KFF designs, conducts and analyzes original public opinion and survey research on Americans’ attitudes, knowledge, and experiences with the health care system to help amplify the public’s voice in major national debates.
Every Friday, we’re recapping the past week in the coronavirus pandemic from our tracking, policy analysis, polling, and journalism.
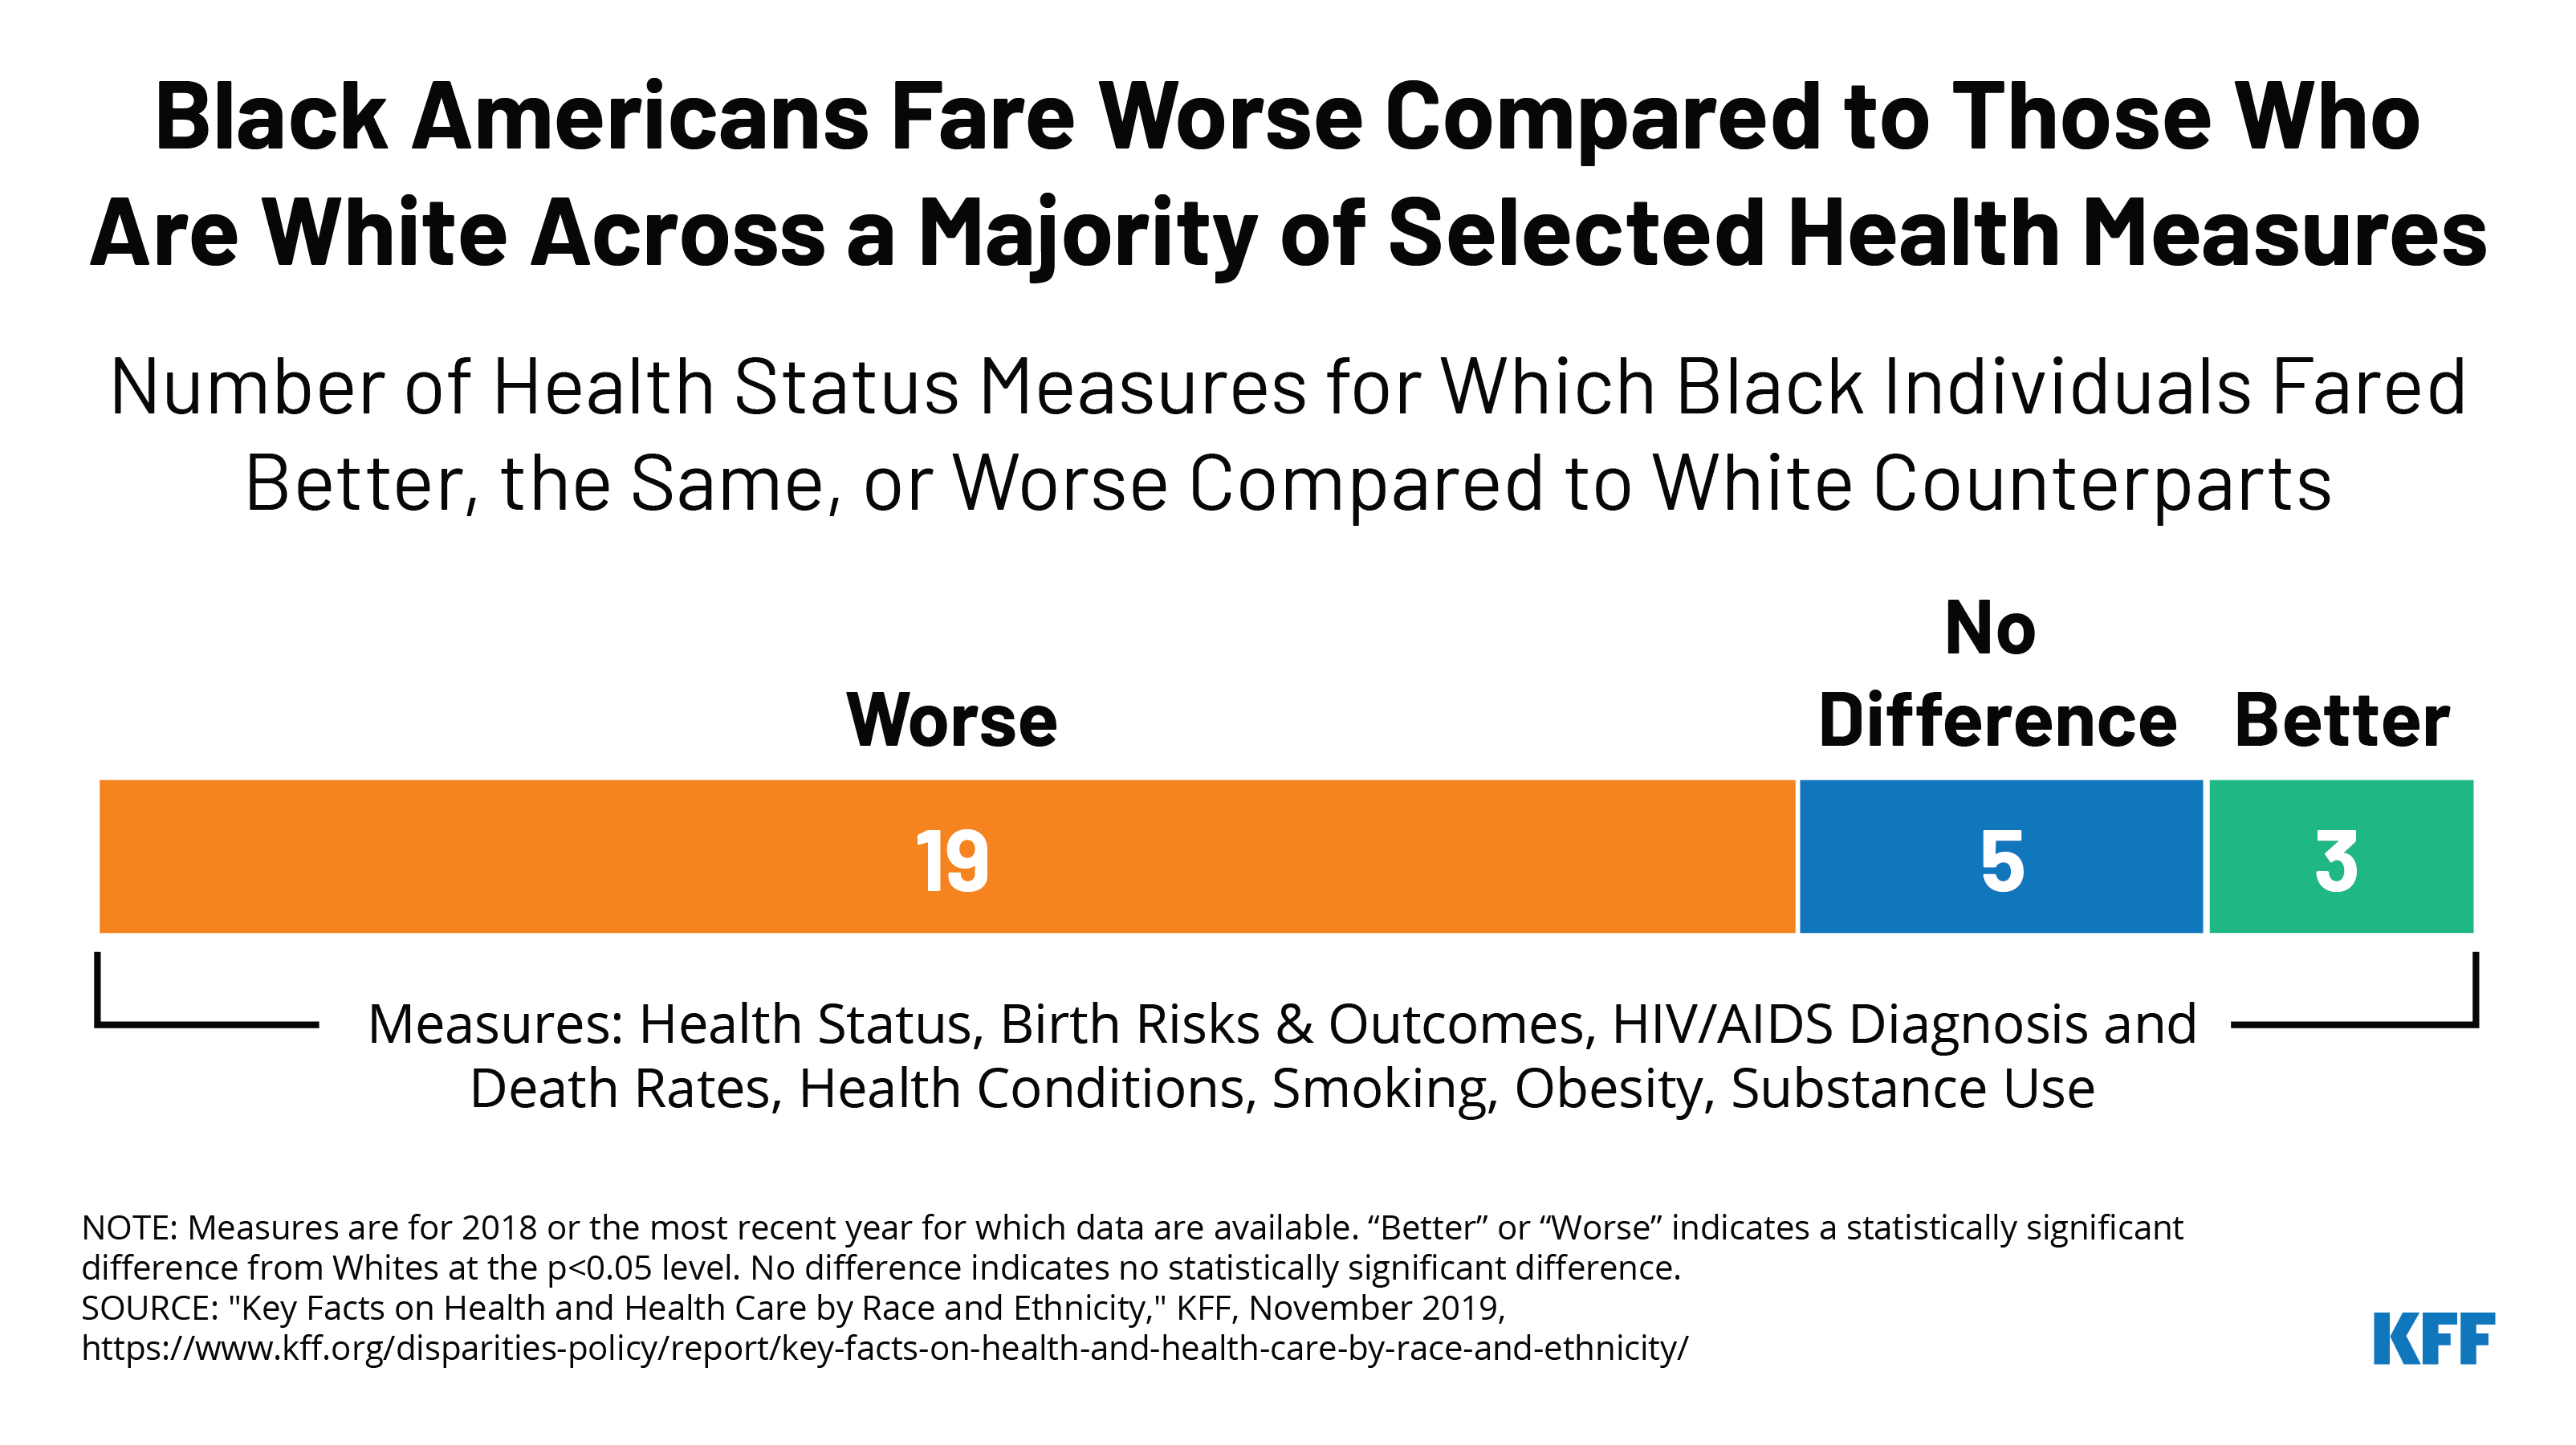
This week saw protests across the country voicing outrage over how widespread racism in the United States impacts black lives. Structural and systemic racism have created longstanding disparities across economic and health indicators for Black Americans – including the disproportionate impact of COVID-19 in Black communities and other communities of color. Data across states show that, in the majority of states reporting data, Black people account for a higher share of COVID-19-related deaths and cases compared to their share of the population. The resulting economic crisis has also had an unequal effect on people of color. Our head of Disparities Policy, Samantha Artiga, explains more in her conversation with Dan Diamond on Politico’s Pulse Check this week.
Total cases in the U.S. are still climbing, and this week increased by 149,000, bringing the cumulative total of cases past 1.8 million. Across 41 states reporting this data as of yesterday, 45% of deaths due to COVID-19 occurred in long-term care facilities.
Here are more of the latest coronavirus stats from KFF’s tracking resources:
Global Cases and Deaths: This week, total cases worldwide passed 6.6 million – with approximately 828,000 new confirmed cases added between May 28 and June 4. There were approximately 31,000 new confirmed deaths worldwide between May 28 and June 4.
U.S. Cases and Deaths: Total confirmed deaths in the U.S. surpassed 108,000 this week. There have been almost 1.9 million total confirmed cases in the U.S. There were approximately 150,000 new confirmed cases and 6,600 confirmed deaths in the United States between May 28 and June 4.
U.S. Tests: There have been over 18.6 million total COVID-19 tests with results in the United States —with more than 3 million since May 28. The seven-day rolling average rate positivity rate (between May 28 and June 4) was 4.9%. In the last seven days, 0.9% of the total U.S. population was tested.
Social Distancing: 51 states have eased at least one social distancing measure.
Stay At Home Order: Original stay at home order in place in 13 states, stay at home order eased or lifted in 32 states, no action in 6 states
Mandatory Quarantine for Travelers: Original traveler quarantine mandate in place in 11 states, traveler quarantine mandate eased or lifted in 14 states, no action in 26 states
Non-Essential Business Closures: Some or all non-essential businesses permitted to reopen (some with reduced capacity) in 46 states, no action in 5 states
Large Gatherings Ban: Original gathering ban/limit in place in 17 states, gathering/ban limit eased or lifted in 33 states, no action in 1 states
State-Mandated School Closures: Closed in 7 states, closed for school year in 36 states, recommended closure in 1 state, recommended closure for school year in 6 states, rescinded in 1 state
Restaurant Limits: Original restaurant closures still in place in 11 states, restaurants re-opened to dine-in service (some with reduced capacity) in 39 states, no action in 1 state
Primary Election Postponement: Postponement in 14 states, cancelled in 1 state, no postponement in 36 states
Emergency Declaration: There are emergency declarations in all 51 states.
Waive Cost Sharing for COVID-19 Treatment: 3 states require, state-insurer agreement in 3 states; no action in 45 states
Free Cost Vaccine When Available: 9 states require, state-insurer agreement in 1 state, no action in 41 states
States Requires Waiver of Prior Authorization Requirements: For COVID-19 testing only in 5 states, for COVID-19 testing and treatment in 6 states, no action in 40 states
Early Prescription Refills: State requires in 18 states, no action in 33 states
Premium Payment Grace Period: Grace period extended for all policies in 9 states, grace period extended for COVID-19 diagnosis/impacts only in 5 states, no action in 35 states, expired in 2 states
Marketplace Special Enrollment Period: Marketplace special enrollment period still active in 6 states, ended in 6 states, no special enrollment period in 39 states
Paid Sick Leave: 13 states enacted, 2 proposed, no action in 36 states
38 states overall have taken mandatory action expanding access to telehealth services through private insurers, including:
New Requirements for Coverage of Telehealth Services: Parity with in-person services in 6 states, broad coverage of telehealth services in 6 states, limited coverage of telehealth services in 6 states, no action in 33 states
Waiving or Limiting Cost-Sharing for Telehealth Services: Waived for COVID-19 services only in 7 states, waived or limited for all services in 9 states, no action in 35 states
Reimbursement Parity for Telehealth and In-Person Services: Required for all services in 17 states, no action in 34 states
Require Expanded Options for Delivery of Telehealth Services: Yes in 35 states, for behavioral health services only in 1 state, no action in 15 states
Approved Section 1115 Waivers to Address COVID-19: 1 state (Washington) has an approved waiver
Approved Section 1135 Waivers: 51 states have approved waivers
Approved 1915 (c) Appendix K Waivers: 48 states have approved waivers
Approved State Plan Amendments (SPAs): 39 states have temporary changes approved under Medicaid or CHIP disaster relief SPAs, 1 state has an approved traditional SPA
Other State-Reported Medicaid Administrative Actions: 51 states report taking other administrative actions in their Medicaid programs to address COVID-19
Adults at Higher Risk of Serious Illness if Infected with Coronavirus: 38% of all U.S. adults are at risk of serious illness if infected with coronavirus (92,560,223 total) due to their age (65 and over) or pre-existing medical condition. Of those at higher risk, 45% are at increased risk of serious illness if infected with coronavirus due to their existing medical condition such as such as heart disease, diabetes, lung disease, uncontrolled asthma or obesity. Among nonelderly adults — low-income, American Indian/Alaska Native & Black adults have a higher risk of serious illness if infected with coronavirus. In both cases – for race and household income – the higher risk of serious illness if infected with coronavirus is chiefly due to a higher prevalence of underlying health conditions and longstanding disparities in health care and other socio-economic factors.
A new KFF brief provides an overview of the legal basis for state stay at home orders in response to the coronavirus pandemic, as well as current legal challenges to these orders. Stay at home orders and other mandatory social distancing measures have received broad public support, but also have drawn some public protests. Different stakeholders have brought at least 20 legal challenges claiming these orders violate the Constitution or state law.
Most courts to date have generally allowed stay at home orders to remain in place to protect public health, despite acknowledging the restrictions on individual rights such as free speech, peaceful assembly, travel, and free exercise of religion. In several states including Wisconsin, the legislature has challenged the Governor’s authority to issue a stay at home order. The Wisconsin Supreme Court is the only court to strike down nearly all of the provisions of a stay at home order. While the current litigation may be resolved when states start to re-open, the general issue about the scope of government authority to limit individual rights in a public health crisis is likely to return to the courts as states may re-institute stay at home orders if there are more COVID-19 outbreaks in the coming months.
Visit our Coronavirus topic page for the newest releases and latest updates regarding the novel coronavirus and COVID-19.
These measures are the primary means of controlling the spread of a highly communicable virus and avoiding health care system overload by limiting close contact between people in the absence of a vaccine or curative treatment. While there has been broad public support of strict stay at home orders and other social distancing measures to protect public health, there also have been protests alleging these measures impermissibly restrict individual rights in Wisconsin, Michigan, California, and elsewhere, and lawsuits challenging them filed in a number of states.
Map accurate as of June 1 – For updated information, see tracker here.
>
This issue brief explains the legal basis for stay at home orders and provides an overview of current legal challenges filed in state and federal courts. Historically, the government’s authority to impose measures that temporarily restrict individual rights during emergencies has been recognized as necessary to protect public health, even when those measures limit rights protected by the Constitution that Americans hold important, such as the rights to free speech, peaceful assembly, interstate travel, and free exercise of religion. Although the Wisconsin Supreme Court’s decision striking down nearly all of that state’s stay at home order, based on its interpretation of state law, received recent mediaattention, most courts to date generally have allowed stay at home orders to remain in place. While some of the specific issues in current lawsuits could become moot as states start to re-open, the general issue about the scope of government authority to limit individual rights in a public health crisis is likely to return to the courts as states re-institute stay at home orders during future COVID-19 outbreaks in the coming months.
What is the legal basis for stay at home orders?
Mandatory social distancing measures during public health emergencies, such as stay at home orders, are based on states’ general authority to protect the general health, safety, morals, and welfare, known as the police power. The police power is a very broad power through which governments regulate individual rights to protect the interests of society as a whole. Common examples of the police power are safety regulations to reduce fire hazard, zoning laws that regulate land use, and laws prohibiting gambling or prostitution. Examples of social distancing measures adopted under the police power in the current coronavirus pandemic include mandatory stay at home orders, mandatory traveler quarantines, closures of non-essential businesses, bans on large gatherings, school closures, and limits on bars and restaurants and other public places.
Because social distancing measures are adopted under states’ police power, there is state variation in the onset of social distancing measures, the specific measures adopted, and their duration. The police power is the main power possessed by state governments. The federal government has limited powers that are specially enumerated in the Constitution. All remaining government powers, including the general police power, are vested in the states under the 10th Amendment.
The U.S. Supreme Court’s recognition of state use of the police power to regulate individual rights in the interest of protecting public health dates back to 1905. In Jacobson v. Massachusetts, the Court upheld a government requirement for smallpox vaccination when that virus was spreading. The Court set out the legal test, still applied today, which provides that a state’s exercise of the police power to promote public safety during a public health emergency will be upheld unless the order has no real or substantial relation to public health or the measure beyond all question is a plain palpable invasion of fundamental rights.
In upholding the smallpox vaccination requirement, the Court emphasized that a free society requires some restrictions on individual rights to protect public health and safety and promote general social order. The Court noted that, “Upon the principle of self-defense, of paramount necessity, a community has the right to protect itself against an epidemic of disease which threatens the safety of its members.” Rather than being absolute in all circumstances, individual constitutional rights are subject to “manifold restraints to which every person is necessarily subject for the common good.” This balance is necessary because: “Society based on the rule that each one is a law unto himself would soon be confronted with disorder and anarchy. Real liberty for all could not exist under the operation of a principle which recognizes the right of each individual person to use his own, whether in respect of his person or his property, regardless of the injury that may be done to others.”
How have courts decided lawsuits challenging stay at home orders issued in response to the COVID-19 pandemic to date?
Most courts to date generally have allowed stay at home orders issued during the current crisis to remain in place to protect public health, despite restrictions on individual rights such as free speech, peaceful assembly, travel, and free exercise of religion. Some courts also have been asked to decide disputes between state legislatures and Governors about the exercise of government power to issue these orders. Selected cases are described below and summarized in Table 1.
Free speech, peaceful assembly, and economic harm
In a case that reached a final decision on the merits, Friends of Danny Devito v. Wolf, the Pennsylvania State Supreme Court upheld the Governor’s closure of physical operations of all non-life-sustaining businesses to reduce coronavirus spread. The Governor’s order was challenged by a realtor, a golf course owner, and a candidate for the state legislature (no relation to the famous actor), who alleged that the order violated their rights to free speech, free assembly, and due process. The Pennsylvania state court found the order to be reasonably necessary to meet the current public health emergency, which involves a virus that spreads “exponentially” and where enforcement of social distancing is currently the only mitigating tool. In this context, the court noted that temporary business closure is not unduly oppressive when faced with protecting the lives and health of all state citizens. The court also observed that the power to enact laws to promote the general welfare is one of the most essential government powers and its “least limitable.” In early May 2020, the U.S. Supreme Court denied the business owners’ application for a stay, allowing the Governor’s order to remain in effect while the business owners ask the Supreme Court to review the case.
Other courts have allowed stay at home measures to remain in place while lawsuits are pending. A California federal district court denied a temporary restraining order in a case brought by a gun shop owner and political candidate who sought to hold public protests and rallies at the state capital, deferring to state officials’ “informed efforts to protect all citizens especially the most vulnerable against a deadly pandemic.” Another federal district court denied a request to block Maryland’s stay at home order in a lawsuit brought by a number of plaintiffs, including members of the state legislature who wanted to attend political rallies and businesses that had lost substantial money because they were deemed non-essential and forced to close. The Maryland court found that, “The executive orders at issue have a ‘real or substantial relation’ to the public health crisis.” The Maryland plaintiffs have appealed that decision to the 4th Circuit Court of Appeals. Other federal lawsuits have been brought by abortion protestors, after they were arrested for violating stay at home orders in North Carolina and Michigan; neither case resulted in a decision on the merits because the orders expired or were amended, making them moot.
Travel Restrictions
A Michigan state court refused to issue a preliminary injunction in a case challenging the scope of the Governor’s stay at home order. The plaintiffs, five Michigan residents, claimed that the intrastate travel restrictions violated their right to procedural due process. The court found that while the order severely restricted individual constitutional rights, the restrictions were reasonable in light of the current public health crisis. The court also emphasized the temporary nature of the restrictions, compared to the “all too permanent” impact on “those who contract the virus and cannot recover and their family and friends.” In contrast, a Kentucky federal court struck down a provision in the Governor’s order requiring individuals to self-quarantine for 14 days after entering the state in a case brought by state residents who wanted to travel freely in and out of state. The Kentucky court found that the requirement was not narrowly tailored to achieve the government’s purpose because it applied to an individual visiting a friend eight miles away in Ohio, but not if the visit occurred eight miles away within Kentucky.
Free exercise of religion
One of the most politically charged provisions of the stay at home orders has been restrictions on public gatherings as they apply to religious worship. There have been multiple examples from around the world of religious services acting as super-spreader events for COVID-19. Federal appeals courts have split on the issue of whether social distancing orders should be lifted or remain in place while lawsuits alleging violations of the free exercise of religion are pending. In the two religious cases seeking U.S. Supreme Court review to date, the Court has allowed social distancing orders to remain in place while the appeals are pending. In the litigation challenging restrictions on in-person religious services, the churches and other houses of worship contend that religious services are being singled out and not being treated equally with other business operations. As states begin to re-open, some lawsuits are alleging that churches should be included in earlier rather than later re-opening phases.
On May 22nd, President Trump declared places of worship “essential” operations that should hold services in person regardless of state orders. While the President lacks the authority to override state orders, many states are starting to open up and allow some in person religious services. The CDC issued specific guidelines for faith based worship services, which it later amended to emphasize religious rights (Box 1). The amended CDC guidelines now provide that faith based organizations should be treated the same as similarly situated entities. The factual question is what kind of business is the correct comparison for religious services: movie theaters, live concerts, grocery stores or office buildings. In a concurring opinion, denying the request from a California church to allow churches to be treated like other businesses allowed to open, Chief Justice Roberts noted that, “Similar or more severe restrictions apply to comparable secular gatherings, including lectures, concerts, movie showings, spectator sports, and theatrical performances, where large groups of people gather in close proximity for extended periods of time.” In his dissent Justice Kavanaugh asserted, “California’s latest safety guidelines discriminate against places of worship and in favor of comparable secular businesses. Such discrimination violates the First Amendment.”
Box 1: CDC Guidelines for Faith Based Organizations
While states and counties have the authority to establish their own stay at home orders, many states have looked to the federal government for guidance. The Centers for Disease Control Interim Guidance for Communities of Faith stated: “consider suspending or at least decreasing use of a choir/musical ensembles and congregant singing, chanting, or reciting during services or other programming, if appropriate within the faith tradition…. The act of singing may contribute to transmission of Covid-19, possibly through emission of aerosols.” CDC also recommended that religious groups “consider temporarily limiting the sharing of frequently touched objects that cannot be easily cleaned between persons, such as worship aids, prayer rugs, prayer books, hymnals, religious texts and other bulletins, books, shared cups, or other items received, passed or shared among congregants as part of services.”
As of May 23rd this part of the guidelines has been removed and new language was added: “This guidance is not intended to infringe on rights protected by the First Amendment to the U.S. Constitution or any other federal law, including the Religious Freedom Restoration Act of 1993 (RFRA). The federal government may not prescribe standards for interactions of faith communities in houses of worship, and in accordance with the First Amendment, no faith community should be asked to adopt any mitigation strategies that are more stringent than the mitigation strategies asked of similarly situated entities or activities”
On May 19th, the Trump Administration Department of Justice sent a letter to California’s Governor Newsom, warning him that they believe the Constitution calls for California to do more to accommodate religious worship, by including worship in stage 2 of the reopening plan.
In two cases appealed from the 9th and 7th Circuit Court of Appeals, the Supreme Court denied requests brought by churches in California and Illinois to block state stay at home orders while the appeals are pending. The California church contended the Governor’s decision to place churches in Stage 3 instead of Stage 2 of the state reopening plan violates their right to free exercise of religion. The 9th Circuit upheld a California federal district court’s denial of a temporary restraining order. The court stated:
“Where state action does not ‘infringe upon or restrict practices because of their religious motivation’ and does not ‘in a selective manner impose burdens only on conduct motivated by religious belief,’ it does not violate the First Amendment. We’re dealing here with a highly contagious and often fatal disease for which there presently is no known cure. In the words of Justice Robert Jackson, if a ‘[c]ourt does not temper its doctrinaire logic with a little practical wisdom, it will convert the constitutional Bill of Rights into a suicide pact.’ “
In a 5-4 vote the Supreme Court denied the California church’s request for an emergency stay of the state’s restriction on worship services. In a concurring opinion, Chief Justice Roberts emphasized that the Constitution delegated the decisions to keep states safe to local politicians: “The precise question of when restrictions on particular social activities should be lifted during the pandemic is a dynamic and fact-intensive matter subject to reasonable disagreement” but entrusted by the Constitution to politically accountable elected officials of the state.
Like the California church, the Illinois church contended that the state’s reopening plan imposed unique limits on religious worship services that are not imposed on other businesses. After the Illinois church appealed the 7th Circuit decision allowing the social distancing measures to stay in place, the Illinois Department of Public Health issued new guidelines allowing in-person worship services, with recommendations for maximum capacity and social distancing. The Supreme Court denied the request for a stay from the IL church because the new guidelines made the request for a stay moot.
Similarly, in a case brought in state court by 10 churches alleging violation of their religious rights, the Oregon State Supreme Court stayed a temporary restraining order issued by a lower state court. The Oregon State Supreme Court is expected to rule on the merits of the case soon.
Other federal district courts in California and New Mexico also have denied requests for temporary restraining orders in cases challenging state social distancing orders brought by churches. These courts found that the orders did not violate the right to free exercise of religion because the orders are neutral, generally applicable, and related to addressing the pandemic. For example, the California federal district court noted that while the order temporarily burdens individual rights to a greater degree than normally permissible, the right to free exercise of religion does not include the liberty to expose the community to a communicable disease. The New Mexico district court observed that when the state faces a major public health threat, its police powers are at a maximum.
In contrast to the above decisions, the 5th and 6th Circuit Courts of Appeals have lifted bans on public gatherings in cases alleging infringement on the right to free exercise of religion. The 5th Circuit Court of Appeals enjoined enforcement of the City of Holy Spring, Mississippi’s stay at home order, while the district court decides the merits of the case. The case was brought by a church alleging that the city’s designation of churches as “nonessential” violates the rights to free exercise of religion and free speech. The church did provide assurances that it will satisfy the “requirements entitling similarly situated businesses and operation to reopen.” In two related cases in Kentucky, the 6th Circuit Court of Appeals held that the public gathering limitations violated the plaintiffs’ right to free exercise of religion under KY’s Religious Freedom and Restoration Act and the First Amendment. In the case brought by Maryville Baptist Church, while the 6th Circuit allowed the plaintiffs to hold drive-in services, the district court subsequently allowed in-person services that abide by social distancing requirements. Similarly, a North Carolina federal district court issued a temporary restraining order in a challenge brought by a church, stating, “There is no pandemic exception to the Constitution of the United States or the Free Exercise of the First Amendment.” The plaintiffs later voluntarily dismissed their case after the Governor issued a new executive order exempting all religious and spiritual gatherings from the public gathering limitations.
Conflicts Between State Legislatures and Governors
In cases disputing the scope of authority of the executive branch vs. the legislature under state law to impose social distancing measures, the Wisconsin State Supreme Court lifted nearly all of the state public health secretary’s stay at home order, while the Kansas State Supreme Court upheld the Governor’s order. While these cases each turn on specific provisions of state law, they also speak to the larger policy and political debate about the extent of executive authority to limit individual rights during a public health crisis. The Wisconsin decision is the only case thus far to lift nearly all provisions of a stay at home order. The case was brought by the state legislature, contesting the state public health secretary’s authority to issue an extended stay at home order without going through an administrative rule making process. While most courts have emphasized that stay at home orders serve to protect people during a public health emergency, the Wisconsin state court in a four to three decision instead highlighted the importance of the administrative rulemaking process to “safeguard all people” (Box 2). The Kansas Supreme Court allowed the Governor’s executive order limiting religious gatherings to 10 people to remain in place, finding that a seven member Legislative Coordinating Council does not have the power to overrule the Governor. The Governor brought suit after the Council voted to revoke her order. Both of these cases involved opposing political parties in control of different branches of state government.
Box 2: The Wisconsin Supreme Court Decision
In a challenge brought by the state legislature, the Wisconsin Supreme Court, in a four to three decision, found the stay at home order invalid because the public health secretary failed to use the emergency administrative rule-making process. Quoting the Trump Administration’s statement of interest filed in a support of a case brought by a church in Mississippi, the court stated, “there is no pandemic exception . . . to the fundamental liberties the Constitution safeguards.” Without following the administrative rule-making process, according to the court, there are no limits on the secretary’s power.
The dissenting judges pointed out that the emergency rule-making process in state law is “inconsistent with the prompt and decisive action needed to control and suppress a deadly communicable disease.” According to the dissent, the emergency rulemaking process involves 11 to 13 steps that take 18 to 49 days, after which a legislative committee can suspend the emergency rule, requiring the secretary to start over. Additionally, emergency rules cannot be changed without going through another rulemaking. In the dissent’s view, state law allowed the secretary to issue an order without rule-making that applies to a temporary specific factual circumstance such as the control and suppression of a particular communicable disease. The secretary’s power is appropriately limited because individuals who believe they are harmed by such an order could bring a constitutional challenge.
The Wisconsin decision resulted in confusion about when it took effect and which restrictions if any were in place in the meantime. The legislature had asked for the court’s decision to be stayed to allow for time to transition to another, less restrictive, stay at home order, but the majority decision did not grant a stay. However, the chief justice who wrote the majority decision also wrote a separate concurring decision, acknowledging the stay request and raising uncertainty about her vote. In the aftermath of the court’s decision, some taverns were planning to reopen, while some local city and county governments planned to issue their own stay-at-home orders. After the state Supreme Court’s order, public health officers for Milwaukee, Appleton and other counties put in place their own orders. Seventeen individuals including a pastor, a restaurant owner and a candidate for the state Assembly are now challenging these local orders in federal court.
Following the Wisconsin decision, the Republican controlled Michigan state legislature sued the Democratic Governor challenging her stay at home order. The Michigan state district court found that the Governor does have the authority to issue stay at home orders under state law. The Legislature has appealed this decision and is seeking emergency-bypass review by the state Supreme Court. In another case, Republican members of the Illinois House of Representatives are challenging the Democratic Governor’s stay at home orders alleging the Governor has exceeded the his authority under the state Emergency Management Agency Act. The plaintiffs filed the case in state court, but the Governor filed the paperwork to move the case to federal court. The plaintiffs are contesting the move to federal court. The Trump Administration issued a statement of interest in the case, supporting the plaintiffs’ position to keep the case in state court.
Looking Ahead
Adoption of social distancing measures continues to be a subject of policy as well as political debate. Courts generally have upheld these measures in the interest of protecting public health during emergencies, despite acknowledging the restriction on individual rights, in cases brought by individuals and groups seeking to fully exercise those rights. Three cases to date have asked for Supreme Court review. The Supreme Court has denied stays in all three cases in which plaintiffs have appealed to block state stay at home orders. Other cases are pending review at district courts and courts of appeals. While state and local actions to open up might make some of the current litigation moot, states may decide to re-instate some of these orders if there are new flares in COVID-19 over the coming year, and we can expect similar legal challenges.
As states recently have begun to roll back some social distancing measures, public opinion on these changes also differs somewhat by political party affiliation. According to the May 2020 KFF Health Tracking Poll, about half of adults – across political party identification – say they think their state is moving at the right speed in easing restrictions. However, more than three times as many Republicans (32%) as Democrats (9%) say their state is opening “too slowly,” and one-fifth (22%) of independents say the same. Four in ten Democrats (39%) say their state is opening “too quickly” compared to 28% of independents and 13% of Republicans. States’ scattershot approach to adopting stay-at-home orders raised concerns about ongoing community transmission in the U.S., while recent movements by some states to ease restrictions similarly raise concerns about new outbreaks. In the coming months and years, many policymakers and other stakeholders will be studying the economic and public health consequences that resulted from varying state approaches to balancing public health vs. individual rights and weighing the effects on the economy.
Table
Table 1: Selected Cases Challenging Stay-at-Home Orders as of May 29, 2020
Individuals seeking to hold political protest and rally at state capitol alleged stay-at-home order violated right to free speech, free assembly, and petition government
Federal district court denied temporary restraining order because ban relates to public health, and court must defer to officials’ informed efforts to protect all citizens against deadly pandemic. Plaintiffs have appealed to the 9th Circuit Court of Appeals.
Individuals seeking to practice religion alleged that stay-at-home order violated right to free exercise of religion, anti-establishment of religion, free speech, free assembly, due process, and equal protection
Federal district court denied temporary restraining order because stay-at-home order is neutral, serves secular purpose, and does not endorse any religion – right to practice religion freely does not include liberty to expose community to communicable disease. Plaintiffs have appealed to the 9th Circuit Court of Appeals.
A church, bishop, and rabbi seeking to assemble to practice religion allege state and county stay at home orders violate rights to free speech and free exercise of religion, and the re-opening plan explicitly target religion and “faith-based” services.
Republican member of the IL House of Representatives alleges the Democratic Governor has exceeded the statutory authority granted under the IL Emergency Management Agency Act.
The Governor filed a motion to remove the case to federal court. The Trump Administration has filed a statement of interest in the case supporting the plaintiffs.
A church and ministry allege the limits on public gathering orders violate rights to free speech, free exercise of religion, and assembly.
Federal district court denied the motion to for a temporary restraining order. The 7th Circuit Court of Appeals also denied the motion for a stay. The Plaintiffs requested an emergency stay from the Supreme Court. After the Illinois Department of Public Health issued new guidelines allowing for in-person worship service, the Supreme denied the stay.
Governor filed a lawsuit against the 7-member Legislative Coordinating Council, which had voted to revoke the Governor’s executive order limiting religious gatherings to 10 people.
The Kansas Supreme Court ruled in the Governor’s favor stating that the Legislative Coordinating Council does not have the power to overrule the Governor.
Individuals alleged ban on mass gatherings violated right to free exercise of religion and mandatory 14-day self-quarantine after out-of-state travel violated fundamental liberty and due process
Federal district court denied preliminary injunction on mass gathering ban as purpose is not to suppress religion, but granted preliminary injunction on mandatory self-quarantine after out-of-state travel ruling this provision is not narrowly tailored. 6th Circuit Court of Appeals granted an injunction barring enforcement of ban on plaintiffs’ religious gatherings pending appeal.
Church and pastor allege the ban on public gathering orders violate rights to free assembly, free speech, free exercise of religion, and the establishment clause of the First Amendment.
6th Circuit Court of Appeals issued an injunction pending appeal as it applies to the plaintiff’s drive in services. The district court then extended the injunction to apply to the plaintiff’s in person services.
Business owners, clergy and 3 Republican state delegates allege that the stay at home order violates free exercise of religion, freedom of assembly and speech, and the order exceeds the Governor’s statutory authority.
The District Court denied the motion for a temporary restraining order. The plaintiffs appealed to the 4th Circuit Court of Appeals.
Individuals alleged stay-at-home order and ban on travel to third party vacation rentals violated right to due process
The Michigan Court of Claims denied preliminary injunction because measure is temporary and has real and substantial relation to public health crisis. Individual constitutional rights are subject to the interest of fellow citizens in remaining unharmed by highly communicable deadly virus. The plaintiffs have appealed to the Court of Appeals and requested the Michigan Supreme Court to grant emergency-bypass review of the case before a decision from the Court of Appeals.
The Legislature asserts the Governor’s Stay at Home Order is not authorized by state law.
The Court of Claims judge denied the Legislature’s motion for declaratory judgment. The Legislature has filed an appeal with the Court of Appeals and requesting the Michigan Supreme Court to grant emergency-bypass review of the case before a decision from the Court of Appeals.
Church challenged City’s stay at home order prohibiting both drive in services and in person worship services.
After the City agreed that the church could conduct drive in services, the federal district court denied a motion for a temporary restraining order to allow in person worship services. The 5th Circuit Court of Appeals issued a temporary restraining order, allowing the church to conduct in person worship services, as long as it satisfies the requirement entitling similarly situated businesses and operations to open.
Two churches, a religious nonprofit consisting of a network of churches and individuals, and a pastor allege that the prohibition on more than 10 people gathering violates freedom of free exercise of religion, right to assemble, and approves only State-mandated forms of worship.
District Court issued a temporary restraining order stating, “There is no pandemic exception to the Constitution of the United States or the Free Exercise of the First Amendment.” Plaintiffs voluntarily dismissed their case after the Governor issued a new executive order exempting all religious and spiritual gathering from the requirements of other gatherings.
10 churches and 21 individuals allege deprivation of constitutional right to freely exercise their religion, and great economic harm and that the Governor’s executive order exceeded the duration permitted by the state law the Governor cited in her order
Circuit Court issued preliminary injunction ruling that the Governor overstepped her authority. Oregon Supreme Court stayed circuit court ruling. Hearing took place May 22nd and awaiting decision from Oregon Supreme Court.
Realtor, golf course owner, and state House candidate alleged that closure of physical operations of all non-life-sustaining businesses violated rights to due process, free speech, and free assembly
State court upheld order as reasonably necessary to meet emergency, temporary business closure not unduly oppressive when faced with protecting life and health of all state citizens. Supreme court denied request for stay without comment.
Spending on antiretrovirals (ARVs), the drugs used to treat and prevent HIV, has an outsized impact on state Medicaid programs.
States may enact policies to either control costs and limit access, or may instead use policies to promote access to certain classes, including ARVs.
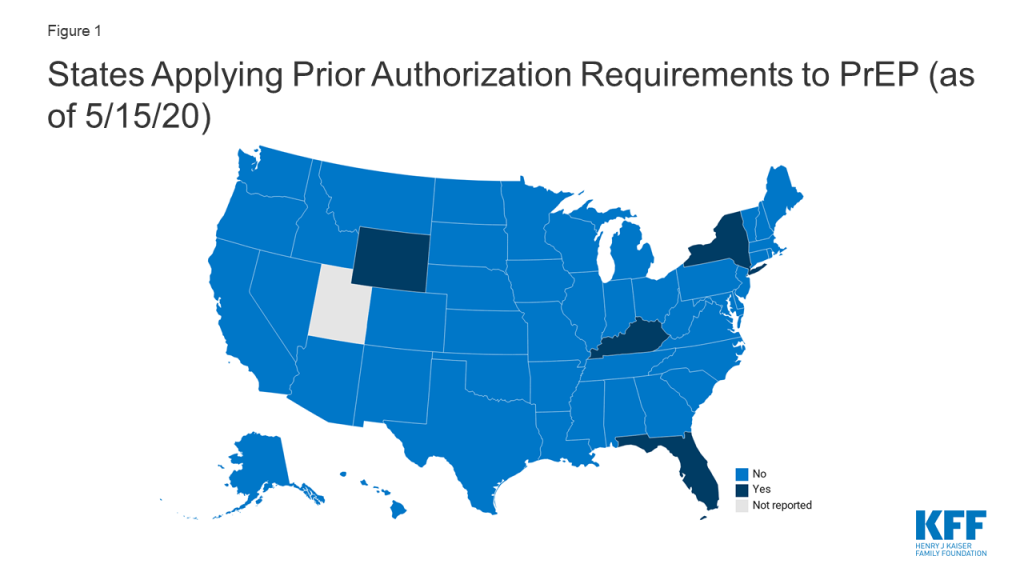
Four states (FL, KY, NY, and WY) currently require prior authorization for pre-exposure prophylaxis (PrEP), drugs used to prevent HIV.
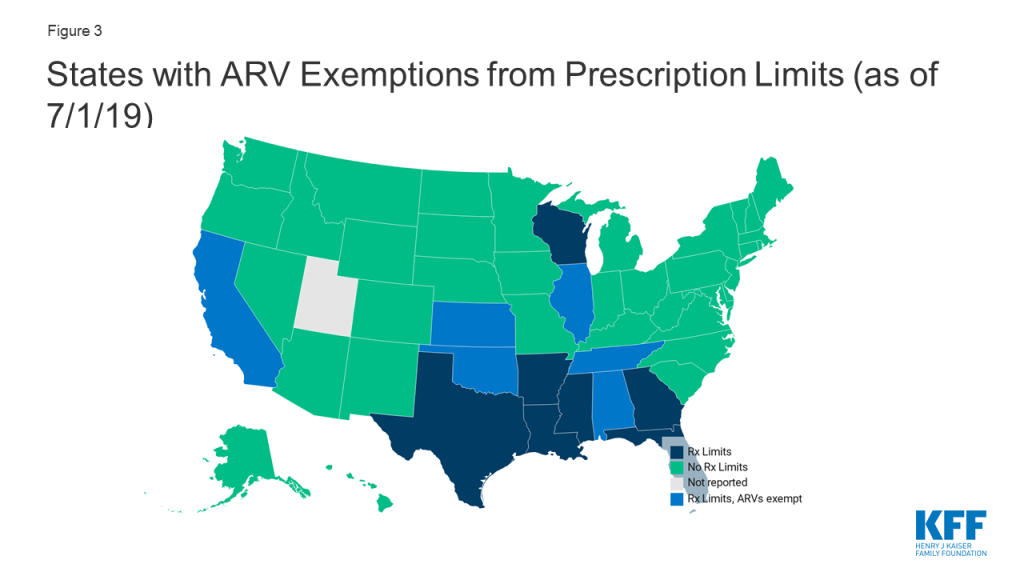
Thirteen states reported monthly fee-for-service prescription limits. However, some exempt certain classes including, six states (AL, CA, IL, NE, OK, and TN) that exempt antiretrovirals from these limitations.
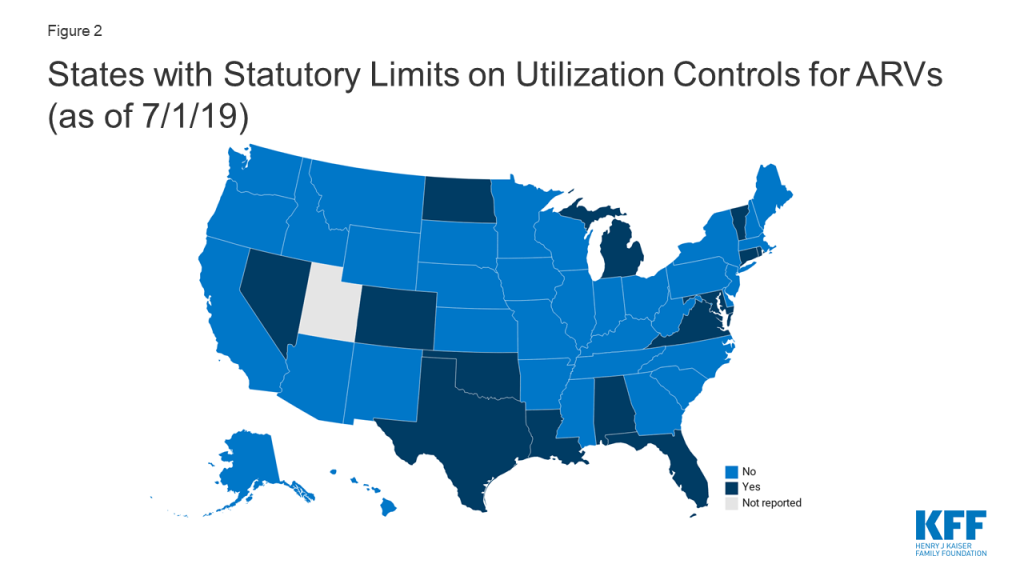
Fourteen states (AL, CO, CT, FL, LA, MD, MI, ND, NV, OK, RI, TX, VA, VT) prohibited the use of at least some utilization management techniques (e.g. prior authorization, step therapy, etc.) for ARVs by law.
Four states (CA, DC, MD, and MI) with comprehensive managed care organizations (MCOs) that generally “carve in” their drug benefit (i.e. require MCOs to cover costs) elect to “carve out” ARVs, in some cases, among other classes. Carving out the drug benefit, or carving out certain drug classes, mitigates financial risk for MCOs, which may facilitate beneficiary access.
Background
Spending on antiretrovirals (ARVs), the drugs used to treat and prevent HIV, has an outsized impact on state Medicaid programs.1 As more people are living with HIV, as national treatment guidelines recommend ARV initiation at the time of diagnosis, and as ARV use for pre-exposure prophylaxis (PrEP) grows, class utilization and subsequent costs have increased over time. a relatively small number of Medicaid beneficiaries are using ARVs but because of their high and growing price tag, the drug class represents a substantial cost for state programs.2,3
Since state Medicaid programs are required by law to cover all FDA approved medications from manufacturers that have entered into federal rebate agreements, all ARVs are covered. Given its broad drug coverage, Medicaid programs take steps to contain costs and utilization, especially for high cost drugs. One of the primary ways state programs control drug costs is by instituting utilization controls which include prior authorization (PA), step therapy, preferred drug lists (PDLs) and quantity limits, among others. Beyond cost control, these practices may also be used in an attempt to align medical practice with accepted guidelines (e.g. limiting access to or requiring prior-authorization for opioids). On the one hand these tools can reduce spending but on the other, they may create access barriers for beneficiaries and result in reduced utilization of essential medications. In the context of HIV treatment and prevention, access barriers to ARVs could result in worsened health outcomes and new HIV infections.
Conversely, states may also enact policies that aim to promote access to certain medications, particularly those that are life-saving or especially critical, such as ARVs. For example, states might enact legislation prohibiting utilization management for a particular class or exempt certain classes from prescription drug limits. States may also choose to carve out certain classes of high-cost drugs and cover them through their fee-for-service program, which reduces the financial risk for MCOs and also can have cost and access implications. In the context of ARVs, each of these actions could help to facilitate drug access which has important implications for individual health and preventing disease transmission.
This data note, primarily based on a survey of state Medicaid pharmacies, reviews cost-containment policies and protections as they relate to ARVs for treatment and prevention of HIV. While most data points here refer to the ARV class broadly, covering drugs for HIV treatment and prevention, we also specifically present new data on use of prior authorization for PrEP. More expansive survey findings, covering prescription benefit trends beyond ARVs are available in a separate report.
State Medicaid Management of Antiretrovirals
Prior Authorization for Pre-exposure prophylaxis (PrEP)
PrEP, which was first approved by the FDA in 2014, plays an important role in HIV prevention. When taken as directed, PrEP can prevent HIV negative individuals from acquiring the infection. While state programs are required to cover PrEP under the rebate agreement, as with any prescription drug, they may use utilization management to limit or control usage.
Forty-six (46) states, including DC, do not require PA for PrEP and one state (UT) did not report. Four states (FL, KY, NY, and WY) currently impose PA for PrEP, specifically for the drugs Truvada and/or Descovy.4
Kentucky reported requiring PA for PrEP in the 2019 survey. After reviewing state policy documents, we found that as of May 2020, Kentucky retained PA for Truvada, which at the time of the 2019 survey, was the only FDA approved drug for use as PrEP.5 However, since that time, Descovy, a drug already marketed to treat HIV, received approval for use as PrEP and is on the state drug list without PA. We categorized KY as state requiring PA for PrEP based on its treatment of Truvada.
New York generally retained PA requirements reported in the 2019 survey but made changes in light of the COVID-19 pandemic:
A key component of the provision of PrEP is ensuring it is only provided to HIV negative individuals, confirmed through routine HIV testing. Given challenges in accessing non-essential medical care, including laboratory services, during the COVID-19 pandemic, NY extended the period in which an HIV test must be documented “to receive automatic payment without pre-authorization” to 180 days during the COVID-19 crisis. When there is no evidence of a test within 180 days, a 30-day supply is permitted to allow time for testing, after which claims will automatically be paid.6 (Note: it is possible, and even likely, that other states have taken similar steps to mitigate drug access barriers, including for medications beyond PrEP, during the COVID-19 pandemic. We did not do an exhaustive review of these policy changes but identified NY’s accommodation in reviewing its PrEP policy.)
Figure 1: States Applying Prior Authorization Requirements to PrEP (as of 5/15/20)
Limits on Utilization Controls
Given that utilization management techniques can result in barriers to treatment, in some cases, states elect to exclude certain drugs or classes of drugs from these cost-containment strategies. Typically, a state would opt to do this when unmitigated access to a certain drug or class of drugs is especially critical such as with oncology drugs, epilepsy treatment, and antiretrovirals for HIV treatment and prevention. In many cases these protections are a result of statutory requirements.
As of July 1, 2019 14 states (AL, CO, CT, FL, LA, MD, MI, ND, NV, OK, RI, TX, VA, VT) prohibited the use of at least some utilization management techniques (e.g. prior authorization, step therapy, etc.) for ARVs by law.
Figure 2: States with Statutory Limits on Utilization Controls for ARVs (as of 7/1/19)
ARV Prescription Limitation Protections
One specific tool states use to reduce cost is limiting the number of prescriptions a beneficiary may fill within a month without getting prior authorization in fee-for-service programs. While states may implement these limits, providers and pharmacists may requests exceptions when medically necessary or under other specific circumstances. In addition states may opt to exclude certain drugs or classes from these limitations. Thirteen states reported monthly fee-for-service limits on at least some prescriptions, three of which only applied this limitation to narcotics. Seven of these states excluded certain drugs or drug classes from these limitations, including six states (AL, CA, IL, NE, OK, and TN) that excluded ARVs from prescription limits.
Figure 3: States with ARV Exemptions from Prescription Limits (as of 7/1/19)
Managed Care Drug Carve-outs
As of July 1, 2019, forty states had comprehensive managed care arrangements with one or more managed care organization (MCOs). States with MCOs may opt to “carve in” the pharmacy benefit, meaning the MCOs bear the cost, “carve out” the benefit, covering it instead through the fee-for-service program, or take a hybrid approach, carving in some drugs and carving out others. Carving out the drug benefit, or carving out certain drug classes, mitigates financial risk for MCOs, which may facilitate beneficiary access.
Four of the 39 MCO states (MO, TN, WV, and WI) responding to the survey reported generally carving out the pharmacy benefit, while the remaining 35 states reported generally carving it in.
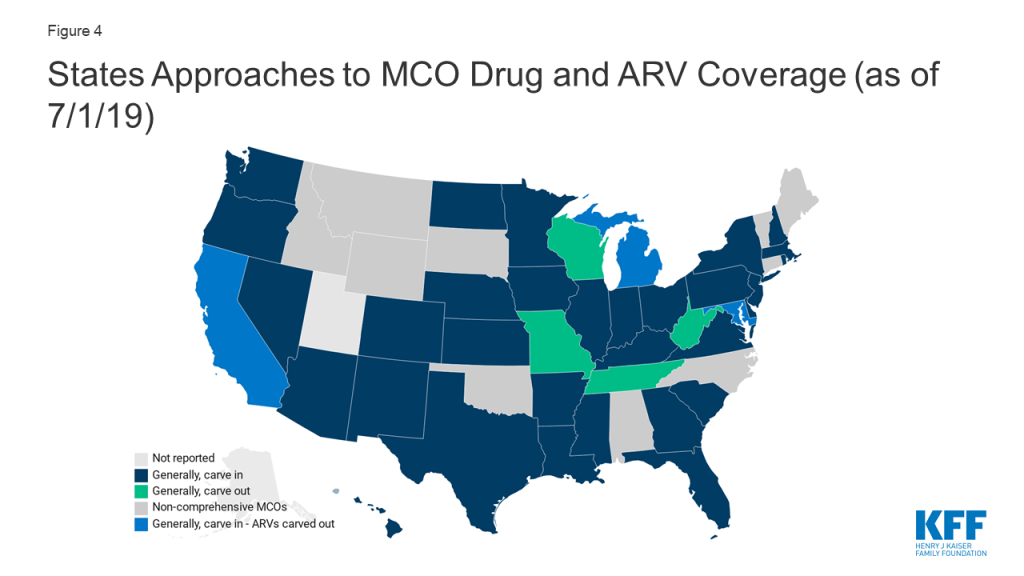
As mentioned, sometimes states that generally, “carve in” the drug benefit, elect to carve out certain drugs or classes, particularly high cost-classes, such as ARVs. Four generally “carve in” states (CA, DC, MD, and MI), elect to carve out ARVs, in some cases, among other classes.
Figure 4: State Approaches to MCO Drug and ARV Coverage (as of 7/1/19)
Methods
Unless otherwise noted, findings are drawn from a survey of Medicaid officials in all 50 states and the District of Columbia conducted by KFF and Health Management Associates (HMA). The survey was conducted from June through December 2019 and sent to each state Medicaid director in June 2019. An acronym glossary and the survey instrument are included in a separate report. The District of Columbia is counted as a state for the purposes of this date note; the counts of state policies or policy actions include survey responses from 50 states (including DC). Utah did not respond. Survey responses refer to Medicaid pharmacy policies in place or implemented in FY 2019.
Data on state prior-authorization practices around PrEP were first drawn from the survey described above. For states reporting PA for PrEP, this policy was confirmed using online pharmacy documents, such as memos and preferred drug lists. Among the 6 states (AR, AZ, FL, KY, NY, and WY) that responded requiring PA for PrEP in the survey, 2 (AR and AZ) were found to now cover PrEP without prior-authorization. A spot check of eight states reporting they did not require PA for PrEP in the survey was performed and no inconsistencies between the survey response and written policy were found. Findings related to PA for PrEP is based on a combined methodology of policy review and survey response.
This work was supported in part by the Elton John AIDS Foundation. We value our funders. KFF maintains full editorial control over all of its policy analysis, polling, and journalism activities.
At the time of the July 2019 survey, six states reported requiring PA for PrEP. After reviewing Medicaid pharmacy documents for all six, we found that AR and AZ have either since removed prior authorization requirements for PrEP or had answered the survey in inconsistently with written policy. States that reported not requiring PA for PrEP in the July 2019 survey, were not further reviewed after a spot check of 8 states was consistent with survey findings. ↩︎
New York State Department of Health. Truvada (emtricitabine and tenofovir DF) and Descovy (emtricitabine and tenofovir alafenamide) Medicaid Fee-for-Service. https://www.health.ny.gov/diseases/aids/general/prep/truvada.htm Accessed 5/14/19 ↩︎
In May 2020, the Trump Administration announced the number of Medicare Part D plans that will be participating in 2021 in a Medicare Innovation Center model to address out-of-pocket costs for insulin products for Part D enrollees. Under the voluntary model, participating Part D plans can offer coverage of insulin for a flat monthly copayment of no more than $35, in contrast to varying cost-sharing amounts during different phases of the Part D benefit under the current design. The model comes in response to rising prices for insulin, which have attracted increasing scrutiny from policymakers, leading to congressionalinvestigations and overall concerns about affordability and access for people with diabetes who need insulin to control blood glucose levels.
Among people with Medicare (including people 65 and older and younger adults with long-term disabilities), one third (33%) had diabetes in 2017, up from 18% in 2000. The rate of diabetes in the overall population has been trending up, and is highest among people 65 and over. Being overweight, having high blood pressure or high cholesterol, older age, and physical inactivity are among the risk factors for type 2 diabetes (by far the most common type). Though not all people with diabetes need insulin, for those who do, it is a life-saving medication and essential to maintaining good health.
In light of heightened attention to insulin and the Trump Administration’s new Part D model to address out-of-pocket costs for insulin for Medicare beneficiaries, we analyzed out-of-pocket spending on insulin by beneficiaries enrolled in Part D drug plans, variation in Part D plan formulary coverage and tier placement of insulin products, and trends in prices for insulin (not accounting for rebates), based on data from the Centers for Medicare & Medicaid Services (CMS) (see Data and Methods for details). We also discuss the Administration’s Part D demonstration, which will take effect in 2021, and policy proposals introduced in the 116th Congress that address cost concerns related to insulin.
Key Takeaways
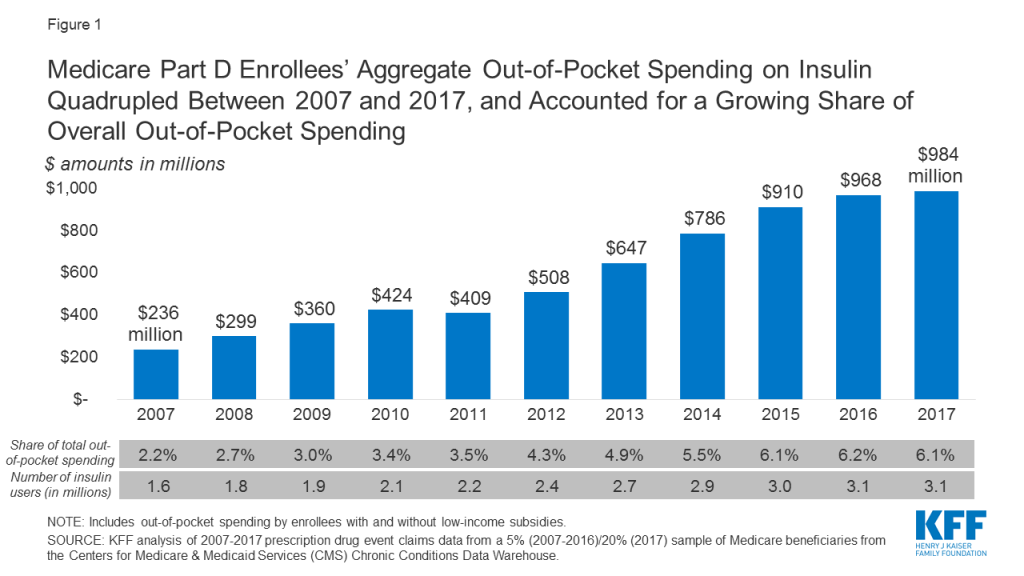
Aggregate out-of-pocket spending by people with Medicare Part D for insulin products quadrupled between 2007 to 2017 from $236 million to $984 million, reflecting both an increase in the number of users and price increases for insulin.
Among insulin users without Part D low-income subsidies (LIS), average annual per capita out-of-pocket spending on insulin increased by 79% over these years, from $324 in 2007 to $580 in 2017. Average annual growth in costs was 6%, which exceeded the 1.6% average annual rate of growth in inflation over this time period.
If Part D enrollees had paid 12 months of $35 copays for insulin in 2017, as under the Administration’s new Part D model, annual costs for one insulin product would have been $420, or $160 (28%) lower than average annual costs paid by non-LIS Part D insulin users in 2017.
Formulary coverage and tier placement of insulin products vary across Part D plans, but in 2019, a large number of Part D plans placed insulin products on Tier 3, the preferred drug tier, which typically had a $47 copayment per prescription during the initial coverage phase. However, once enrollees reach the coverage gap phase, they face a 25% coinsurance rate, which equates to $100 or more per prescription in out-of-pocket costs for many insulin therapies, unless they qualify for LIS. Paying a flat $35 copayment rather than 25% coinsurance during the coverage gap phase could translate to meaningful savings on many insulin products.
Among the 22 insulin therapies that have been on the market since at least 2013, 16 products had average annual price increases of more than 10% between 2013 and 2018, as measured by the change in total Part D spending per dosage unit between these years, which far exceeded the 1.5% rate of inflation over the same time period. Although CMS’s Part D pricing data does not account for rebates, it is relevant in considering out-of-pocket costs for people who use insulin, because in some cases what people pay out of pocket is based on the list price.
The Administration’s new model that allows participating Part D plans to cap monthly out-of-pocket insulin costs could help some beneficiaries with their insulin costs, if they are enrolled in a participating Part D plan and use an insulin product covered by their plan with a $35 copayment. But the new model applies to a subset of plans and enrollees (those without low-income subsidies in enhanced plans, which cover 80% of non-LIS Part D enrollees in non-employer Part D plans in 2020), and not all insulin products have to be covered by all participating plans. The new model also does not address underlying list price increases for insulin or affordability concerns for people who are uninsured or covered by other sources of coverage.
Out-of-Pocket Spending on Insulin by Medicare Part D Enrollees
Aggregate Out-of-Pocket Spending for Insulin in Part D
Aggregate out-of-pocket spending by people with Medicare Part D for insulin products quadrupled between 2007 to 2017, from $236 million to $984 million (Figure 1). The number of Medicare Part D enrollees using insulin nearly doubled over this time period (from 1.6 million to 3.1 million beneficiaries), which indicates that higher aggregate out-of-pocket spending was not solely a function of more Medicare beneficiaries using insulin.
Figure 1: Medicare Part D Enrollees’ Aggregate Out-of-Pocket Spending on Insulin Quadrupled Between 2007 and 2017, and Accounted for a Growing Share of Overall Out-of-Pocket Spending
Average Annual Per Capita Out-of-Pocket Costs for Insulin
Annual out-of-pocket spending on insulin products among Medicare Part D insulin users who do not receive low income subsidies was $580 in 2017, a 79% increase since 2007 ($324). Average annual growth in insulin out-of-pocket costs was 6% over these years, which far exceeded the 1.6% average annual rate of growth in inflation over this time period.
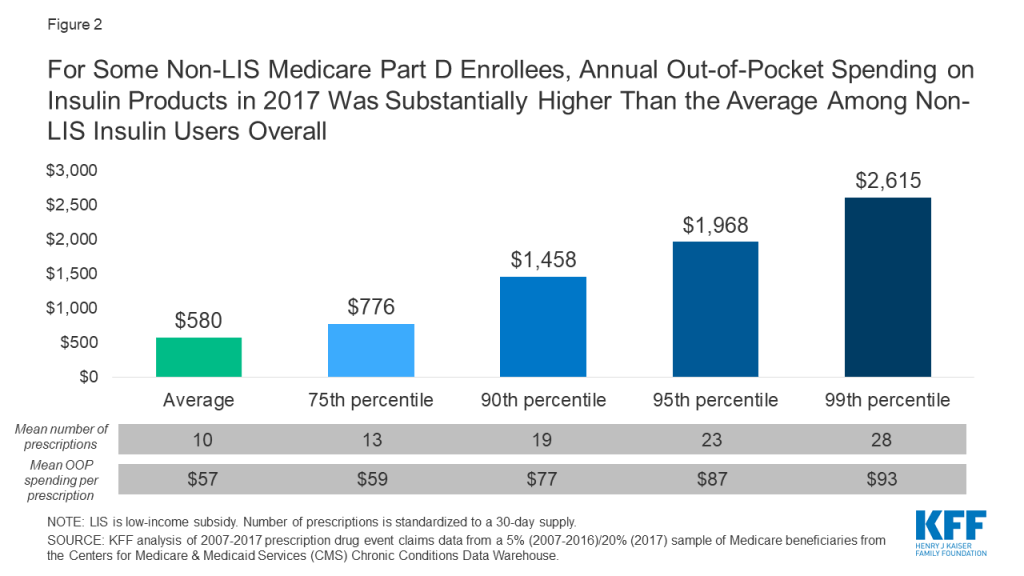
Some enrollees spent considerably more than the average (Figure 2). For example, 10% of non-LIS insulin users spent nearly $1,500 on insulin in 2017 and 1% spent over $2,600. Higher-than-average out-of-pocket spending is due to a greater number of prescription fills for insulin products and higher out-of-pocket costs per insulin prescription. In other words, taking more than one insulin product and taking newer, more expensive formulations leads to higher out-of-pocket costs.
Figure 2: For Some Non-LIS Medicare Part D Enrollees, Annual Out-of-Pocket Spending on Insulin Products in 2017 Was Substantially Higher Than the Average Among Non-LIS Insulin Users Overall
Out-of-Pocket Spending Per Insulin Prescription
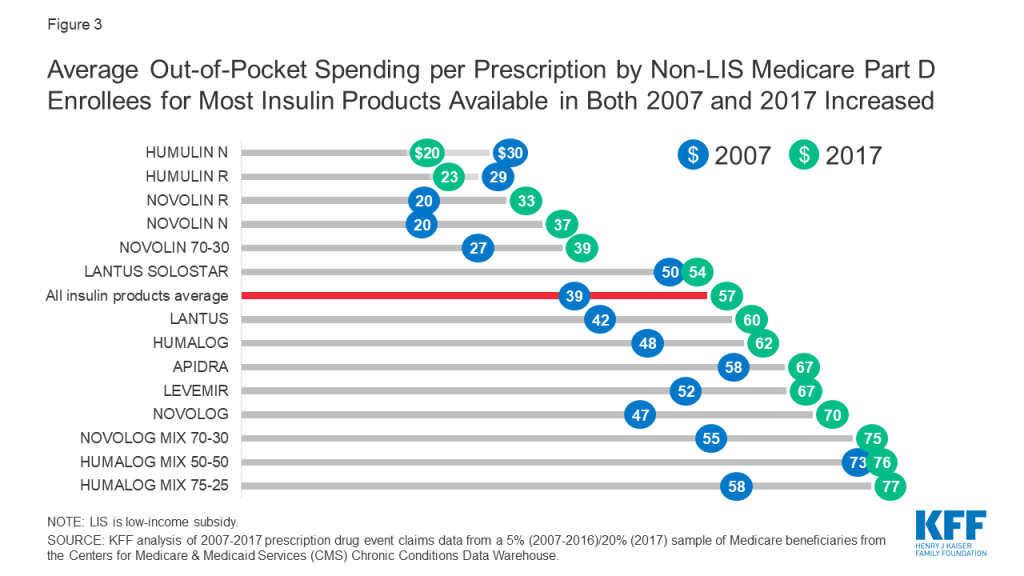
Among Medicare Part D insulin users who do not receive low-income subsidies, out-of-pocket costs per prescription increased by 50% across insulin products available in both 2007 and 2017, from $39 to $57 per prescription, on average (Figure 3). For all insulin products available in 2017, out-of-pocket spending per prescription by non-LIS Part D enrollees ranged from $20 for Humulin N, an intermediate-acting insulin, to $128 for Humulin R U-500, a short-acting concentrated insulin (Table 1).
Figure 3: Average Out-of-Pocket Spending per Prescription by Non-LIS Medicare Part D Enrollees for Most Insulin Products Available in Both 2007 and 2017 Increased
For some products, the percentage increase in out-of-pocket costs per prescription between 2007 and 2017 was higher than average, including an 87% increase for Novolin N and a 63% increase for Novolin R, both short-acting insulin products. In terms of actual out-of-pocket costs per prescription, these were among the lower-cost insulin products in both 2007 and 2017, and less commonly used than several other insulin products (Table 1).
Part D Formulary Coverage and Tier Placement of Insulin
Formulary Coverage and Tier Placement of Insulin Therapies
Formulary coverage and tier placement are key factors determining how much Medicare Part D enrollees without low-income subsidies pay out of pocket for their prescriptions, including insulin. In 2019, most insulin products were covered by at least 50% of all Part D plans, including both stand-alone prescription drug plans and Medicare Advantage drug plans (Table 2). Although coverage of insulin products was not universal, as for drugs in the so-called protected classes, it exceeds the minimum requirement that plans cover at least two chemically distinct drugs in each class.
Even when insulin products are covered by Part D plans, there is variation in tier placement and cost-sharing requirements when enrollees are in the initial coverage phase. A large number of plans placed insulin products on Tier 3, the preferred drug tier, with a $47 copayment per prescription during the initial coverage phase; more plans used this combination of tier placement and cost-sharing requirement for coverage of insulin than any other combination in 2019 (Table 3, Table 4).
This means that for Part D enrollees, the typical out-of-pocket cost for insulin when they are in the initial coverage phase is not pegged to the list price, as it would be with coinsurance. But some plans charged coinsurance for Tier 3, with a median coinsurance rate 25%, and a handful of plans placed some insulin products on Tier 4 (the non-preferred drug tier), with a median coinsurance rate of 48%. These coinsurance rates translate into varying out-of-pocket costs for insulin users depending on the underlying list price, as described below.
Variation in Out-of-Pocket Spending for Insulin Products by Tier Placement and Cost-Sharing Requirements
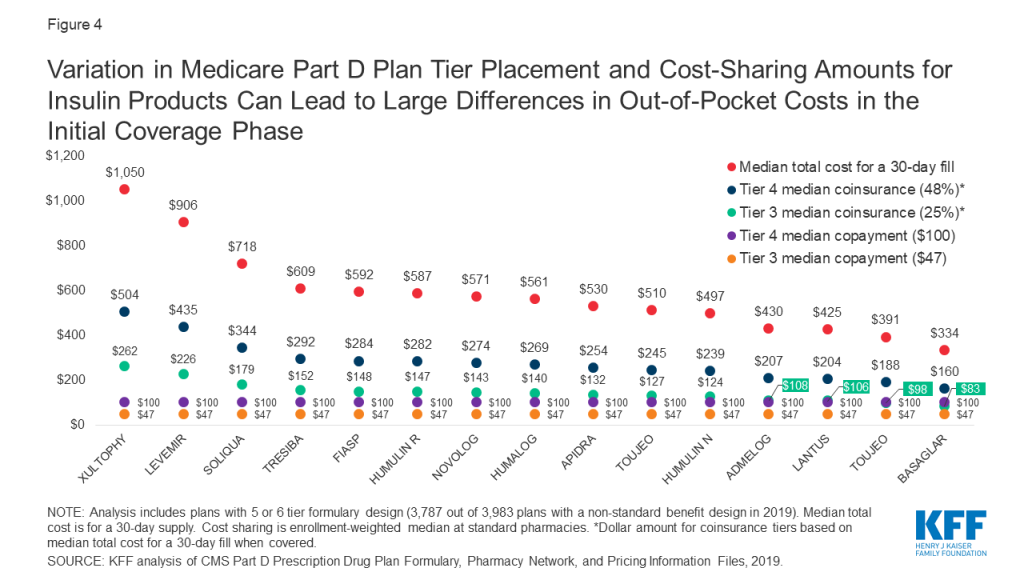
Because some insulin products are considerably more expensive than others, differences in tier placement and cost-sharing requirements can translate to wide variation in out-of-pocket spending for any given insulin therapy and from one insulin therapy to another (Figure 4).
Figure 4: Variation in Medicare Part D Plan Tier Placement and Cost-Sharing Amounts for Insulin Products Can Lead to Large Differences in Out-of-Pocket Costs in the Initial Coverage Phase
For example, Xultophy has the highest median total cost for a 30-day fill among all pen injector insulin products, at more than $1,000, while Basaglar has the lowest, at $334. A beneficiary enrolled in a Part D plan that placed these drugs on Tier 4 with the most common coinsurance requirement (48%) would pay more than $500 per prescription for Xultophy in the initial coverage phase of the Part D benefit, which is three times what they would pay for Basaglar ($160). Both amounts are more than they would pay for these products if their plan charged a $100 copayment for Tier 4 drugs, and substantially higher than if the drugs were covered on Tier 3 with a $47 copayment.
Case Study in Part D Formulary Coverage of Insulin: Lantus Solostar
Lantus Solostar was the top insulin product in terms of total out-of-pocket spending by Part D enrollees in 2017. In 2019, this drug was covered on Tier 3 for about 6 in 10 Part D enrollees in 2019 (63%), while for one third of enrollees (33%), this drug was not covered on their formulary. For users of Lantus whose plans covered this drug, most (59%) were subject to a Tier 3 copayment between $40 and $47, while 16% faced lower copays, and one-fourth (25%) faced higher out-of-pocket costs, either a copayment between $90 and $100 or coinsurance between 15% and 25%, which translates to $64 to $106 based on the median cost. Users of Lantus who were enrolled in a plan that did not cover this insulin therapy faced the full cost of $425 per prescription.
Variation in Out-of-Pocket Spending for Insulin Products by Part D Benefit Phase
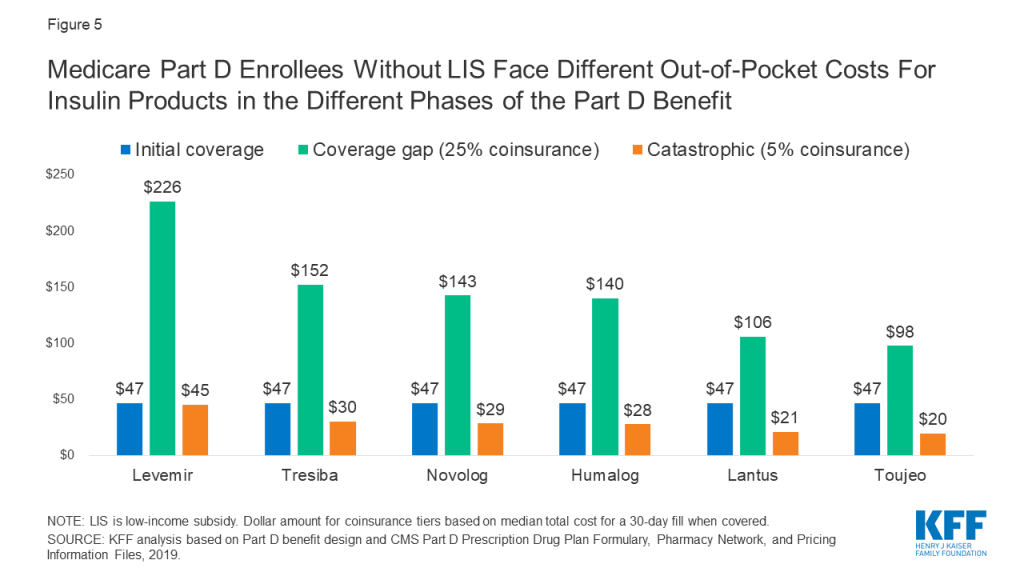
A distinctive feature of the Part D benefit is that out-of-pocket costs paid by non-LIS enrollees may not be uniform for each prescription fill from one month to another, depending on which phase of the benefit they are in. The Part D defined standard benefit has several phases where cost sharing for enrollees varies, including a deductible, an initial coverage phase, a coverage gap phase, and catastrophic coverage. Between the initial coverage phase and the coverage gap phase, cost sharing paid by non-LIS enrollees for any given drug switches from however much a plan charges for that drug based on its specific formulary design to a uniform 25% coinsurance rate, followed by a uniform 5% coinsurance rate that non-LIS enrollees pay in the catastrophic coverage phase. Based on the underlying list price of a medication, enrollees’ costs can increase substantially when they move from the initial coverage phase to the coverage gap phase.
For insulin products, this variation in cost sharing translates to varying out-of-pocket costs from one benefit phase to another. Figure 5 shows out-of-pocket costs for a selection of insulin products where in the initial coverage phase, the most common tier placement in 2019 was Tier 3 with a $47 copayment. For all of these products, out-of-pocket costs per prescription increase to $100 or more during the coverage gap phase, when cost sharing is based on a 25% coinsurance rate. For example, for Levemir, an enrollee would pay $47 in the initial coverage phase, but during the coverage gap phase (after total drug costs exceeded $3,820 in 2019), their out-of-pocket costs would rise to $226 per prescription, which is 25% of the $906 list price of Levemir. Out-of-pocket costs would decrease to $45, or 5% of the list price, during the catastrophic phase (after annual out-of-pocket spending exceeded $5,100 in 2019).
Figure 5: Medicare Part D Enrollees Without LIS Face Different Out-of-Pocket Costs For Insulin Products in the Different Phases of the Part D Benefit
Trends in Insulin Prices
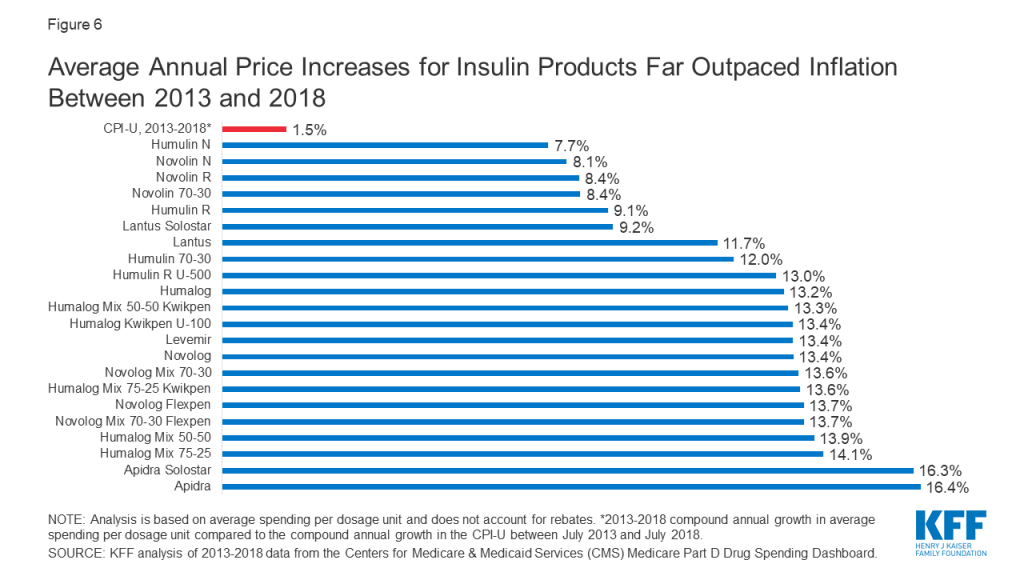
Among the 22 insulin therapies that have been on the market since at least 2013, 16 products had average annual price increases of more than 10% between 2013 and 2018, as measured by the change total Part D spending per dosage unit between these years, which far exceeded the 1.5% average annual growth in inflation over the same time period (Figure 6).
Figure 6: Average Annual Price Increases for Insulin Products Far Outpaced Inflation Between 2013 and 2018
It is important to note that this spending measure, and total spending as reported in Part D claims, do not account for rebates, which are not publicly available at the individual product level. The Government Accountability Office has estimated rebates of 41% in 2016 for drugs in the therapeutic class that includes insulin. This is higher than the estimated 20% rebate for Part D covered drugs overall in 2016. While gross total Part D spending on insulin increased from $1.4 billion in 2007 to $13.1 billion in 2017, net total spending would be significantly lower after accounting for rebates.
The level of rebates offered by manufacturers for specific drugs influences coverage and tier placement decisions by Part D plans, which in turn affects out-of-pocket costs paid by enrollees. It has been suggested that the magnitude of list price increases for insulin products over time can be attributed to manufacturers offering increasingly larger rebates for these drugs in exchange for preferred formulary coverage.
Although CMS’s Part D pricing data does not account for rebates, it is relevant in considering out-of-pocket costs for people who use insulin, because in some cases what people pay out of pocket is based on the list price. As a result, percentage increases in prices for insulin products can translate to higher out-of-pocket spending over time.
Proposals to Address Insulin Costs for Medicare Beneficiaries
Innovation Center Model
In March 2020, the Administration announced a voluntary Innovation Center model, the “Part D Senior Savings Model,” that allows participating Part D plans to offer coverage of insulin for a flat monthly copayment of no more than $35 for enrollees not receiving low-income subsidies (LIS), starting in 2021. (Most LIS enrollees already pay a much lower copayment of no more than $8.95 for brands in 2020, so the model does not apply to them.) Participating Part D plans – enhanced plans only, not basic plans – can offer insulin products from participating manufacturers at a flat $35 copayment during all phases of the benefit (deductible, initial coverage, coverage gap, and catastrophic). Compared to basic Part D plans, enhanced plans can offer a lower deductible (the standard is $435 in 2020), reduced cost sharing (under the basic standard benefit, cost sharing is a uniform 25% coinsurance or actuarially equivalent amounts), and/or a higher initial coverage limit (the standard limit is $4,020 in 2020).
CMS recently announced that more than 1,750 enhanced Part D plans will participate in the model in 2021; for reference, this equals roughly 50% of all enhanced plans in 2020, including both Medicare Advantage and stand-alone drug plans and roughly 40% of all Part D plans this year. It is not yet known how many Part D plans of each type will be offered in 2021, or how many plans in total.
Each of the three major insulin manufacturers – Eli Lilly, Sanofi, and Novo Nordisk – has agreed to participate in the model for 2021. Participating manufacturers will continue to provide a 70% price discount in the coverage gap, but the discount will be calculated before the application of the supplemental benefit (i.e., the $35 monthly copay for insulin). Under current law, the manufacturer discount is calculated after the application of the supplemental benefit if a plan lowers cost sharing in the coverage gap. This creates a disincentive for plans to offer supplemental benefits in the coverage gap because plan liability increases and manufacturer liability decreases.
For example, for a drug that costs $500, under current law in a plan with no supplemental benefit, the manufacturer discount is $350 (70% of $500), beneficiaries pay $125 (25% of $500), and plans pay $25 (5% of $500) (see table below). If, instead, the plan charged a flat $35 copayment in the coverage gap, the plan’s total liability increases to $465 ($500-$35), and the manufacturer 70% discount is calculated off of the $35 remainder (i.e., after the application of the supplemental benefit). The Part D model modifies this calculation, thereby reducing the amount plans pay and increasing liability for manufacturers.
Example of Part D Plan, Manufacturer, and Enrollee Costs For a Monthly Prescription Drug Fill in the Coverage Gap Under Current Law With and Without Supplemental Benefits and Under the Administration’s Part D Model
Under current law with no supplemental benefit
Under current law with a $35 monthly copay in coverage gap
Under Administration’s Part D model with a $35 monthly copay
List price
$500
$500
$500
Manufacturer gap discount
$350$500 * 70%
$24.50$35 * 70%
$350$500 * 70%
Enrollee cost
$125$500 * 25%
$10.50$35 – $24.50
$35
Plan cost
$25$500 * 5%
$465$500 – $35
$115$500 – $350 – $35
Under the model, CMS expects that there will be more insulin claims filled in the coverage gap phase and fewer enrollees passing into the catastrophic coverage phase. This change, plus the changes to plan and manufacturer liability for insulin claims in the coverage gap, translates into an estimated $250 million in additional coverage gap discounts over five years, and similar savings for Medicare.
As an additional financial incentive for plans to participate in the model, participating plans can also receive financial protection through a narrower risk corridor, which would reduce potential losses if a plan’s actual costs are higher than expected. Currently, plans bear full liability for actual costs up to 5% higher than expected costs, beyond which higher costs are paid by both plans and the government. The model reduces the initial risk corridor threshold to 2.5% for participating plans that have a significantly greater number of insulin-dependent diabetics enrolled relative to other similar plan types. Higher costs can also be passed on to enrollees in the form of higher premiums, and CMS has estimated that the model will in fact increase enhanced plan premiums by approximately $1 per month due to higher plan liability.
Implications for Part D Enrollees
Based on our analysis of actual spending in 2017, we found that average annual out-of-pocket costs by Part D insulin users not receiving low-income subsidies was $580. If instead they had paid 12 months of $35 copays, as under the Administration’s model, annual costs would have been $420 for one insulin product, or $160 (28%) lower than average annual costs paid by non-LIS Part D insulin users in 2017. Paying a flat $35 copayment during the coverage gap phase could translate to meaningful savings on many insulin products, with typical list prices in the hundreds of dollars, which equates to out-of-pocket costs of $100 or more under the current benefit design where beneficiaries pay 25% coinsurance in the coverage gap phase.
Two key features of the model will limit its scope, however. The model relies on voluntary plan participation (though participation seems relatively robust for 2021), and only enhanced Part D plans can participate (though most enrollees – 80% of non-LIS Part D enrollees in non-employer plans – are in these enhanced plans in 2020). If Part D enrollment in 2021 is similar to 2020, one-fifth of non-LIS Part D enrollees (those who are in basic plans) would not stand to benefit from the model unless they switch from a basic to an enhanced plan, and some additional share of current enhanced plan enrollees who are in plans that have chosen not to participate would need to switch into a participating plan. Prior work shows that most enrollees do not switch during the open enrollment period, though it is possible that insulin users would be more willing switch plans if joining a participating plan would lower their out-of-pocket costs.
Another potential concern is that enhanced Part D plans have higher monthly premiums than basic Part D plans, and as mentioned earlier, CMS expects that participating enhanced plans will have even higher premiums based on higher plan costs. On average, the monthly premium for enhanced stand-alone drug plans in 2020 is $47, compared to $30 for basic stand-alone drug plans – or more than 50% higher. This translates to more than $200 in higher annual premiums, on average. Based on these average premiums amounts and our estimate of possible savings based on 2017 out-of-pocket costs, the higher premium for an enhanced plan could fully offset savings from lower out-of-pocket costs for one insulin product (though beneficiaries could see other savings in these enhanced plans, such as a lower deductible).
A final concern is that participating Part D plans do not have to cover all insulin products at the $35 monthly copayment amount, just one of each dosage form (vial, pen) and insulin type (rapid-acting, short-acting, intermediate-acting, and long-acting). For insulin products not covered by a participating plan, users of these products would not benefit from the model unless they switch to a product from a competing manufacturer. Making this switch could be difficult for insulin users who have been stabilized on a particular insulin medication (or medications) and for whom consistency in treatment is important in managing diabetes.
Legislative Proposals
Several bills have been introduced in the 116th Congress aiming to curb insulin costs for consumers. Some of these proposals target insulin directly, while others address drug prices as a whole and would therefore impact insulin prices. Proposals that target out-of-pocket costs specifically for insulin under Medicare Part D include the Lower Costs, More Cures Act (Rep. Walden, R-OR), which includes a provision to impose a $50 cap on monthly out-of-pocket costs incurred by Medicare beneficiaries for insulin and insulin supplies, and the Insulin Access for All Act (Rep. Rush, D-IL), which would eliminate all cost sharing for insulin and related supplies for Medicaid and Medicare beneficiaries.
Some current proposals rely on strategies that could help control prescription drug costs more generally to target insulin prices specifically. These strategies include importation, international reference pricing, and manufacturer rebates.
The Affordable Insulin Act (Rep. Welch, D-VT) allows individuals, pharmacies, and wholesalers to import insulin from Canada and other qualifying countries.
The End Price Gouging for Insulin Act (Sen. Merkley, D-OR) authorizes the government to establish reference prices for insulin products sold under any federal health program, including Medicare and Medicaid, based on existing prices in certain economically comparable countries, and to impose civil penalties on manufacturers that are non-compliant to these prices.
The Insulin Price Reduction Act (Sen. Shaheen, D-NH) prohibits manufacturer rebates for insulin products unless they are passed on at the point of sale.
Several proposals target drug costs more broadly and would have effects on insulin prices and spending.
The Prescription Drug Pricing Reduction Act (Sen. Grassley, R-IA, and Sen. Wyden, D-OR), limits Part D drug price increases to the rate of inflation, requiring manufacturers to pay rebates equal to any increase exceeding inflation rates.
The Affordable Drug Manufacturing Act (Sen. Warren, D-MA) establishes a federal office to authorize and oversee the manufacture of generic drugs in case of shortages and lack of competition and to set fair market prices for such drugs. While the bill is not exclusively aimed at insulin prices, it targets insulin for manufacture due to lack of competition and high prices.
The Elijah E. Cummings Lower Drug Costs Now Act, passed by the House of Representatives in December 2019, authorizes the government to negotiate prices for a limited number of high-cost, single source Part D drugs, and explicitly lists insulin among those drugs to be negotiated. This bill also includes an inflation rebate provision.
Conclusion
Rising prices for insulin have attracted increasing scrutiny from policymakers. The Administration’s new model that allows participating Part D plans to cap monthly out-of-pocket insulin costs for their enrollees will help some beneficiaries with their insulin costs, if they are enrolled in a participating Part D plan and use an insulin product covered by their plan with a $35 copayment. But the new model applies to only a subset of plans and enrollees, and not all insulin products have to be covered by all participating plans. The new model also does not address underlying insulin list price increases or affordability concerns for people who are uninsured or covered by other sources of coverage besides Medicare Part D.
Our analysis of Part D claims shows that higher insulin prices have led to an increase in out-of-pocket spending by Medicare beneficiaries for insulin, and higher out-of-pocket costs for some insulin products relative to others. At the same time, the typical formulary placement for insulin products in Part D plans insulates many people on Medicare from the high cost of this drug since many plans typically charge a flat dollar copayment for covered insulin products during the initial coverage phase. However, when insulin users reach the coverage gap and face 25% coinsurance, or when an insulin product is covered on a higher tier or not covered at all, out-of-pocket costs are higher.
It is important to note that this analysis does not include the cost of insulin supplies, nor does it include the cost of other drugs that people with diabetes might take for other conditions, so it is not the full picture of the out-of-pocket prescription drug cost burden facing insulin users in Medicare. These findings demonstrate why the cost of insulin and other prescription drugs is an ongoing concern for patients and public and private payers, and a pressing issue for policymakers.
This work was supported in part by Arnold Ventures. We value our funders. KFF maintains full editorial control over all of its policy analysis, polling, and journalism activities.
Juliette Cubanski, Tricia Neuman, and Sarah True are with KFF. Anthony Damico is an independent consultant.
Methods
Data and Methods
Our analysis of changes in list prices for insulin therapies covered by Medicare Part D is based on data from the CMS’s two most recent releases of the Medicare Part D drug spending dashboard (March 2019 and January 2020). Changes in list prices for insulin products available between 2013 and 2018 are measured by five-year (2013-2018) changes in average spending per dosage unit amounts reported in the dashboard. We compare these changes to the rate of increase in the Consumer Price Index for all urban consumers (CPI-U) over the same time period, based on the July 2013-July 2018 percentage change in the CPI-U.
Our analysis of out-of-pocket spending on insulin therapies covered by Medicare Part D, in the aggregate and average per insulin user and product, is based on 2007-2017 prescription drug event claims data from a sample of Medicare beneficiaries (5% sample for 2007-2016, 20% sample for 2017) from the Centers for Medicare & Medicaid Services (CMS) Chronic Conditions Data Warehouse.
Our analysis of formulary coverage of insulin products in Part D plans is based on data from the Q4 2018 Part D Prescription Drug Plan Formulary, Pharmacy Network, and Pricing Information Files, which includes formulary data for 2019 for 46 insulin products (see Table 2 for a complete product listing). Our analysis includes all Part D plans with a 5 or 6 tier formulary design, including stand-alone prescription drug plans and Medicare Advantage drug plans. We calculate out-of-pocket costs for covered insulin products based on the enrollment-weighted median cost sharing at pharmacies offering standard (non-preferred) cost sharing. To illustrate the impact of differences in tier placement and cost-sharing requirements for insulin products, we calculate the median total cost for a 30-day fill at standard cost-sharing pharmacies for several insulin therapies as reported in the pricing information file, and calculate the out-of-pocket cost based on different tier placement and cost-sharing requirements.
Estimates of the share of Medicare beneficiaries with diabetes is based on our analysis of 2000 and 2017 data from the CMS Medicare Current Beneficiary Survey (MCBS). The MCBS asks respondents whether they have ever had any of a series of illnesses or conditions, including diabetes. Their responses are coded affirmatively if the respondent had at some time been diagnosed with the condition, even if it had been corrected by time or treatment. The condition must have been reported by the respondent as diagnosed by a physician, and not by the respondent.
Tables
Table 1: Number of Users and Out-of-Pocket Spending on Insulin Products in Medicare Part D, 2007 and 2017
Number of users
Average out-of-pocket spending perprescription by non-LIS enrollees
Insulin products
2007
2017
2007
2017
All insulin products, average
1,642,880
3,136,240
$39
$57
Afrezza
N/A
775
N/A
86
Apidra
12,260
3,355
58
67
Apidra Solostar
N/A
7,765
N/A
60
Basaglar Kwikpen U-100
N/A
24,485
N/A
64
Humalog
205,700
270,780
48
62
Humalog Kwikpen U-100
N/A
411,895
N/A
62
Humalog Kwikpen U-200
N/A
23,640
N/A
70
Humalog Mix 50-50
3,900
1,895
73
76
Humalog Mix 50-50 Kwikpen
N/A
5,700
N/A
78
Humalog Mix 75-25
67,180
28,720
58
77
Humalog Mix 75-25 Kwikpen
N/A
67,655
N/A
78
Humulin 70-30
165,640
75,070
32
43
Humulin 70/30 Kwikpen
N/A
24,860
N/A
63
Humulin N
150,060
119,445
30
20
Humulin N Kwikpen
N/A
27,335
N/A
35
Humulin R
133,800
97,365
29
23
Humulin R U-500
N/A
14,240
N/A
128
Humulin R U-500 Kwikpen
N/A
13,320
N/A
95
Lantus
775,740
586,770
42
60
Lantus Solostar
28,220
1,108,460
50
54
Levemir
64,120
187,005
52
67
Levemir Flextouch
N/A
508,655
N/A
59
Novolin 70-30
207,440
111,895
27
39
Novolin N
159,580
76,890
20
37
Novolin R
254,240
90,410
20
33
Novolog
247,680
286,065
47
70
Novolog Flexpen
N/A
543,835
N/A
70
Novolog Mix 70-30
117,220
41,605
55
75
Novolog Mix 70-30 Flexpen
N/A
96,425
N/A
84
Soliqua 100-33
N/A
3,425
N/A
68
Toujeo Solostar
N/A
190,805
N/A
63
Tresiba Flextouch U-100
N/A
63,500
N/A
55
Tresiba Flextouch U-200
N/A
89,275
N/A
70
Xultophy 100-3.6
N/A
1,330
N/A
83
NOTE: LIS is low-income subsidy. N/A indicates drug not available in year.SOURCE: KFF analysis of 2007-2017 prescription drug event claims data from a 5% (2007-2016)/20% (2017) sample of Medicare beneficiaries from the Centers for Medicare & Medicaid Services (CMS) Chronic Conditions Data Warehouse.
Table 2: Formulary Coverage of Insulin Products in Medicare Part D Plans, 2019
Part D plans placing drug on formulary
Part D enrollees with formulary coverage
Drug name
Product type
Number
Share(out of 3,787)
Number(in millions)
Share (out of 37.0 million)
Median total cost for 30-day prescription
Admelog Solostar
Pen injector
124
3%
1.4
4%
$430
Admelog
Injectable solution
124
3%
1.4
4%
$225
Afrezza (12 units)
Inhalant powder
98
3%
1.4
4%
$937
Afrezza (8 units)
Inhalant powder
98
3%
1.4
4%
$626
Afrezza (4 units)
Inhalant powder
98
3%
1.4
4%
$314
Afrezza Titration Pack
Inhalant powder
98
3%
1.4
4%
$937
Afrezza 180 Titration Pack
Inhalant powder
98
3%
1.4
4%
$1,249
Apidra Solostar
Pen injector
223
6%
1.8
5%
$530
Apidra
Injectable solution
223
6%
1.8
5%
$277
Basaglar
Pen injector
1,241
33%
13.9
38%
$334
Fiasp Flextouch
Pen injector
2,004
53%
22.0
59%
$592
Fiasp
Injectable solution
2,004
53%
22.0
59%
$307
Humalog
Injectable solution
1,932
51%
16.6
45%
$87
Humalog
Pen injector
1,923
51%
16.4
44%
$561
Humalog
Cartridge
1,918
51%
16.3
44%
$540
Humalog U-100 Kwikpen
Pen injector
1,890
50%
16.3
44%
$567
Humalog U-200 Kwikpen
Pen injector
1,853
49%
16.2
44%
$450
Humalog Mix 75/25
Injectable suspension
1,932
51%
16.6
45%
$301
Humalog Mix 50/50
Injectable suspension
1,932
51%
16.6
45%
$301
Humalog Mix 75/25 Kwikpen
Pen injector
1,923
51%
16.4
44%
$562
Humalog Mix 50/50 Kwikpen
Pen injector
1,923
51%
16.4
44%
$561
Humulin
Pen injector
1,865
49%
16.3
44%
$498
Humulin
Injectable suspension
1,852
49%
16.4
44%
$158
Humulin N Kwikpen
Pen injector
1,865
49%
16.3
44%
$497
Humulin N
Injectable suspension
1,852
49%
16.4
44%
$158
Humulin R U-500
Injectable solution
3,648
96%
35.6
96%
$1,518
Humulin R U-500 Kwiken
Pen injector
3,607
95%
35.3
95%
$587
Humulin R
Injectable solution
1,852
49%
16.4
44%
$156
Lantus
Injectable solution
2,798
74%
24.9
67%
$283
Lantus Solostar
Pen injector
2,793
74%
24.9
67%
$425
Levemir Flextouch
Pen injector
3,368
89%
33.3
90%
$906
Levemir
Injectable solution
3,368
89%
33.3
90%
$604
Novolin 70/30
Injectable suspension
2,189
58%
22.8
62%
$141
Novolin N
Injectable suspension
2,189
58%
22.8
62%
$141
Novolin R
Injectable solution
2,189
58%
22.8
62%
$141
Novolog Flexpen
Pen injector
2,319
61%
23.1
62%
$571
Novolog
Cartridge
2,319
61%
23.1
62%
$549
Novolog
Injectable solution
2,319
61%
23.1
62%
$296
Novolog Mix 70/30 Flexpen
Pen injector
2,319
61%
23.1
62%
$571
Novolog Mix 70/30
Injectable suspension
2,319
61%
23.1
62%
$307
Soliqua 100-33
Pen injector
2,657
70%
30.7
83%
$718
Toujeo Solostar
Pen injector
2,779
73%
24.7
67%
$391
Toujeo Max Solostar
Pen injector
2,643
70%
24.5
66%
$510
Tresiba Flextouch U-200
Pen injector
2,953
78%
31.0
84%
$609
Tresiba Flextouch U-100
Pen injector
2,953
78%
31.0
84%
$508
Xultophy 100-3.6
Pen injector
2,168
57%
22.9
62%
$1,050
NOTE: Analysis includes plans with 5 or 6 tier formulary design (3,787 out of 3,983 plans with a non-standard benefit design in 2019).SOURCE: KFF analysis of CMS Part D Prescription Drug Plan Formulary, Pharmacy Network, and Pricing Information Files, 2019.
Table 3: Typical Formulary Placement of Insulin Products in Medicare Part D Plans, 2019
Median formulary placement when covered
Cost-sharing amounts
Drug name
Product type
Tier
Cost-sharing type
Initial coverage phase
Coverage gap phase(based on 25% coinsurance)
Catastrophic coverage phase(based on 5% coinsurance)
Admelog Solostar
Pen injector
4
copayment
$100
$108
$22
Admelog
Injectable solution
4
copayment
$100
$56
$11
Afrezza (12 units)
Inhalant powder
4
copayment
$100
$234
$47
Afrezza (8 units)
Inhalant powder
4
copayment
$100
$157
$31
Afrezza (4 units)
Inhalant powder
4
copayment
$100
$79
$16
Afrezza Titration Pack
Inhalant powder
4
copayment
$100
$234
$47
Afrezza 180 Titration Pack
Inhalant powder
4
copayment
$100
$312
$62
Apidra Solostar
Pen injector
4
copayment
$100
$132
$26
Apidra
Injectable solution
4
copayment
$100
$69
$14
Basaglar
Pen injector
3
copayment
$47
$83
$17
Fiasp Flextouch
Pen injector
3
copayment
$47
$148
$30
Fiasp
Injectable solution
3
copayment
$47
$77
$15
Humalog
Injectable solution
3
copayment
$47
$22
$4
Humalog
Pen injector
3
copayment
$47
$140
$28
Humalog
Cartridge
3
copayment
$47
$135
$27
Humalog U-100 Kwikpen
Pen injector
3
copayment
$47
$142
$28
Humalog U-200 Kwikpen
Pen injector
3
copayment
$47
$112
$22
Humalog Mix 75/25
Injectable suspension
3
copayment
$47
$75
$15
Humalog Mix 50/50
Injectable suspension
3
copayment
$47
$75
$15
Humalog Mix 75/25 Kwikpen
Pen injector
3
copayment
$47
$140
$28
Humalog Mix 50/50 Kwikpen
Pen injector
3
copayment
$47
$140
$28
Humulin
Pen injector
3
copayment
$47
$124
$25
Humulin
Injectable suspension
3
copayment
$47
$39
$8
Humulin N Kwikpen
Pen injector
3
copayment
$47
$124
$25
Humulin N
Injectable suspension
3
copayment
$47
$39
$8
Humulin R U-500
Injectable solution
5
coinsurance
29% ($440)
$379
$76
Humulin R U-500 Kwiken
Pen injector
5
coinsurance
29% ($170)
$147
$29
Humulin R
Injectable solution
3
copayment
$47
$39
$8
Lantus
Injectable solution
3
copayment
$47
$71
$14
Lantus Solostar
Pen injector
3
copayment
$47
$106
$21
Levemir Flextouch
Pen injector
3
copayment
$47
$226
$45
Levemir
Injectable solution
3
copayment
$47
$151
$30
Novolin 70/30
Injectable suspension
3
copayment
$47
$35
$7
Novolin N
Injectable suspension
3
copayment
$47
$35
$7
Novolin R
Injectable solution
3
copayment
$47
$35
$7
Novolog Flexpen
Pen injector
3
copayment
$47
$143
$29
Novolog
Cartridge
3
copayment
$47
$137
$27
Novolog
Injectable solution
3
copayment
$47
$74
$15
Novolog Mix 70/30 Flexpen
Pen injector
3
copayment
$47
$143
$29
Novolog Mix 70/30
Injectable suspension
3
copayment
$47
$77
$15
Soliqua 100-33
Pen injector
3
copayment
$47
$179
$36
Toujeo Solostar
Pen injector
3
copayment
$47
$98
$20
Toujeo Max Solostar
Pen injector
3
copayment
$47
$127
$25
Tresiba Flextouch U-200
Pen injector
3
copayment
$47
$152
$30
Tresiba Flextouch U-100
Pen injector
3
copayment
$47
$127
$25
Xultophy 100-3.6
Pen injector
3
copayment
$47
$262
$52
NOTE: Analysis includes plans with 5 or 6 tier formulary design (3,787 out of 3,983 plans with a non-standard benefit design in 2019). Typical formulary placement refers to formulary tier, copayment type, and cost-sharing amount most often used by Part D plans that cover given insulin product. Cost-sharing amounts based on coinsurance are calculated based on median total cost for 30-day prescription (see Table 1).SOURCE: KFF analysis of CMS Part D Prescription Drug Plan Formulary, Pharmacy Network, and Pricing Information Files, 2019.
Table 4: Formulary Coverage, Tier Placement, and Cost Sharing of Insulin Products in Medicare Part D Plans, 2019
Plans charging copayments
Plans charging coinsurance
Formulary tier
Number of insulin products
Percent of plans / enrollees with at least one insulin product covered
Enrollment-weighted median copayment
Number of insulin products
Percent of plans / enrollees with at least one insulin product covered
Enrollment-weighted median copayment
1
32
0.4% / 0.2%
$5
n/a
2
36
7.4% / 17.8%
$20
23
0.3% / <0.1%
25%
3
46
86.8% / 84.2%
$47
39
12.3% / 15.0%
25%
4
46
8.9% / 5.9%
$100
46
7.7% / 4.5%
48%
5
3
0.2% / 0.2%
$0
5
52.2% / 57.6%
30%
6
34
2.5% / 0.85
$11
21
0.1% / <0.1%
0%
NOTE: Analysis includes plans with 5 or 6 tier formulary design (3,787 out of 3,983 plans with a non-standard benefit design in 2019).SOURCE: KFF analysis of CMS Part D Prescription Drug Plan Formulary, Pharmacy Network, and Pricing Information Files, 2019.
KFF’s Samantha Artiga appeared on the June 4 episode of the Politico Pulse Check podcast to discuss the intersection of the coronavirus pandemic and protests on racial inequality following the death of George Floyd. (more…)
Samantha Artiga Talks with Politico Pulse Check about the Pandemic and Protests on Racial Inequality
KFF’s Samantha Artiga appeared on the June 4 episode of the Politico Pulse Check podcast to discuss the intersection of the coronavirus pandemic and protests on racial inequality following the death of George Floyd. (more…)
KFF’s Samantha Artiga appeared on the June 4 episode of the Politico Pulse Check podcast to discuss the intersection of the coronavirus pandemic and protests on racial inequality following the death of George Floyd. (more…)
News Release
Who are the 3.4 Million People Who Work in the Nation’s Food Production Industries?
Roughly 3.4 million individuals work in food production industries, more than a third of them in animal production and processing where there have been several COVID-19 outbreaks, a new KFF analysis shows. Workers at meat and poultry plants face a higher risk of coronavirus exposure due to the close quarters of their workplaces.
The majority of workers in food production – which also include crop production, seafood, and other food manufacturing– are White and U.S. citizens, but they include disproportionate shares of lower-income, Hispanic, and noncitizen immigrant workers compared to workers overall, the analysis finds. Food production workers, and in particular Black and Hispanic workers, also are more likely to be uninsured, and so may face increased challenges accessing COVID-19-related testing and treatment services.
The new analysis, The COVID-19 Outbreak and Food Production Workers: Who is at Risk?, examines key characteristics of food production workers to provide insight into who these risks affect and the health and financial implications of the COVID-19 outbreak for these workers and their communities.
The data paint a portrait of workers who have limited ability to absorb income decreases, creating disincentives for them to miss work even if they feel ill, and who may face barriers to care due to lack of insurance and immigration-related fears. At the same time, a recent Presidential Executive Order requires meat and poultry processing plants to continue operating, even in the face of outbreaks, in order to prevent disruption in the food supply chain.
The full analysis, as well as other KFF analyses and data on the coronavirus and its implications, are available at kff.org.
The federal government has deemed workers in the food and agricultural sector part of the essential critical infrastructure workforce. Moreover, under recent a Presidential Executive Order, meat and poultry processing plants must continue operations to prevent disruption in the food supply chain. Workers in these industries face risk for coronavirus exposure due to their continued work outside the home, with many facing increased risks due to close quarters in their working environment. The Centers for Disease Control and Prevention (CDC) and other analysis have identified coronavirus outbreaks in meatpacking facilities. This data note analyzes key characteristics of food production workers to provide insight into who these risks affect and the health and financial implications of the COVID-19 outbreak for these workers and their communities. It finds:
Roughly 3.4 million individuals work in food production industries.
While the majority of food production workers are White (51%), Hispanic workers (34%) make up twice as many food production workers compared to their share of all workers (17%). A higher proportion of food production workers are noncitizens compared to all workers (22% vs 8%).
Reflecting the higher shares of noncitizen and Hispanic workers, 37% of food production workers speak a language other than English at home, and a quarter (25%) are less than fluent in English.
Despite being more likely than all workers to work full-time (82% vs. 76%), food production workers are more likely to have household income below 200% of the federal poverty level (FPL), which is $12,760 for an individual and $26,200 for a family of four as of 2020 (29% vs. 19%). Food production workers, in particular Black and Hispanic workers, also are more likely to be uninsured compared to workers overall (17% vs. 10%).
Food production workers are more likely to be living in non-metro areas than workers overall (29% vs. 13%).
These findings show that many food production workers have limited ability to absorb income decreases, creating disincentives for them to miss work even if they feel ill and increasing the risk of them experiencing financial challenges if they do miss work. Restrictions on immigrant eligibility for public programs and federal financial relief may compound these potential financial challenges given the relatively high share of noncitizen workers. Moreover, food production workers may face increased barriers to testing and treatment due to their relatively higher uninsured rate. Workers who live in immigrant families may also face barriers to care due to immigration-related fears. At a broader level, outbreaks among food production workers may exacerbate the disproportionate impact COVID-19 is having on people of color and widen underlying health, social, and economic disparities.
Background
The federal government has deemed workers in the food and agricultural sector part of the essential critical infrastructure workforce. Moreover, under recent a Presidential Executive Order, meat and poultry processing plants must continue operations to prevent disruption in the food supply chain. Workers in these industries face risk for coronavirus exposure due to their work outside the home, with many facing increased risks due to close quarters in their working environment. While essential workers in many industries face ongoing risk, the CDC has identified barriers to effective prevention and control of COVID-19 within meat processing plants and noted that socioeconomic challenges might contribute to workers in this industry working while feeling ill. Workers in other food production and processing industries may also be at increased risk for exposure due to their working environment, which likely requires close contact with colleagues.
Few states break out data on coronavirus cases and deaths by workplace. However, as of April 2020, the CDC had identified nearly 5,000 confirmed cases and 20 COVID-19 related deaths among workers within 115 meat or poultry processing plants in 19 states reporting data to the CDC. It further found that, among 17 states reporting the number of workers in their affected facilities, 3% of workers tested positive, but this rate was higher in several states, including Washington (7.1%), Wisconsin (8.8%), South Dakota (17.3%), and Iowa (18.2%). Other analysis finds that, as of May 28, there had been at least 18,500 cases tied to facilities in 33 states and at least 69 reported worker deaths in 21 states. Ongoing investigations and news reports highlight the risk for food processing plants to become COVID-19 “hot spots.” Emerging reports also are identifying spread of the virus among farmworkers, with one farm in Tennessee recently identifying all 200 of its employees as infected with the virus.
This data note analyzes key characteristics of food production workers to provide insight into who these risks affect and the health and financial implications of the COVID-19 outbreak for these workers and their communities. It is based on Kaiser Family Foundation analysis of 2018 American Community Survey data. We identify food production workers as those employed in animal processing, farming, or food manufacturing such as commercial bakeries or beverage plants. See methods for more details.
Who are Food Production Workers?
Roughly 3.4 million individuals work in food production industries. The largest shares of these workers are in animal production and processing (38%) and crop production (30%); 7% work in seafood, and the remaining 25% work in other food manufacturing, including bakeries, beverage manufacturers, and fruit and vegetable preserving and other specialty food processing (Figure 1).
Figure 1: Distribution of Food Production Workers by Industry, 2018
Demographic Characteristics
Food production workers are more likely to be male compared to workers overall, and the majority are less than age 50. Over two-thirds of all food production workers are male (69%), compared to 52% of all workers. Workers in crop production have the highest share of male workers (73%), while a lower share of seafood production workers is male (62%) (Appendix, Table 1). The majority of food production workers are less than age 50 (67%), but 33% are age 50 or over, including 6% who are 65 or older.
Just over half (51%) of food production workers are White, and the remaining 49% are people of color, compared to 38% of all workers who are people of color (Figure 2). This pattern reflects that Hispanic workers make up twice as many food production workers compared to their share of workers overall (34% vs. 17%). The share of food production workers who is Black is less than the share of all workers (10% vs. 12%). Among crop production workers, over half (55%) are people of color, including nearly half who are Hispanic (49%), and 3% who are Black. The total share of seafood production workers who are people of color is similar to that of all food production workers (50%), but they include a higher share of Black workers (14%) and a lower share of Hispanic workers (26%) compared to all food production workers (Appendix, Table 1).
Figure 2: Race/Ethnicity of Food Production Workers compared to All Workers, 2018
The majority of food production workers are citizens, but more than 1 in 5 (22%) are noncitizens, compared to 8% of all workers who are noncitizens (Figure 3). The share of workers who are noncitizen is higher among crop production workers (33%) and lower among seafood production workers (16%).
Figure 3: Citizenship Status and Language among Food Production Workers compared to All Workers, 2018
Reflecting the higher shares of noncitizen and Hispanic workers, 37% of food production workers speak another language than English at home, and a quarter (25%) are less than fluent in English. In contrast, 22% of all workers speak another language than English at home and 8% are less than fluent in English. Among workers in crop production, nearly half (49%) report speaking another language other than English at home and over a third (36%) are less than fluent in English, compared to 37% and 25% of all food production workers, respectively. The shares of seafood production workers who speak another language than English at home and who are less than fluent in English are lower at 32% and 19%, respectively.
Income and Health Insurance
Over eight in ten food production workers are employed full time (82%), higher than the share of full-time employees among workers overall (76%) (Figure 4). Workers in crop production have the lowest share of full time full-time workers (74%), while seafood production workers are more likely to work full-time (87%).
Figure 4: Employment, Income, and Health Insurance Coverage among Food Production Workers compared to All Workers, 2018
Despite being more likely than all workers to be employed full-time, nearly three in ten (29%) food production workers have household incomes below 200% FPL compared to just less than one in five workers (19%) overall. The share of workers who have household incomes below 200% of FPL is higher among crop production workers (39%), while lower among seafood workers (20%). The FPL is $12,760 for an individual and $26,200 for a family of four as of 2020.
Compared to workers overall, food production workers are less likely to have employer sponsored coverage (59% vs. 68%), more likely to be covered by Medicaid (12% vs. 9%), and more likely to be uninsured (17% vs. 10%). Over one in four (26%) crop production workers lack health insurance coverage, reflecting a substantially lower rate of employer coverage (38%) compared to all food production workers. In contrast, seafood production workers have a lower uninsured rate (10%) due to a higher rate of employer coverage (74%) relative to all food production workers.
There are meaningful differences in household income and insurance coverage among food production workers by race/ethnicity. The share of food production workers who work full-time is similar across race/ethnicity groups. However, compared to White food production workers, Black and Hispanic food production workers are more likely to live in households with income below 200% FPL (35% and 44% compared to 18%). Similarly, Black and Hispanic food production workers are more likely to be uninsured than White workers (16% and 31% compared to 9%).
Figure 5: Income and Health Insurance Coverage among Food Production Workers by Race/Ethnicity, 2018
Geographic Distribution
Nearly three in ten (29%) food production workers live outside of metro areas, compared to 13% of all workers. The share living outside a metro area is significantly higher for workers in animal production and processing (40%), and lower for seafood production workers (18%).
Over one in four (28%) food production workers are in just three states California (17%), Texas (6%), and Illinois (4%) (Appendix, Table 2). Food production workers constitute more than 5% of the workforce in Nebraska, Iowa, Arkansas, Idaho and South Dakota. Animal production and processing composes a large share of food production workers in Mississippi, Arkansas and Wyoming, where crop production is a larger share in Washington, California and North Dakota.
What are the implications for risks posed by COVID-19?
Together, these findings show that, while the majority of food production workers are White and citizens, they include disproportionately larger shares of Hispanic and noncitizen workers compared to workers overall. Moreover, despite higher rates of full-time employment, food production workers are more likely to have household income below 200% FPL and to be uninsured. Further, food production workers are more likely to live outside of metro areas compared to workers overall.
Food production workers have limited ability to absorb income reductions, creating disincentives for them to miss work and increasing the risk of financial challenges for those who do miss work. As noted by the CDC, socioeconomic challenges may contribute to individuals working while feeling ill, particularly if there are management practices such as bonuses that incentivize attendance. Those who do miss work due to illness may experience financial challenges and problems paying for basic needs if they do not have sick leave and lose pay. Restrictions on immigrant eligibility for public programs and federal financial relief may compound these challenges given the higher share of noncitizens among food production workers. The CDC suggests that programs that actively encourage symptomatic workers to stay home can support infection control, including paid sick leave and the avoidance of incentives that might encourage individuals to work while symptomatic.
Food production workers may face increased challenges accessing COVID-19-related testing and treatment services due to a relatively higher uninsured rate and larger share of noncitizens. The higher uninsured rate among food production workers may increase barriers to testing and treatment. Even though federal legislation provides resources to cover testing costs for uninsured individuals, individuals may not know where to obtain a test and/or may forego testing out of fear of having to pay out-of-pocket. Aside from barriers to testing, individuals also may face barriers to obtaining treatment. Although federal legislation provides funding to reimburse providers for treating uninsured patients with COVID-19, there are questions about sufficiency of the funds to cover costs. Workers who live in immigrant families may also face barriers to testing and treatment due to restrictions on immigrant eligibility for health coverage and fears about potential negative consequences on their or a family member’s immigration status. The United Food and Commercial Workers International Union has called on the Administration to prioritize testing for essential workers, including those in meatpacking and food processing.
Outbreaks among food production workers may exacerbate the disproportionate impact COVID-19 is having on people of color. Data illustrate the stark impacts COVID-19 is having on people of color, who account for a higher share of confirmed cases and deaths relative to their share of the population in many states. Given that people of color make up a disproportionate share of food production workers, outbreaks among these workers could amplify these disparities and widen preexisting underlying health, economic, and social disparities. The diversity among food production workers also points to the importance of providing outreach and education to workers in linguistically and culturally appropriate ways. The CDC recommends periodic infection control and occupational safety and health training for all workers and supervisors tailored to literacy levels and preferred languages as part of its prevention and mitigation strategies among meat and poultry facilities. In addition, because food production workers are more likely to live outside of metro areas, outbreaks among these workers may affect rural communities that could experience particular challenges given their relative lack of hospital capacity, older average age, and higher shares of their populations with underlying health conditions.
In sum, food production workers may face particular health care access and financial challenges associated with the COVID-19 outbreak. Addressing their needs may help protect the health and financial stability of workers themselves, but also plays a role in preventing widening of underlying racial and ethnic disparities in health, social, and economic factors given the diversity of the food production workforce.
Methods
This analysis is based on KFF analysis of the 2018 American Community Survey (ACS), 1-year file. The ACS includes a 1% sample of the US population; the subset of food production workers examined in this data note includes over 33,000 observations. We define the food production workforce as all individuals who earned at least $1,000 during the year and indicated that their job was in one of the food processing industry codes listed below. We include only adults age 18 and up in the analysis.
Table 1: Weighted and Unweighted Counts by Industry
Industry Code
Industry Description
Weighted Counts
Unweighted Counts
170
Crop production
1,010,087
10,601
180
Animal production and aquaculture
427,134
4,970
1180
Animal slaughtering and processing
521,694
4,372
1370
Beverage manufacturing
308,914
2,790
1280
Seafood and other miscellaneous foods, n.e.c.
253,120
2,365
1270
Bakeries and tortilla manufacturing, except retail bakeries
220,484
1,872
1070
Animal food, grain and oilseed milling
176,690
1,858
1170
Dairy product manufacturing
164,959
1,771
1090
Fruit and vegetable preserving and specialty food manufacturing
173,583
1,605
1080
Sugar and confectionery products
95,651
899
1290
Not specified food industries
32,206
289
We roll up food production industries related to animal production and processing into one category based on the following categories: animal production and aquaculture; animal slaughtering and processing; animal food, grain, and oilseed milling, and dairy product manufacturing. Similarly, we include beverage manufacturing; bakeries and tortilla manufacturing, except retail bakers; sugar and confectionary productions; and not specified food industries in the food manufacturing category.
The ACS asks respondents about their health insurance coverage at the time of the survey. Respondents may report having more than one type of coverage; however, we sort individuals into only one category of insurance coverage based on a hierarchy of coverage (detailed here).
The ACS divides the United States into Public Use Microdata Areas (PUMAs), or geographic areas representing at least 100,000 people. PUMA’s vary in size based on population density. The USDA Economic Research Service defines metro and non-metro areas. Using the USDA method, we identify 80% of the PUMAs as solely in non-metro areas, 9% containing metro areas, and 12% containing both metro and non-metro areas. We categorize the PUMAs containing both metro and non-metro areas based on where the majority of the population lives. Using this approach, we categorize a total of 14% of the population living in a PUMA was classified as a non-metro area.
Appendix
Table 1: Selected Sociodemographic Characteristics of Food Production Workers, 2018
All Workers
All Food Production
Animal Processing and Production
Crop Production
Other Food Manufacturing
Seafood and Other Miscellaneous Foods
Total
155,924,000
3,385,000
1,290,000
1,010,000
831,000
253,0000
Age
18-50
67%
67%
67%
66%
69%
67%
50-64
27%
27%
28%
25%
28%
29%
65+
6%
6%
5%
9%
4%
3%
Gender
Male
52%
69%
70%
73%
64%
62%
Female
48%
31%
30%
27%
36%
38%
Race/Ethnicity
White
62%
51%
53%
45%
54%
50%
Black
12%
10%
13%
3%
12%
14%
Hispanic
17%
34%
28%
49%
26%
26%
Other
9%
6%
6%
3%
7%
10%
Citizenship Status
Citizen
92%
78%
81%
67%
86%
84%
Noncitizen
8%
22%
19%
33%
14%
16%
Language
Speaks another Language at Home
22%
37%
33%
49%
31%
32%
Fluent in English
92%
75%
78%
64%
83%
81%
Employment
Full-time
76%
82%
86%
74%
85%
87%
Household Income
<100% FPL
6%
9%
7%
13%
6%
6%
100% < 200% FPL
13%
20%
20%
26%
16%
14%
200% < 400% FPL
30%
36%
38%
34%
36%
38%
400% FPL +
50%
35%
35%
27%
43%
42%
Health Insurance Coverage
Employer
68%
59%
66%
38%
70%
74%
Medicaid
9%
12%
9%
18%
10%
9%
Other
5%
4%
4%
7%
3%
3%
Non-Group
7%
7%
6%
11%
6%
4%
Uninsured
10%
17%
15%
26%
12%
10%
NOTES: Animal processing and production includes animal food, grain, and oilseed milling; animal production and aquaculture; animal slaughtering and processing; and dairy product manufacturing. Other Food Manufacturing includes bakeries and tortilla manufacturing, except retail bakers; beverage manufacturing, fruit and vegetable preserving and specialty food manufacturing; sugar and confectionary products; and not specified food industries. FPL is the federal poverty level. In 2020, the FPL is $12,760 for an individual and $26,200 for a family of four.SOURCE: KFF analysis of American Community Survey, 2018.
Table2: All Workers and Food Production Workers by State, 2018
All Workers
Food Production Workers
Animal Production and Processing
Crop Production
Other Food Manufacturing
Seafood and Other Miscellaneous
Alabama
2,092,000
45,000
30,000
5,000
6,000
4,000
Alaska
358,000
11,000
1,000
–
3,000
6,000
Arizona
3,227,000
44,000
13,000
17,000
11,000
3,000
Arkansas
1,289,000
82,000
59,000
12,000
8,000
3,000
California
18,436,000
587,000
88,000
317,000
146,000
36,000
Colorado
2,972,000
53,000
25,000
14,000
13,000
1,000
Connecticut
1,795,000
15,000
4,000
4,000
6,000
1,000
Delaware
469,000
12,000
7,000
3,000
–
2,000
District of Columbia
378,000
1,000
–
–
–
–
Florida
9,687,000
115,000
21,000
55,000
34,000
5,000
Georgia
4,914,000
107,000
46,000
23,000
27,000
11,000
Hawaii
667,000
11,000
2,000
5,000
3,000
–
Idaho
813,000
51,000
22,000
17,000
10,000
2,000
Illinois
6,321,000
146,000
48,000
31,000
49,000
17,000
Indiana
3,257,000
72,000
31,000
16,000
17,000
9,000
Iowa
1,597,000
98,000
66,000
20,000
7,000
4,000
Kansas
1,424,000
62,000
35,000
16,000
7,000
5,000
Kentucky
2,000,000
55,000
23,000
11,000
16,000
4,000
Louisiana
2,011,000
27,000
10,000
8,000
6,000
3,000
Maine
665,000
12,000
3,000
5,000
4,000
–
Maryland
3,096,000
26,000
9,000
4,000
8,000
5,000
Massachusetts
3,584,000
30,000
8,000
6,000
12,000
4,000
Michigan
4,744,000
78,000
29,000
21,000
23,000
5,000
Minnesota
2,968,000
96,000
51,000
23,000
16,000
6,000
Mississippi
1,234,000
33,000
23,000
6,000
2,000
2,000
Missouri
2,939,000
93,000
51,000
19,000
18,000
5,000
Montana
519,000
23,000
13,000
6,000
3,000
–
Nebraska
973,000
55,000
33,000
16,000
4,000
2,000
Nevada
1,445,000
13,000
4,000
3,000
4,000
1,000
New Hampshire
720,000
6,000
2,000
2,000
2,000
–
New Jersey
4,517,000
49,000
9,000
8,000
25,000
7,000
New Mexico
877,000
22,000
13,000
5,000
3,000
1,000
New York
9,438,000
95,000
33,000
20,000
36,000
6,000
North Carolina
4,867,000
115,000
53,000
31,000
24,000
7,000
North Dakota
391,000
16,000
4,000
10,000
2,000
–
Ohio
5,699,000
97,000
33,000
19,000
34,000
11,000
Oklahoma
1,789,000
41,000
25,000
9,000
7,000
1,000
Oregon
2,014,000
77,000
13,000
36,000
24,000
4,000
Pennsylvania
6,283,000
121,000
41,000
22,000
43,000
15,000
Rhode Island
525,000
5,000
1,000
1,000
2,000
1,000
South Carolina
2,314,000
28,000
12,000
6,000
7,000
3,000
South Dakota
440,000
29,000
18,000
9,000
1,000
1,000
Tennessee
3,102,000
60,000
26,000
8,000
24,000
2,000
Texas
13,283,000
202,000
98,000
38,000
54,000
12,000
Utah
1,533,000
30,000
14,000
6,000
8,000
2,000
Vermont
325,000
12,000
7,000
2,000
1,000
2,000
Virginia
4,177,000
55,000
27,000
8,000
15,000
6,000
Washington
3,708,000
134,000
25,000
71,000
28,000
11,000
West Virginia
759,000
6,000
3,000
1,000
2,000
–
Wisconsin
2,999,000
124,000
73,000
17,000
25,000
10,000
Wyoming
290,000
8,000
6,000
1,000
–
–
NOTES: Animal processing and production includes animal food, grain, and oilseed milling; animal production and aquaculture; animal slaughtering and processing; and dairy product manufacturing. Other Food Manufacturing includes bakeries and tortilla manufacturing, except retail bakers; beverage manufacturing, fruit and vegetable preserving and specialty food manufacturing; sugar and confectionary products; and not specified food industries.SOURCE: KFF analysis of American Community Survey, 2018.
The COVID-19 pandemic and killing of George Floyd along with other recent deaths of Black people at the hands of police have laid bare stark structural and systemic racial inequities and their impacts on the health and well-being of individuals and communities. While these events have brought health and health care disparities into sharp focus for the media and public, they are not new. These longstanding and persistent health disparities are symptoms of broader social and economic challenges that are rooted in structural and systemic barriers across sectors — including housing, education, employment, and the justice system — as well as underlying racism and discrimination. Amid this difficult time for our nation, the increased recognition and understanding of disparities could provide a catalyst for the challenging work required to address them. (more…)
Health Disparities are a Symptom of Broader Social and Economic Inequities
The COVID-19 pandemic and killing of George Floyd along with other recent deaths of Black people at the hands of police have laid bare stark structural and systemic racial inequities and their impacts on the health and well-being of individuals and communities. While these events have brought health and health care disparities into sharp focus for the media and public, they are not new. These longstanding and persistent health disparities are symptoms of broader social and economic challenges that are rooted in structural and systemic barriers across sectors — including housing, education, employment, and the justice system — as well as underlying racism and discrimination. Amid this difficult time for our nation, the increased recognition and understanding of disparities could provide a catalyst for the challenging work required to address them. (more…)
The COVID-19 pandemic and killing of George Floyd along with other recent deaths of Black people at the hands of police have laid bare stark structural and systemic racial inequities and their impacts on the health and well-being of individuals and communities. While these events have brought health and health care disparities into sharp focus for the media and public, they are not new. These longstanding and persistent health disparities are symptoms of broader social and economic challenges that are rooted in structural and systemic barriers across sectors — including housing, education, employment, and the justice system — as well as underlying racism and discrimination. Amid this difficult time for our nation, the increased recognition and understanding of disparities could provide a catalyst for the challenging work required to address them. (more…)