The COVID-19 Outbreak and Food Production Workers: Who is at Risk?
Data Note
The federal government has deemed workers in the food and agricultural sector part of the essential critical infrastructure workforce. Moreover, under recent a Presidential Executive Order, meat and poultry processing plants must continue operations to prevent disruption in the food supply chain. Workers in these industries face risk for coronavirus exposure due to their continued work outside the home, with many facing increased risks due to close quarters in their working environment. The Centers for Disease Control and Prevention (CDC) and other analysis have identified coronavirus outbreaks in meatpacking facilities. This data note analyzes key characteristics of food production workers to provide insight into who these risks affect and the health and financial implications of the COVID-19 outbreak for these workers and their communities. It finds:
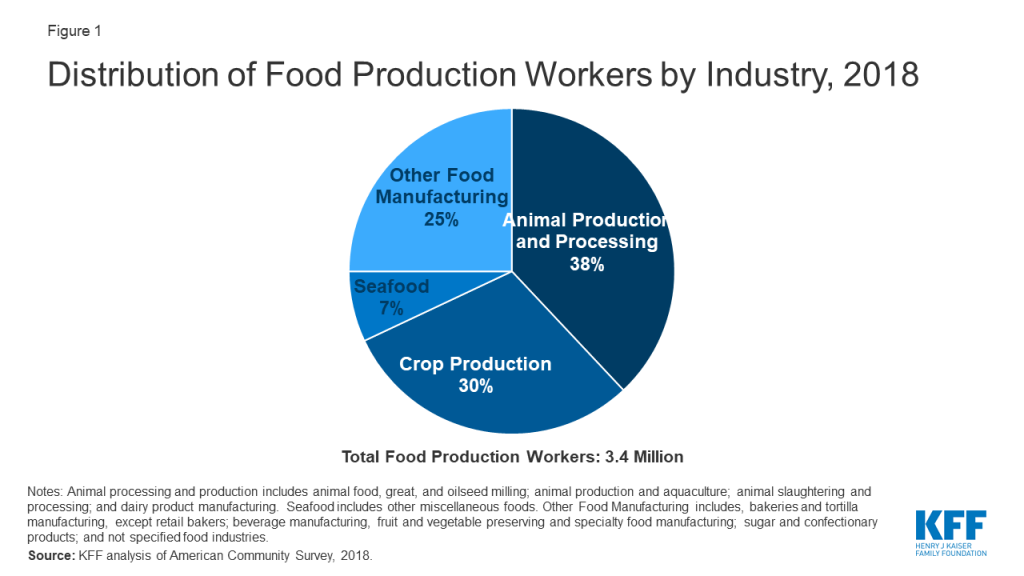
- Roughly 3.4 million individuals work in food production industries.
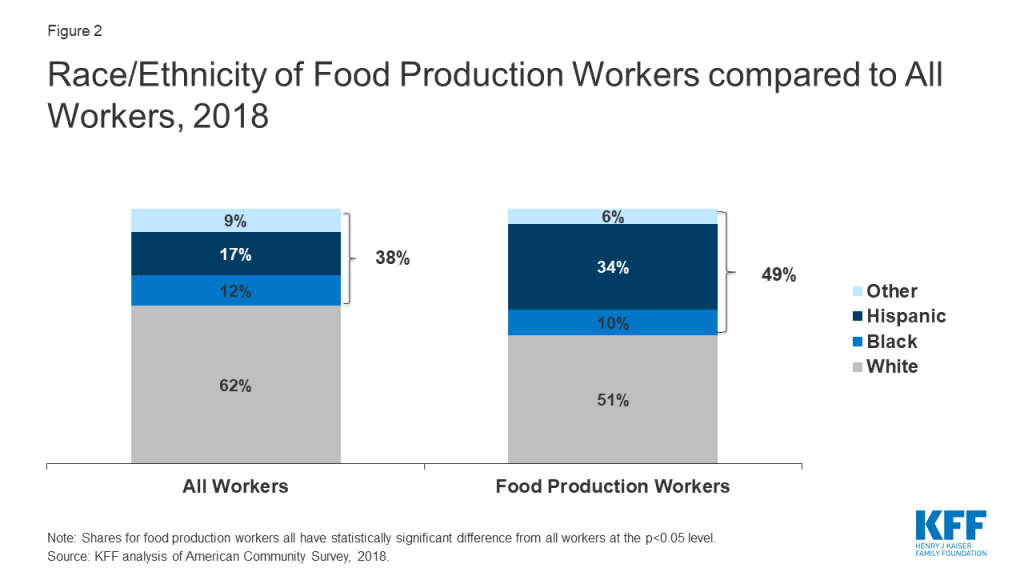
- While the majority of food production workers are White (51%), Hispanic workers (34%) make up twice as many food production workers compared to their share of all workers (17%). A higher proportion of food production workers are noncitizens compared to all workers (22% vs 8%).
- Reflecting the higher shares of noncitizen and Hispanic workers, 37% of food production workers speak a language other than English at home, and a quarter (25%) are less than fluent in English.
- Despite being more likely than all workers to work full-time (82% vs. 76%), food production workers are more likely to have household income below 200% of the federal poverty level (FPL), which is $12,760 for an individual and $26,200 for a family of four as of 2020 (29% vs. 19%). Food production workers, in particular Black and Hispanic workers, also are more likely to be uninsured compared to workers overall (17% vs. 10%).
- Food production workers are more likely to be living in non-metro areas than workers overall (29% vs. 13%).
These findings show that many food production workers have limited ability to absorb income decreases, creating disincentives for them to miss work even if they feel ill and increasing the risk of them experiencing financial challenges if they do miss work. Restrictions on immigrant eligibility for public programs and federal financial relief may compound these potential financial challenges given the relatively high share of noncitizen workers. Moreover, food production workers may face increased barriers to testing and treatment due to their relatively higher uninsured rate. Workers who live in immigrant families may also face barriers to care due to immigration-related fears. At a broader level, outbreaks among food production workers may exacerbate the disproportionate impact COVID-19 is having on people of color and widen underlying health, social, and economic disparities.
Background
The federal government has deemed workers in the food and agricultural sector part of the essential critical infrastructure workforce. Moreover, under recent a Presidential Executive Order, meat and poultry processing plants must continue operations to prevent disruption in the food supply chain. Workers in these industries face risk for coronavirus exposure due to their work outside the home, with many facing increased risks due to close quarters in their working environment. While essential workers in many industries face ongoing risk, the CDC has identified barriers to effective prevention and control of COVID-19 within meat processing plants and noted that socioeconomic challenges might contribute to workers in this industry working while feeling ill. Workers in other food production and processing industries may also be at increased risk for exposure due to their working environment, which likely requires close contact with colleagues.
Few states break out data on coronavirus cases and deaths by workplace. However, as of April 2020, the CDC had identified nearly 5,000 confirmed cases and 20 COVID-19 related deaths among workers within 115 meat or poultry processing plants in 19 states reporting data to the CDC. It further found that, among 17 states reporting the number of workers in their affected facilities, 3% of workers tested positive, but this rate was higher in several states, including Washington (7.1%), Wisconsin (8.8%), South Dakota (17.3%), and Iowa (18.2%). Other analysis finds that, as of May 28, there had been at least 18,500 cases tied to facilities in 33 states and at least 69 reported worker deaths in 21 states. Ongoing investigations and news reports highlight the risk for food processing plants to become COVID-19 “hot spots.” Emerging reports also are identifying spread of the virus among farmworkers, with one farm in Tennessee recently identifying all 200 of its employees as infected with the virus.
This data note analyzes key characteristics of food production workers to provide insight into who these risks affect and the health and financial implications of the COVID-19 outbreak for these workers and their communities. It is based on Kaiser Family Foundation analysis of 2018 American Community Survey data. We identify food production workers as those employed in animal processing, farming, or food manufacturing such as commercial bakeries or beverage plants. See methods for more details.
Who are Food Production Workers?
Roughly 3.4 million individuals work in food production industries. The largest shares of these workers are in animal production and processing (38%) and crop production (30%); 7% work in seafood, and the remaining 25% work in other food manufacturing, including bakeries, beverage manufacturers, and fruit and vegetable preserving and other specialty food processing (Figure 1).
Demographic Characteristics
Food production workers are more likely to be male compared to workers overall, and the majority are less than age 50. Over two-thirds of all food production workers are male (69%), compared to 52% of all workers. Workers in crop production have the highest share of male workers (73%), while a lower share of seafood production workers is male (62%) (Appendix, Table 1). The majority of food production workers are less than age 50 (67%), but 33% are age 50 or over, including 6% who are 65 or older.
Just over half (51%) of food production workers are White, and the remaining 49% are people of color, compared to 38% of all workers who are people of color (Figure 2). This pattern reflects that Hispanic workers make up twice as many food production workers compared to their share of workers overall (34% vs. 17%). The share of food production workers who is Black is less than the share of all workers (10% vs. 12%). Among crop production workers, over half (55%) are people of color, including nearly half who are Hispanic (49%), and 3% who are Black. The total share of seafood production workers who are people of color is similar to that of all food production workers (50%), but they include a higher share of Black workers (14%) and a lower share of Hispanic workers (26%) compared to all food production workers (Appendix, Table 1).
The majority of food production workers are citizens, but more than 1 in 5 (22%) are noncitizens, compared to 8% of all workers who are noncitizens (Figure 3). The share of workers who are noncitizen is higher among crop production workers (33%) and lower among seafood production workers (16%).
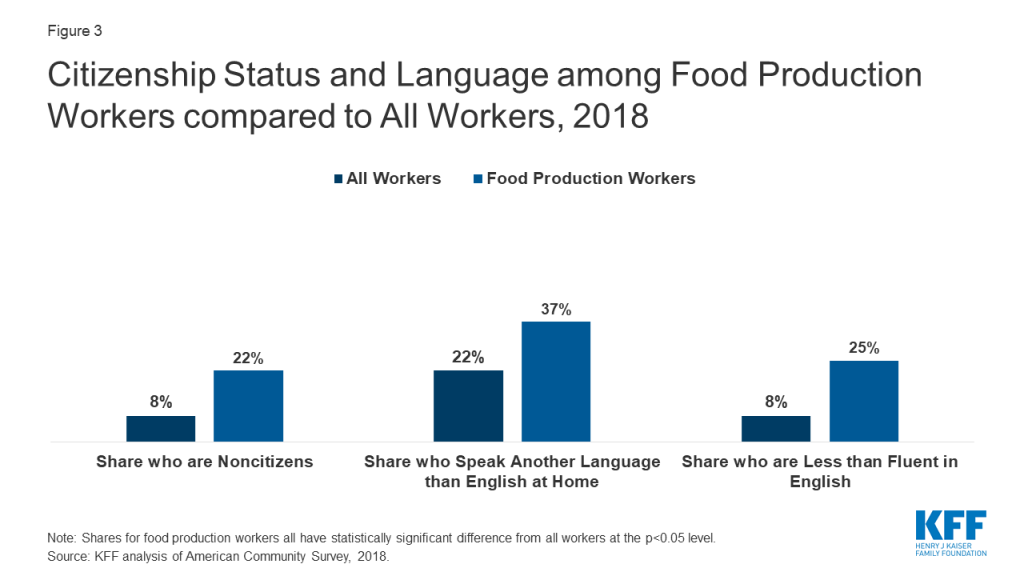
Reflecting the higher shares of noncitizen and Hispanic workers, 37% of food production workers speak another language than English at home, and a quarter (25%) are less than fluent in English. In contrast, 22% of all workers speak another language than English at home and 8% are less than fluent in English. Among workers in crop production, nearly half (49%) report speaking another language other than English at home and over a third (36%) are less than fluent in English, compared to 37% and 25% of all food production workers, respectively. The shares of seafood production workers who speak another language than English at home and who are less than fluent in English are lower at 32% and 19%, respectively.
Income and Health Insurance
Over eight in ten food production workers are employed full time (82%), higher than the share of full-time employees among workers overall (76%) (Figure 4). Workers in crop production have the lowest share of full time full-time workers (74%), while seafood production workers are more likely to work full-time (87%).
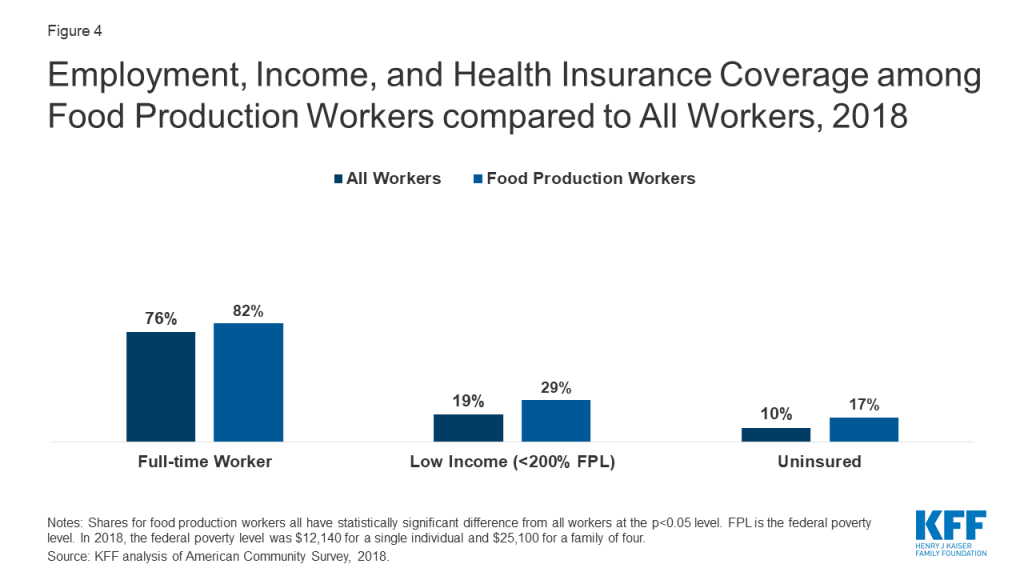
Despite being more likely than all workers to be employed full-time, nearly three in ten (29%) food production workers have household incomes below 200% FPL compared to just less than one in five workers (19%) overall. The share of workers who have household incomes below 200% of FPL is higher among crop production workers (39%), while lower among seafood workers (20%). The FPL is $12,760 for an individual and $26,200 for a family of four as of 2020.
Compared to workers overall, food production workers are less likely to have employer sponsored coverage (59% vs. 68%), more likely to be covered by Medicaid (12% vs. 9%), and more likely to be uninsured (17% vs. 10%). Over one in four (26%) crop production workers lack health insurance coverage, reflecting a substantially lower rate of employer coverage (38%) compared to all food production workers. In contrast, seafood production workers have a lower uninsured rate (10%) due to a higher rate of employer coverage (74%) relative to all food production workers.
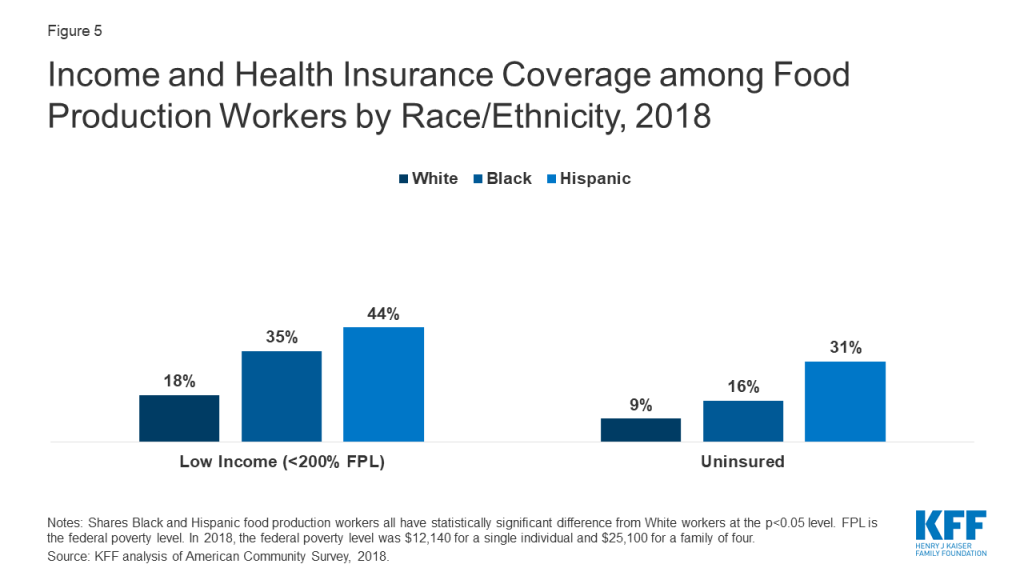
There are meaningful differences in household income and insurance coverage among food production workers by race/ethnicity. The share of food production workers who work full-time is similar across race/ethnicity groups. However, compared to White food production workers, Black and Hispanic food production workers are more likely to live in households with income below 200% FPL (35% and 44% compared to 18%). Similarly, Black and Hispanic food production workers are more likely to be uninsured than White workers (16% and 31% compared to 9%).
Geographic Distribution
Nearly three in ten (29%) food production workers live outside of metro areas, compared to 13% of all workers. The share living outside a metro area is significantly higher for workers in animal production and processing (40%), and lower for seafood production workers (18%).
Over one in four (28%) food production workers are in just three states California (17%), Texas (6%), and Illinois (4%) (Appendix, Table 2). Food production workers constitute more than 5% of the workforce in Nebraska, Iowa, Arkansas, Idaho and South Dakota. Animal production and processing composes a large share of food production workers in Mississippi, Arkansas and Wyoming, where crop production is a larger share in Washington, California and North Dakota.
What are the implications for risks posed by COVID-19?
Together, these findings show that, while the majority of food production workers are White and citizens, they include disproportionately larger shares of Hispanic and noncitizen workers compared to workers overall. Moreover, despite higher rates of full-time employment, food production workers are more likely to have household income below 200% FPL and to be uninsured. Further, food production workers are more likely to live outside of metro areas compared to workers overall.
Food production workers have limited ability to absorb income reductions, creating disincentives for them to miss work and increasing the risk of financial challenges for those who do miss work. As noted by the CDC, socioeconomic challenges may contribute to individuals working while feeling ill, particularly if there are management practices such as bonuses that incentivize attendance. Those who do miss work due to illness may experience financial challenges and problems paying for basic needs if they do not have sick leave and lose pay. Restrictions on immigrant eligibility for public programs and federal financial relief may compound these challenges given the higher share of noncitizens among food production workers. The CDC suggests that programs that actively encourage symptomatic workers to stay home can support infection control, including paid sick leave and the avoidance of incentives that might encourage individuals to work while symptomatic.
Food production workers may face increased challenges accessing COVID-19-related testing and treatment services due to a relatively higher uninsured rate and larger share of noncitizens. The higher uninsured rate among food production workers may increase barriers to testing and treatment. Even though federal legislation provides resources to cover testing costs for uninsured individuals, individuals may not know where to obtain a test and/or may forego testing out of fear of having to pay out-of-pocket. Aside from barriers to testing, individuals also may face barriers to obtaining treatment. Although federal legislation provides funding to reimburse providers for treating uninsured patients with COVID-19, there are questions about sufficiency of the funds to cover costs. Workers who live in immigrant families may also face barriers to testing and treatment due to restrictions on immigrant eligibility for health coverage and fears about potential negative consequences on their or a family member’s immigration status. The United Food and Commercial Workers International Union has called on the Administration to prioritize testing for essential workers, including those in meatpacking and food processing.
Outbreaks among food production workers may exacerbate the disproportionate impact COVID-19 is having on people of color. Data illustrate the stark impacts COVID-19 is having on people of color, who account for a higher share of confirmed cases and deaths relative to their share of the population in many states. Given that people of color make up a disproportionate share of food production workers, outbreaks among these workers could amplify these disparities and widen preexisting underlying health, economic, and social disparities. The diversity among food production workers also points to the importance of providing outreach and education to workers in linguistically and culturally appropriate ways. The CDC recommends periodic infection control and occupational safety and health training for all workers and supervisors tailored to literacy levels and preferred languages as part of its prevention and mitigation strategies among meat and poultry facilities. In addition, because food production workers are more likely to live outside of metro areas, outbreaks among these workers may affect rural communities that could experience particular challenges given their relative lack of hospital capacity, older average age, and higher shares of their populations with underlying health conditions.
In sum, food production workers may face particular health care access and financial challenges associated with the COVID-19 outbreak. Addressing their needs may help protect the health and financial stability of workers themselves, but also plays a role in preventing widening of underlying racial and ethnic disparities in health, social, and economic factors given the diversity of the food production workforce.
Methods
This analysis is based on KFF analysis of the 2018 American Community Survey (ACS), 1-year file. The ACS includes a 1% sample of the US population; the subset of food production workers examined in this data note includes over 33,000 observations. We define the food production workforce as all individuals who earned at least $1,000 during the year and indicated that their job was in one of the food processing industry codes listed below. We include only adults age 18 and up in the analysis.
| Table 1: Weighted and Unweighted Counts by Industry | |||
| Industry Code | Industry Description | Weighted Counts | Unweighted Counts |
| 170 | Crop production | 1,010,087 | 10,601 |
| 180 | Animal production and aquaculture | 427,134 | 4,970 |
| 1180 | Animal slaughtering and processing | 521,694 | 4,372 |
| 1370 | Beverage manufacturing | 308,914 | 2,790 |
| 1280 | Seafood and other miscellaneous foods, n.e.c. | 253,120 | 2,365 |
| 1270 | Bakeries and tortilla manufacturing, except retail bakeries | 220,484 | 1,872 |
| 1070 | Animal food, grain and oilseed milling | 176,690 | 1,858 |
| 1170 | Dairy product manufacturing | 164,959 | 1,771 |
| 1090 | Fruit and vegetable preserving and specialty food manufacturing | 173,583 | 1,605 |
| 1080 | Sugar and confectionery products | 95,651 | 899 |
| 1290 | Not specified food industries | 32,206 | 289 |
We roll up food production industries related to animal production and processing into one category based on the following categories: animal production and aquaculture; animal slaughtering and processing; animal food, grain, and oilseed milling, and dairy product manufacturing. Similarly, we include beverage manufacturing; bakeries and tortilla manufacturing, except retail bakers; sugar and confectionary productions; and not specified food industries in the food manufacturing category.
The ACS asks respondents about their health insurance coverage at the time of the survey. Respondents may report having more than one type of coverage; however, we sort individuals into only one category of insurance coverage based on a hierarchy of coverage (detailed here).
The ACS divides the United States into Public Use Microdata Areas (PUMAs), or geographic areas representing at least 100,000 people. PUMA’s vary in size based on population density. The USDA Economic Research Service defines metro and non-metro areas. Using the USDA method, we identify 80% of the PUMAs as solely in non-metro areas, 9% containing metro areas, and 12% containing both metro and non-metro areas. We categorize the PUMAs containing both metro and non-metro areas based on where the majority of the population lives. Using this approach, we categorize a total of 14% of the population living in a PUMA was classified as a non-metro area.
Appendix
| Table 1: Selected Sociodemographic Characteristics of Food Production Workers, 2018 | ||||||
| All Workers | All Food Production | Animal Processing and Production | Crop Production | Other Food Manufacturing | Seafood and Other Miscellaneous Foods | |
| Total | 155,924,000 | 3,385,000 | 1,290,000 | 1,010,000 | 831,000 | 253,0000 |
| Age | ||||||
| 18-50 | 67% | 67% | 67% | 66% | 69% | 67% |
| 50-64 | 27% | 27% | 28% | 25% | 28% | 29% |
| 65+ | 6% | 6% | 5% | 9% | 4% | 3% |
| Gender | ||||||
| Male | 52% | 69% | 70% | 73% | 64% | 62% |
| Female | 48% | 31% | 30% | 27% | 36% | 38% |
| Race/Ethnicity | ||||||
| White | 62% | 51% | 53% | 45% | 54% | 50% |
| Black | 12% | 10% | 13% | 3% | 12% | 14% |
| Hispanic | 17% | 34% | 28% | 49% | 26% | 26% |
| Other | 9% | 6% | 6% | 3% | 7% | 10% |
| Citizenship Status | ||||||
| Citizen | 92% | 78% | 81% | 67% | 86% | 84% |
| Noncitizen | 8% | 22% | 19% | 33% | 14% | 16% |
| Language | ||||||
| Speaks another Language at Home | 22% | 37% | 33% | 49% | 31% | 32% |
| Fluent in English | 92% | 75% | 78% | 64% | 83% | 81% |
| Employment | ||||||
| Full-time | 76% | 82% | 86% | 74% | 85% | 87% |
| Household Income | ||||||
| <100% FPL | 6% | 9% | 7% | 13% | 6% | 6% |
| 100% < 200% FPL | 13% | 20% | 20% | 26% | 16% | 14% |
| 200% < 400% FPL | 30% | 36% | 38% | 34% | 36% | 38% |
| 400% FPL + | 50% | 35% | 35% | 27% | 43% | 42% |
| Health Insurance Coverage | ||||||
| Employer | 68% | 59% | 66% | 38% | 70% | 74% |
| Medicaid | 9% | 12% | 9% | 18% | 10% | 9% |
| Other | 5% | 4% | 4% | 7% | 3% | 3% |
| Non-Group | 7% | 7% | 6% | 11% | 6% | 4% |
| Uninsured | 10% | 17% | 15% | 26% | 12% | 10% |
| NOTES: Animal processing and production includes animal food, grain, and oilseed milling; animal production and aquaculture; animal slaughtering and processing; and dairy product manufacturing. Other Food Manufacturing includes bakeries and tortilla manufacturing, except retail bakers; beverage manufacturing, fruit and vegetable preserving and specialty food manufacturing; sugar and confectionary products; and not specified food industries. FPL is the federal poverty level. In 2020, the FPL is $12,760 for an individual and $26,200 for a family of four.SOURCE: KFF analysis of American Community Survey, 2018. | ||||||
| Table2: All Workers and Food Production Workers by State, 2018 | ||||||
| All Workers | Food Production Workers | Animal Production and Processing | Crop Production | Other Food Manufacturing | Seafood and Other Miscellaneous | |
| Alabama | 2,092,000 | 45,000 | 30,000 | 5,000 | 6,000 | 4,000 |
| Alaska | 358,000 | 11,000 | 1,000 | – | 3,000 | 6,000 |
| Arizona | 3,227,000 | 44,000 | 13,000 | 17,000 | 11,000 | 3,000 |
| Arkansas | 1,289,000 | 82,000 | 59,000 | 12,000 | 8,000 | 3,000 |
| California | 18,436,000 | 587,000 | 88,000 | 317,000 | 146,000 | 36,000 |
| Colorado | 2,972,000 | 53,000 | 25,000 | 14,000 | 13,000 | 1,000 |
| Connecticut | 1,795,000 | 15,000 | 4,000 | 4,000 | 6,000 | 1,000 |
| Delaware | 469,000 | 12,000 | 7,000 | 3,000 | – | 2,000 |
| District of Columbia | 378,000 | 1,000 | – | – | – | – |
| Florida | 9,687,000 | 115,000 | 21,000 | 55,000 | 34,000 | 5,000 |
| Georgia | 4,914,000 | 107,000 | 46,000 | 23,000 | 27,000 | 11,000 |
| Hawaii | 667,000 | 11,000 | 2,000 | 5,000 | 3,000 | – |
| Idaho | 813,000 | 51,000 | 22,000 | 17,000 | 10,000 | 2,000 |
| Illinois | 6,321,000 | 146,000 | 48,000 | 31,000 | 49,000 | 17,000 |
| Indiana | 3,257,000 | 72,000 | 31,000 | 16,000 | 17,000 | 9,000 |
| Iowa | 1,597,000 | 98,000 | 66,000 | 20,000 | 7,000 | 4,000 |
| Kansas | 1,424,000 | 62,000 | 35,000 | 16,000 | 7,000 | 5,000 |
| Kentucky | 2,000,000 | 55,000 | 23,000 | 11,000 | 16,000 | 4,000 |
| Louisiana | 2,011,000 | 27,000 | 10,000 | 8,000 | 6,000 | 3,000 |
| Maine | 665,000 | 12,000 | 3,000 | 5,000 | 4,000 | – |
| Maryland | 3,096,000 | 26,000 | 9,000 | 4,000 | 8,000 | 5,000 |
| Massachusetts | 3,584,000 | 30,000 | 8,000 | 6,000 | 12,000 | 4,000 |
| Michigan | 4,744,000 | 78,000 | 29,000 | 21,000 | 23,000 | 5,000 |
| Minnesota | 2,968,000 | 96,000 | 51,000 | 23,000 | 16,000 | 6,000 |
| Mississippi | 1,234,000 | 33,000 | 23,000 | 6,000 | 2,000 | 2,000 |
| Missouri | 2,939,000 | 93,000 | 51,000 | 19,000 | 18,000 | 5,000 |
| Montana | 519,000 | 23,000 | 13,000 | 6,000 | 3,000 | – |
| Nebraska | 973,000 | 55,000 | 33,000 | 16,000 | 4,000 | 2,000 |
| Nevada | 1,445,000 | 13,000 | 4,000 | 3,000 | 4,000 | 1,000 |
| New Hampshire | 720,000 | 6,000 | 2,000 | 2,000 | 2,000 | – |
| New Jersey | 4,517,000 | 49,000 | 9,000 | 8,000 | 25,000 | 7,000 |
| New Mexico | 877,000 | 22,000 | 13,000 | 5,000 | 3,000 | 1,000 |
| New York | 9,438,000 | 95,000 | 33,000 | 20,000 | 36,000 | 6,000 |
| North Carolina | 4,867,000 | 115,000 | 53,000 | 31,000 | 24,000 | 7,000 |
| North Dakota | 391,000 | 16,000 | 4,000 | 10,000 | 2,000 | – |
| Ohio | 5,699,000 | 97,000 | 33,000 | 19,000 | 34,000 | 11,000 |
| Oklahoma | 1,789,000 | 41,000 | 25,000 | 9,000 | 7,000 | 1,000 |
| Oregon | 2,014,000 | 77,000 | 13,000 | 36,000 | 24,000 | 4,000 |
| Pennsylvania | 6,283,000 | 121,000 | 41,000 | 22,000 | 43,000 | 15,000 |
| Rhode Island | 525,000 | 5,000 | 1,000 | 1,000 | 2,000 | 1,000 |
| South Carolina | 2,314,000 | 28,000 | 12,000 | 6,000 | 7,000 | 3,000 |
| South Dakota | 440,000 | 29,000 | 18,000 | 9,000 | 1,000 | 1,000 |
| Tennessee | 3,102,000 | 60,000 | 26,000 | 8,000 | 24,000 | 2,000 |
| Texas | 13,283,000 | 202,000 | 98,000 | 38,000 | 54,000 | 12,000 |
| Utah | 1,533,000 | 30,000 | 14,000 | 6,000 | 8,000 | 2,000 |
| Vermont | 325,000 | 12,000 | 7,000 | 2,000 | 1,000 | 2,000 |
| Virginia | 4,177,000 | 55,000 | 27,000 | 8,000 | 15,000 | 6,000 |
| Washington | 3,708,000 | 134,000 | 25,000 | 71,000 | 28,000 | 11,000 |
| West Virginia | 759,000 | 6,000 | 3,000 | 1,000 | 2,000 | – |
| Wisconsin | 2,999,000 | 124,000 | 73,000 | 17,000 | 25,000 | 10,000 |
| Wyoming | 290,000 | 8,000 | 6,000 | 1,000 | – | – |
| NOTES: Animal processing and production includes animal food, grain, and oilseed milling; animal production and aquaculture; animal slaughtering and processing; and dairy product manufacturing. Other Food Manufacturing includes bakeries and tortilla manufacturing, except retail bakers; beverage manufacturing, fruit and vegetable preserving and specialty food manufacturing; sugar and confectionary products; and not specified food industries.SOURCE: KFF analysis of American Community Survey, 2018. | ||||||