Appendix A
| Table 1: Federal Data Sources on COVID-19 and Race/Ethnicity |
| Source | Title | Description | Level |
| Public Data from the Federal Government |
| CDC | CDC COVID Data Tracker | Provides information on cases and deaths by race/ethnicity. Race/ethnicity data can also be stratified by age group (updated daily). | National |
| CDC | Provisional Death Counts for Coronavirus Disease (COVID-19) | Contains multiple data sets from the National Vital Statistics System’s COVID-19 Surveillance Data Files, including provisional death counts by race/ethnicity and deaths involving coronavirus by race/ethnicity and age (race data updated weekly). | State and National |
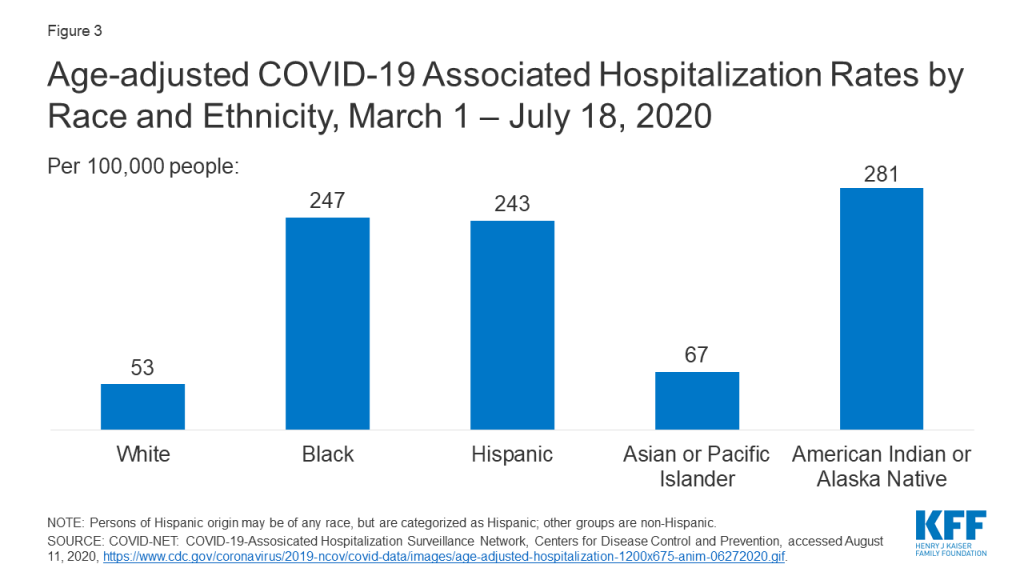
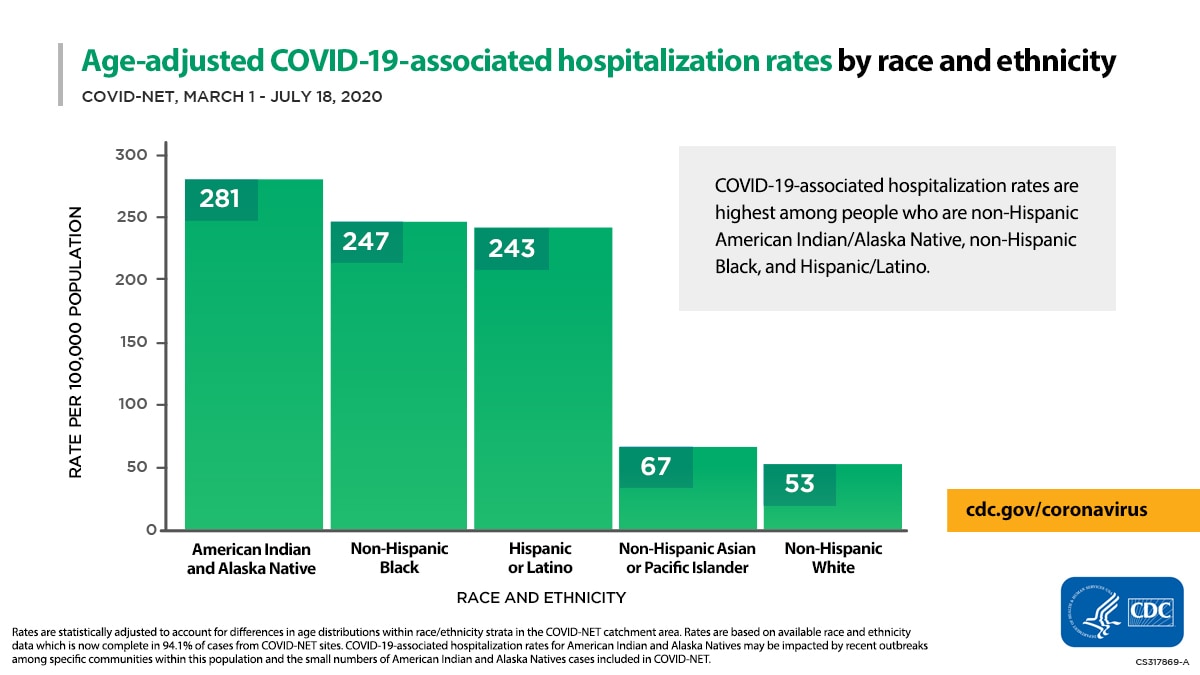
| CDC | COVID-NET: COVID-19 Laboratory-Confirmed Hospitalizations | Summary of COVID-19 hospitalizations. In addition to race/ethnicity, figures are stratified by multiple demographic characteristics (updated biweekly). | National |
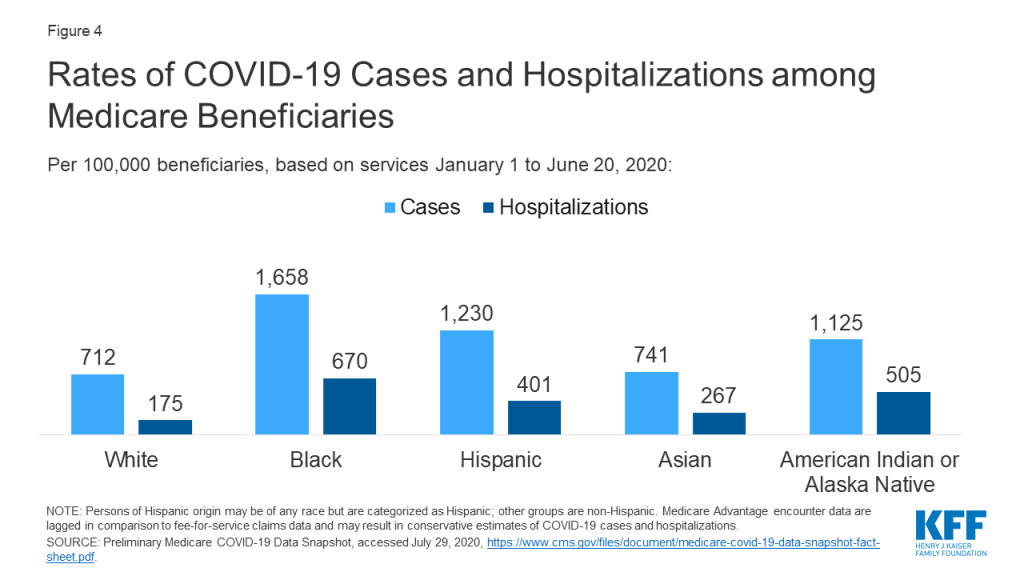
| CMS | Preliminary Medicare COVID-19 Data Snapshot | Counts of Medicare beneficiaries of COVID-19 cases and hospitalizations by several measures, including race/ethnicity at the national level (updated monthly). | State and National |
| HRSA | Health Center COVID-19 Survey | Rapid response survey of community health centers on a range of issues related to COVID-19, included testing data by race/ethnicity (updated weekly). | State and National |
Appendix B: References
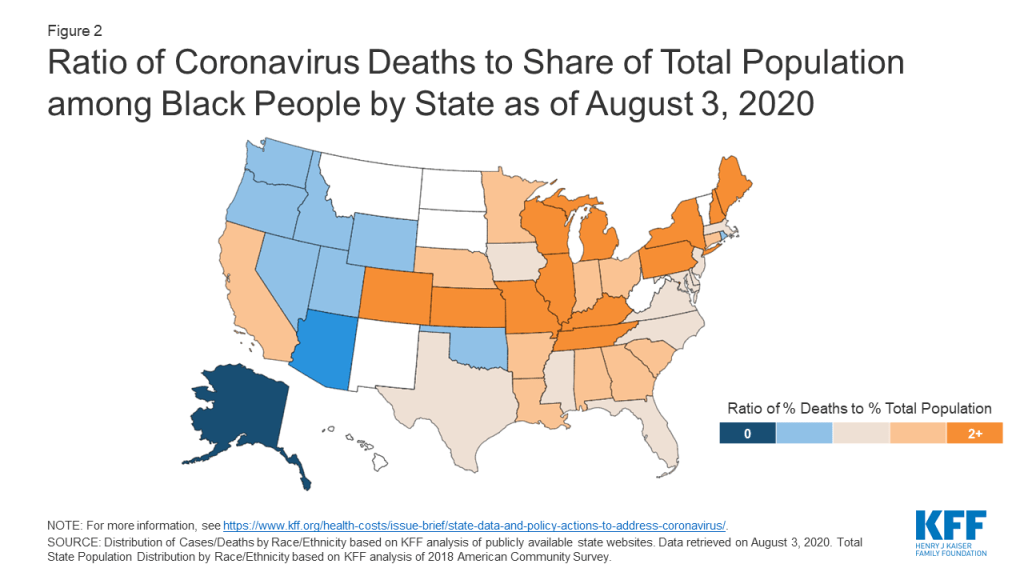
KFF (Kaiser Family Foundation), State Data and Policy Actions to Address Coronavirus, COVID-19 Confirmed Cases and Deaths by Race/Ethnicity as of August 3, 2020, accessed August 11, 2020, https://www.kff.org/health-costs/issue-brief/state-data-and-policy-actions-to-address-coronavirus/.
The COVID Tracking Project, The COVID Racial Data Tracker, accessed August 11, 2020, https://covidtracking.com/race.
APM Research Lab, The Color of Coronavirus: COVID-19 Deaths by Race and Ethnicity in the U.S., (August 5, 2020), accessed August 11, 2020, https://www.apmresearchlab.org/covid/deaths-by-race.
The COVID Tracking Project, The COVID Racial Data Tracker, accessed August 11, 2020, https://covidtracking.com/race.
KFF (Kaiser Family Foundation), State Data and Policy Actions to Address Coronavirus, COVID-19 Confirmed Cases and Deaths by Race/Ethnicity as of August 3, 2020, accessed August 11, 2020, available at https://www.kff.org/health-costs/issue-brief/state-data-and-policy-actions-to-address-coronavirus/.
L. Kim, M. Whitaker. A. O’Halloran, et al., “Hospitalization Rates and Characteristics of Children Aged <18 Years Hospitalized with Laboratory-Confirmed COVID-19 — COVID-NET, 14 States, March 1–July 25, 2020,” Morbidity and Mortality Weekly Report ePub 7 (August 2020), available at https://www.cdc.gov/mmwr/volumes/69/wr/mm6932e3.htm?s#F2_down.
Monika K. Goyal, et al, “Racial/Ethnic and Socioeconomic Disparities of SARS-CoV-2 Infection Among Children, Pediatrics, Vol 16, Issue 2 (August 2020), accessed August 11, 2020, available at https://pediatrics.aappublications.org/content/early/2020/08/03/peds.2020-009951.
Centers for Disease Control and Prevention, Age-adjusted COVID-19-associated hospitalization rates by race and ethnicity, accessed August 11, 2020, https://www.cdc.gov/coronavirus/2019-ncov/covid-data/images/July-28_Race_Ethnicity_COVIDNet.jpg.
Centers for Medicare & Medicaid Services, Preliminary Medicare COVID-19 Data Snapshot, accessed August 11, 2020, https://www.cms.gov/research-statistics-data-systems/preliminary-medicare-covid-19-data-snapshot.
Samrachana Adhikari, Nicholas P. Pantaleo, and Justin M. Feldman, “Assessment of Community-Level Disparities in Coronavirus Disease 2019 (COVID-19) Infections and Deaths in Large Metropolitan Areas, Jama Network Open (July 28, 2020), accessed August 11, 2020, available at https://jamanetwork.com/journals/jamanetworkopen/fullarticle/2768723.
Carlos E. Rodriguez-Diaz et al., “Risk for COVID-19 infection and death among Latinos in the United States: Examining heterogeneity in transmission dynamics”, Annals of Epidemiology (July 23, 2020), accessed August 11, 2020, available at https://www.sciencedirect.com/science/article/pii/S1047279720302672#figs1.
Soo Rin Kim et al., “Which Cities Have The Biggest Racial Gaps In COVID-19 Testing Access?” FiveThirtyEight, July 22, 2020, https://fivethirtyeight.com/features/white-neighborhoods-have-more-access-to-covid-19-testing-sites/.
J.M. Wortham, J.T. Lee, S. Althomsons et al., “Characteristics of Persons Who Died with COVID-19 — United States, February 12–May 18, 2020”, Morbidity and Mortality Weekly Report 69, no. 28 (July 17, 2020), accessed August 11, 2020, available at https://www.cdc.gov/mmwr/volumes/69/wr/mm6928e1.htm.
Brandon W. Yan et al., “Asian Americans Facing High COVID-19 Case Fatality”, Health Affairs (July 13, 2020), https://www.healthaffairs.org/do/10.1377/hblog20200708.894552/full/.
Heather E. Hsu et al., “Race/Ethnicity, Underlying Medical Conditions, Homelessness, and Hospitalization Status of Adult Patients with COVID-19 at an Urban Safety-Net Medical Center – Boston, Massachusetts, 2020”, Morbidity and Mortality Weekly Report 69 no. 27 (July 10, 2020), available at https://pubmed.ncbi.nlm.nih.gov/32644981/.
Ayodeji Adegunsoye, I. Bauer Ventura , and V.M. Liarski, “Association of Black Race with Outcomes in COVID-19 Disease: A Retrospective Cohort Study”, Annals of the American Thoracic Society (July 9, 2020), available at https://www.atsjournals.org/doi/abs/10.1513/AnnalsATS.202006-583RL.
Richard A. Oppel Jr. et al., “The Fullest Look Yet at the Racial Inequity of Coronavirus”, The New York Times, July 5, 2020, accessed August 11, 2020, https://www.nytimes.com/interactive/2020/07/05/us/coronavirus-latinos-african-americans-cdc-data.html.
David R. Holgrave et al., “Assessing racial and ethnic disparities using a COVID-19 outcomes continuum for New York State”, Annals of Epidemiology 48 (June 29, 2020), available at https://doi.org/10.1016/j.annepidem.2020.06.010.
Marie E. Killerby et al. “Characteristics Associated with Hospitalization Among Patients with COVID-19 — Metropolitan Atlanta, Georgia, March–April 2020”, Morbidity and Mortality Weekly Report 69, no. 25 (June 26, 2020), available at https://www.cdc.gov/mmwr/volumes/69/wr/mm6925e1.htm.
Sascha Ellington et al., “Characteristics of Women of Reproductive Age with Laboratory-Confirmed SARS-CoV-2 Infection by Pregnancy Status — United States, January 22–June 7, 2020”, Morbidity and Mortality Weekly Report 69 no. 25 (June 26, 2020): 769–775, available at https://www.cdc.gov/mmwr/volumes/69/wr/mm6925a1.htm.
Eboni G. Pricey-Haywood et al., “Hospitalization and Mortality among Black Patients and White Patients with Covid-19”, New England Journal of Medicine 382, no. 26 (June 25, 2020), available at https://www.nejm.org/doi/full/10.1056/NEJMsa2011686.
Wil Libermann-Cribbin et al., “Disparities in COVID-19 Testing and Positivity in New York City”, American Journal of Preventive Medicine (June 25, 2020), available at 10.1016/j.amepre.2020.06.005.
Diego A. Martinez et al., “SARS-CoV-2 Positivity Rate for Latinos in the Baltimore–Washington, DC Region”, Journal of the American Medical Association 324 no. 4 (June 13, 2020), available at 10.1001/jama.2020.11374.
Bassett MT, Chen JT and Krieger N, “The Unequal toll of COVID-19 Mortality by Age in the United States: Quantifying Racial/Ethnic Disparities”, Working Paper Series 19, no.3 (June 12, 2020), Harvard Center for Population and Development Studies, available at https://cdn1.sph.harvard.edu/wp-content/uploads/sites/1266/2020/06/20_Bassett-Chen-Krieger_COVID-19_plus_age_working-paper_0612_Vol-19_No-3_with-cover.pdf.
Hannah R. Abrams et al., “Characteristics of U.S. Nursing Homes with COVID ‐19 Cases”, Journal of the American Geriatrics Society, (June 2, 2020), available at https://doi.org/10.1111/jgs.16661.
Sindhura Bandi, M.Z. Nevid, M. Mahdavinia, “African American children are at higher risk of COVID‐19 infection”, Pediatric Allergy and Immunology (May 29, 2020), available at https://doi.org/10.1111/pai.13298.
Sean McMinn et al. “In Large Texas Cities, Access To Coronavirus Testing May Depend On Where You Live”, NPR, May 27, 2020, accessed August 11, 2020, https://www.npr.org/sections/health-shots/2020/05/27/862215848/across-texas-black-and-hispanic-neighborhoods-have-fewer-coronavirus-testing-sit.
Kristen M.J. Azar et al., “Disparities In Outcomes Among COVID-19 Patients In A Large Health Care System In California”, Health Affairs 39, no. 7 (May 21, 2020), accessed August 11, 2020, available at https://www.healthaffairs.org/doi/10.1377/hlthaff.2020.00598.
Robert Gebeloff et al., “The Striking Racial Divide in How Covid-19 Has Hit Nursing Homes”, The New York Times, May 21, 2020, accessed July 8, 2020, https://www.nytimes.com/article/coronavirus-nursing-homes-racial-disparity.html.
Uma V Mahajan and Margaret Larkins-Pettigrew, “Racial demographics and COVID-19 confirmed cases and deaths: a correlational analysis of 2886 US counties”, Journal of Public Health (May 21, 2020), available at 10.1093/pubmed/fdaa070.
Bradley Corallo and Jennifer Tolbert, Impact of Coronavirus on Community Health Centers, (Washington, DC, KFF, May 20, 2020), accessed August 11, 2020, available at https://www.kff.org/coronavirus-covid-19/issue-brief/impact-of-coronavirus-on-community-health-centers/
Benjamin Rader et al., “Geographic access to United States SARS-CoV-2 testing sites highlights healthcare disparities and may bias transmission estimates”, Journal of Travel Medicine (May 15, 2020), available at https://doi.org/10.1093/jtm/taaa076.
Gregorio A. Millett et al., “Assessing Differential Impacts of COVID-19 on Black Communities”, Annals of Epidemiology 47 (May 14, 2020), available at https://doi.org/10.1016/j.annepidem.2020.05.003.
Joseph Keawe‘aimoku Kaholokula et al., “COVID-19 Special Column: COVID-19 Hits Native Hawaiian and Pacific Islander Communities the Hardest”, Hawai’i Journal of Health & Social Welfare, 29 no. 5 (May 1, 2020), available at https://www.ncbi.nlm.nih.gov/pmc/articles/PMC7226312/#.
Shikha Garg et al. “Hospitalization Rates and Characteristics of Patients Hospitalized with Laboratory-Confirmed Coronavirus Disease 2019 — COVID-NET, 14 States, March 1–30, 2020”, Morbidity and Mortality Weekly Report 69, no. 15 (April 17, 2020), available at https://www.cdc.gov/mmwr/volumes/69/wr/mm6915e3.htm.

