The KFF COVID-19 Vaccine Monitor is an ongoing research project tracking the public’s attitudes and experiences with COVID-19 vaccinations. Using a combination of surveys and qualitative research, this project tracks the dynamic nature of public opinion as vaccine development and distribution unfold, including vaccine confidence and acceptance, information needs, trusted messengers and messages, as well as the public’s experiences with vaccination.
Key Findings
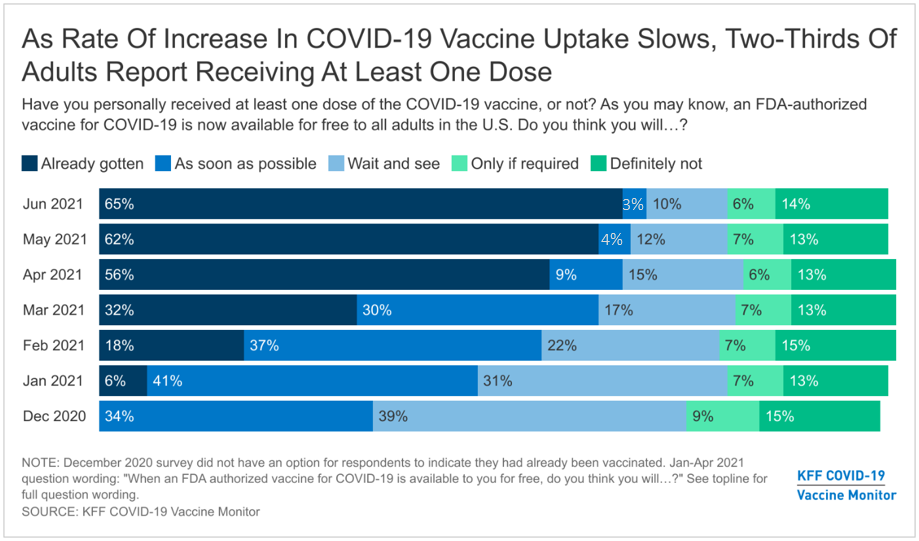
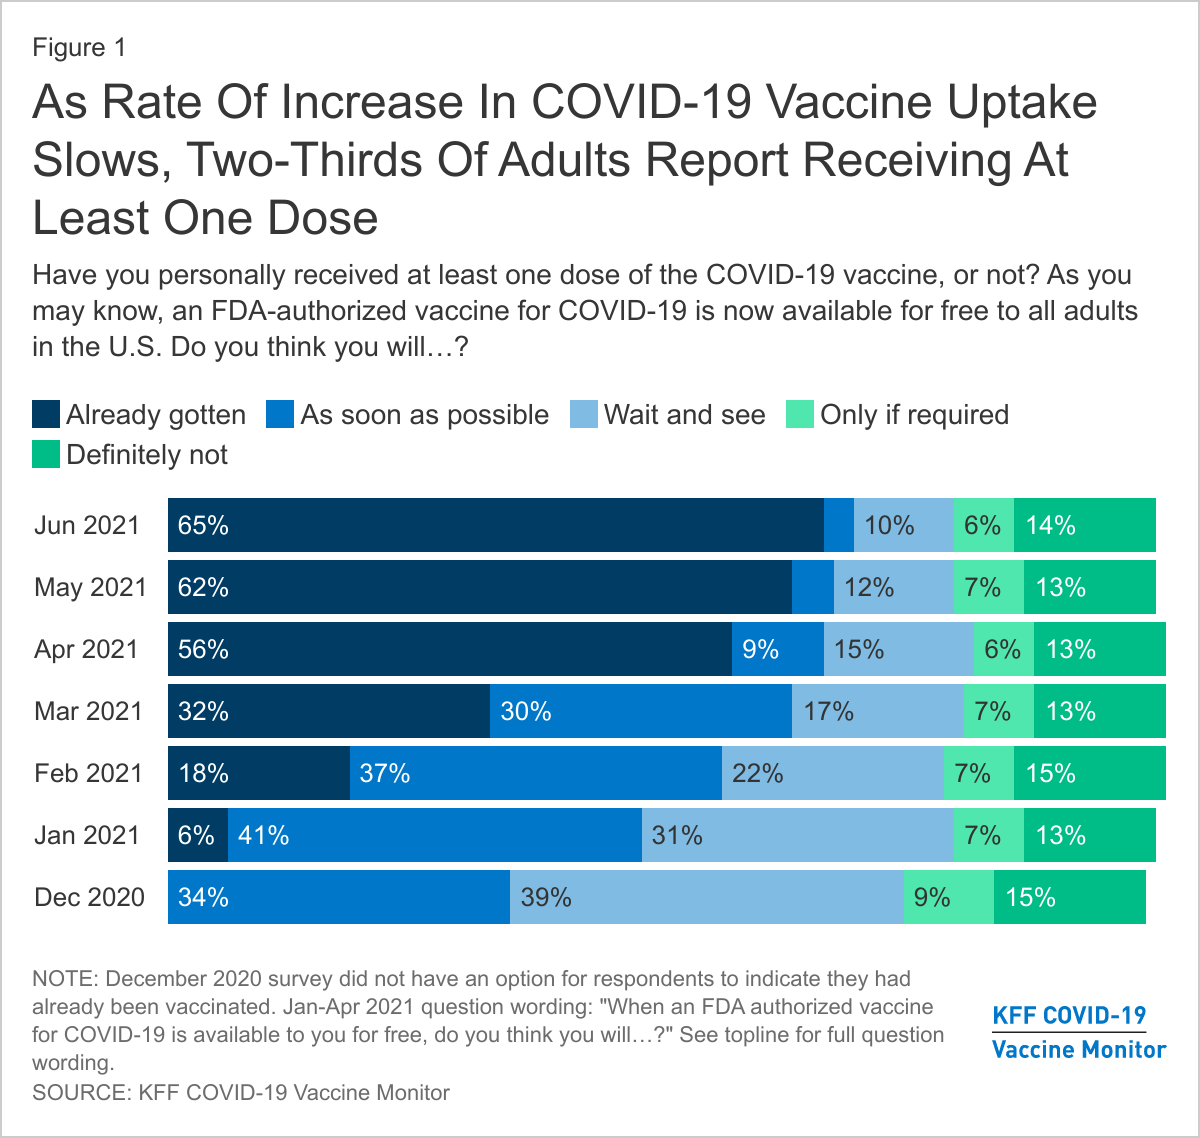
- Reflecting other data indicating a slowdown in U.S. COVID-19 vaccination rates, the latest KFF COVID-19 Vaccine Monitor finds that nearly two-thirds of adults (65%) have received at least one vaccine dose, with only a small share (3%) saying they intend to get the vaccine as soon as they can. While vaccine intentions vary by party, race, ethnicity, age, and other demographics, at least half across most demographic groups now report being vaccinated, with the exception of those who lack health insurance, 48% of whom say they have received at least one dose of a COVID-19 vaccine.
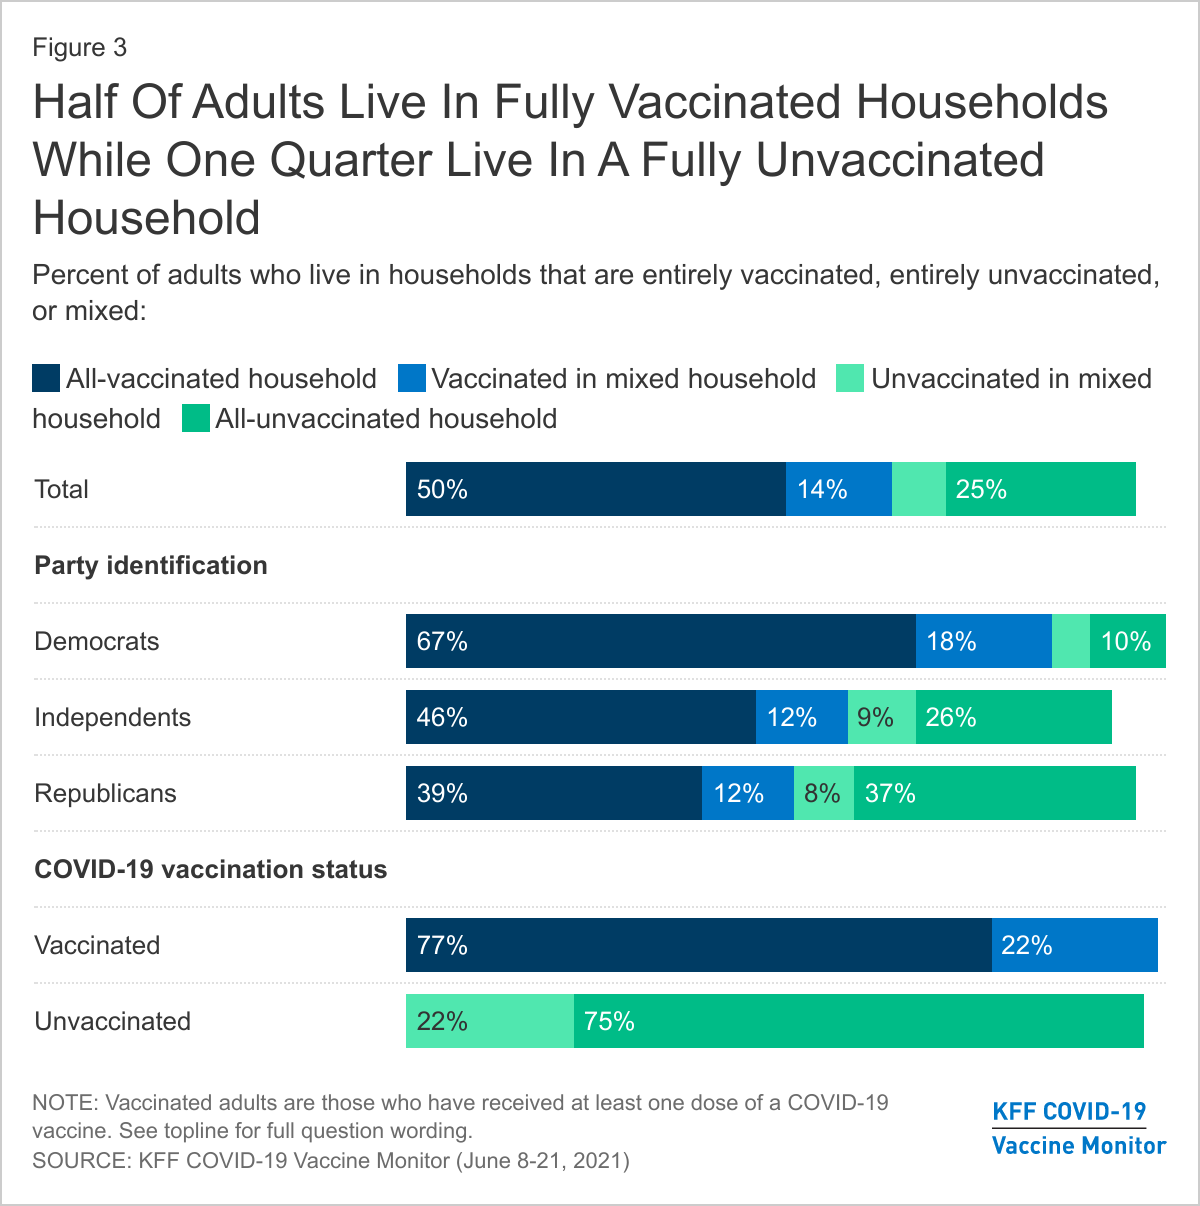
- In a new measure, we find that most adults live in homogenous households when it comes to COVID-19 vaccination status, with three-quarters (77%) of vaccinated adults saying everyone in their household is vaccinated and a similar share (75%) of unvaccinated adults saying no one they live with is vaccinated. Overall, half of adults report living in vaccinated households and one in four live in fully unvaccinated households. The remainder, about one in five adults, live in households with both vaccinated and unvaccinated household members including some households with children under the age of 12 who are not currently eligible to receive a vaccine. Notably, two-thirds of Democrats report living in all-vaccinated households while four in ten Republicans (39%) report living in all-unvaccinated homes.
- With COVID-19 case rates at record lows and much of the country re-opening, most adults (76%) are optimistic that the U.S. is nearing the end of the pandemic. However, this optimism has the potential to hamper further vaccination efforts, with half of unvaccinated adults saying that the number of cases is now so low there is no need for more people to get the vaccine.
- Consistent with last month’s results, three in ten unvaccinated adults, rising to about half of those in the “wait and see” group, say they would be more likely to get vaccinated if one of the vaccines currently authorized for emergency use were to receive full approval from the FDA. However, this finding likely suggests that FDA approval is a proxy for general safety concerns, as two-thirds of adults (including a large majority of unvaccinated adults) either believe the vaccines currently available in the U.S. already have full approval from the FDA or are unsure whether they have full approval or are authorized for emergency use. In terms of other incentives and interventions, a million dollar lottery could motivate about a quarter of the unvaccinated to get a shot, while mobile vaccine clinics motivate about one in six overall, but notably higher shares of Black and Hispanic adults, suggesting such outreach could help further reduce racial and ethnic disparities in vaccination rates.
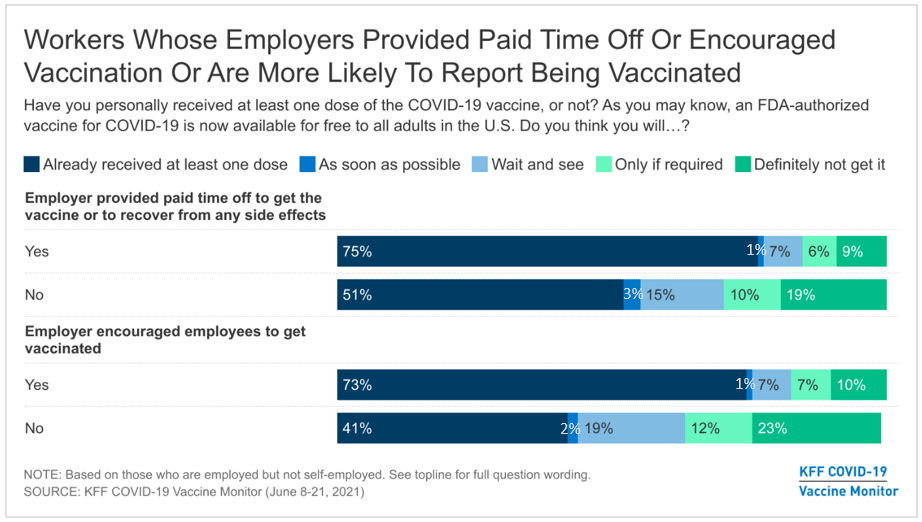
- Two-thirds of employed adults say their employer has encouraged workers to get vaccinated and half say their employer provided them paid time off to get the vaccine or recover from side effects. Notably, workers who say their employer did either one of these things are more likely to report being vaccinated, even after controlling for other demographics, suggesting that more employers encouraging vaccination and offering paid time off could lead to higher vaccination rates among U.S. workers.
- While half the public overall say employers should require their workers to get vaccinated, most workers do not want their own employer to require vaccination, including the vast majority of unvaccinated workers (92%) as well as four in ten workers who are already vaccinated (42%). About four in ten adults say employers should provide cash bonuses or other incentives to workers who get vaccinated, but just 12% of workers say their own employer has offered such an incentive.
- Reported vaccination rates continue to increase among children ages 12-17, with one-third of parents of children in this age range saying their child has received at least one vaccine dose, up from 24% in May. However, many parents are still waiting and one-quarter say they will “definitely not” vaccinate their child. Similar to employer requirements, about half the public overall supports K-12 schools requiring COVID-19 vaccination, but most parents are opposed, with divisions along partisan lines. A somewhat larger share of the public (58%) says colleges and universities should require students to be vaccinated, including 58% of those who say they are currently undergraduate or graduate students.
Trends In COVID-19 Vaccination Intentions And Uptake
Reflecting other data indicating a slowdown in U.S. COVID-19 vaccination rates, the latest KFF COVID-19 Vaccine Monitor reports that about two-thirds of adults (65%) now say they have received at least one dose of a vaccine, up only slightly from May (62%). An additional 3% of adults say they intend to get the vaccine as soon as possible. One in ten adults say they want to “wait and see” before getting vaccinated, trending downward over time but statistically similar to the share that said the same last month (12%). The shares of adults who are more reluctant to get the COVID-19 have remained relatively unchanged since January, with about one in five saying they either will get a vaccine “only if required” for work or other activities (6%) or will “definitely not” get vaccinated (14%).
Among those who say they want to “wait and see” before getting vaccinated, a critical group to efforts to increase the adults vaccination rate, about a quarter (3% of all adults) say they plan to get vaccinated within the next three months. Notably, four in ten adults (37%) in the “wait and see” group say they are likely to wait more than a year before getting vaccinated.
Demographic patterns in vaccine uptake and intentions are similar to those measured in previous surveys, with large majorities of older adults, those with serious health conditions, college graduates, and Democrats saying they have gotten at least one dose of the COVID-19 vaccine. Black and Hispanic adults along with younger adults remain somewhat more likely than their counterparts to say they will “wait and see” before getting vaccinated, while Republicans, rural residents, and White Evangelical Christians continue to be disproportionately more likely to say they will definitely not get vaccinated.
While younger adults remain less likely to report being vaccinated, the largest increases in self-reported vaccination between May and June were among those ages 18-29 (from 48% to 55%) and those ages 30-49 (from 51% to 59%).
There remains a large gap in vaccine uptake across education, with about eight in ten college graduates (79%) saying they have gotten at least one dose of the COVID-19 vaccine, compared to about six in ten adults without a degree who say the same (59%). There is also a large gap among adults under age 65 by insurance status, with 62% of insured adults reporting receiving at least one dose compared to about half (48%) of uninsured adults. Notably, however, with the exception of individuals without health insurance, at least half of adults across all demographic subgroups say they have received at least one dose of a vaccine.
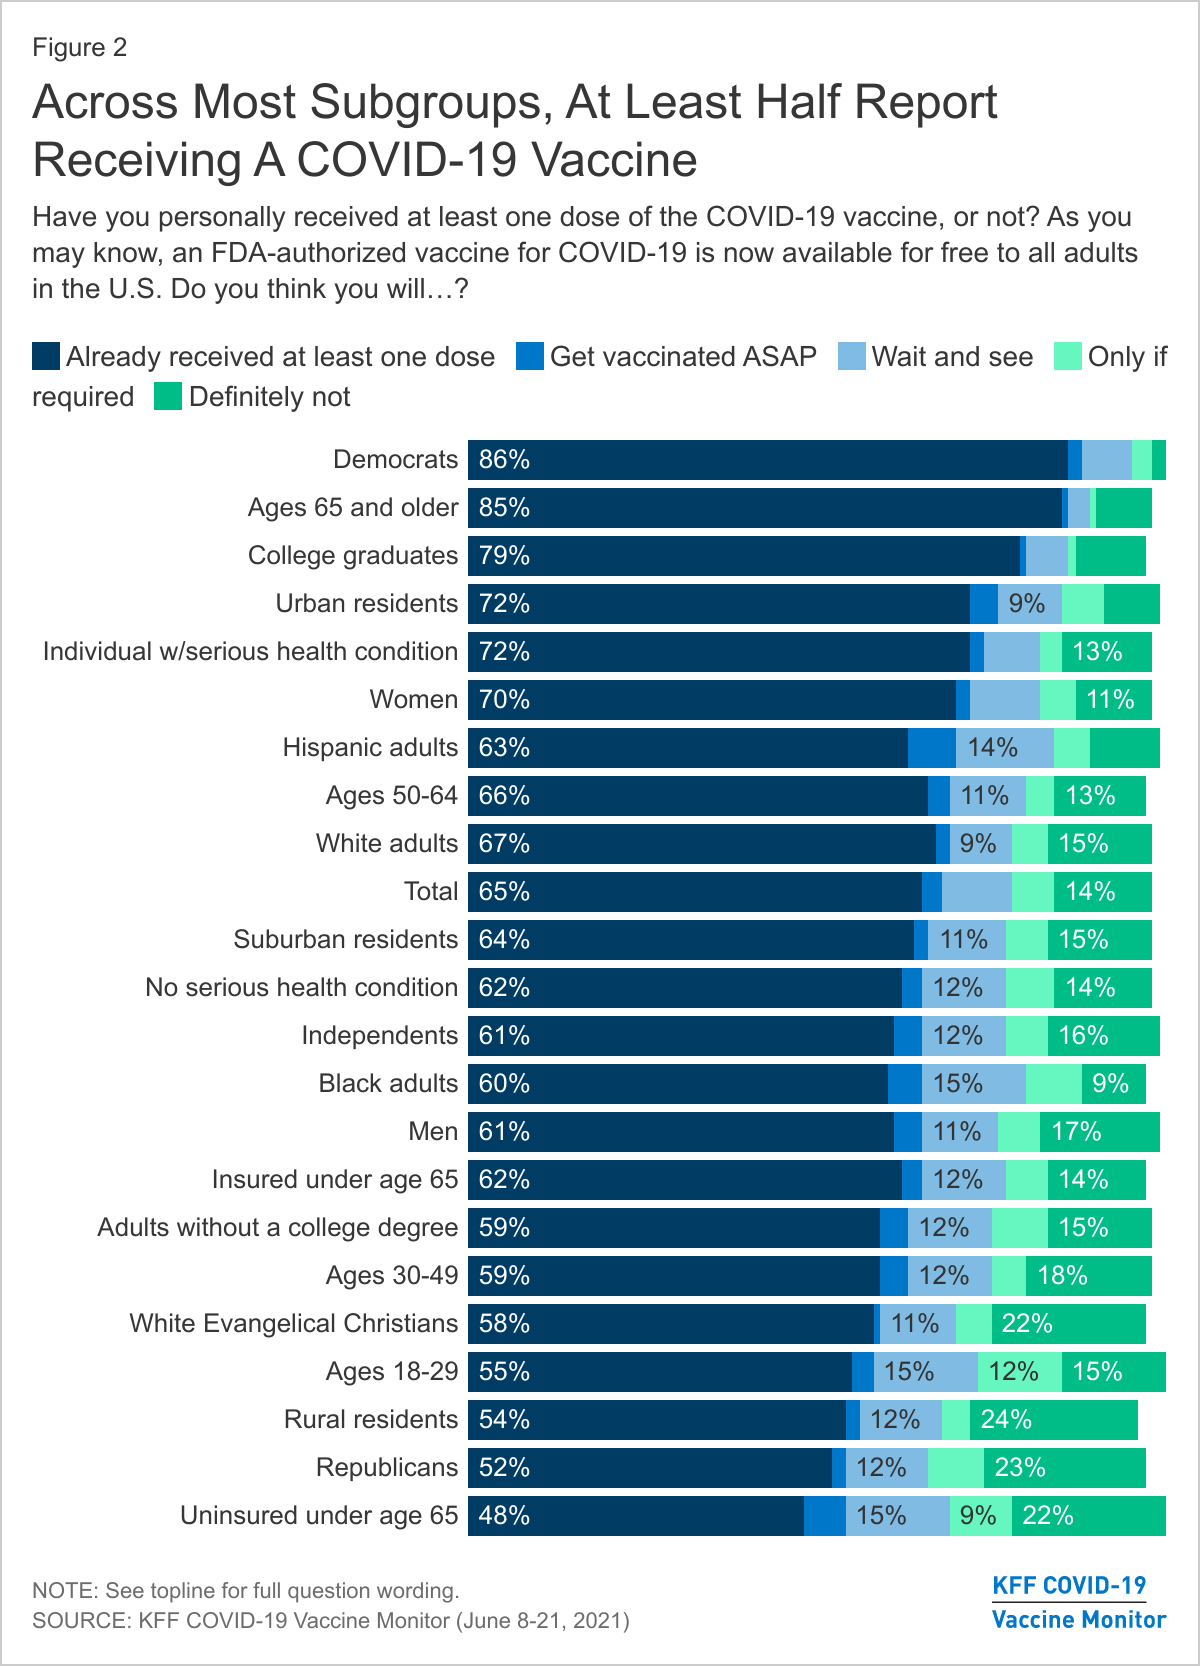
A gender gap in vaccine uptake has emerged over the past several months, and women are now 9 percentage points more likely to report being vaccinated than men (70% vs. 61%), and a larger share of men than women say they will “definitely not” get the vaccine (17% vs. 11%). This difference appears to largely reflect differences in partisan identification between men and women, with 43% of men identifying as Republicans or Republican-leaning independents compared to 27% of women. In fact, self-reported vaccination rates are similar by partisanship across genders with half of Republicans and Republican-leaning men and women reporting receiving at least one dose (50% of men and 52% of women) compared to eight in ten Democratic men and women (78% of men and 82% of women).
Vaccination Status of Households
This month’s Monitor finds that most U.S. households are homogeneous when it comes to their COVID-19 vaccination status. Half of adults report living in a vaccinated household (those in which every household member has received at least one dose of a COVID-19 vaccine) while one in four live in fully unvaccinated households (those in which no household member has been vaccinated) and about one in five live in a household with both vaccinated and unvaccinated individuals. Across partisans, two-thirds of Democrats say they live in a fully vaccinated household while nearly four in ten Republicans (37%) say they live in a fully unvaccinated household.
Three in four vaccinated adults (77%) say they live in fully vaccinated households while a similar share of unvaccinated adults (75%) say everyone in their household is unvaccinated. Among vaccinated adults living in a mixed-status household, one-third (34%) say all the unvaccinated members of their household are under age 12 and therefore ineligible to receive a COVID-19 vaccine, while the majority (65%) say at least one of their unvaccinated household members is age 12 or over and therefore eligible to get vaccinated.
How Optimism About The Pandemic’s End May Affect Vaccination Efforts
With COVID-19 cases at their lowest point since testing became widely available, and as the nation continues to open up with increased travel, large public events returning, and mask mandates being rescinded, about three-quarters of the public (76%) say they are optimistic that the U.S. is nearing the end of the COVID-19 pandemic. Vaccinated adults are somewhat more likely than those who are unvaccinated to express optimism, though large shares of both groups are optimistic (78% vs. 70%).
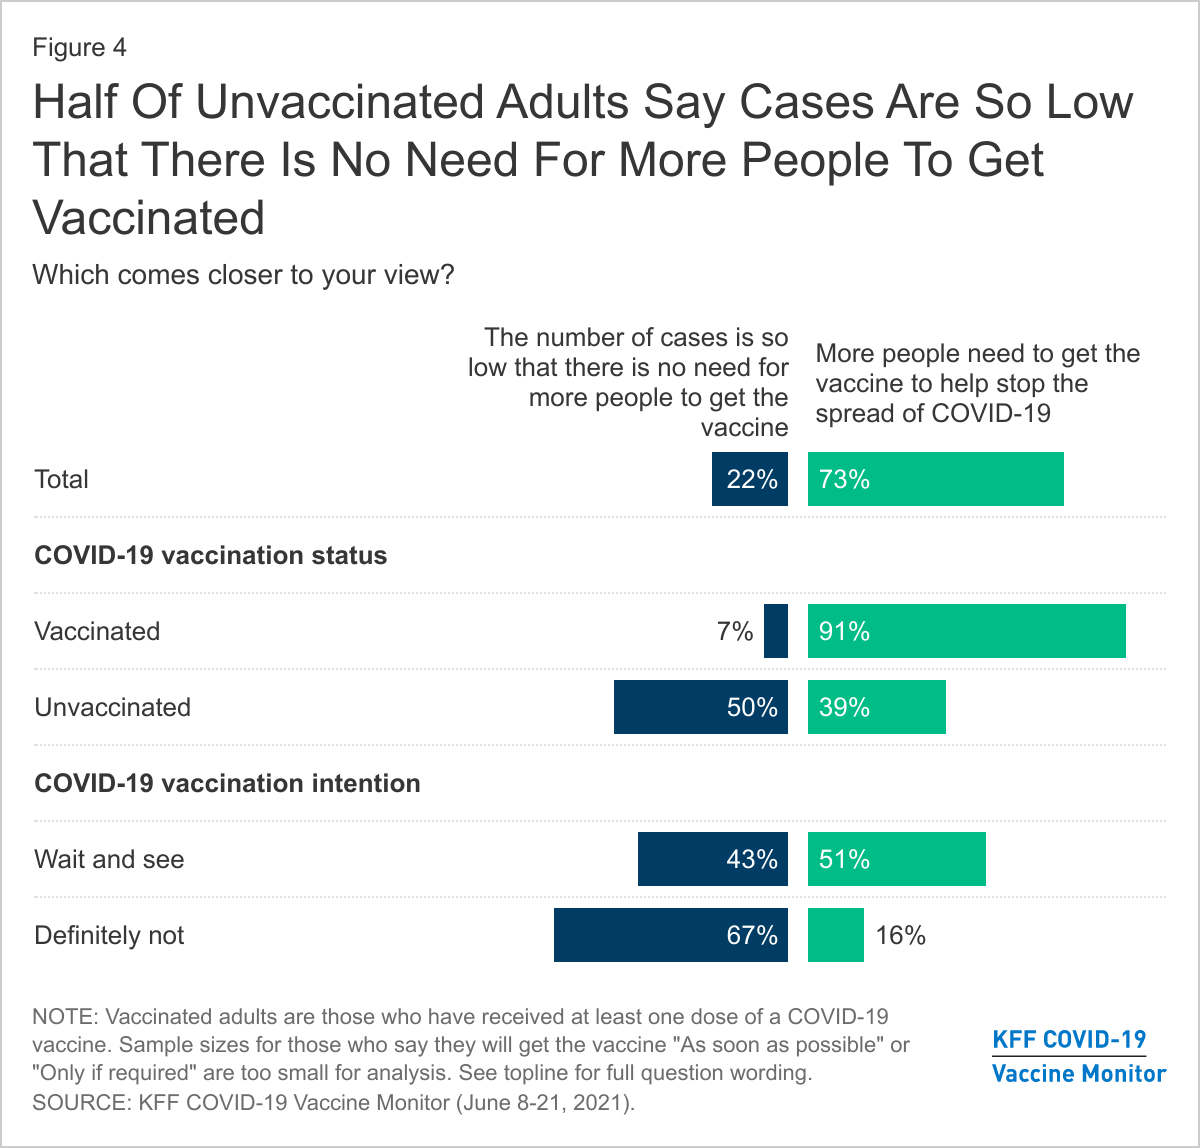
Public optimism about the end of the pandemic has the potential to hinder further vaccination efforts if low case rates decrease people’s sense of risk and therefore decrease their sense of urgency about getting vaccinated. The latest Monitor finds some evidence that this may be happening to a certain extent among unvaccinated adults. Overall, 73% of the public feels that “more people need to get the vaccine to help stop the spread of COVID-19,” while 22% say the number of cases “is so low that there is no need for more people to get the vaccine.” While the vast majority (91%) of vaccinated adults say that more people need to get vaccinated, half of unvaccinated adults say cases are so low that additional vaccinations are not necessary. This includes 43% in the potentially convertible “wait and see” group as well as two-thirds of those who say they will “definitely not” get the vaccine.
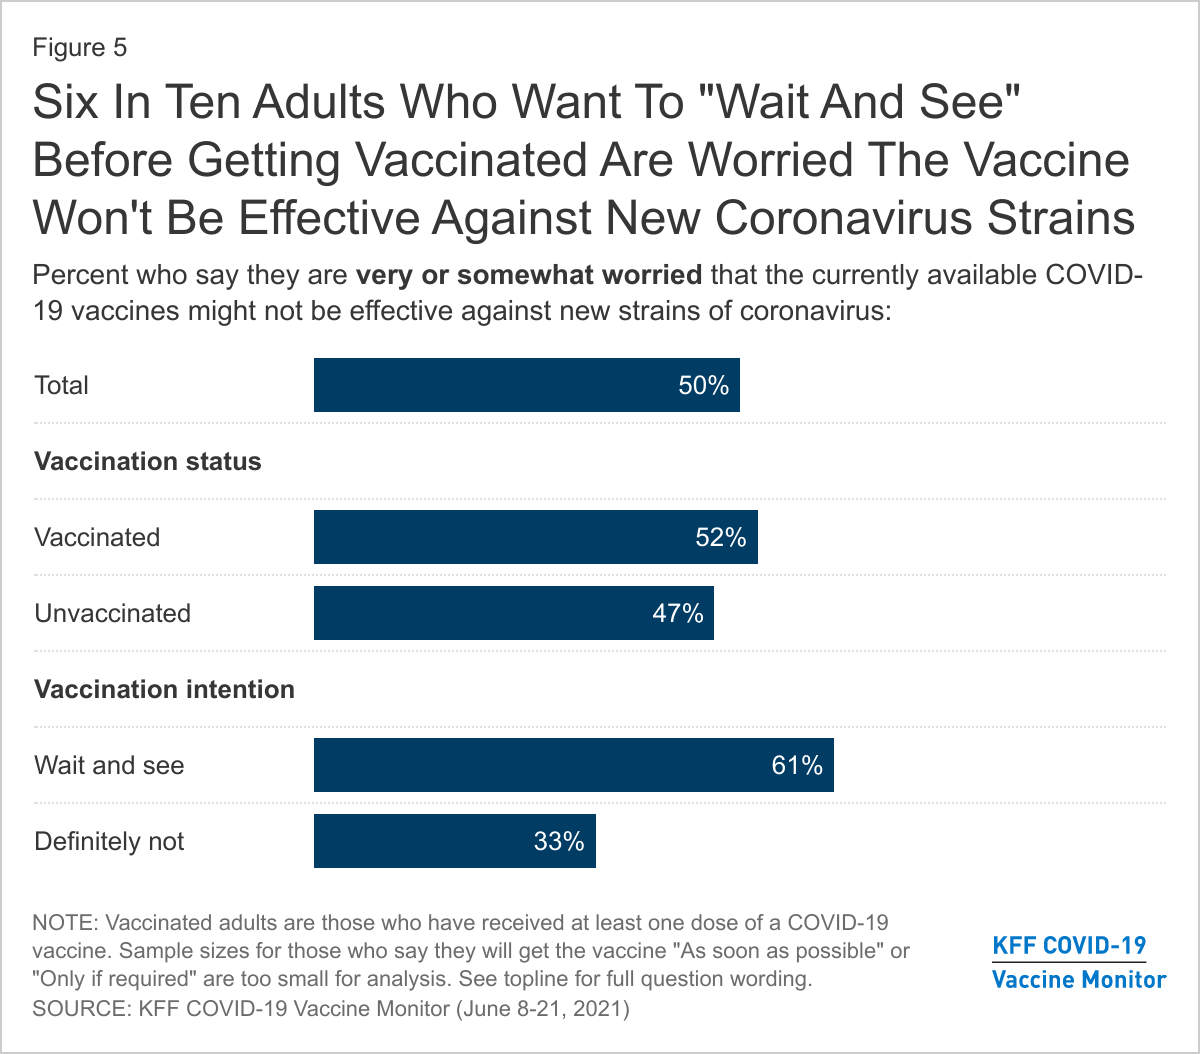
Concerns about the efficacy of the COVID-19 vaccines against new coronavirus variants could also deter some from getting vaccinated. Nearly half of unvaccinated adults, including six in ten of those in the “wait and see” group say they are worried that the currently available COVID-19 vaccines might not be effective against new strains of coronavirus.
Reasons Why Some Adults Remain Unvaccinated
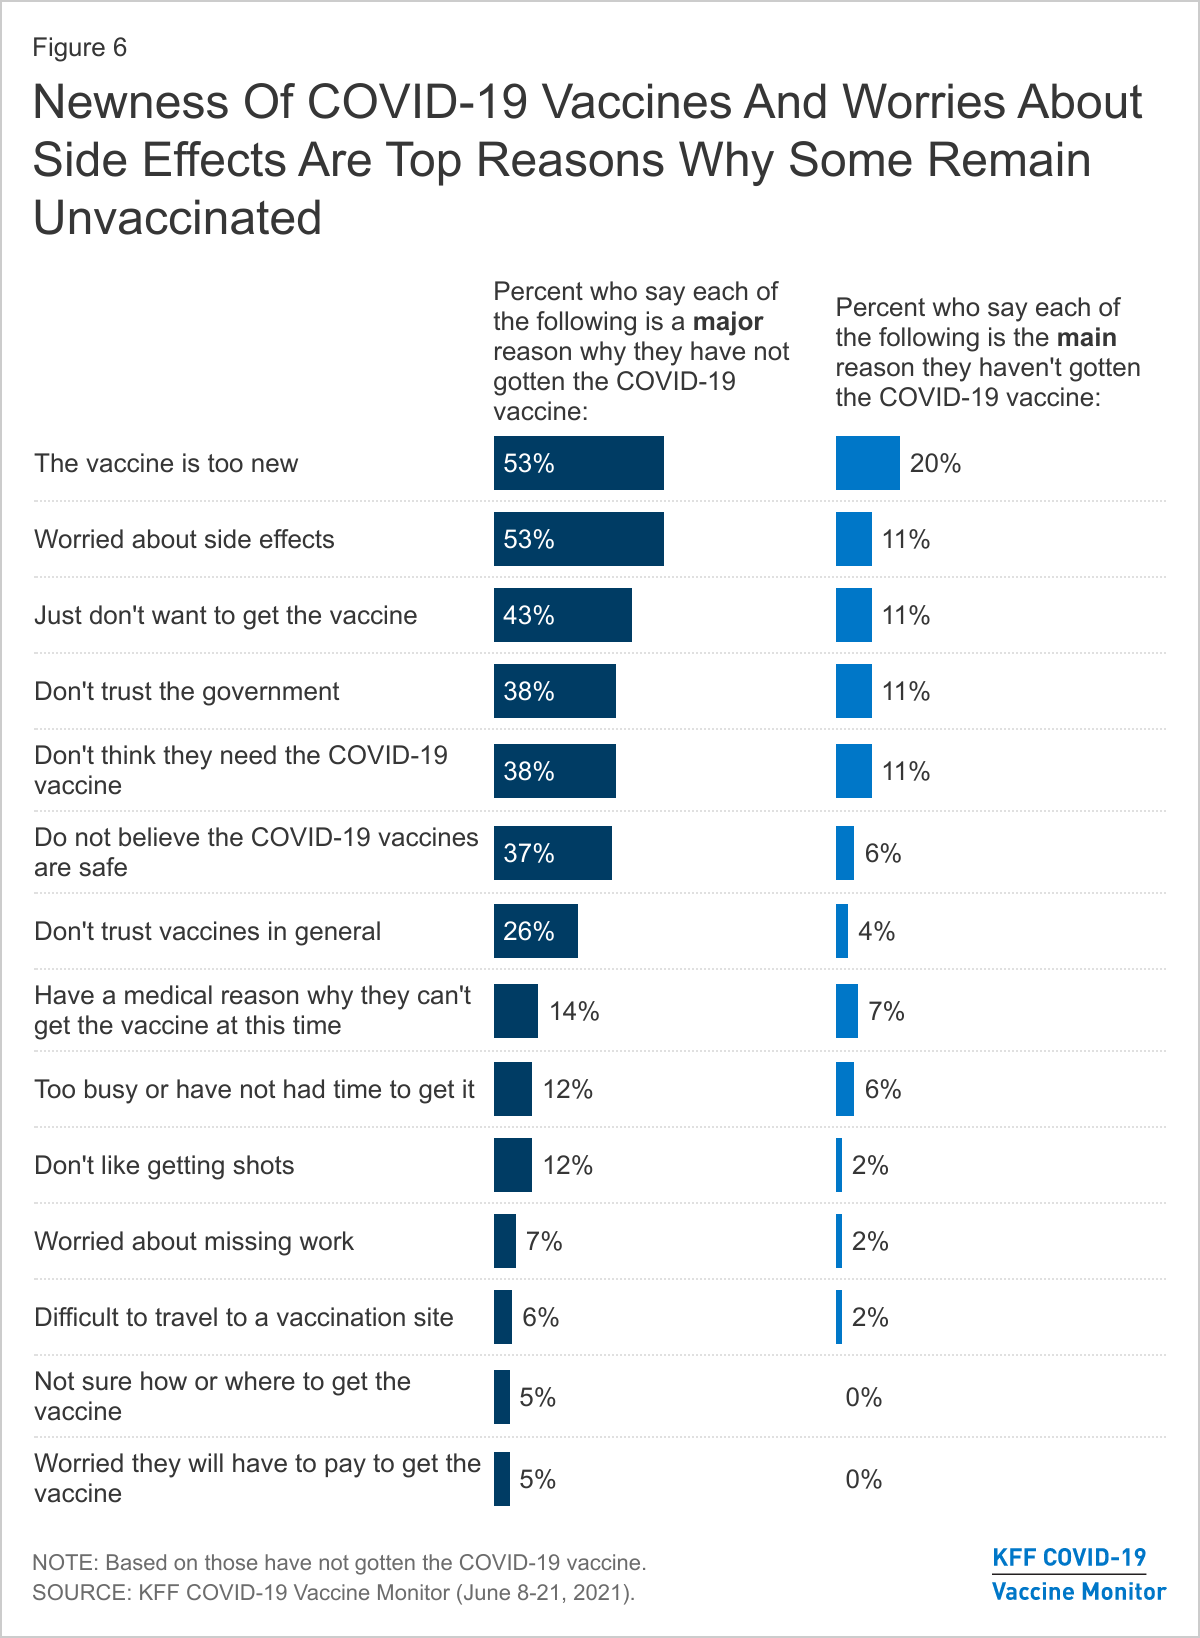
Unvaccinated adults cite a variety of reasons why they have not gotten a COVID-19 vaccine, with half citing worries about side effects and the newness of the vaccine as major reasons (53% each). Other major reasons include just not wanting to get the vaccine (43%), not trusting the government (38%), thinking they do not need the vaccine (38%), not believing the COVID-19 vaccines are safe (37%), and not trusting vaccines in general (26%). Fewer cite as major reasons that they have a medical reason for not getting vaccinated (14%), they are too busy or have not had the time to get it (12%), they don’t like getting shots (12%), they are worried about missing work (7%), they would have difficulty traveling to a vaccination site (6%), they are worried about having to pay (5%), or they are not sure how or where to get the vaccine (5%).
When unvaccinated adults are asked to choose the main reason they have not yet gotten the COVID-19 vaccine, one in five cite the newness of the vaccine, followed by 11% each who say the main reason is that they are worried about side effects, they don’t trust the government, they don’t think they need the vaccine, and they just don’t want to get the vaccine.
Reasons for not getting vaccinated differ between those in the “wait and see” group and those who say they will “definitely not” get vaccinated, as well as between unvaccinated adults with different partisan identities and those from different racial and ethnic backgrounds. While the newness of the vaccine and worries about side effects are prominent across groups, the vaccine’s newness is cited as a major reason by a larger share of those in the “wait and see” group compared to the “definitely not” group (67% vs. 52%). By contrast, those in the “definitely not” group are much more likely than those in the “wait and see” group to say they just don’t want to get the vaccine (63% vs. 25%), they don’t trust the government (55% vs. 29%), they don’t think they need the vaccine (54% vs. 21%), and that they don’t believe the vaccines are safe (50% vs. 31%).
When asked to choose the main reason they haven’t gotten vaccinated, the top two answers among the “wait and see” group are that the vaccine is too new (38%) and that they are worried about side effects (18%); among the “definitely not” group, the top reasons are they don’t trust the government (19%) and they just don’t want to get vaccinated (12%).
Consistent with previous research, unvaccinated Hispanic and Black adults are more likely than White adults to cite worries about missing work and having to pay for the vaccine as major reasons for not being vaccinated. In addition, unvaccinated Hispanic adults are more likely than unvaccinated White adults to say they are too busy, would have difficulty traveling to a vaccination site, or are not sure how or where to get the vaccine.
By partisanship, larger shares of unvaccinated Republicans than Democrats say they don’t want or need the vaccine, they don’t trust the government, or don’t believe the vaccines are safe. Larger shares of unvaccinated Democrats than Republicans say they are too busy, don’t like getting shots, or are worried about missing work.
| Table 1: Major Reasons Why Unvaccinated Adults Have Not Gotten A COVID-19 Vaccine |
| Percent who say each is a MAJOR reason why they haven’t gotten vaccinated: | Total unvaccinated | COVID-19 Vaccination intention | Race/Ethnicity | Party ID |
| Wait and see | Definitely not | Black | Hispanic | White | Dem. | Ind. | Rep. |
| The vaccine is too new | 53% | 67% | 52% | 55% | 54% | 54% | 63% | 50% | 51% |
| Worried about side effects | 53 | 57 | 61 | 55 | 60 | 51 | 57 | 54 | 51 |
| Just don't want to get the vaccine | 43 | 25 | 63 | 30 | 34 | 48 | 36 | 34 | 55 |
| Don't trust the government | 38 | 29 | 55 | 31 | 34 | 40 | 25 | 35 | 47 |
| Don't think they need the COVID-19 vaccine | 38 | 21 | 54 | 27 | 42 | 38 | 25 | 28 | 47 |
| Do not believe the COVID-19 vaccines are safe | 37 | 31 | 50 | 29 | 38 | 40 | 30 | 34 | 46 |
| Don't trust vaccines in general | 26 | 19 | 38 | 27 | 21 | 26 | 27 | 27 | 26 |
| Have a medical reason why they can't get the vaccine at this time | 14 | 14 | 17 | 7 | 18 | 15 | 9 | 17 | 14 |
| Too busy or have not had time to get it | 12 | 13 | 6 | 17 | 22 | 9 | 17 | 10 | 5 |
| Don't like getting shots | 12 | 12 | 10 | 17 | 14 | 10 | 22 | 12 | 4 |
| Worried about missing work | 7 | 7 | 3 | 9 | 18 | 3 | 11 | 8 | 3 |
| Difficult to travel to a vaccination site | 6 | 9 | 3 | 5 | 13 | 4 | 7 | 7 | 4 |
| Not sure how or where to get the vaccine | 5 | 7 | 2 | 6 | 13 | 2 | 6 | 5 | 1 |
| Worried they will have to pay to get the vaccine | 5 | 7 | 1 | 10 | 12 | 2 | 6 | 6 | 1 |
What Might Increase Vaccination Rates?
The May KFF COVID-19 Vaccine Monitor found that if the FDA were to give full approval to one of the COVID-19 vaccines, it could move some unvaccinated adults to get the vaccine. Findings were similar this month with 31% of unvaccinated adults saying they would be more likely to get a vaccine if one of the vaccines currently authorized for emergency use received full approval by the FDA, rising to nearly half of those in the “wait and see” group.
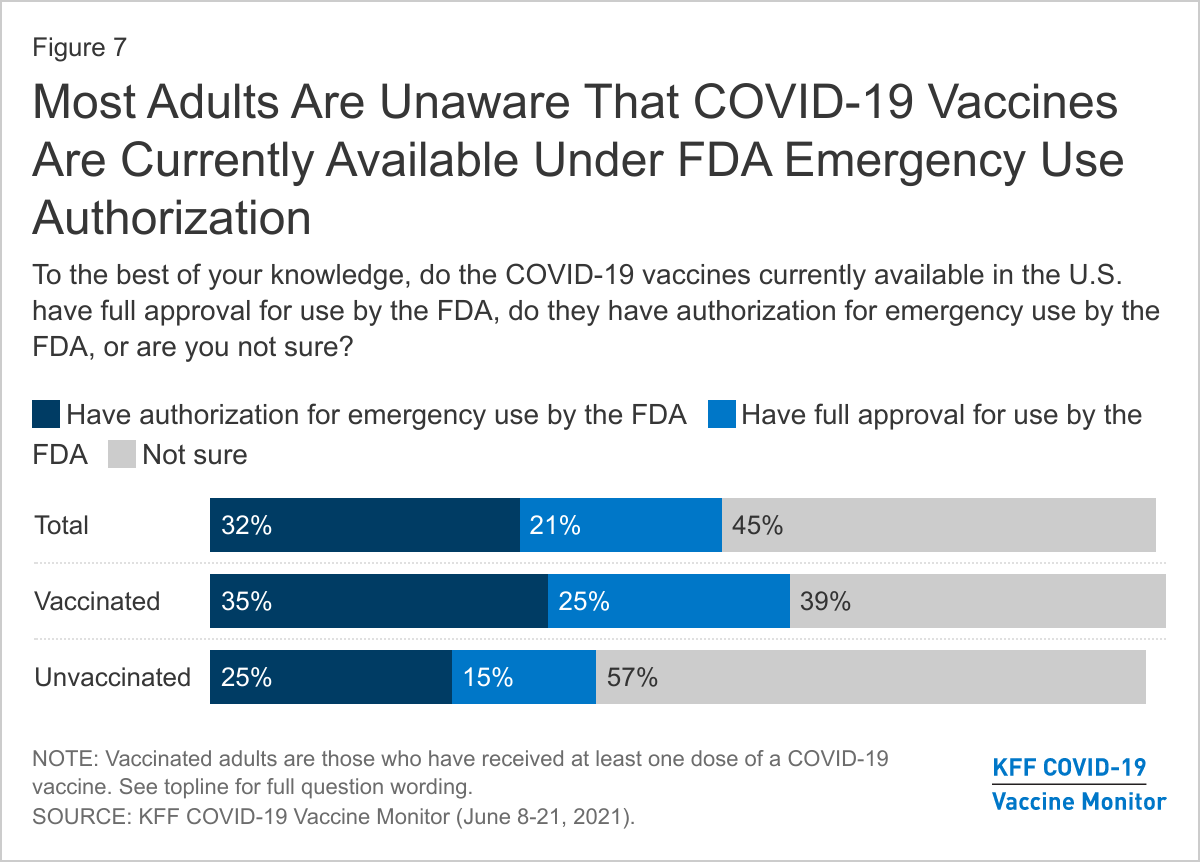
However, this reported increased likelihood does not necessarily reflect a nuanced understanding of the FDA approval process among unvaccinated adults and may be a proxy for more general concerns about safety. Two-thirds of the public either are unsure if the FDA has given full approval of the COVID-19 vaccines (45%) or think it has done so (21%), while just a third (32%) know that the vaccines have only been authorized for emergency use. Among unvaccinated adults, a majority (57%) say they are unsure whether the FDA had granted full approval or only emergency use authorization to the COVID-19 vaccines currently available in the U.S.
Among unvaccinated adults who are aware that the vaccines are available under emergency use authorization, a similar share as among all unvaccinated adults – 32% - say they would be more likely to get vaccinated if one of the vaccines were granted full approval by the FDA.
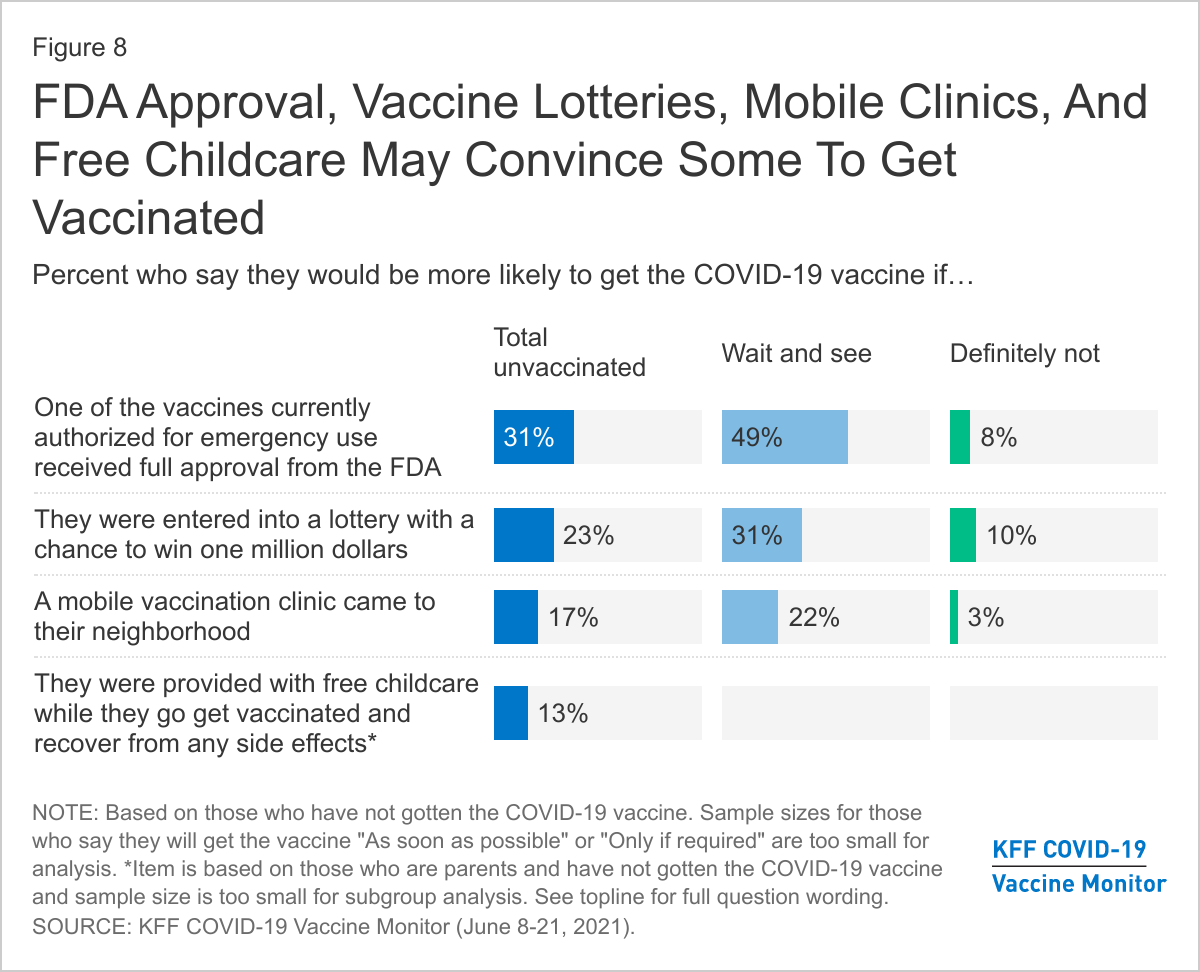
Over the past several months, we have been using the Vaccine Monitor surveys to test a number of potential incentives that may resonate with those who remain unvaccinated. Along with the 31% of unvaccinated adults who say they would be more likely to get the vaccine if the FDA granted full approval, the incentive tested in this month’s Monitor that appears to have the most resonance is a lottery with the chance to win one million dollars. About one in four (23%) of those who have not been vaccinated, including 31% of those who say they want to “wait and see,” say they would be more likely to get vaccinated if they were entered into a lottery with a chance to win one million dollars. Among the unvaccinated, about a third of adults ages 18 to 29 (33%), Black adults (34%), and those with a household income under $40,000 (31%) say being entered in a lottery would make them more likely to get the vaccine.
Incentives targeting vaccine access may also help increase vaccination rates and reduce racial and ethnic disparities in who is getting vaccinated. Seventeen percent of unvaccinated adults overall say they would be more likely to get vaccinated if a mobile vaccine clinic came to their neighborhood, a share that rises to nearly one-fourth of unvaccinated Black adults (22%) and one-third of Hispanic adults. In addition, 13% of unvaccinated parents say they would be more likely to get a vaccine if they were provided with free childcare while they get the vaccine and recover from side effects.
The Role of Employers in COVID-19 Vaccination
Workplace Vaccination Status And Feelings Of Safety
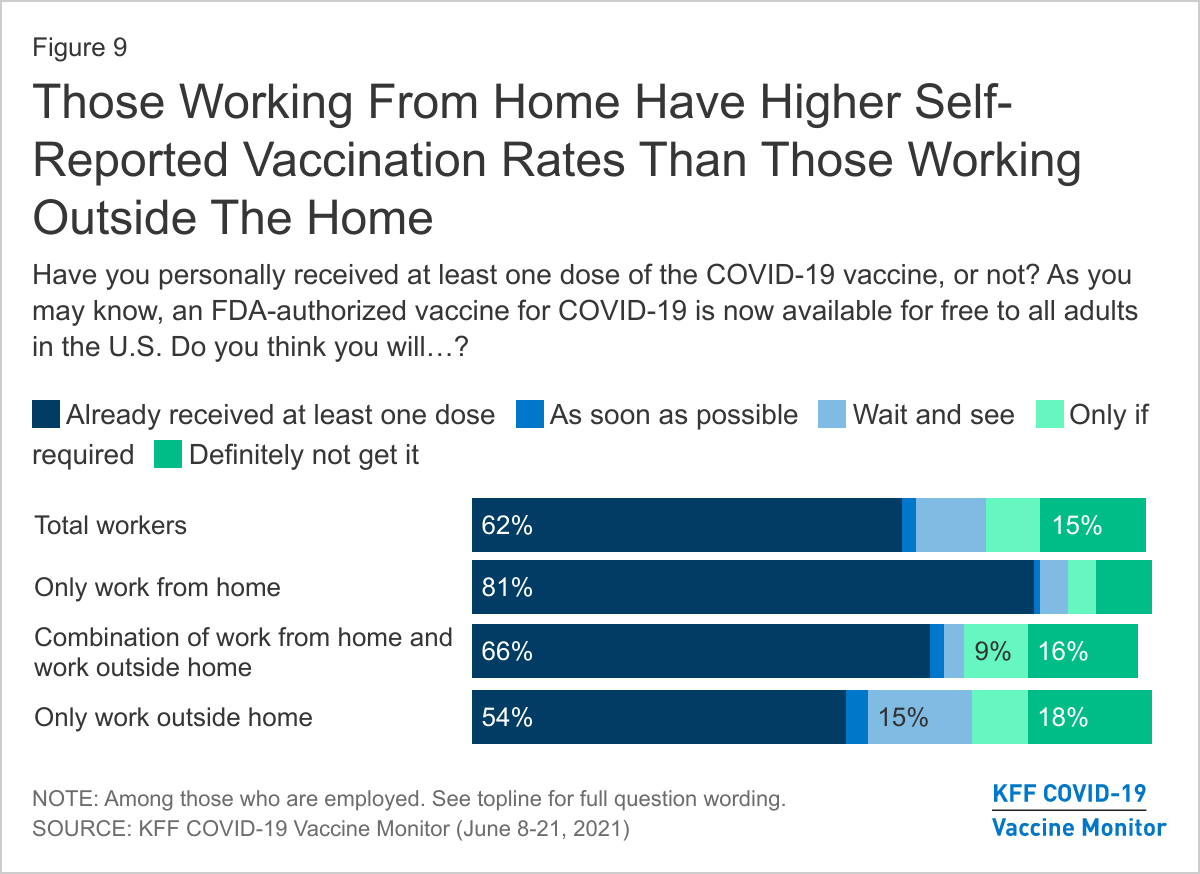
With businesses reopening across the country and many workplaces returning to in-person work, employers have a large role to play in providing worker with information about COVID-19 vaccines, encouraging them to get vaccinated, and making sure they can get vaccinated without losing pay. Among adults who are employed at least part-time, most (61%) now say they are working from a location outside their home, while one in five (19%) say they work solely from their home and another one in five (21%) say they work partially at home and partially at another location.
Although they may be at higher risk for exposure to coronavirus, those who work solely (54%) or partially (66%) outside their home are less likely to report receiving a COVID-19 vaccine compared to those who work solely from home (81%). Compared to those working from home, a larger share of those working solely outside their home say they will “wait and see” before getting vaccinated (15% vs. 4%) or that they will “definitely not” get the vaccine (18% vs. 8%). These differences are likely driven by other demographic factors, as those who work at home are more likely to be college-educated and to identify as Democrats compared to those who work outside their homes.
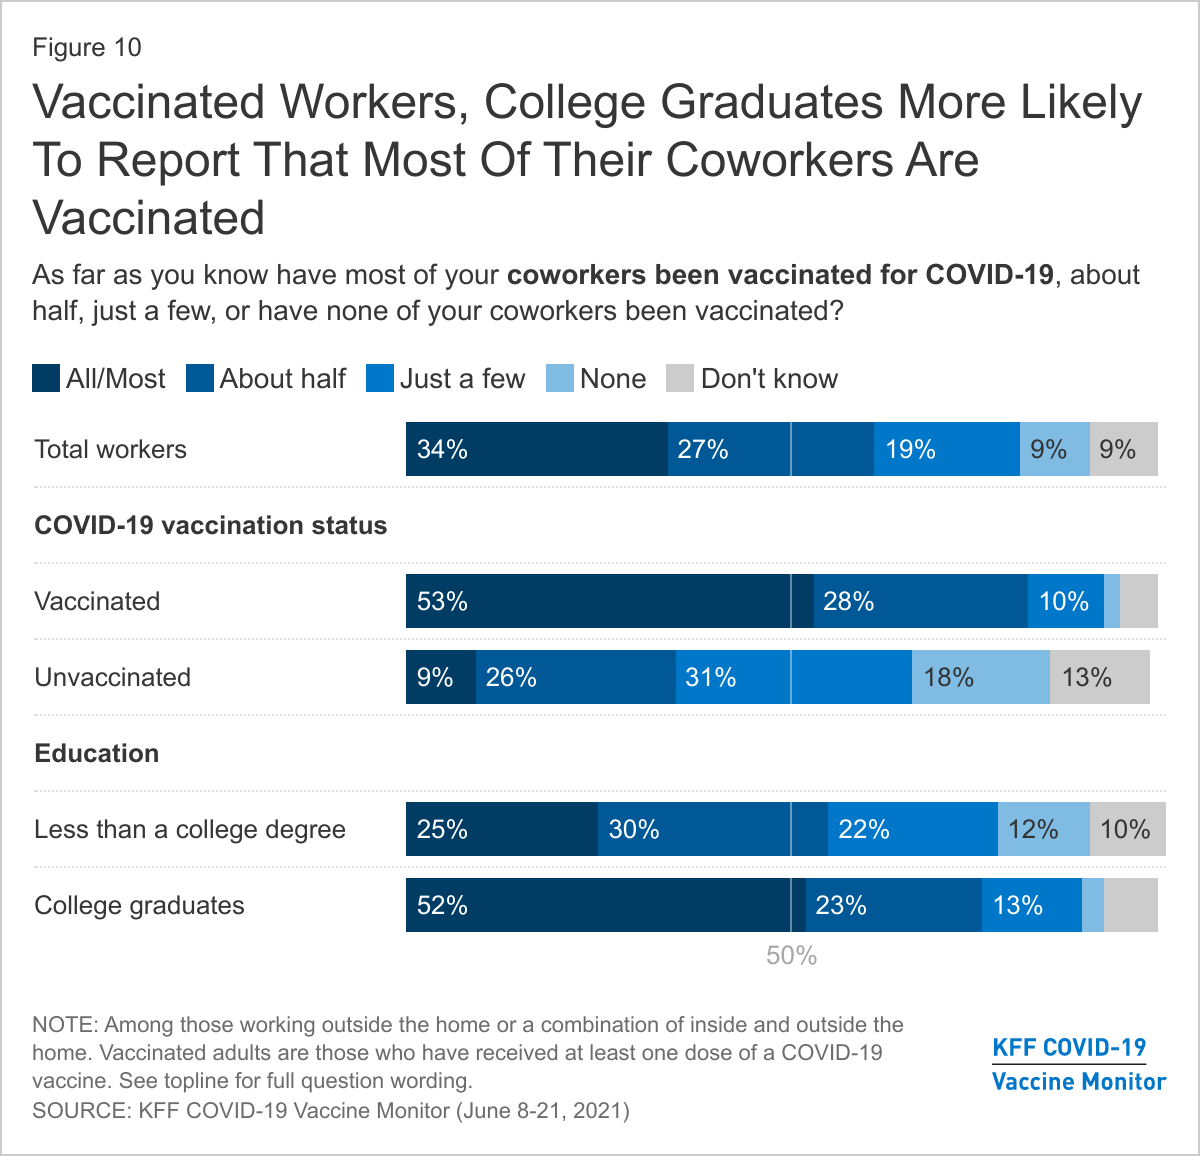
Just as many households are homogeneous in their vaccination status, the latest Vaccine Monitor finds that many workplaces are as well. Among those who work at least partially outside their home, one-third (34%) say that all or most of their coworkers have been vaccinated for COVID-19 and another quarter (27%) say about half of their coworkers have been vaccinated. Notably, about half (53%) of those who have been vaccinated themselves say that all or most of their coworkers have been vaccinated while a similar share (49%) of unvaccinated workers say just a few or none of their coworkers have received a vaccine. There is also a large education divide among those working outside the home, with about half (52%) of workers who are college graduates saying all or most of their coworkers have been vaccinated compared to one-quarter of workers without a college degree. Notably, about one in ten of those working outside their home overall say they don’t know what share of their coworkers have received a COVID-19 vaccine.
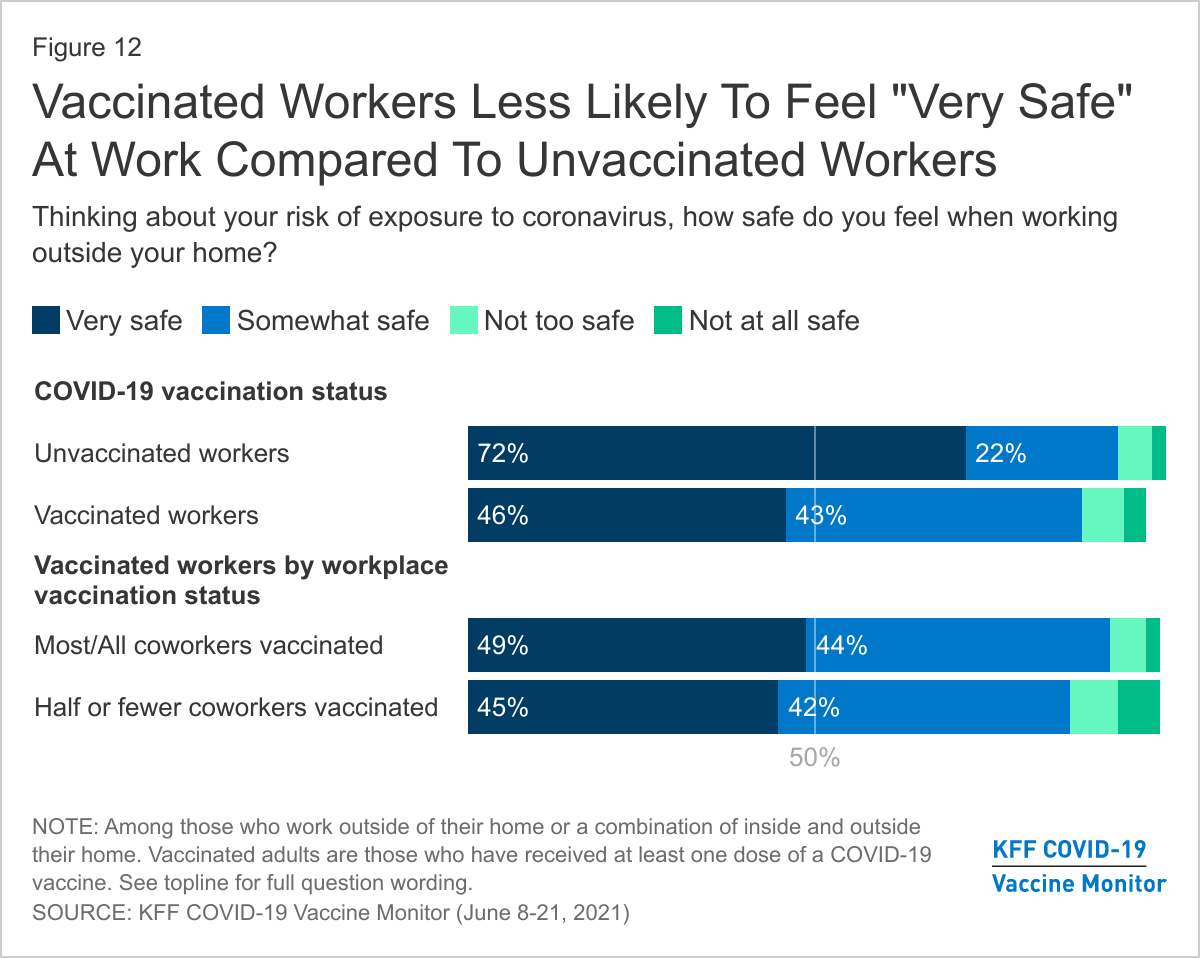
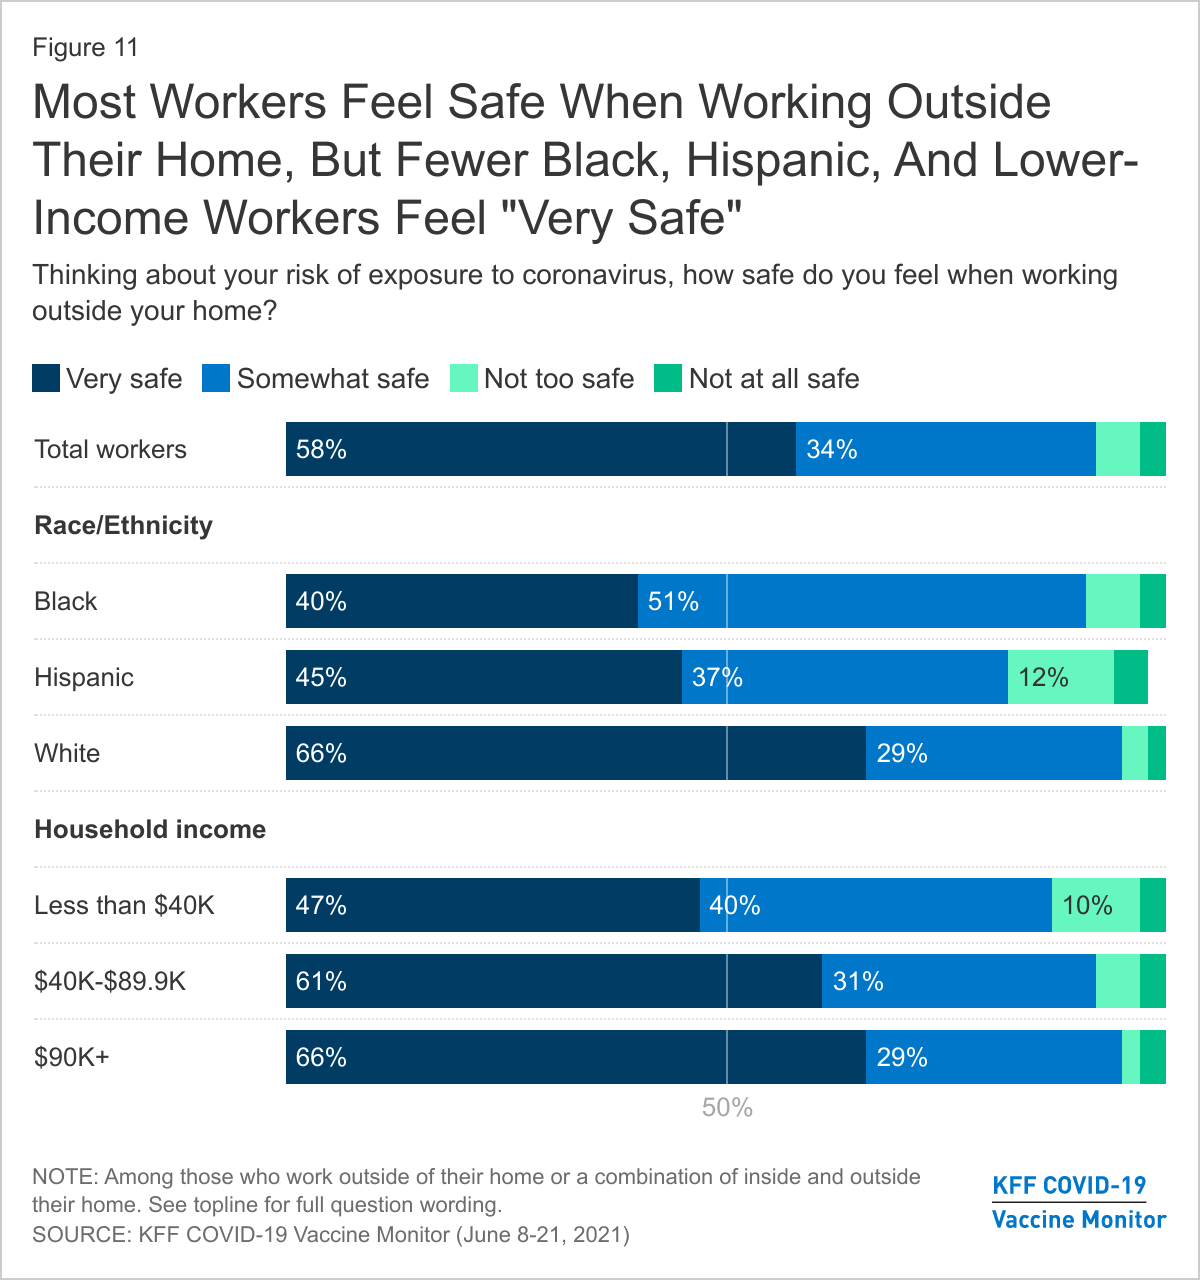
Despite mixed workplace vaccination status, the vast majority of workers say they feel at least somewhat safe when it comes to their risk of exposure to coronavirus when working outside their home, including 58% who say they feel “very” safe and 34% who feel “somewhat” safe. Black and Hispanic workers are less likely to report feeling “very” safe working outside their home compared to White workers (40%, 45%, and 66%, respectively), as are lower-income workers compared to those with higher incomes (47% of those with household incomes less than $40,000 vs. 66% of those with incomes of $90,000 or more).
Among those who work outside their homes, a larger share of those who have not received a COVID-19 vaccine says they feel “very safe” compared to those who have received a vaccine (72% vs. 46%). This likely reflects the fact that those who have chosen not to get a COVID-19 vaccine are less likely to view the virus as a threat to their personal health. Among those who have been vaccinated, feelings of safety from exposure to the virus do not appear to be correlated with beliefs about coworkers’ vaccination status; about half of vaccinated workers say they feel “very safe” among those who say all or most of their coworkers have been vaccinated and among those who say half or fewer of their coworkers have gotten a vaccine.
The Role Of Employers In Encouraging Vaccinations
Among the different roles employers might play, we find the most common are providing information and encouraging vaccination. Seven in ten of those who work for an employer say their employer has provided them with information about how to get a COVID-19 vaccine, and two-thirds (65%) say their employer has encouraged employees to get vaccinated. A larger share of workers with college degrees compared to those without college degrees say their employer has provided information (77% vs. 66%) or encouraged employees to get vaccinated (78% vs. 57%). Notably, 72% say they trust their employer a great deal or a fair amount to provide reliable information about the vaccines.
Half of workers overall say their say their employer provides them with paid time off to get a COVID-19 vaccine and recover from any side effects, though this share is lower among Black workers (38%), those without college degrees (41%), and those with household incomes less than $40,000 annually (41%). Among workers who don’t have health insurance, just one-third (33%) say their employer provides paid time off for vaccine administration and side effects.
About one in ten workers say their employer offered a cash bonus or other incentive to employees who get vaccinated (12%) or required them to get a COVID-19 vaccine (9%). The share saying their employer offered cash or another incentive rises to 22% among Black employees and 16% among those in households earning between $40,000 and $89,999 annually. One in six workers with household incomes under $40,000 (17%) say their worker required them to get vaccinated compared to smaller shares of those in middle- and higher-income households (4% and 7%, respectively).
| Table 2: Employer Provided Vaccination Incentives By Race, Education, Income And Insurance Status |
| Percent of employed adults whose employer has done each of the following: | Total employed | Race/Ethnicity | Education | Household Income | Insurance status |
| Black | Hispanic | White | Less than college | College graduate | Less than $40K | $40K-$89.9K | $90K+ | Insured under age 65 | Uninsured under age 65 |
| Provided them with information about how to get a COVID-19 vaccine | 70% | 67% | 67% | 70% | 66% | 77% | 69% | 71% | 72% | 70% | 57% |
| Encouraged employees to get vaccinated | 65 | 68 | 68 | 64 | 57 | 78 | 60 | 66 | 69 | 65 | 58 |
| Provided them with paid time off to get the vaccine or to recover from any side effects | 50 | 38 | 51 | 49 | 41 | 64 | 41 | 47 | 63 | 51 | 33 |
| Offered a cash bonus or another type of incentive to employees who get vaccinated | 12 | 22 | 11 | 11 | 13 | 11 | 12 | 16 | 7 | 11 | 15 |
| Required them to get a COVID-19 vaccine | 9 | 13 | 9 | 7 | 8 | 11 | 17 | 4 | 7 | 9 | 9 |
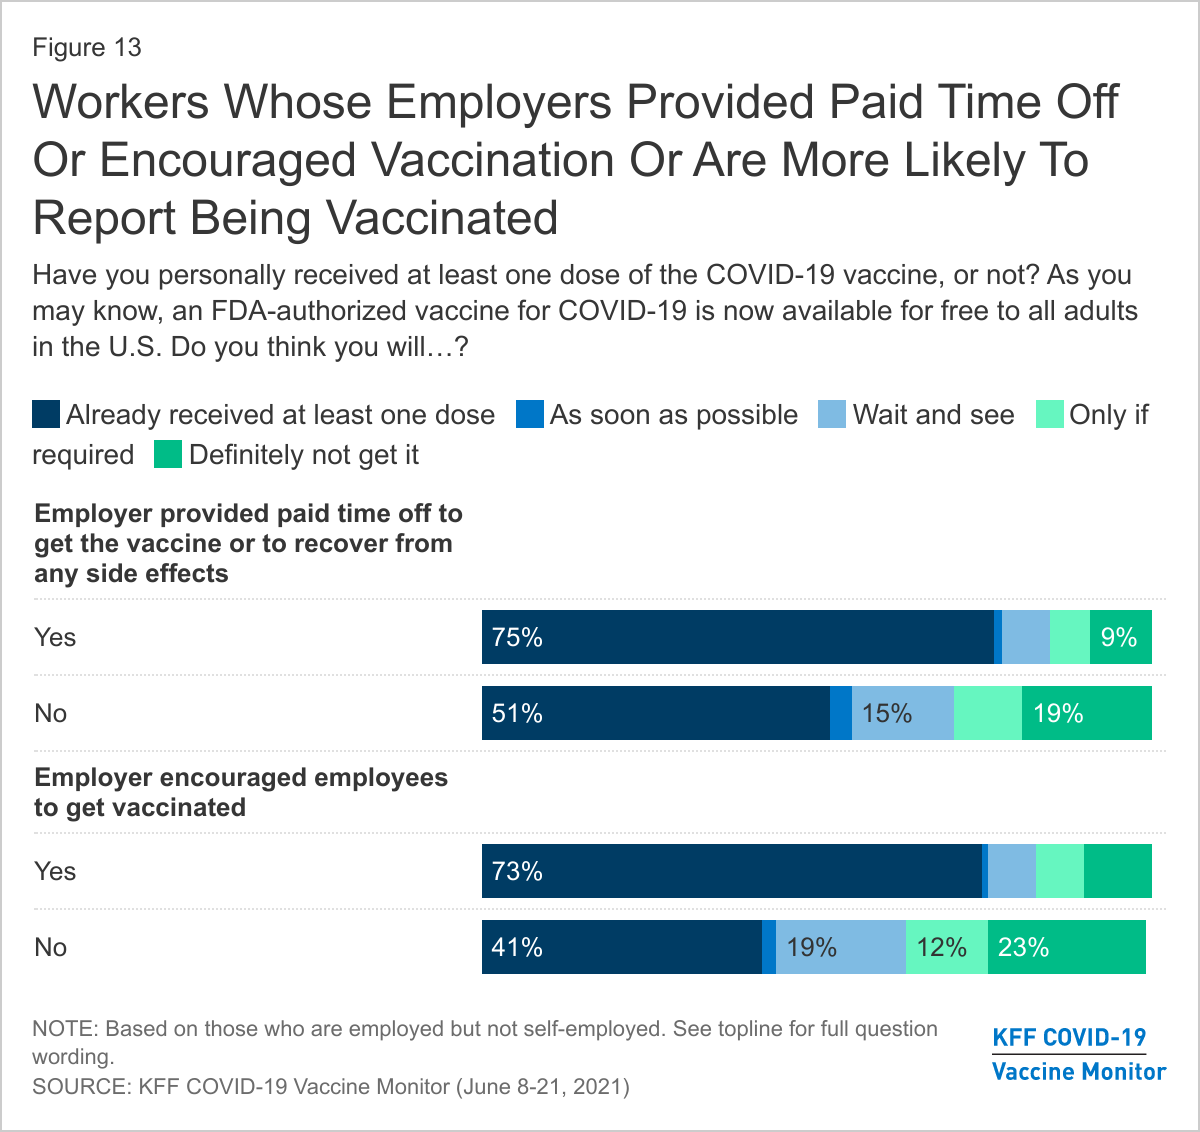
Workers who say their employer provided them with paid time off to get a COVID-19 vaccine and recover from side effects and those who say their employer encouraged vaccination are more likely to report receiving a COVID-19 vaccine compared to those whose employers have not taken these actions. Three-quarters of those who got paid time off say they’ve received at least one dose of the vaccine compared to about half (51%) of those who did not have this benefit. Similarly, 73% of those who say their employer encouraged vaccination report getting at least one dose compared to four in ten (41%) of those whose employer did not.
At least part of this difference may be due to differences in other demographic characteristics of those whose employers engaged in these activities compared to those who did not. However, using a statistical technique called multiple logistic regression, we find that employees who are encouraged by their employers to get vaccinated, or who are provided paid time off are more likely to get vaccinated, even after controlling for age, race, ethnicity, education, income, party identification, and other demographic characteristics that may impact vaccination uptake. This suggests that more employers encouraging vaccination and offering paid time off could lead to higher vaccination rates among employed adults in the U.S.
Views on Employer Requirements and Incentives
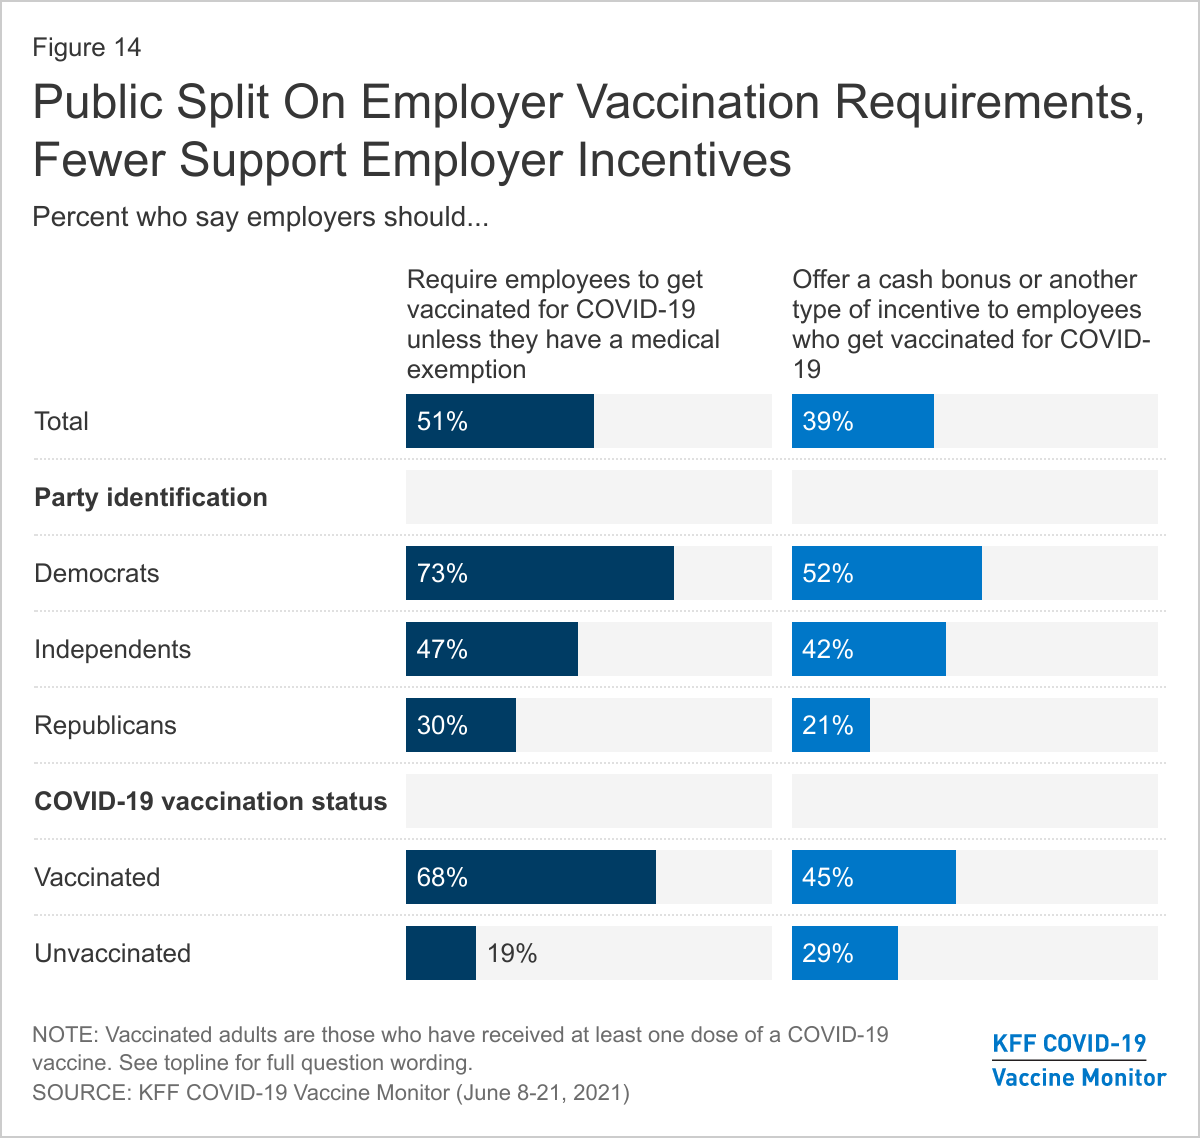
The public overall is divided in their views of employer requirements for COVID-19 vaccination, with about half (51%) saying employers should require employees to get vaccinated unless they have a medical exemption and a similar share (46%) saying they should not. Somewhat fewer support employers offering financial incentives, with four in ten (39%) saying employers should offer cash bonuses and other incentives to employees who get vaccinated and a majority (57%) saying employers should not do this.
On each of these questions, views diverge largely along partisan lines and by vaccination status. Three-quarters of Democrats (73%) support employers requiring COVID-19 vaccination compared to about half of independents (47%) and three in ten Republicans. Similarly, Democrats (52%) and independents (42%) are more likely than Republicans (21%) to say employers should offer incentives for vaccinated employees. Vaccinated adults are also more likely than unvaccinated adults to support employer requirements (68% vs. 19%) and financial incentives (45% vs. 29%).
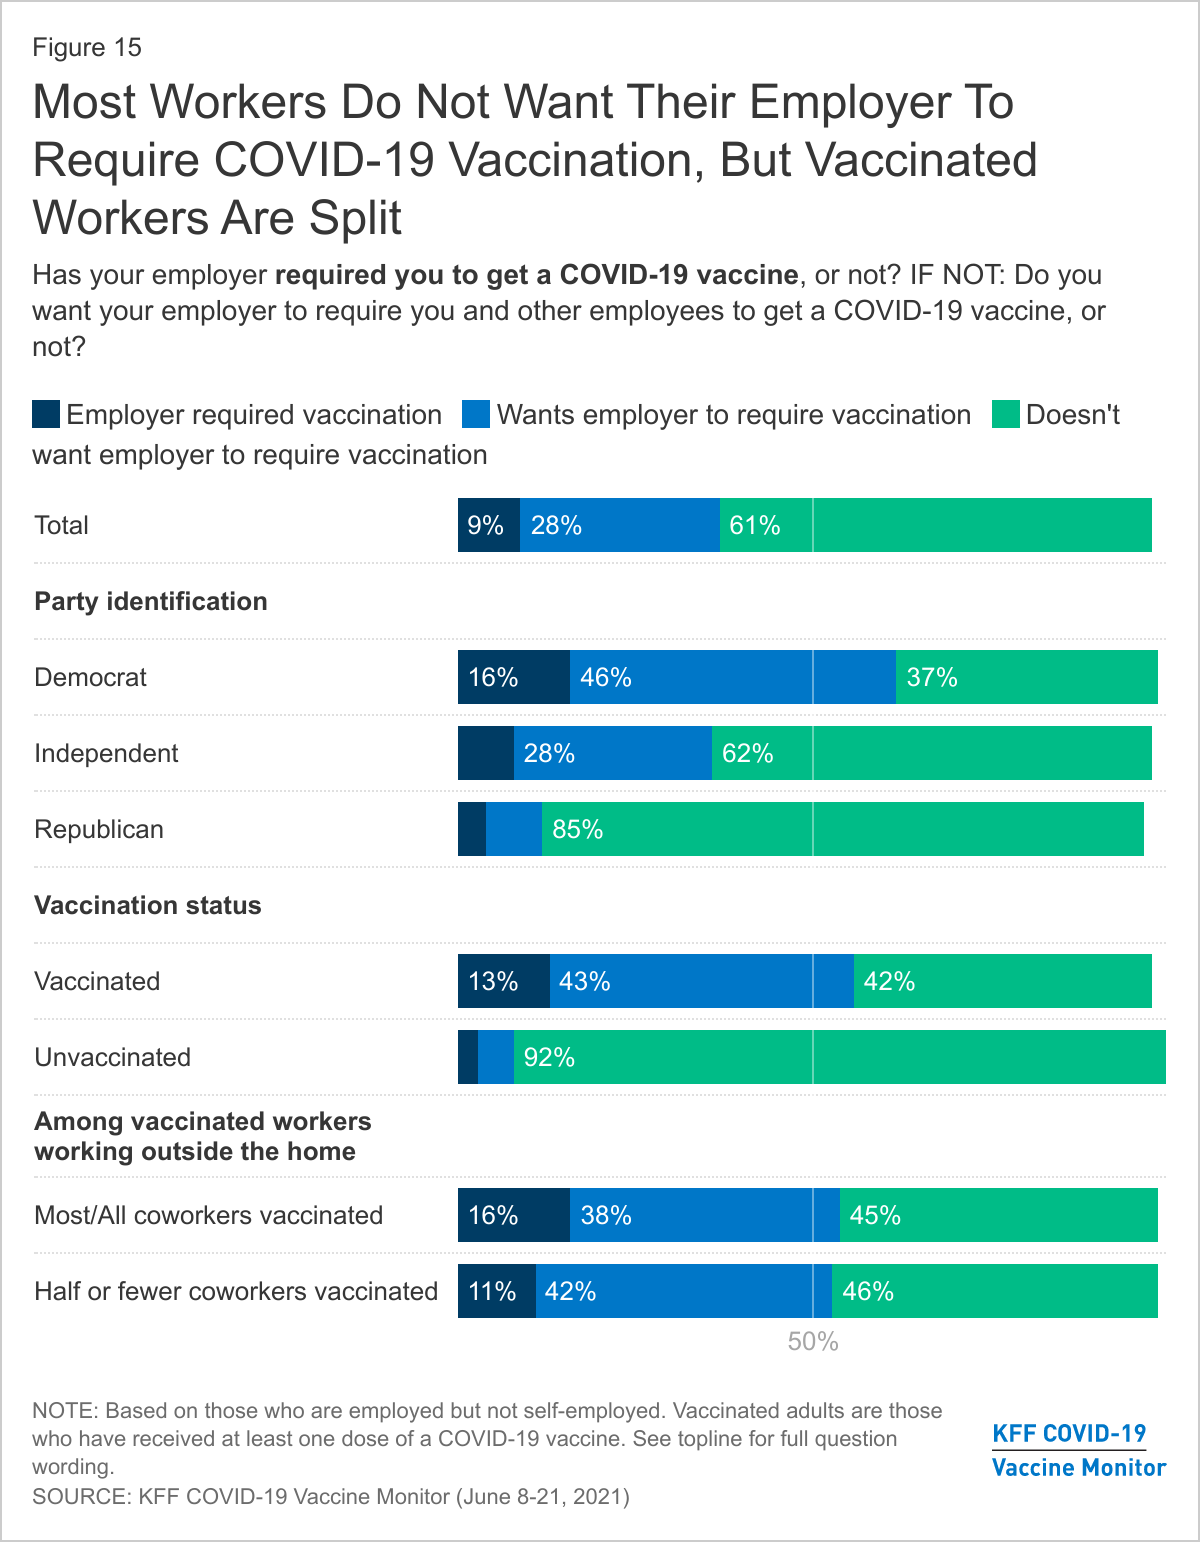
Although about half the public overall supports employers requiring workers to get vaccinated, most of those who work for an employer say they do not want their own employer to require employees to get vaccinated (61%). About three in ten (28%) say they want their employer to require vaccination and another 9% say their employer already requires it. As among the public, views among workers diverge by partisanship and vaccination status. The vast majority of Republican workers (85%) and six in ten of those who identify as independents (62%) say they do not want their employer to require vaccination, while over half of Democrats say they want their employer to require it (46%) or that they already do (16%).
Not surprisingly, nine in ten (92%) unvaccinated workers don’t want their employer to require them and other employees to get a COVID-19 vaccine. When unvaccinated workers are asked what they would do if their employer required them to get vaccinated to continue working, four in ten (42%) say they would get the vaccine and half say they would leave their job.
Vaccinated workers are split on the question of employer requirements, with roughly equal shares saying they do (43%) and do not (42%) want their employer to require vaccination and 13% saying it is already required. Notably, vaccinated workers’ views on employer vaccination requirements are similar regardless of whether they report working in a mostly-vaccinated or a mostly-unvaccinated workplace.
Views On COVID-19 Vaccines For Children And School Requirements
Parents’ Intentions for Vaccinating Children
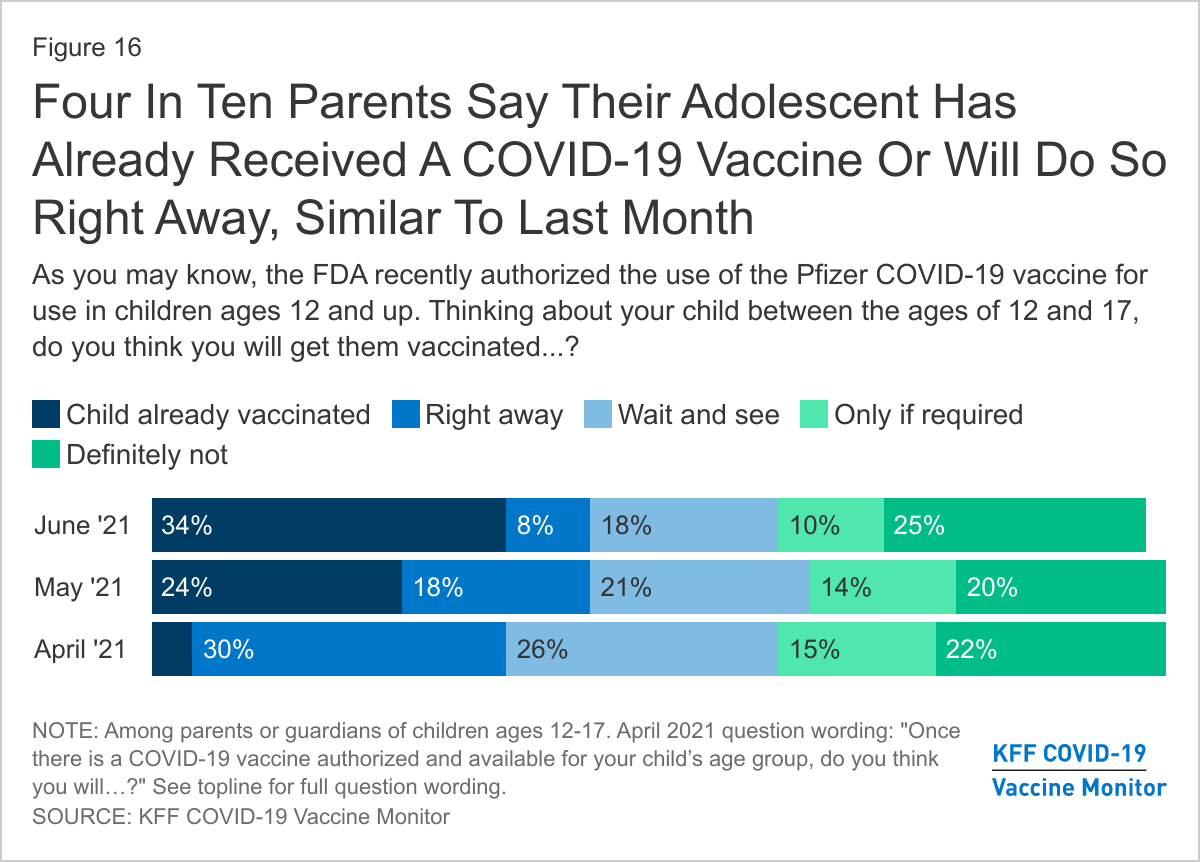
About a month and a half after the FDA authorized the Pfizer COVID-19 vaccine for use in children ages 12 and older, the latest Monitor finds about four in ten (42%) parents of children ages 12-17 say their child has already received at least one dose of the vaccine (34%) or that they will get them vaccinated right away (8%). About one in five parents of adolescents say they will “wait a while to see how it is working” before getting their child vaccinated (18%), while one in ten say they will get their child vaccinated only if their school requires it and an additional one in four say they will “definitely not” get their 12-17 year-old vaccinated.
Since May, the share of parents who say their 12-17 year old child has been vaccinated has risen by about ten percentage points while the share who say they will get their child vaccinated “right away” has fallen by a similar amount. From May to June, the shares of parents who say they want to “wait a while to see how it is working,” will only get their child vaccinated if their school requires it, or will “definitely not” get their child vaccinated has remained about the same.
When those who say they want to wait and see before getting their 12-17 year-old child vaccinated are asked how long they think they will wait, responses are split. Seven percent of all parents of children ages 12-17 say they will wait three months or less, 4% say they will wait between four months and one year, and 7% say they plan to wait longer than one year to vaccinate their child.
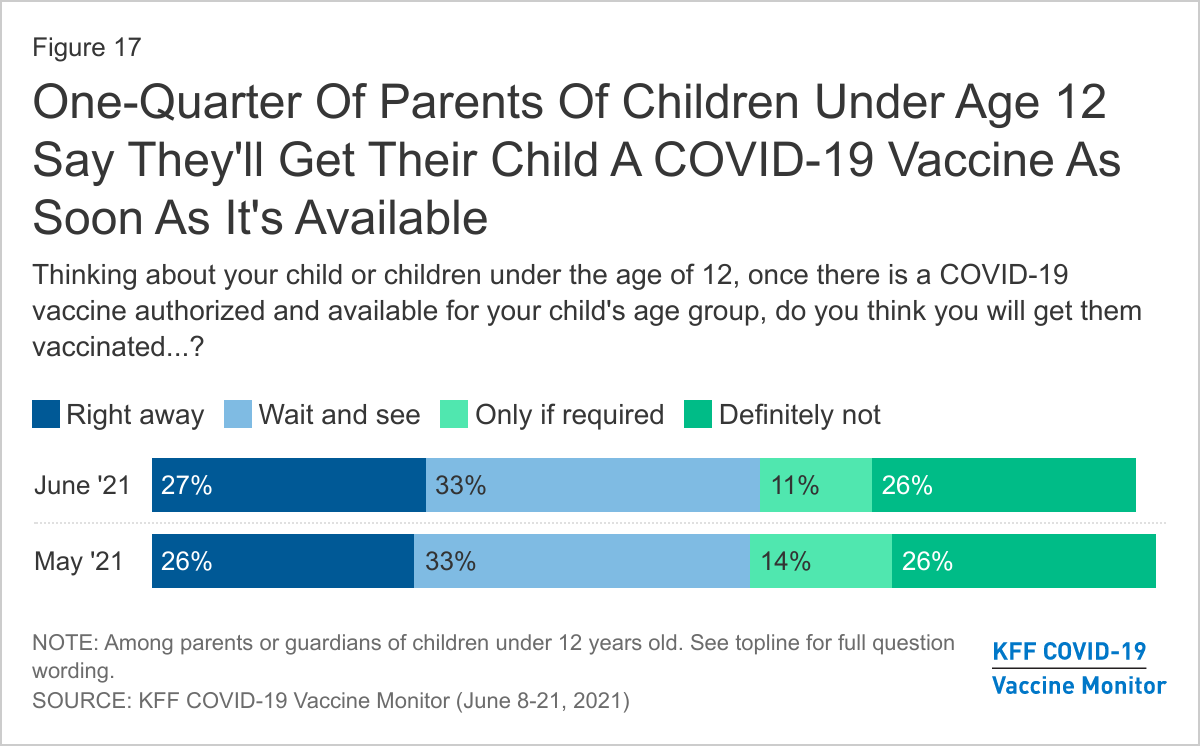
Parents of younger children, for whom a COVID-19 vaccine is not yet authorized, remain more cautious in their approach to the vaccine. About one-quarter (27%) say they will get their child under age 12 vaccinated as soon as a vaccine is authorized for their age group, while one-third intend to wait a while to see how the vaccine is working. An additional 11% say they will vaccinate their young child only if school requires it and one-quarter (26%) say they will definitely not get them vaccinated. These shares are virtually unchanged from when this was first asked in May 2021.
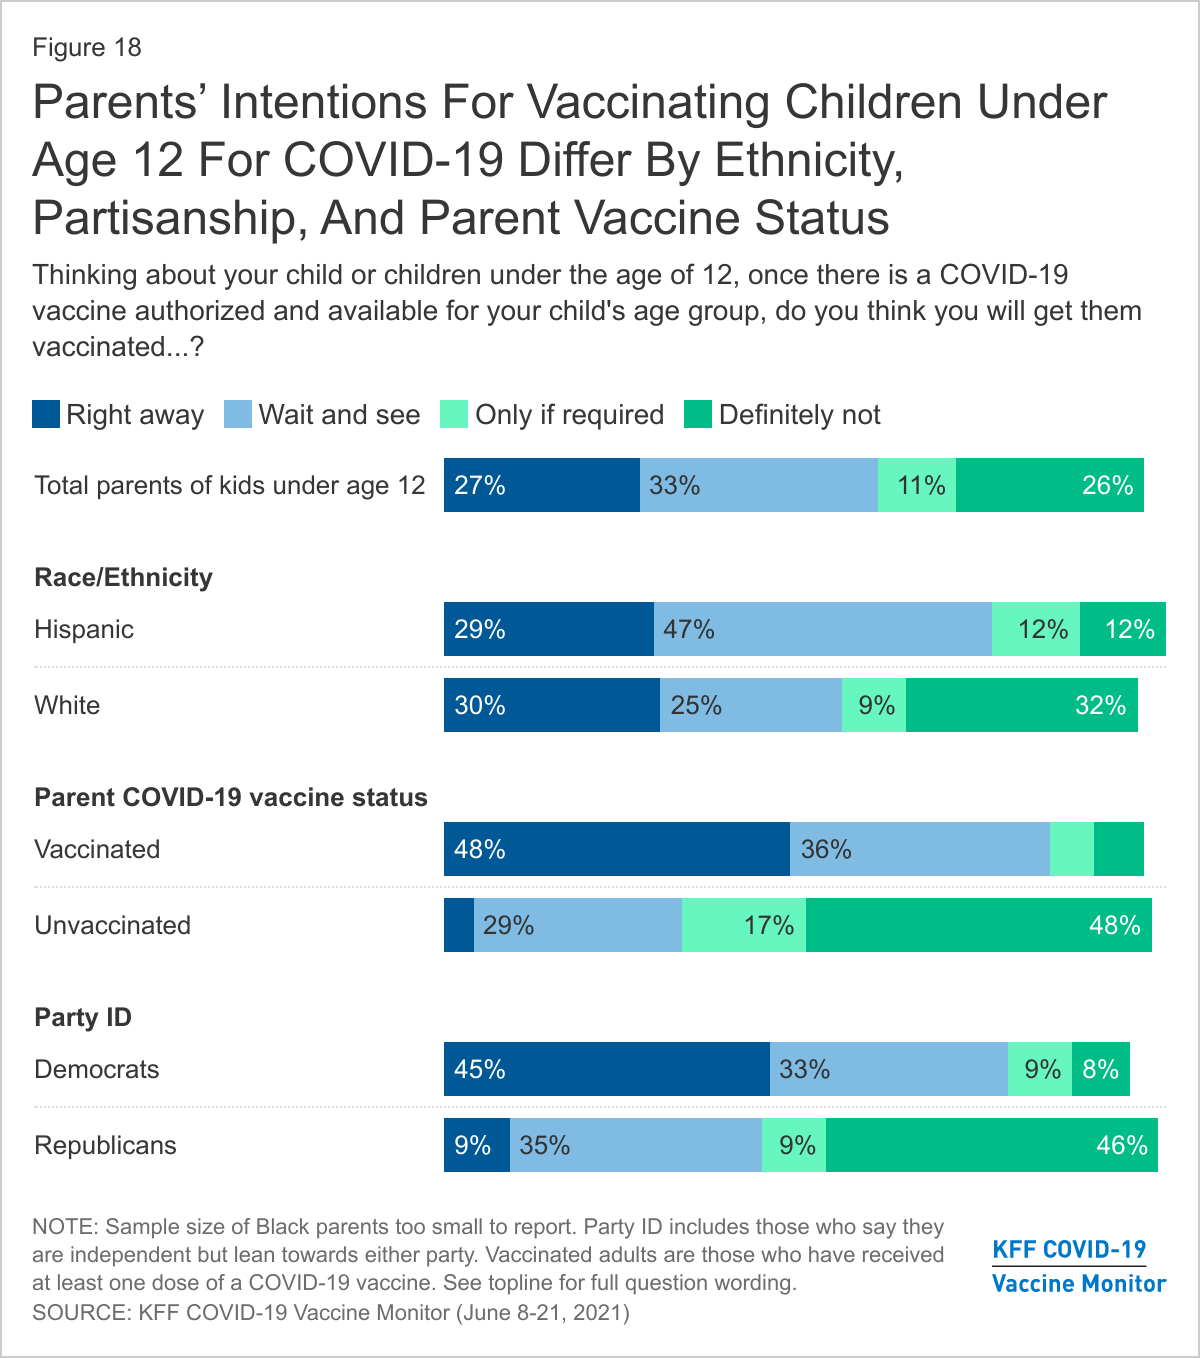
Among parents of younger children, intentions for vaccinating children vary by parents’ own vaccination status, their ethnicity, and party identification. Among parents of children under age 12 who have received a vaccine themselves, about half (48%) say they will get their younger child a vaccine as soon as one is authorized for their age group compared to just 4% of parents who have not received a vaccine. By contrast, nearly half (48%) of unvaccinated parents say they will “definitely not” get their child under age 12 vaccinated compared to 7% of parents who have received the vaccine themselves. A similar pattern emerges by partisanship, as nearly half (45%) of Democrats and Democratic-leaning parents of children under age 12 say they will get their child vaccinated “right away,” and the same proportion (46%) of Republicans and Republican-leaning independents say they will “definitely not” get their young child vaccinated. While similar shares of Hispanic and White parents say they will vaccinate their child under age 12 as soon as a vaccine is authorized, a larger share of Hispanic parents than White parents say they will “wait and see” (47% vs. 25%) while a smaller share say they will “definitely not” get the vaccine for their child (12% vs. 32%). (The sample size of Black parents of younger children is too small to report separately.)
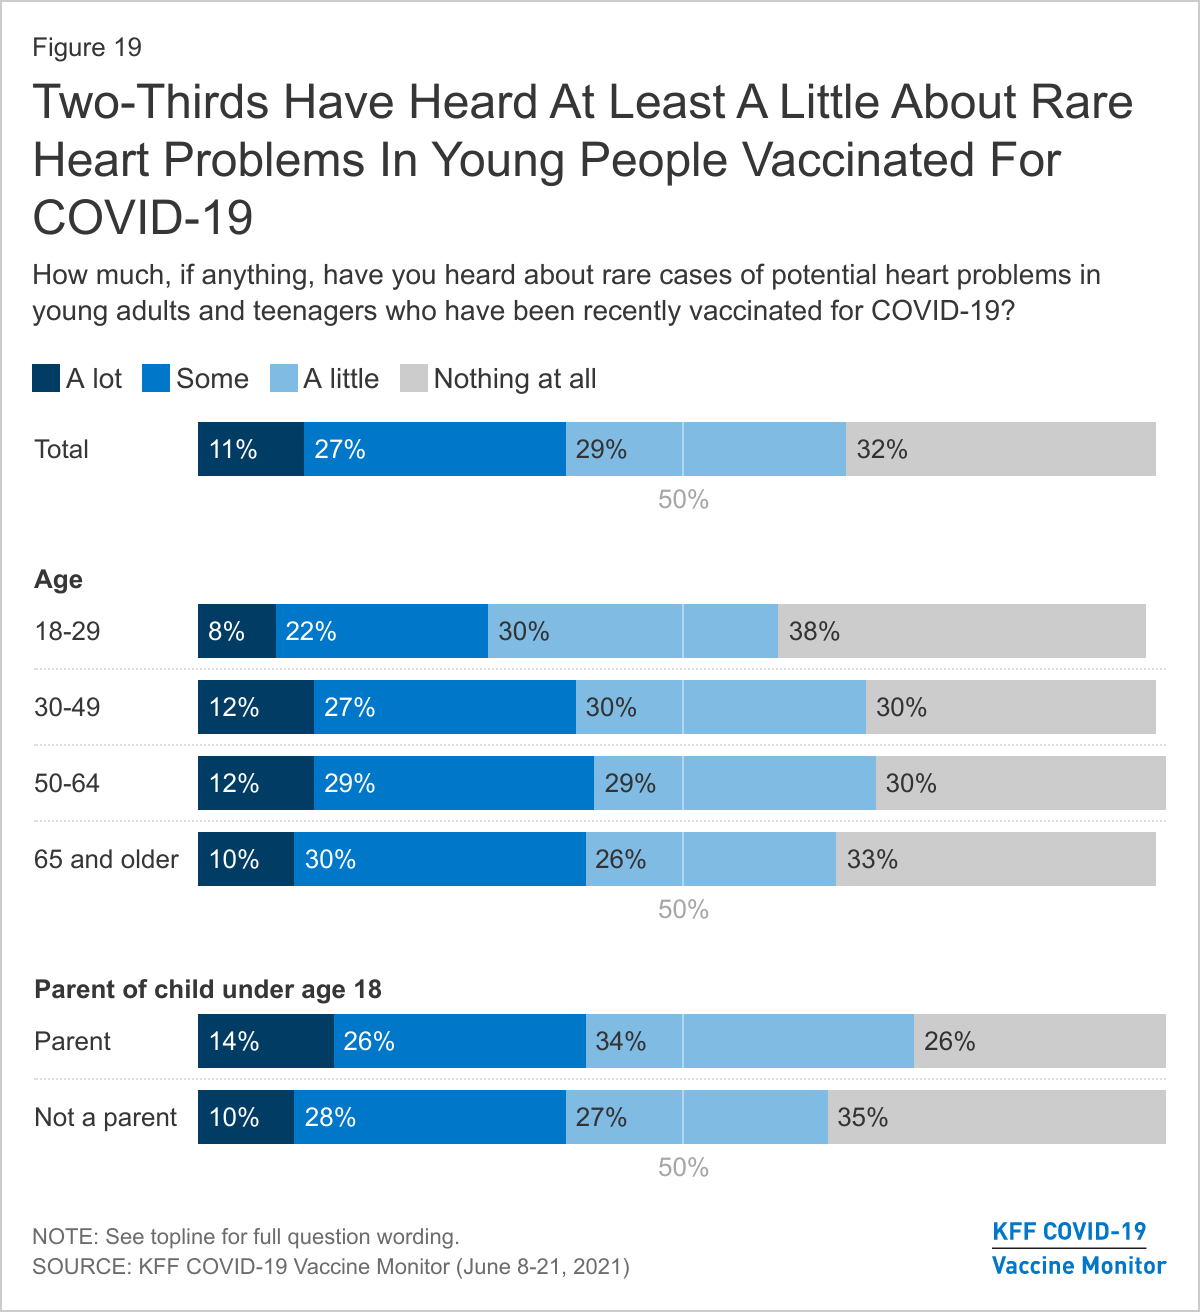
Recently, the CDC announced that it is investigating about 800 cases of rare heart problems and inflammation that have occurred in some teenagers and young adults after they received the Pfizer or Moderna COVID-19 vaccines. The CDC and many physician groups continue to strongly recommend vaccination for young people despite these rare cases.
Two-thirds of adults, rising to 74% of parents, say they have heard at least a little about these rare cases of heart problems in young people related to the vaccine. Among young adults ages 18-29, a somewhat smaller share (60%) say they’ve heard at least a little. Across age groups and parent status, few say they’ve heard “a lot” about these cases.
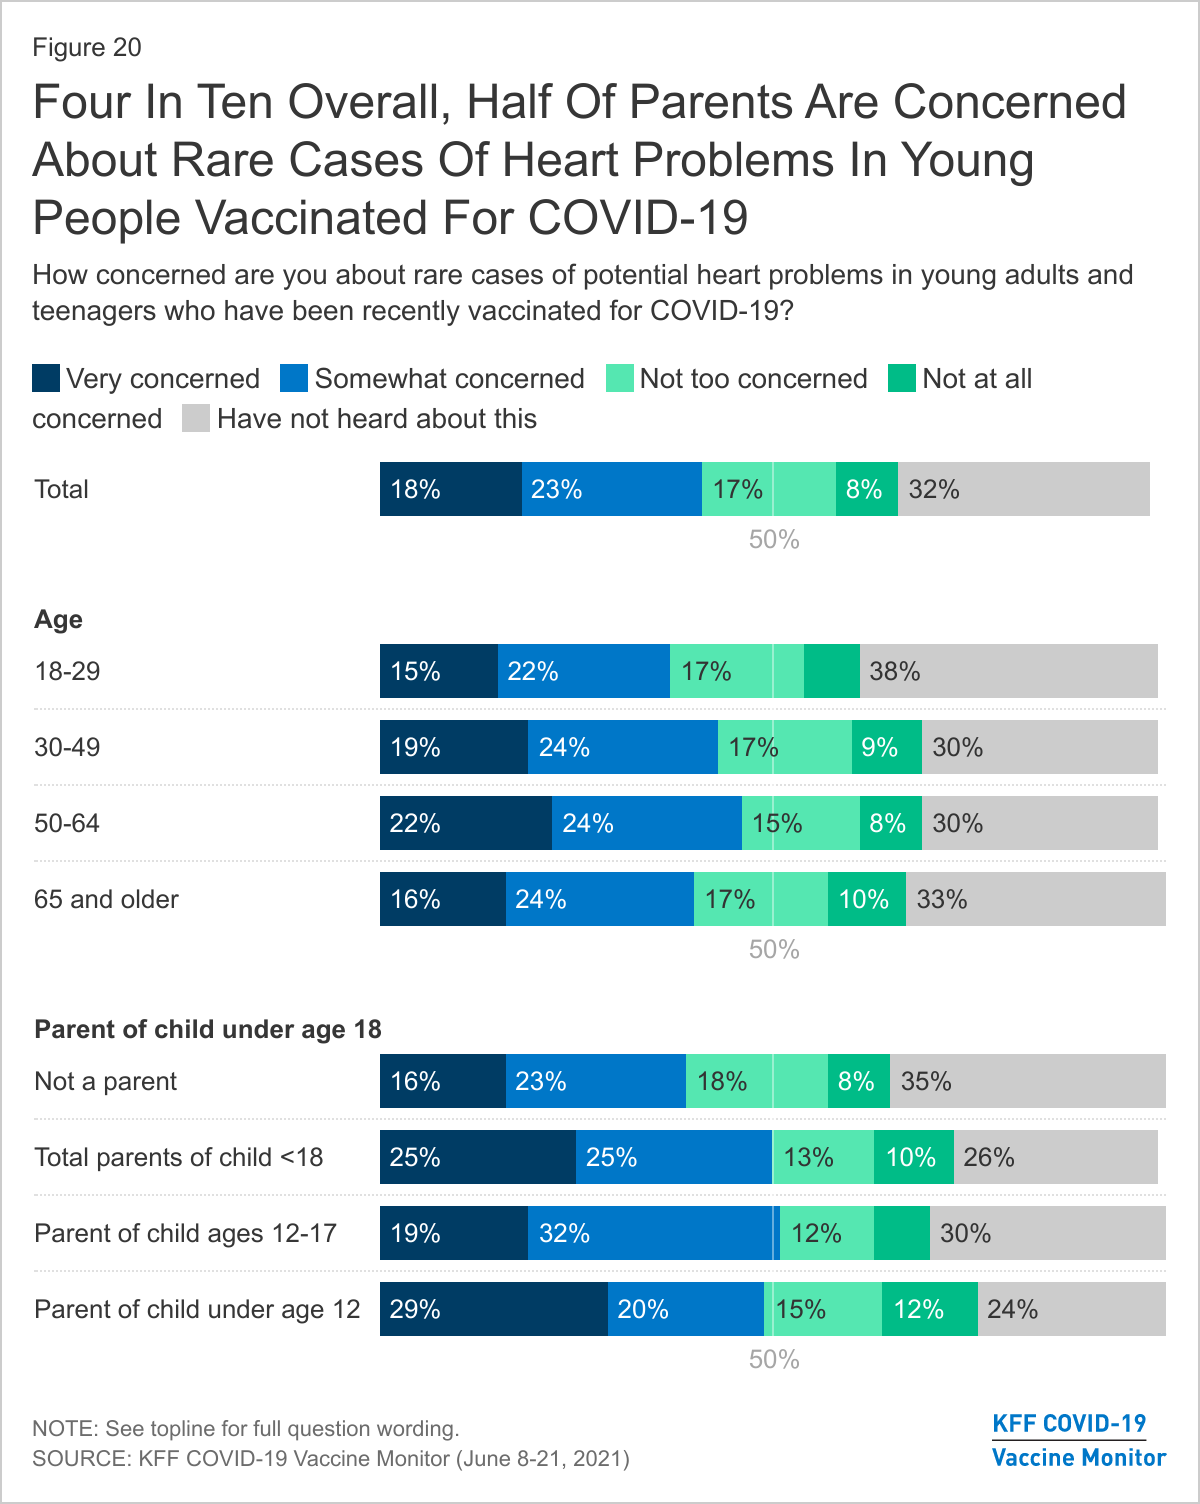
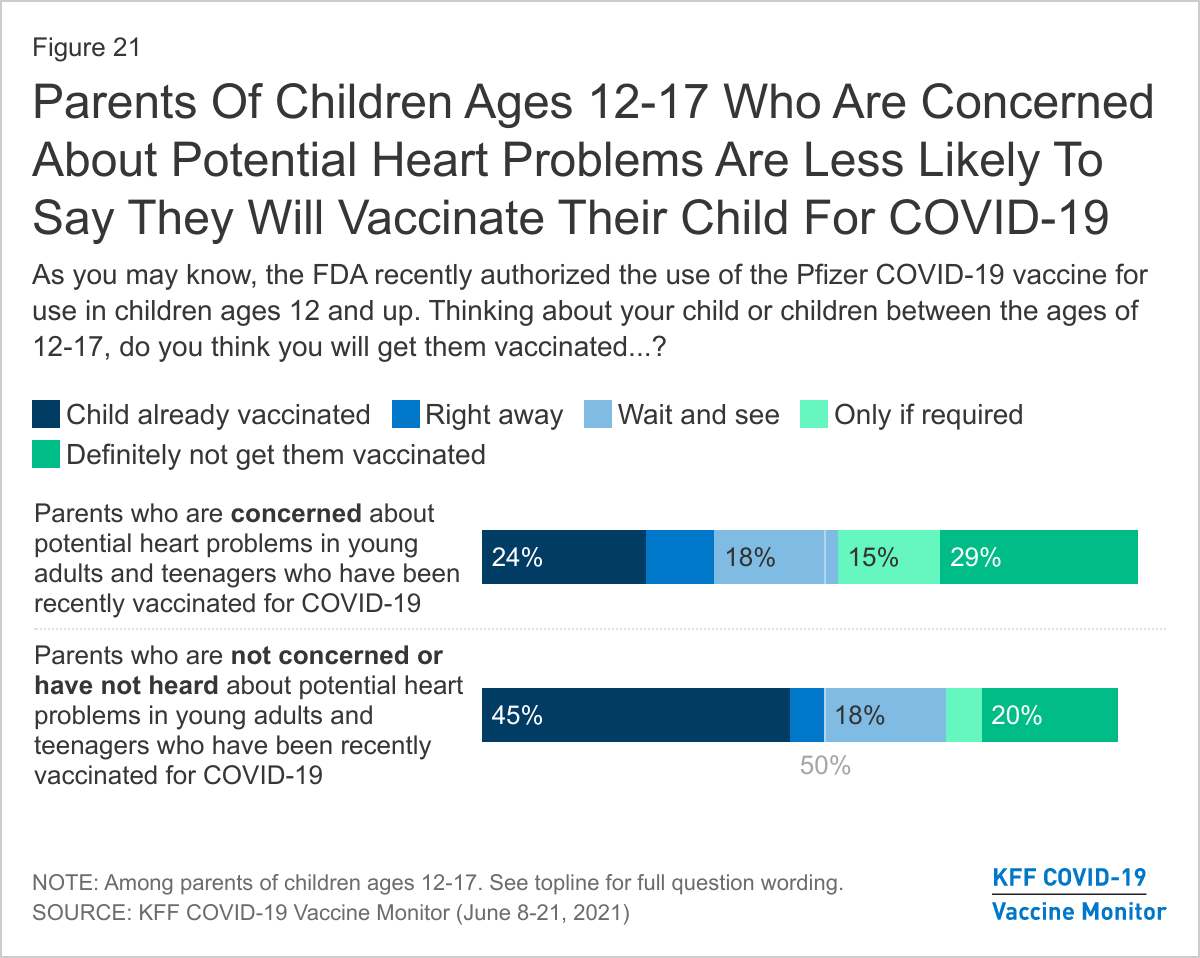
About four in ten adults overall, rising to half of parents of children under age 18, say they have heard about rare cases of heart problems among young adults and teenagers who have been recently vaccinated for COVID-19 and that they are very or somewhat concerned about these cases.
Parents of children ages 12-17 who have heard about and are concerned about heart problems linked to the COVID-19 vaccine in young people are notably more cautious about getting their children vaccinated compared to parents who say they are not concerned or have not heard about these cases. One-quarter (24%) of parents who express concern about these events say their child is already vaccinated compared to 45% of parents who haven’t heard or do not express concern.
Views on Schools Requiring COVID-19 Vaccinations
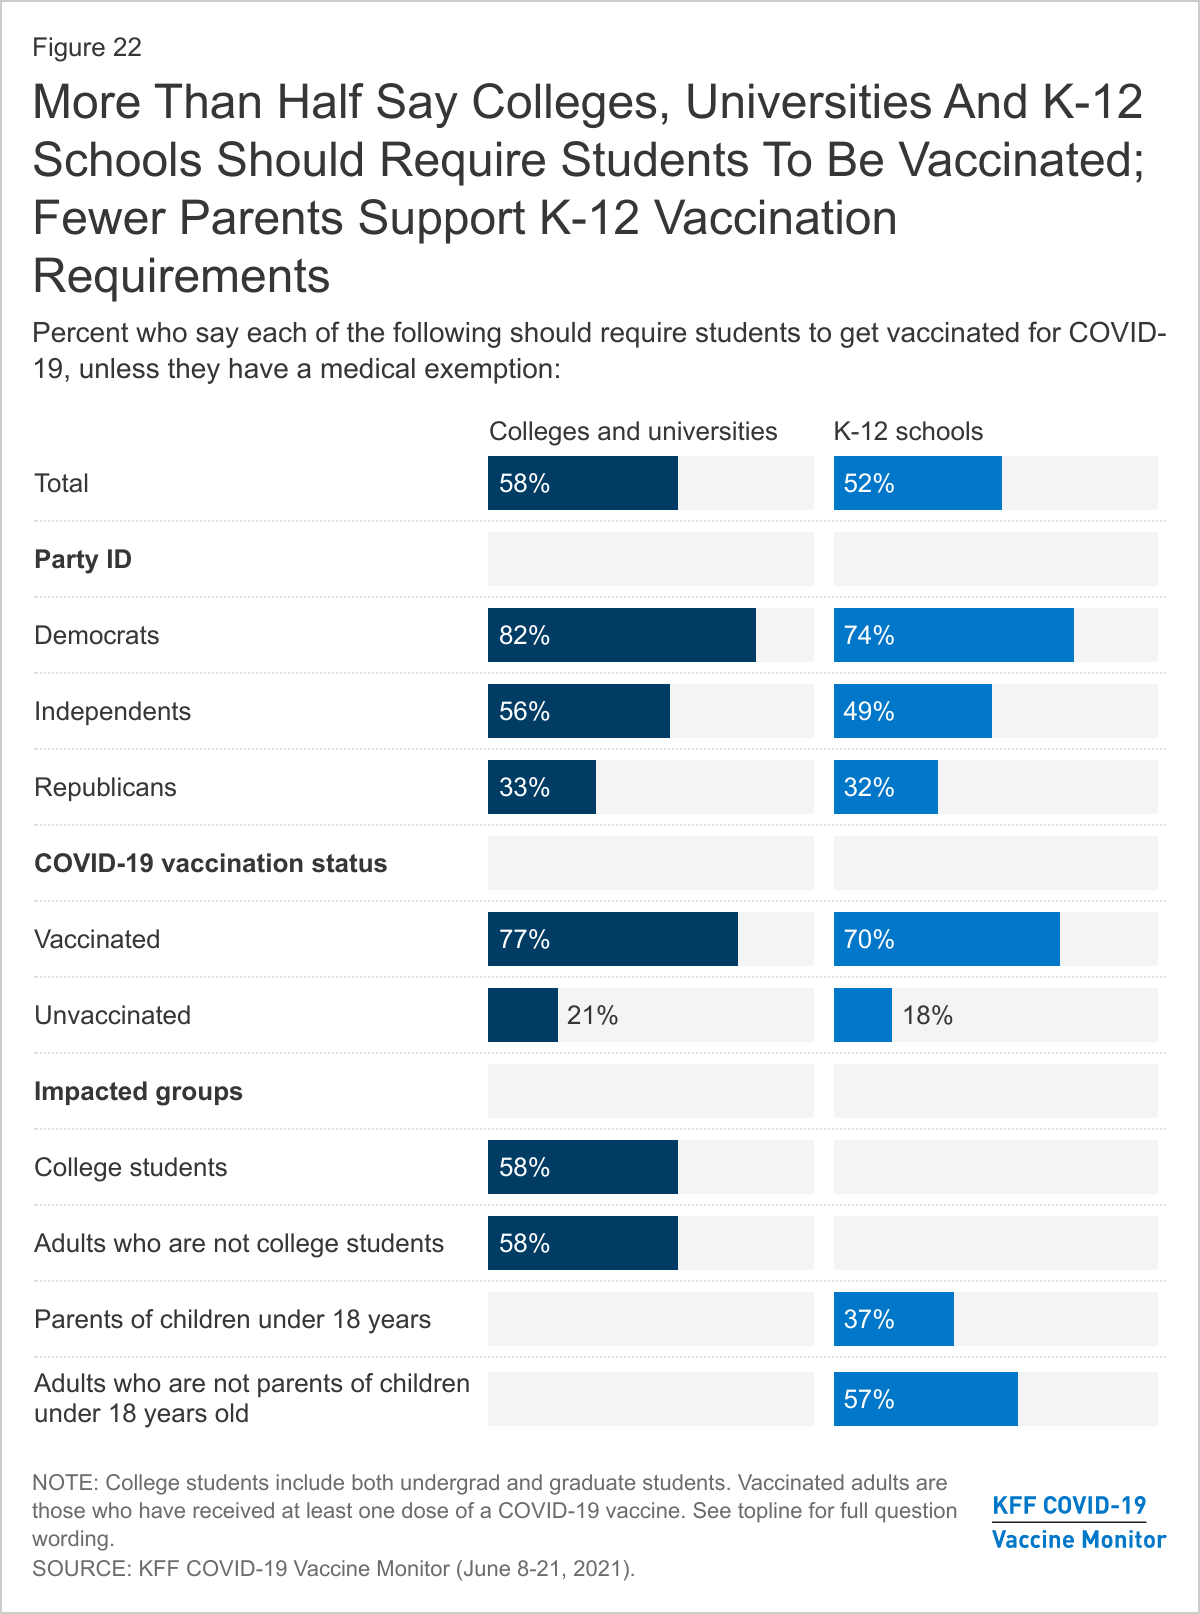
The public overall is somewhat divided on whether schools should require students to get vaccinated for COVID-19. About half the public (52%) say K-12 schools should require students to get vaccinated unless they have a medical exemption while a similar share (45%) say they should not. Notably, parents of children under age 18 are less likely to say K-12 schools should require vaccination compared to adults who do not have minor children (37% vs. 57%). Among parents of children ages 12-17, for whom vaccines are currently authorized, 38% say that K-12 schools should require students to be vaccinated.
Overall public support is somewhat higher for colleges and universities requiring students to be vaccinated; 58% say they should, including 58% of those who are current undergraduate or graduate students at a college or university.
As is the case with employers requiring workers to be vaccinated, views on school requirements diverge largely along partisan lines and by vaccination status. Large majorities of Democrats support vaccination requirements by K-12 schools and universities compared to about half of independents and about a third of Republicans. At least seven in ten vaccinated adults support each type of requirement, compared to about one in five of those who have not been vaccinated.
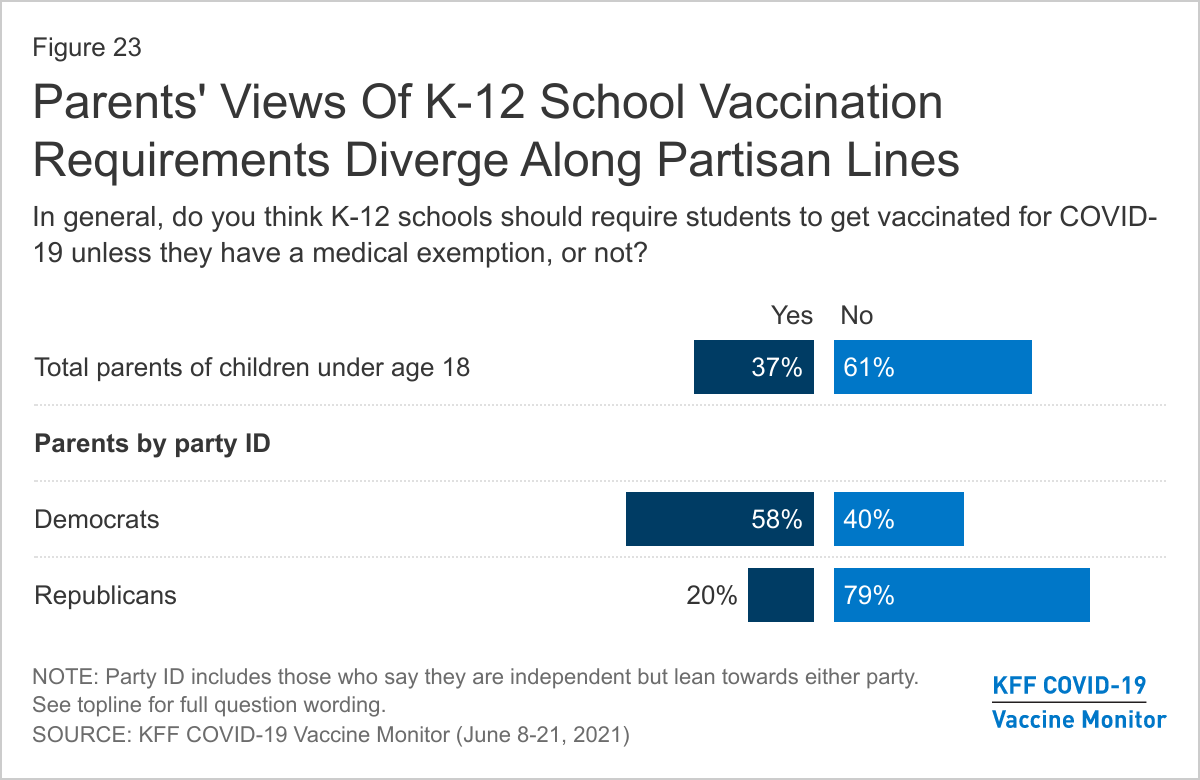
Overall, six in ten (61%) parents of children under 18 say that K-12 schools should not require students to get vaccinated for COVID-19. However, similar to the partisan split among the general public on this question, parents are split on partisan lines. Nearly six in ten (58%) parents who identify as Democrats or lean that way say K-12 schools should require students to be vaccinated, while about eight in ten (79%) Republican-leaning parents say they should not require this.
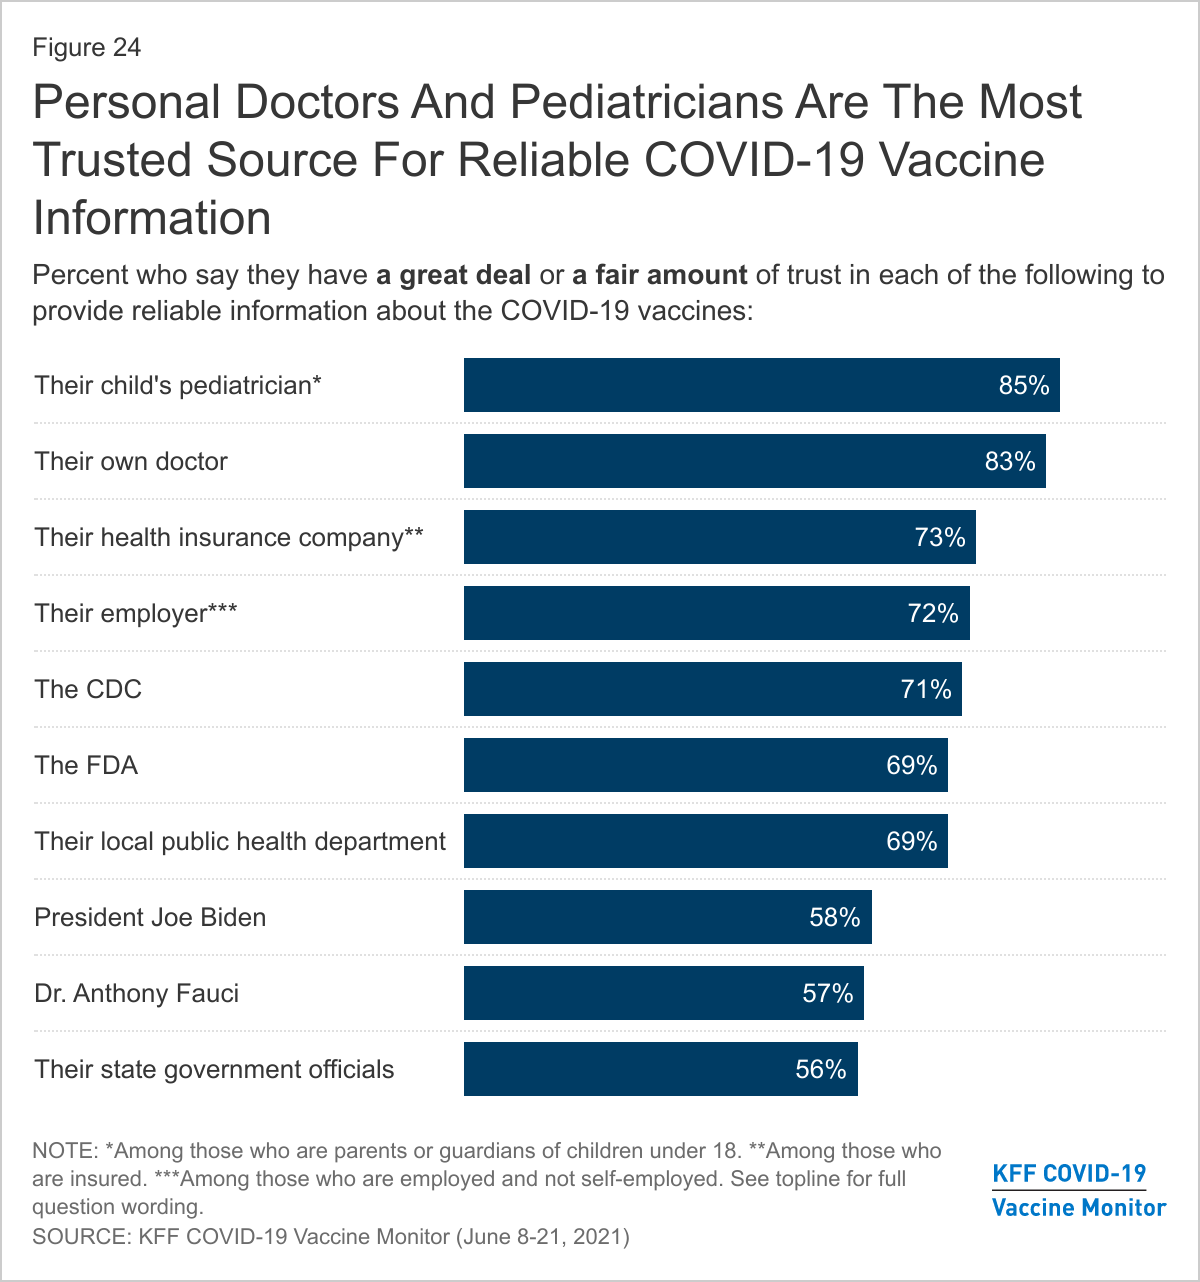
When asked who they trust to provide reliable information about the COVID-19 vaccines, personal doctors, including pediatricians, top the list, with 83% of adults saying they trust their own doctor a great deal or a fair amount and 85% of parents saying the same about their child’s pediatrician. Employers and health insurance companies also garner a high degree of trust, with 72% of workers saying they trust their employer and 73% of those with health insurance saying they trust their insurer to provide reliable vaccine information. About seven in ten each say they trust the CDC (71%), the FDA (69%), and their local public health department (69%). Somewhat fewer, but still more than half, trust President Joe Biden (58%), Dr. Anthony Fauci (57%), and their state government officials (56%). Levels of trust in most government sources of information has remained steady since this question was last asked in December 2020, but trust in Dr. Fauci has fallen somewhat, from 68% to 57%.
Among unvaccinated adults, majorities trust their own doctor, their child’s pediatrician, their health insurance company, and their employer for reliable information about COVID-19 vaccines, while trust in other sources is somewhat lower than among vaccinated adults. About half of unvaccinated adults say they trust the CDC, FDA, and their local health department, while about four in ten trust their state government officials and fewer trust President Biden (32%) or Dr. Fauci (27%). Trust in government sources of information is especially low among those who say they will “definitely not” get the vaccine.
| Table 3: Trust In Sources Of COVID-19 Vaccine Information By Vaccination Status And Intention |
| Percent who say they have a great deal or fair amount of trust in each of the following to provide reliable information about the COVID-19 vaccines: | COVID-19 vaccination status | COVID-19 vaccination intention |
| Total vaccinated | Total unvaccinated | Wait and see | Definitely not |
| Their child’s pediatrician* | 95% | 73% | - | - |
| Their own doctor | 89 | 69 | 78% | 60% |
| Their health insurance company** | 79 | 60 | 75 | 45 |
| Their employer*** | 78 | 61 | 60 | 64 |
| The U.S. Centers for Disease Control and Prevention, or CDC | 82 | 48 | 62 | 28 |
| The U.S. Food and Drug Administration, or FDA | 79 | 51 | 60 | 37 |
| Their local public health department | 80 | 49 | 57 | 30 |
| President Joe Biden | 72 | 32 | 36 | 15 |
| Dr. Anthony Fauci, the director of the National Institute of Allergy and Infectious Diseases | 74 | 27 | 34 | 8 |
| Their state government officials | 64 | 41 | 46 | 27 |
| NOTE: *Item asked only of those who are parents/guardians of children under 18 in household. Sample size too small for some subgroup analysis. **Item asked only of those who are insured. ***Item asked only of those who are employed and not self-employed. |
| Table 4: Trust In Sources Of COVID-19 Vaccine Information By Party ID |
| Percent who say they have a great deal or fair amount of trust in each of the following to provide reliable information about the COVID-19 vaccines: | Party identification |
| Democrat | Independent | Republican |
| Their child’s pediatrician* | 88% | 85% | - |
| Their own doctor | 88 | 83 | 82% |
| Their health insurance company** | 82 | 71 | 63 |
| Their employer*** | 83 | 63 | 71 |
| The U.S. Centers for Disease Control and Prevention, or CDC | 91 | 69 | 48 |
| The U.S. Food and Drug Administration, or FDA | 83 | 68 | 56 |
| Their local public health department | 86 | 69 | 52 |
| President Joe Biden | 91 | 55 | 22 |
| Dr. Anthony Fauci, the director of the National Institute of Allergy and Infectious Diseases | 87 | 55 | 30 |
| Their state government officials | 71 | 54 | 45 |
| NOTE: *Item asked only of those who are parents/guardians of children under 18 in household. Sample size too small for some subgroup analysis. **Item asked only of those who are insured. ***Item asked only of those who are employed and not self-employed. |