Senate Appropriations Committee Approves FY 2024 State, Foreign Operations, and Related Programs (SFOPs) Appropriations Bill

Published: Jul 21, 2023

The Senate Committee on Appropriations approved the FY 2024 State, Foreign Operations, and Related Programs (SFOPs) appropriations bill, accompanying report, and amendments on July 20, 2023. The SFOPs bill includes funding for U.S. global health programs at the State Department and the U.S. Agency for International Development (USAID). Funding for these programs, through the Global Health Programs (GHP) account, which represents the bulk of global health assistance, totaled $10.3 billion, a decrease of $239 million (-3%) below the FY 2023 enacted level. All of the decrease is due to reduced funding in the bill for the Global Fund to Fight AIDS, Tuberculosis and Malaria (Global Fund), though the accompanying report notes that the decline is “a result of the statutory cap on U.S. contributions related to other donor funds” and that “should sufficient matching contributions be available, the Committee intends to honor the $6,000,000,000 U.S. pledge for the seventh replenishment.” Funding for maternal and child health, Gavi the Vaccine Alliance, family planning and reproductive health (FP/RH), and the Health Reserve Fund increased compared to FY 2023 enacted levels; all other global health areas remained flat. See the table below (downloadable version here) for additional detail on FY 2024 Senate levels compared to the FY 2023 Omnibus as well as the FY 2024 President’s Request and FY 2024 House levels. See other budget summaries and the KFF budget tracker for details on historical annual appropriations for global health programs.

Table 1: KFF Analysis of Global Health Funding in the FY24 Senate Appropriations Bill
Department / Agency / AreaFY23Omnibus(millions)FY24 Request (millions)FY24 House i(millions)FY24 Senate(millions)Difference: FY24 Senate – FY23 OmnibusDifference: FY24 Senate – FY24 RequestDifference: FY24 Senate – FY24 House
State, Foreign Operations, and Related Programs (SFOPs) – Global Health ii
HIV/AIDS iii, iv –$4,700.0 – – – – –
Global Health Programs (GHP) account$4,725.0$4,700.0$4,725.0$4,725.0$0(0%)$25(0.5%)$0(0%)
State Department$4,395.0$4,370.0$4,395.0$4,395.0$0(0%)$25(0.6%)$0(0%)
USAID$330.0$330.0$330.0$330.0$0(0%)$0(0%)$0(0%)
of which Microbicides$45.0$45.0Not specified$45.0$0(0%)$0(0%) –
ESF AccountNot specified$0.0Not specifiedNot specified – – –
Global Fund v$2,000.0$2,000.0$2,000.0$1,650.0$-350(-17.5%)$-350(-17.5%)$-350(-17.5%)
Tuberculosis iii –$358.5 – – – – –
Global Health Programs (GHP) account$394.5$358.5$394.5$394.5$0(0%)$36(10%)$0(0%)
Economic Support Fund (ESF) accountNot specified$0.0Not specifiedNot specified – – –
Malaria$795.0$780.0$800.0$795.0$0(0%)$15(1.9%)$-5(-0.6%)
Maternal & Child Health (MCH)iii –$1,082.5 – – – – –
GHP account$910.0$910.0$910.0$920.0$10(1.1%)$10(1.1%)$10(1.1%)
of which Gavi$290.0$300.0$300.0$300.0$10(3.4%)$0(0%)$0(0%)
of which Polio$85.0$85.0$85.0$85.0$0(0%)$0(0%)$0(0%)
UNICEF iii$142.0$145.0Not specified$145.0$3(2.1%)$0(0%) –
ESF accountNot specified$27.0Not specifiedNot specified – – –
of which PolioNot specified$0.0Not specifiedNot specified – – –
Assistance for Europe, Eurasia, and Central Asia (AEECA) accountNot specified$0.5Not specifiedNot specified – – –
Nutrition iii –$164.8 – – – – –
GHP account$160.0$160.0$172.5$160.0$0(0%)$0(0%)$-12.5(-7.2%)
ESF accountNot specified$4.0Not specifiedNot specified – – –
AEECA accountNot specified$0.8Not specifiedNot specified – – –
Family Planning & Reproductive Health (FP/RH)iii, vi, vii$607.5$677.2$461.0$635.1$27.6 (4.5%)$-42.1 (-6.2%)$174.1 (37.8%)
Bilateral FP/RH vi, vii$575.0$619.7$461.0$600.0$25(4.3%)$-19.7(-3.2%)$139(30.2%)
GHP account vi$524.0$600.0Not specified$549.0$25(4.8%)$-51.1(-8.5%) –
ESF account vi$51.1$19.3Not specified$51.1$0(0%)$31.8(164.5%) –
Assistance for Europe, Eurasia, and Central Asia (AEECA) account viiiNot specified$0.4Not specifiedNot specified – – –
UNFPA ix$32.5$57.5$0.0$35.1$2.6(8%)$-22.4(-38.9%)$35.1(NA)
Vulnerable Children$30.0$30.0$32.5$30.0$0 (0%)$0 (0%)$-2.5 (-7.7%)
Neglected Tropical Diseases (NTDs)$114.5$114.5$114.5$114.5$0 (0%)$0 (0%)$0 (0%)
Global Health Security iii, vii –$1,260.3 – – – – –
GHP account$900.0$1,245.0Not specifiedNot specified – – –
State Department vii $500.0Not specifiedNot specified – – –
of which Pandemic Fund xi$500.0Not specifiedNot specified – – –
USAID$900.0$745.0Not specified$900.0$0(0%)$155(20.8%) –
of which bilateralNot specified$435.0Not specifiedNot specified – – –
of which multilateralNot specified$220.0Not specifiedNot specified – – –
of which the Coalition for Epidemic Preparedness Innovations (CEPI)xii$100.0Not specified$100.0$100.0$0(0%) –$0(0%)
of which Emergency Reserve Fundxiii$90.0xiiixiii – – –
ESF accountNot specified$13.3Not specifiedNot specified – – –
AEECA accountNot specified$2.0Not specifiedNot specified – – –
Emergency Reserve Fundxiiixiiixiiixiii – – –
Health Reserve Fund xiv$8.0$10.0Not specified$10.0$2 (25%)$0 (0%) –
Global Health Worker InitiativeNot specified$20.0Not specified$20.0 –$0 (0%) –
SFOPs Total (GHP account only)$10,561.0$10,928.0$10,018.7$10,268.0$-293 (-2.8%)$-660 (-6%)$249.2 (2.5%)
Notes:
i – The FY24 House and Senate bill texts state that up to $200 million of the funds appropriated by this Act through various accounts “may be made available to combat such infectious disease of public health emergency.”
ii – Unless otherwise specified, funding amounts listed under the “State, Foreign Operations, and Related Programs (SFOPs) – Global Health” heading are provided through the Global Health Programs (GHP) account.
iii – Some HIV, tuberculosis, MCH, nutrition, family planning and reproductive health, and global health security funding is provided under the ESF and AEECA accounts, which is not earmarked by Congress in the annual appropriations bills and is determined at the agency level.
iv – The FY24 Senate report accompanying the SFOPs bill “recommends not less than $30,000,000 under the GHP heading for a pilot project in up to three current PEPFAR countries to enhance antenatal and maternity services.”
v – The FY24 Senate report states that the reduction in funding for the Global Fund compared to the prior fiscal year is “a result of the statutory cap on U.S. contributions related to other donor funds” and that “should sufficient matching contributions be available, the Committee intends to honor the $6,000,000,000 U.S. pledge for the seventh replenishment.”
vi – The FY23 Omnibus bills states that “not less than $575,000,000 should be made available for family planning/reproductive health.” The FY24 House bill states that “of the funds appropriated by this Act, not more than $461,000,000 may be made available for family planning/reproductive health.” The FY24 Senate bill states that “not less than $600,000,000 should be made available for family planning/reproductive health.”
vii – The explanatory statement accompanying the House FY24 SFOPs appropriations bill does not provide specific funding amounts for FPRH or GHS under the GHP account. After the funding amounts specified for all other areas (e.g., HIV, TB, MCH, etc.) are removed, $869.71 million remains under the GHP account at USAID, which is funding that could be used for FPRH and GHS (or other areas as determined by the Administration). Since the House FY24 bill text states that “of the funds appropriated by this Act, not more than $461,000,000 may be made available for family planning/reproductive health” without specifying an account, it is possible the Administration could fund all or a portion of this amount through the GHP account with the remainder directed to GHS (or other areas as determined by the Administration).
viii – It is possible additional funding for FPRH might be provided through the AEECA account, but these amounts, if any, will not be available until late in the fiscal year.
ix – The FY23 Omnibus and FY24 Senate bills state that if this funding is not provided to UNFPA it “shall be transferred to the ‘Global Health Programs’ account and shall be made available for family planning, maternal, and reproductive health activities.”
x – The FY24 Request states that this amount is for the Pandemic Fund to “strengthen global health security and pandemic preparedness and help make the world safer from infectious disease threats.”
xi – The FY24 Senate bill states that “funds appropriated by this Act under the heading ‘Global Health Programs‘ may be made available for contributions to the Financial Intermediary Fund for Pandemic Prevention, Preparedness and Response.”
xii – The explanatory statement accompanying the House FY24 SFOPs appropriations bill directs that $50 million in unobligated balances from previous fiscal years should be made available to CEPI in addition to the $100m provided through the bill matching the FY23 enacted level. The explanatory statement accompanying the Senate FY24 SFOPs appropriations bill recommends “not less than $100,000,000 for a U.S. contribution to the Coalition for Epidemic Preparedness Innovations.”
xiii – The FY23 Omnibus and FY24 Senate bills state that “up to $90,000,000 of the funds made available under the heading ‘Global Health Programs’ may be made available for the Emergency Reserve Fund.” The FY24 Request includes funding for the Emergency Reserve Fund under Global Health Security. The FY24 House bill states that “up to $50,000,000 of the funds appropriated by this Act under the heading ‘Global Health Programs’ may be made available for the Emergency Reserve Fund.”
xiv – The explanatory statement accompanying the FY23 Omnibus states that these funds are “to support cross-cutting health activities, including health service delivery, the health workforce, health information systems, access to essential medicines, health systems financing, and governance, in challenging environments and countries in crisis.” The FY24 Request states that these funds are to “support cross-cutting global health activities in challenging environments or countries emerging from crisis. It will provide flexible, no year funding to ensure basic health services are accessible to those most in need and to build more resilient health services and systems. Activities will focus on six key areas: support for health service delivery, the global health workforce, health information systems, access to essential medicines, health systems financing, and governance.”

Sustainability Readiness in PEPFAR Countries

Authors: Jennifer Kates, Kellie Moss, Stephanie Oum, Anna Rouw, and Allyala Nandakumar
Published: Jul 21, 2023

Data Note

Overview

PEPFAR’s latest 5-year strategy puts a premium on sustainability as one of its five strategic pillars, and the program reports that it is working to develop sustainability roadmaps with countries. Achieving and maintaining sustainability of the HIV response, with the goal of countries taking on more ownership of their HIV response, is complex, multidimensional, and dependent on numerous factors that are not always within PEPFAR or the U.S. government’s control. To help inform discussions about PEPFAR’s work on sustainability, this data note arrays and groups PEPFAR countries by their level of “sustainability readiness.” Specifically, it assigns “sustainability scores” according to how countries perform relative to targets on 14 indicators and combines those scores with their HIV epidemic control status to group countries into several categories. The analysis shows that traditional measures of sustainability, such as those that assess financial independence or the strength of the basic health system, are not necessarily indicative of HIV epidemic control status. Countries that have achieved epidemic control and reached higher sustainability thresholds are likely best placed to take on more of their HIV response.

Introduction

PEPFAR’s latest 5-year strategy puts a premium on sustainability as one of five strategic pillars. The program defines sustainability as “a country having and using its enabling environment, capable institutions, functional systems, domestic resources, and diverse capacities within the national system…to sustain achievement of 95-95-95 goals; to ensure equity in its HIV response; and to protect against other public health threats.”1  Sustainability is to be assessed across three broad areas: political, programmatic, and financial – and a PEPFAR process has been launched to develop measurable country sustainability “roadmaps,” with the goal of having them in place by the end of 2024. This current approach joins a much longer history in PEPFAR’s attention to sustainability but marks a new point in this evolution, informed by the impact of COVID-19, progress in the HIV response, projected budget constraints, and the changing U.S. view of its role in development and of the “donor/recipient” relationship.

Achieving and maintaining sustainability of the HIV response, however, is complex, multidimensional, and not static, and is ultimately dependent on numerous factors that are sometimes within but often outside of PEPFAR and the U.S. government’s control. Country contexts vary and may change over time due to economic conditions, shifts in political and legal landscapes, and the impact of other pandemics or health issues, conflicts, and other challenges. Moreover, considerations for ensuring sustainability are particularly delicate in the context of an infectious disease, where there is risk of resurgence if programs are not maintained. This has been seen historically with both malaria and tuberculosis, as well as more recently with service disruptions due to COVID-19.2 

To help inform discussions about PEPFAR’s work on sustainability, this analysis seeks to identify potential indicators of “sustainability readiness” in PEPFAR countries – that is, how prepared PEPFAR countries are to take on more of their HIV response. Specifically, it assigns “sustainability scores” according to how countries perform relative to targets3  on 14 indicators, spanning four broad areas (see Appendix Table 1 and Methods).

At the same time, because the ultimate goal of PEPFAR is to achieve and maintain HIV epidemic control (see definitions in Box 1), we also combined these sustainability scores with HIV epidemic control status in each country. The resulting “sustainability readiness matrix” helps point to potential pathways or emphases for future sustainability efforts while maintaining a focus on HIV. We limited the analysis to the 25 PEPFAR countries that are required to prepare Country Operational Plans (COPs) in 2023.

It is important to note that while a range of indicators were included in this analysis, there are others that may also be important to assess, such as indicators of equity (another of PEPFAR’s five strategic pillars) and/or more specific programmatic measures, such as HIV commodity security. In addition, while this analysis applied equal weights to each of the indicators (and indicator areas) used here, it may be desirable to assign greater importance to some areas, such as those describing the HIV policy environment or financial independence. Finally, this analysis focuses on only one point in time, but country contexts change and continual monitoring of these indicators as well as HIV epidemic control status will be important.

Box 1: Epidemic Control Status Groups for PEPFAR Countries

PEPFAR categorizes countries into three groups4  based on their progress toward reaching control of their HIV/AIDS epidemic using two metrics:

  • The trend in the incidence to mortality ratio (IMR)5  (whether increasing or decreasing), and
  • Whether a country has reached the global target of 73%6  viral load suppression (VLS) among people living with HIV.

The three epidemic control status groups are:

  • At Epidemic Control – new infections and deaths are low and declining, and the global target for people virally suppressed has been reached7 
  • Near Epidemic Control – new infections and deaths are low and declining, but the global target for people virally suppressed has not yet been reached 8 
  • Not Near Epidemic Control – new infections and deaths are not declining, and in some cases increasing, and the global target for people virally suppressed has not yet been reached9 

Key Takeaways

  • PEPFAR countries are at varying points along the sustainability glidepath. They vary in their levels of economic growth and financial independence, the extent to which their policy environments align with international HIV standards, and the strength of their basic health system, among other factors. For example, central government debt as a percentage of GDP, a measure of financial burden faced by countries, ranges from 20% in Botswana to 119% in Zambia. Alignment of HIV testing and prevention policies with international standards ranges from 14% in Angola to 94% in South Africa. See Appendix Tables 2-3.
  • As such, sustainability scores ranged significantly across PEPFAR countries, and no country attained the highest possible score. South Africa ranked the highest (10), followed by Botswana and the Dominican Republic (9) and then Namibia and Ukraine (8). At the other end of the spectrum, eight countries had scores of 3, and one country (Ethiopia) had a score of 1. See Figure 1.
Sustainability Scores for PEPFAR Countries by Epidemic Control Status
  • The role of conflict and fragility is an important element to consider, as most of the countries with the lowest sustainability scores face such challenges. Of the 10 countries characterized by the World Bank as conflict-affected or fragile, nine have sustainability scores of four or less (Burundi, Cameroon, the Democratic Republic of the Congo, Ethiopia, Haiti, Mozambique, Nigeria, South Sudan, and Zimbabwe). The exception is Ukraine, with a score of 8 (which could reflect the timing of data available for this assessment, which largely pre-date the current crisis in that country). See Figure 1.
  • Looking across the four sustainability indicator areas (commitment to HIV, basic health system, economic, and commitment to health indicators), PEPFAR countries scored, on average, highest on “commitment to HIV” and lowest on “basic health system” measures. Overall, PEPFAR countries were most likely to meet or exceed commitment to HIV indicators (66%), which assess how fully countries have adopted internationally-recommended policies for addressing the epidemic. By contrast, only 17% of basic health system measures were met or exceeded. For the other two indicator areas – economic and commitment to health – PEPFAR countries met or exceeded 29% and 30% of targets, respectively. This suggests that the areas of focus for promoting sustainability rest largely in the realm of further strengthening the basic health system and in addressing economic vulnerability. See Figure 2 and Appendix Table 4.
Average Share of Targets Attained by PEPFAR Countries, by Indicator Area and Epidemic Control Status
  • There is also some notable variation in indicator scores within each of these broader areas. For example, despite the relatively high score for commitment to HIV policy indicators, the individual indicator addressing structural challenges (e.g., laws and policies), lags far behind with only 16% of countries meeting or exceeding its target. By contrast, all PEPFAR countries met or exceeded the indicator for care and treatment policies (100%), and almost three-quarters (72%) did so for testing and prevention policies. In the area of basic health, only 4% of countries met or exceeded targets for delivering recommended antenatal care and for seeking care for children suspected of having pneumonia. Similarly, in the area of commitment to health, only 4% met or exceeded the target for health as a share of the domestic government’s budget. See Figure 3 and Appendix Tables 2-3.
Overview of Target Attainment by Indicator: Share and Number of PEPFAR Countries
  • Sustainability scores alone, however, do not tell the whole story, as they are not indicative of HIV epidemic control status. In fact, the average sustainability score was highest (5.6) for the group of countries “not near epidemic control,” largely driven by scores for South Africa and the Dominican Republic, and lowest (3.8) for countries “near epidemic control.” The average for countries “at epidemic control” was five. See Figure 4.
Average Sustainability Scores for PEPFAR Countries by Epidemic Control Status
  • Therefore, grouping countries by both epidemic control status and sustainability score may help point to potential pathways or emphases for future sustainability planning and strengthening, while maintaining a focus on HIV. Countries that have achieved epidemic control and reached higher sustainability thresholds (those that are in the top left of the sustainability readiness matrix) are likely best placed to take on more of their HIV response, while those that are not yet near epidemic control and have not reached higher sustainability thresholds (the bottom right of the matrix) are least prepared (see Figure 5). Specifically, three countries – Botswana, Malawi, and Namibia – have not only achieved epidemic control but have some of the highest sustainability scores. This suggests that the focus of PEPFAR’s effort in these countries, as well as the timeline for achieving greater sustainability, could be substantially different than in countries that have high scores but are not near epidemic control (e.g., South Africa), those that are at epidemic control but have low sustainability scores (e.g., Ethiopia, Nigeria, and Zimbabwe), and finally, those that are not near epidemic control and have low sustainability scores (e.g., Angola, South Sudan, and Tanzania).
Sustainability Readiness Matrix for PEPFAR Countries

This analysis, designed to help inform discussions about sustainability of the HIV response in PEPFAR countries, presents one framework for assessing countries by their sustainability readiness. A key takeaway is that traditional measures of sustainability, such as those that assess financial independence or the strength of the basic health system, are not necessarily indicative of HIV epidemic control status. This underscores the delicate nature of sustainability efforts, which alone may not secure success in combatting HIV. Therefore, grouping countries across both dimensions – sustainability scores and HIV epidemic control status – may help to identify potential pathways for future sustainability planning while maintaining a focus on HIV.

Jen Kates, Kellie Moss, Stephanie Oum, and Anna Rouw are with KFF. Allyala Nandakumar is with Brandeis University.

Appendix

Sustainability Readiness Indicators and Targets for Scoring
Sustainability Indicators Used for Target Attainment Analysis in Sustainability Scoring, by PEPFAR Country
Sustainability Indicators with Target Attainment Analysis, by PEPFAR Country
Target Attainment by PEPFAR Countries, by Indicator Area and Epidemic Control Status

Methods

Countries Included

We limited our analysis to the 25 PEPFAR countries that are required to prepare Country Operational Plans (COPs) in 2023. We grouped these countries by epidemic control status, as defined by PEFPAR. For four countries where epidemic control status was not defined by PEPFAR (the Dominican Republic, Mozambique, Ukraine, and Vietnam), we determined their group using PEPFAR’s definition (see Box 1) and by relying on data from UNAIDS’ AIDSinfo, PEPFAR’s Sustainability Index and Dashboard (SID), and the Population-Based HIV Impact Assessment (PHIA) from Columbia University; we used the latest year of data available.10  Lastly, we identified PEPFAR countries that are considered fragile or conflict-affected using the World Bank’s FY 2023 Fragile and Conflict-Affected Situations (FCS) List.

Indicators and Targets

We selected 14 indicators across four broad indicator areas to analyze each PEPFAR country’s level of “sustainability readiness”. The four areas include:

  1. Commitment to HIV – indicators on the status of policies and laws that either enable or hamper the HIV response;
  2. Basic Health System – indicators, like immunization rates and share of births attended by skilled health personnel, that shed light on the general strength or weakness of a country’s health system;
  3. Economic – indicators that point to country economic growth or vulnerability broadly, as well as financial independence of HIV programs from donor support; and
  4. Commitment to Health – indicators of financial commitment to health by country governments, such as how much of a government’s budget is spent on health.

In order to measure sustainability readiness, we assessed whether a country had met or exceeded the globally set target for each indicator, where such targets were available. In two cases – Central Government Debt and GNI Per Capita – we used an alternate approach. For Central Government Debt, we used the COP country average as the target. For GNI Per Capita, we used the World Bank income classification cutoff for upper-middle-income economies for FY 2023 as the target.

Sustainability Scoring

Each country was scored according to how many global targets it had met or exceeded for the 14 indicators (one point for each target met), with the sum resulting in a total country score (14 was the highest possible total score for any given country). Instances of missing data were counted as not having met the target for that indicator. To group and array countries by sustainability readiness, we used a “Majority Target Score” approach where we grouped countries by epidemic control status and whether or not they had a score of at least 7 (a majority of indicators). 

Definitions & Sources
Indicator AreaIndicator NameIndicator Description and SourceGlobal TargetGlobal Target Description and Source
Commitment to HIVCare and Treatment PoliciesHIV policy alignment score for policies on HIV treatment and related health services.

Source: HIV Policy Lab, using 2021 data. Accessed February 23, 2023. https://www.hivpolicylab.org/data.

≥ 60%According to the HIV Policy Lab, countries that have policy adoption scores greater than or equal to 60% are considered to have “many” or “most” of the recommended policies adopted.

Source: HIV Policy Lab, https://www.hivpolicylab.org/compare.

Commitment to HIVHealth Systems PoliciesHIV policy alignment score for policies on financing and management of the health system.

Source: HIV Policy Lab, using 2021 data. Accessed February 23, 2023. https://www.hivpolicylab.org/data

≥ 60%According to the HIV Policy Lab, countries that have policy adoption scores greater than or equal to 60% are considered to have “many” or “most” of the recommended policies adopted.

Source: HIV Policy Lab, https://www.hivpolicylab.org/compare.

Commitment to HIVStructural PoliciesHIV policy alignment score for policies on political and social drivers of HIV, including criminalization, gender, and human rights issues.

Source: HIV Policy Lab, using 2021 data. Accessed February 23, 2023. https://www.hivpolicylab.org/data

≥ 60%According to the HIV Policy Lab, countries that have policy adoption scores greater than or equal to 60% are considered to have “many” or “most” of the recommended policies adopted.

Source: HIV Policy Lab, https://www.hivpolicylab.org/compare.

Commitment to HIVTesting and Prevention PoliciesHIV policy alignment score for policies on biomedical and socio-behavioral HIV prevention and testing.

Source: HIV Policy Lab, using 2021 data. Accessed February 23, 2023. https://www.hivpolicylab.org/data

≥ 60%According to the HIV Policy Lab, countries that have policy adoption scores greater than or equal to 60% are considered to have “many” or “most” of the recommended policies adopted.

Source: HIV Policy Lab, https://www.hivpolicylab.org/compare.

Basic Health SystemANC4Percentage of women aged 15-49 attended by any provider (antenatal care or ANC) at least four times during pregnancy.

Source: UNICEF global database of antenatal care based on MICS, DHS, and other nationally representative household survey data, using 2022 data. Accessed February 23, 2023. https://data.unicef.org/topic/maternal-health/antenatal-care/#data.

≥ 90%In 2021, the World Health Organization (WHO) and United Nations Population Fund (UNFPA) launched five coverage targets, for achievement by 2025, to help countries track progress toward the Sustainable Development Goals (SDGs) and to reduce preventable maternal deaths. One of those targets was 90% of pregnant women attending four or more ANC visits.

Source: World Health Organization, “New global targets to prevent maternal deaths,” https://www.who.int/news/item/05-10-2021-new-global-targets-to-prevent-maternal-deaths.

Basic Health SystemSkilled Birth AttendancePercentage of births attended by skilled health personnel.

Source: WHO Global Health Observatory, using 2013-2021 data. Accessed March 13, 2023. https://www.who.int/data/gho/data/indicators/indicator-details/GHO/births-attended-by-skilled-health-personnel-(-).

≥ 90%In 2021, WHO and UNFPA launched five coverage targets, for achievement by 2025, to help countries track progress toward the SDGs and to reduce preventable maternal deaths. One of those targets was 90% of births to be attended by skilled health personnel.

Source: World Health Organization, “New global targets to prevent maternal deaths,” https://www.who.int/news/item/05-10-2021-new-global-targets-to-prevent-maternal-deaths.

Basic Health SystemPneumonia Care-seekingPercentage of children under 5 with suspected pneumonia taken to an appropriate health facility or provider.

Source: WHO Global Health Observatory, using 2000-2021 data. Accessed March 13, 2023. https://www.who.int/data/maternal-newborn-child-adolescent-ageing/indicator-explorer-new/mca/proportion-of-children-under-5-years-with-acute-respiratory-infection-taken-to-a-health-facility.

≥ 90%In 2013, WHO and the United Nations Children’s Fund (UNICEF) launched the integrated Global Action Plan for Prevention and Control of Pneumonia and Diarrhea (GAPPD) to develop targets to reduce mortality related to pneumonia and diarrhea, for achievement by 2025. One of those targets was 90% access to appropriate pneumonia care and diarrhea case management.

Source: World Health Organization, The Integrated Global Action Plan for Prevention and Control of Pneumonia and Diarrhea (GAPPD), https://www.who.int/publications/i/item/the-integrated-global-action-plan-for-prevention-and-control-of-pneumonia-and-diarrhoea-(gappd).

Basic Health SystemImmunization RateImmunization rate, calculated as the simple average of the 2021 diphtheria-tetanus-pertussis (DPT3) coverage rate and the 2021 measles (MCV) coverage rate. Immunization rates calculated according to the Millennium Challenge Corporation methodology for estimating immunization coverage.

Source: KFF analysis of UNICEF immunization data, using 2021 data. Accessed February 21, 2023. https://data.unicef.org/topic/child-health/immunization/.

≥ 90%As part of the Immunization Agenda 2030, one of the targets is 90% global coverage for selected essential vaccines, including DTP3 and MCV, to be achieved by 2030.

Source: Immunization Agenda 2030, https://scorecard.immunizationagenda2030.org/ig3.1.

Basic Health SystemService Coverage IndexCoverage of essential health services as an index on a scale of 0 to 100 which is computed as the geometric mean of the 14 tracer indicators of health coverage.

Source: WHO Global Health Observatory, using 2019 data. Accessed March 13, 2023. https://www.who.int/data/gho/data/indicators/indicator-details/GHO/uhc-index-of-service-coverage.

≥ 60According to the World Bank, countries with Service Coverage Index scores above 60 are considered as having “high” service coverage.

Source: The World Bank, “Universal Health Coverage as a Sustainable Development Goal,” https://datatopics.worldbank.org/world-development-indicators/stories/universal-health-coverage-as-a-sustainable-development-goal.html.

EconomicDonor Share of HIV FundingShare of domestic HIV funding contributed by donor governments and other donors, such as the Global Fund to Fight AIDS, TB and Malaria.

Source: PEPFAR, PEPFAR 2022 Country and Regional Operational Plan (COP/ROP) Guidance for all PEPFAR-Supported Countries, Jan. 2022; KFF special data request fulfilled by Office of the Global AIDS Coordinator (OGAC), May 6, 2022.

≤ 65%Based on Gavi, the Vaccine Alliance’s (Gavi) co-financing policies in which countries reach an ‘accelerated transition phase’ after meeting certain GNI per capita requirements and co-financing at least 35% of its vaccine costs. The target used, therefore, is the remaining donor share (less than 65%) when at least 35% of costs are financed by the country.

Source: Gavi, “Co-financing policy,” https://www.gavi.org/programmes-impact/programmatic-policies/co-financing-policy.

EconomicCentral Government DebtTotal stock of debt liabilities issued by the central government as a share of gross domestic product (GDP).

Source: International Monetary Fund (IMF), using 2021 data. Accessed March 13, 2023. https://www.imf.org/external/datamapper/CG_DEBT_GDP@GDD/SWE.

≤ 60%*Average value of PEPFAR COP country’s central government debt data due to unavailability of widely accepted global standard. Average was 60%.

Source: KFF data analysis.

EconomicGNI Per CapitaEstimated gross national income (GNI) per capita.

Source: World Bank, using 2021 data. Accessed March 1, 2023. https://data.worldbank.org/indicator/NY.GNP.PCAP.CD.

≥ $4,256*Using the World Bank’s FY 2023 Country and Lending Groups, $4,256 is the cut-off value for GNI per capita for upper-middle income countries.

Source: World Bank, “World Bank Country and Lending Groups,” https://datahelpdesk.worldbank.org/knowledgebase/articles/906519-world-bank-country-and-lending-groups.

Commitment to HealthOut-of-Pocket SpendingHousehold out-of-pocket expenditure as a percentage of total current health expenditure.

Source: WHO Global Health Observatory, using 2020 data. Accessed March 13, 2023. https://www.who.int/data/gho/data/indicators/indicator-details/GHO/out-of-pocket-expenditure-as-percentage-of-current-health-expenditure-(che)-(-).

≤ 25%As part of the SDGs, households spending 25% or more of household expenditure on health are considered as having ‘catastrophic health spending.’

Source: World Health Organization, “Global monitoring report on financial protection in health 2021,” https://www.who.int/publications/i/item/9789240040953.

Commitment to HealthHealth as Share of Domestic Government BudgetDomestic general government health spending as a percentage of general government expenditures.

Source: WHO Global Health Observatory, using 2020 data. Accessed March 13, 2023. https://www.who.int/data/gho/data/indicators/indicator-details/GHO/domestic-general-government-health-expenditure-(gghe-d)-as-percentage-of-general-government-expenditure-(gge).

≥ 15%As part of the Abuja Declaration, adopted in 2001 by the African Union, countries pledged to dedicate at least 15% of domestic government budgets to the health sector.

Source: World Health Organization, “The Abuja Declaration: Ten Years On,” https://apps.who.int/iris/bitstream/handle/10665/341162/WHO-HSS-HSF-2010.01-eng.pdf?sequence=1.

Endnotes

  1. PEPFAR 2023 Country and Regional Operational Plan (COP/ROP) Guidance for all PEPFAR-Supported Countries. ↩︎
  2. See, for example: Cohen JM, Smith DL, Cotter C. et al., “Malaria resurgence: a systematic review and assessment of its causes”, Malaria Journal, 11(122), 2012; Greenwood B, Zongo I, Dicko A, Chandramohan D, Snow RW, Ockenhouse C, “Resurgent and delayed malaria”, Malaria Journal, 21(1), 2022; Institute of Medicine, Ending Neglect: The Elimination of Tuberculosis in the United States, 2000; WHO, Global Tuberculosis Report, 2022; WHO World Malaria Report, 2022. ↩︎
  3. In most cases, the targets used for benchmark scoring are globally set standards; however, there were a few exceptions. See Methods for more details about these. ↩︎
  4. Most countries are identified by PEPFAR as belonging to a specific epidemic control status grouping, but four were not; we categorized these countries into epidemic control groups using PEPFAR’s definition/metrics approach. See Methods for more details. ↩︎
  5. Incidence-to-mortality (IMR) are defined as the ratio of new HIV infections to the total number of deaths from all causes among people living with HIV. As part of PEPFAR’s efforts to help countries reach epidemic control, the target for this value is at or below 1. For more information on countries’ progress in reaching this target, see the KFF dashboard Progress Toward Global HIV Targets in PEPFAR Countries. ↩︎
  6. The global viral load suppression target is defined as at least 73% of people living with HIV having suppressed viral loads. This target is part of the UNAIDS 90-90-90 targets which had a target date of 2020. For more information on countries’ progress in reaching this target, and the updated 95-95-95 targets, see the KFF dashboard Progress Toward Global HIV Targets in PEPFAR Countries. ↩︎
  7. Countries that have a stabilized HIV/AIDS epidemic, as shown by a trend of decreasing IMR, and have reached a VLS of 73% or higher among all people living with HIV, per the PEPFAR 2023 COP Guidance/FY 2024 Technical Considerations. ↩︎
  8. Countries that have a stabilized HIV/AIDS epidemic, as shown by a trend of decreasing IMR, but have not yet reached a VLS of at least 73% among all people living with HIV, per the PEPFAR 2023 COP Guidance/FY 2024 Technical Considerations. ↩︎
  9. Countries that show a trend of increasing or flat IMR and have not yet achieved a VLS of at least 73% among all people living with HIV, per the PEPFAR 2023 COP Guidance/FY 2024 Technical Considerations. ↩︎
  10. For the Dominican Republic, Ukraine, and Vietnam, we relied on UNAIDS data for incidence-to-mortality ratio (IMR) and viral load suppression (VLS) among people living with HIV estimates using the latest year of data available (2021). For Mozambique, we relied on PEPFAR’s 2021 SID for Mozambique for an IMR estimate and Mozambique’s PHIA for an estimate of VLS among people living with HIV. Mozambique and Vietnam were categorized as “Near Epidemic Control” due to decreasing IMR trends, but viral load suppression rates below the global target of 73%. The Dominican Republic and Ukraine were categorized as “Not Near Epidemic Control” due to increasing IMR trends and viral load suppression rates below the global target of 73%. ↩︎

Health Care Issues in the Early Stages of the 2024 Election

Author: Larry Levitt
Published: Jul 20, 2023

In this JAMA Health Forum column, Larry Levitt examines differences in the Republican presidential candidates’ records and positions on health issues, including Medicaid and abortion, that could play a role in the primaries and would set up a sharp contrast in the general election against President Biden.

News Release

New KFF Health News Podcast Explores How the Eradication of Smallpox in India Informs Public Health Ambitions and Challenges in 2023

Published: Jul 18, 2023

KFF Health News today launched a new limited-series podcast, “Epidemic: Eradicating Smallpox,” with host Dr. Céline Gounder, senior fellow and editor-at-large for public health at KFF Health News. The eight-episode podcast takes listeners on a journey to South Asia, the site of the last days of variola major smallpox. There, public health workers from India, Bangladesh, and around the world did what many thought was impossible: eradicate smallpox.

“Eradicating smallpox was one of humanity’s greatest triumphs, and it’s one that public health has yet to repeat,” said Dr. Gounder, a physician and epidemiologist. “By telling the stories from the field with the communities and public health workers involved, we can better understand how science, medicine, and the human spirit can dramatically change the course of history.”

In the first episode of the series, listeners will hear how smallpox was seen as both deadly and divine in India through the story of a young boy who overcomes his fear and gets vaccinated after seeing a close friend die of the disease.

In each episode, Dr. Gounder, a public health expert and the KFF Health News medical contributor for CBS News, shares another facet of the historic effort to end smallpox from the field in India and Bangladesh, and also interviews guests who reflect on the strategies and actions of public health workers to help identify relevant lessons for today’s public health emergencies.

New episodes will be available every two weeks on Tuesdays. Listen to the audio trailer here and watch the video trailer on KFF Health News’ YouTube page. 

News Release

U.S. Has the Highest Rate of Gun Deaths for Children and Teens Among Peer Countries

Published: Jul 18, 2023

Firearms were responsible for 20 percent of all child and teen deaths in the U.S. for both 2020 and 2021, compared to an average of less than 2 percent in similarly large and wealthy nations, according to a new KFF analysis. This puts the U.S. far ahead of peer nations in child and teen firearm deaths.

Data show that U.S. firearm deaths for children and teens again surpassed motor vehicle deaths – the second leading cause of death – and that the increase has been primarily driven by gun assault deaths.

On a per capita basis, the firearm mortality rate among children and teens in the U.S. is over 9.5 times the rate of Canada, the country with the second-highest child and teen firearm death rate. If firearm deaths in the U.S. had mirrored Canada’s rates between 2010 and 2021, approximately 30,000 U.S. children and teenagers would still be alive.

Even New York and New Jersey – the states with the lowest child and teen firearm mortality rates among those with available data – have rates that are over three times that of Canada. Among the 38 states with available data, Louisiana, Mississippi, and Alabama had the highest rates of firearm mortality for children and teens ages 1-19 years (17.6, 15.3, and 11.9 deaths per 100,000, respectively).

KFF’s earlier analysis shows that exposure to firearms has important implications for mental health. Among adolescents, gun violence may lead to anxiety, post-traumatic stress disorder, and challenges with school performance, including increased absenteeism and difficulty concentrating

Child and Teen Firearm Mortality in the U.S. and Peer Countries

Authors: Matt McGough, Nirmita Panchal, Cynthia Cox, and Krutika Amin
Published: Jul 18, 2023

Editorial Note: This brief was updated on July 18, 2023, with newer data. It was originally published on July 8, 2022.

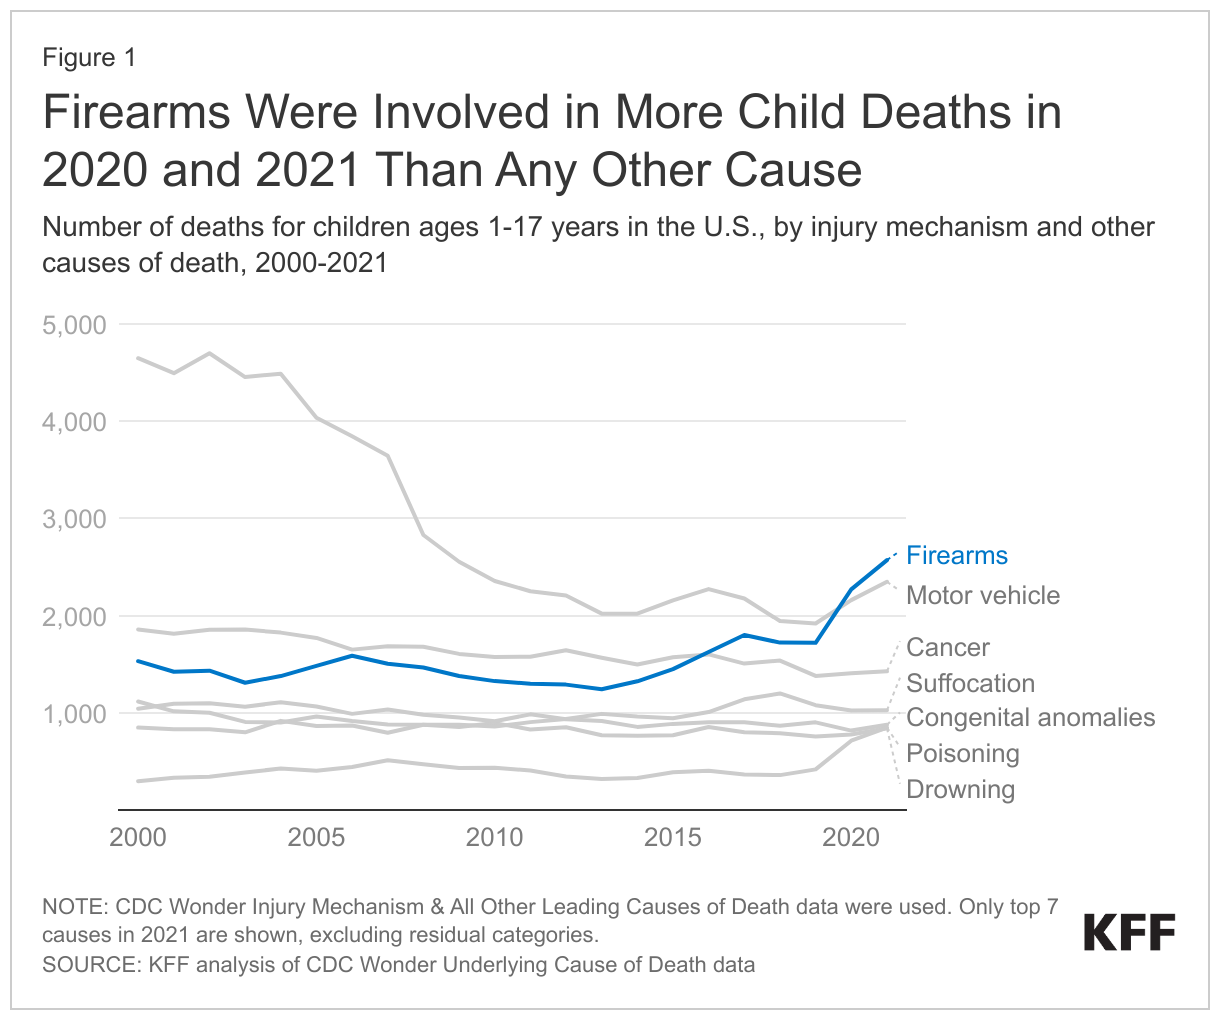
In 2020 and 2021, firearms contributed to the deaths of more children ages 1-17 years in the U.S. than any other type of injury or illness. The child firearm mortality rate has doubled in the U.S. from a recent low of 1.8 deaths per 100,000 in 2013 to 3.7 in 2021.

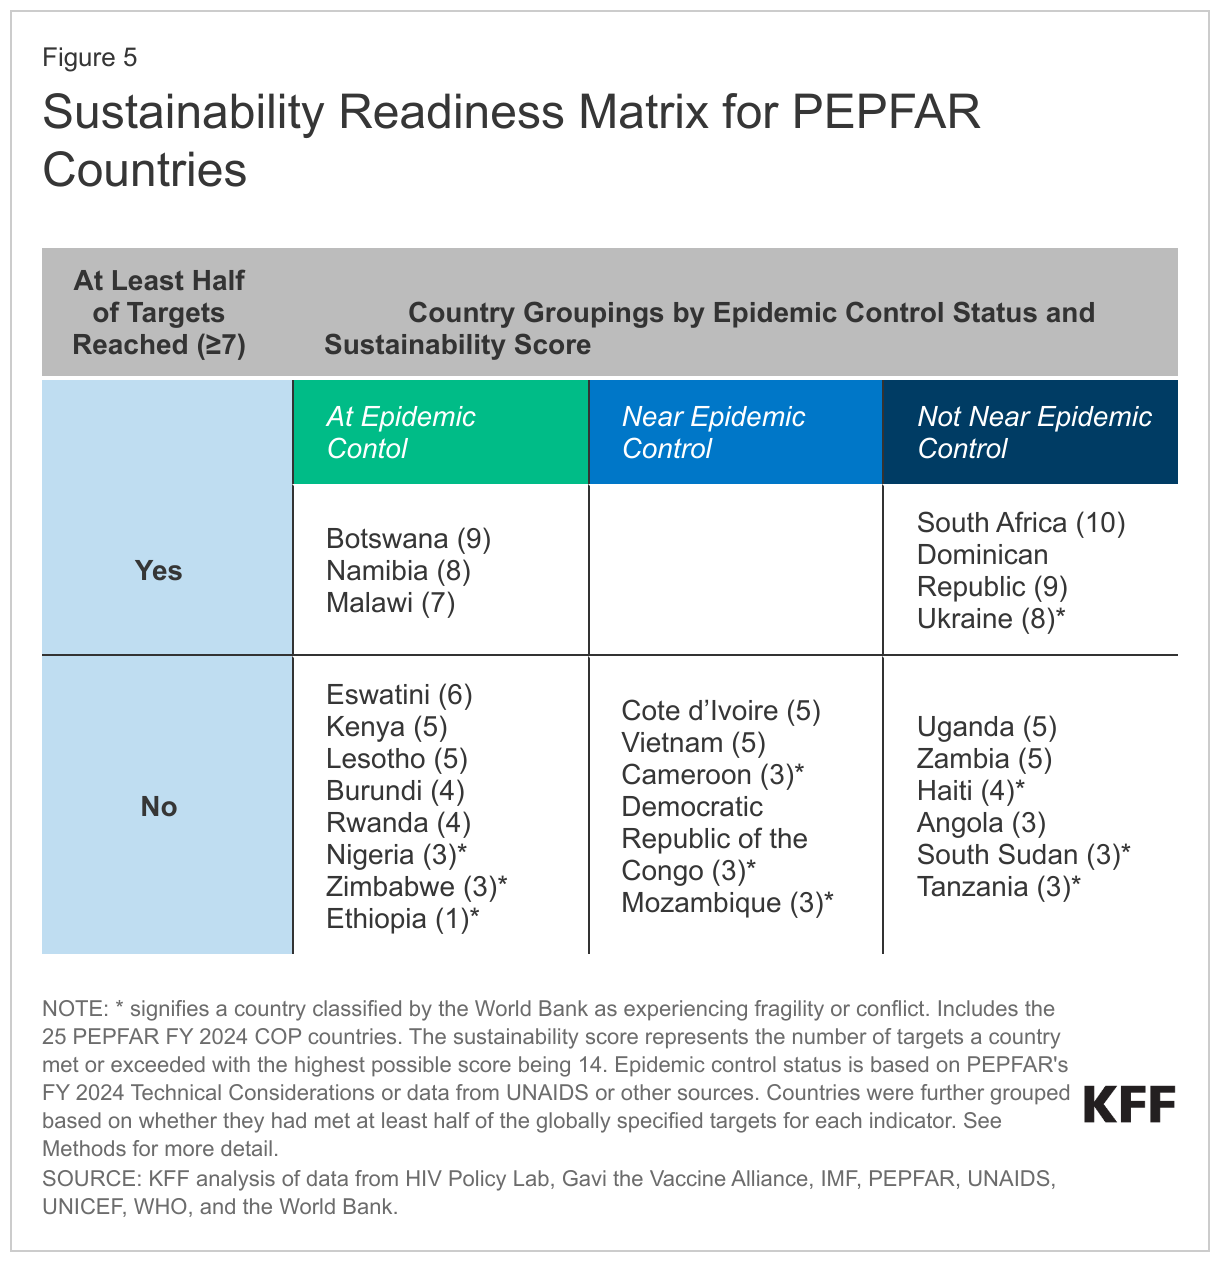
The United States has by far the highest rate of child and teen firearm mortality among peer nations. In no other similarly large, wealthy country are firearms in the top four causes of death for children and teens, let alone the number one cause. U.S. states with the most gun laws have lower rates of child and teen firearm deaths than states with few gun laws. But, even states with the lowest child and teen firearm deaths have rates much higher than what peer countries experience.

Firearms Were Involved in More Child Deaths in 2020 and 2021 Than Any Other Cause

In 2020 and 2021, firearms were involved in the deaths of more children ages 1-17 than any other type of injury or illness, surpassing deaths due to motor vehicles, which had long been the number one factor in child deaths. In 2021, there were 2,571 child deaths due to firearms—a rate of 3.7 deaths per 100,000 children, which is an increase of 68% in the number of deaths since 2000 and 107% since a recent low of 2013.

While the rate of firearm deaths among children has increased since 2000, the rate of motor vehicle deaths is now significantly lower than it had been. The number of motor vehicle deaths among children in 2021 was 49% lower than in 2000, though it did grow during the pandemic by 22% from 2019. Though fewer in number than firearm deaths among children, deaths due to poisonings, which include drug overdoses, have also grown, increasing 186% since 2000 and 103% since 2019.

Provisional CDC data from 2022 indicate that firearms continued to be the number one factor in child deaths for the third year in a row.

The U.S. Has By Far the Highest Child and Teen Firearm Mortality Rate Among Similarly Large and Wealthy OECD Nations

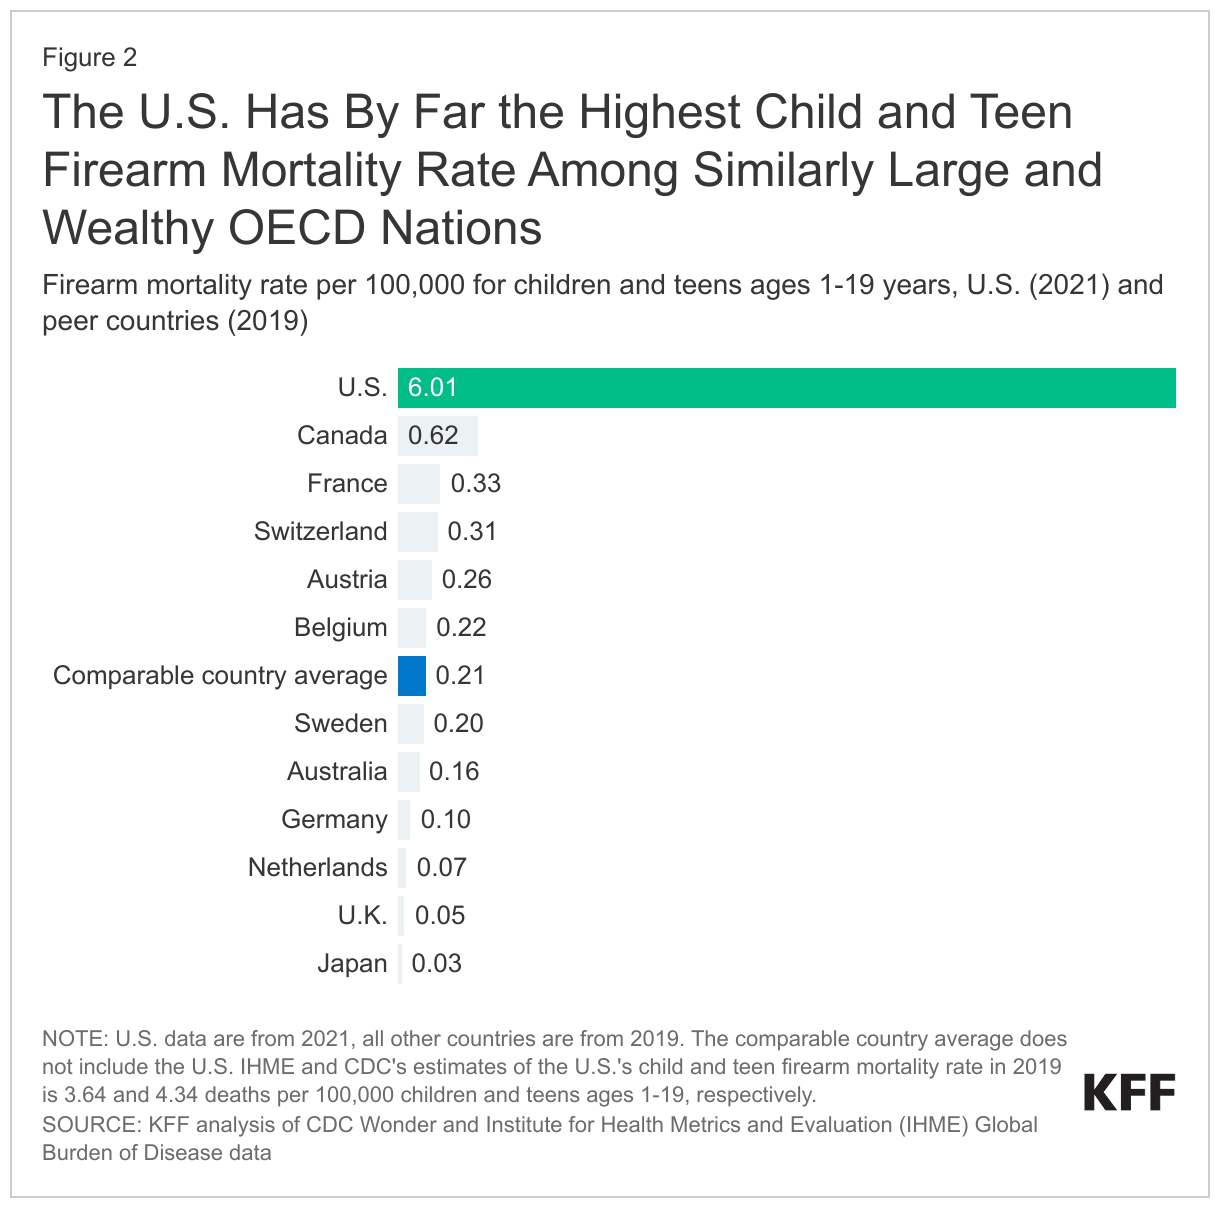
Because peer countries’ mortality data are not available for children ages 1-17 years old alone, we group firearm mortality data for teens ages 18 and 19 years old with data for children ages 1-17 years old in all countries for a direct comparison.

On a per capita basis, the firearm death rate among children and teens (ages 1-19) in the U.S. is over 9.5 times the firearm death rate of Canadian children and teens (ages 1-19). Canada is the country with the second-highest child and teen firearm death rate among similarly large and wealthy nations.

As might be expected, teenagers have higher firearm mortality rates than children. In the U.S., teens ages 18 and 19 have a firearm mortality rate of 25.2 per 100,000, compared to a rate of 3.7 per 100,000 for children ages 1-17 in the U.S. Even so, the child firearm mortality rate in the U.S. (3.7 per 100,000 people ages 1-17) is 5.5 times the child and teen mortality rate in Canada (0.6 per 100,000 people ages 1-19).

If the child and teen firearm mortality rate in the U.S. had been brought down to rates seen in Canada, we estimate that approximately 30,000 children’s and teenagers’ lives in the U.S. would have been saved since 2010 (an average of about 2,500 lives per year). This would have reduced the total number of child and teenage deaths from all causes in the U.S. by 13%.

Even in States with Lower Child and Teen Firearm Mortality, Rates Are Much Higher Than in Comparable Countries

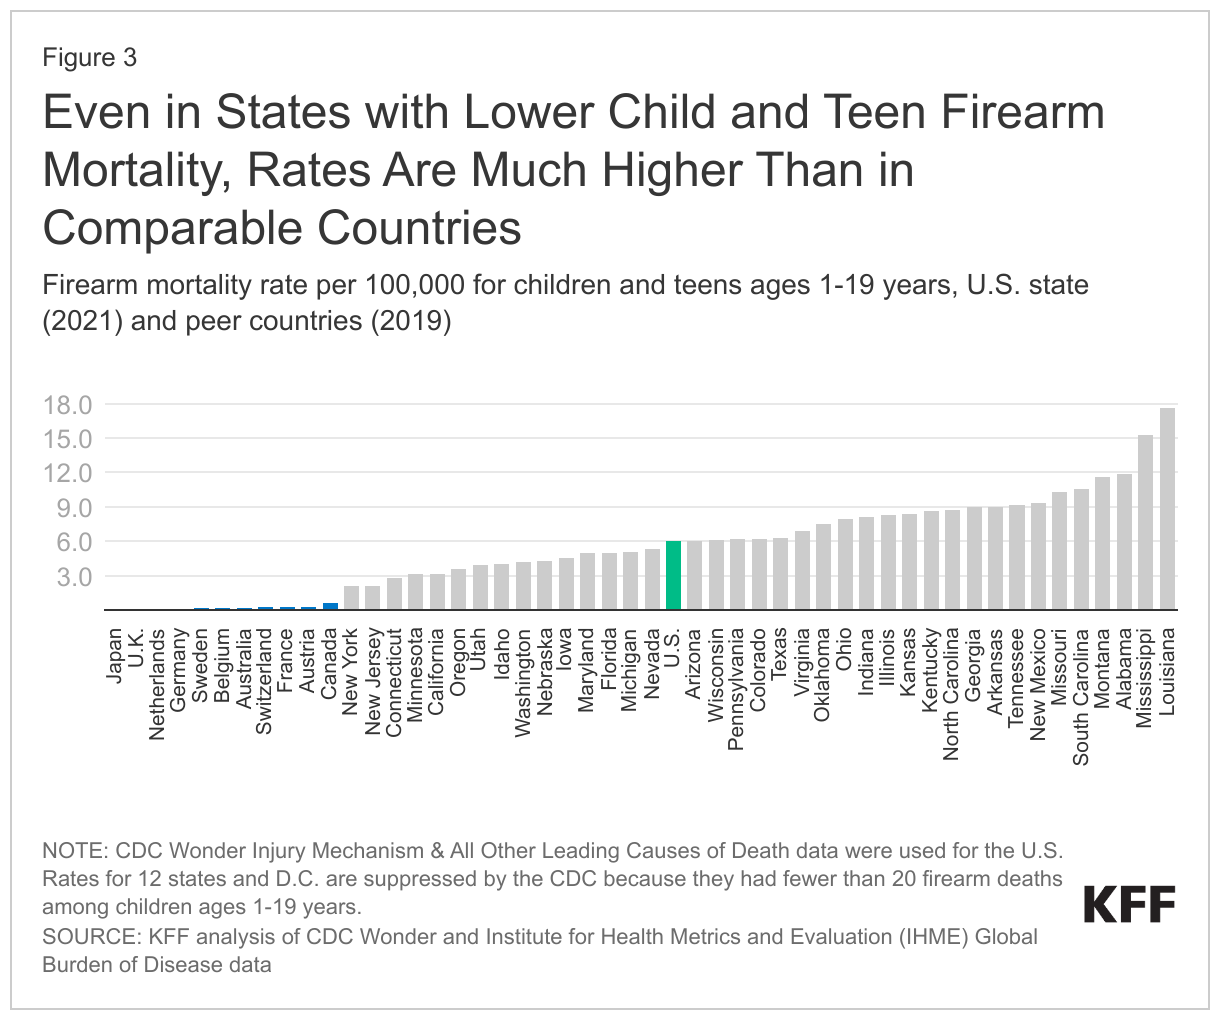
The child and teen (ages 1-19 years) firearm mortality rate varies by state in the U.S. from 2.1 deaths per 100,000 in New York and New Jersey to 17.6 deaths per 100,000 in Louisiana. Even in New York and New Jersey, which have the lowest child and teen firearm mortality rates among those with available data, the rate is still over three times that in Canada.

States with the Most Gun Laws Still Have Much Higher Child and Teen Firearm Death Rates Than Canada

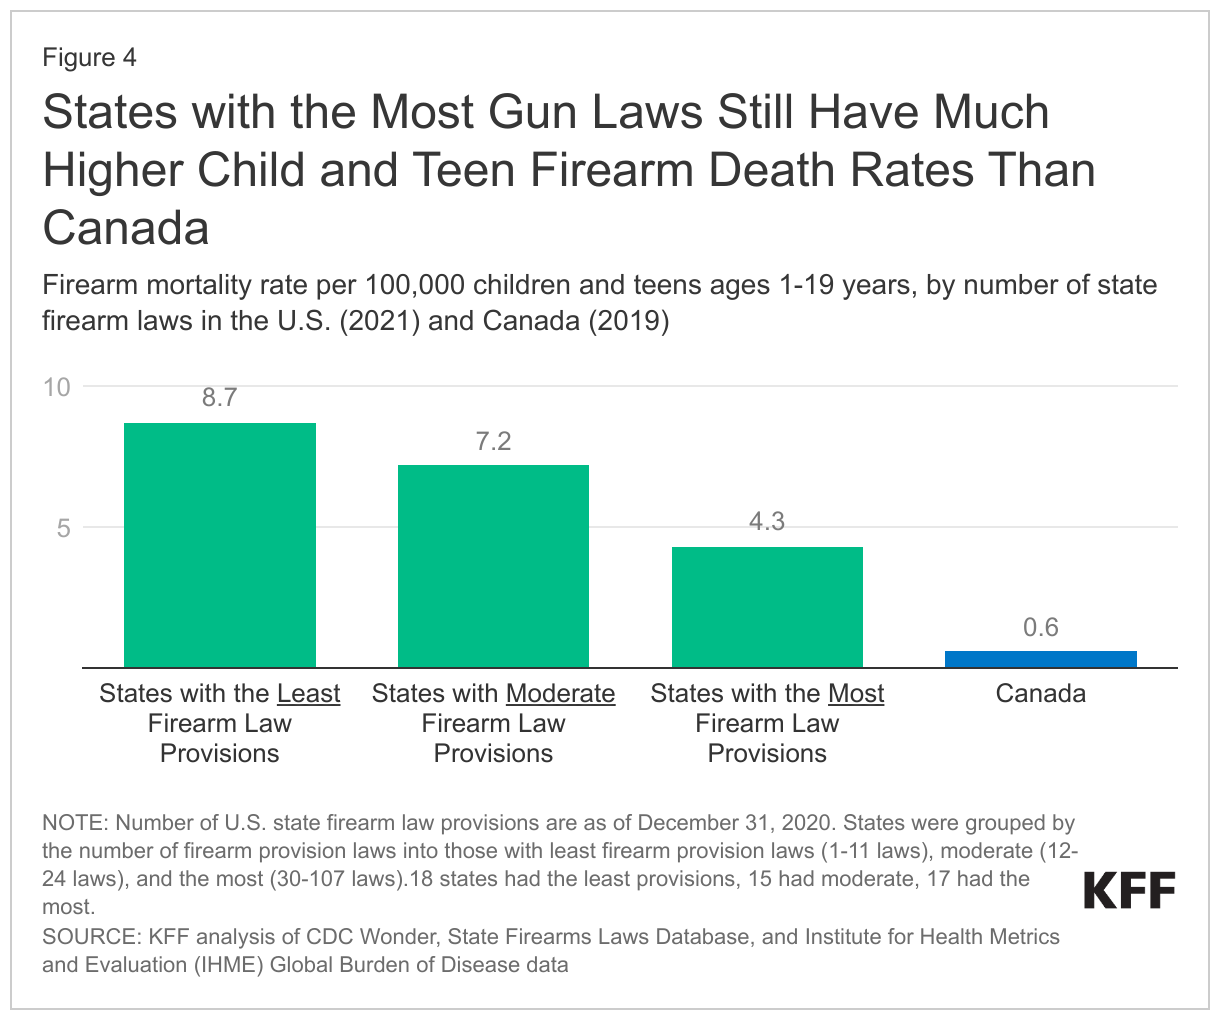
Because there is no comprehensive national firearm registry, it is difficult to track gun ownership in the U.S. Instead, we look at the correlation between the number of child and teen firearm deaths and the number of gun laws in U.S. states (based on the State Firearm Law Database, which is a catalog of the presence or absence of 134 firearm law provisions across all 50 states).

States with more restrictive firearm laws in the U.S. generally have fewer child and teen firearm deaths than states with fewer firearm law provisions. Even so, these states on average have a much higher rate of child and teen firearm deaths than that of Canada and other countries. Among comparably large and wealthy countries, Canada has the second highest child and teen firearm death rate to the U.S. However, Canada generally has more restrictive firearm laws and regulates access to guns at the federal level. In the U.S., guns may be brought to states with strict laws from out-of-state or unregistered sources.

The U.S. Is the Only Country Among Its Peers In Which There are More Gun Deaths Than Cancer or Motor Vehicles Among Children and Teens

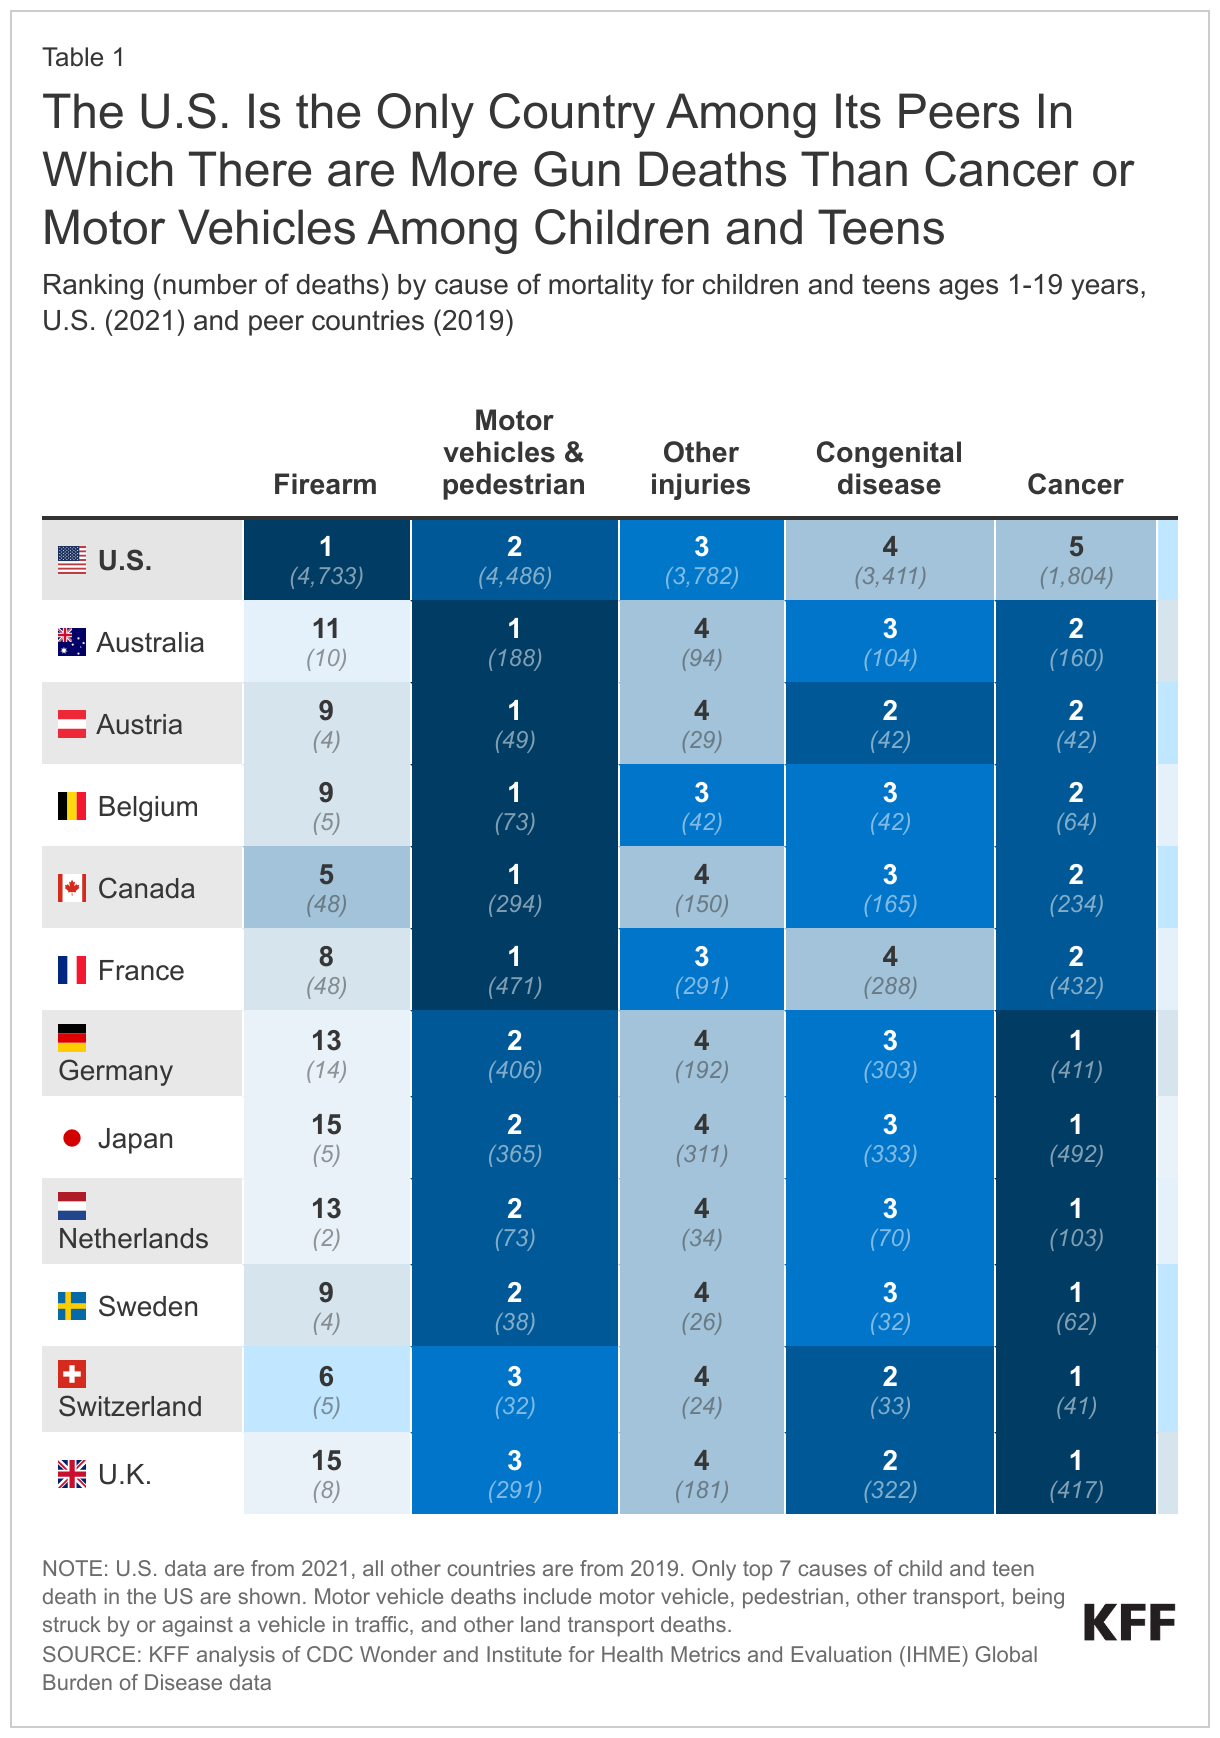
In 2020 and 2021, firearms were involved in more deaths for children and teens (ages 1-19 years) in the United States than any other type of injury or illness. In 2021, firearms were involved in 4,733 child and teen deaths.

With the exception of Canada, in no other peer country were firearms among the top five causes of childhood and teenage death. Motor vehicle accidents and cancer are the two most common causes of death for this age group in all other comparable countries.

The categories in the chart above are more specific than CDC’s rankable causes of death. We use CDC’s data grouped by injury mechanism and illness. However, given differences in how deaths are grouped by CDC and IHME, we adapt CDC data to be comparable to IHME data. For example, pedestrian deaths are included with motor vehicle and pedestrian deaths in the chart above. See Methods for more details.

Combining all child and teen firearm deaths in the U.S. with those in other OECD countries with above median GDP and GDP per capita, the U.S. accounts for 97% of gun-related child and teen deaths, despite representing 46% of the total population in these countries. Combined, the eleven other similarly large and wealthy countries account for only 153 of the total 4,886 firearm deaths for children and teens ages 1-19 years in these nations, and the U.S. accounts for the remainder.

Firearms account for 20% of all child and teen deaths in the U.S., compared to an average of less than 2% of child and teen deaths in similarly large and wealthy nations.

Most Child and Teen Firearm Deaths Are Caused By Assault In the U.S.

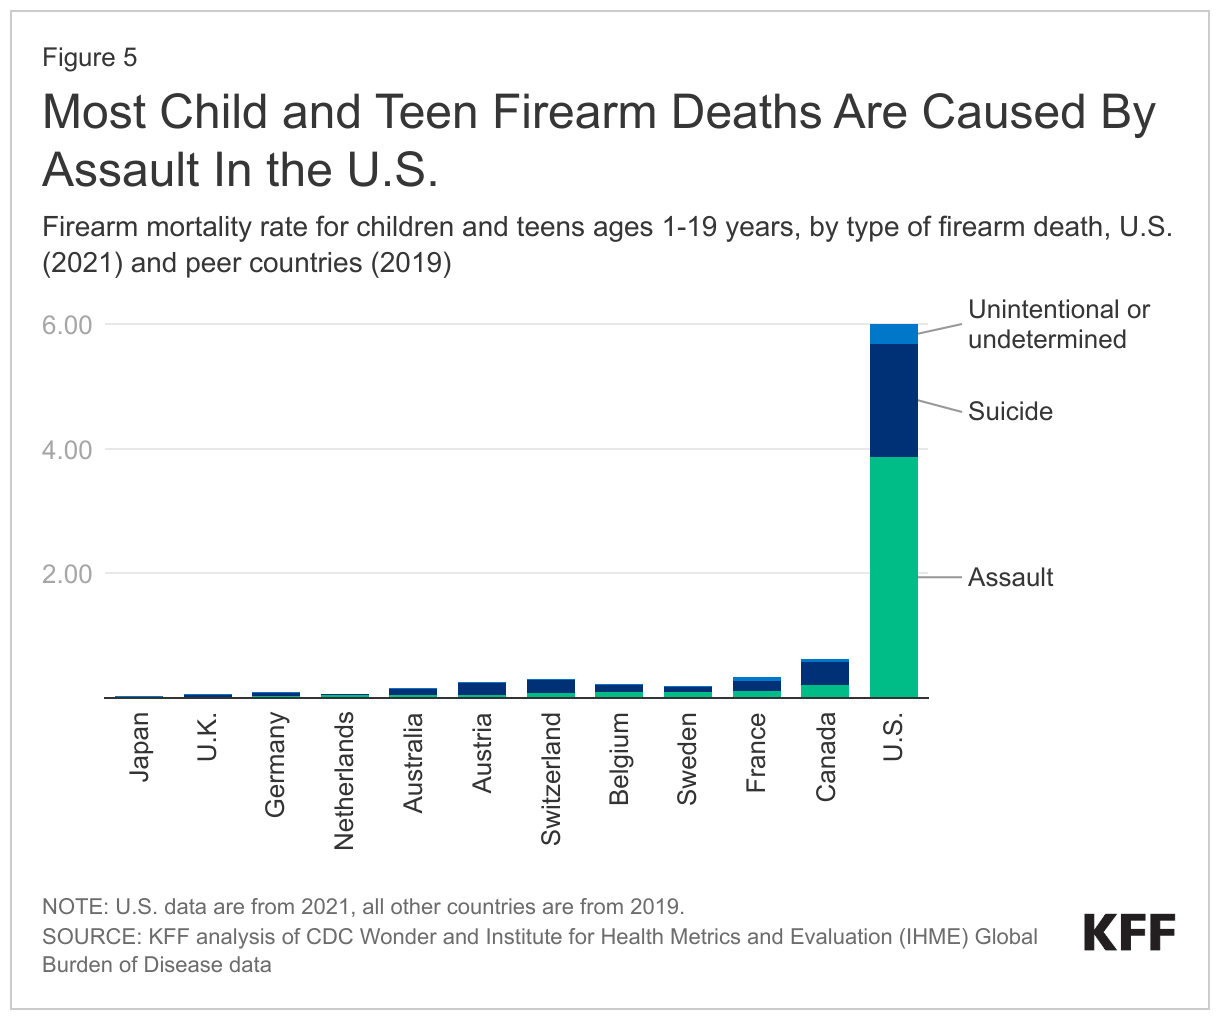
The U.S. also has the highest rate of each type of child and teen firearm death—suicides, assaults, and unintentional or undetermined intent—among similarly large and wealthy countries.

In 2021 in the U.S., the overall child and teen firearm assault rate was 3.9 per 100,000 children and teens. In the U.S., the overall suicide rate among children and teens was 3.8 per 100,000; and 1.8 per 100,000 child and teen suicide deaths were by firearms. In comparable countries, on average, the overall suicide rate is 2.8 per 100,000 children and teens, and 0.2 per 100,000 children and teens suicide deaths were by firearms.

If the U.S. child and teen suicide by firearm rate was brought down to the same level as in Canada, the peer country with the next highest rate, over 1,000 fewer children and teens would have died in 2021 alone.

U.S. Child and Teen Firearm Assault and Suicide Deaths Have Increased

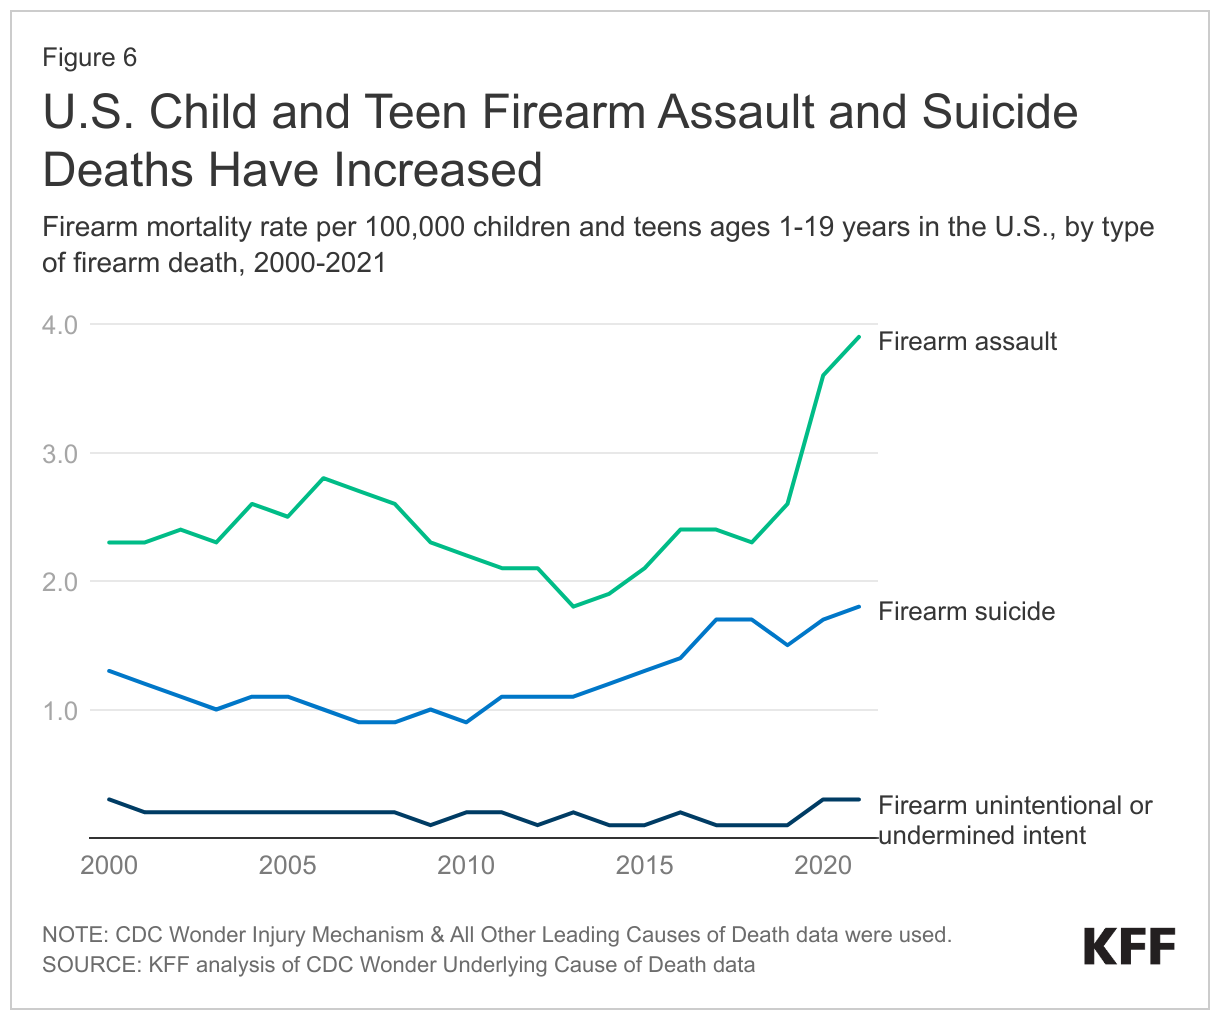
The spike in 2020 and 2021 in child and teen firearm deaths in the U.S. was primarily driven by an increase in violent assault deaths. The child and teen firearm assault mortality rate reached a high in 2021 with a rate of 3.9 per 100,000, a 7% increase from the year before and a 50% increase from 2019. The firearm suicide mortality rate among children and teenagers in the U.S. increased 21% from 2019 to 2021.

Exposure and use of firearms also have implications for mental health. Research suggests that youth may experience symptoms of post-traumatic stress disorder and anxiety in response to gun violence. Specifically, survivors of firearm-related injuries, including youth survivors, may be at increased risk of mental health conditions and substance use disorders. Furthermore, gun violence disproportionately affects many children of color, particularly Black children, and children living in areas with a high concentration of poverty.

Methods

Data from CDC Wonder 2021 Underlying Cause of Death database and IHME Global Burden of Disease (GBD) 2019 study  (Level 2 Causes of Death) were used. CDC Wonder Underlying Cause of Death grouped by Injury Mechanism and All Other Leading Causes data are used for the U.S., and IHME GBD data are used for other countries. While CDC Wonder data are available by single-year age, IHME data are only available by broad age groups (e.g., ages 1-4 years and 5-19 years). Given that international estimates are not available for children ages 1-17, we use ages 1-19 for comparisons to other countries.

Mortality rates for comparable countries were calculated using population estimates from United Nations (UN) Population Prospects data. Mortality rates for the U.S. were taken from CDC Wonder. For the calculations of potential lives saved in the U.S., we use the upper limits of IHME’s estimates of number of deaths to minimize risk of overestimation. For estimating child and teen firearm mortality over time in the U.S., Underlying Cause of Death by Bridged-Race Categories were used between 2000 and 2018, and Underlying Cause of Death by Single-Rate Categories for 2018 through 2021.

Differences in the categorization of causes of death between the CDC and IHME were addressed by adapting the Level 2 Causes of Death categories from IHME’s GBD study. The top 20 causes of death, aggregated regardless of intent, were ranked. These top 20 causes of death include: firearms, motor vehicle traffic, other injuries, congenital diseases, cancer, substance use disorders, cardiovascular diseases, infectious diseases, chronic respiratory diseases, respiratory infections, neurological disorders, diabetes and kidney diseases, maternal and neonatal complications, digestive diseases, nutritional deficiencies, HIV/AIDS and STIs, musculoskeletal disorders, skin and subcutaneous diseases, other mental disorders, and neglected tropical diseases. Unintentional firearm deaths include undetermined intent firearm deaths. Motor vehicle deaths include motor vehicle, pedestrian, other transport, being struck by or against a vehicle in traffic, and other land transport deaths. Other injuries encompass all injuries that are not from firearms, motor vehicles, or poisonings from substance use disorders, but not from injuries incurred via medical care. Cancer includes both malignant and in situ neoplasms. Congenital diseases include congenital malformations, deformations, and chromosomal disorders, as well as any disease/disorder that could not be identified via laboratory tests or examinations. Other mental disorders (not shown in the tables above but accounted for in analyses) include all deaths from mental health disorders, excluding suicide via firearm or other injury or poisonings via substance use disorder.

News Release

One Year After the Launch of 988, the National Suicide and Crisis Hotline Has Received Nearly 5 Million Combined Calls, Texts, and Chats  

Published: Jul 14, 2023

Since its launch in July 2022, the 988 national suicide and crisis hotline has received about 4 million contacts, a 33 percent increase from the year before, according to a new KFF analysis of publicly available data through May 2023. The contacts include more than 2.6 million calls, over 740,000 chats, and more than 600,000 texts. The total number of contacts rises to almost 5 million when nearly 1 million additional contacts from the Veterans Crisis Line (VCL) are included, which were reported by the federal Substance Abuse and Mental Health Services Administration (SAMHSA), but aren’t yet publicly available.

Overall, the 988 line steers callers who are suicidal or experiencing a behavioral health crisis to the renamed “988 Suicide & Crisis Lifeline,” through which they can be connected to a local Lifeline counselor and may receive crisis counseling, resources, and referrals. Before 988, the Lifeline crisis hotline–established in 2005–was typically accessed through a 10-digit number, which was difficult for callers experiencing a mental health crisis to recall.

Since the 988 launch, there has been a notable increase in the rate of answered contacts, coupled with considerable decreases in waiting times for users. The 988 in-state answer rate varies widely across states, ranging from 55 percent in Alabama to 98 percent in Mississippi in April-May 2023, the latest data available. An in-state answer rate is a measure of the percentage of calls answered within state borders. 988 uses the caller’s area code to route the call to the crisis center closest to that area code.

If local centers don’t answer calls, they are redirected to out-of-state overflow facilities, which handle approximately 8 percent of all calls nationally. If national overflow facility counselors are not familiar with local resources, they may not be able to assist callers with treatment referrals or extra assistance, which can be better provided from local crisis centers.

Although the federal government spent money to assist with the implementation of 988, ongoing funding relies heavily on local and state funds. In May, the Biden administration announced an additional $200 million in funding opportunities to assist states in developing 988 infrastructure and related crisis services.

To date, six states have enacted legislation to fund crisis services through telecom fees, including California, Colorado, Nevada, Virginia, Washington, and most recently Minnesota. Furthermore, Oregon and Delaware are approaching final legislative approval, with new 988 telecom fees having passed in the legislature and awaiting the signature of the governor. Three other states have pending telecommunications fee legislation.

News Release

In 2022, Donor Governments Spent US$8.2 billion on Efforts to Fight HIV/AIDS Globally, Returning to 2020 Funding Levels and Still Below the High-water Mark of Almost a Decade Ago

Published: Jul 13, 2023

A new report from KFF and The Joint United Nations Programme on HIV/AIDS (UNAIDS) reveals that donor governments disbursed US$8.2 billion in 2022 to combat HIV in low- and middle-income countries, returning to 2020 funding levels and still below the high-water mark of $8.6 billion in 2014. The funding supports HIV care and treatment, prevention, and other services in low- and middle-income countries.

Although total donor government funding for HIV increased in 2022 compared to the year before, this increase was primarily because of the timing of U.S. payments rather than increased donor government commitments.

While there has been significant progress in addressing the HIV epidemic—there were 1.3 million new infections in 2022, down from approximately 2 million a decade ago, and almost half as many AIDS-related deaths—new infections and AIDS-related deaths are on the rise in some regions, including in Eastern Europe and Central Asia and the Middle East and North Africa. Further, more than 9 million people living with HIV still lack access to antiretroviral therapy.

The U.S. continues to be the largest donor to HIV, providing 74% of all donor government HIV funding (US$6.1 billion), followed by France (5%, US$382 million), the United Kingdom (5%, US$376 million), the European Commission (4%, US$328 million), and Germany (2%, US$191 million). The U.S. also ranked first when standardized by the size of its economy, followed by the Netherlands, France, Sweden, and Denmark.

“UNAIDS data show clearly that progress towards ending AIDS is the strongest in the countries that have the most financial investments,” said Winnie Byanyima, Executive Director of UNAIDS. “Today, world leaders are faced with an unprecedented opportunity to end AIDS by 2030. However, globally in 2022, funding was nearly US$ 9 billion short of the US$ 29.3 billion needed by 2025. By investing now, donors will not only push forward the end of AIDS but will also be better prepared for future pandemics.”

“Our analysis shows that donor government funding for HIV is stable but stagnant, with current levels below the high-water mark reached almost a decade ago,” KFF Senior Vice President Jen Kates said. “This contributes to uncertainty ahead, particularly in light of falling domestic resources.”

Donor governments’ bilateral aid—provided directly to or on behalf of specific countries rather than to multilateral organizations—was US$5.6 billion in 2022, an increase of almost US$130 million compared to 2021 (US$5.5 billion), primarily because of the timing of U.S. payments.

Total bilateral funding from donor governments, other than the United States, has decreased each year for more than a decade (by almost US$1.4 billion or 80% since 2011). While increases in multilateral funding have offset these declines in some years, overall funding from these donor governments is still more than US$1.0 billion below where it was just over a decade ago.

The report, “Donor Government Funding for HIV in Low- and Middle-Income Countries in 2022” is part of a collaborative tracking effort between UNAIDS and KFF that began almost 20 years ago, just as new global initiatives were being launched to address the epidemic. The analysis includes data from all 31 members of the Organisation for Economic Co-operation and Development (OECD)’s Development Assistance Committee (DAC), as well as non-DAC members who report data to the DAC.

The data included in this report are also included in a broader UNAIDS global report, which examines all sources of funding for HIV relief, including local governments, non-governmental organizations, and the private sector.

News Release

10 Prescription Drugs Accounted for $48 Billion in Medicare Part D Spending in 2021, or More Than One-Fifth of Part D Spending That Year  

Published: Jul 12, 2023

A new KFF analysis finds that the 10 top-selling prescription drugs under Medicare Part D comprised less than 1 percent of all covered drugs in 2021, but accounted for 22 percent, or $48 billion, of gross Medicare Part D drug spending that year.

The analysis provides context for understanding the federal government’s new authority under the Inflation Reduction Act to negotiate prices for some high-spending drugs covered by Part D, Medicare’s outpatient prescription drug benefit program, and Part B, which covers physician and outpatient services, including drugs administered by physicians and other providers.

All of the 10 top-selling Medicare Part D drugs in 2021 were brand-name drugs. Five of them were diabetes drugs, including Ozempic, which belongs to a class of medications that lately have gained attention because they are also effective for weight loss. Other drugs in the top 10 included Eliquis, a blood thinner that was the No. 1 selling drug in 2021, followed by Revlimid, a treatment for multiple myeloma, and Xarelto, a blood thinner.

Total Gross Sending on The Top 10 Medicare Part D Drugs in 2021 Ranged from $2.6 Billion for Ozempic, a Diabetes Drug, to $12.6 Billion for Eliquis, a Blood Thinner

While the drug price negotiations begin modestly with 10 drugs in the first year, KFF’s research shows that even a relatively small number of drugs can command a substantial share of spending in Medicare. The number of drugs subject to price negotiation will grow in subsequent years and may include drugs covered under Part B beginning in 2028. Drugs will be selected for negotiation from among those with the highest gross prescription drug costs under Medicare.

It is important to note that this analysis, based on 2021 data from the Centers for Medicare and Medicaid Services (CMS), is not designed to identify which drugs are likely to be subject to price negotiation for 2026. CMS will use more current spending data and consider several factors, including FDA approval date and generic availability, in making that determination. CMS will publish the names of the first 10 Part D drugs selected for price negotiation by September 1, 2023.

In 2021, Part D covered more than 3,500 prescription drug products, with total gross spending of $216 billion, not accounting for rebates paid by drug manufacturers to pharmacy benefit managers. Total Part B drug spending was $40 billion on more than 600 covered drugs in 2021, but Part B drugs will not be subject to price negotiation until 2028.

A Small Number of Drugs Account for a Large Share of Medicare Part D Spending

Published: Jul 12, 2023

The Inflation Reduction Act requires the federal government to negotiate the price of certain high-spending drugs covered by Medicare Part D, Medicare’s outpatient prescription drug benefit program, and Medicare Part B, which covers physician and outpatient services, including drugs administered by physicians and other providers. Under the new Medicare Drug Price Negotiation Program, the number of drugs subject to price negotiation will be limited to 10 Part D drugs for 2026, another 15 Part D drugs for 2027, another 15 Part D and Part B drugs for 2028, and another 20 Part D and Part B drugs for 2029 and later years. The number of drugs with negotiated prices available will accumulate over time.

The 10 Part D drugs that will be selected for price negotiation for 2026 will be published by September 1, 2023. These 10 drugs will be chosen from the top 50 negotiation-eligible Part D drugs with the highest total Medicare Part D expenditures (defined as total gross covered prescription drug costs). Subject to specific exclusions and exceptions, drugs qualify for price negotiation if they are single-source brand-name drugs or biological products without therapeutically-equivalent generic or biosimilar alternatives, and are at least 7 years (for small-molecule drugs) or 11 years (for biologics) past their FDA approval or licensure date, as of the date that the list of drugs selected for negotiation is published.

This analysis provides context for understanding the potential impact of negotiating prices for a limited number of Medicare-covered drugs by identifying the 10 top-selling drugs in 2021, measuring the share of total Medicare Part D drug spending accounted for by top-selling drugs that year, and examining changes in spending and use of these drugs since 2018 (the first year that all 10 of the drugs were covered under Part D). We focus on drugs covered under Part D, rather than Part B, since negotiation will be limited to Part D drugs for the first two years of the negotiation program. We ranked drugs by total gross spending in 2021 since that is the measure that will be used to rank drug products in the negotiation program. Our analysis is based on Centers for Medicare & Medicaid Services’ data on Medicare Part D spending by drug.

It is important to note that this analysis is not designed to identify which drugs are likely to be subject to price negotiation for 2026, since we do not take into account all of the factors that determine whether a drug is negotiation-eligible and we do not have access to the more current spending data that CMS will use in selecting drugs for price negotiation.

A small number of drugs account for a disproportionate share of Medicare Part D prescription drug spending, with the 10 top-selling drugs accounting for nearly one-fourth of gross Part D spending in 2021

In 2021, Medicare Part D covered more than 3,500 prescription drug products, with total gross spending of $216 billion, not accounting for rebates paid by drug manufacturers to pharmacy benefit managers (PBMs). The 10 top-selling Part D drugs accounted for 0.3% of covered drugs and 22% of total gross Medicare drug spending in 2021 (Figure 1). The top 100 drugs, representing just 3% of covered drugs, accounted for 61% of total gross spending that year.

Relatively Few Drugs Account for a Large Share of Medicare Part D Spending

Total gross spending on the top 10 Medicare Part D drugs in 2021 ranged from $2.6 billion for Ozempic, a diabetes drug, to $12.6 billion for Eliquis, a blood thinner

In the aggregate, gross Medicare drug spending on the top 10 Part D drugs in 2021 was $48 billion. Eliquis, a blood thinner manufactured by Bristol Myers Squibb, was the top-selling drug, accounting for a quarter of this total, or $12.6 billion (Figure 2). Gross Medicare Part D spending exceeded $5 billion for both Revlimid, a treatment for multiple myeloma also manufactured by Bristol Myers Squibb, and Xarelto, a blood thinner manufactured by Janssen.

Total Gross Sending on The Top 10 Medicare Part D Drugs in 2021 Ranged from $2.6 Billion for Ozempic, a Diabetes Drug, to $12.6 Billion for Eliquis, a Blood Thinner

Five of the 10 top-selling Part D drugs in 2021 are diabetes drugs: Trulicity, Januvia, Jardiance, Lantus Solostar, and Ozempic. Notably, Ozempic belongs to a class of medications that have gained attention in recent months because they are highly effective weight loss agents. Manufactured by Novo Nordisk, Ozempic was approved by the FDA in 2017 as a treatment for type 2 diabetes. While Medicare does not cover Ozempic when prescribed off-label for weight loss due to the current law prohibition on Medicare coverage of drugs when used for weight loss, it is covered as a diabetes drug. Gross Part D spending on Ozempic, used by 0.5 million Part D enrollees in 2021, totaled $2.6 billion.

Also included in the top 10 is Imbruvica, a cancer treatment manufactured by Pharmacyclics, with gross Medicare spending of $3.2 billion in 2021, and Humira Citrate-free (Cf) pen, a treatment for rheumatoid arthritis (among other conditions), manufactured by Abbvie, with gross Medicare spending of $2.9 billion in 2021. (While the original version of Humira was approved in 2002, Abbvie launched the citrate-free version in 2018). Gross Medicare spending across all formulations of Humira totaled $4.7 billion in 2021, including the citrate-free and original versions and various formulations and dosages of each version approved for different indications and populations.

In the aggregate, gross Medicare spending for the 10 top selling Part D drugs more than doubled between 2018 and 2021

Between 2018 and 2021, aggregate gross spending on the 10 top-selling drugs in 2021 increased from $22 billion to nearly $48 billion. The increase in gross spending on these 10 drugs alone accounted for more than half of the increase in gross Medicare spending across all covered Part D drugs over these years. In the aggregate, gross Part D spending rose from $166 billion in 2018 to $216 billion in 2021.

Over these years, total gross Part D spending on Eliquis, the top selling drug in Medicare Part D in 2021, increased by 2.5 times from $5 billion in 2018 to $12.6 billion in 2021; gross spending for the diabetes drug Trulicity more than tripled from $1.4 billion to $4.7 billion; and gross spending on the diabetes drug Jardiance increased more than five times from $0.7 billion to $3.7 billion (Figure 3). For all of these drugs, the percentage increase in gross spending between 2018 and 2021 outpaced the percentage increase in the number of users over these years (data not shown, see Figure 2 for number of users per drug in 2018 and 2021).

Spending on Each of the Top 10 Medicare Part D Drugs in 2021 Has Increased Since 2018

Conclusion

The Medicare drug price negotiation program established by the Inflation Reduction Act is designed to target high-spending drugs that have been on the market for several years and lack generic or biosimilar competition. CBO estimates nearly $100 billion in Medicare savings between 2026 and 2031 from the drug negotiation program. Our analysis shows that Medicare Part D spending is highly concentrated among a small share of covered brand-name drugs, and that increases in gross spending on the 10 top-selling drugs have contributed to a substantial increase in overall Medicare drug spending in recent years.

While this analysis is not designed to identify which drugs will be selected for negotiation for 2026, two of the 10 top-selling Part D drugs in 2021 would not be eligible for selection based on when they were approved (Trulicity, a biologic approved in 2014, and Ozempic, a small-molecule drug approved in 2017) and three would not be eligible for selection based on generic or biosimilar availability in 2023 (Revlimid, Humira, and Lantus). The final list will be determined based on more current spending data than is publicly available and consideration of several factors not included here. While all of the 10 top-selling Part D drugs in 2021 will not be included on the list of 10 drugs selected for price negotiation this year, this analysis suggests that targeting negotiation on a small number of high-spending drugs could affect a disproportionate share of Medicare drug spending in the future.

This work was supported in part by Arnold Ventures. KFF maintains full editorial control over all of its policy analysis, polling, and journalism activities.

Methods

This analysis is based on 2021 Medicare Part D Spending by Drug data from the Centers for Medicare & Medicaid Services (CMS). The data includes spending for beneficiaries in both traditional Medicare and Medicare Advantage who are enrolled in Medicare Part D plans.

Drug spending metrics for Part D drugs presented in the CMS data are based on the gross drug cost, which represents total spending for the prescription claim, including Medicare, plan, and beneficiary payments. The Part D spending metrics do not reflect manufacturer rebates or other price concessions, because CMS is prohibited from publicly disclosing such information.

We sorted the list of drugs in the Part D dashboard in 2021 (n=3,566) by total spending and calculated the percent of total spending accounted for by each drug, summing across the top 10, 15, 20, 50, and 100 drugs ranked by total spending.

We used the FDA’s Drugs@FDA database to identify FDA approval dates for the top 10 drugs by Part D gross spending in 2021.