KFF designs, conducts and analyzes original public opinion and survey research on Americans’ attitudes, knowledge, and experiences with the health care system to help amplify the public’s voice in major national debates.
Enrollment in the Affordable Care Act (ACA) Marketplaces will hit another record high in 2024, with sign-ups to date topping 20 million—already 4 million above last year’s record high.
The Medicaid unwinding, enhanced Marketplace subsidies that make coverage more affordable, as well as increased marketing, outreach, and enrollment assistance have all played a role in this growth, according to a new analysis from KFF.
Marketplace sign-ups have nearly doubled since 2020. The Medicaid unwinding is likely contributing to 2024’s record-high enrollment. States provided continuous enrollment in Medicaid during most of the pandemic, but disenrollments resumed in April.
Unlike most previous years, the individual market grew mid-year in 2023, outside the open enrollment window and at a time when attrition normally occurs. From early April to the end of September 2023, enrollment in the individual market grew by 5.7%, or just over 1 million enrollees. The only other time the ACA individual market recently saw mid-year growth was in 2021, when the American Rescue Plan’s enhanced subsidies were first rolled out.
Enhanced subsidies make coverage more affordable generally and ease the transition from Medicaid to private coverage, with zero-premium plans available to more people with low incomes. In addition to these new enrollees, enhanced subsidies may also be helping current enrollees maintain their coverage. The enhanced subsidies will expire at the end of 2025, requiring Congress to decide whether to extend them using additional federal funding.
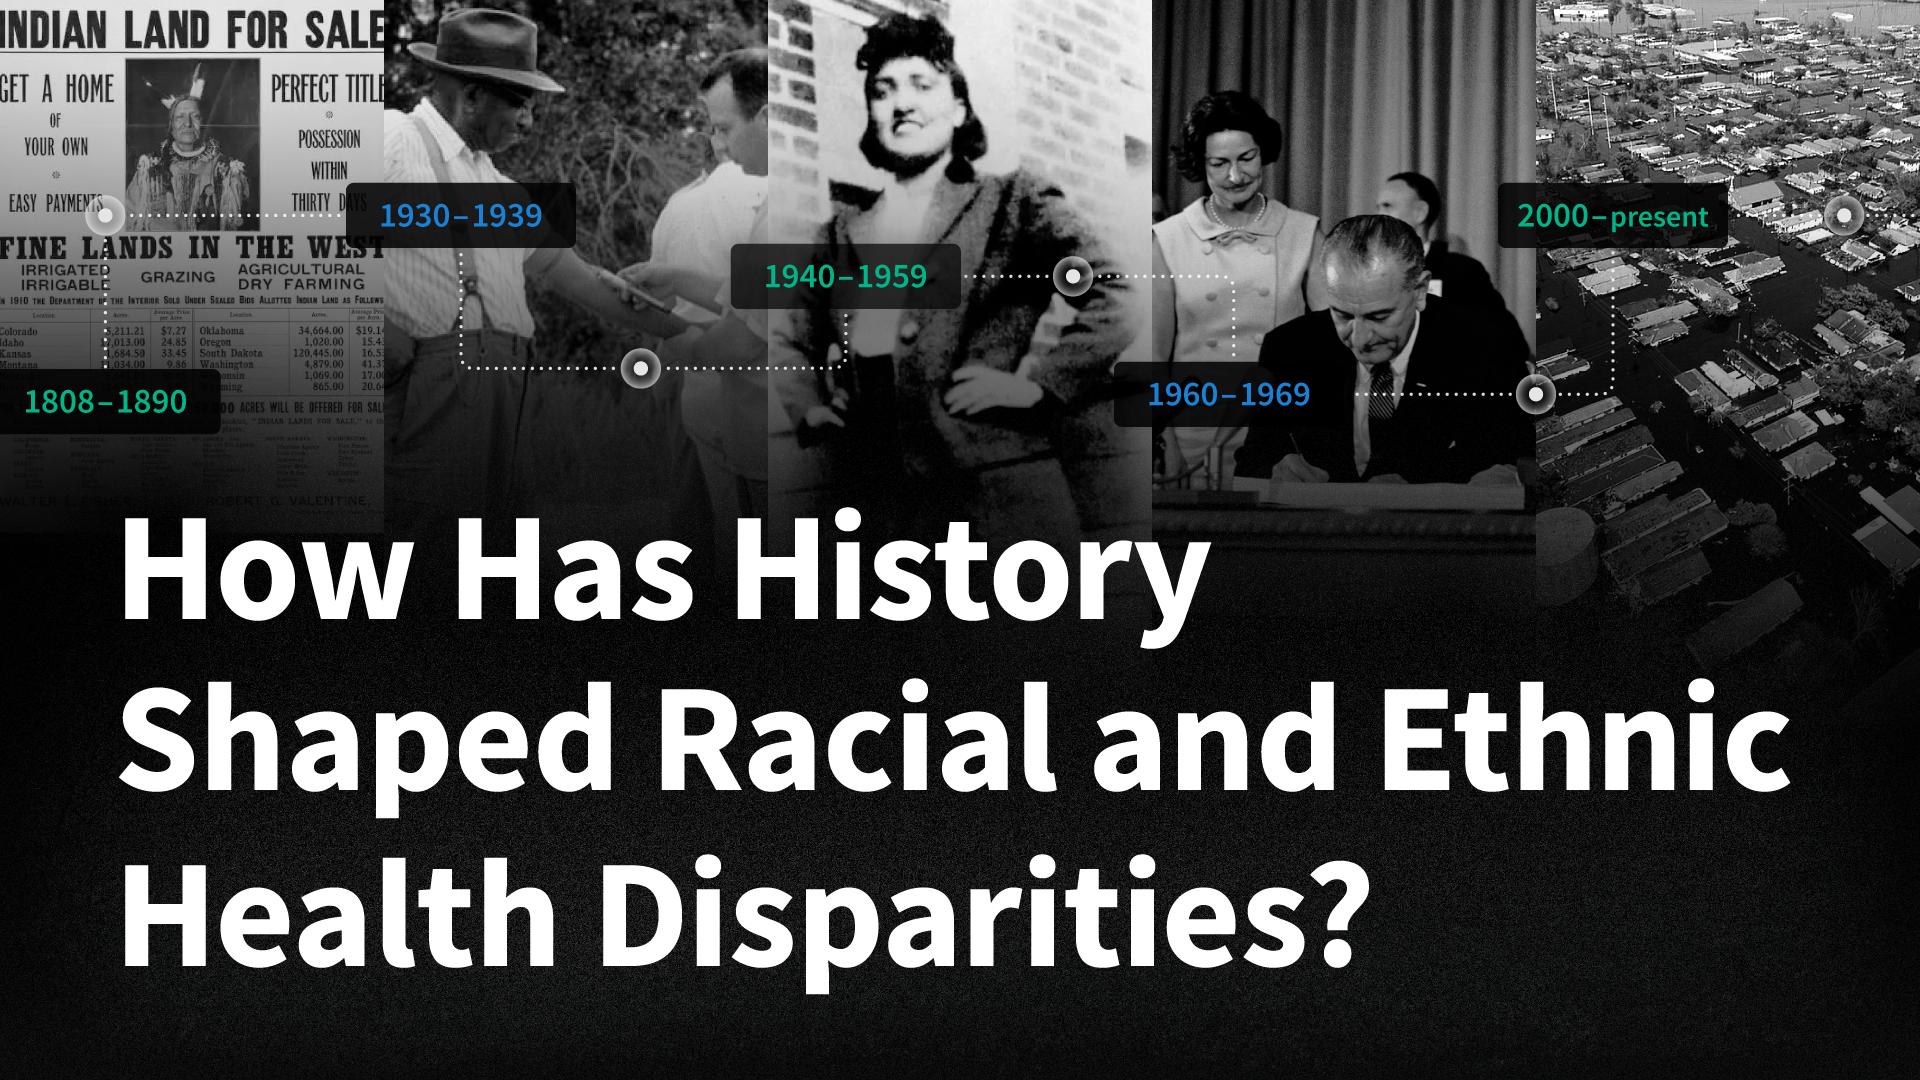
KFF’s new interactive timeline explores how history has shaped racial and ethnic health disparities and the lasting effects that persist to this day. The timeline describes major U.S. federal policies and events since the early 1800s that are linked to present-day health disparities. It also covers policies that impact health coverage and access to care, medicine, and social and economic policies that influence health as well as efforts to tackle inequalities.
The timeline includes 80 entries categorized as “Health & Medicine” or “Broader Policies.” Users can navigate through historical periods to see the expansive selections of historical events. Clicking on an entry reveals a description of the relevant event, an archival image referencing the event, and the ability to explore the entries in more detail via original source material.
While not exhaustive, the timeline provides context for the challenge of addressing current health and healthcare disparities, acknowledging the complex history that shapes them.
With More than Half of Medicaid Enrollees Awaiting their Renewal Process, New Report Highlights Lessons Learned that Can Inform State Efforts and Reduce Disenrollments for “Procedural” Reasons
Interviews in Four States Suggest Strategies to Improve Enrollee Communication and Boost Number of Medicaid Enrollees Moving to Marketplace Coverage
At the beginning of 2024, nine months into states’ efforts to unwind the Medicaid continuous enrollment provision and reverify enrollees’ eligibility, states have completed renewals for less than half of all enrollees.
To gain a better understanding of what challenges states are facing and the effects of different unwinding strategies, KFF interviewed state Medicaid officials in Arizona, Indiana, and Pennsylvania, as well as others involved, including representatives from Medicaid, managed care plans, legal aid organizations, and Marketplace navigators in Arizona, Florida, Indiana, and Pennsylvania. A new report highlights some key insights stemming from those interviews. For example:
The volume of renewals, systems issues, and staffing shortages have posed significant challenges to states and, in turn, enrollees. In response, states have taken steps to streamline renewal processes and increase automated renewals. As of December, all study states except Florida had adopted waivers to increase automated renewal rates, and state officials noted that flexibilities related to verifying income and assets were most helpful at increasing those rates.
States have also used an array of outreach strategies and partnered with multiple entities involved in the unwinding to reach Medicaid enrollees. All four states have increased communications with enrollees using emails, texts, and phone calls in addition to mailed notices. However, participants in the states said Medicaid renewal and termination notices can be difficult to understand, and long call center wait times hinder the ability of enrollees to get needed help.
Some individuals who are disenrolled from Medicaid for procedural reasons are re-enrolling after a gap in coverage. While data on the share of people reenrolling are limited, study states are conducting additional outreach to enrollees who have been procedurally disenrolled to encourage them to complete the renewal process so they can reenroll if still eligible. Interview participants reported that, even with enhanced Affordable Care Act Marketplace premium subsidies, affordability remains a barrier to enrollment for people trying to transition from Medicaid to Marketplace coverage. The number of people disenrolled from Medicaid who enroll in Marketplace coverage remains modest in all four states, according to the people interviewed.
Nationally, the latest KFF tracking shows nearly 14.4 million people have been disenrolled and nearly 27 million reenrolled in Medicaid coverage. While many who are disenrolled may churn back onto Medicaid or transition to other coverage, many will likely become uninsured.
The report, Unwinding of Medicaid Continuous Enrollment: Key Themes from the Field, is available here.
During the COVID-19 pandemic, states kept people continuously enrolled in Medicaid in exchange for enhanced federal funding. With the end of continuous enrollment on March 31, 2023, states are required to complete an eligibility renewal for all Medicaid and CHIP enrollees by May 2024 – a process commonly referred to as “unwinding.” KFF survey data show that despite outreach, as of early November more than one-third (36%) of Medicaid enrollees had heard nothing at all about unwinding. As of January 2024, states had renewal outcomes for more than four in ten enrollees with over 14 million people disenrolled and more than 27 million reenrolled in Medicaid coverage. In December 2023, growing concern over loss of Medicaid coverage for children prompted federal officials to issue additional guidance with strategies to protect coverage and to write letters to nine states with large declines in Medicaid child enrollment, urging them to take up additional policy options to prevent disenrollments due to paperwork, or procedural, issues.
Data are important to help monitor how unwinding is going across states, but trackers and dashboards only tell part of the unwinding story. Medicaid eligibility is complex, and outcomes are the result of federal and state policy decisions but also the result of how those policies are implemented and how well eligibility and other systems work. This brief examines the perspectives of state officials and others involved in the unwinding process. KFF worked with PerryUndem to conduct interviews with representatives from Medicaid managed care plans, primary care associations, legal aid and other advocacy organizations, and navigator organizations in four states: Arizona, Florida, Indiana and Pennsylvania. In addition, the report draws on broader state input from interviews with Medicaid officials as part of the 23rd annual budget survey of Medicaid officials conducted by KFF and Health Management Associates (HMA) from June to September 2023 (early in the unwinding process). The brief provides information on outreach and engagement, renewal processes and coverage transitions, providing lessons for the ongoing unwinding process, as well as for how to conduct more effective Medicaid renewals generally in the future. Key takeaways include the following:
Communication and Engagement
States have used an array of outreach strategies and partnered with multiple entities involved in unwinding to reach Medicaid enrollees. All states reported using traditional communication campaigns with mailers and paid advertising, and some states have added text messaging and targeted outreach to certain populations, including users of long-term services and supports and people with limited English proficiency. To encourage consistent messaging and information, all four study states have developed toolkits for partner organizations that included printable and digital materials. Study states credited new strategies to update contact information, such as using the National Change of Address database and accepting updated contact information from managed care organizations (MCOs), with reductions in returned mail. While enhanced outreach efforts were generally viewed as positive, some participants said enrollees have been overwhelmed by the volume of contact they have received and, in some cases, unclear messages have led to confusion.
State engagement with those involved with unwinding was described as a positive aspect of unwinding, and feedback loops have helped identify early problems. Many states, including three of the study states, increased engagement and coordination with others involved in unwinding, holding regular meetings to provide updates and review data. In the study states, participants noted these meetings have provided an opportunity to create feedback loops to alert states to potential problems and build relationships in the process. In contrast, limited state engagement and communication contributed to more reports of problems with the unwinding process and frustration among groups involved with the unwinding.
Renewal Processes
The volume of renewals, systems issues, and staffing shortages have posed significant challenges to states. Across many states, older systems that require manual workarounds to meet federal requirements have exacerbated staffing shortages and negatively impact the processing of renewals. While systems are generally working well in Arizona and Indiana, Pennsylvania’s system was not designed to conduct ex parte renewals for a large number of Medicaid enrollees, increasing the burden on eligibility staff to manually process most renewals. Study state officials noted that staffing shortages and inexperienced staff have contributed to backlogs and disenrollments of people who are likely still eligible early in the process; these states responded with additional training and other efforts to increase staff.
States have taken steps to streamline renewal processes and increase ex parte, or automated, renewals. As of January 2024, all study states except Florida had adopted a range of 1902(e)(14) waivers and other flexibilities to increase ex parte rates and streamline renewals. Guidance from CMS in December 2023 announced these waivers will be available through the end of 2024 unless approved for a longer duration. A number of states, including Indiana, have also taken steps to increase ex parte renewals for people who qualify on the basis of disability or over age 65, referred to as non-MAGI populations. When asked about the most helpful flexibilities, states most often pointed to those allowing use of Supplemental Nutrition Access Program (SNAP) data to renew Medicaid, streamlining renewals for those with no and low income, and waiving the asset limit test. Officials in the study states have prioritized ex parte renewals, both automated and manual, as a strategy for reducing procedural disenrollments.
All four study states have increased the number of communication touch points with enrollees. In an effort to improve response rates, study states increased the number of enrollee contacts during the renewal process. For example, Pennsylvania went from sending one mailer ahead of the renewal notice to adding 11 enrollee contacts. States have also expanded communication modes to include emails, texts, and phone calls in addition to mailed notices.
Participants in all four study states reported that Medicaid renewal and termination notices can be difficult to understand. Participants described a variety of problems with notices, from lack of clarity on what actions or documentation are needed for renewal to misleading or incorrect information. Issues with notices were most acute in Florida where advocates have filed a lawsuit, contending notices are confusing, fail to explain why individuals lost Medicaid coverage, and sometimes include incorrect information.
Participants reported challenges getting through to call centers when enrollees needed assistance with their renewals, particularly for people with limited English proficiency. According to study participants, call center wait times are often long and it can be difficult to connect with someone able to assist with complicated cases. Advocates noted wait times were longer for those requesting a language other than English. These problems were echoed by state officials in a number of states.
Coverage Transitions
Some individuals who are disenrolled from Medicaid for procedural reasons are reenrolling after a gap in coverage. While most states are not reporting data on the number of people reenrolling in Medicaid, two study states (Arizona and Pennsylvania) are reporting these data. In Arizona, about half of people who complete their renewal during the 90-day reconsideration period have their coverage reinstated. States have increased communication with people procedurally disenrolled who may be eligible – Arizona and Pennsylvania send letters following disenrollment to let people know they still have time to regain their coverage without completing a new application. Participants noted that when process and systems issues result in disenrollment, it can undermine peoples’ trust in the system and can discourage them from completing their renewal or reapplying.
While children in some states are seamlessly transitioning to CHIP, in other states children are experiencing gaps in coverage. When children in Arizona and Indiana are found to be ineligible for Medicaid, the states automatically enroll them in CHIP, if eligible, without any action required from the family. Participants reported that challenges and glitches with a recent change in Pennsylvania to integrate the CHIP eligibility system with Medicaid have led to some children losing coverage. While information for children determined ineligible for Medicaid is automatically transferred to CHIP, slow processing times may lead to gaps in coverage for some children.
Participants reported that even with enhanced Marketplace premiums, affordability remains a barrier to enrollment. Respondents generally said that account transfers to the Marketplace were happening as expected; however, the number of people disenrolled from Medicaid who enroll in Marketplace coverage remains low in all study states. Participants said that for some people, the deductibles and cost sharing are too high. They also noted that not everyone is aware that Marketplace coverage is an option.
As states continue processing renewals for the more than half of enrollees whose eligibility must be still redetermined, the perspectives of state officials and others involved in unwinding provide valuable insights into what is working well and where there are challenges and room for improvement. States can make changes in the near term to help enrollees maintain Medicaid or transition to other coverage during the unwinding period, but they can also apply the lessons learned to make longer-term improvements to Medicaid renewal processes.
Issue Brief
Introduction
During the COVID-19 pandemic, states kept people continuously enrolled in Medicaid in exchange for enhanced federal funding. With the end of continuous enrollment on March 31, 2023, states began the process of redetermining eligibility for all Medicaid enrollees and disenrolling those who are no longer eligible or whose eligibility could not be determined – a process commonly referred to as “unwinding.” KFF survey data show that despite outreach, as of early November more than one-third (36%) of Medicaid enrollees had heard nothing at all about unwinding. As of January 2024, states had renewal outcomes for more than four in ten enrollees with over 14 million people disenrolled and more than 27 million reenrolled in Medicaid coverage. Data are important to help monitor how unwinding is going across states, but trackers and dashboards only tell part of the unwinding story. Medicaid eligibility is complex, and outcomes are the result of federal and state policy decisions but also the result of how those policies are implemented and how well eligibility and other systems work.
Leading up to unwinding, the federal government issued guidance and provided states with the option to adopt a range of new policies to help promote continuity of coverage (in Medicaid for those who remain eligible or though other coverage for those who are no longer eligible). States have been engaged in unprecedented levels of new outreach, but the volume of redeterminations coupled with workforce shortages and systems issues present challenges. Focus groups with enrollees revealed that while many have been able to successfully renew Medicaid coverage, many were disenrolled due to confusion and barriers to completing the renewal process. While some who were disenrolled transitioned to other coverage, many who were disenrolled faced challenges navigating appeals and also experienced out of pocket costs or gaps in access to needed care. By December 2023, the federal government had issued additional guidance and sent letters to nine states with the largest amounts of children losing Medicaid urging them to do adopt additional federal strategies to prevent families from losing coverage due to paperwork, or procedural, issues. CMS identified the top five actions states could take to reduce procedural disenrollments: improve auto-renewal (or ex parte) rates, adopt additional unwinding waivers, partner with managed care plans, support coverage transitions, and reduce call center wait times.
To gain a better understanding of what is working well during the unwinding and where there may be opportunities to improve processes, KFF worked with PerryUndem to conduct detailed interviews with state officials in Arizona, Indiana, and Pennsylvania, as well as with others involved in unwinding including representatives from Medicaid managed care plans, primary care associations (PCAs) representing federally qualified health centers (FQHCs), legal aid and other advocacy organizations, and navigator groups in Arizona, Florida, Indiana, and Pennsylvania. These states were selected because they provided early data, have a large and diverse Medicaid population, and, collectively, are geographically and politically diverse (see the Appendix for more information on key policies and characteristics in the study states).
In addition, as part of our Annual Medicaid Budget Survey for State Fiscal Years 2023 and 2024, KFF worked with Health Management Associates (HMA) to survey Medicaid directors in all 50 states and DC, as well as conduct a follow-up telephone interview, with the goal of identifying and tracking trends in Medicaid spending, enrollment, and policymaking. To address current issues, the survey and phone interview included questions regarding Medicaid unwinding. This report synthesizes themes from these interviews and the survey, examining the perspectives of states and other participants on outreach and engagement, renewal processes during the unwinding period, and coverage transitions. See the methods box at the end of this report for more detail.
This report describes state and other participant experiences with Medicaid unwinding to provide additional context for a range of policy options adopted by states through temporary 1902(e)(14) waivers to address unwinding challenges and unwinding data. These perspectives provide examples of innovation, as well as continued challenges, during the first months of unwinding. These interviews occurred over multiple months. State Medicaid unwinding is a quickly evolving landscape, as new data, greater experience, and CMS guidance influence what is happening in the field.
Outreach and Engagement
Broad Takeaways Across All States
Interviews with states about outreach strategies during the unwinding of the Medicaid continuous enrollment provision revealed that most states have used multiple outreach strategies, with states noting it was difficult to isolate the most effective strategies because they have used a “no stone unturned” approach. In addition to more traditional communication campaigns using mailers, billboards, and print/radio/TV advertising, at least 15 states have used text messaging to conduct outreach. Most states were working with a wide range of groups to reach Medicaid enrollees, including MCOs, providers (like community health centers, other primary care providers, and pharmacies), community-based organizations, navigator/assister organizations, and faith-based groups. To increase the capacity of community partners to assist with outreach, some states provided outreach grants to local organizations.
Some states mentioned focusing particular attention on certain populations. Several states described specific outreach to users of long-term services and supports (LTSS) through outbound calls, in-person assistance, and working with nursing facilities and direct care providers to enable them to assist enrollees with renewals. A few states also mentioned outreach targeting people in rural areas, tribal populations, and non-English speaking populations as well as efforts aimed at certain zip codes. While most state interviews took place over the summer, some states mentioned back-to-school outreach or working directly with children’s groups.
Despite various strategies to increase enrollee response, including by making mail more visible using “urgent” stamps or colored envelopes (e.g., a pink letter campaign in Hawaii and yellow envelopes in Texas), states continue to struggle with enrollee nonresponse. However, a few states noted that as a result of aggressive outreach to update contact information and flexibilities to accept contact information from certain partners, they have experienced reduced rates of returned mail.
Outreach Strategies
Study states are using an array of strategies to reach out to enrollees. States have introduced new methods of communications and greatly increased their enrollee outreach, expanding the number of touchpoints before renewal. All four study states offeredpubliclyavailablecommunication toolkits for partner organizations to use, which included printable materials like posters, postcards, and handouts, as well as digital materials for social media, email, or content that can be embedded into websites. Indiana has offered to print and distribute these materials to external groups at no cost. Study states have also used traditional press to raise awareness; in Pennsylvania, for example, participants commended the Secretary of the Department of Human Services for travelling across the state and holding numerous unwinding press conferences to raise awareness at the local level. To increase the reach of messaging, state officials referenced strategies such as translating outreach materials for non-English speakers. Arizona officials noted electronic communication as an effective method to reach transient populations.
Many entities involved with unwinding have been conducting outreach to amplify state efforts. Some MCOs, newly able to provide direct outreach to enrollees as a result of 1902(e)(14) waiver flexibilities adopted in three study states (Florida is the only state that has not adopted any of these waivers), mentioned they would like to see these flexibilities become permanent so they can continue this outreach after the unwinding period ends. Innovative approaches to outreach include virtual renewal training events (an Indiana MCO reported thousands of attendees for such an event) and coordination between MCOs and FQHCs so providers can work with individuals due for renewal. Some participants in Arizona and Florida noted that direct local marketing and word of mouth can be more effective than statewide ads.
Targeted outreach messages and multiple strategies to update contact information have helped to reduce returned mail. State officials reported that supplementing their outreach efforts with information from the National Change of Address (NCOA) database has been effective for automatically updating mailing addresses and targeting outreach. Pennsylvania conducted a call campaign to people identified via the database as having a change of address, while Arizona credits the NCOA database for a precipitous drop in returned mail. State officials and MCO representatives both reported that receiving contact information from MCOs has also been helpful. Arizona, Indiana, and Pennsylvania have obtained 1902(e)(14) waivers to obtain updated contact information from MCOs. In Arizona, an MCO representative reported that they are able to check enrollees’ contact information with the state’s files and, if needed, MCO staff can provide the updated information to the state.
Despite significant outreach, navigators and those providing legal aid noted that some messages have created confusion and not all enrollees were aware that Medicaid disenrollments had resumed. In Pennsylvania, participants provided examples of enrollees not receiving phone calls, text messages, or letters even after updating their contact information, leaving them unaware that they need to be on the lookout for renewal paperwork. Similarly, Florida participants encountered individuals who signed up for electronic notifications and then never received an email. An Indiana participant spoke of the opposite issue, however: enrollees were overwhelmed by the large number of calls they were receiving about renewing their coverage. Florida navigators and advocates commented that unclear messaging and poor translations led to confusion about renewals and coverage status for enrollees.
“But we’re also doing things we’ve never done. The level of outreach, engagement, advertising; you know, we have never sent text messages before, we have never sent these emails before, we haven’t done all of these reminder calls.” – Indiana State Official
“We also have met with our MCOs regularly. We started with a series of webinars and then moved to a work group that they, I think, host a every couple of weeks, so that we can continue to ask questions or answer questions about their outreach and their activity with individuals in regard to the unwinding. We provide them direction on the kinds of messaging that we’d like to see, and they submit their own kind of versions to speak to their members. Whether that be text messages, emails, regular mail, phone call, call scripts, call center scripts everything to us, and we process a review of that.” – Pennsylvania State Official
“When they’re talking with a member they’re verifying the address and the phone number on file. If it is not the correct one that is being fed to us on our eligibility file then there is a way to go in, and they can provide that information so that it gets updated through AHCCCS [the state Medicaid agency].” – Arizona Participant
“They were receiving text messages that put them in a panic that like, ‘wait a minute we’re, we’ve lost coverage?…’ The messaging that was sent [to] our community was poor translations and then also confusing.” – Florida Participant
Stakeholder Coordination
Three of the study states hold regular meetings with groups involved in unwinding to coordinate efforts, and participants value this increased engagement. These states convene regular meetings, which began before the start of the unwinding period, to provide updates on unwinding plans, review the latest unwinding data, and share updated outreach materials and messages. Arizona holds large monthly meetings with about 100 participants as well as smaller meetings to focus on unwinding data that resulted in the state expanding its data reporting and developing a comprehensive unwinding dashboard. In Pennsylvania, the stakeholder meetings include multiple officials from the Department of Human Services, which administers Medicaid, and the state-based Marketplace, known as Pennie, and help to promote interagency coordination as well as coordination with stakeholders. Participants in Arizona, Indiana, and Pennsylvania all described the increased engagement with the state Medicaid agency as a bright spot during the unwinding. Florida was the only study state that did not have regular meetings with external groups involved in unwinding, though some study participants reported meeting with state officials individually. In lieu of meetings with the state, participants said they coordinated with each other to share information and experiences.
Feedback loops have helped states identify problems early in the unwinding process. Participants noted that regular meetings provide a forum for sharing on-the-ground experiences and alerting states to problems people are encountering with the renewal process. State officials said getting input about potential problems enables them to assess the situation and determine whether changes to processes or policies are needed. While participants agreed that states did not address all issues or did not respond as quickly as they wanted in all cases, the willingness of states to communicate about issues and engage over possible solutions helped build trust in the process.
Where there has been limited state engagement and communication, there are more reports of problems with the unwinding process and frustration among others working on unwinding. While participants in Florida indicated they were able to work individually with staff involved in the unwinding to resolve problems with specific cases, they said it has been harder to address issues like long call center wait times and problems with notices at a more systemic level. The reported lack of communication from the state has created a more adversarial situation, leading to a civil rights complaint and a lawsuit. Florida participants also described using press conferences and media calls to raise awareness broadly and for the state without direct access to a state meeting.
“We conduct a routine meeting every month… It’s nonprofit providers groups there, it’s legal services, attorneys there, it’s a healthcare advocates there, and they come to us with many questions about how the process is going and what our policies look like. We do our best to answer them, provide them information, hear what they have to say about our approach and make changes when we feel it’s necessary to do so.” – Pennsylvania State Official
“In Indiana our Medicaid Department is called FSSA, and FSSA has been incredibly transparent in what their plan was and the processes and the waivers that they were going to be applying for.…I also think that FSSA’s willingness to accept criticism and to listen to Hoosiers and stakeholders that, you know, you’re thinking about this process, it’s not working.” – Indiana Participant
Renewal Processes During the Unwinding
Broad Takeaways Across All StatesAll states cited the volume of renewals, systems issues, and staffing shortages as the most significant challenges during the Medicaid unwinding period. At least 11 states reported that their systems were old or difficult to use. A few states noted that it has been difficult to implement systems changes on “clunky” old systems and that the systems were not set up to produce real-time analytics to help inform unwinding efforts. In many states, the system issues exacerbated staffing shortages that states said negatively impacted the processing of renewals. Several mentioned that their staff was not experienced enough to handle the large workload, mostly due to high turnover among eligibility workers. One state cited a 20% staff vacancy rate, and another state pointed to low morale and burn-out among staff.
Most states mentioned they were taking steps to increase ex parte, or automated, renewals to reduce the burden on eligibility staff and enrollees; however, going into unwinding, there was variation across states in their ability to conduct ex parte reviews. In particular, some states that were previously unable to conduct ex parte renewals for non-MAGI populations (those who qualify on the basis of disability or being over age 65) reported newly adding ex parte reviews for some or all non-MAGI groups. As of January 2024, states have adopted a range of 1902(e)(14) waivers and other flexibilities to increase ex parte rates and streamline renewals. When asked about the most helpful flexibilities, states most often pointed to those allowing use of Supplemental Nutrition Access Program (SNAP) data to renew Medicaid, streamlining renewals for those with zero and low income, and waiving the asset limit test.
A few states specifically noted challenges with call centers and reported actions to enhance call center operations. For example, Arkansas upgraded call centers to better track metrics and to reduce call wait times. Virginia is using outbound calls to assist seniors and people with disabilities, and after seeing fewer online renewals than expected, the state began redirecting calls from county offices to the statewide call center to help reduce the burden on local agencies.
Eligibility Systems
While eligibility and renewal systems are generally working well in Arizona and Indiana, Pennsylvania is hampered by an outdated system that requires manual workarounds to comply with federal requirements. Arizona has prioritized automated eligibility processes for many years to help balance efficiency, cost effectiveness, and accountability. Officials noted that the state has added data sources and refined business rules for checking eligibility, which have increased ex parte rates and reduced demands on staff. Pennsylvania’s system, however, cannot conduct ex parte renewals for people enrolled in Medicaid and another program, such as SNAP or Temporary Assistance for Needy Families (TANF), or for non-MAGI enrollees. To address this limitation, the state implemented a mitigation plan requiring manual ex parte reviews before terminating coverage during the unwinding.
Respondents reported both benefits and drawbacks to having Medicaid eligibility systems that are integrated with other benefit programs. Integrated eligibility systems allow people to apply for and renew coverage for multiple benefit programs at once, and all four study states have Medicaid eligibility systems that are integrated with CHIP and social benefit programs like SNAP and TANF. Officials in Arizona and Indiana reported that data sharing across programs has helped improve ex parte renewal rates and simplify renewal processes. However, some Florida participants expressed concern that information provided during SNAP renewals, which occur more frequently than Medicaid renewals, can trigger a Medicaid review and potentially lead to people being disenrolled from Medicaid. State officials also reported that it can be more challenging to make changes to integrated systems because of the need to reconcile complex eligibility rules across programs.
Even where systems are working well, the volume of renewals poses challenges, and most system changes can take time to implement. State officials reported challenges “turning on” normal eligibility functions after three years of continuous enrollment, especially after states implemented changes to their systems during the pandemic that needed to be undone. In Arizona, officials noted that they are continually making changes to their systems, but at the start of the unwinding, the number of needed changes meant they could not test everything before going into production. Officials in Arizona and Indiana discussed having procedures for identifying problems and working closely with their vendors to fix things as they come up. However, because some systems changes can take longer to implement, states reported having to adopt manual workarounds for certain groups while developing more permanent changes.
“We have a weekly system ticket triage where we have policy operations and systems folks from both our vendor and internally, that are looking at ticket issues that are coming up. And we have definitely identified some…We are continually making changes…In the middle of everything else we implemented our 12-month postpartum. We are working on continuous eligibility…We’re trying to do everything at once, and sometimes the testing just can’t catch it all.” – Arizona State Official
Staffing
Respondents cited staffing shortages as an ongoing challenge contributing to slower processing of renewals and backlogs. Indiana officials noted that inexperienced eligibility staff coupled with staffing shortages led to renewal backlogs early in the unwinding, although the number of pending cases at the end of the month has since improved. Some respondents also noted that staffing shortages disproportionately affect certain communities. For example, Pennsylvania officials found that staffing shortages are more concentrated in urban areas where there is greater competition for workers. In Florida, participants echoed reports that staff shortages at call centers have led to longer wait times for Spanish-speakers compared to English-speakers.
Study participants noted that new and inadequately trained staff may be contributing to disenrollments of people who are still eligible. Federal guidance requires states to assess eligibility for all Medicaid pathways before disenrolling someone from coverage. However, according to participants, inexperienced staff may not be doing this full assessment before sending a termination notice. Participants in Pennsylvania noted this problem in counties with high turnover among eligibility workers and began adding information on additional eligibility pathways to paperwork they help people submit. Arizona officials acknowledged that training issues combined with the high volume of renewals each month increased the likelihood that staff would make mistakes or “cut corners” that could lead to incorrect eligibility determinations. They have sought to address this issue by providing additional training.
“We did have some backlog initially, due to we had a lot of new staff or existing staff that hadn’t done this in many years, and then just the people who are not used to doing renewals and so they have a lot of questions, and they want to reach out, which is absolutely what we want them to do. But we’ve made progress in reducing the number of renewals that are not yet completed at the end of the month… We’re definitely monitoring it, but we are seeing a trend in a good direction.” – Indiana State Official
“There’s been some good work on just trying to think through the processes and the impact on the staff. At the same time, I think staff are frustrated, overwhelmed and, you know there’s a lot of new staff who really don’t know the rules or the system very well. So, they’re the ones who are going to miss anything that requires manual review, that’s how things can go wrong.” – Pennsylvania Participant
Streamlining Renewals
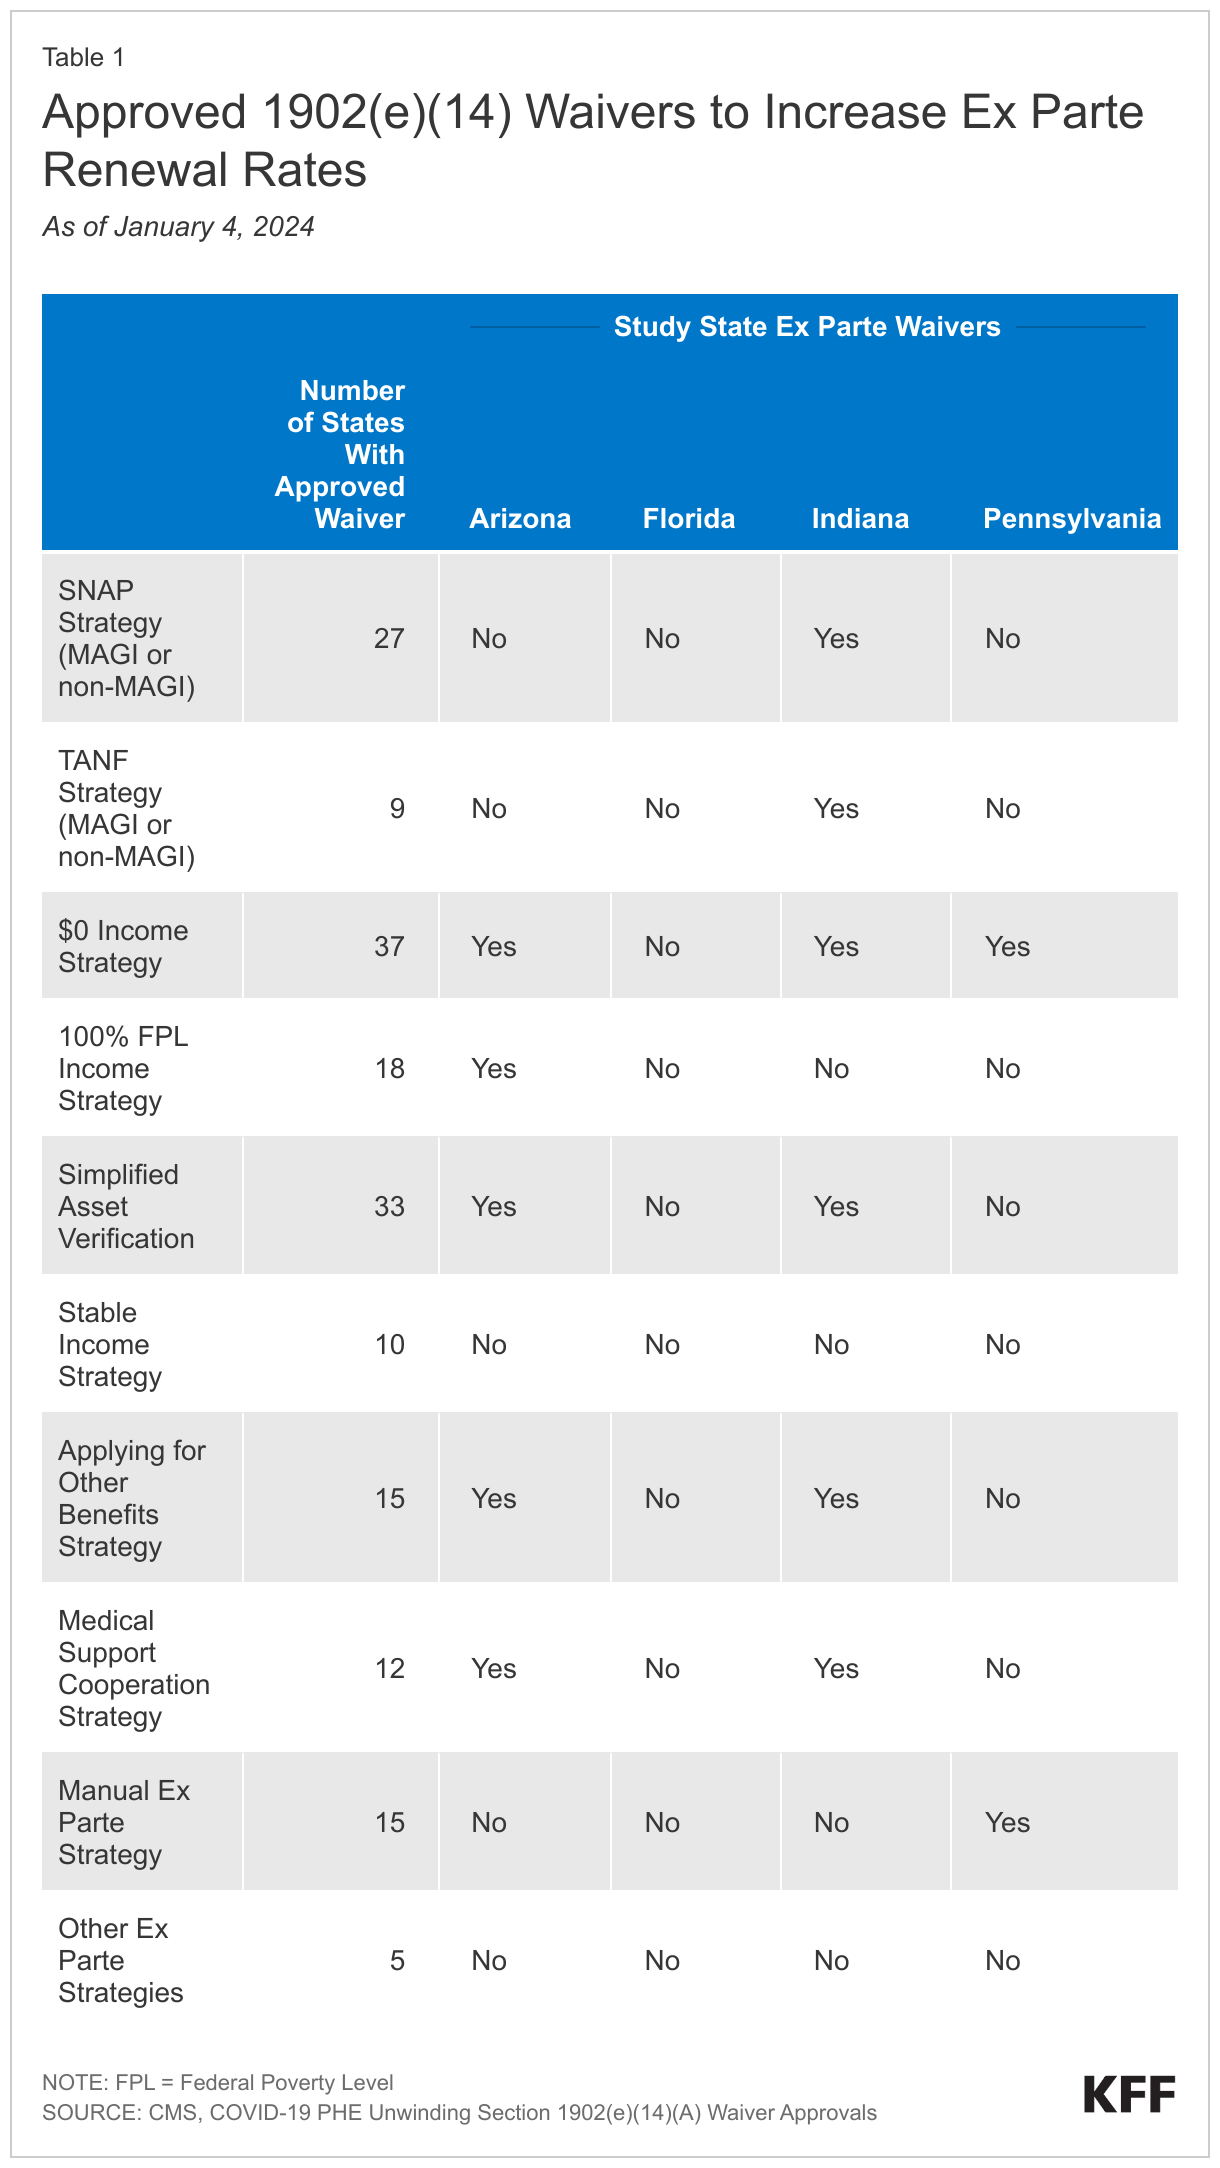
States have taken steps to streamline the renewal process and increase their ex parte renewal processes. Arizona and Indiana opted to align renewal dates for all household members to reduce the number of times a family must respond to a renewal request. Three of the study states have also adopted temporary federal flexibilities using 1902(e)(14) waivers to improve ex parte rates, especially for cases where no income or assets are returned from state databases (Table 1). Study states have also taken steps outside of the federal flexibilities to improve ex parte rates. For example, Indiana added the Asset Verification System in 2020, improving the state’s ability to conduct ex parte renewal for non-MAGI enrollees, which, as noted above, is a challenge in many states.
Most study state officials noted that federal flexibilities related to verifying income and assets have been particularly helpful for increasing ex parte rates. When asked which federal strategies they would like to see made permanent, Arizona and Indiana officials cited the zero- and low-income strategies. These waivers allow states to complete ex parte renewals in cases where no income data are returned from state databases if the state had verified or accepted an attestation of no income or income below 100% of the federal poverty level (FPL) in the past 12 months. Indiana officials said that unemployed people can have trouble producing documentation of zero income. Arizona officials also found that the zero- and low-income strategies are generally low-risk for erroneously renewing coverage for someone who is over-income. Officials argued that it is unusual for someone’s previously verified income to increase a large amount without that person’s higher income appearing in state databases.
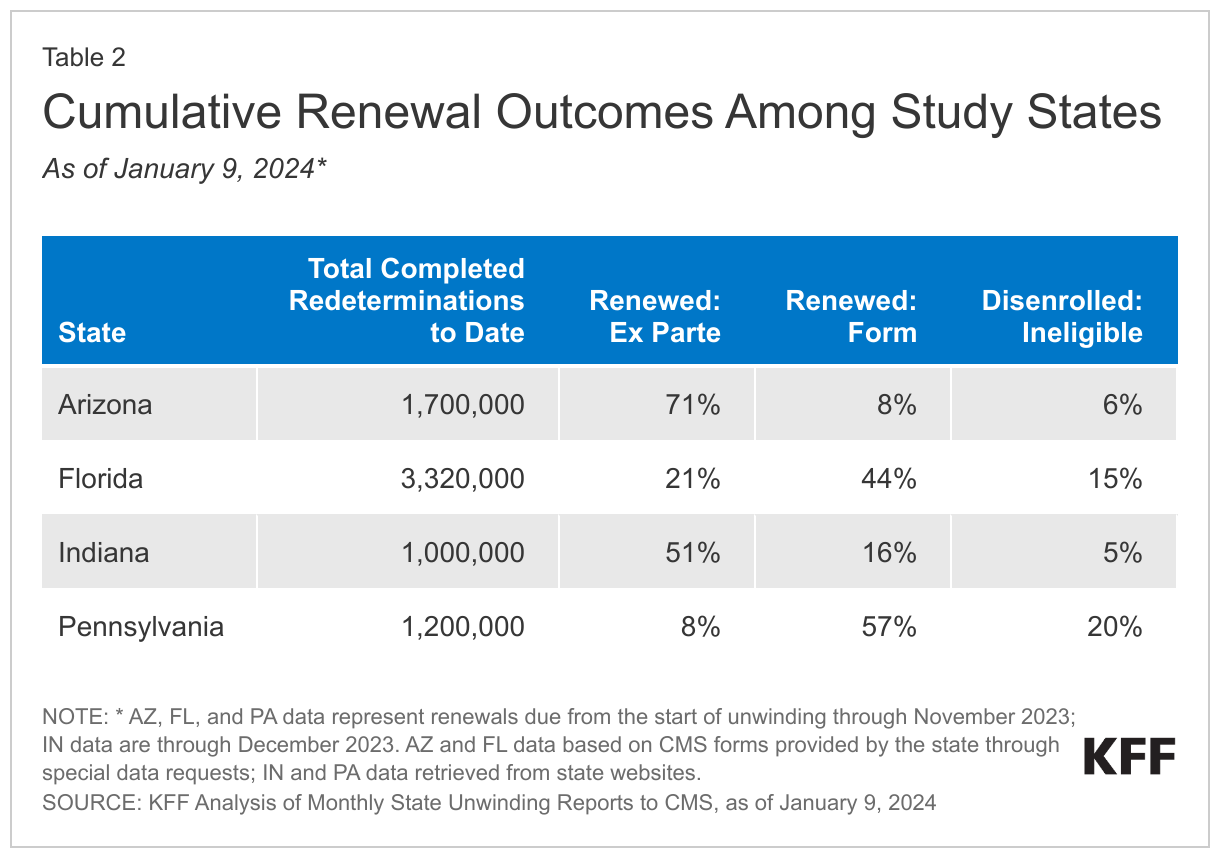
While all respondents expressed concern over procedural disenrollment rates, state officials noted that strategies to increase ex parte renewals have helped to lower those rates. Notably, in guidance released in December 2023, federal officials pointed to analysis showing that increasing ex parte rates is the most effect strategy to reducing procedural disenrollments. Procedural disenrollments occur when there is no definitive determination of ineligibility, and high procedural disenrollment rates could mean that some people losing Medicaid may still be eligible. While disenrollment rates across study states are similar, there is greater variation in procedural disenrollment rates; procedural disenrollments as a share of completed redeterminations range from 28% in Indiana to 15% in Arizona (Table 2). In Arizona and Indiana, officials prioritized automated processes as a way to reduce the number of people needing to complete paperwork who could potentially lose coverage for procedural reasons. Similarly, Pennsylvania officials found that the manual ex parte process they have put in place is effective at reducing procedural disenrollments because eligibility workers look at every case before terminating coverage. Notably, Pennsylvania is one of 29 states (but the only study state) that had been conducting ex parte renewals at the household level, rather than the individual level, contributing to some inappropriate procedural terminations (as of December 2023, Pennsylvania has nearly completed reinstatements for affected enrollees). State officials also credited increased outreach efforts as a major factor in reducing procedural terminations.
In response to questions about procedural disenrollments, Arizona and Indiana are reporting additional data on the reason for procedural disenrollments on their unwinding dashboards. For example, Arizona added data to their state dashboard showing that roughly three-quarters of procedural terminations were among people who the state had identified as over-income or aging out of coverage. Indiana began adding footnotes to their monthly Centers for Medicare and Medicaid Services (CMS) unwinding reports showing about one-third of procedural terminations also had “a non-procedural” reason for termination (e.g., over the income or asset limit, moving out of state, or death). The differences in the share of people with a non-procedural reason for closure may be partially explained by different data matching procedures in each state. Study participants in both states have also requested data on procedural terminations by zip code, which they believe will help more effectively target outreach. In response, Arizona recently published an interactive map showing zip codes at “low” or “high” risk of disenrollment, but could not provide exact counts out of privacy concerns.
“I think that the zero-income strategy is really helpful. We are working on the SNAP/TANF strategy, so that is number one…I think that all of the ones that we’ve adopted, if CMS were to say these are available permanently now, we would definitely look into, do we want to keep them? They were things that are helpful and common sense.” – Indiana State Official
Enrollee Communication and Notices
All four study states have increased the number of communication touch points when enrollees cannot be renewed via ex parte processes, including sending multiple reminder notices through the mail, email, and text. Pennsylvania, for example, went from just sending a mailer 90 days ahead of renewal to adding 11 “touches,” which include reaching out 90, 60, 30, and five days before a renewal is due. Study participants noted that enrollees who enrolled in Medicaid for the first time during continuous enrollment needed additional reminders and education about completing Medicaid renewals. In Indiana, one participant said that they have begun a consumer campaign focused on encouraging individuals to open letters from the state after hearing from multiple people that they were ignoring incoming letters because they incorrectly assumed no action was needed.
Study participants in all four states reported that Medicaid renewal and termination notices can be difficult to understand and, in some cases, provide misleading or incorrect information. While participants noted myriad issues with notices, Florida advocates were the most critical of the state’s notices. In Florida, advocates have filed a lawsuit over notices, contending that termination notices are confusing, fail to explain why individuals lost Medicaid coverage, and sometimes include incorrect information. Florida participants also described situations where enrollees were requested to provide information or documentation that is not necessary for renewal and noted that it is often unclear which individuals have been denied coverage within a household. Arizona and Pennsylvania participants observed that, for some enrollees, the notices are not clear on what actions or documents are needed for renewal. Other areas of concern include poor translations and notices not being translated into requested languages. An Indiana participant said the notices informing parents that their child has been transitioned to CHIP coverage were confusing because families receive one notice about disenrollment from Medicaid and separate notice indicating enrollment in CHIP. Across multiple study states, participants also said that termination notices included language discouraging people from requesting continued benefits while they appeal their coverage denial.
Some states have made changes to fix incorrect information or to provide additional clarifying information in notices. While changing Medicaid notice language can be a lengthy process, participants reported situations in which states corrected notice language or adopted creative workarounds to improve information shared with enrollees. In Arizona, participants noted that early in the unwinding termination notices included incorrect information about maintaining coverage during an appeal; the state has since corrected the language. In Indiana, at the request of participants, the state added brightly colored inserts to notices that include additional clarifying information.
“Sometimes it’ll come back and say all of the individuals were denied for coverage, right? …And then the next page, this person approved and enrolled. And it’s like; are they all denied, are they enrolled?… Do I have coverage, do I not?” – Florida Participant
Assisting Enrollees with Renewals and Appeals
Participants involved in unwinding reported challenges getting through to call centers when enrollees needed assistance with their renewals, with some enrollees never receiving needed help. According to participants, call center wait times can be lengthy and it can be challenging to be connected to a staffer able to answer questions, especially for complicated cases. One Florida participant said some people will carry their phone on speaker phone for hours waiting to get through to the Florida Department of Children and Families (DCF) and sometimes calls can be disconnected. A Pennsylvania participant also noted long call center wait times for some enrollees. An Indiana participant observed the quality of call center assistance can vary, with some newer employees less able to resolve enrollees’ issues.
Non-English language speakers have experienced more difficulty with call centers. An Arizona advocate observed that individuals with limited English proficiency faced longer wait times and could sometimes have their calls dropped. In Florida, participants noted that while an English speaker may wait 30-45 minutes, a Spanish speaker could end up waiting hours. In Pennsylvania, a participant similarly reported that requesting a language other than English can lead to longer wait times, and occasionally if Spanish interpreter lines are busy, people will be rolled over to the English lines. In Indiana, one navigator noted that some call center staff will not allow bilingual navigators to join calls or speak on behalf of their client, requiring that a call center interpreter be used instead which can create additional confusion.
Some participants in the study states noted challenges with timeframes for responding to renewal notices. Some study state participants noted that the timeframes to respond to a renewal notice or to find other coverage after receiving a termination notice are too short. Florida advocates wanted the state to consider adopting flexibilities offered by CMS to extend the timeframe for renewals to help address this issue. Participants in Pennsylvania also noted that the window to return renewal packets is short and results in difficulty submitting documents by the deadline, especially if there are mail delays.
In Arizona and Indiana, MCOs are able to help their members complete renewals and contract with outside vendors or navigator to provide that assistance. Generally, MCOs are prohibited from assisting enrollees with completing renewals; however, during the unwinding, Arizona and Indiana obtained 1902(e)(14) waivers that allow MCOs to help their members complete renewals. MCO respondents in both states said they are working with vendors because of the scale of the task and compliance concerns. In Arizona, an MCO participant spoke of how they have been able to pass on lists from the state of enrollees coming due for renewal to a vendor to do targeted outreach and education. This vendor collects information over the phone for members, helps gather supporting documents, and submits the renewal on their behalf. In Indiana, one MCO participant also used a vendor to set up an in-house call center for member renewal questions.
“The renewal notices, there is a very short window for them to be returned, and folks who are getting those notices sometimes are not getting them until after the deadline, or after the date that it’s supposed to come back. So, depending on the mail system and depending on when it was date-stamped as to the Department of Human Services, the stamp put on it, and it actually being put in the mail, there’s a little lag time in there we’re starting to see. So, that response time is shortened and then that backs up the entire process.” – Pennsylvania Participant
Coverage Transitions
Broad Takeaways Across All States
At the time of our interviews, it was still relatively early in the unwinding process and most states said data on coverage transitions were limited. States specifically mentioned the lack of information on people reenrolling in Medicaid after being disenrolled, also known as churn, as a factor contributing to uncertainly about overall net Medicaid enrollment projections for the fiscal year. Among the few states able to track reenrollment in Medicaid, churn rates of people reenrolling within a short period varied from about 25% to 40%. The ability of states to track transitions to the Marketplace varied by Marketplace type—all interviewed states operating a state-based Marketplace reported some ability to track information on enrollment in Marketplace plans while states that rely on the federally-facilitated Marketplace were waiting on the release of federal data. Fewer states were able to track transitions to private coverage and did so through indirect means, including surveys and information from MCOs.
‘Churning’ Back on to Medicaid
State officials and other study participants acknowledge that some individuals who are disenrolled from Medicaid for procedural reasons reenroll after a short period. At the time of the interviews, state officials explained they were just getting data on churn among those who were disenrolled for procedural reasons and had not had time to analyze the data. Both Arizona and Pennsylvania are now reporting data on the number of people reenrolling in Medicaid. Pennsylvania state officials mentioned they are considering working with a vendor to identify and follow up with individuals procedurally disenrolled who may still be eligible. Other participants also spoke about their experiences with enrollee churn. An Arizona participant noted that nearly half of individuals who re-apply during the reconsideration period are renewed, indicating that eligible individuals are being dropped and losing coverage. An MCO in Indiana said that the initial files shared by the state made it difficult to analyze churn, though the MCO is currently assessing improved data elements from the state. Study states have also implemented new communication methods to target people who are procedurally disenrolled. Both Arizona and Pennsylvania send letters following disenrollment to let people know they still have time to renew coverage.
Study participants reported that losing Medicaid despite being eligible creates confusion and distrust in the community, leading some people to choose not to reapply. Navigators and advocates described how being dropped from Medicaid, particularly because the state did not process their paperwork before the due date, causes some enrollees to lose trust in the ability of navigators and other to provide needed help and in the program overall. That frustration can lead them to give up on the process and not work to complete a renewal or reapply, if needed. Indiana community outreach groups, including chaplaincy programs, are working on rebuilding trust in the community to assist in getting people reenrolled.
“When people are contacting [AHCCCS], over 50% of them that have been terminated procedurally, are being reinstated. So to us this is concerning because it’s indicative of a potentially high rate of erroneous terminations that are happening.” – Arizona Participant
“What’s happening is when there are barriers, people just give up. There is like, ‘whatever, I just pray I don’t get sick, or I’ll go to the emergency room for care, or I’ll continue to go to my community health center where they’re gonna charge me based on the sliding fee.’ Then, they don’t sign up for Medicaid anymore, whether they qualify or they don’t.” – Pennsylvania Participant
Transitions to CHIP and the Marketplace
Arizona and Indiana auto-enroll eligible children into CHIP ensuring a seamless coverage transition, but other study participants reported gaps in coverage for some children transitioning to CHIP in Florida and Pennsylvania. When children in Arizona and Indiana are found to be ineligible for Medicaid, the states automatically enroll them in CHIP, if eligible, without any action required from the family. Though, as noted above, participants in Indiana said unclear notices about the transition created confusion for some families. Pennsylvania recently integrated CHIP into their Medicaid eligibility system, a project that had been planned for years, but coincided with the start of the unwinding period. Study participants reported that there were challenges with the rollout and system glitches have led to some children losing coverage. In Florida, participants noted that children no longer eligible for Medicaid have their information automatically transferred to CHIP; however, slow processing times lead to gaps in coverage for some children. A December 2023 letter from federal officials to Florida’s governor raised concerns about child disenrollments and encouraged the state to adopt additional strategies to reduce child disenrollments, such as utilizing more federal flexibilities as well as eliminating CHIP premiums and lockout periods, which help with transitions from Medicaid to CHIP.
Although many people who are no longer eligible for Medicaid qualify for subsidized Marketplace coverage, study participants said affordability remains a barrier to enrollment. Respondents generally said that account transfers to the Marketplace were happening as expected; however, the number of people disenrolled from Medicaid who enroll in Marketplace coverage remains low in all study states. Even with heavily subsidized premiums and cost-sharing for the lowest-income enrollees, participants said that for some people, the deductibles and cost sharing are too high. They also pointed out that not everyone is aware of Marketplace coverage as an option and that educating people about premiums, cost-sharing, benefits, and the Marketplace generally is an ongoing need. Awareness of the Marketplace is low in Pennsylvania, which launched its State-Based Marketplace, Pennie, during the pandemic. Pennsylvania’s statewide press campaign has been held jointly between the Department of Human Services and Pennie to increase awareness.
Navigators in states using the Federally-facilitated Marketplace (FFM) described problems with the quality of the contact information they receive through the Medicaid Assister Community (MAC) program. The purpose of the MAC is to provide navigators with lists of people disenrolled from Medicaid whom navigators are expected to contact with information about applying for Marketplace coverage. However, navigators participating in the program in the three study states using the FFM (Arizona, Florida, and Indiana) identified common challenges. They reported outdated or missing contact information, and some data erroneously included minors (who navigators cannot contact) and people who still qualified for Medicaid. The volume of people to contact overwhelmed navigators, with one organization reporting having to contact thousands of consumers each week; however, bad data meant the number of people who enroll in the Marketplace is low.
“I think cost is a barrier. I think that is the problem because the premiums have consistently gone up over the last six to seven years…. It’s a bit of a sticker shock when you go from state insurance to over to the Federal Exchange or even to your employer. Sometimes your employer coverage can be more than Marketplace.” – Indiana Participant
Looking Ahead
At the beginning of 2024, nine months into the unwinding process, states have completed renewals for less than half of all enrollees. While many who are disenrolled may “churn” back to Medicaid or transition to other coverage, many will likely become uninsured. People who are uninsured face more barriers to care, go without needed care and also may experience higher out of pocket costs and medical debt.
Data are important to help monitor how unwinding is going across states, but trackers and dashboards only tell part of the unwinding story. Medicaid eligibility is complex, and outcomes are the result of federal and state policy decisions but also the result of how those policies are implemented and how well eligibility and other systems work. Gaining perspectives from state officials, others involved with unwinding and enrollees provides valuable insights into what is working well and where there are challenges and room for improvement to efficiently identify those who are no longer eligible and help those who are eligible maintain coverage.
With more than half of renewals still to be completed, there is time to learn from experience. Key themes from the interviews include:
Efforts to enhance outreach and stakeholder engagement such as:
Supplementing broad outreach strategies aimed at raising awareness with targeted messaging that is directed at certain populations who are at greater risk of not completing their renewals may help increase renewal response rates;
Use of the NCOA database and partnering with MCOs can help to reduce returned mail;
Collaborating with stakeholders to reach enrollees and also to establish feedback loops can help to continue to identify problems even as initial issues are addressed;
Efforts to improve renewal processes that include:
Adopting federal flexibilities to streamline renewals and increase ex parte rates can simultaneously help to reduce the burden on overloaded staff and reduce procedural disenrollments among those who remain eligible;
Improving communication with enrollees, including notices and call center access, can reduce enrollee confusion and increase the likelihood that individuals are able to resolve problems;
Efforts to smooth transitions to other coverage such as:
Auto enrollment of eligible children into CHIP can support seamless coverage transitions and reduce the number of children experiencing a gap in coverage; and
Greater coordination with the Marketplace can increase awareness of that coverage option and improvements to the MAC program, particularly enhancement of data quality, could lead to a greater number of people transitioning from Medicaid to Marketplace coverage.
States will continue the process of unwinding continuous enrollment through much of 2024. Any steps they take in the near term to improve systems and processes to help people who are still eligible maintain Medicaid and those who are no longer eligible transition to other coverage can reduce the number of people who become uninsured. Looking ahead, lessons learned from this experience can be used to inform policy changes and direct resources to more successful outreach and other strategies for reaching and communicating with enrollees and to make longer-term improvements to Medicaid renewal processes.
Methods
A total of 15 interviews were conducted, including one written response, in the four study states between August and November: three with state officials (we did not talk with state officials in Florida), two with managed care organization (MCO) representatives, three with legal aid organizations, and six with state navigators/assisters and primary care associations (PCAs) representing federally qualified health centers (FQHCs) (some PCA organizations also act as navigators and assisters). PerryUndem assisted with the logistics and facilitating interviews. The Medicaid budget survey, conducted by KFF and HMA, was sent to state Medicaid directors in June 2023. Forty-four states participated in a follow-up telephone interview, conducted between July and September 2023. (Florida, Minnesota, and South Carolina did not respond to the 2023 survey or telephone interview, and Alabama, New Hampshire, New Jersey, and Washington did not participate in the follow-up telephone interview.)
Appendix
The appendix tables below summarize some of the key criteria used in selecting study states.
Most nonprofit hospitals and hospital systems had enough cash on hand in 2022 to cover operating expenses for an extended period of time, though about one-in-10 had relatively low levels to cover their expenses, which potentially could leave them vulnerable in a financial crisis, a new KFF analysis finds.The analysis comes as the hospital industry pushes for increases in Medicare and Medicaid reimbursement levels and Congress considers legislation that would reduce hospital revenues, such as through site-neutral payment reform. It looks at “days cash on hand” at 274 nonprofit hospitals and health systems rated by S&P Global, which are estimated to collectively account for more than half of all nonprofit hospitals and about two thirds of nonprofit beds. The measure is one of several that S&P Global uses to assess hospitals’ financial health and determine their credit rating. Those with more days of cash on hand are better able to weather financial challenges, such as low operating margins.
The analysis finds:
Nearly three-quarters (73%) of nonprofit hospitals and health systems analyzed had at least “strong” levels of cash on hand based on the S&P’s standard definitions – enough to cover at least 150 days of expenses for health systems or 160 days of expenses for stand-alone hospitals.
An additional one-in-six (18%) had “adequate” levels of cash on hand – enough to cover 100-150 days for hospital systems or 110-160 days for stand-alone hospitals.
About one-in-10 (9%) analyzed hospitals and health systems had fewer days of available cash on hand, which the ratings agency considers “vulnerable” or “highly vulnerable.”
The total share of non-profit hospitals and health systems with “vulnerable” or “highly vulnerable” levels of days cash on hand may be larger, since the as the S&P data analyzed underrepresents groups that are more likely to face financial challenges, such as small and rural hospitals.
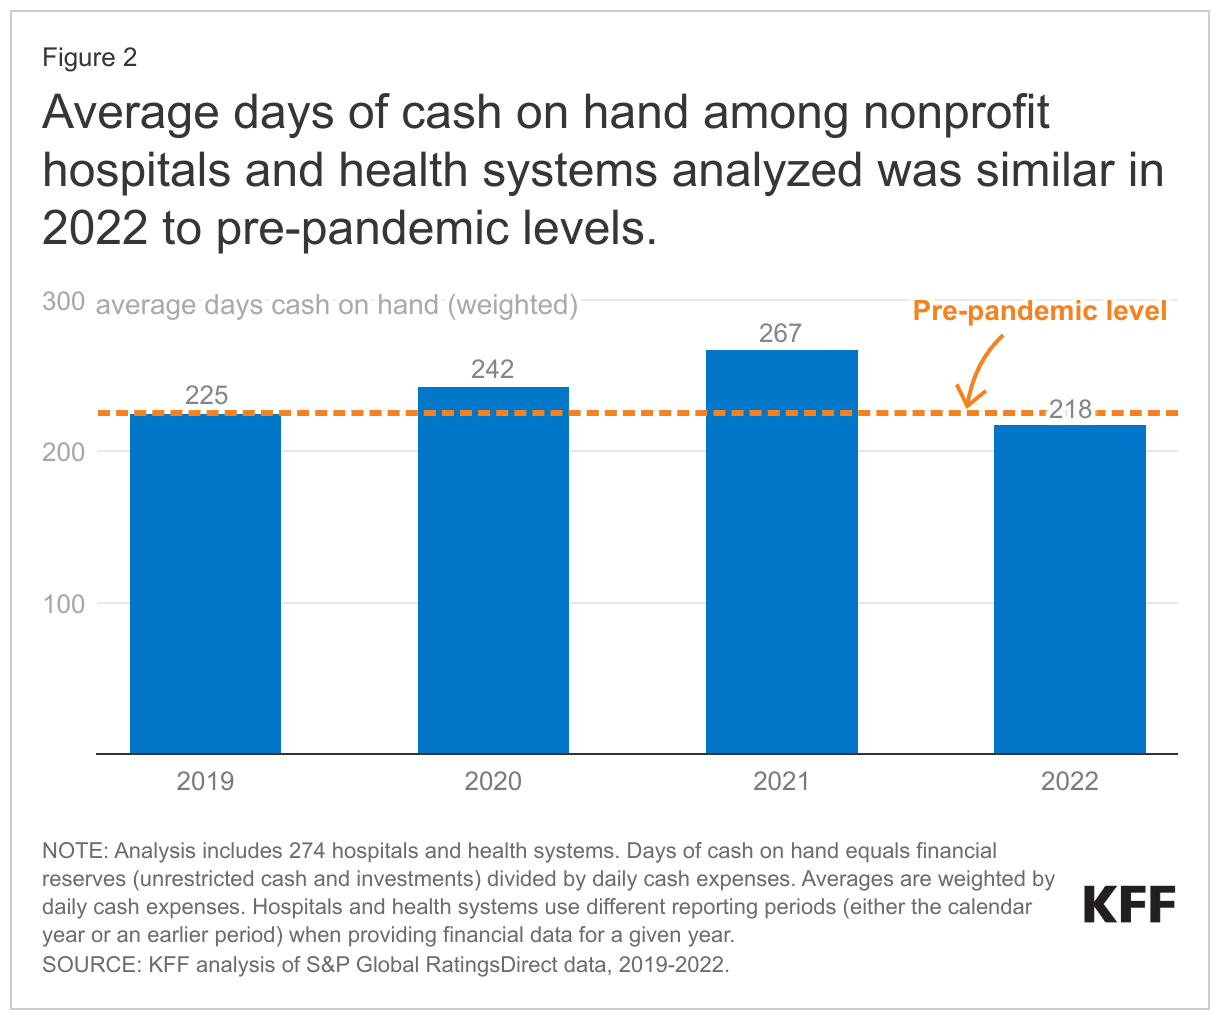
Across all analyzed hospitals and hospital systems, the average levels of days cash on hand stood at 218 days in 2022, similar to the levels in 2019 but down from a recent peak during the early years of the COVID-19 pandemic.
Policymakers, employers, insurers and others have expressed concern about the cost of hospital care in the United States, which totaled $1.4 trillion in 2022, contributing to higher health insurance premiums; lower wages for workers; and greater out-of-pocket spending, medical debt, and barriers to care for patients. At the same time, hospital industry representatives and others have pointed to recent financial challenges facing the sector and have pushed for increases in Medicare and Medicaid reimbursement levels and lobbied against legislation that would reduce hospital revenues, such as through site-neutral payment reform. Operating margins decreased by a large amount between 2021 and 2022. Industry reports suggest that operating margins haveimproved in 2023 but tend to remain below pre-pandemic levels.
However, operating margins capture only one component of the financial health of hospitals and health systems. This data note examines “days cash on hand”—another measure of financial standing that estimates the number of days that an entity could cover their cash expenses using available reserves. Hospitals and health systems with more days of cash on hand are better able to weather financial challenges, such as low operating margins. This analysis includes nonprofit hospitals and health systems from 2019 through 2022 based on data from S&P Global, a credit rating agency. The S&P data in this analysis include an estimated 56 percent of all nonprofit hospitals and 65 percent of all nonprofit hospital beds but underrepresent entities that are likely to be more financially vulnerable, such as relatively small hospitals, rural hospitals, and hospitals with relatively low commercial prices. See Methodsfor more details. Highlights include the following:
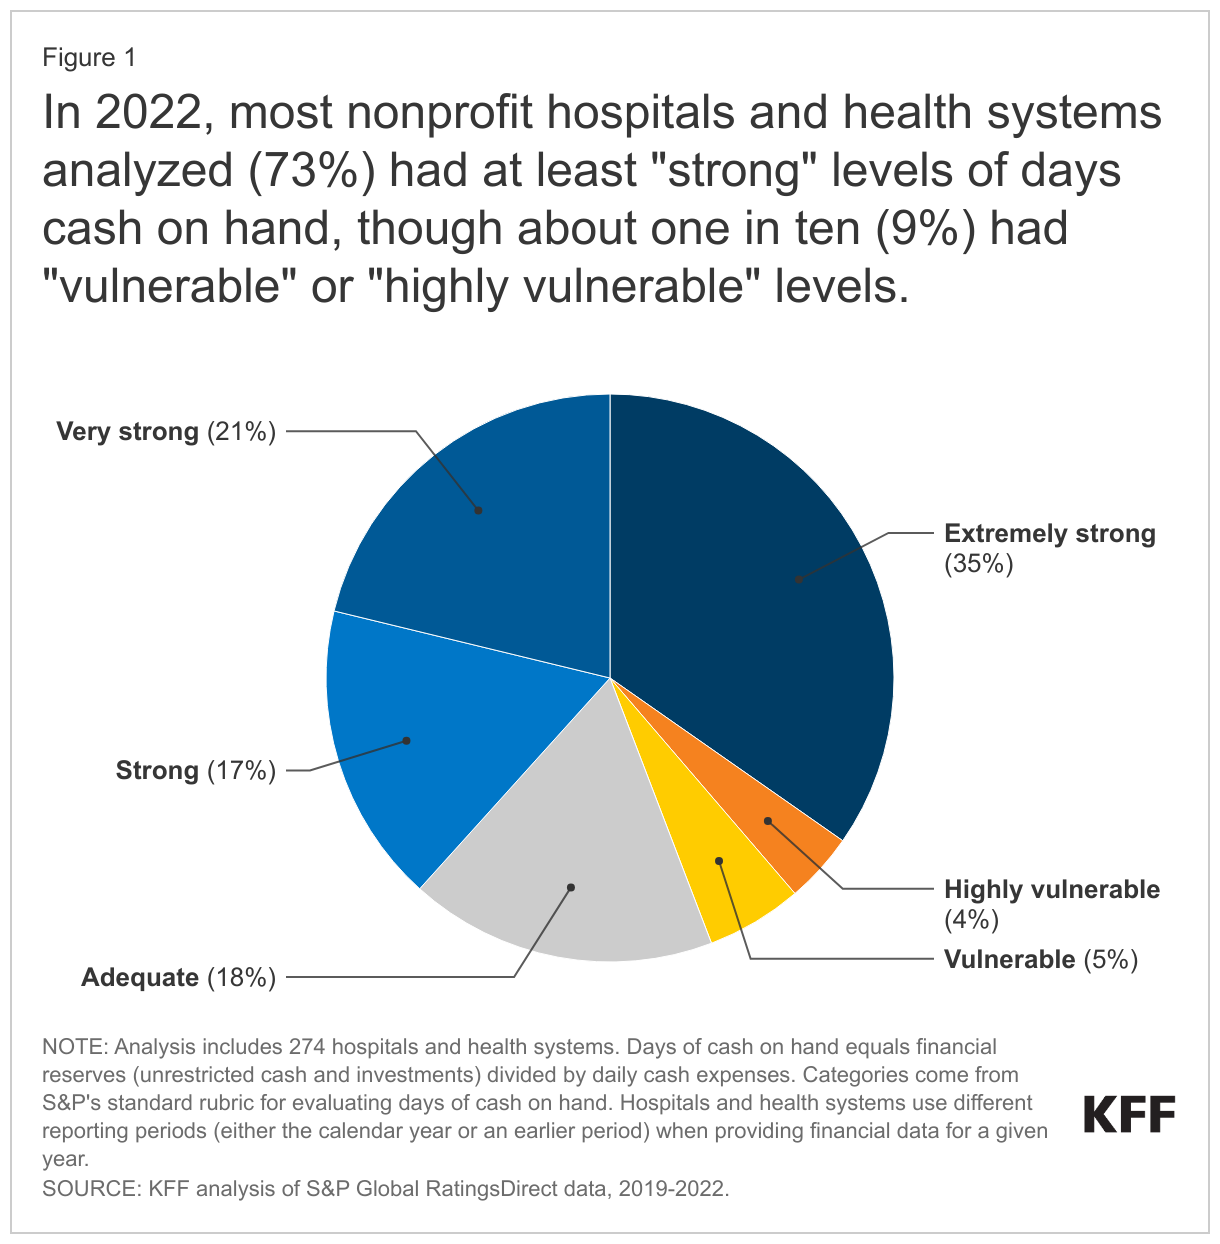
In 2022, most nonprofit hospitals and health systems analyzed (73%) had at least “strong” days of cash on hand, though about one in ten (9%) had “vulnerable” or “highly vulnerable” levels. This is based on S&P’s standard categories for days cash on hand, which it uses along with other financial measures, such as operating margins and debt burden, to assign credit ratings to nonprofit hospitals and health systems.
The majority of nonprofit hospitals and health systems with negative margins in this analysis (60%) had at least “strong” days cash on hand. As might be expected, most nonprofit hospitals and health systems with “vulnerable” or “highly vulnerable” days cash on hand in this analysis (81%) had negative operating margins.
The average days of cash on hand among nonprofit hospitals and health systems analyzed was similar in 2022 (218 days) to pre-pandemic levels (225 days in 2019).
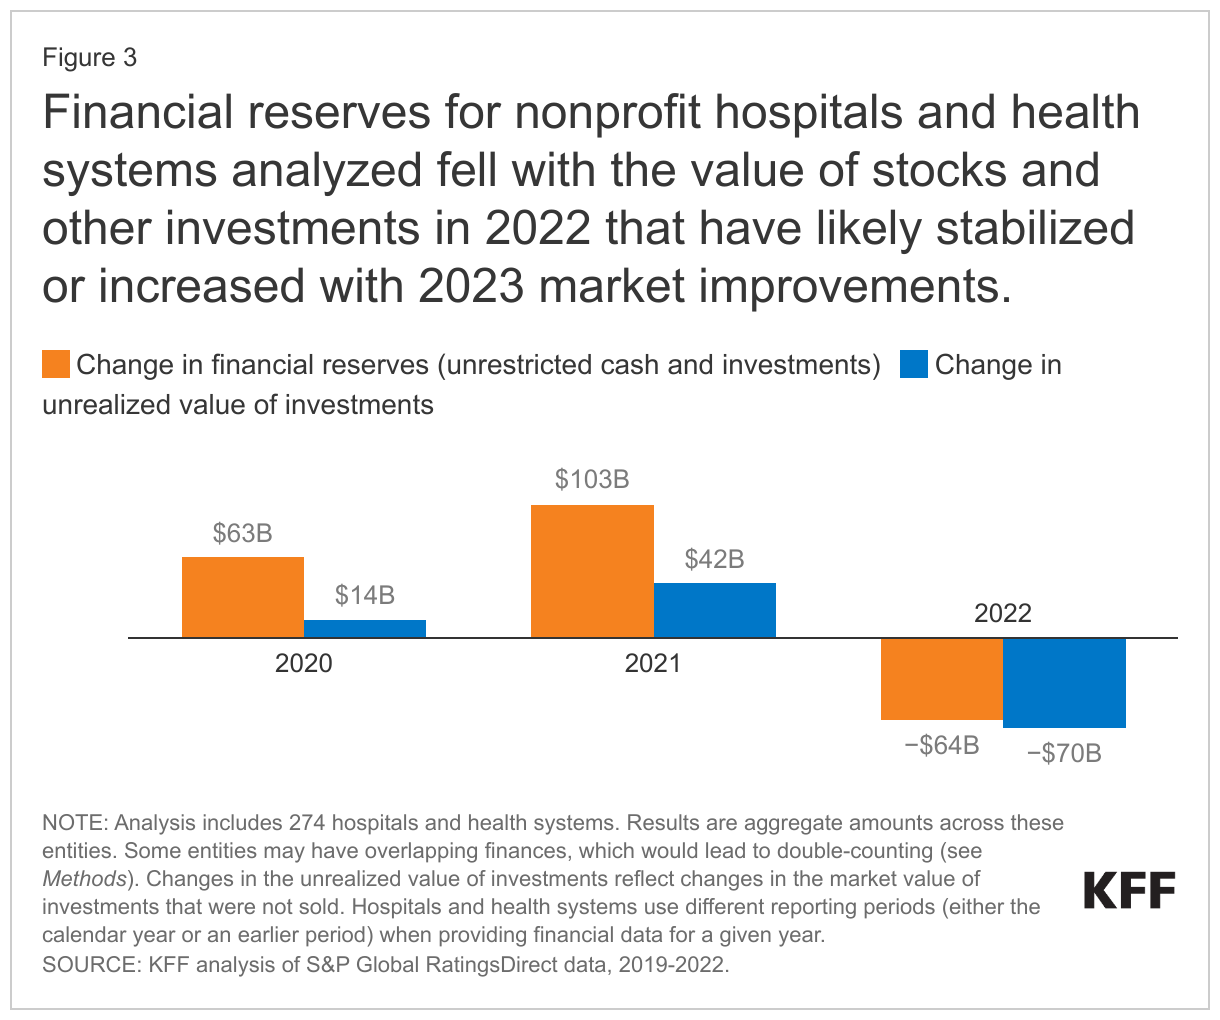
The financial reserves (unrestricted cash and investments) of nonprofit hospitals and health systems analyzed increased early in the pandemic before falling in 2022; the latter trend coincided with decreases in the value of stocks and other investments that have likely stabilized or increased with 2023 market improvements.
Discussions about hospitals’ financial challenges often focus on operating margins, though days of cash on hand provide different and complementary information about the financial standing of hospitals and health systems. Operating margins provide useful information about the short-term financial standing of a given hospital or health system, i.e., the extent to which they are earning a profit on patient care and other operating activities. However, two entities with the same operating margins in a given year may be in a much different financial position depending, for example, on their days of cash on hand. Hospitals and health systems with more days of cash on hand are better able to weather financial challenges, such as low operating margins for a period of time. This may be especially salient in the aftermath of the pandemic. Hospitals and health systems with more days of cash on hand also have access to more resources internally that can be used to invest in operations, and they may be able to qualify for lower interest rates when borrowing money, all else equal, both of which may facilitate their growth and competitiveness over the long term. Although having a high level of days cash on hand points to one source of financial strength, it is possible that a given hospital or health system may also have challenges that are captured by other metrics, such as low operating margins or a high debt burden.
Results
In 2022, most nonprofit hospitals and health systems analyzed (73%) had at least “strong” levels of days cash on hand, though about one in ten (9%) had “vulnerable” or “highly vulnerable” (less than “adequate”) levels. Days of cash on hand is defined as financial reserves (unrestricted cash and investments) divided by daily cash expenses. Categories of this measure (e.g., “strong”) are based on S&P’s standard rubric for evaluating days cash on hand, which it uses along with other financial measures to assign credit ratings to nonprofit hospitals and health systems. Credit ratings indicate the likelihood that entities will be able to repay their long-term debt. S&P’s categories correspond to a range of days cash on hand. For example, “strong” levels correspond to 150-200 days for systems (160-205 days for stand-alone hospitals) and “adequate” levels correspond to 100-150 days for systems (110-160 days for stand-alone hospitals) (See Methods for the complete list). S&P may adjust these categories based on other available information, such as reports that a system is planning to spend some of its reserves on upcoming infrastructure projects.
The total share of nonprofit hospitals and health systems that are “vulnerable or highly vulnerable” in the US is likely to be larger than this estimate derived from S&P data because certain types of hospitals that are more likely to have financial challenges are underrepresented, such as small hospitals, rural hospitals, and hospitals with relatively low commercial prices (see Methods for details about the sample).
The majority of nonprofit hospitals and health systems with negative operating margins in this analysis had at least “strong” levels of days cash on hand in 2022, though, as might be expected, having fewer days of cash on hand among nonprofit hospitals and health systems was associated with negative operating margins in 2022. Sixty percent of the nonprofit hospitals and health systems with negative operating margins in this analysis had at least “strong” levels of days cash on hand in 2022. Hospitals and health systems with more days of cash on hand are better able to weather operating losses, all else equal. Nonetheless, about four out of five (81%) nonprofit hospitals and health systems in this analysis with “vulnerable” or “highly vulnerable” days of cash on hand had negative operating margins in 2022.
Average days of cash on hand among nonprofit hospitals and health systems analyzed was similar in 2022 to pre-pandemic levels. The nonprofit hospitals and health systems in this analysis had an average of 225 days of cash on hand in 2019 and nearly the same number, 218 days of cash on hand, in 2022, when weighting entities by their daily cash expenses. In the years between, average days cash on hand increased (from 225 days in 2019 to 267 days 2021) before decreasing to an amount close to pre-pandemic levels. To put this in context, S&P generally considers 218 days to be a “very strong” level of days cash on hand. As noted above, it is likely that this analysis excludes nonprofit hospitals and health systems with relatively few days of cash on hand on average, though the hospitals in this analysis encompass a large portion of the nonprofit sector, including an estimated 56 percent of nonprofit hospitals and 65 percent of nonprofit hospital beds.
Financial reserves and daily cash expenses among nonprofit hospitals and health systems analyzed increased by a similar rate from 2019 to 2022. Financial reserves are defined to include all cash and investments (such as stocks) that are “unrestricted” (i.e., available for any purpose), while daily cash expenses reflect annual operating expenses minus non-cash expenses (i.e. depreciation and amortization), divided by 365 (see Methods for more on definitions). From 2019 to 2022, total financial reserves and daily cash expenses among nonprofit hospitals and health systems grew by a similar rate: 23% and 27%, respectively (data not shown). Daily cash expenses increased throughout this period likely due in part to increases in labor costs and increases in the cost of medical and other supplies as a result of high inflation rates. Financial reserves increased at a faster rate than expenses in 2020 and 2021 before dropping in 2022. Financial reserves may grow due to many factors, including profits from patient care and other operating activities, income from investments (such as stock dividends), increases in the market value of investments, profits from the sale of investments, income from selling off nonfinancial assets (such as property or joint venture businesses), and new loans (to the extent that they exceed the amount repaid on existing loans). Financial reserves may decrease for similar but opposite reasons and other factors, such as spending on new buildings, medical equipment, and information systems. Growth in the size of hospitals and health systems through mergers and acquisitions could also contribute to increases in both financial reserves and daily cash expenses over time.
Financial reserves for nonprofit hospitals and health systems analyzed fell with the value of stocks and other investments in 2022 that have likely stabilized or increased with 2023 market improvements. Financial reserves fell by $64 billion in 2022 among the nonprofit hospitals and health systems in this analysis while the market value of their stocks and other financial investments decreased by $70 billion. If stocks and other financial investments had instead retained their value in 2022, then financial reserves would have increased by $6 billion rather than decreasing by $64 billion among the nonprofit hospitals and health systems in this analysis (and average days of cash on hand would have fallen by 22 days rather than 49 days in that year).
The value of financial investments among nonprofit hospitals and health systems have likely stabilized or increased with 2023 market improvements. For example, the S&P 500 increased by 24 percent in calendar year 2023 after decreasing by 20 percent in calendar year 2022. Nonetheless, data are not yet available to provide a full picture of how nonprofit hospital and health system stock portfolios and other investments have performed in 2023.
While financial reserves decreased in 2022, they increased by a larger amount earlier in the pandemic, leading to an overall increase from $446 billion in 2019 to $548 billion in 2022 among the nonprofit hospitals and health systems in this analysis, a $102 billion change. Hospitals and health systems received large amounts of government relief during the COVID-19 pandemic that may have contributed to this increase in financial reserves. Had hospitals not received pandemic relief dollars, operating losses, as applicable, would need to have been covered with existing financial reserves or cash obtained through other means (such as by taking out new loans or selling assets, like property). Pandemic relief dollars and other one-time sources of operating revenue, together known as “nonrecurring operating revenues”, totaled $52 billion from 2019 through 2022 among the nonprofit hospitals and health systems in this analysis, most of which, $29 billion, was received in 2020. It is likely that pandemic relief dollars made up the large majority of these nonrecurring operating revenues, as totals jumped from $13 million in 2019 to $29 billion in 2020 (i.e., the beginning of the pandemic) among the nonprofit hospitals and health systems in this analysis (before falling to $14 billion in 2021 and $8 billion in 2022).
Discussion
Many nonprofit hospitals and health systems had at least “strong” levels of days cash on hand in 2022, and averages among a large number of nonprofit entities were similar in 2022 to pre-pandemic levels. This result adds some nuance to recent stories about the financial challenges facing hospitals and health systems, which have informed policy debates about government reimbursement and funding for these entities. Although operating margins dropped by a large amount in 2022—likely due to the erosion of pandemic relief funds, costs associated with labor shortages, and increased supply expenses due to high inflation rates, among other factors—many nonprofit hospitals and health systems had a large financial cushion as of 2022 to help weather these challenges. Reports suggest that operating margins have improved in 2023—perhaps due to decreases in labor expenses and increases in volume and reimbursement rates, among other factors—but that they tend to remain below pre-pandemic levels. As hospitals continue to adjust to these financial challenges, those with more days of cash on hand will be better positioned to absorb operating losses, all else equal.
About ten percent of nonprofit hospitals and health systems in this analysis had “vulnerable” or “highly vulnerable” levels of days cash on hand in 2022, and it is likely that the percent would be higher if the analysis included all nonprofit hospitals and health systems in the US. While this analysis includes more than half of all nonprofit hospitals, it underrepresents certain types of hospitals that may be more likely to have financial challenges, such as small hospitals, rural hospitals, and hospitals with relatively low commercial prices. About four in five of the entities in this analysis with “vulnerable” or “highly vulnerable” levels of days cash on hand also had negative operating margins. This subset of nonprofit hospitals and health systems could be especially challenged to maintain current services or remain open. At the same time, 60 percent of the nonprofit hospitals and health systems in this analysis with negative operating margins had at least “strong” days cash on hand, suggesting some capacity to manage through challenging times.
Better, more complete, and standardized information about the days of cash on hand at hospitals and health systems could provide policymakers with a greater understanding of the financial status of these entities and which entities have a weaker or stronger footing. The federal government does not currently collect standardized information about days of cash on hand, which is why this analysis relies on data provided by S&P. Information about profitability is often based on cost reports submitted by many hospitals to the federal government, but cost reports are less standardized than the data used for this analysis and are missing key details that are necessary to provide reliable information about days of cash on hand. Some states have begun to fill in gaps in financial data by requiring that hospitals and health systems report additional and more standardized information. Such information would improve the understanding of how financially vulnerable hospitals are performing and inform policy pertaining to hospital costs and finances.
Methods
Data. We obtained financial data for a large number of nonprofit entities from S&P Global RatingsDirect, which collects and standardizes information from audited financial statements as part of their process for generating credit ratings. These financial data typically encompass every component of a given health system, including hospitals, other providers, and, in some cases, health plans (the largest example being Kaiser Permanente). Hospitals and health systems use different reporting periods for their audited financial statements in a given year. For 2022, the three most common reporting periods accounted for the large majority (96%) of hospitals and health systems in our analysis: January 2022 to December 2022 (39% of hospitals and health systems), July 2021 to June 2022 (33%), and October 2021 to September 2022 (25%). When focusing on entities with calendar year reporting periods, we found a slightly larger decrease in average days of cash on hand (from 226 to 214 days).
In some instances, S&P data may include entities with overlapping financial data (e.g., a health system and a subset of the health system that was recently acquired and continues to receive a credit rating), which would lead to double-counting. We attempted to identify these cases by flagging: (1) entities with the same ultimate parent organization in S&P’s data and (2) entities that were matched to the same health system based on information from the American Hospital Association (AHA) Annual Survey Database (see below). In those rare instances, we retained the larger entity.
We relied on the American Hospital Association (AHA) Annual Survey Database to help create and describe our sample (see below). We matched S&P entities to AHA data using a combination of name, ZIP code, and state. We linked S&P entities that could not be matched based on these variables through a manual review process. Our matches could be inaccurate in some instances for a variety of reasons. For example, S&P and AHA data could identify system membership differently in certain scenarios, in which case we may include some hospitals that are not part of the financial data for a given system or exclude some hospitals that are.
Measures. Our analysis focuses on days of cash on hand, which equals financial reserves divided by daily cash expenses. Financial reserves are defined to include all unrestricted cash and investments (such as stocks) but to exclude restricted cash and investments, which are legally constrained to serve a particular purpose (such as to fund the construction of a new facility). Daily cash expenses are defined as (operating expenses – depreciation and amortization) / 365. Categories of days cash on hand are based on S&P’s standard rubric (though the agency may adjust these categories based on other available information, such as reports that a system is planning to spend some of its reserves on upcoming infrastructure projects). Categories include the following:
Extremely strong: >275 days for standalone hospitals; >250 days for systems
Very strong: 205-275 days for standalone hospitals; 200-250 days for systems
Strong: 160-205 days for standalone hospitals; 150-200 days for systems
Adequate: 110-160 days for standalone hospitals; 100-150 days for systems
Vulnerable: 80-110 days for standalone hospitals; 70-100 days for systems
Highly vulnerable: <80 days for standalone hospitals; <70 days for systems
Our analysis includes average days of cash on hand weighted by daily cash expenses as well as some total dollar amounts (e.g., aggregate financial reserves). Larger health systems, by definition, contribute more to weighted averages and total dollar amounts. For example, the five largest health systems accounted for 22% percent of total daily cash expenses in 2022. The number of and trends in days of cash on hand were similar when looking at medians (224 in 2019 and 217 in 2022), which do not give additional weight to larger health systems. Similarly, most nonprofit hospitals and health systems in this analysis trended in the same direction as aggregate dollar amounts, with most exhibiting overall increases in financial reserves and daily cash expenses from 2019 and 2022 (84% and 98% of entities, respectively). Although there tended to be an increase in cumulative financial reserves from 2019 through 2022, most entities (88%) experienced decreases in financial reserves in 2022 and in the market value of financial investments (94% of entities) in that year. Nearly half (46%) of those with decreases in financial reserves in 2022 also had larger decreases in the market value of financial investments.
From 2020 through 2022, days cash on hand was higher than it otherwise would have been by what was likely a small number of days due to the deferral of Social Security payroll taxes under the Coronavirus, Aid, Relief and Economic Security (CARES) Act. In particular, employers were allowed to defer their share of these taxes that would otherwise have been due from March 27 through December 31, 2020. They were required to pay at least half of the deferred amount by December 31, 2021 and any remainder by December 31, 2022. We evaluated the magnitude of this benefit based on cleaned financial data for eight health systems in Massachusetts with October to September reporting periods. Among these health systems, the payroll tax deferral had the largest effect on days cash on hand in 2021 (ranging from zero to six days for an average of four days) and the smallest effect in 2022 (ranging from zero to three days for an average of one day). About four in ten (39%) hospitals and health systems evaluated in this data note had calendar year reporting periods; the payroll tax deferral should not have affected days cash on hand for these entities in 2022 if it were fully repaid by December 31, 2022, as required. S&P data on financial reserves and days cash on hand do not include Medicare advance payments.
Sample. We excluded some S&P hospitals and health systems from our analysis. First, we dropped for-profit hospitals and health systems. For-profit entities tend to maintain low financial reserves—and therefore have low days of cash on hand—as they face pressure to return excess cash to stockholders through dividends. Second, we excluded public hospitals and health systems, as there are a relatively small number of these entities in S&P data. Third, we excluded hospitals and health systems that were missing data for at least one year from 2019 through 2022. Fourth, we excluded hospitals and health systems when most of the reporting period for a given year fell in the prior calendar year (e.g., April 2021 to March 2022 reporting periods for 2022). Fifth, we dropped a small number of entities that appeared to overlap with others. Sixth, we dropped a small number of entities based in the US Territories. Finally, we dropped entities that we were unable to match to AHA data, which helped us narrow the sample to private, nonprofit hospitals and health systems. We defined nonprofit systems as those in which a majority of member hospitals were nonprofit.
After these changes, our analysis included 274 nonprofit hospitals and health systems. Based on our match to AHA data, these entities accounted for an estimated 56 percent of nonprofit hospitals in 2021 and 65 percent of nonprofit hospital beds.
Our analysis encompasses a large portion of nonprofit hospitals and health systems, but it excludes, among other entities, those that have not applied for a credit rating through S&P. To evaluate how representative our data are, we compared the characteristics of nonprofit hospitals with cost report data that could and could not be matched to S&P entities based on: (1) RAND Hospital Data, which is a cleaned and processed version of annual cost report data submitted by Medicare-certified hospitals to the Healthcare Cost Report Information System (HCRIS), (2) the RAND Price Transparency Study, and (3) AHA data. We found that our sample underrepresents small hospitals, rural hospitals, hospitals that are not part of a multihospital system, and hospitals with relatively low commercial prices. Excluded hospitals also had lower operating margins on average in 2022 but appeared to be similar to included hospitals based on Medicaid inpatient discharge shares. Our analysis excluded government hospitals, which tend to have lower days of cash on hand, as well as for-profit hospitals, which tend to maintain less financial reserves due to their organizational structure.
Although our analysis includes a distinct set of hospitals and health systems, it also encompasses a large portion of the nonprofit sector. Other, more comprehensive hospital data, such as HCRIS or AHA survey data, do not include reliable information about days of cash on hand. For example, cost reports collect information at the hospital level, but financial reserves are often held at the system level. In those scenarios, cost report data would understate the financial reserves that are available to the hospital.
This work was supported in part by Arnold Ventures. KFF maintains full editorial control over all of its policy analysis, polling, and journalism activities.
Nancy Kane, an independent consultant, provided input for this analysis.
In a given year, a small portion of the population is responsible for a very large percentage of total health spending. This slideshow explores the variation in health spending across the population through an analysis of the 2021 Medical Expenditure Panel Survey (MEPS) data. The analysis finds that, in 2021, 5% of the population accounted for nearly half of all health spending. At the other end of the spectrum, the 50% of the population with lowest total health spending accounted for only 3%.
It also examines spending variation by age, gender, race, insurance status and presence of certain health conditions.
The chart collection is part of the Peterson-KFF Health System Tracker, an online information hub dedicated to monitoring and assessing the performance of the U.S. health system.
Like other immigrants to the U.S., Asian immigrants overwhelmingly say they emigrated for the opportunity to build a better life for themselves and their children. They come from more than 30 countries, and their experiences – their economic circumstance, how safe they feel, and the discrimination they face – vary greatly once here, including differences by income level, immigration status and country of origin.
These three charts explore the diversity of the Asian immigrant experience, drawing on findings from a new KFF report based on data from the KFF-Los Angeles Times Survey of immigrants:
1) Most Asian immigrants are faring relatively well financially, though there’s variation by region of origin, with immigrants from South Asia doing notably better than those from East or Southeast Asia. And one-in-three low-income Asian immigrants struggle to pay their bills.
2) One-in-six Asian immigrants, including one-in-three of those born in China, say they feel less safe due to their move to the United States. One-in-five Asian immigrants – and a higher share of those from China – also say that the COVID-19 pandemic has negatively impacted how they are treated in the United States, likely reflecting anti-Chinese rhetoric amidst the pandemic.
3) One-in-five Asian immigrants who sought health care in the U.S. say they have been treated unfairly by a health care provider at some point due to their accent or ability to speak English, their racial or ethnic background or skin color, or their ability to pay. The shares are higher among those with lower incomes or limited English proficiency.
For more about Asian immigrants’ experiences beyond these three charts, including their reasons for coming, their employment and financial situation, their experiences with discrimination and health care, and their understanding of immigration policies, read our new report, “Understanding the Diversity in the Asian Immigrant Experience in the U.S.: The 2023 KFF/LA Times Survey of Immigrants.”
In September 2023, the National Institutes of Health designated people with disabilities as a population experiencing health disparities, which will help ensure that people with disabilities are represented in research funded by the National Institutes. Also in September of 2023, the Biden Administration proposed a new rule that would update the requirements for nondiscrimination on the basis of disability. Among other changes, the proposed rule would codify the Olmstead court decision, which requires people with disabilities to be served in the most integrated setting that is appropriate. The new designation and proposed rule may reflect, in part, an increased awareness of the challenges and health disparities faced by people with disabilities, many of which were exacerbated by the COVID-19 pandemic and its aftermath.
In this analysis, KFF examines the characteristics of people with disabilities who are living in the community from the American Community Survey. State-level data are also available on State Health Facts.
Key takeaways include:
Over one in ten (11%) working-age adults ages 18-64 living in the community reported having a disability on the 2022 American Community Survey, which is defined as having a difficulty with hearing, vision, cognition, ambulation, self-care, or independent living.
Those 21.8 million working-age adults report difficulties with a range of different activities and are lower-income than working-age adults who did not report a disability.
Adults with disabilities are over twice as likely to have Medicaid as adults without disabilities, but fewer than a third receive income from the social security disability programs.
1. What are the demographic characteristics of working-age adults with disabilities?
People with disabilities tend to be older than other working-age adults, but the racial and gender distributions of people with disabilities are like those of people without disabilities (Figure 1). Nearly half (47%) of working-age adults with a disability are 50 years old or older, compared with only 30% of working-age adults without a disability. Smaller percentages of people with disabilities are ages 18-29, 30-39, and 40-49 than among adults without disabilities. Although the racial and ethnic distributions of working-age adults are similar for people with and without disabilities, among people with disabilities a smaller percent are Hispanic (17% compared to 20%) and Asian (3% compared to 7%), and a larger percent are Black (15% compared to 12%). Among working-age adults, roughly half are female regardless of disability status.
2. What types of difficulties do working-age adults with disabilities report?
Among adults ages 18-64 with a disability, nearly half report a cognitive difficulty and nearly half report having more than one difficulty (Figure 2). Of the 21.8 million adults ages 18-64 who report having a disability, nearly half report difficulties with cognition, which is defined as difficulty concentrating, remembering, or making decisions; over two-fifths report difficulties with ambulation (defined as difficulty with walking or climbing stairs); and over a third report difficulties living independently (defined as difficulty doing errands alone such as visiting a doctor’s office or shopping). Fewer working-age adults report difficulties seeing, hearing, and with self-care (defined as difficult dressing or bathing). Among working-age adults with a disability, 44% report having more than one difficulty, with 9% reporting four or more difficulties.
3. What is the income and employment status of working-age adults with disabilities?
Working-age adults with disabilities are almost twice as likely to have income below 200% Federal Poverty Level (FPL) compared with adults without disabilities (Figure 3). The income distribution of working-age adults with disabilities is lower than that of working-age adults without disabilities. One in four working-age adults with a disability have incomes below FPL ($14,880 for an individual, and $23,280 for a family of three on average in 2022). Income is generally higher for working-age adults without disabilities with only 10% reporting incomes below FPL and almost half having incomes above 400% FPL.
The percentage of working-age adults with disabilities who do not work is over three times greater than the percentage of working-age adults without disabilities who do not work (Figure 4). Lower income is likely related to lower levels of employment among working-age adults with disabilities: Almost half of people with disabilities do not work and one third work full time (35 or more hours per week). In comparison, over 64% of adults without a disability work full time and 16% do not work at all.
4. How do working-age adults with disabilities access health insurance coverage?
The percentage of people with Medicaid is over two times higher among working-age adults with disabilities compared with those without disabilities (Figure 5). Among working-age adults with disabilities, 38% have Medicaid, which includes 30% who have Medicaid only and an additional 8% who have Medicaid and Medicare (dual-eligible individuals). Among those without a disability, 13% have Medicaid and 1% have Medicare and Medicaid. Notably, the majority of Medicaid enrollees with disabilities qualify on the basis of low income rather than on the basis of disability. The Medicaid expansion under the Affordable Care Act (ACA) – which all but 10 states have taken up – is based only on income. Qualifying for Medicaid based on disability status generally involves a complex application process to determine the extent of the disability and typically includes an asset test. To be eligible for Medicare, people must generally be ages 65 and older, or have a disability that qualifies them for the federal disability insurance program (DI). For most people ages 64 and younger, Medicare coverage begins only after waiting a 2-year waiting period which starts after they have been approved for DI benefits.As a result, 8% of working-age adults with disabilities have Medicare as their only source of coverage compared with only 1% of adults without a disability.
All other coverage—including coverage through an employer, direct purchase, VA—accounts for 41% among working-age adults with disabilities compared with 74% of those without disabilities. Rates of employer coverage are nearly twice as high among adults without disabilities compared to those with (64% to 33% respectively). Uninsured rates are similar among working-age adults with and without a disability (10% and 11% respectively).
5. How many adults with disabilities receive income from the social security disability programs?
Fewer than a third of working-age adults with disabilities receive any income from the social security programs, including Social Security Disability Insurance (DI) and Supplemental Security Income (SSI). Social security income includes income from several programs that support people who are retired, have qualifying disabilities, are survivors of people who died and had paid into the system, or who have limited financial resources and either a qualifying disability or are age 65 and older. The two primary programs include SSI and DI:
SSI is a federal program administered by the Social Security Administration (SSA) that ensures a minimum level of income for poor people who are elderly or disabled. To qualify, SSI enrollees must have low income, limited assets, and either be age 65 or older or have an impaired ability to work at a substantial gainful level according to strict federal rules. Unlike DI, SSI is available to people regardless of their work history. As a result of strict SSA disability determination rules, not all people with disabilities qualify for SSI.
DI is a separate program from SSI also administered by the SSA. Unlike SSI, there are no income or asset limits for DI eligibility. Instead, to qualify for DI, enrollees must have a sufficient work history (generally, 40 quarters) and meet the strict federal disability rules. The amount of DI benefits is based on the person’s earnings history.
People receive both DI and SSI when their incomes (including DI benefits) are less than the maximum SSI payments. Among working-age adults with disabilities, fewer than one-third receive social security income: (14% receive DI, 12% receive SSI, and 3% receive benefits from both programs) (Figure 6).
Looking Ahead, what are key issues to watch?
What new challenges will emerge now that the COVID-19 public health emergency has ended? Working-age adults with disabilities are a heterogenous group that may be facing unique challengesas the nation emerges from the COVID-19 public health emergency. These challenges include higher rates of long COVID than among people without disabilities, and disruptions in access to ongoing services and supports including telehealth services and Medicaid home- and community-based services. Recognizing the importance of home- and community-based services (HCBS) for people with disabilities during the pandemic and the workforce shortages during that time, the federal government provided new funding and flexibilities for states when delivering HCBS. In many states, those policies are ending which may create additional barriers to accessing HCBS in some states. More broadly, Medicare, Medicaid, and private insurers increased access to telehealth services during the pandemic, which may have enabled people with disabilities to access medical care more easily than in-person visits. Broad Medicare coverage of telehealth is set to expire at the end of 2024 and other payers may also limit their coverage, which could reduce the increased access to care.
Long COVID may have disproportionately affected people with disabilities, but it may also cause higher rates of disability moving forward. Long COVID can create or exacerbate challenges in meeting basic needs and a December 2022 survey found that substantial numbers of people with long COVID—many of whom also had other disabilities—were having difficulty paying their bills are accessing sufficient food.
How are people with disabilities accessing the supports and services they need when average wait times for disability claims are at an all-time highand clerical errors result in missing benefits or notices that people must repay prior years’ benefits? Long wait times make it difficult for people to access benefits when they need them creating unique challenges for the 21.8 million working-age adults living with disabilities in the United States. For those that receive disability benefits through the social security programs, many are finding their benefits reduced on account of overpayments they owe because of past errors on the part of the Social Security Administration. The Administration has been sending overpayment notices to more than 2 million people each year, which ask recipients to repay the government within 30 days. In many cases, those payments had been made years earlier without the recipients’ knowledge. By the time they had been identified, the overpayment amounts may be far larger than people can repay, measured in tens or even hundreds of thousands of dollars. When beneficiaries are unable to repay the money, the government may reduce their monthly benefits. The Senate Finance Committee is expanding oversight of the Social Security Administration to address such issues, but it’s unclear how long it will take to sort through the prior clerical errors and to address the wait times.
How will Medicaid redeterminations affect coverage for people with disabilities? Medicaid plays an important role in helping working-age adults to access the health and long-term services and supports they need and the next year or so may present difficulties as states redetermine Medicaid eligibility for the first time in over three years. At the start of the pandemic, Congress enacted the Families First Coronavirus Response Act, which required states to keep people continuously enrolled as a condition of receiving additional federal funding, but that requirement ended March 31, 2023, and states have begun disenrolling people who are no longer eligible or who do not submit complete and timely paperwork, resulting in many millions of people losing Medicaid coverage. Although Medicaid renewals are challenging for all types of enrollees, redeterminations may require more paperwork for people who are eligible on the basis of disability; and the loss of health coverage is especially likely to disrupt access to ongoing health care.
How might a new proposed rule regarding nondiscrimination based on disability be finalized and when finalized, affect people with disabilities? On September 7, 2023, the Office of Civil Rights within the Department of Health and Human Services published a proposed update to the regulations that prohibit discrimination based on disability by recipients of federal funding. The proposed rule is the first comprehensive update of the regulations since they were established more than 40 years ago and the new requirements would strengthen protections for people with disabilities. The proposed rule would address discrimination in medical treatment and child welfare programs, establish accessibility standards for web and mobile delivery of health and human services benefits, and establish enforceable standards for accessible medical equipment. It would also codify the Olmstead court decision that requires services to be provided in the most integrated setting appropriate. Often, the most appropriate settings are financed through Medicaid home- and community-based services, but many of those programs have waiting lists for people to access care. It is unknown how the final requirements will compare to the proposed rule, but the new regulation is intended to help people with disabilities better access health care and social services.
How might a proposed change to the definition of disability in the American Community Survey affect people with disabilities and funding for programs that provide housing, transportation, health care, and education? Currently, the survey asks people whether they have difficulty with hearing, vision, cognition, ambulation, self-care, or independent living using a yes/no answer option. The proposed change would tweak the wording of the questions, but the biggest change is that respondents would be given four answer options instead of two: no difficulty, some difficulty, a lot of difficulty, and cannot do at all. The new questions and answers were developed in recognition that disability is a complex topic that may be difficult to define with a yes or no framework, to better identify people who may be at risk of restricted social participation, and to enable international comparisons. Under the proposal, people would be counted as having a disability if they reported they cannot do something at all or have a lot of difficulty, which could reduce the percentage of people with disabilities by 40%, raising concerns among people with disabilities, advocates for programs serving people with disabilities, and researchers using the data. Advocates and researchers note that the American Community Survey data are used for enforcing civil rights and allocating federal funding, which means changing the questionnaire could have significant policy implications.
As the 25th anniversary of Olmstead nears, more than one-in-10 working age adults have a disability and most do not receive public disability income.
Over one-in-10 working-age adults reported having a disability in 2022. A disability is defined as having difficulty with hearing, vision, cognition, ambulation, self-care, or independent living, according to KFF’s examination of data on people with disabilities from the American Community Survey.
Fewer than a third of working-age adults with disabilities receive any income from social security programs, including Social Security Disability Insurance and Supplemental Security Income. Meanwhile, they are almost twice as likely to have income below 200% Federal Poverty Level compared with adults without disabilities. They are also more likely to have Medicaid and could face greater paperwork challenges during Medicaid redeterminations.
In many states, COVID-era policies that increased access to home and community-based services are ending, which may create additional barriers to care for some people with disabilities.
As people with disabilities struggle to access and maintain the supports and services they need, average wait times for disability claims are at an all-time high and current recipients may be missing benefit payments on account of past clerical errors.
A new proposed rule could address discrimination against people with disabilities in medical treatment and child welfare programs, establish accessibility standards for web and mobile delivery of health and human services benefits, and establish enforceable standards for accessible medical equipment. It would also codify the Olmstead court decision that requires services to be provided in the most integrated setting appropriate.