Poll Finding

KFF Health Tracking Poll February 2024: Voters on Two Key Health Care Issues: Affordability and ACA

Published: Feb 21, 2024

Findings

Key Takeaways

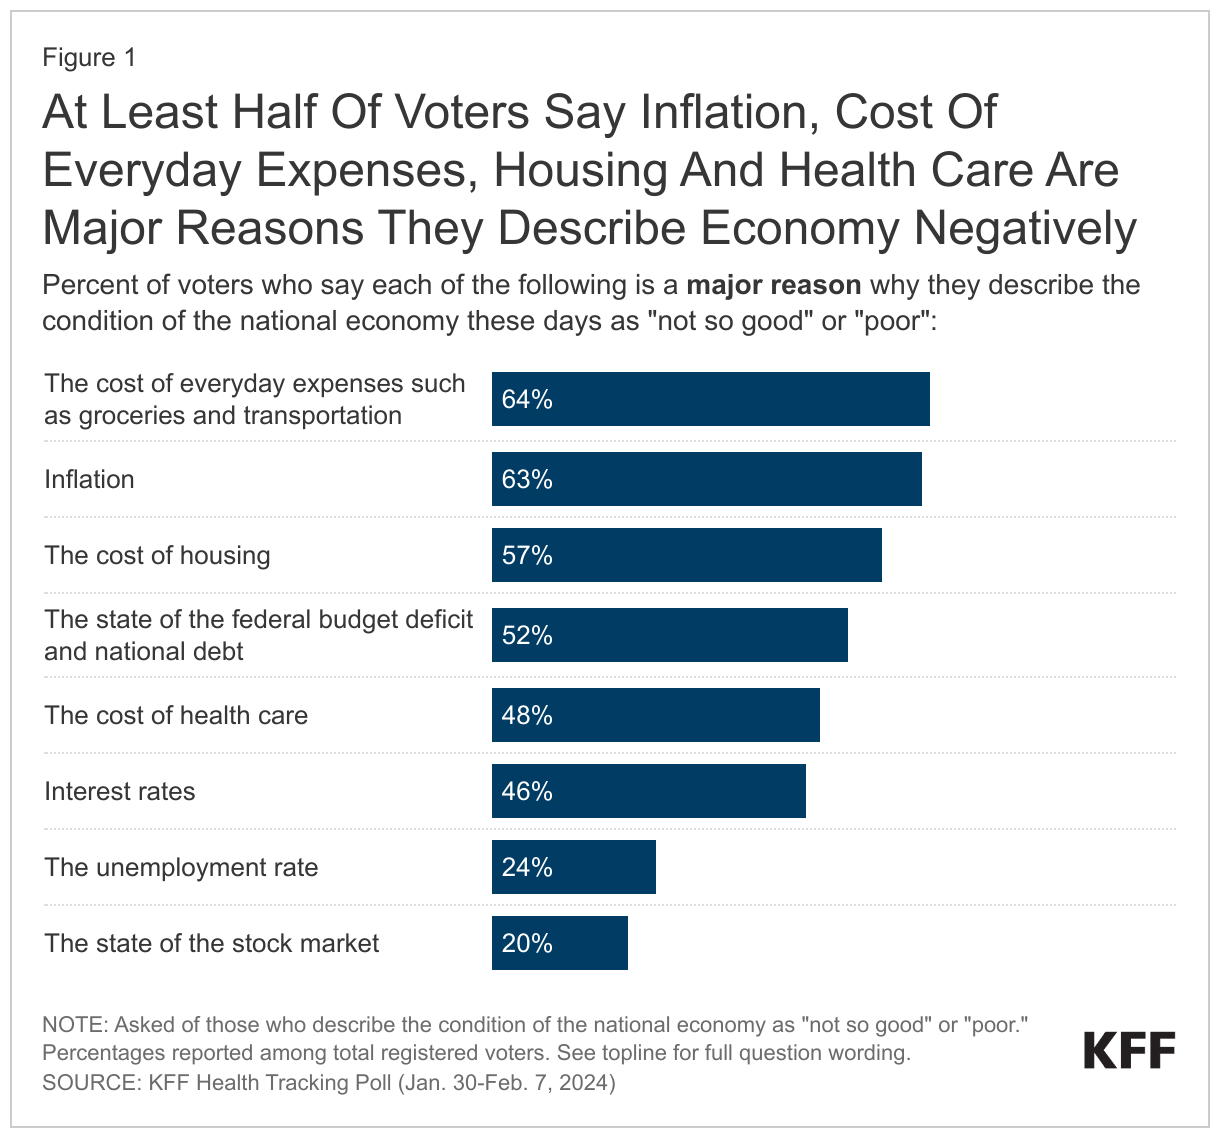
  • Inflation and health care affordability continue to be the top issues voters want the 2024 presidential candidates to talk about on the campaign trail, and while national news has recently emphasized an improving national economy alongside expanded consumer spending, most voters (67%) rate the national economy as “not so good” or “poor.” Voters’ assessment of the economy is largely influenced by their perceptions of their own costs, as majorities describe the economy negatively due to the cost of everyday expenses (64%), inflation (63%), the cost of housing (57%), or the cost of health care (48%). About half of all voters say the economy is “not so good” or “poor” due to the state of the federal budget deficit and national debt (52%), and few say financial indicators such as the unemployment rate (24%) or the state of the stock market (20%) factor into their assessment in a major way.
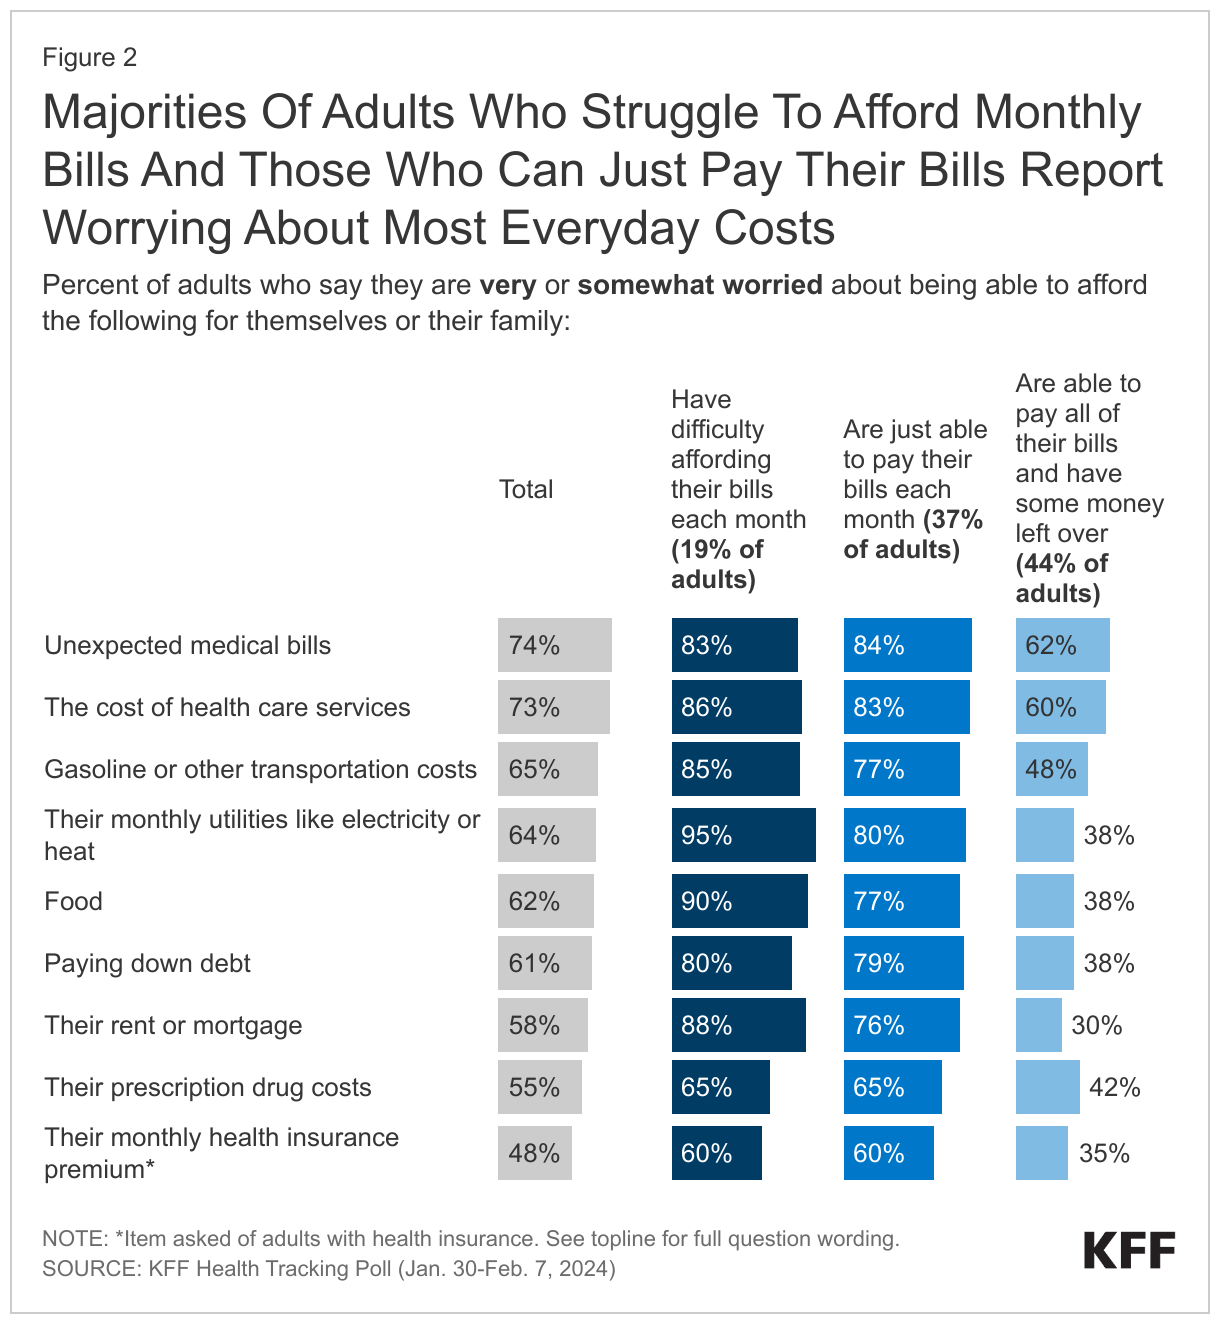
  • Unexpected medical bills and health care costs top the list of expenses that adults, regardless of partisanship, say they worry about affording, with three in four adults saying they are “very” or “somewhat worried” about being able to afford unexpected medical bills (74%) or the cost of health care services (73%) for themselves and their family. Just over half (55%) report worrying about being able to afford prescription drug costs, and about half of insured adults (48%) say they are worried about being able to afford their monthly health insurance premium.
  • Voters are divided along party lines over which candidate they think has the better approach to the future of the Affordable Care Act, with partisans overwhelmingly choosing their party’s candidate. Nine in ten Democratic voters (90%) say Biden has the better approach and nine in ten Republican voters (91%) say Trump does. Although the vast majority of Republicans say Trump has a better approach to the ACA, few (30%) Republican voters think Trump has a health care plan to replace it. At the same time, most of the public does not associate President Biden with playing a major role in the passage of the ACA, which was signed into law when he was Vice President. One in five (21%) say he had a major role in the law’s passage, including a larger share of Democrats ages 50 and older (42%).
  • The Affordable Care Act continues to be more popular than it was prior to Republican attempts to repeal it in 2017, with six in ten (59%) expressing a favorable view, though partisans are divided on what they want to see done with the law. About three in four Democrats want the next Presidential Administration and Congress to expand what the law does (77%), while about two-thirds of Republicans either want the law to be scaled back (23%) or repealed entirely (39%). A majority of independents want the law to be expanded (48%) or kept as is (18%).
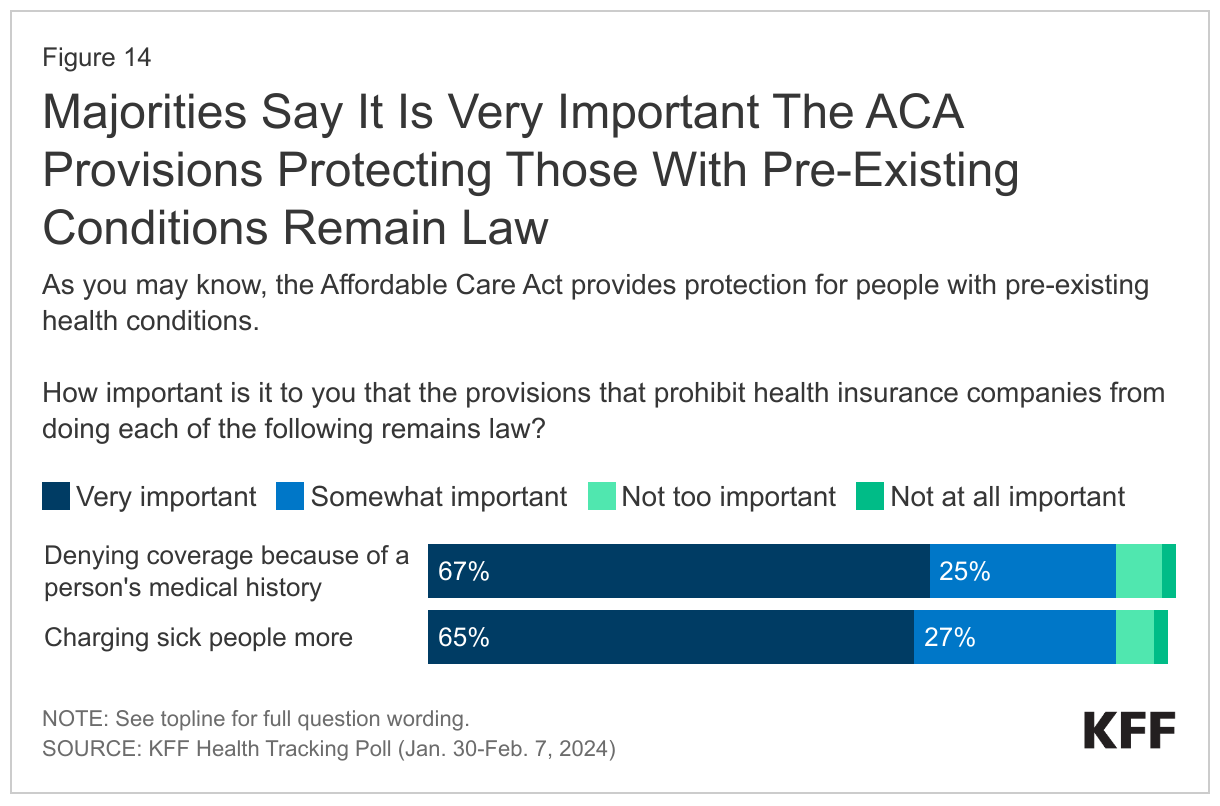
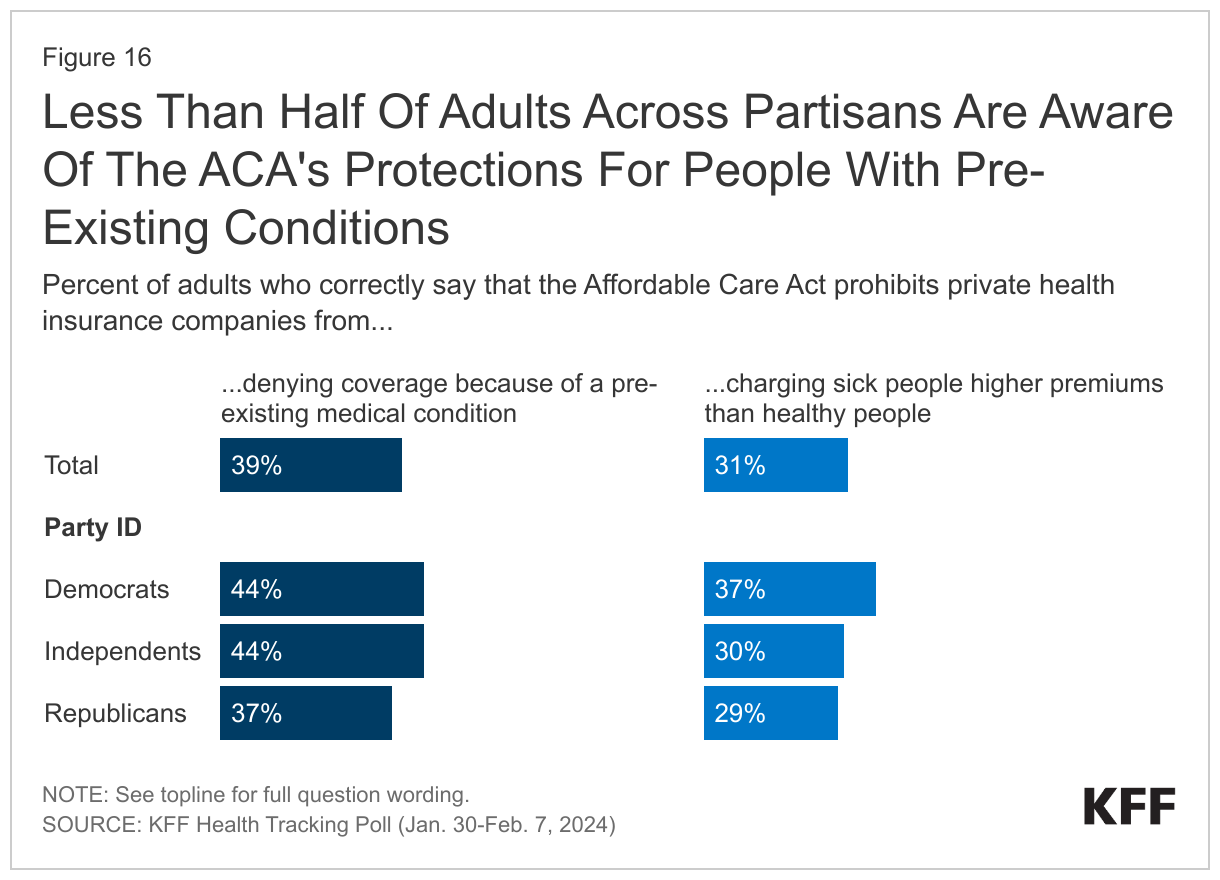
  • One of the most consistently popular provisions of the Affordable Care Act is its protections for people with pre-existing conditions. Most adults across partisans say it is very important that the aspects of the law that prevent health insurance companies from denying coverage due to someone’s medical history (67%) and that prevent health insurance companies from charging sick people higher premiums (65%) remain law. However, few – between three and four in ten for each aspect – are aware that these are provisions of the ACA.
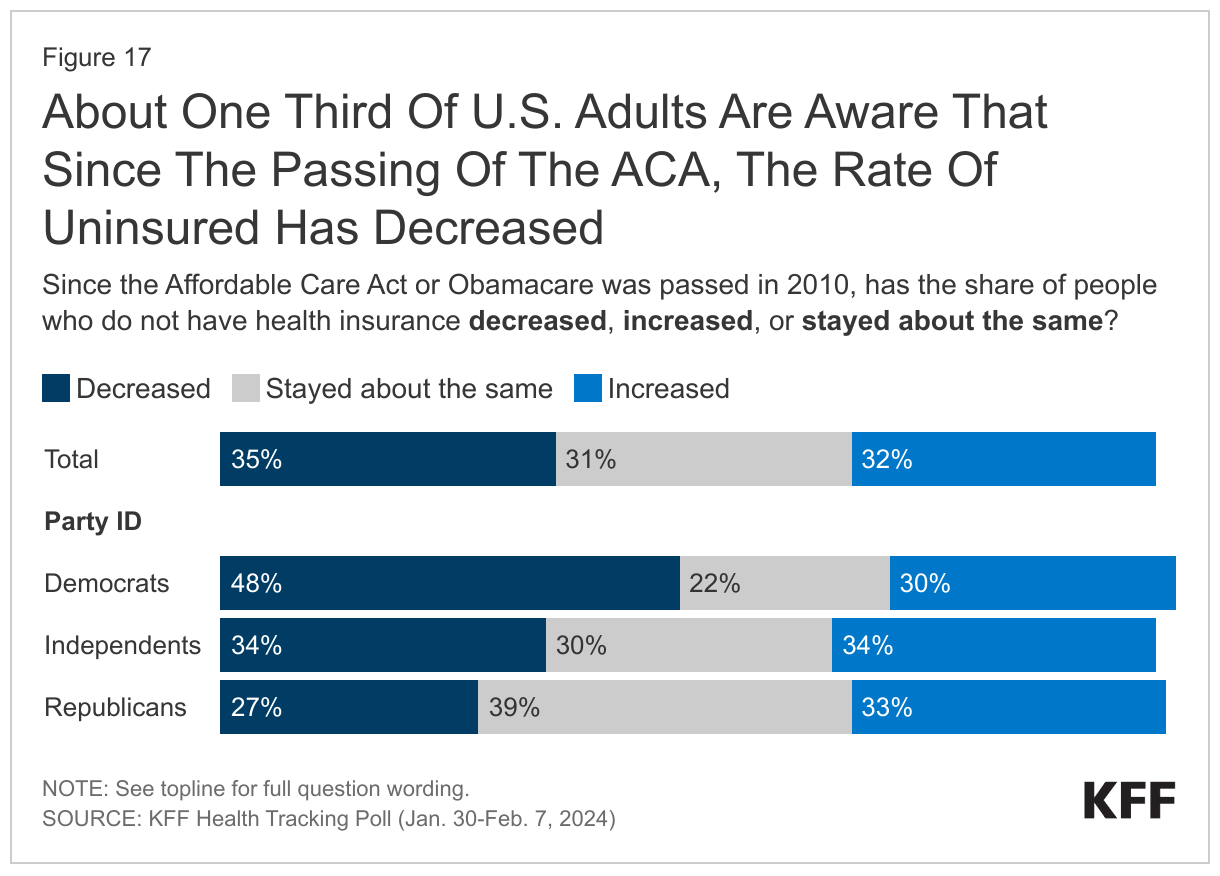
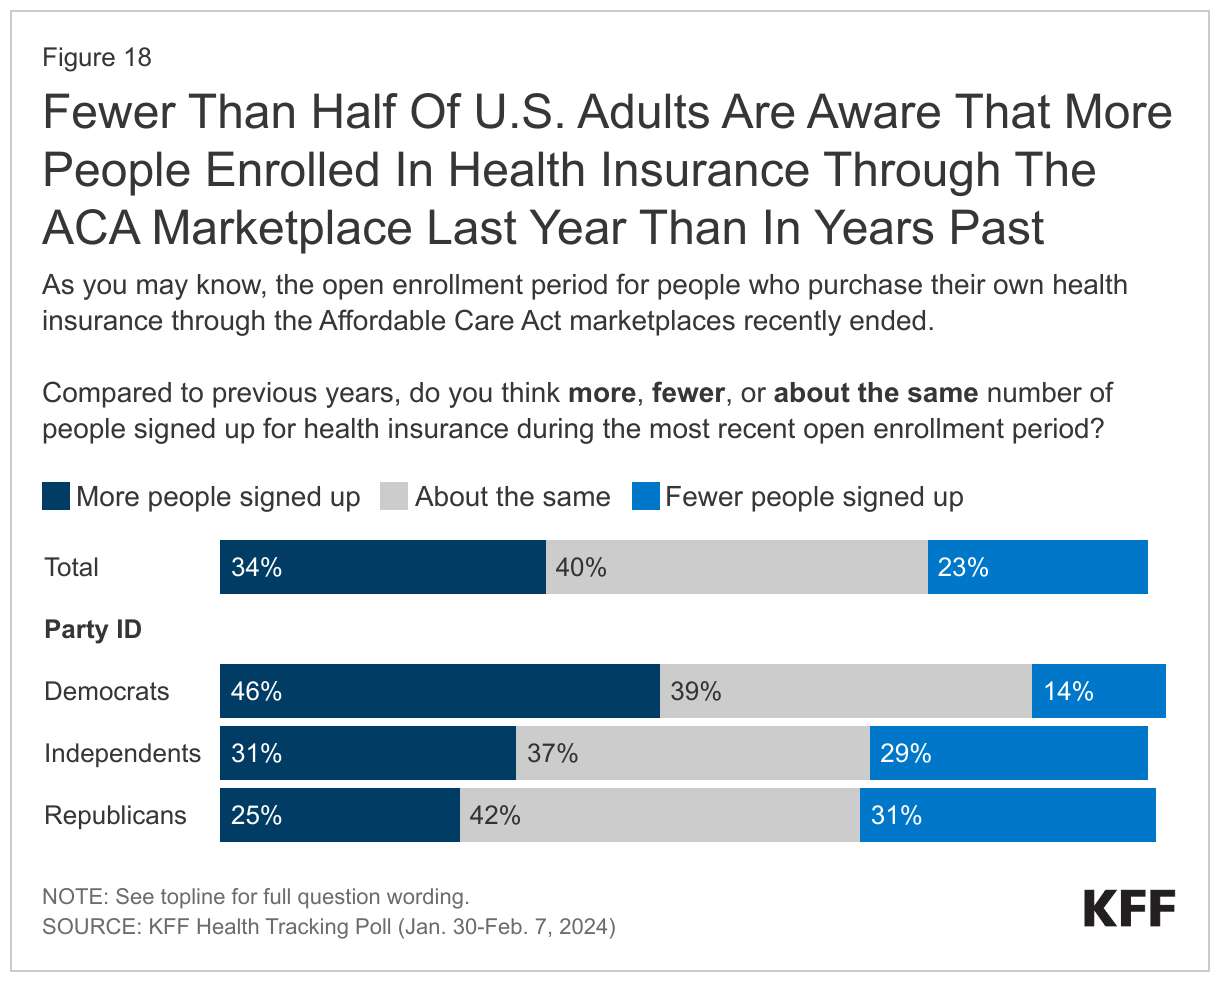
  • Knowledge among the public is low regarding the Affordable Care Act’s impact on lowering the rate of uninsured in the U.S. and the all-time high rate of enrollees during the recent open enrollment period. One-third (35%) of adults – rising to about half (48%) of Democrats – correctly say that since the ACA was passed in 2010, the uninsured rate in the U.S. has decreased. A similar share (34%) correctly say that more people signed up in this enrollment period than in the past.

Health Care Affordability as a Voting Issue

Voters want to Hear from Candidates on Inflation, The Affordability of Health Care and The Future of Government Health Care Programs

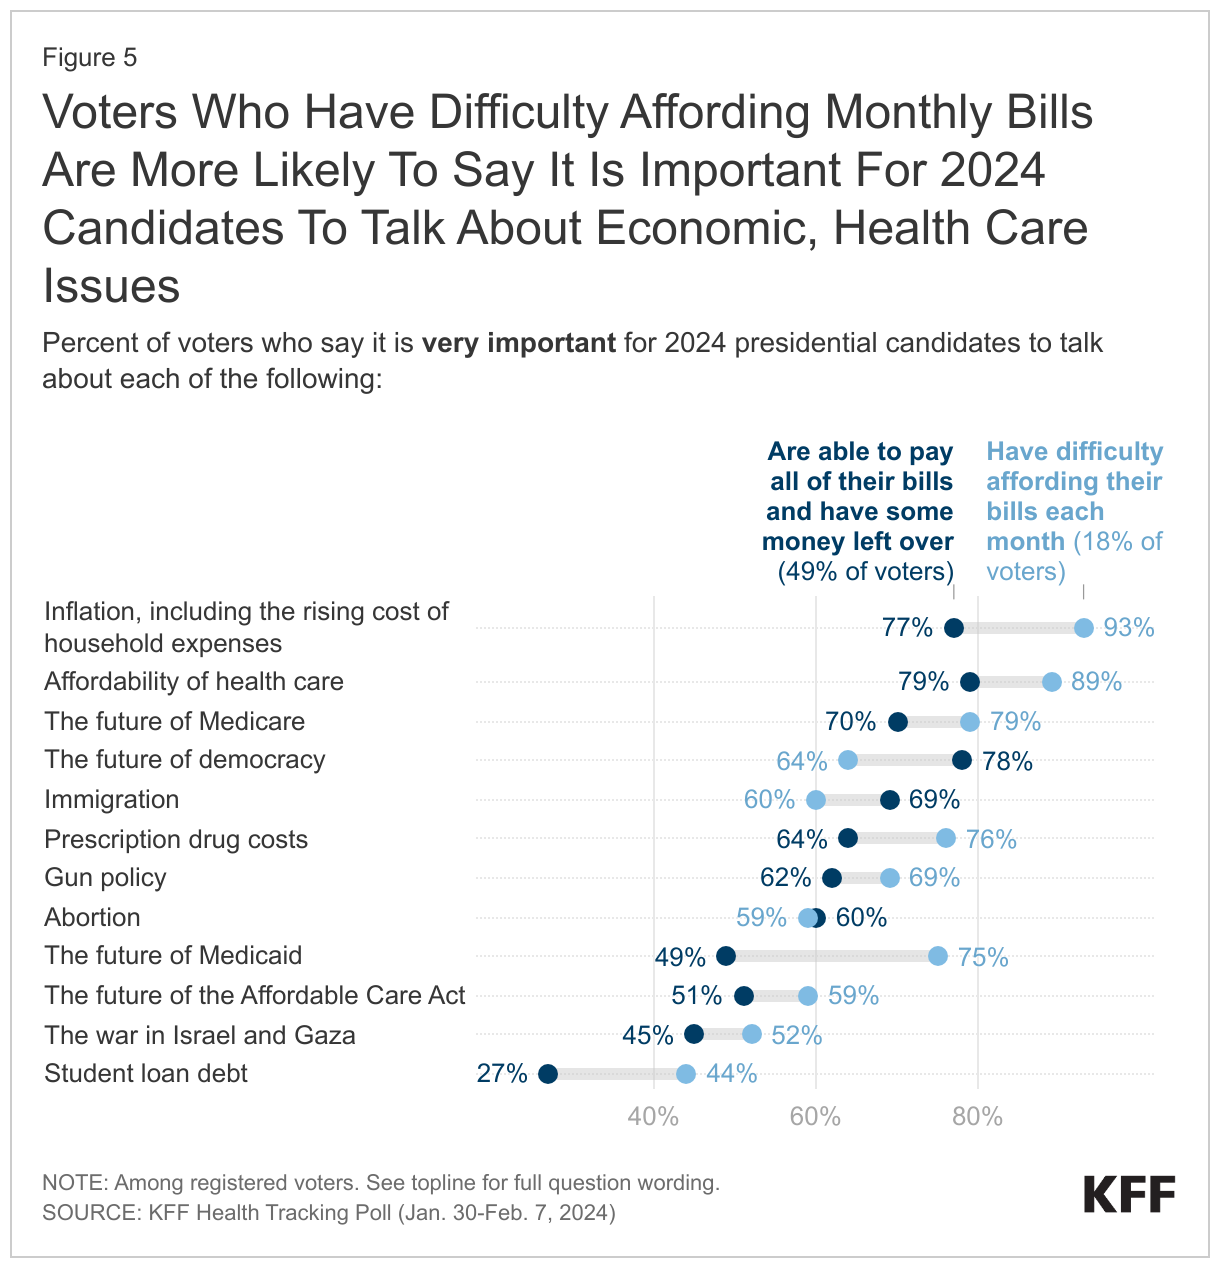
Heading into the election, the issues that voters are most interested to hear candidates talk about are related to the economy and health care costs. At least eight in ten voters say it is “very important” for the 2024 presidential candidates to talk about inflation (83%) and the affordability of health care (80%) – relatively unchanged from November 2023. Following inflation and health care affordability, about seven in ten voters say it is “very important” to hear presidential candidates talk about the future of Medicare (73%), the future of democracy (72%), and immigration (69%).

The future of the Affordable Care Act, an issue that was once a key health care issue for Republican voters, is ranked as a “very important” issue for larger shares of Democratic voters (71%) than Republican voters (36%). In December 2023, former President Donald Trump reignited the issue by announcing that he plans to replace the 2010 health care law. However, similar minorities of Republicans now and before these statements say the issue is “very important” to them.

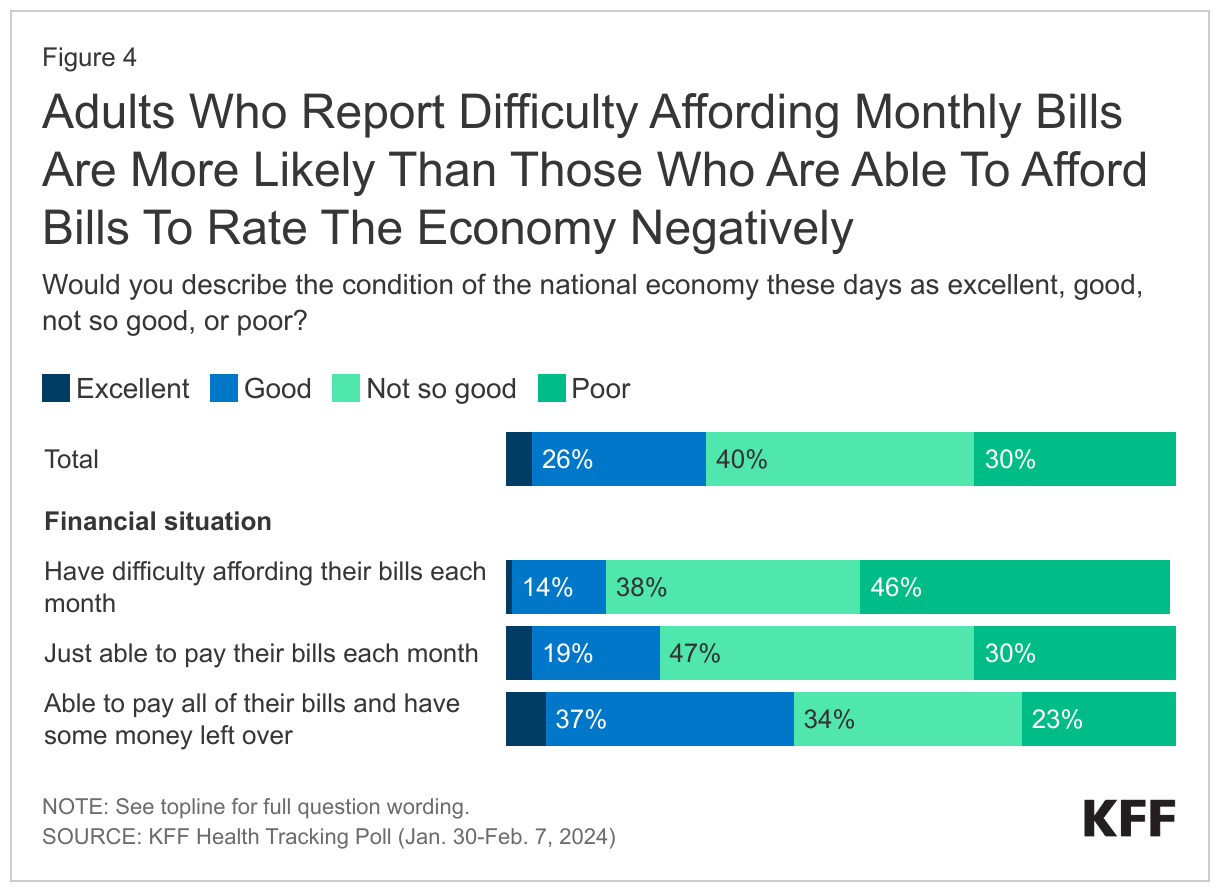
With inflation and health care affordability remaining among the most important issues voters want to hear the presidential candidates talk about heading into the 2024 election, two-thirds of voters (67%) describe the national economy as either “not so good” or “poor.” Republican voters are more than twice as likely as Democrats to rate the economy negatively (88% v. 37%) and seven in ten independent voters (72%) rate the economy negatively.

Large shares of voters who rate the economy negatively cite cost issues, including health care costs, as a major reason for doing so. A majority of voters rate the economy negatively and say a “major reason” for doing so is the cost of everyday expenses (64%), inflation (63%), or the cost of housing (57%). About half of voters describe the economy as “not so good” or “poor” and say the state of the federal budget deficit and national debt (52%) or health care costs (48%) are a “major reason” for their negative views. Far fewer voters cite indicators such as the unemployment rate (24%) or the state of the stock market (20%) as a “major reason” they rate the economy negatively.

Majority of Voters Say Inflation And Cost Of Everyday Expenses, Housing And Healthcare Are Major Reasons They Describe Economy Negatively

Among those who rate the economy negatively, Democratic voters are more likely than Republican voters to cite the cost of health care and the rate of unemployment as “major reason” for doing so, while Republican voters are more likely to cite the state of the federal budget deficit and national debt.

Health Care Expenses Top List of Financial Worries

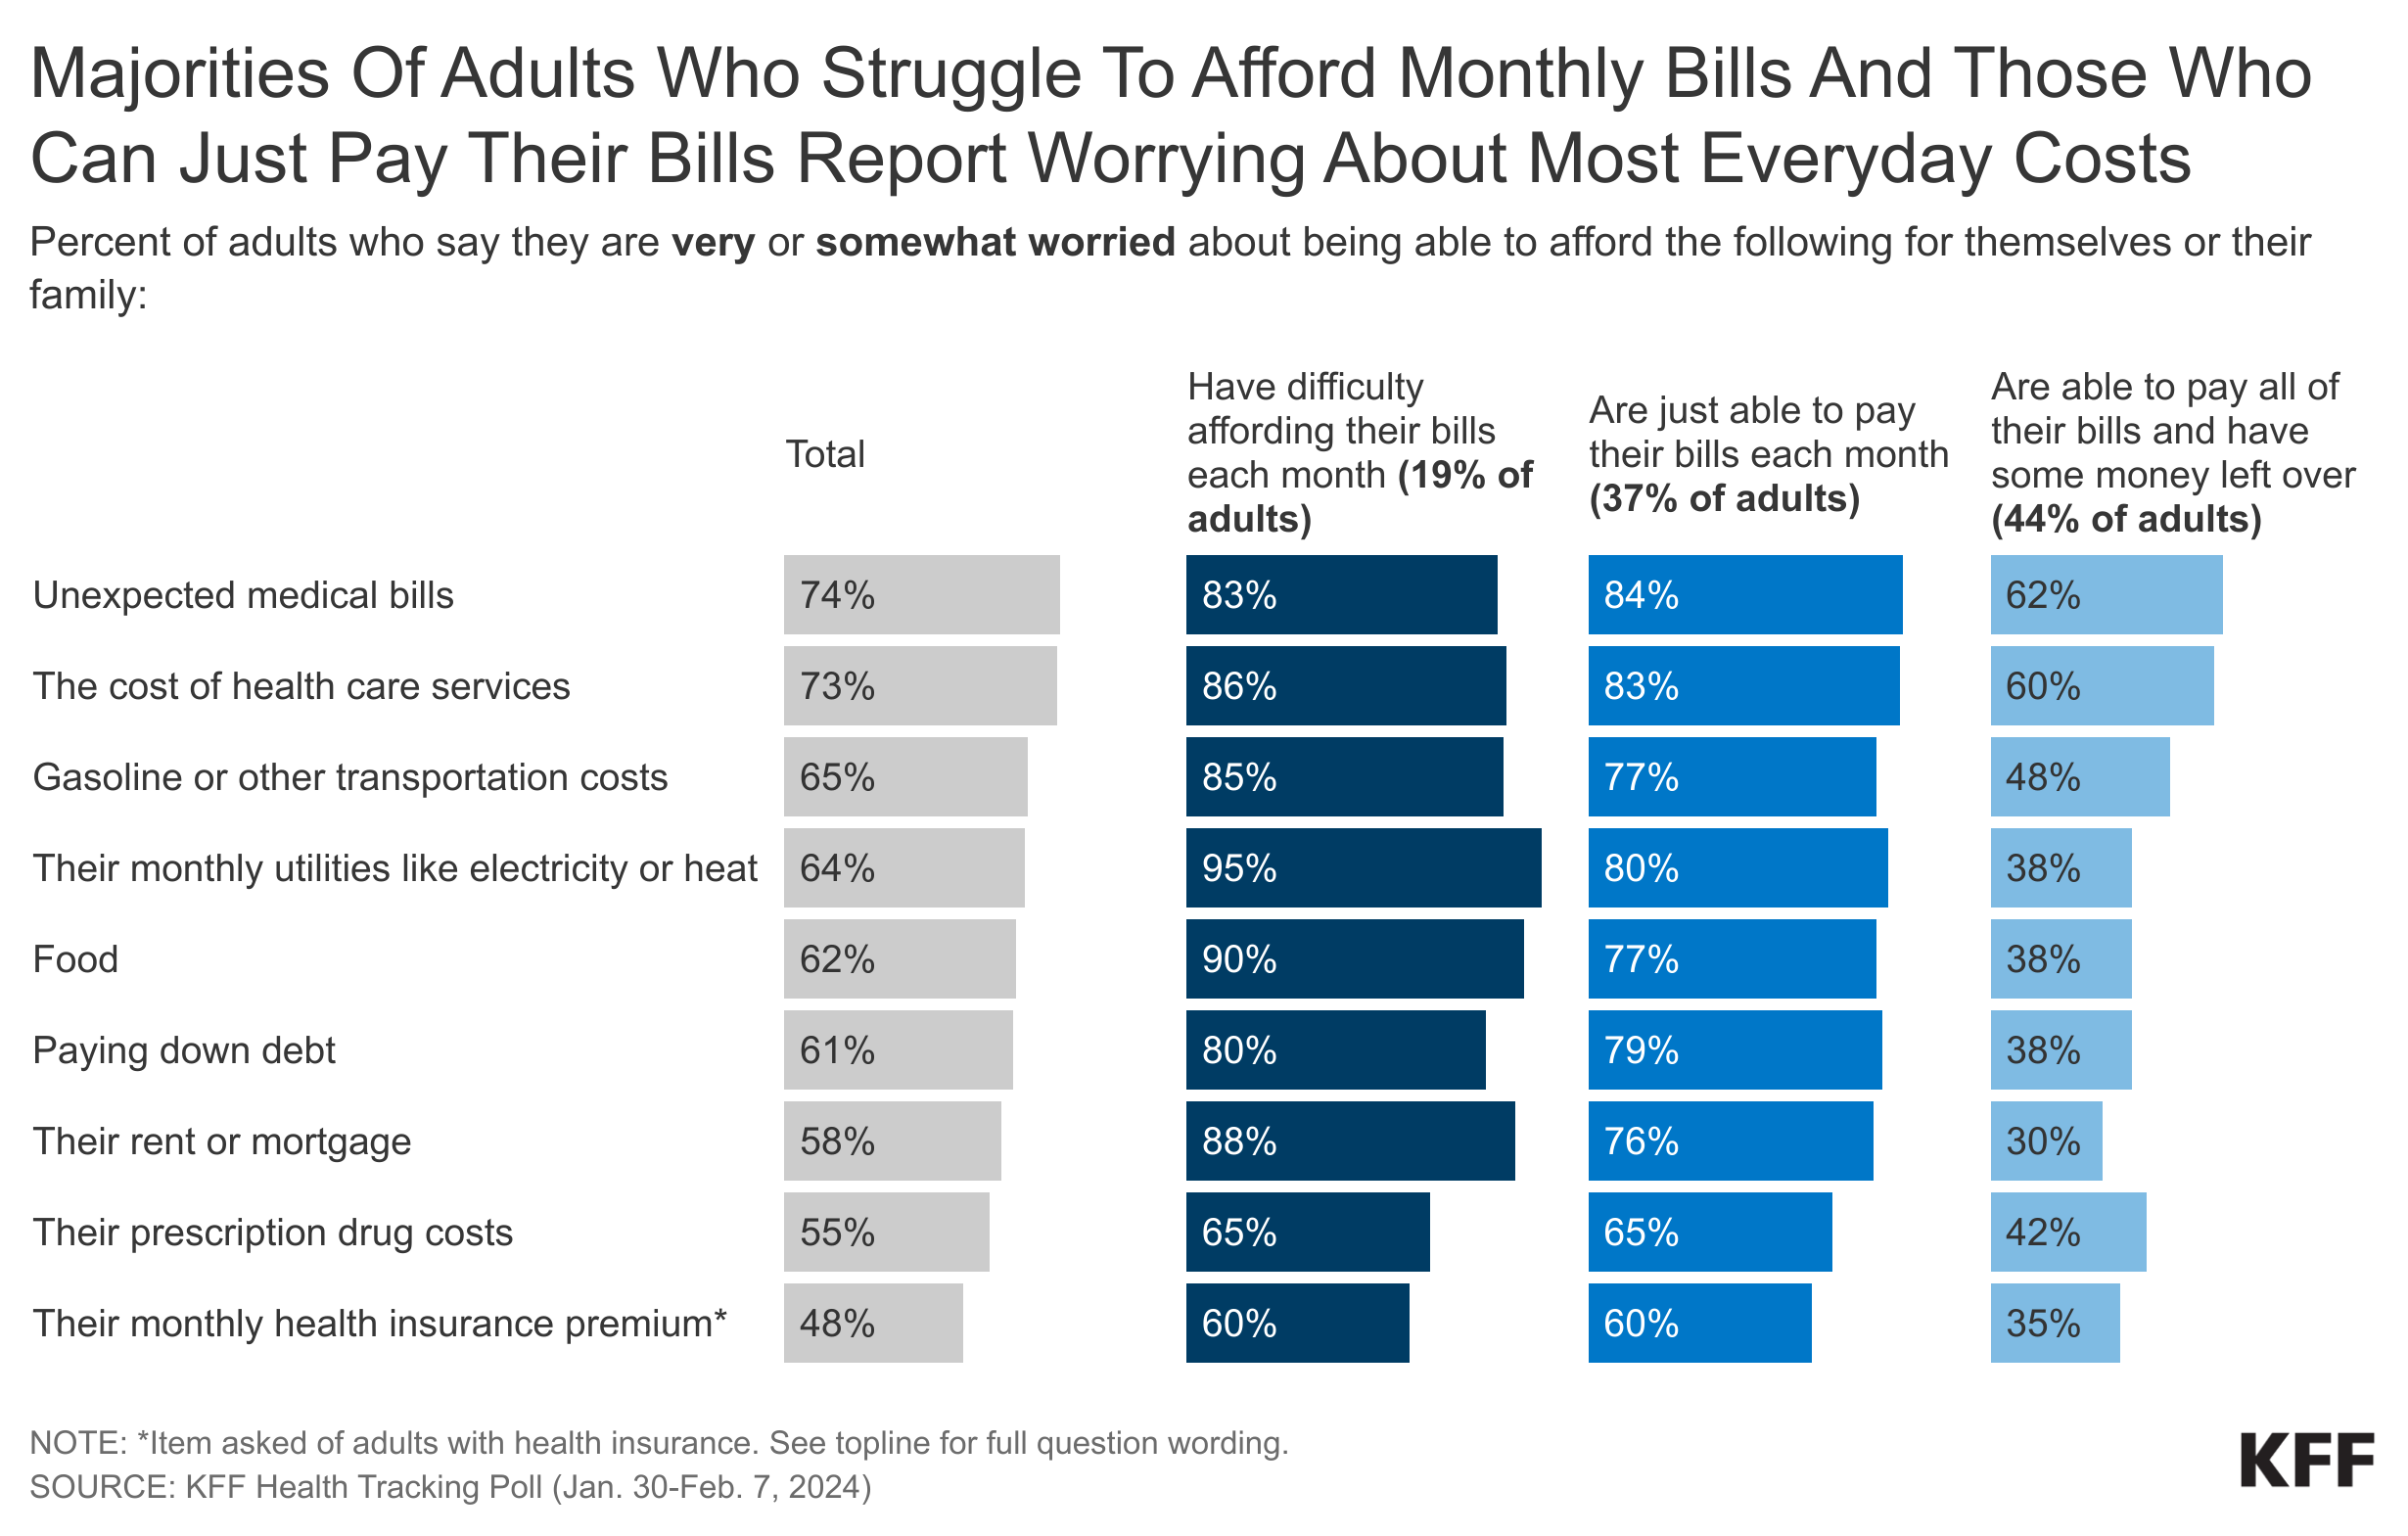
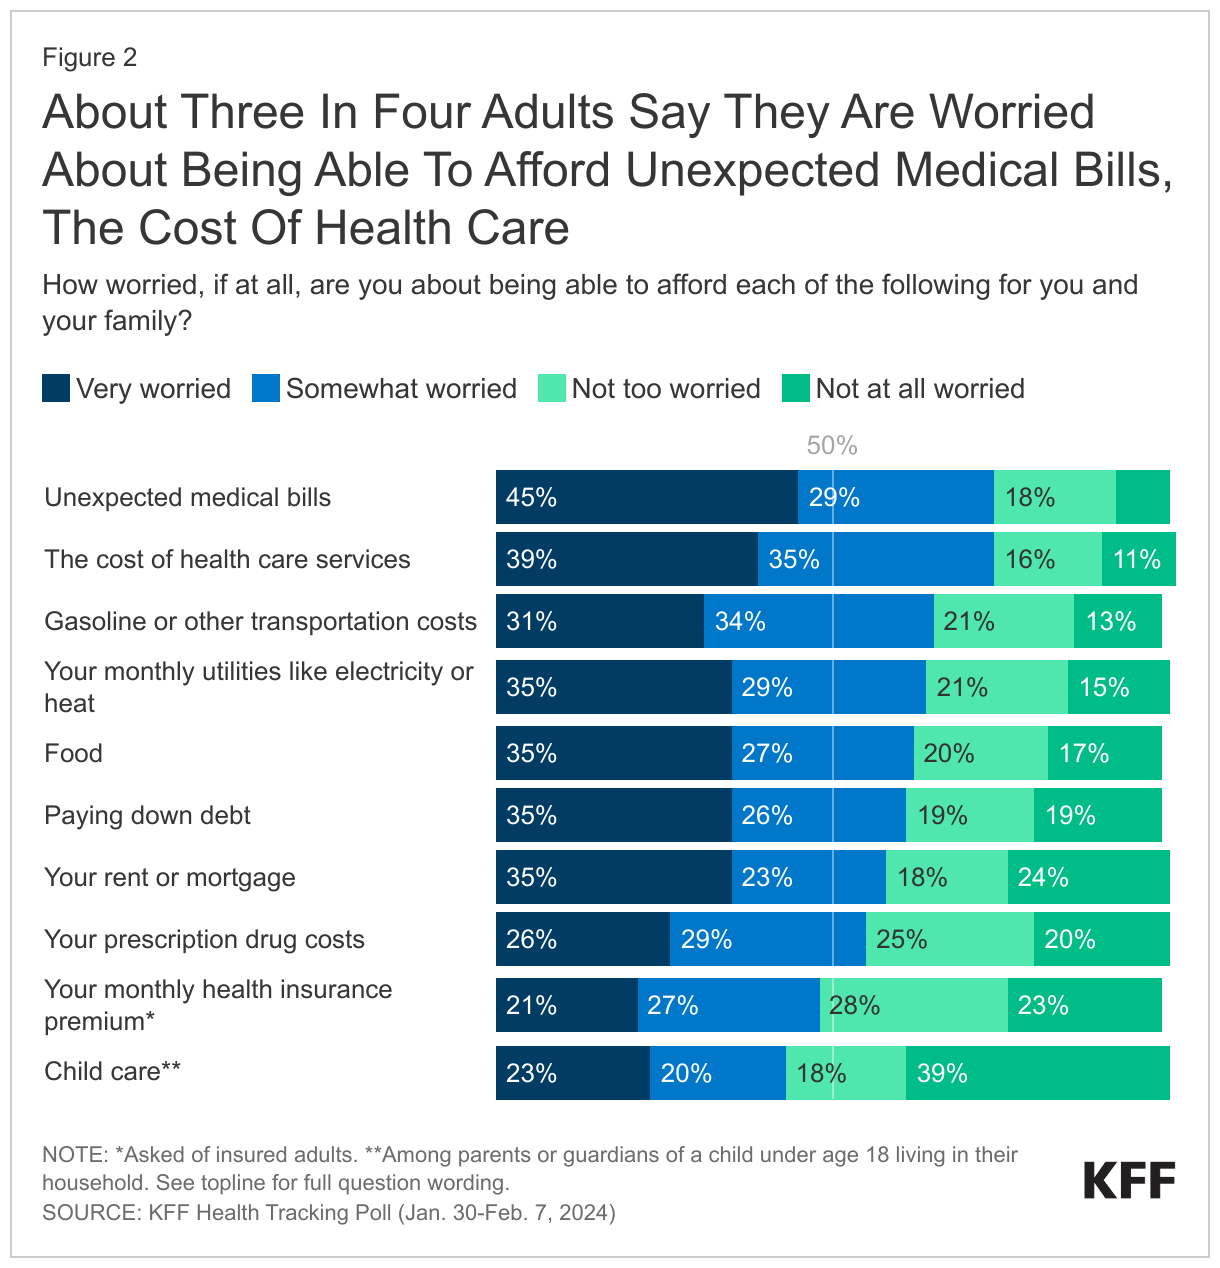
Alongside voters’ overwhelmingly negative views of the economy, large shares of the public say they worry about being able to afford basic living expenses with health care cost concerns topping the list. About three in four adults say they are either “very” or “somewhat worried” about being able to afford unexpected medical bills (74%) or the cost of health care services (73%) for themselves and their families. Just over half of adults (55%) say they are “very worried” about being able to afford prescription drug costs, and about half of insured adults say they are “very” or “somewhat worried” about being able to afford their monthly health insurance premium (48%).

Beyond health care cost concerns, a majority of the public reports worrying about being able to afford gasoline or other transportation costs (65%), their monthly utilities like electricity and heat (64%), food (62%), paying down debt (61%), or their rent or mortgage (58%). About four in ten parents (43%) say they are worried about being able to afford child care for themselves and their family.

About Three In Four Adults Say They Are Worried About Being Able To Afford Unexpected Medical Bills, The Cost Of Health Care

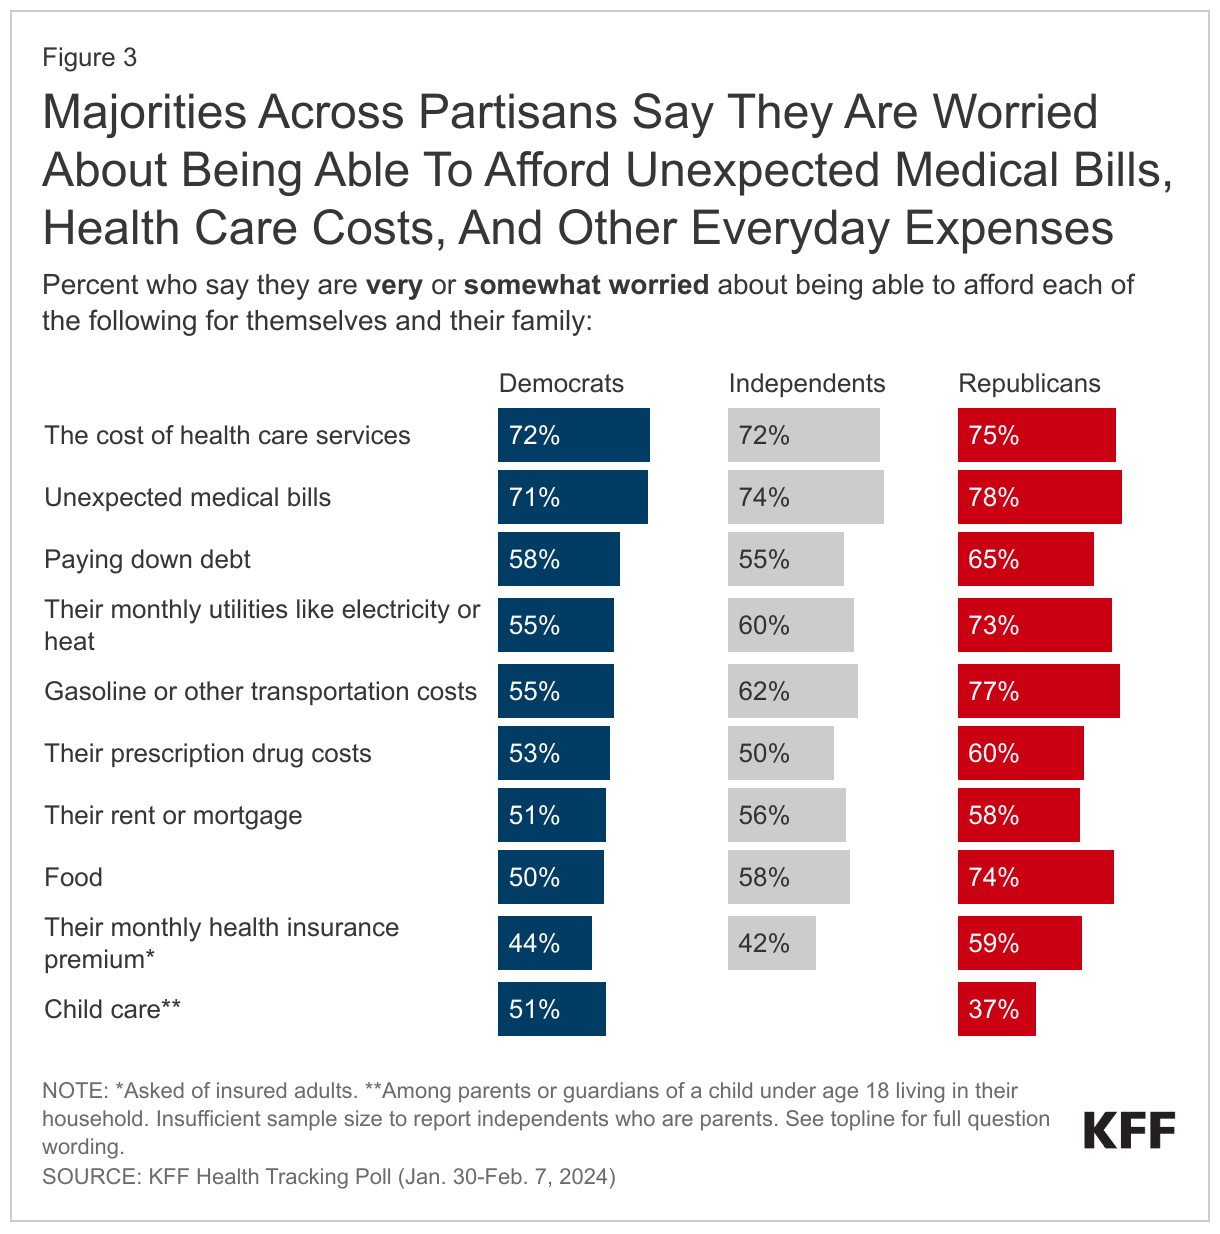
Unexpected medical bills and the cost of health care services are the top financial worries across partisans. At least seven in ten Democrats and Republicans say they are “very” or “somewhat worried” about being able to afford the cost of health care services (72% and 75%, respectively) or unexpected medical bills (71% and 78%, respectively) for themselves and their family.

Majorities Across Partisans Say They Are Worried About Being Able To Afford Unexpected Medical Bills, Health Care Costs, And Other Everyday Expenses

Biden vs. Trump on Addressing High Health Care Costs

With health care affordability topping the list of issues voters want to hear about and leading the list of financial worries, the latest KFF Tracking Poll suggests neither President Biden nor former President Trump has a clear advantage on this issue, but Republicans give Trump higher marks on this issue than Democrats give Biden.

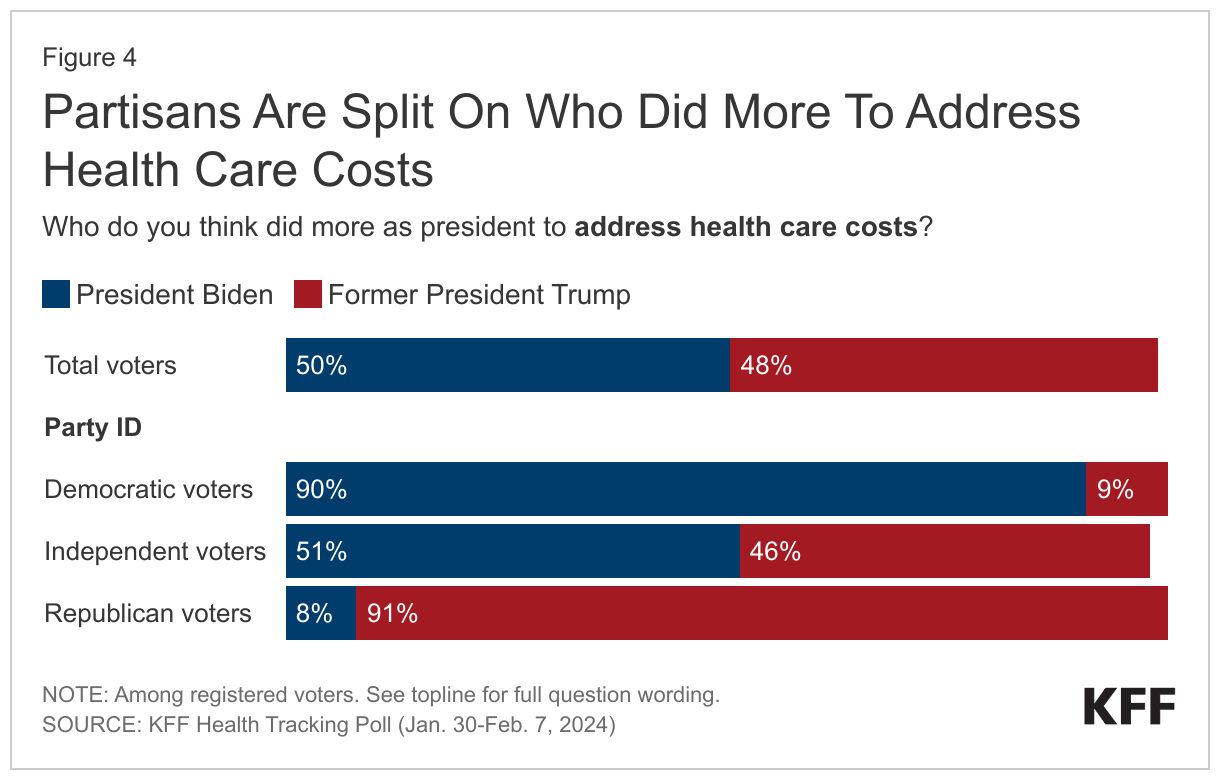
Reflecting the current dynamic of the 2024 election overall, voters are divided along partisan lines on which candidate did more when they were president to address health care costs. Most Democrats (90%) say Biden has done more to address health care costs and most Republicans (91%) say Trump did more during his time as president. Independents are split, with similar shares saying each did more to address health care costs.

Partisans Are Split On Who Did More To Address Health Care Costs

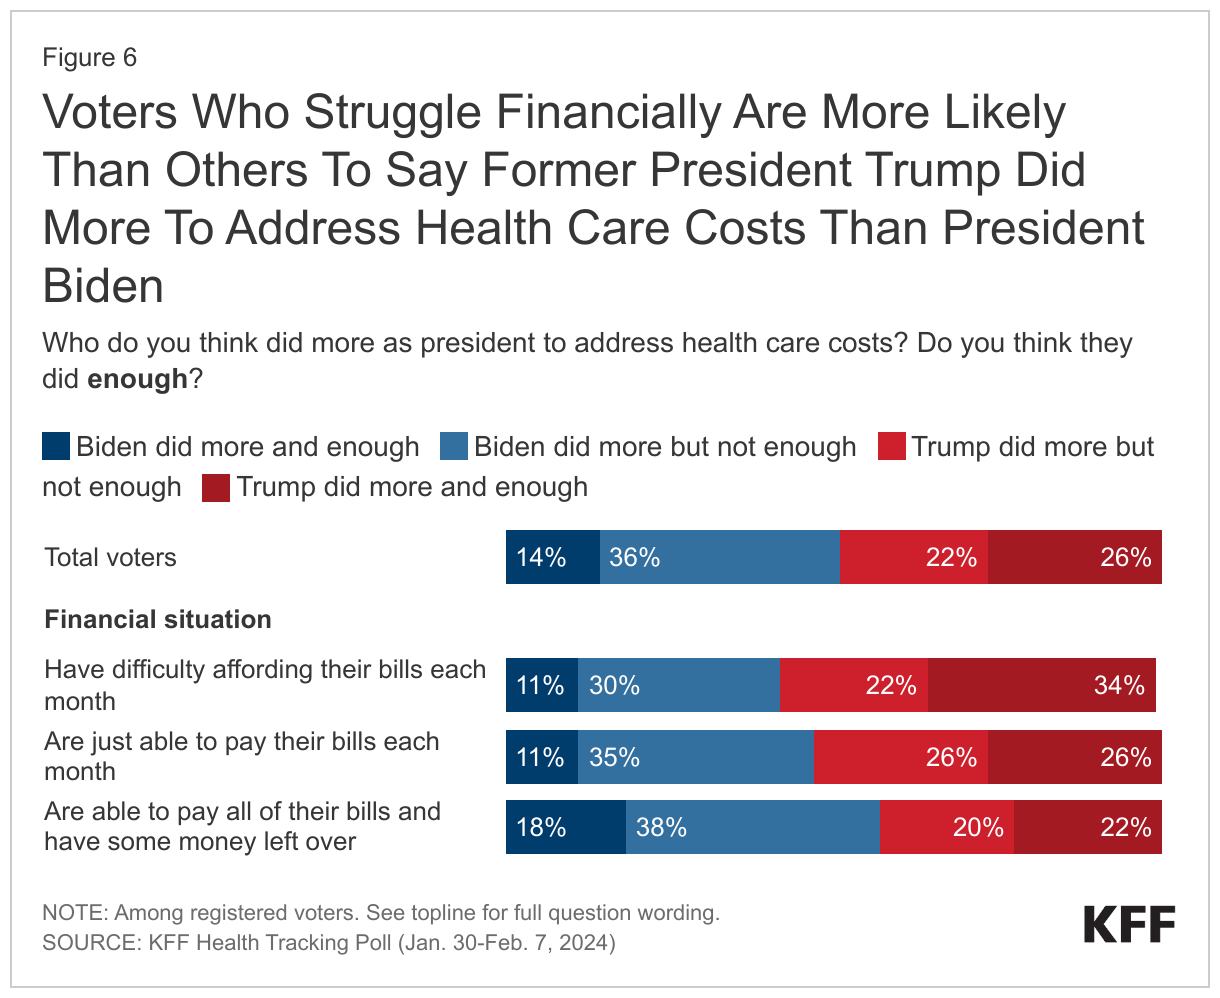
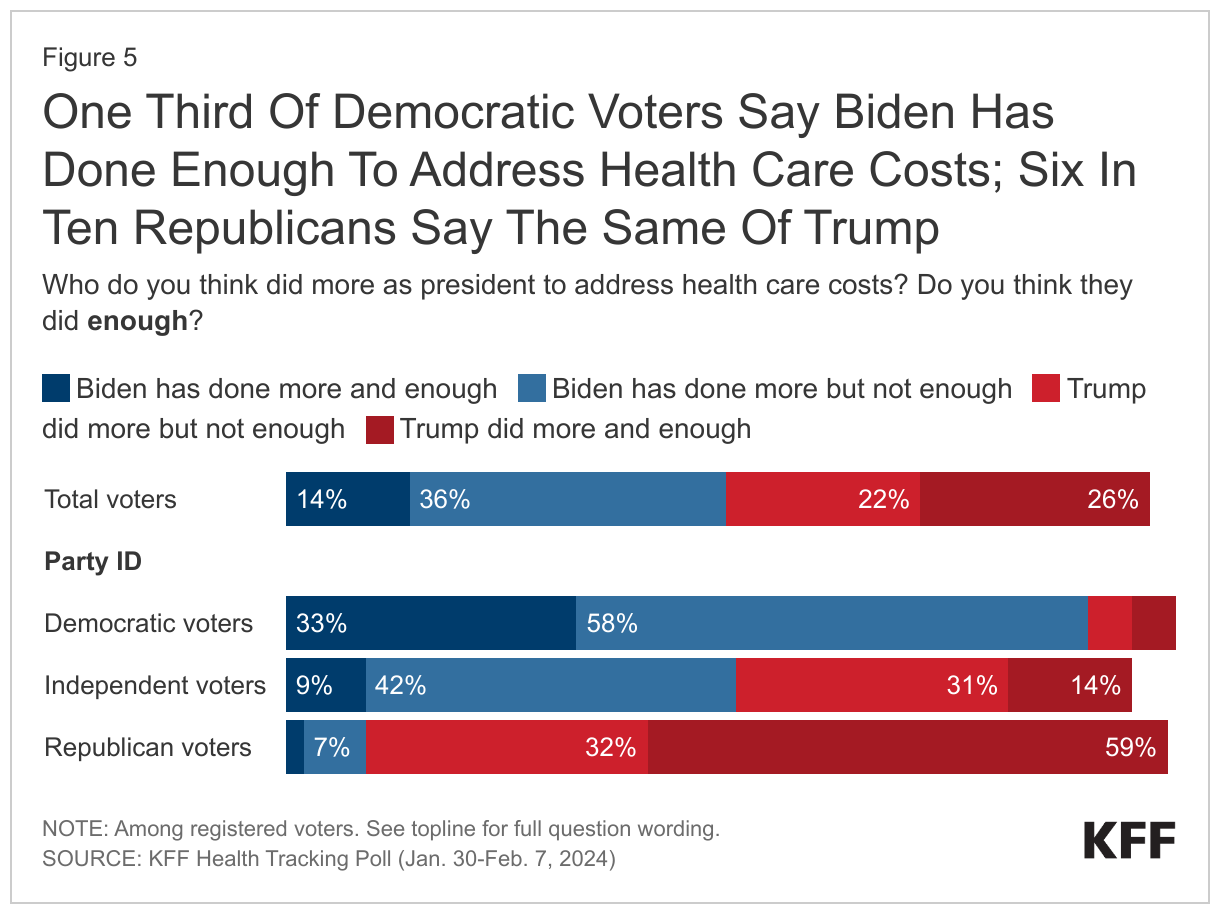
While partisans say their party’s candidate did more to address health care costs, Trump receives higher levels of satisfaction on the issue from voters overall and Republican voters than Biden does from voters overall and Democratic voters. One in seven (14%) voters overall say Biden has done more than Trump and has done enough to address health care costs, while one in four (26%) say Trump has done more than Biden and that he did enough on this issue. A majority of voters say neither president did enough, including about one in three who say President Biden did more than Trump but not enough (36%) and about one in five who say former President Trump did more than Biden but not enough (22%). Trump may be reaping the benefits of the retrospective views of voters, whereas criticism of Biden may be more reflective of voters’ general dissatisfaction with the current state of the national economy.

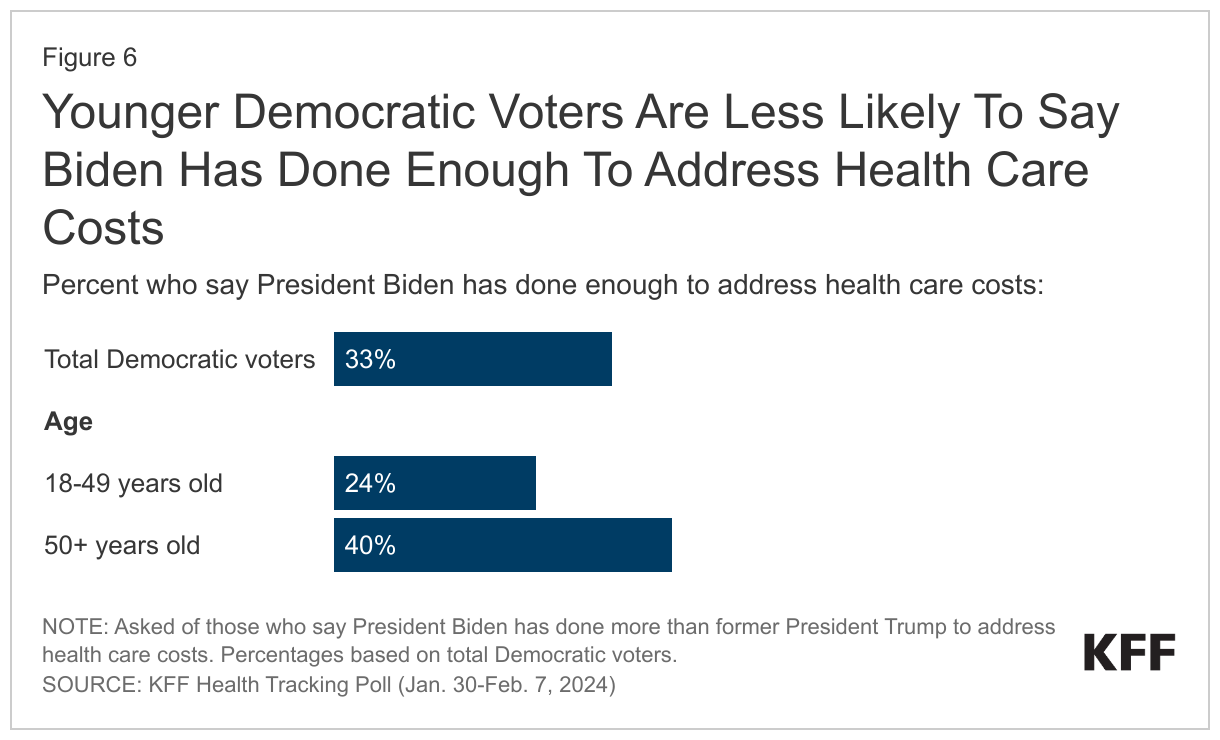
This also holds true when examining partisan attitudes, with Democratic voters being less satisfied with Biden’s performance than Republican voters are with Trump on health care costs: About one in three (33%) Democratic voters say Biden has done enough to address health care costs while six in ten (59%) Republican voters say Trump has done enough. Few independent voters are satisfied with either candidate’s addressing of health care costs, as one in ten (9%) say President Biden has done enough and 14% say former President Trump has done enough. This is in-line with Democrats’ overall lack of enthusiasm of President Biden and strong support for Trump among Republicans as each party’s respective presidential candidate at this time.

One Third Of Democratic Voters Say Biden Has Done Enough To Address Health Care Costs; Six In Ten Republicans Say The Same Of Trump

Perhaps reflecting younger voters’ overall lower enthusiasm for President Biden, one in four (24%) younger Democratic voters say Biden has done enough when it comes to addressing health care costs, compared to four in ten (40%) Democratic voters ages 50 and older who say the same.

Younger Democratic Voters Are Less Likely To Say Biden Has Done Enough To Address Health Care Costs

Republican voters, however, by age are aligned, with similar shares across age groups saying Trump has done enough to address health care costs. Trump may be reaping the benefits of the retrospective views of a largely Republican base, whereas Democrats’ critiques of President Biden may reflect voters’ general dissatisfaction with the current state of the economy.

The Affordable Care Act as a Voting Issue

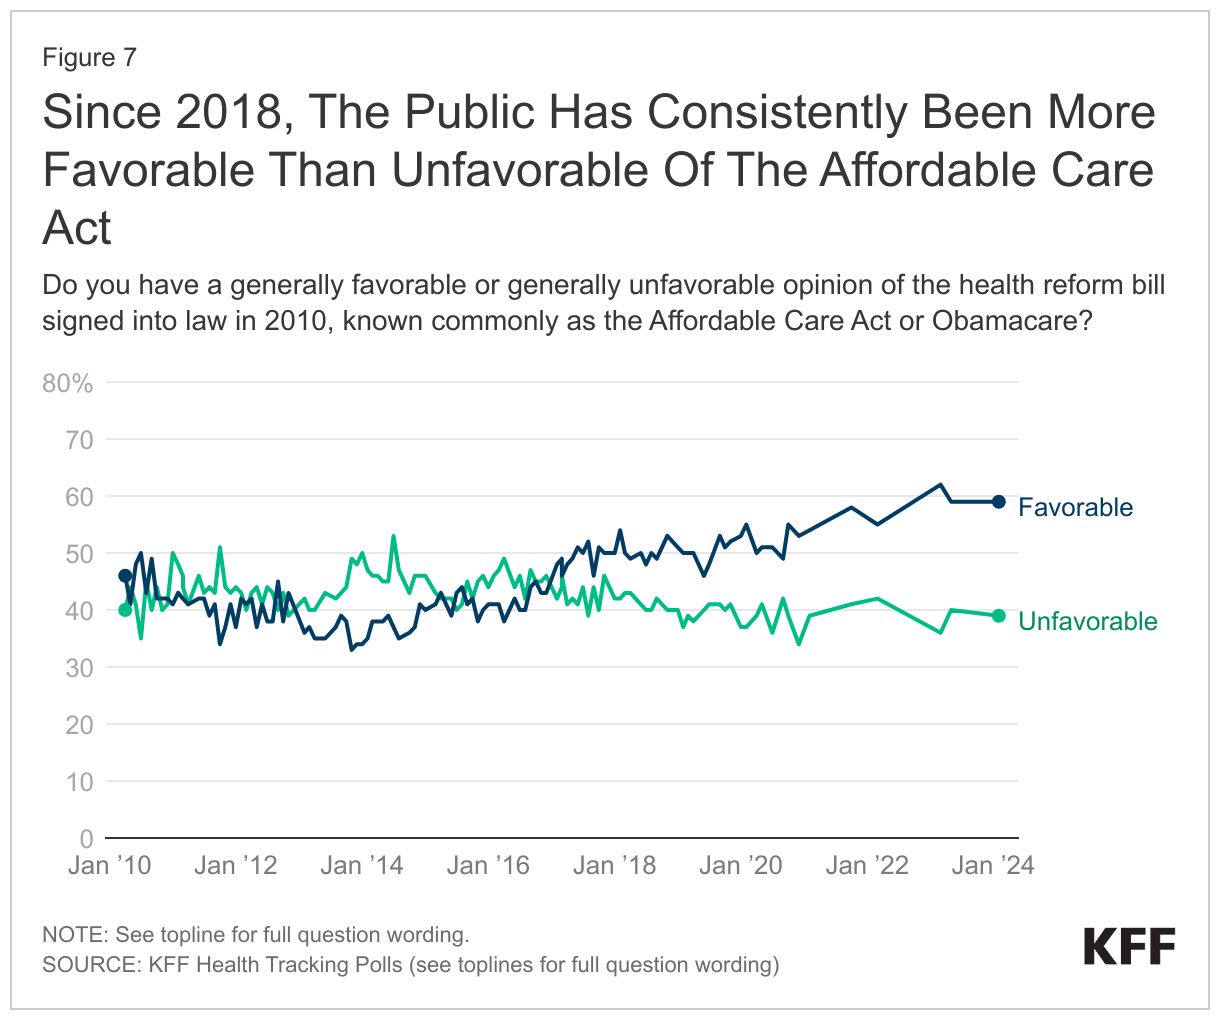
In November of last year, former President Trump reignited the conversation of replacing the Affordable Care Act if elected president, an issue that was once a key health care issue for Republicans. Once a more contentious issue, the health care law enacted under the Obama Administration in 2010 has consistently garnered more support than opposition since 2018.

Since 2018, The Public Has Consistently Been More Favorable Than Unfavorable Of The Affordable Care Act

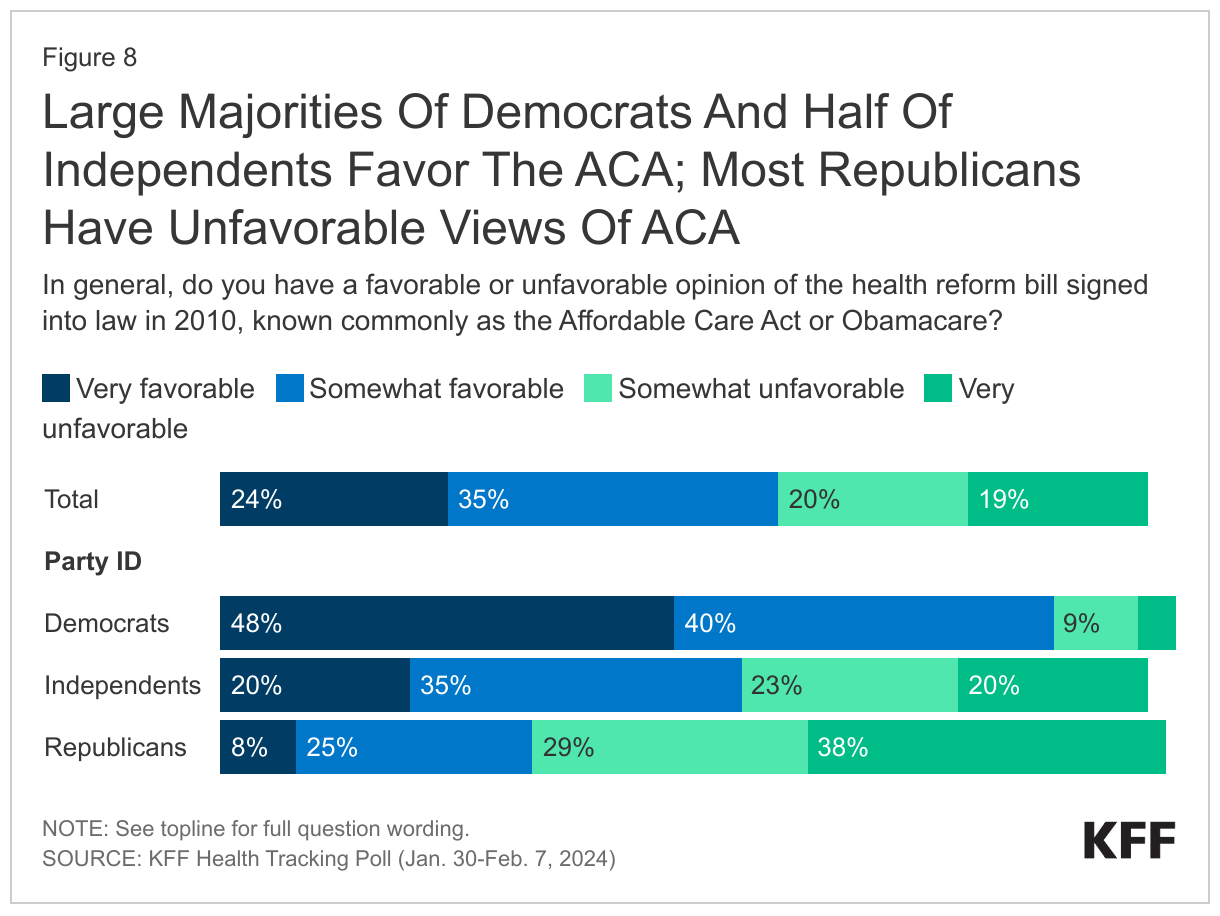
However, views of the Affordable Care Act remain partisan with nearly nine in ten (87%) Democrats and about half (55%) of independents holding positive views of the law while two-thirds (67%) of Republicans view the law unfavorably. One-third (33%) of Republicans view the law favorably, a share that has increased since the law was enacted. See here for full trend on views of the ACA by partisanship.

Large Majorities Of Democrats And Half Of Independents Favor The ACA; Most Republicans Have Unfavorable Views Of ACA

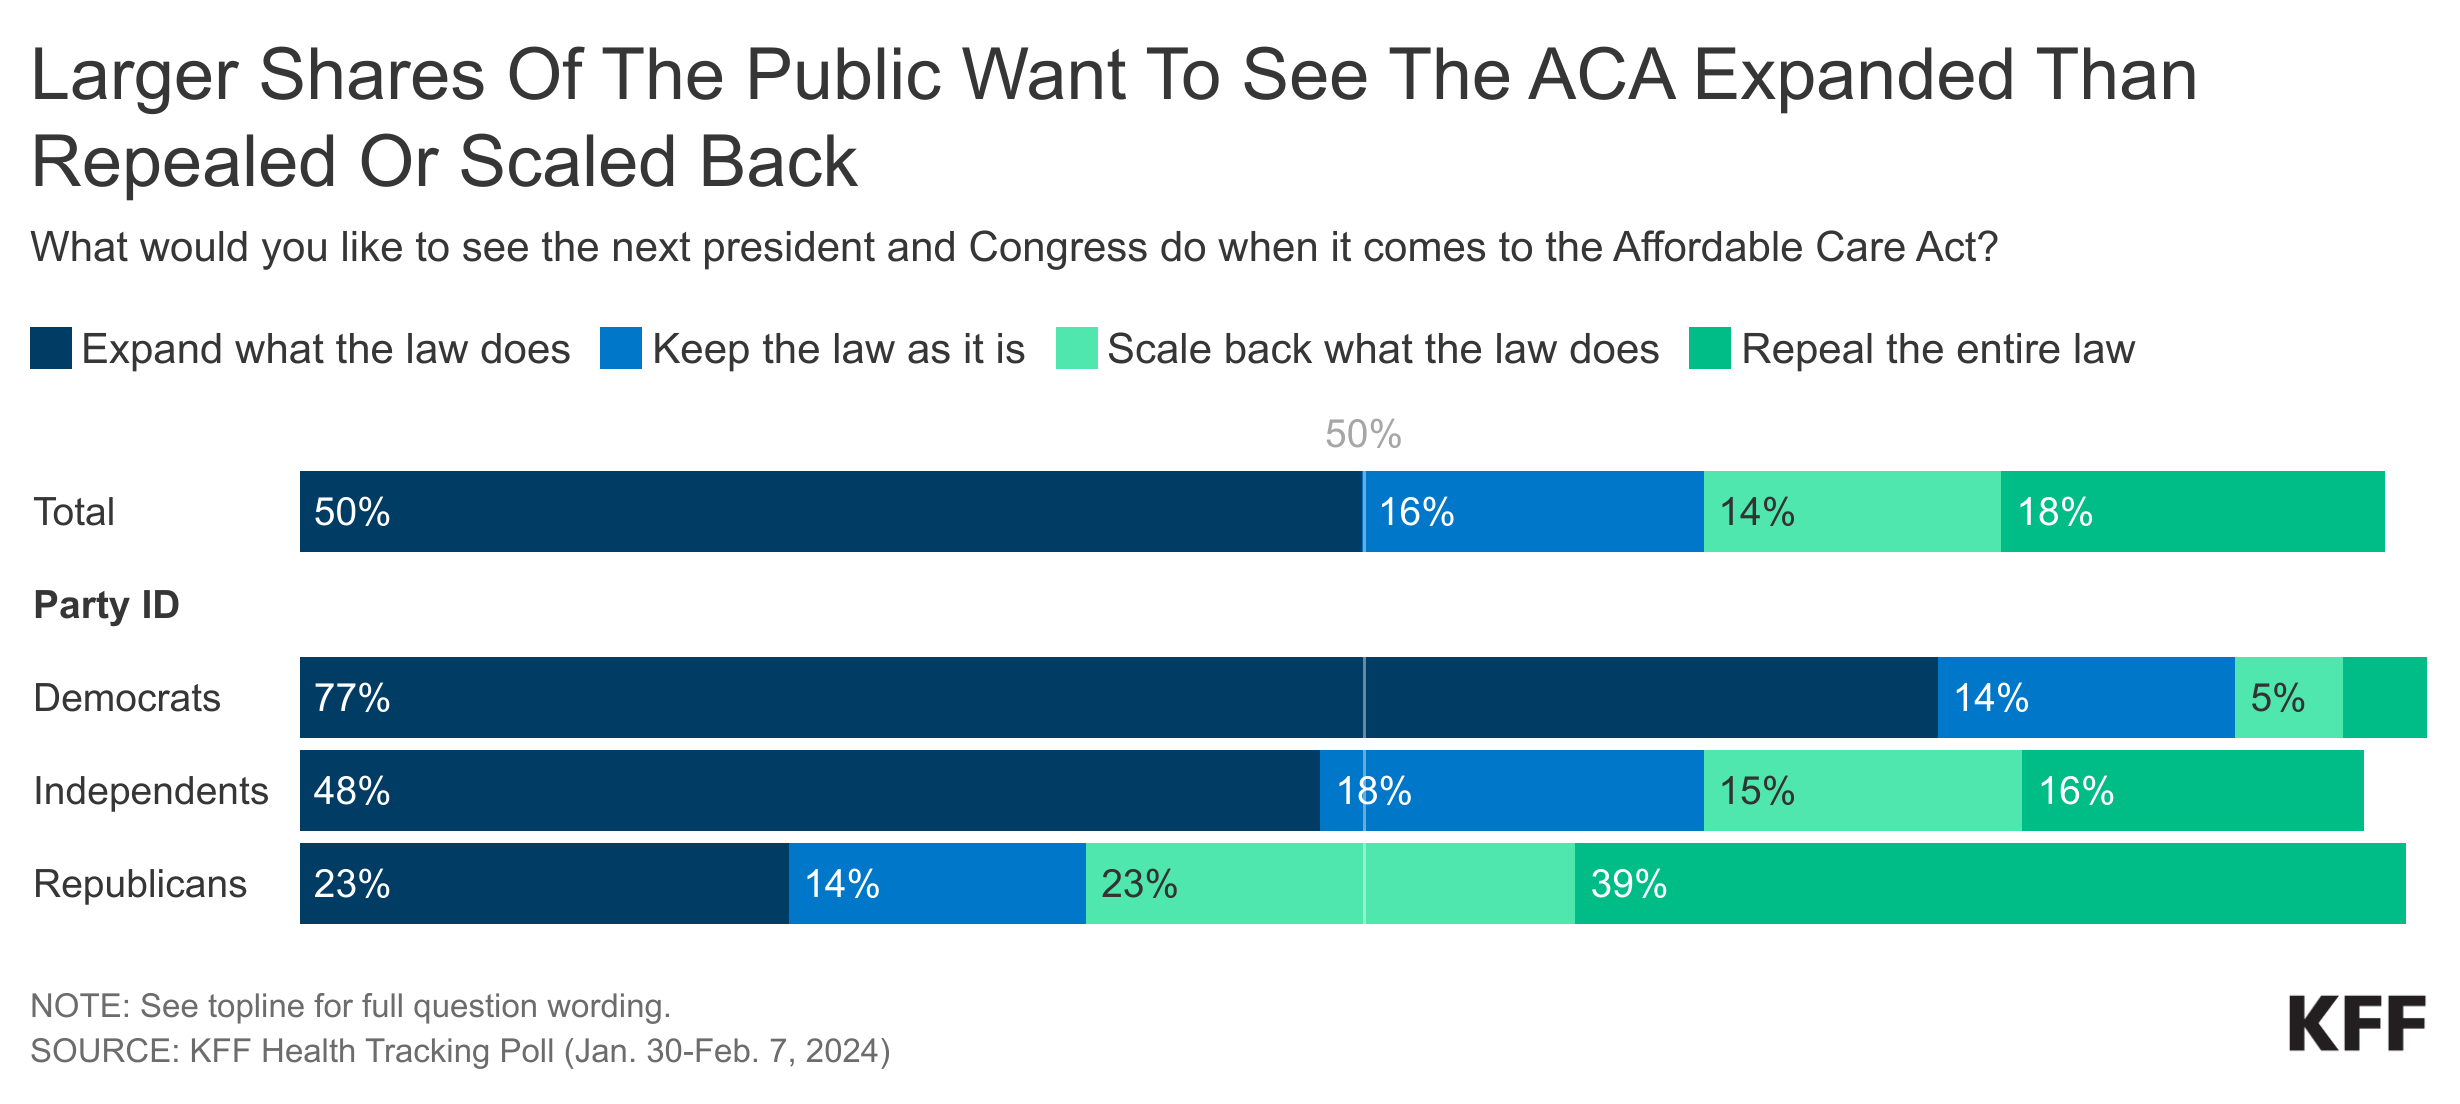
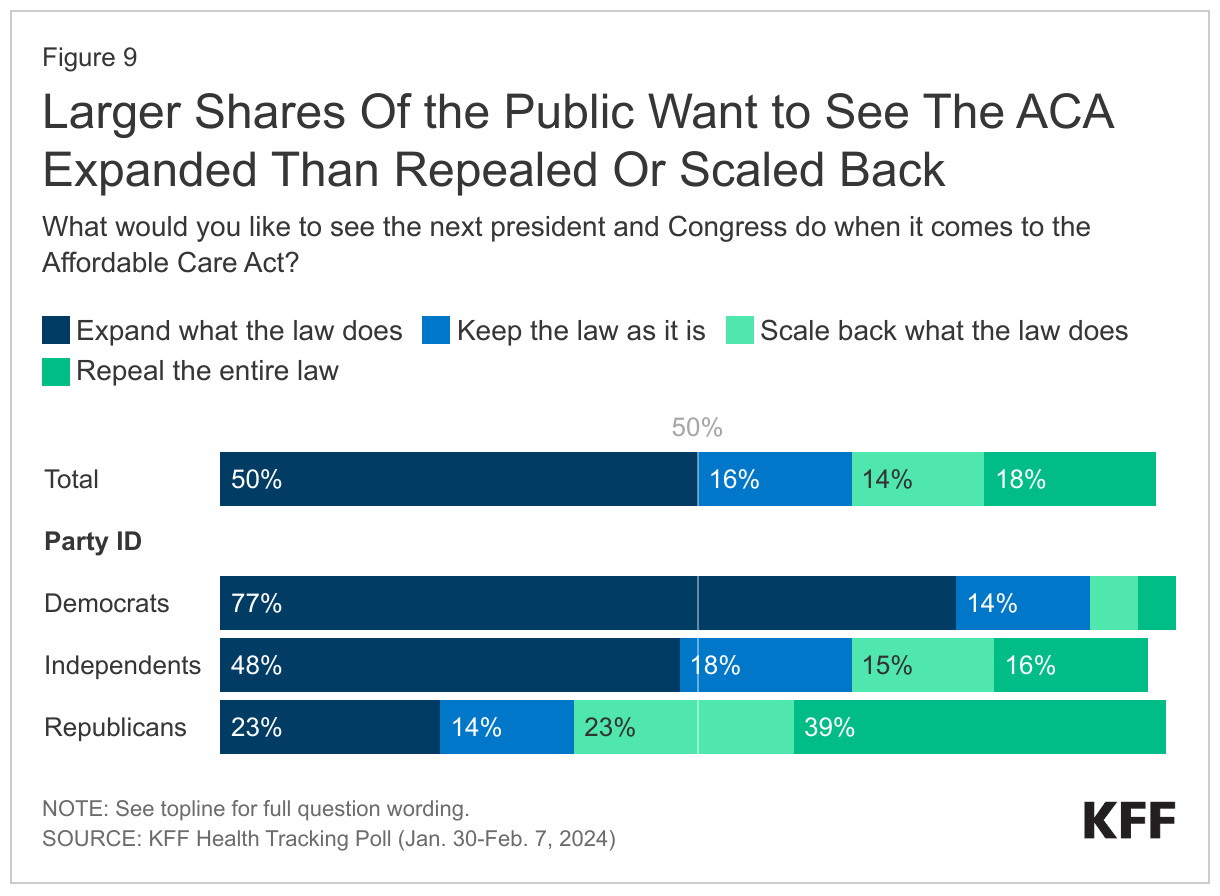
Building on the ACA has been a focal point of President Biden’s health care agenda, while former President Trump has recently discussed his desire to try again to repeal and replace the law. Half of the public say they would like to see the next president and Congress expand what the ACA does. A smaller share wants to keep the law as it is (16%) and about a third want to either scale back what the law does (14%) or repeal it entirely (18%). Partisans differ on these approaches, with about three in four Democrats wanting the 2024 incoming administration and Congress to expand what the law does (77%), while two-thirds of Republicans want the law to be scaled back (23%) or repealed entirely (39%). A majority of independents want the law to be expanded (48%) or kept as it is (18%). Views towards what to do with the health care law have remained largely unchanged since 2020.

Larger Shares Of the Public Want to See The ACA Expanded Than Repealed Or Scaled Back

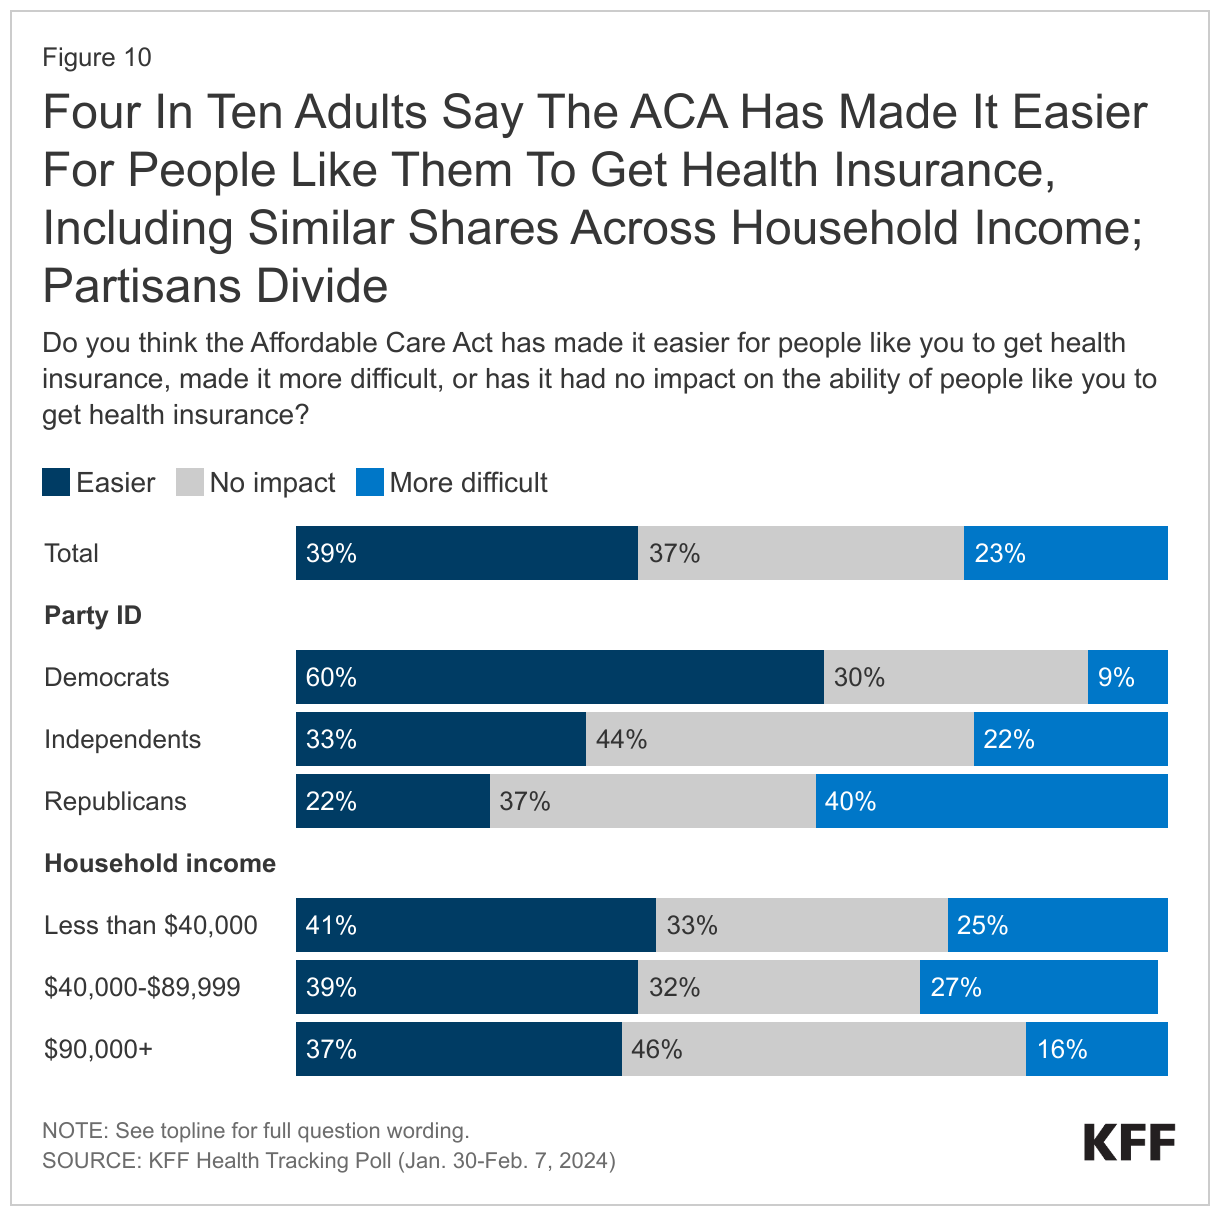
Views of the ACA may be driven by interactions with the law and perceptions about what it has done for access to health insurance. About four in ten (39%), including similar shares across household income, say the Affordable Care Act has made it easier for people like them to get health insurance, while about one quarter (23%) say it has made it more difficult and about one-third (37%) say it has had no impact on people like them to get health insurance. Similar to other assessments of the 2010 health care law, this perception varies by partisanship, as Democrats are about three times as likely as Republicans (60% v. 22%) to say the ACA has helped people like them get insurance. More than four in ten independents (44%) say the ACA has had no impact on the ability of people like them to get health insurance.

Similar shares of adults under and over age 65 – the age of eligibility for Medicare, a government health insurance program – say the ACA has made it easier for people like them to get health insurance (40% among adults ages 18 to 64 vs. 36% among adults ages 65 and older), though younger adults are more likely to say the ACA has made it more difficult for them to access health care (25% v. 17%) and less likely to say it has had “no impact” on people like them (34% v. 45%).

Four In Ten Adults Say The ACA Has Made It Easier For People Like Them To Get Health Insurance, Including Similar Shares Across Household Income; Partisans Divide

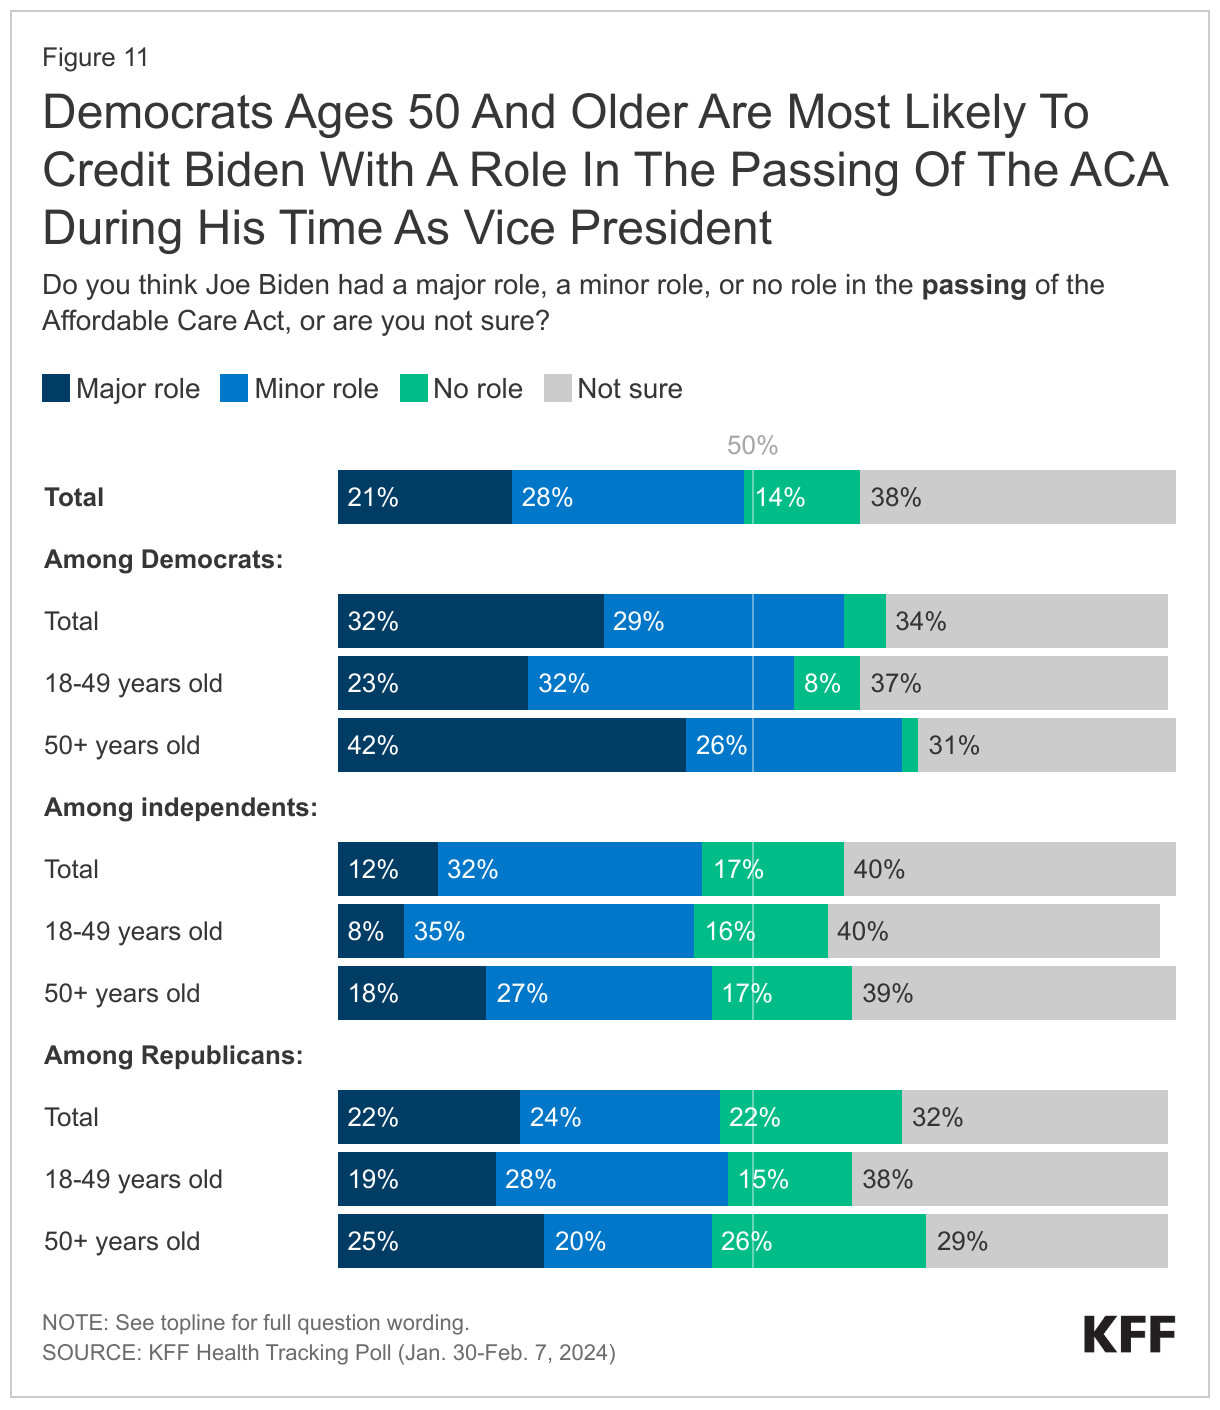
The passing of the Affordable Care Act under the Obama Administration was one of Biden’s achievements as Vice President, and its expansion became a cornerstone for his 2020 presidential campaign and administration, but many voters do not associate Biden with the ACA. About half of adults associate President Biden with the passing of the Affordable Care Act, with one in five saying he had a major role (21%) and about three in ten (28%) saying he had a “minor role” in the passing of the legislation. Few (14%) say he had no role, and about four in ten (38%) are not sure. About one third (32%) of Democrats say that Biden had a “major role” in the passing of the ACA, including larger shares of Democrats ages 50 and older (42%) than younger Democrats (23%). About one in five (22%) Republicans say that Biden had a major role, including similar shares across age groups. About one third of partisans say they are not sure about Biden’s role in the ACA.

Democrats Ages 50 And Older Are Most Likely To Credit Biden With A Role In The Passing Of The ACA During His Time As Vice President

Biden vs. Trump on the Affordable Care Act

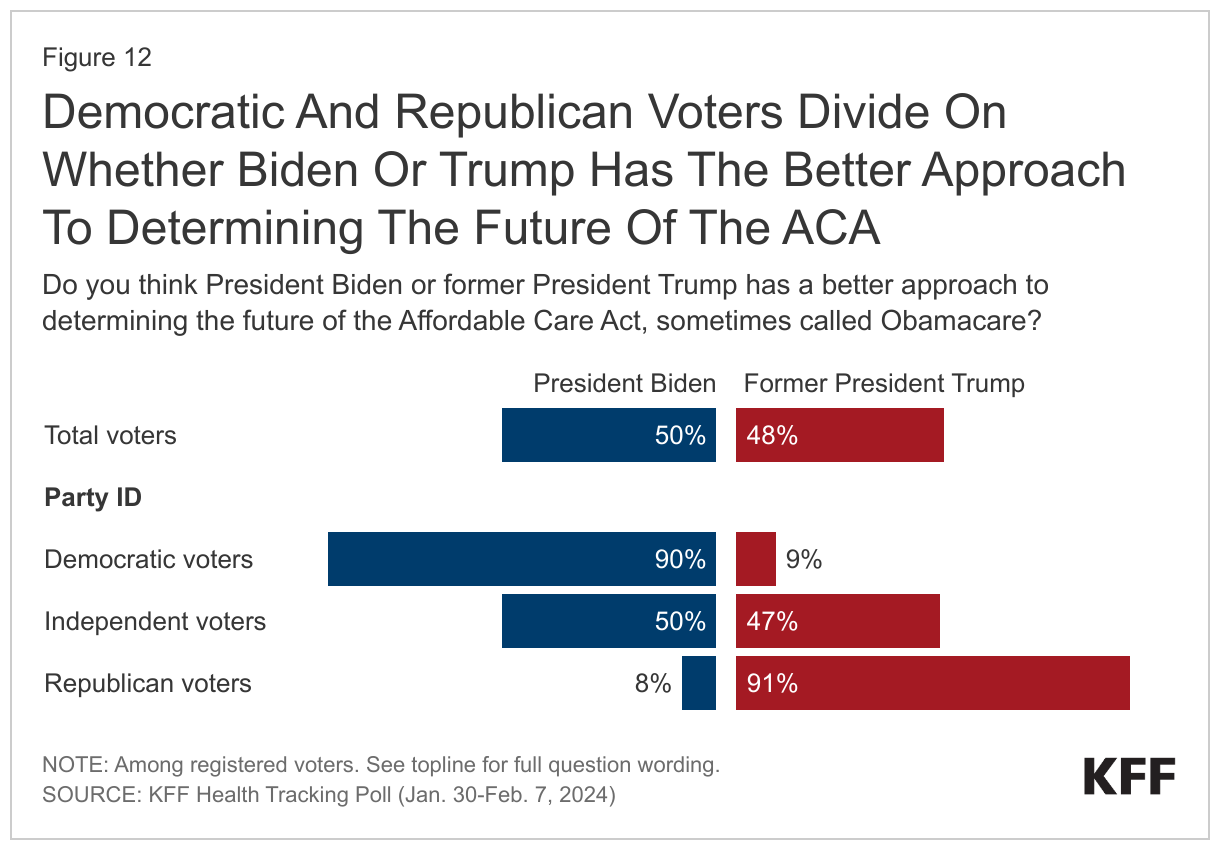
Voters are split along party lines in their assessments of the potential 2024 presidential candidates’ approaches to the ACA, with about nine in ten Democratic voters saying they think President Biden has the better approach to determining the future of the ACA, and similar shares of Republicans saying the same of Trump. Independent voters are split, with half (50%) saying Biden has the better approach and about half (47%) saying Trump has the better approach. Neither President Biden nor former President Trump has the edge among voters overall when it comes to approaches to determining the future of the Affordable Care Act.

Democratic And Republican Voters Divide On Whether Biden Or Trump Has The Better Approach To Determining The Future Of The ACA

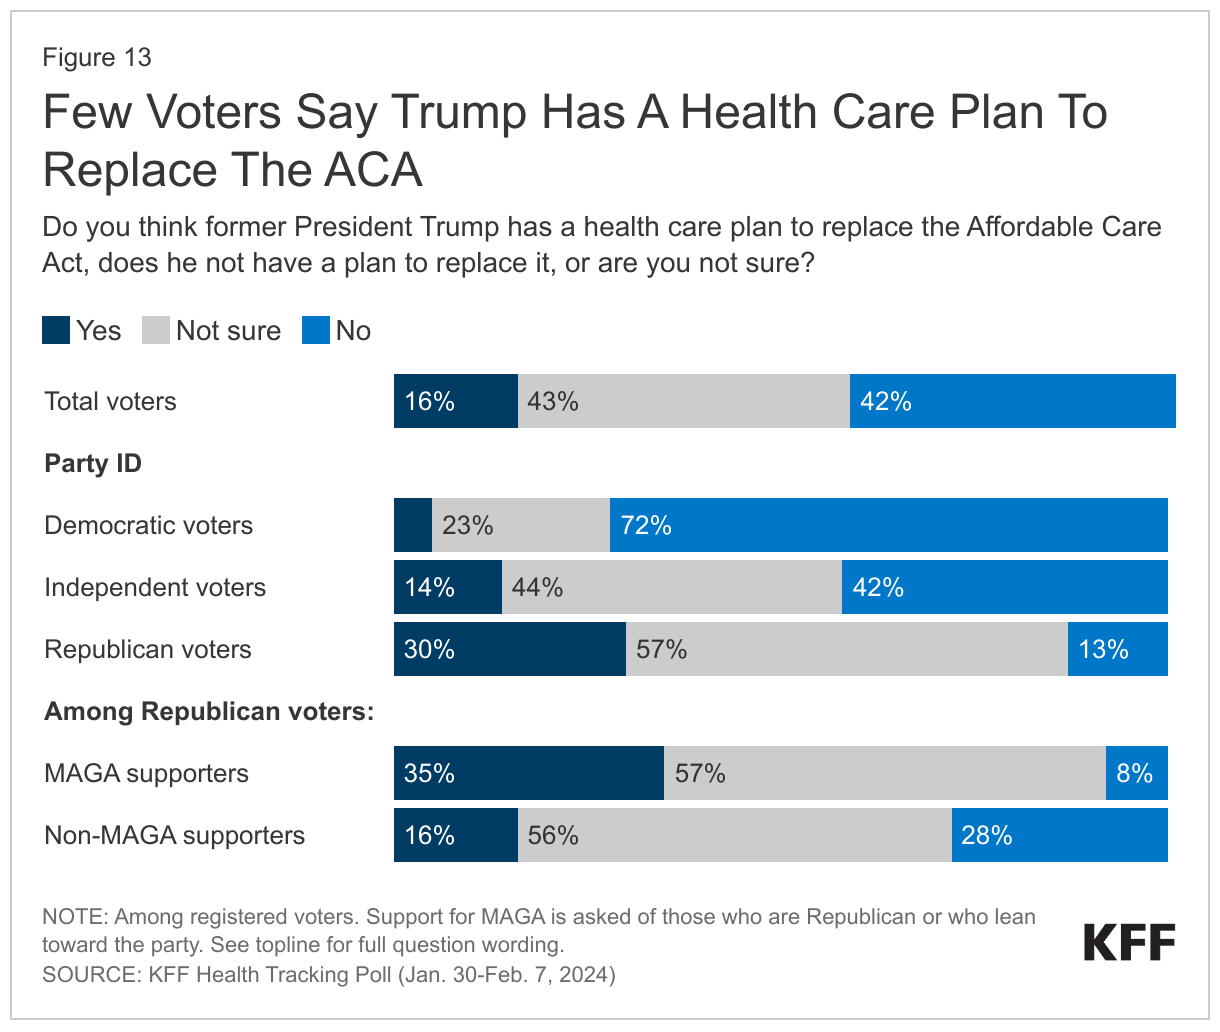
While Republican voters think President Trump has a better approach to determining the future of the ACA, many say they either don’t think he has a health care plan to replace the 2010 law or are unsure. A majority of voters, including seven in ten Republican voters, say they do not think President Trump has a health care plan to replace the ACA (42%) or that they are not sure if he has a plan (43%). Trump’s supporters, or MAGA Republican voters, are most likely to say Mr. Trump does have a plan, with one-third (35%) saying this compared to one in seven (16%) non-MAGA Republicans.

Few Voters Say Trump Has A Health Care Plan To Replace The ACA

Pre-Existing Conditions Protections

As part of the ACA, private health insurance companies are prohibited from denying coverage based on a person’s medical history and are prohibited from charging those with pre-existing conditions more coverage. These protections have been consistently popular among the public, and about two-thirds of adults say it is “very important” that provisions prohibiting insurance companies from denying coverage because of a person’s medical history (67%) and prohibiting insurance companies from charging sick people more (65%) remain law.

Majorities Say It Is Very Important The ACA Provisions Protecting Those With Pre-Existing Conditions Remain Law

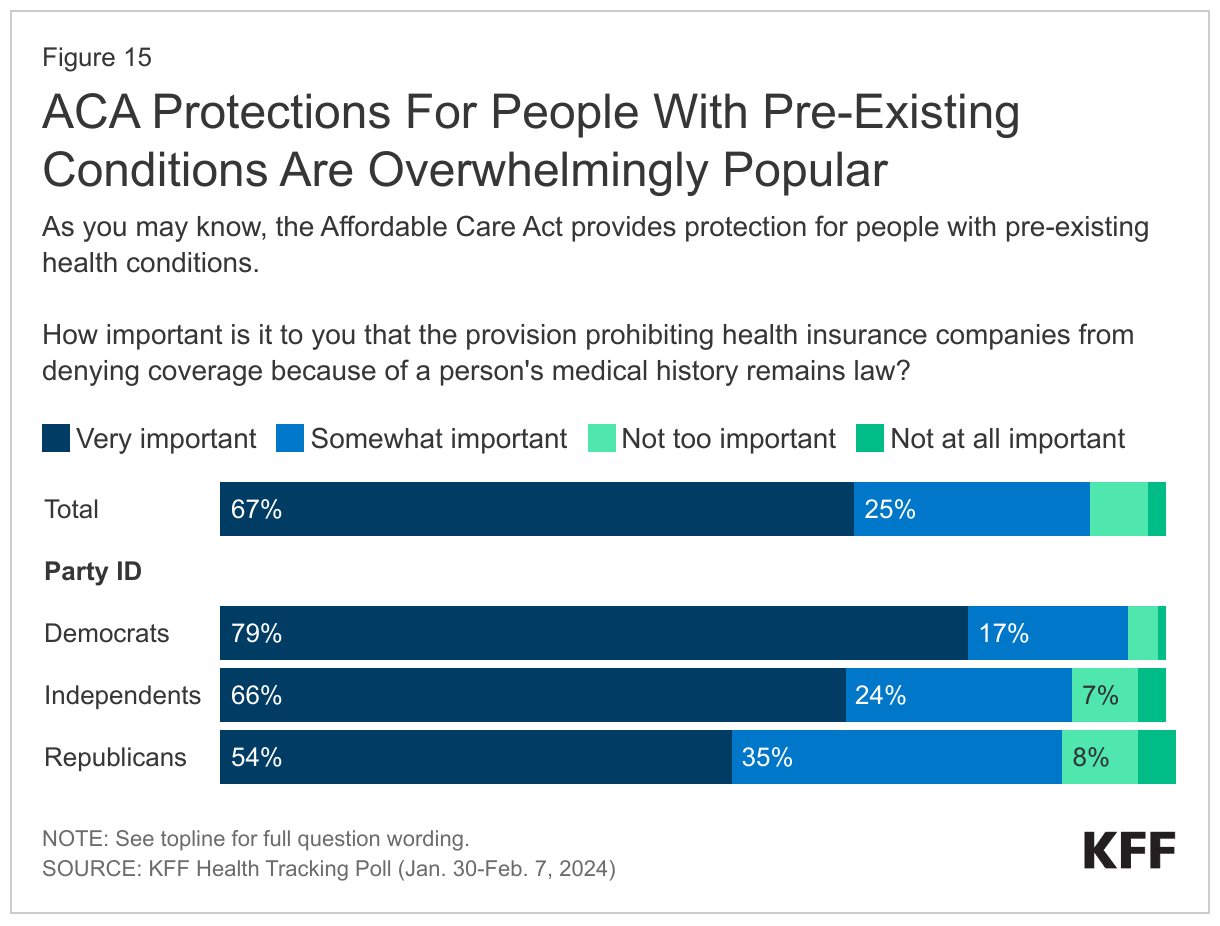
Pre-existing condition provisions are popular across party lines. For example, about eight in ten (79%) Democrats and two-thirds (66%) of independents say it is “very important” to them that the provision prohibiting health insurance companies from denying coverage because of one’s medical history remains intact. A slight majority (54%) of Republicans say this is “very important” to them, and an additional third (35%) say it is “somewhat important.” Similarly, half (51%) of Republicans and majorities of Democrats (79%) and independents (65%) say it is “very important” that insurance companies are prohibited from charging sick people more.

ACA Protections For People With Pre-Existing Conditions Are Overwhelmingly Popular

Although the future of the Affordable Care Act has reentered the news cycle with Trump’s reigniting of repeal efforts, awareness of the law’s provisions is low. About three in ten (31%) adults are aware that the ACA prohibits private health insurance companies from charging sick people higher premiums, while about seven in ten say they are not sure or incorrectly say it does not, though Democrats (37%) are more likely than Republicans (29%) to correctly say it does. Six in ten adults either say they are not sure or do not know if the ACA prohibits private health insurance companies from denying coverage for a pre-existing condition, including similar shares across partisans.

Knowledge of the law’s provisions has dropped over the past 14 years. At its height, seven in ten U.S. adults were aware of the ACA’s protections for people with pre-existing conditions at the law’s inception in 2010. Since 2017, fewer than half of U.S. adults have been aware, while the popularity of these provisions remains high.

Less Than Half Of Adults Across Partisans Are Aware Of The ACA's Protections For People With Pre-Existing Conditions

The ACA Marketplace

Since 2010, with the enactment of the Affordable Care Act Marketplaces and expansion of Medicaid, the share of uninsured non-elderly adults in the U.S. has dropped from 18% to about 10%. About one in three (35%) are aware of this decrease – rising to half (48%) of Democrats – while about three in ten adults say the uninsured rate has increased (32%) or remained the same (31%) since 2010. Republicans (39%) are more likely than Democrats to say the uninsured rate has stayed the same.

About One Third Of U.S. Adults Are Aware That Since The Passing Of The ACA, The Rate Of Uninsured Has Decreased, Rising To About Half Of Democrats

During the open enrollment period at the end of 2023, a record breaking number of individuals selected health insurance plans through the ACA Marketplace, or healthcare.gov, continuing a trend of increases in enrollment since 2020’s open enrollment period. However, this fact is not widely known among the public: one in three (34%) U.S. adults correctly say more people purchased their own health insurance through the Affordable Care Act Marketplace during this enrollment period than in past years, while about one in five (23%) say fewer people signed up, and four in ten (40%) say about the same number of enrollees signed up. There are sharp partisan divides on knowledge of the latest enrollment period, as half of Democrats correctly say more people signed up, compared to one in four Republicans who say the same.

Fewer Than Half Of U.S. Adults Are Aware That More People Enrolled In Health Insurance Through The ACA Marketplace Last Year Than In Years Past

Methods

This KFF Health Tracking Poll was designed and analyzed by public opinion researchers at KFF. The survey was conducted January 30 – February 7, 2024, online and by telephone among a nationally representative sample of 1,309 U.S. adults in English (1,231) and in Spanish (78). The sample includes 1,026 adults (n=58 in Spanish) reached through the SSRS Opinion Panel either online (n=1,002) or over the phone (n=24). The SSRS Opinion Panel is a nationally representative probability-based panel where panel members are recruited randomly in one of two ways: (a) Through invitations mailed to respondents randomly sampled from an Address-Based Sample (ABS) provided by Marketing Systems Groups (MSG) through the U.S. Postal Service’s Computerized Delivery Sequence (CDS); (b) from a dual-frame random digit dial (RDD) sample provided by MSG. For the online panel component, invitations were sent to panel members by email followed by up to three reminder emails.

Another 283 (n=20 in Spanish) interviews were conducted from a random digit dial telephone sample of prepaid cell phone numbers obtained through MSG. Phone numbers used for the prepaid cell phone component were randomly generated from a cell phone sampling frame with disproportionate stratification aimed at reaching Hispanic and non-Hispanic Black respondents. Stratification was based on incidence of the race/ethnicity groups within each frame.

Respondents in the phone samples received a $15 incentive via a check received by mail, and web respondents received a $5 electronic gift card incentive (some harder-to-reach groups received a $10 electronic gift card). In order to ensure data quality, cases were removed if they failed attention check questions in the online version of the questionnaire, or if they had over 30% item non-response, or had a length less than one quarter of the mean length by mode. Based on this criterion, one case was removed.

The combined cell phone and panel samples were weighted to match the sample’s demographics to the national U.S. adult population based on parameters derived from the Census Bureau’s 2022 Current Population Survey (CPS), 2021 Volunteering and Civic Life Supplement data from the CPS, and the 2023 KFF Benchmarking survey with ABS and prepaid cell phone samples. The demographic variables included in weighting for the general population sample are sex, age, education, race/ethnicity, region, education, civic engagement, internet use, and political party identification by race/ethnicity. The sample of registered voters was weighted separately to match the U.S. registered voter population using the parameters above plus recalled vote in the 2020 presidential election by county quintiles grouped by Trump vote share. Both weights account for differences in the probability of selection for each sample type (prepaid cell phone and panel). This includes adjustment for the sample design and geographic stratification of the cell phone sample, within household probability of selection, and the design of the panel-recruitment procedure.

The margin of sampling error including the design effect for the full sample and registered voters is plus or minus 4 percentage points. Numbers of respondents and margins of sampling error for key subgroups are shown in the table below. For results based on other subgroups, the margin of sampling error may be higher. Sample sizes and margins of sampling error for other subgroups are available by request. Sampling error is only one of many potential sources of error and there may be other unmeasured error in this or any other public opinion poll. KFF public opinion and survey research is a charter member of the Transparency Initiative of the American Association for Public Opinion Research.

GroupN (unweighted)M.O.S.E.
Total1,309± 4 percentage points
Total Registered Voters1,055± 4 percentage points
Republican Registered Voters343± 7 percentage points
Democratic Registered Voters368± 7 percentage points
Independent Registered Voters241± 8 percentage points


Poll Finding

KFF Health Tracking Poll: Economic Views and Experiences of Adults Who Struggle Financially

Published: Feb 21, 2024

Findings

About half of adults say they either have difficulty affording monthly bills or are just able to afford their household expenses without having money left over, according to the latest KFF Tracking Poll. These groups are much more likely than those who can afford their monthly costs with money left over to rate the national economy negatively and worry about affording everyday expenses. Worries about health care costs, however, pervade regardless of financial situation, with a majority of adults who can afford their bills with money left over saying they worry about affording unexpected medical bills or the cost of health care services. Thinking ahead to the upcoming 2024 presidential election, voters who have difficulty affording household expenses are more likely than others to say it is “very important” for presidential candidates to discuss inflation and affordability of health care on the campaign trail.

Assessments of the national economy are historically linked to presidential approval, and KFF’s latest tracking poll reflects this, with large shares of Republicans describing the economy negatively compared to fewer than half of Democrats saying the same. Yet at least three quarters of adults who report difficulty affording bills or say they can just afford their bills rate the economy negatively, suggesting that negative perceptions of the economy, at least in part, also reflect adults’ personal financial situations.

Who Struggles Affording Monthly Bills?

About one in five adults (19%) say they have difficulty affording their bills each month and about four in ten (37%) say they are just able to afford their bills each month, while a little over four in ten (44%) say they are both able to pay their bills and have some money left over.

Adults who have difficulty affording their monthly bills as well as those who are just able to pay their bills each month are younger and have lower household incomes compared to adults who say they can afford their bills each month with money left over. These groups are also disproportionately made up of Black adults, Hispanic adults, and women. The groups struggling to afford household expenses are equally made up of Democrats, independents, and Republicans, while adults who say they can afford their monthly bills with money left over are more likely to be Democrats than independents or Republicans.

Demographics Of Adults By Self-Reported Financial Situation

Majorities of adults who report difficulty affording their monthly bills and those who are just able to afford their bills say they are worried about affording expenses for themselves and their family, from health care costs to food and paying down debt. About nine in ten adults who have difficulty affording their monthly bills are “very” or “somewhat worried” about being able to afford their monthly utilities like electricity and heat (95%), food (90%), or their rent or mortgage (88%) for themselves or their family. Similarly large majorities of the group who can just afford their bills also say they are worried about affording monthly utilities (80%), food (77%), or their rent or mortgage (76%).

Health care costs are also a concern for those who struggle with bills, with more than eight in ten saying they are worried about the cost of health care services (86%) or unexpected medical bills (83%). Among those who are just able to afford their bills, about eight in ten are worried about being able to afford unexpected medical bills (84%) or health care services (83%). Fewer, but still majority shares, of both these groups report being worried about affording prescription drug costs (65% for each), and – among those with health insurance – their monthly health insurance premium (60%).

Notably, worry about health care costs pervade among a majority of adults, regardless of their financial situation. Six in ten adults who say they can afford their bills with money left over nonetheless say they are “very” or “somewhat worried” about being able to afford unexpected medical bills (62%) or the cost of health care services (60%) for themselves and their family. For this group, larger shares worry about affording health care services and unexpected medical bills than other expenses like housing, food, and utilities, perhaps reflecting anxieties associated with the uncertainty and potential high costs of a prospective medical episode.

Majorities Of Adults Who Struggle To Afford Monthly Bills And Those Who Can Just Pay Their Bills Report Worrying  About Most Everyday Costs

Beyond affordability worries, large shares of adults overall – including even larger shares of those who have difficulty affording bills or can just afford their bills – express worry about the prospect of medical debt, which prior KFF polling has found is held by about four in ten U.S. adults. Overall, seven in ten (70%) adults say they are “very” or “somewhat worried” a medical or dental bill will put them into debt or add to their current debt. Over eight in ten (85%) adults who struggle to afford their monthly bills say they are worried a medical or dental bill will put them in debt or add to their debt, including two-thirds (66%) of this group who say they are “very worried” about the prospect of taking on medical debt. Similar shares of the group that can just afford their bills also worry about health care debt, with 85% saying they are “very” or “somewhat worried” a medical or dental bill will lead to debt or add to their debt. Half (51%) of adults who can afford their bills with money left over report worrying that a bill will put them into health care debt or add to their debt.

Over Eight In Ten Adults Who Struggle To Pay Bills And Those Who Can Just Pay Their Bills Report Worrying About Going Into Medical Debt

How Personal Finances Impact Views of National Economy and Politics

Adults who struggle with their monthly bills are much more likely than those who are able to afford bills to rate the economy negatively, even as recent news reports have emphasized an improving national economy, although inflation rates have recently remained higher than expected. While there are notable partisan divides on the economy, with Republican voters much more likely than Democratic voters to rate the economy negatively, views on the economy also differ by financial situation. More than eight in ten adults (84%) who report difficulty affording their bills say the national economy is either “not so good” or “poor,” as do three-fourths (77%) of those who are just able to afford their monthly bills. These assessments of the national economy are at least twenty percentage points more negative than the views of adults who can afford their bills with money left over (57%).

Adults Who Report Difficulty Affording Monthly Bills Are More Likely Than Those Who Are Able To Afford Bills To Rate The Economy Negatively

Voters struggling to afford their monthly costs are more likely to say they want to hear the 2024 presidential candidates discuss economic issues and the future of Medicaid, suggesting that these issues may resonate even more with these voters during the presidential campaign. However, a majority of voters, regardless of financial situation, say they want to hear about cost issues. Voters who have trouble affording their monthly bills are more likely than those who can afford their bills with money left over to say it is “very important” for the 2024 presidential candidates to talk about several economic and health care related issues such as inflation (93% v. 77%), affordability of health care (89% v. 79%), prescription drug costs (76% v. 64%), the future of Medicaid (75% v. 49%) and student loan debt (44% v. 27%).

Voters Who Have Difficulty Affording Monthly Bills Are More Likely To Say It Is Important For 2024 Candidates To Talk About Economic, Health Care Issues

Large Shares of Voters Who Are Struggling to Afford Monthly Bills Say Trump Has Done More to Address Health Care Costs

Former President Trump may be reaping the benefits of retrospective views when voters are asked which president did more in office to address health care costs, while criticism of President Biden may be largely a result of general dissatisfaction with the current state of the economy. The groups of voters who struggle to afford their bills or can just afford their bills are more likely to say former President Trump did more than President Biden to address health care costs.

Six in ten (59%) voters who report difficulty affording their bills and about half (52%) of those who can just afford their bills say former President Trump did more as president to address health care costs than President Biden, while more than half of voters (56%) who can afford their bills with money left over side with Biden.

On the question of whether each president did enough to address health care costs, one-third (34%) of voters who have difficulty affording their monthly bills say former President Trump did enough to address health care costs, compared to one in ten (11%) who say President Biden has done enough to address the cost of health care. The group of voters who have difficulty affording bills are also more likely than those who can afford their bills with money left over to say former President Trump did enough to address health care costs (34% v. 22%).

Voters Who Struggle Financially Are More Likely Than Others To Say Former President Trump Did More To Address Health Care Costs Than President Biden

Methods

This KFF Health Tracking Poll was designed and analyzed by public opinion researchers at KFF. The survey was conducted January 30 – February 7, 2024, online and by telephone among a nationally representative sample of 1,309 U.S. adults in English (1,231) and in Spanish (78). The sample includes 1,026 adults (n=58 in Spanish) reached through the SSRS Opinion Panel either online (n=1,002) or over the phone (n=24). The SSRS Opinion Panel is a nationally representative probability-based panel where panel members are recruited randomly in one of two ways: (a) Through invitations mailed to respondents randomly sampled from an Address-Based Sample (ABS) provided by Marketing Systems Groups (MSG) through the U.S. Postal Service’s Computerized Delivery Sequence (CDS); (b) from a dual-frame random digit dial (RDD) sample provided by MSG. For the online panel component, invitations were sent to panel members by email followed by up to three reminder emails.

Another 283 (n=20 in Spanish) interviews were conducted from a random digit dial telephone sample of prepaid cell phone numbers obtained through MSG. Phone numbers used for the prepaid cell phone component were randomly generated from a cell phone sampling frame with disproportionate stratification aimed at reaching Hispanic and non-Hispanic Black respondents. Stratification was based on incidence of the race/ethnicity groups within each frame.

Respondents in the phone samples received a $15 incentive via a check received by mail, and web respondents received a $5 electronic gift card incentive (some harder-to-reach groups received a $10 electronic gift card). In order to ensure data quality, cases were removed if they failed attention check questions in the online version of the questionnaire, or if they had over 30% item non-response, or had a length less than one quarter of the mean length by mode. Based on this criterion, one case was removed.

The combined cell phone and panel samples were weighted to match the sample’s demographics to the national U.S. adult population based on parameters derived from the Census Bureau’s 2022 Current Population Survey (CPS), 2021 Volunteering and Civic Life Supplement data from the CPS, and the 2023 KFF Benchmarking survey with ABS and prepaid cell phone samples. The demographic variables included in weighting for the general population sample are sex, age, education, race/ethnicity, region, education, civic engagement, internet use, and political party identification by race/ethnicity. The sample of registered voters was weighted separately to match the U.S. registered voter population using the parameters above plus recalled vote in the 2020 presidential election by county quintiles grouped by Trump vote share. Both weights account for differences in the probability of selection for each sample type (prepaid cell phone and panel). This includes adjustment for the sample design and geographic stratification of the cell phone sample, within household probability of selection, and the design of the panel-recruitment procedure.

The margin of sampling error including the design effect for the full sample and registered voters is plus or minus 4 percentage points. Numbers of respondents and margins of sampling error for key subgroups are shown in the table below. For results based on other subgroups, the margin of sampling error may be higher. Sample sizes and margins of sampling error for other subgroups are available by request. Sampling error is only one of many potential sources of error and there may be other unmeasured error in this or any other public opinion poll. KFF public opinion and survey research is a charter member of the Transparency Initiative of the American Association for Public Opinion Research.

GroupN (unweighted)M.O.S.E.
Total1,309± 4 percentage points
Financial situation
Have difficulty affording their bills each month279± 8 percentage points
Are just able to afford their bills each month482± 6 percentage points
Are able to pay all of their bills and have some money left over544± 5 percentage points
News Release

Health Care Costs Top the Public’s List of Financial Worries, and Those Who Are Struggling the Most Want to Hear Presidential Candidates Discuss Economic and Health Care Issues

Far More People Want to Expand What the Affordable Care Act Does Than Want to Repeal It; Most Don’t Know Popular Pre-Existing Condition Protections Are Part of the ACA

Published: Feb 21, 2024

At a time when kitchen table economic problems are on voters’ minds, unexpected medical bills and health care costs top the public’s list of financial concerns, and voters who are struggling to pay their monthly bills are the most eager to hear the presidential candidates talk about economic and health care issues, the latest KFF Health Tracking Poll finds.

Nearly 3 in 4 adults say they are worried about being able to afford unexpected medical bills (74%) and the cost of health care services (73%), more than say the same about other everyday expenses, such as gas, utilities, food, and housing costs, and about paying for prescription drugs (55%). Health care worries top the list regardless of partisanship.

About half of all voters (48%) say health care costs are a major reason for their negative views of the economy, though larger shares cite everyday expenses, inflation, and housing costs. Overall, two thirds (67%) of voters view the economy negatively. Republican voters are more than twice as likely as Democratic voters to hold such negative views. 

The poll probes how people’s economic struggles color their views of the economy and their priorities for candidates. Overall, 1 in 5 adults (19%) say they have trouble affording their monthly bills, and nearly 4 in 10 (37%) say they say they can just afford their monthly bills. These groups hold very different views than those who say that they afford their bills with money left over (44% of all adults).

Those who report difficulty affording monthly bills are more likely to view the national economy negatively and are more likely to worry about affording health care and other routine expenses. They are also more likely to want the presidential candidates to talk about economic issues, including health care costs and the future of Medicaid, compared to voters who can easily afford their bills. 

The ACA Remains Popular, and More Want to Expand It Than Scale It Back or Repeal It

The poll also explores views of the Affordable Care Act (ACA), which remains popular generally, though voters again split sharply along partisan lines over what should happen to the law next. 

Most of the public (59%) views the law favorably, as has been true since Republicans’ failed attempt to repeal and replace it during President Trump’s presidency. Fewer hold unfavorable views (39%), though most Republicans do (67%).  

In addition, half (50%) of the public, including nearly a quarter of Republicans (23%), want the next president and Congress to expand what the ACA does, as President Biden has advocated. Another 16% want to keep it as is. In contrast, only about a third of the public favor either scaling back the law (14%) or repealing it entirely (18%), the options preferred by most Republicans.

While President Trump has talked about wanting to replace the ACA during his campaign, just 1 in 6 voters (16%) say that he has a plan to do so. Even among Republican voters, just 3 in 10 say that President Trump has a plan to replace the ACA.On the flip side, while the ACA was originally enacted during Biden’s tenure as vice president, just half of the public says he had either a major (21%) or minor (28%) role in its passage. Democrats ages 50 and older are most likely to say President Biden played a role in the ACA becoming law. Most adults want the law’s prohibition on insurers from denying coverage based on pre-existing medical conditions to stay. Two thirds (67%) of the public say that it is “very important” that this provision remain in place, including most Republicans (54%) However, only about 4 in 10 people (39%) are aware that that provision is part of the ACA.The poll also finds gaps in the public’s knowledge about the ACA’s impact on health coverage. While the share of adults under age 65 who are uninsured has fallen sharply since the ACA’s enactment, just over a third (35%) of the public correctly says the uninsured rate has gone down since the law’s enactment, while similar shares incorrectly say it has gone up (32%) or stayed the same (31%).

The poll findings are featured in two reports: a main report that captures the main findings on health costs, the Affordable Care Act, and the election, and a companion report that looks at differences in the economic views and priorities for adults based on their economic circumstances.

Designed and analyzed by public opinion researchers at KFF, the survey was conducted from January 30-February 7, 2024, online and by telephone among a nationally representative sample of 1,309 U.S. adults, including 1,055 registered voters. Interviews were conducted in English and in Spanish. The margin of sampling error is plus or minus 4 percentage points for the full sample and the registered voter sample. For results based on other subgroups, the margin of sampling error may be higher.

News Release

KFF Health News and CBS News Win 2023 George Polk Award for Medical Reporting

Published: Feb 19, 2024

KFF Health News won the 2023 George Polk Award for Medical Journalism for its year-long investigation with CBS News into the failure of FDA-approved medical devices that were suspected of contributing to thousands of injuries and patient deaths.

The George Polk Awards were established in 1949 by Long Island University to commemorate George Polk, a CBS correspondent murdered in 1948 while covering the Greek Civil War. The awards place a premium on investigative and enterprising reporting that gains attention and achieves results.

The investigation, “When Medical Devices Malfunction,“ brought to light deep flaws in FDA oversight of a series of devices, including:

  • Artificial knee implants that wore out prematurely;
  • Metal hip implants that snapped in two and led to urgent surgeries;
  • Last-resort heart pumps that may have caused or contributed to thousands of patient deaths;
  • Insulin pumps that are blamed for contributing to at least a dozen patient deaths; and,
  • A dental device that lawsuits alleged caused catastrophic harm to teeth and jawbones.

“This investigation revealed the deeply significant, and sometimes deadly, impact of flawed devices and oversight, and is part of our continuing work across KFF to show how people are affected by health policy,” said Dr. Drew Altman, president and chief executive officer, KFF.

“When Medical Devices Malfunction“ was reported by Fred Schulte, an investigative reporter at KFF Health News, Holly K. Hacker, the data editor at KFF Health News, Daniel Chang, the Florida correspondent at KFF Health News, Brett Kelman, a correspondent at KFF Health News, Anna Werner, the national consumer investigative correspondent at CBS News, and Nicole Keller, consumer investigative producer at CBS. It is Schulte’s and Werner’s second Polk award.

About KFF Health News’ Partnership with CBS News

The reporting in “When Medical Devices Malfunction“ was done in partnership with CBS News to investigate the safety of devices suspected of causing patient harm and explore the FDA’s process for assuring patient safety. Reporters from KFF Health News and CBS reviewed FDA data and court records and conducted many interviews with patients, device manufactures, FDA officials, consumer advocates, and others.

The investigation stems from a broader editorial partnership between CBS News and KFF Health News. The editorial partnership also features regular appearances by Dr. Céline Gounder, KFF Health News’ senior fellow and editor-at-large for public health, on CBS News, the popular “Bill of the Month” series, in which KFF Health News editor-in-chief Elisabeth Rosenthal appears regularly on “CBS Mornings” to discuss surprising medical bills, and the KFF Health News “Health Minute,” a weekly feature for CBS News Radio stations that helps millions of listeners understand how developments in health care delivery and policy affect them.

About KFF and KFF Health News

KFF is the independent source for health policy research, polling, and journalism. Our mission is to serve as a nonpartisan source of information for policymakers, the media, the health policy community, and the public. KFF Health News is a national newsroom that produces in-depth and award-winning journalism about health issues and is one of the core operating programs at KFF. Other major KFF programs include Policy Analysis; KFF Polling and Survey Research; and KFF Social Impact Media, which conducts specialized public health information campaigns. A new program on Health Misinformation and Trust is under development.

Section 1115 Waiver Watch: Continuous Eligibility Waivers

Published: Feb 15, 2024

Note: For the latest information on states with approved and pending waivers to extend multi-year continuous eligibility for children, view our Section 1115 tracker “Key Themes Maps.

The pandemic continuous enrollment provision and other research show that continuous eligibility reduces Medicaid disenrollment and “churn” rates and helps to ensure stable coverage. Guaranteeing 12-month continuous coverage for children has long been an option in Medicaid and CHIP without a waiver, but not for adults. The Consolidated Appropriations Act required all states to implement 12-month continuous eligibility for children beginning on January 1, 2024. As many Medicaid enrollees are currently experiencing disruptions in coverage as a result of the Medicaid unwinding, a number of states are pursuing strategies to help promote continuity of coverage, including through unwinding waivers and Section 1115 demonstration waivers. This Waiver Watch summarizes approved and pending Section 1115 waivers with continuous eligibility provisions for children and adults in Medicaid.

What is continuous eligibility?

States are required to provide 12-month continuous eligibility for children in Medicaid and CHIP. Continuous eligibility generally allows individuals to remain enrolled for a specific period even if there are fluctuations in income. States have long had the option to provide 12 months of continuous eligibility to children (under age 19) without a waiver, and many states (23 as of January 2023) had taken up that option for all children in Medicaid and CHIP (additional states had adopted 12-month continuous eligibility for only some children or only children in CHIP). However, the Consolidated Appropriations Act required all states to implement 12-month continuous eligibility for all children in Medicaid and CHIP beginning on January 1, 2024. Additional guidance issued on October 27, 2023 prohibits states from terminating coverage of children enrolled in CHIP for failure to pay premiums. Under the previous 12-month continuous eligibility option, states were permitted to disenroll children in CHIP during the continuous eligibility period if a family did not pay their premiums; this exception to continuous eligibility was not available in Medicaid. On February 1, 2024, the state of Florida filed a lawsuit against HHS challenging the implementation of the law, asserting states should be allowed to terminate CHIP coverage (during the 12-month period) when premium payments are not made.

Under current law, states cannot provide continuous eligibility for adults without a Section 1115 waiver submitted to the federal government. States cannot require a renewal process for Medicaid coverage for adults who are eligible based on income more than once every 12 months. While states may conduct renewals for individuals who qualify for Medicaid based on age or disability more than once every 12 months, most states conduct annual renewals for these groups. However, because states cannot guarantee continuous eligibility for adults absent a waiver, adults may lose coverage if there are “changes in circumstance,” including changes in family income, during the year. Enrollees are required to report changes in circumstances, and some states conduct periodic electronic data matches between renewal periods to identify changes in circumstance.

Continuous eligibility has been shown to reduce Medicaid disenrollment and “churn” rates. Churn occurs when individuals temporarily lose Medicaid coverage and then re-enroll within a short period of time suggesting they are experiencing short-term changes in income or difficulty completing the renewal process. When individuals churn on and off coverage, the gaps in coverage may limit access to care or lead to delays in getting needed care, which can be especially problematic for young children who receive frequent screenings and check-ups. Research has found continuous eligibility for Medicaid is associated with improved child health. While continuous eligibility increases coverage costs due to longer average eligibility periods, there are also administrative costs associated with disenrolling individuals and then subsequently processing new applications.

How are states using 1115 waivers to provide extended continuous eligibility for children?

As of February 15, 2024, three states have approved Section 1115 demonstration waivers to provide multi-year continuous eligibility to children (Table 1). Section 1115 waivers allow states to obtain federal approval to operate Medicaid programs in ways that differ from federal standards and requirements. In September 2022, CMS approved Oregon’s waiver to implement continuous eligibility for children from birth to age six as well as 24 months of continuous eligibility for nearly all enrollees ages six and older. Since then, CMS has approved multi-year continuous eligibility requests for children in Washington and New Mexico. Hawaii, Minnesota, North Carolina, and Pennsylvania have requests pending with CMS.

A number of states are developing waivers to provide multi-year continuous eligibility to children. Several states have waiver proposals under development that have recently been released for state-level public comment (California, Colorado, and New York) that include multi-year continuous eligibility for children (Table 1). Other tracking shows state activity, including legislation directing the state Medicaid agency to seek approval for multi-year continuous eligibility for children, in Illinois, Ohio and the District of Columbia. In December 2023, growing concern over loss of Medicaid coverage for children prompted federal officials to issue additional guidance with strategies to protect coverage; one strategy CMS highlighted in its guidance is providing multi-year continuous eligibility for children through Section 1115 demonstration authority.

States can use Section 1115 waivers to extend multi-year continuous eligibility to children.

What options do states have to provide continuous eligibility for adults?

As of February 15, 2024, five states have approved Section 1115 waivers to provide varying lengths of continuous eligibility to certain adults (Table 2). Oregon provides 24 months of continuous eligibility to nearly all enrollees over age six. New York and New Jersey provide 12-month continuous eligibility to all income-eligible Medicaid adults. Kansas provides 12-month continuous eligibility to parents and caretaker relatives. Massachusetts provides 12-month continuous eligibility for individuals following release from a correctional institution and 24-month continuous eligibility for individuals under age 65 experiencing homelessness for at least 6 months; however, the state is seeking CMS approval to expand 12-month continuous eligibility to all adults (including those eligible based on income, age, or disability status) and 24 months of continuous eligibility to all adults experiencing homelessness. Minnesota is seeking to provide 12-month continuous eligibility to young adults ages 19 and 20, and Pennsylvania is seeking to provide 12-month continuous eligibility to individuals that qualify for proposed reentry services following release from a correctional facility.

As of February 2024, five states have implemented 12-month continuous eligibility for certain adults.

Looking Ahead

Experience during the pandemic demonstrated that continuous enrollment can ensure stable coverage and reduce churn. While increased enrollment may result in increased overall costs, the policy can also improve health outcomes and potentially lead to some longer-term savings due to less fragmented care. While the unwinding of the pandemic-era continuous enrollment provision is leading to high rates of procedural disenrollments and is expected to increase the number of people who are uninsured longer term, mandatory 12-month continuous eligibility for children as well as new continuous eligibility policies that some states are pursuing through 1115 waivers can help to provide more stable coverage once the unwinding period ends.

What Would Another Trump Presidency Mean for Health Care?

Published: Feb 15, 2024

In this JAMA Health Forum column,  Larry Levitt, KFF’s Executive Vice President for Health Policy, explores what a second Trump presidency would mean for health care based on President Trump’s record and remarks, and concludes that a new term likely would result in efforts to weaken the Affordable Care Act, reduce federal Medicaid costs, restrict abortion access to abortion, and scale back benefits for immigrants.

News Release

Few Nursing Facility Residents and Staff Have Gotten the Latest COVID-19 Vaccines

Published: Feb 13, 2024

Fewer nursing facility residents and staff are getting COVID-19 vaccines, according to a new KFF analysis of federal data. Only 38% of residents and 15% of staff have received the latest vaccine. In comparison, 50% of residents and 22% of staff received updated vaccines in 2022 and 87% of residents and 88% of staff completed the initial vaccination series.

The percentage of residents who received the latest COVID-19 vaccine varies by state and type of facility. Vaccination rates range from 20% in Arizona to 63% in Vermont and North Dakota and were higher in nonprofit facilities (46%) than in for-profit (35%) or government (43%) facilities. Nursing staff had less variation and lower vaccination rates across states and in all facilities.

Residents’ and staff vaccination rates have declined with the release of each new COVID-19 shot for a variety of reasons, including fewer federal initiatives aimed at increasing vaccinations, the end of vaccine mandates for health care workers, and declining concerns about COVID-19 risks. Recent KFF polling shows that more than half of previously vaccinated adults are not worried about getting COVID-19.

Variation in nursing facility vaccine rates across states may be affected by several factors, including ownership patterns and partisanship, with higher rates in states that have more non-profit facilities and states that voted for President Biden in 2020, as well as whether facilities have established successful vaccination programs.

Few Nursing Facility Residents and Staff Have Received the Latest COVID-19 Vaccine

Published: Feb 13, 2024

Keeping 2 million nursing facility staff and 1.2 million residents current on their COVID-19 vaccines is one tool for reducing deaths from COVID-19 as the virus continues to evolve. KFF analysis found that despite over one-fifth of all U.S. COVID-19 deaths occurring in long-term care facilities, as of January 14, 2024, only 38% of residents and 15% of staff were “up-to-date” with their COVID-19 vaccines, which the CDC defines as having received the updated Fall 2023 vaccine. Those rates are lower than uptake was for the 2022 vaccine. This data note also finds lower uptake rates for for-profit facilities and state uptake rates that vary from 20% to 63%. Data for this analysis include 14,318 nursing facilities (96% of all nursing facilities, home to 1.2 million residents) that had reported COVID-19 vaccination data as of January 21, 2024.

Uptake of the most recent COVID-19 vaccine is lower among nursing facility residents and staff than uptake was for the fall 2022 vaccine: Only 38% of residents and 15% of staff have received the new vaccine (Figure 1). In comparison, at the same point in time last year, 50% of residents and 22% of staff had received the updated vaccine. Those rates represent the share that received the newly available COVID-19 vaccines, 18 weeks after each shot was made available to the public. These rates are much lower than the 87% of residents and 88% of staff who received their primary vaccination series when measured in September 2022. On January 1, 2024, the CDC changed the way it collects data to calculate the percent of staff who are up to date with their COVID-19 vaccination. CMS reports that it may take facilities some time to adapt to the new methodology.

A Lower Share of Residents & Staff Received the Current Vaccine When Compared to the Previous Vaccine

Uptake of the current COVID-19 vaccine is higher in non-profit facilities than in for-profit or government facilities (Figure 2). The percentage of nursing facility residents who received the updated vaccine is 46% in non-profit facilities compared with 35% in for-profit facilities and 43% in government facilities. Uptake of the fall 2022 vaccine was also highest in non-profit facilities and lowest in for-profit facilities. Rates of vaccine uptake for nursing facility staff were low in all types of facilities with minimal variation across facility types (data not shown).

A Higher Share of Residents in Non-Profit Facilities Received Vaccines When Compared to Other Facility Types

The percentage of nursing facility residents who received the latest COVID-19 vaccine ranges from 20% in Arizona to 63% in Vermont and North Dakota (Figure 3). In eleven states, half or more of nursing facility residents received the newest vaccine while in two states, 25% or fewer have received the most recent vaccine. Uptake among staff of the most recent vaccine ranges from 5% in Arkansas to 51% in Washington D.C. In 42 states, fewer than 20% of staff have received the most recent vaccine. There are a number of factors that may contribute to the variation in nursing facility vaccine uptake across states including ownership patterns and partisanship, with higher rates in states that have more non-profit facilities and states that voted for President Biden in 2020. Other factors include whether facilities have established programs to keep residents current on their vaccines and the success of those various programs. Additionally, some state variation in staff rates may be attributed to variation in how facilities are adapting to new CMS reporting methodology for staff vaccinations.

The Share of Residents Who Received an Updated Vaccine Ranges From 20% in Arizona to 63% in Vermont and North Dakota

Federal vaccine clinics contributed to high initial vaccination rates among nursing facility residents, but without ongoing federal initiatives, uptake of vaccines among nursing facility residents may remain low and vary across facilities. Earlier KFF analysis found that nearly 90% of residents completed the initial COVID-19 vaccination series. High take-up of the primary vaccine series stems from high death rates among nursing facility residents, which contributed to a fear of contracting COVID-19, and a concerted policy effort to vaccinate nursing facility residents, including through federally supported on-site vaccination clinics. According to AARP, federal supports have ended and long-term care facilities now coordinate their own COVID-19 vaccination programs, contributing to greater variation across facilities and lower overall rates.

Recent KFF polling shows that over half of previously vaccinated adults are not worried about getting COVID-19, suggesting that uptake of vaccines among nursing facility staff may remain low in the absence of federal mandates. Among nursing facility staff, initial take-up of COVID-19 vaccines was low until a health care worker vaccination mandate required providers that participate in Medicare and/or Medicaid to be vaccinated. This mandate was not updated to include follow-up vaccines, which may contribute to lower uptake of new vaccines among staff, particularly as concern about contracting COVID-19 drops among the U.S, population more broadly.

As winter viruses circulate, COVID-19 vaccines may help decrease sickness and preventable deaths among nursing facility residents and staff. Though people living and working in nursing facilities have likely built some immunity against COVID-19 through prior vaccinations and natural immunity, periodic vaccines have been shown to decrease mortality and increase antibody concentrations among nursing facility residents. For older adults—who constitute most people who use nursing facilities—the risks of COVID-19 may be seven times higher than that of the flu. The CDC finds that 72% of residents had received the flu vaccine as of December 10, 2023, among the small number of nursing facilities that had reported such data, a rate that is nearly twice that of the most recent COVID-19 vaccine. Beyond the flu and COVID-19, RSV is another high-risk respiratory virus. Although there is a new vaccine for RSV, uptake of the new vaccine among nursing facility residents has been hampered by shortages of RSV vaccines and the prioritization of the vaccine for infants and high-risk children. Increasing access to all vaccinations for this population may be a key strategy to preventing respiratory illnesses.

News Release

People with Medical Debt are Much More Likely to Experience Other Forms of Financial Stress

Published: Feb 12, 2024

People with medical debt are much more likely than those without such debt to show other signs of financial vulnerability, like having no “rainy day” fund, overdrawing a checking account, or relying on costly loans, according to a new KFF analysis of national survey data.

Medical debt remains a significant issue in the U.S., including among people with health insurance. In 2021, 23% of U.S. adults had one or more unpaid and past due bills from a medical service provider.

KFF’s 2022 Health Care Debt Survey found similar results: Among adults, 24% say they had medical or dental bills that were past due or that they could not pay, and a total of 41% had some type of health care debt, including on credit cards or owed to family members.

Medical debt and other forms of financial instability affect people and households across the income spectrum and can cause individuals to forgo needed care. In its award-winning series, “Diagnosis: Debt”, KFF Health News examined the epidemic of medical debt that has become a defining feature of the U.S. health care system.

The Consumer Financial Protection Bureau is expected to release requirements that remove medical debt from credit reports and could crack down on certain debt collection practices. Some states and localities have also bought or are seeking to buy their residents’ medical debt, in part with remaining COVID relief funds.

KFF’s new analysis relies on data from the 2021 National Financial Capabilities Survey. The survey uses information from more than 27,000 adults in each state and D.C.