KFF designs, conducts and analyzes original public opinion and survey research on Americans’ attitudes, knowledge, and experiences with the health care system to help amplify the public’s voice in major national debates.
The Kaiser Media Fellowships in Health: Site Visits and Events
Fellowship program site visits are a central part of the Kaiser Media Fellowships in Health Program. The site visits and events provide journalists with the opportunity for in-depth learning about specific topics in health policy, and aim to address timely policy questions which are both current and complex.
State Health Care and Reform Initiatives, Northern California—March 2008In March 2008, the Kaiser Media Fellows and invited journalists met in Northern California with state and local policymakers, migrant farm worker community representatives, and leaders from the business community for a week-long series of briefings on state and local health reform initiatives. Agenda
The Poynter Institute, St. Petersburg, Florida—November 2007In November 2007, the Kaiser Media Fellows met at the Poynter Institute for Media Studies in St. Petersburg, Florida, for a three day program on multimedia reporting including database work, blogging, and podcasting. The Kaiser Media Fellowships Program take a group of journalists to the Poynter Institute each year. Agenda
Multimedia Workshop with Amy Webb—Washington, D.C., September 24–27, 2007In September, 2007, the fellows met in Washington, D.C. with Amy Webb of Webbmedia Group, LLC, for a three day workshop on multimedia tools to help them in their fellowship projects and their reporting in general. During the workshop they also received briefings on funding for global health issues and health care concerns related to immigration. Agenda
Health Issues Post-Katrina: New Orleans, LA and the Gulf Coast Region—March 2007In March 2007, the Kaiser Media Fellows and invited journalists met in New Orleans, LA and travelled to Gulfport, MS and Baton Rouge, LA for a weeklong series of briefings with health experts, policymakers and health care providers on the changing health challenges in the Gulf Coast Region.AgendaReporting from New Orleans Site Visit
Quality of Care Issues Brifing: Washington, DC—February 2007In February 2007, the Kaiser Media Fellows met in Washington, DC, for a one-day seminar on evaluating and improving the quality of medical care. Agenda
Hospital Financing Seminar: Boston, MA—November 2006In advance of the 2006 Nieman Conference, some of the 2006 Kaiser Media Fellows attended a halfday-long seminar on hospital financing issues with Nancy Kane, Professor of Management in the Department of Health Management at the Harvard University School of Public Health. Agenda
The Poynter Institute, St. Petersburg, Florida—November 2006In November 2006, the Kaiser Media Fellows met at the Poynter Institute for Media Studies in St. Petersburg, Florida, for a three day program on computer-assisted health reporting. The Kaiser Media Fellowships Program take a group of journalists to the Poynter Institute each year. Agenda
THERE WERE NO SITE VISITS BETWEEN AUGUST 2005 AND NOVEMBER 2006 WHILE THE KAISER MEDIA FELLOWSHIPS PROGRAM WAS ON HIATUS.
The VA System: Washington, DC, Wilmington, DE, Coatesville, PA, Baltimore, MD—August 2005In August 2005, the Kaiser Media Fellows and invited journalists met in Washington, DC, and traveled to Coatesville, PA, Wilmington, DE, and Baltimore, MD, for a weeklong series of briefings on the VA health care system. Agenda
Washington, D.C. —May 2005In May 2005, the Kaiser Media Fellows met in Washington, DC for briefings on SARS and Medicare Part D, and also met with the national advisory committee to discuss fellows’ projects, fellowship program experiences, and lessons for future selections. AgendaFlorida’s Medicaid Program: Tallahassee & Miami, Florida – April 2005In April 2005, the Kaiser Media Fellows and invited journalists met in Tallahassee and Miami for a weeklong series of briefings focused on Governor Bush’s proposed changes to the State’s Medicaid program, and the potential implications of such reform. Agenda
The Poynter Institute, St. Petersburg, Florida—November 2004In November 2004, the Kaiser Media Fellows met at the Poynter Institute for Media Studies in St. Petersburg, Florida, for a three day program on computer-assisted health reporting. The Kaiser Media Fellowships Program takes a group of journalists to the Poynter Institute each year. Agenda
Washington, D.C.—September 2004In September 2004, the Kaiser Media Fellows met in Washington, DC for a series of briefings on the uninsured and the Medicare prescription drug benefit with Kaiser Foundation staff and CMS officials. Agenda
SARS & Prescription Drug Issues: Toronto & Ottawa, Canada—August 2004In August 2004, the Kaiser Media Fellows and invited journalists met in Toronto and Ottawa for a weeklong series of briefings on SARS and prescription drug issues in Canada, and to discuss the lessons to be learned for the U.S. Agenda
Minority Journalists’ Workshop, “Reporting on HIV/AIDS in the US,” Washington, D.C.—August 2004In August 2004 the Kaiser Media Fellowships Program held a workshop for minority journalists ahead of the UNITY: Journalists of Color, Inc. convention in Washington, D.C. Agenda
Racial Barriers to Health Care: Atlanta, GA—April 2004In April 2004, the Kaiser Media Fellows and invited journalists met in Atlanta, GA for a weeklong series of briefings that examined diversity issues and barriers to health care, and the implications for the city. Agenda“AIDS in America: The Forgotten Epidemic? A Conference for News Leaders,”Washington, DC—March 2004 In March 2004, The Kaiser Media Fellowships Program, in partnership with the Columbia Graduate School of Journalism, hosted “AIDS in America: A Forgotten Epidemic? A Conference for News Leaders,” a conference for editors and news directors.
The conference included presentations by David Satcher, M.D., former U.S. Surgeon General, Director of the National Center for Primary Care; Julie Gerberding, M.D., Director of the U.S. Centers for Disease Control; Anthony Fauci, M.D., Director of the National Institutes on Health, and others and a discussion of “AIDS at 21: Media Coverage of the HIV Epidemic 1981–2002,” a comprehensive Kaiser study published in the March/April edition of the Columbia Journalism Review.
The Poynter Institute, St. Petersburg, Florida—November 2003 In November 2003, the Kaiser Media Fellows met at the Poynter Institute for Media Studies in St. Petersburg, Florida, for a three day program on computer-assisted health reporting. The Kaiser Media Fellowships Program takes a group of journalists to the Poynter Institute each year. Agenda
Challenges to the County Public Health Care System: Los Angeles, CA—August 2003In August 2003, the Kaiser Media Fellows and invited journalists met in Los Angeles for a weeklong series of briefings focused on the challenges facing the Los Angeles County public health care system, including the services in place to provide care for the uninsured. Agenda
Brazil’s Response to HIV/AIDS: Brazil—May 2003 In May 2003, the Kaiser Media Fellows and a group of senior health/medical journalists visited Brazil for a weeklong series of briefings on Brazil’s response to HIV/AIDS. Agenda
Reporting from Brazil Site VisitSusan Dentzer, of the NewsHour with Jim Lehrer, joined the Kaiser Media Fellows in Brazil to report on the country’s HIV treatment and prevention programs.
Sue Valentine, editor of the South African news agency Health-e, joined the Kaiser Media Fellows on the sitevisit to Brazil and reported on Brazil’s response to HIV/AIDS.
Airlie House Reunion, Warrenton, VA – October 2002 In October 2002, the Kaiser Media Fellowships Program hosted a reunion at the Airlie Center in Warrenton, VA, that gave the Fellows an opportunity to meet and catch up with other Fellows, the advisory committee, and other invited health journalists. Agenda
Multicultural Health and Immigration Issues: Seattle, WA and Vancouver, Canada—August 2002In August 2002, the Kaiser Media Fellows and invited journalists met in Seattle, WA and Vancouver, Canada for a weeklong series of briefings on multicultural health and immigration issues. Agenda
XIV International AIDS Conference, Barcelona, Spain—July 2002Agenda
“Covering the Global AIDS Crisis,” Columbia University, New York, NY—May 2002Agenda
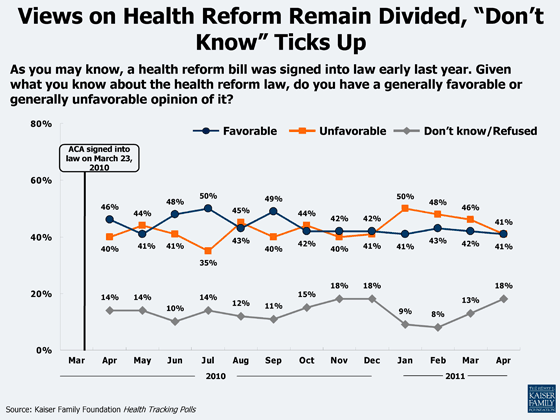
This month, public opinion on the health reform law continues to be remarkably steady. The April Kaiser Health Tracking Poll finds that four in ten feel favorably about the law and an equal share say they feel unfavorably. In recent months there has been a slight decline in the share with an unfavorable view of the law, with a corresponding uptick in the share who offer no opinion on the law. The rise in those who say they don’t know how they feel about the law seems to have been driven by seniors; this month nearly a quarter (24 percent) of those ages 65 and older declined to give an opinion of the law. This may reflect confusion stemming from the recent deficit-reduction proposals and their potential impact on Medicare and the health reform law. In addition, the partisan divisions over that landmark legislation remain: 74 percent of Republicans oppose the law and 64 percent of Democrats favor it, with independents occupying the middle ground.
Along with attitudes about the ACA, the April poll examined the public’s views of deficit-reduction proposals impacting Medicare. For more on those results, see the full report and toplines.
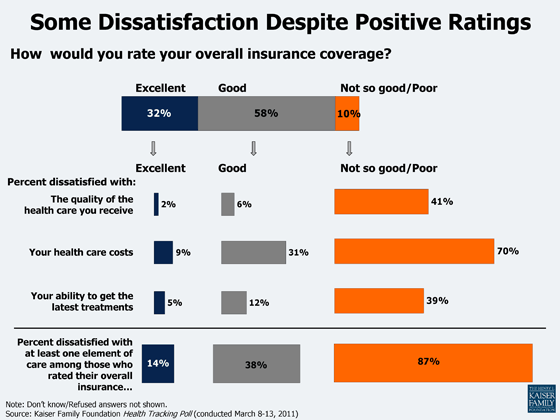
Personal experiences with the health care system are a key factor in Americans’ opinions on how the health care system should function and their expectations of how the Affordable Care Act (ACA) will change the system when fully implemented. In order to take a closer look at these personal experiences, this post explores findings from the March Kaiser Health Tracking Poll on Americans’ views of their health care and coverage, including health insurance ratings and satisfaction with cost, quality and access to new treatments. Overall, the data suggests that while most like their health insurance, there remain areas of dissatisfaction, primarily centered on cost.
The vast majority of people with insurance rate their coverage highly, but even when the ratings are positive, they do not report being completely satisfied. Fully nine in ten say their health insurance is “excellent” (32 percent) or “good” (58 percent). While among those that say their coverage is “excellent,” just nine percent report being dissatisfied with health care costs. Dissatisfaction increases among those with “good” coverage, where almost a third (31 percent) report being dissatisfied with costs, 12 percent are dissatisfied with their ability to get the latest treatments, and six percent are dissatisfied with the quality of care they receive. Not surprisingly, 70 percent of those rating their health coverage as “poor” express dissatisfaction with costs, 41 percent report dissatisfaction with their quality of care, and 39 percent say they are dissatisfied with their access to new treatments.
Overall, while just 14 percent of those that rate their health insurance as “excellent” reported dissatisfaction to at least one of the questions on cost, quality or access to new treatments, closer to four in ten of those who rated their coverage as “good” report dissatisfaction. These findings demonstrate that positive health insurance ratings do not necessarily translate to fully satisfied consumers and suggest that public opinion of the ACA will be tied in part to their personal health care costs.
This brief examines key Medicare provisions included in “The Path to Prosperity: Restoring America’s Promise,” a long-term budget proposal released by House Budget Chairman Paul Ryan on April 5, 2011, which outlines a strategy for reducing federal spending and reducing the national debt over time. The Medicare provisions are among the many significant changes to programs affecting the elderly and disabled in the “Path to Prosperity” proposal.
The central Medicare proposal would transform the program from one that helps pay for a defined set of benefits to one that provides “premium support” payments to private health insurers on behalf of Medicare enrollees, beginning in 2022. Under the plan, the government would contribute a pre-determined amount toward the cost of private health insurance, with beneficiaries responsible for costs above that amount. The annual increase in the government contribution would be limited to the consumer price index, a measure of general inflation.
Under the proposal, a typical 65-year-old retiring in 2022 would be expected to devote nearly half their monthly Social Security checks toward health care costs, more than double what they would spend under current Medicare law, according to the analysis.
The brief also describes other Medicare provisions included in the proposal, including gradually raising Medicare’s age of eligibility from 65 to 67, and repealing provisions of the 2010 law that would have closed the Medicare drug benefit’s coverage gap, or “doughnut hole,” and created an Independent Payment Advisory Board (IPAB).
The brief is a product of the Kaiser Project on Medicare’s Future, which focuses on producing timely analysis of leading reforms affecting people on Medicare.
Menlo Park, CA – The Henry J. Kaiser Family Foundation announced today that the Honorable James E. Doyle, former governor of Wisconsin, and Kathryn B. Kaiser, great granddaughter of the Foundation’s originator, Henry J. Kaiser, have been elected to its Board of Trustees.
Doyle served two terms as governor of Wisconsin, first being elected in 2002 and wrapping up his second term earlier this year. He has extensive experience in health care issues and gained attention during his time as governor for being able to reduce Medicaid spending while expanding health coverage for state residents. Governor Doyle is currently of counsel at Foley & Lardner, LLP, specializing in health care and energy policy issues. Doyle has also served three terms each as a district attorney in Dane County, Wisconsin, and as Wisconsin’s attorney general.
Kathryn Kaiser, known as Katie, is the great granddaughter of Henry J. Kaiser and will serve as one of two current family Trustees of the Foundation. Kaiser, a graduate of the Stanford University Graduate School of Business, has extensive corporate experience, most recently in executive search and staffing, and is the founder of CoachingWIT, a life coaching practice dedicated to helping women in all stages of life transition.
“The Foundation is very pleased to have Governor Doyle as a Trustee at a time when states are the focal point of some of the nation’s key health care challenges, and Katie Kaiser’s election reaffirms the Kaiser Family Foundation’s commitment to follow the “can do” legacy of its founder, Henry J. Kaiser,” said Richard T. Schlosberg III, Chair of the Board of Trustees.
The Kaiser Family Foundation is a non-profit, private operating foundation focusing on the major health care issues facing the U.S., as well as the U.S. role in global health policy. Unlike grant making foundations, Kaiser develops and runs its own research and communications programs, sometimes in partnership with other non-profit research organizations or major media companies. The Foundation serves as a non-partisan source of facts, information, and analysis for policymakers, the media, the health care community, and the public. The Kaiser Family Foundation is not associated with Kaiser Permanente.
Doyle and Kaiser succeed Donna E. Shalala and Jennifer A. Drobac, each of whom served nine years as a Foundation Trustee.
# # #
The Kaiser Family Foundation is a non-profit private operating foundation, based in Menlo Park, California, dedicated to producing and communicating the best possible information, research and analysis on health issues. More information about the Foundation and its Trustees is available online.
In 2010, the Patient Protection and Affordable Care Act authorized the creation of the Independent Payment Advisory Board (IPAB) to help control the growth in Medicare costs. Beginning in 2014, IPAB will issue recommendations to lower Medicare costs in the event that spending exceeds targets established in the health care reform law.
This brief explains how the Independent Payment Advisory Board will be structured, the process and timelines for IPAB to make recommendations to achieve Medicare savings and the scope of its recommendations. It also explores issues and questions that have been raised about IPAB, its implementation, and its workings in practice. Finally, the report describes the various policy options that could be considered to modify the role of IPAB in the future.
The brief was authored by Jack Ebeler of Health Policy Alternatives and Tricia Neuman and Juliette Cubanski of the Kaiser Family Foundation.
Conservatives obviously don’t like what they call “Obamacare” because they think it expands the role of government too much and spends too much money. But ironically, the Affordable Care Act (ACA) actually promotes — though not explicitly — something that has been a fundamental objective of conservatives in health care for years: high-deductible health plans with more “skin in the game.”
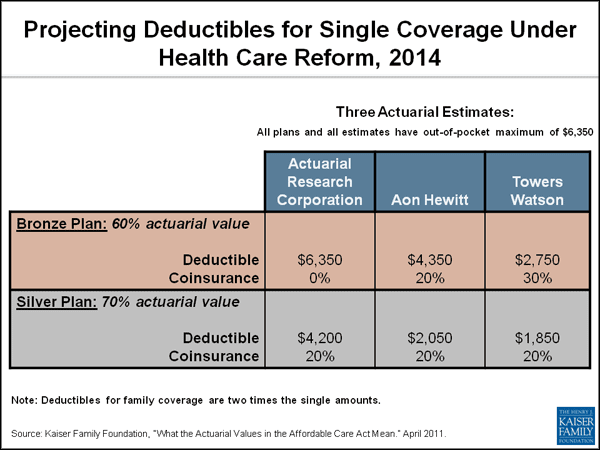
In a new study we just released, we commissioned three different actuarial consulting firms to estimate what deductibles may look like for people buying coverage in the new health insurance exchanges beginning in 2014. The analysis is complex because the levels of coverage in the ACA are specified using an “actuarial value” (the percentage of health care expenses the plan is expected to cover for a typical population of enrollees). Needless to say, actuarial value is not exactly a concept that makes a whole lot of sense to most people. The combination of deductible and coinsurance amounts that satisfy an actuarial value — which determine how much someone with a given level of health expenses will pay out-of-pocket — will vary from plan to plan and can only be estimated at this point. That’s the reason we used three firms — to surround a difficult technical task.
The three firms produced a wide range of estimates (a notable result in itself, and one that has implications for consumers and for federal policymakers now writing the regulations that will guide how state exchanges operate). But significantly, in all cases, the deductibles were high — ranging from $2,750 with 30% coinsurance to $6,350 with no coinsurance for an individual policy for the basic Bronze plan in 2014, which is the minimum people can buy and satisfy the so-called “individual mandate.” Patient out-of-pocket costs would be capped at $6,350, an amount that’s specified in the ACA. All of these amounts would be double for a family policy.
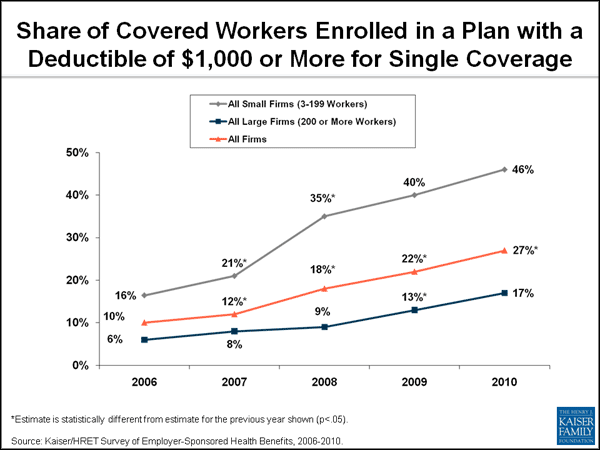
These are high levels of cost sharing by any standard, although the ACA also ensures improvements in the quality of the insurance people get and offers a better deal for many people than is now available in the broken, non-group market. For example, it prohibits denials of coverage based on health status, provides access to preventive services with no cost sharing, and specifies an essential benefits package for all plans offering coverage in the exchanges and the small- and non-group markets.These higher deductibles are also consistent with the trends we are seeing in the marketplace. Our 2010 employer survey found that the share of workers enrolled in a higher-deductible plan (with a deductible of $1,000 or more for single coverage) has nearly tripled since 2006. Almost half of all workers in small firms are now enrolled in such a plan. It is possible that the ACA will accelerate these trends by establishing a standard for coverage with high deductibles as a matter of national policy once the exchanges are in place.
Conservatives (and some economists) have always favored more “skin in the game,” arguing that it will incentivize consumers to be more prudent purchasers of health services and hold down utilization of health care overall. They particularly favor high-deductible plans tied to tax-preferred savings accounts. According to our study, both Bronze and Silver Plans in exchanges would have deductibles that meet the standards for Health Savings Accounts. It is possible, but hard to prove, that one of the factors responsible for the historically moderate increases in employer premiums in recent years has been increases in deductibles and other forms of cost sharing, which (along with the recession) may have caused workers to use less health care. Liberals believe in comprehensive coverage not “skin in the game.” Many health services researchers who have examined this question worry that plans with too much up front cost sharing will cause people to defer needed care, impose an added burden on families’ economic security, and present special risks for the chronically ill if they defer care.
The deductibles in the ACA have not been a focus to date for several reasons. The Congressional Budget Office, Congress’ official budget scorekeeper, released estimates of premium costs but not deductibles. Also, reducing deductible levels through higher actuarial values would have added to the cost of the legislation, which was already a hot issue. And, the advocacy community mostly focused its attention elsewhere, especially on the public option and on subsidies for lower income enrollees in the exchanges (which lower this high cost sharing for people with incomes up to 2.5 times the poverty level).
It is possible that in the future, once the ACA is fully in place, there will be pressure to reduce deductible levels to make out-of-pocket costs more affordable. But there will be countervailing pressure to keep premiums down, and deductibles are likely to remain high, consistent with trends in the marketplace.
A different way of looking at the ACA is that it represents a bargain between liberals and conservatives, although not one that was ever explicitly made. The left got 32 million people covered and reforms that eliminate the worst abuses in the health insurance system. And the right got a further push, beyond the momentum already underway in the market, towards just the kind of “skin in the game” insurance they have always believed will help control health care costs. It’s the big victory in health reform conservatives seem not to realize they have won.
Health spending is rising faster than incomes in most developed countries, which raises questions about how countries will pay for their future health care needs. The issue is particularly acute in the United States, which not only spends much more per capita on health care, but also has had one of the highest spending growth rates. Both public and private health expenditures are growing at rates which outpace comparable countries. Despite this higher level of spending, the United States does not achieve better outcomes on many important health measures. This paper uses information from the Organisation for Economic Co-operation and Development (OECD)1to compare the level and growth rate of health care spending in the United States to those of other OECD countries.
It is reasonably well known that the United States spends more per capita on health care than other countries. What may be less well known is that the United States still has one of the highest growth rates in health care spending. Health care spending around the world is generally rising faster than overall economic growth, so almost all countries have seen health care spending increase as a percentage of their gross domestic product (GDP) over time. In the United States, which has both a high level of health spending per capita and a relatively high rate of real growth in spending, the share of GDP devoted to health care spending grew from 9% of GDP in 1980 to 16% of GDP in 2008. This 7 percentage-point increase in health spending as a share of GDP is one of the largest across the OECD.
This paper analyzes data on health spending and national income from the 15 Organisation for Economic Co-operation and Development (OECD) countries who rank in the top three-fifths of per capita national income and aggregate national income. The OECD is an international organization that collects and analyses data on various social and economic indicators. Countries with relatively low per capita income were excluded because they have fewer resources to devote to health care and, therefore, do not provide a reasonable comparison with American spending levels.2Similarly, smaller developed countries face different challenges in administering their healthcare system and were also excluded. Footnotes are provided where the OECD data show a break in series, indicating that the OECD data may not be comparable over the entire period being analyzed. Germany is excluded from the time series exhibits because data is not comparable across the period of reunification.3The level of total health expenditure per capita is shown in U.S. dollars, adjusted for purchasing power parity (PPP).4 Spending totals for Japan and Australia are reported from 2007 because 2008 data is not currently available. Data on growth rates and health care as a percentage of GDP are based upon the national currency of each country, with growth rates adjusted to remove the impact of inflation.5
Health Spending Per Capita:
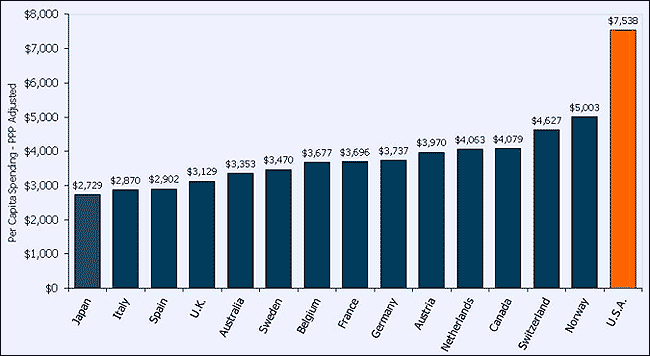
Exhibit 1 shows per capita health expenditures for 2008 in U.S. dollars purchasing power parity. Health spending per capita in the United States is much higher than in other countries – at least $2,535 dollars, or 51%, higher than Norway, the next largest per capita spender. Furthermore, the United States spends nearly double the average $3,923 for the 15 countries.
Exhibit 1Total Health Expenditure per Capita, U.S. and Selected Countries, 2008
Source: Organisation for Economic Co-operation and Development (2010), “OECD Health Data”, OECD Health Statistics (database). doi: 10.1787/data-00350-en (Accessed on 14 February 2011).Notes: Data from Australia and Japan are 2007 data. Figures for Belgium, Canada, Netherlands, Norway and Switzerland, are OECD estimates. Numbers are PPP adjusted.
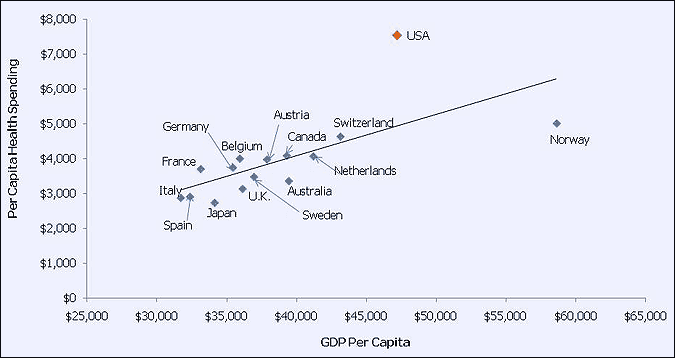
While an increasing GDP per capita is associated with increased health spending, the United States is an outlier, spending more than similarly wealthy countries. Exhibit 2 shows the relationship between a country’s GDP per capita and its per capita health care expenditure.
Exhibit 2Total Health Expenditure per Capita and GDP per Capita, US and Selected Countries, 2008
Source: Organisation for Economic Co-operation and Development (2010), “OECD Health Data”, OECD Health Statistics (database). doi: 10.1787/data-00350-en (Accessed on 14 February 2011).Notes: Data from Australia and Japan are 2007 data. Figures for Belgium, Canada, Netherlands, Norway and Switzerland, are OECD estimates.
Health Spending and Annual Growth Rates:
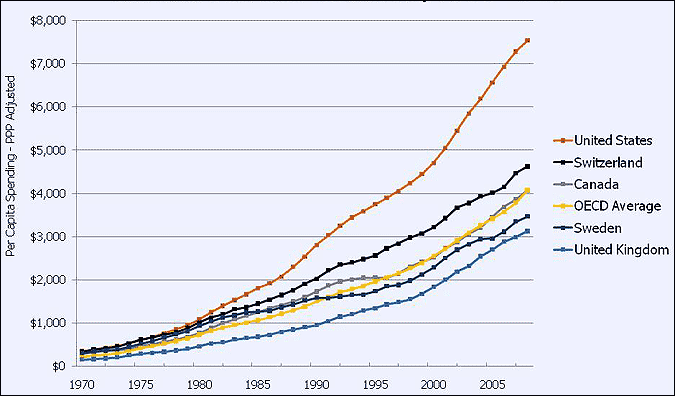
In addition to higher health spending, the United States is increasing its spending faster than other countries. Exhibit 3 illustrates the trend in health spending among five countries. The United States’ higher growth rate in the 1990s and the 2000s ensured that it spent far more than other selected countries. While the United States had a slower rate of growth in the early 1990s, the late 1980s and 2000s were defined by an accelerated growth rate.
Exhibit 3Growth in Total Health Expenditure Per Capita, U.S. and Selected Countries, 1970-2008
Source: Organisation for Economic Co-operation and Development (2010), “OECD Health Data”, OECD Health Statistics (database). doi: 10.1787/data-00350-en (Accessed on 14 February 2011).Notes: Data from Australia and Japan are 2007 data. Figures for Belgium, Canada, Netherlands, Norway and Switzerland, are OECD estimates. Numbers are PPP adjusted. Break in series: CAN(1995); SWE(1993, 2001); SWI(1995); UK (1997). Numbers are PPP adjusted. Estimates for Canada and Switzerland in 2008.
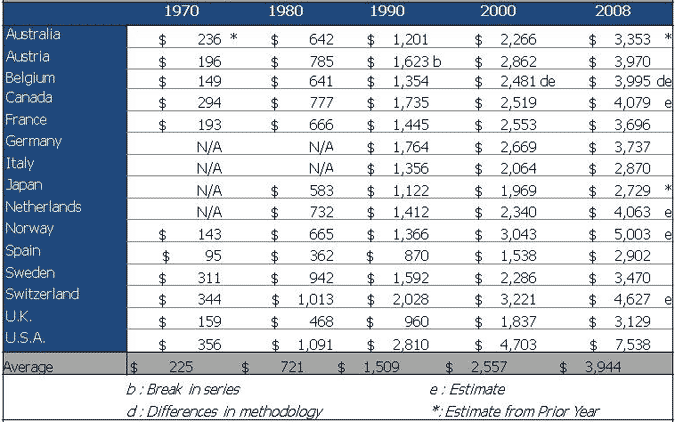
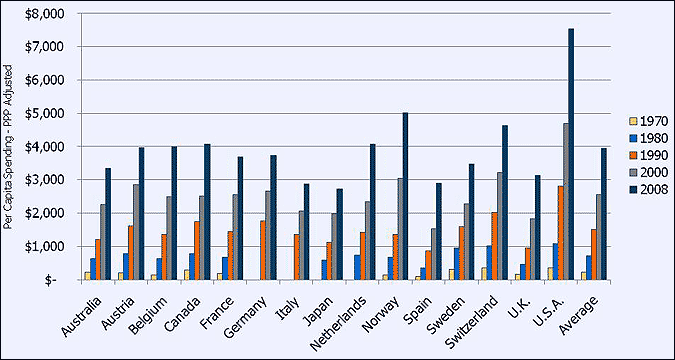
Exhibits 4A and 4B document total health expenditure per capita, holding constant both inflation and adjusting for, purchasing power parity. Over the last thirty years the difference between the United States’ spending and comparable countries has widened.
Exhibit 4ATotal Health Expenditures, Per Capita Spending in US Dollars and PPP adjusted
Source: Organisation for Economic Co-operation and Development (2010), “OECD Health Data”,OECD Health Statistics (database). doi: 10.1787/data-00350-en (Accessed on 14 February 2011).Notes: Data from Australia and Japan are 2007 data. 2008 figures for Belgium, Canada, Netherlands, Norway and Switzerland, are OECD estimates. 2000 figured for Belgium are OECD estimates. Numbers are PPP adjusted. Break in Series AUS (1998); AUSTRIA(1990); BEL(2003, 2005); CAN(1995); FRA(1995); GER(1992); JAP(1995); NET(1998, 2003); NOR(1999); SPA(1999, 2003); SWE(1993, 2001); SWI(1995); UK (1997. Starting in 1993 Belgium used a different methodology.
Exhibit 4BTotal Health Expenditure Per Capita, U.S. and Selected Countries, 1970, 1980, 1990, 2000, 2008
Source: Organisation for Economic Co-operation and Development (2010), “OECD Health Data”, OECD Health Statistics (database). doi: 10.1787/data-00350-en (Accessed on 14 February 2011).Notes: Data from Australia and Japan are 2007 data. Figures for Belgium, Canada, Netherlands, Norway and Switzerland, are OECD estimates. Numbers are PPP adjusted. Break in Series AUS (1998); AUSTRIA(1990); BEL(2003, 2005); CAN(1995); FRA(1995); GER(1992); JAP(1995); NET(1998, 2003); NOR(1999); SPA(1999, 2003); SWE(1993, 2001); SWI(1995); UK (1997). Starting in 1993 Belgium used a different methodology.
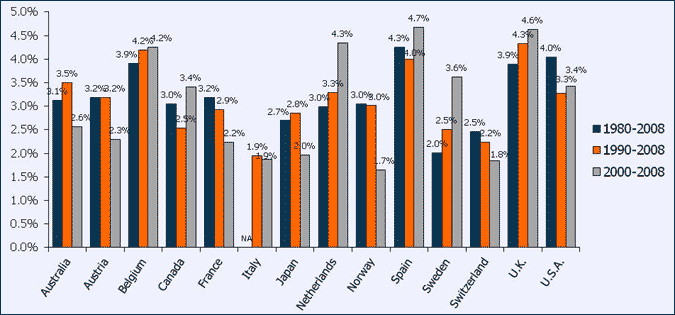
Exhibit 5 shows the average annual growth rate for per capita health spending, adjusted for inflation in each country.6The U.S. average annual growth rate (4% from 1980 to 2008) was the second highest among the countries analyzed throughout the selected period. The combination of a relatively high level of per capita health spending in 1980, and a relatively high growth rate between 1980 and 2008, resulted in the very high level of health spending per capita that we now see in the United States. For example, while Switzerland and Sweden had levels of per capita health spending comparable to the U.S. in 1980 (Exhibit 4), they had much lower average annual growth rates in health spending than the U.S. over the 1980 to 2008 period. Other countries with relatively high average annual growth rates over the 1980 to 2008 period (e.g., Spain, Norway, United Kingdom) started the period at relatively low levels of health spending per capita relative to the U.S. While the annual growth rate between 1990 and 2008 and between 2000 and 2008, are more modest, the United States still matched or exceeded the growth rate of more than half of the fifteen countries analyzed.
Exhibit 5Average Annual Growth Rates in Total Health Expenditure Per Capita, U.S. and Selected Countries, 1980 to 2008, 1990 to 2008, and 2000 to 2008
Source: Organisation for Economic Co-operation and Development (2010), “OECD Health Data”, OECD Health Statistics (database). doi: 10.1787/data-00350-en (Accessed on 14 February 2011).Notes: Data from Australia and Japan are 2007 data. Figures for Belgium, Canada, Netherlands, Norway and Switzerland, are OECD estimates. Numbers are PPP adjusted. Break in Series AUS (1998); AUSTRIA(1990); BEL(2003, 2005); CAN(1995); FRA(1995); GER(1992); JAP(1995); NET(1998, 2003); NOR(1999); SPA(1999, 2003); SWE(1993, 2001); SWI(1995); UK (1997). Starting in 1993 Belgium used a different methodology.
Health Spending and National Income:
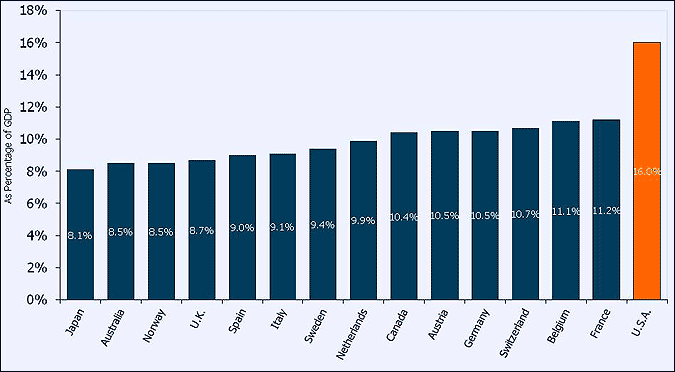
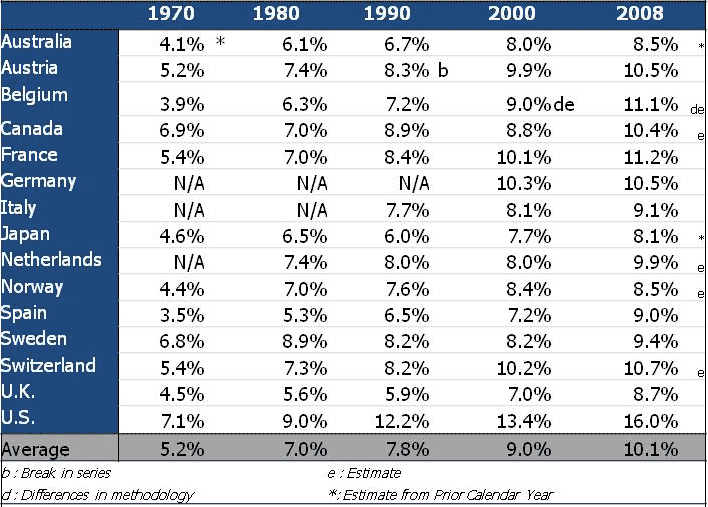
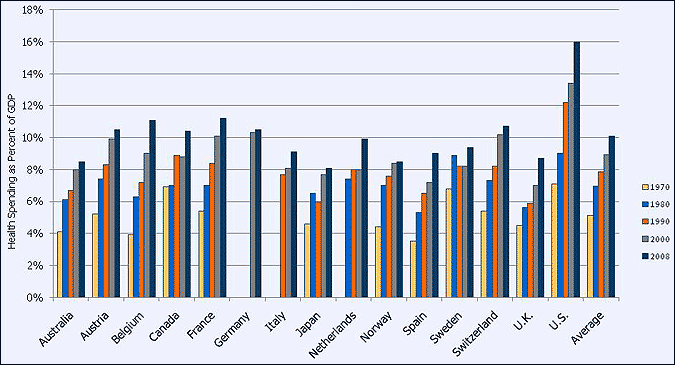
Another way to look at relative health spending is to look at how much of a country’s national income is spent on health care. Economist often use a country’s total production, or its GDP, as a measurement of its national income. Exhibit 6 shows that in 2008, health expenditures in the U.S. equaled 16% of GDP, almost five percentage points higher than for any other country in the analysis. The U.S. has committed a higher share of GDP to health care than most other nations since at least the 1970s, although there were several other countries with comparable levels in the 1970s and 1980s (Exhibit 7A and 7B). Since that time, health spending as a share of GDP has grown in the U.S. relative to other countries.
Exhibit 6Total Health Expenditure as a Share of GDP, U.S. and Selected Countries, 2008
Source: Organisation for Economic Co-operation and Development (2010), “OECD Health Data”, OECD Health Statistics (database). doi: 10.1787/data-00350-en (Accessed on 14 February 2011).Notes: Data from Australia and Japan are 2007 data.Figures for Belgium, Canada, Netherlands, Norway and Switzerland, are OECD estimates.
Exhibit 7ATotal Expenditure on Health as a Share of GDP
Source: Organisation for Economic Co-operation and Development (2010), “OECD Health Data”, OECD Health Statistics (database). doi: 10.1787/data-00350-en (Accessed on 14 February 2011).Notes: Data from Australia and Japan are 2007 data. Figures for Belgium, Canada, Netherlands, Norway and Switzerland, are OECD estimates. Numbers are PPP adjusted. Break in Series AUS (1998); AUSTRIA(1990); BEL(2003, 2005); CAN(1995); FRA(1995); GER(1992); JAP(1995); NET(1998, 2003); NOR(1999); SPA(1999, 2003); SWE(1993, 2001); SWI(1995); UK (1997). Starting in 1993 Belgium used a different methodology.
Exhibit 7BTotal Expenditure on Health as a Share of GDP, U.S. and Selected Countries, 1970, 1980, 1990, 2000, 2008
Source: Organisation for Economic Co-operation and Development (2010), “OECD Health Data”, OECD Health Statistics (database). doi: 10.1787/data-00350-en (Accessed on 14 February 2011).Notes: Data from Australia and Japan are 2007 data. Figures for Belgium, Canada, Netherlands, Norway and Switzerland, are OECD estimates. Numbers are PPP adjusted. Break in Series AUS (1998); AUSTRIA(1990); BEL(2003, 2005); CAN(1995); FRA(1995); GER(1992); JAP(1995); NET(1998, 2003); NOR(1999); SPA(1999, 2003); SWE(1993, 2001); SWI(1995); UK (1997). Starting in 1993 Belgium used a different methodology.
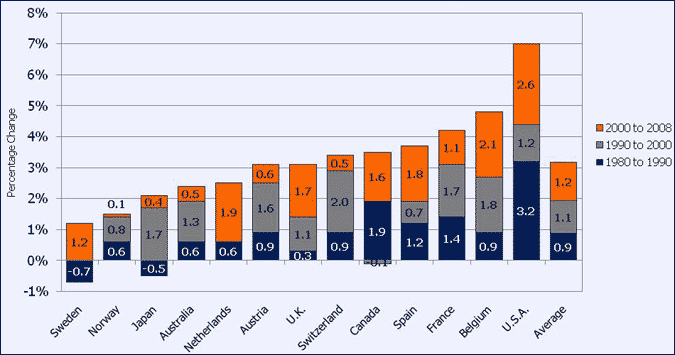
Between 1980 and 2008, the U.S. share of GDP devoted to health grew by 7 percentage points, almost 4 percentage points more than the 15-country average (Exhibit 8). In addition to the largest total increase in health spending as a percentage of GDP, the United States saw the largest increase of any country from 2000 to 2008 with health spending consuming 2.6% more of GDP than it did in 2000.
Exhibit 8Percentage Point Change in Total Health Expenditure as a Share of GDP, U.S. and Selected Countries, by Decade.
Source: Organisation for Economic Co-operation and Development (2010), “OECD Health Data”, OECD Health Statistics (database). doi: 10.1787/data-00350-en (Accessed on 14 February 2011).Notes: Data from Australia and Japan are 2007 data. Figures for Belgium, Canada, Netherlands, Norway and Switzerland, are OECD estimates. Numbers are PPP adjusted. Break in Series AUS (1998); AUSTRIA(1990); BEL(2003, 2005); CAN(1995); FRA(1995); GER(1992); JAP(1995); NET(1998, 2003); NOR(1999); SPA(1999, 2003); SWE(1993, 2001); SWI(1995); UK (1997). Starting in 1993 Belgium used a different methodology.
Health Spending and Public and Private Spending:
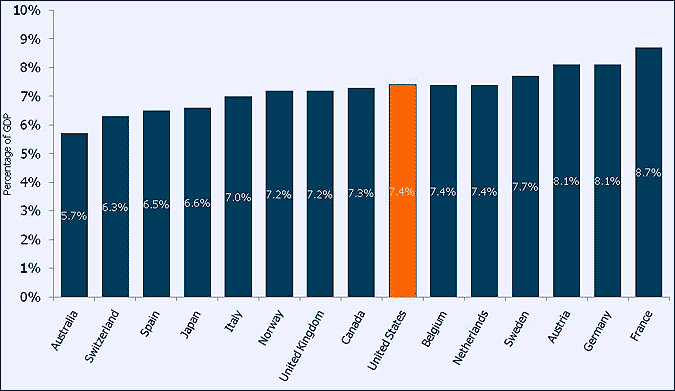
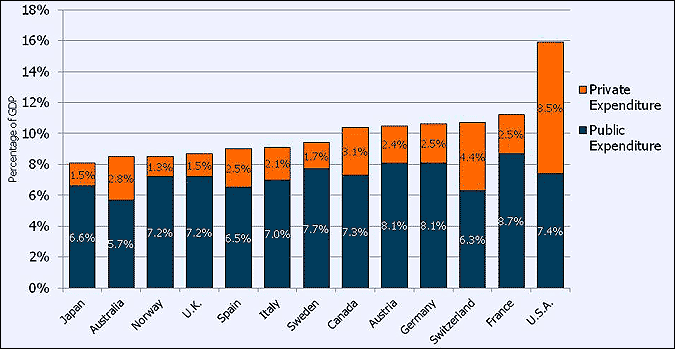
While the United States has had above average total spending, its public expenditures are in line with other countries. At 7.4%, of GDP public expenditures in the U.S. on health are only 0.2% above the 15-country average (Exhibit 9). Conversely, the United States has much more private sector spending as a percentage of GDP. Exhibit 10 illustrates the proportion of public and private spending among the 15 countries. Private health spending accounts for 8.5% of the U.S.’ GDP, 4 percentage points more than Switzerland (4.4%), the next largest private sector spender.
Exhibit 9Public Health Expenditure as a Percentage of GDP, U.S. and Selected Countries, 2008
Source: Organisation for Economic Co-operation and Development (2010), “OECD Health Data”, OECD Health Statistics (database). doi: 10.1787/data-00350-en (Accessed on 14 February 2011)Notes: Data from Australia and Japan are 2007 data.Figures for Belgium, Canada, Netherlands, Norway and Switzerland, are OECD estimates.
Exhibit 10Public and Private Health Expenditures as a Percentage of GDP, U.S. and Selected Countries, 2008
Source: Organisation for Economic Co-operation and Development (2010), “OECD Health Data”, OECD Health Statistics (database). doi: 10.1787/data-00350-en (Accessed on 14 February 2011).Notes: Data from Australia and Japan are 2007 data. Figures for Belgium, Canada,
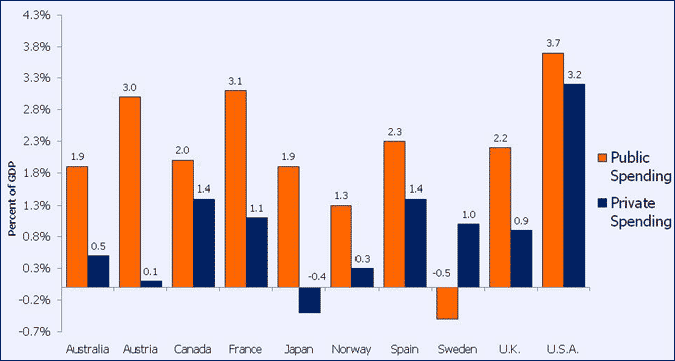
Over the last three decades, the United States has seen increased spending by both the public and private sectors. Exhibit 11 illustrates how the United States has had a faster rate of both sources of spending than other countries included in our analysis. Exhibit 12 shows the percentage of a country’s total health expenditure committed by the public sector. While countries such as the U.K., Norway and Sweden with relatively high public investments have seen increased spending by the private sector, the United States and countries with lower levels of public spending have seen a steady increase in the public’s share.
Exhibit 11Percentage Point Change in Public and Private Health Expenditure as a Share of GDP, U.S. and Selected Countries, 1980 to 2008
Source: Organisation for Economic Co-operation and Development (2010), “OECD Health Data”, OECD Health Statistics (database). doi: 10.1787/data-00350-en (Accessed on 14 February 2011).Notes: Break in Series AUS (1998); AUSTRIA(1990); CAN(1995); FRA(1995); JAP(1995); NOR(1999); SPA(1999, 2003); SWE(1993, 2001); UK (1997) Data from Australia and Japan are 2007 data. Figures for Canada, and Norway, are OECD estimates. Italy, the Netherlands, Belgium, and Switzerland were excluded because of missing data. Numbers are PPP adjusted.
Exhibit 12Public Spending on Health as a Percentage of Total Health Expenditure
Source: Organisation for Economic Co-operation and Development (2010), “OECD Health Data”, OECD Health Statistics (database). doi: 10.1787/data-00350-en (Accessed on 14 February 2011).Notes: 2008 figures for Canada, Norway and Switzerland, are OECD estimates. 2000 figured for Belgium are OECD estimates. Numbers are PPP adjusted. Break in Series AUS (1998); AUSTRIA(1990); BEL(2003, 2005); CAN(1995); FRA(1995); GER(1992); JAP(1995); NET(1998, 2003); NOR(1999); SPA(1999, 2003); SWE(1993, 2001); SWI(1995); UK (1997. Starting in 1993 Belgium used a different methodology.
After a brief respite in the mid-1990s, significant annual increases in health care spending over the past few years have refocused U.S. policymakers on the impacts of rising health care costs on businesses, individuals and government budgets. Compared to other developed nations, the U.S. spends more on health care per capita and devotes a greater share of its GDP to health. Since 1980, the U.S. also has had among the highest average annual growth rates in per capita spending on health care. Despite this relatively high level of spending, the U.S. does not appear to provide substantially greater health resources to its citizens,7or achieve substantially better health benchmarks, compared to other developed countries.8 Faced with expanding public deficits, and growing health care costs, American policy makers may elect to examine the tools employed by other countries to rein in costs. The growing difference between America’s spending and other developed countries may encourage an examination of what people in the U.S. are getting for their healthcare dollar.
Notes:
1. The data for this Kaiser Snapshot is from the Organisation for Economic Co-operation and Development (2010), “OECD Health Data”, OECD Health Statistics (database), updated February 14, 2011. Seehttp://www.oecd.org/health/healthdata.To improve comparability between countries and across time periods in 2000 the OECD developed A System of Health Accounts. Rep. OECD, 2000. Web. 18 Mar. 2011. <http://www.oecd.org/dataoecd/41/4/1841456.pdf>. The SHA relies on a different accounting methodology then CMS producing slightly different estimates of total health expenditure. Eva Orosz’s report for the OECD provides an explanation of the differences between the two methods. Orosz, Eva. The OECD System Of Health Accounts and the US National Health Account: Improving Connections through Shared Experiences. Rep. Centers for Medicare & Medicaid Services, 22 Apr. 2005. Web. 18 Mar. 2011. <https://www.cms.gov/NationalHealthExpendData/downloads/confpaperorosz.pdf>.OECD data from the United States was collected by the Centers for Medicare and Medicaid Services (CMS), Office of the Actuary. https://www.cms.gov/NationalHealthExpendData/07_NHEA_Related_Studies.asp
2. We are presenting information for 15 countries with 2008 GDP per capita above $32,305 and a total GDP above 3.4 billion dollars. The 15 countries are Australia, Austria, Belgium, Canada, France, Germany, Italy, Japan, Netherlands, Norway, Spain, Sweden, Switzerland, the United Kingdom and the United States.
3. OECD indicates that a “break in series” may be indicated when, for example, there are changes in a country’s reporting system; see “Comparability of time” at http://www.ecosante.org/OCDEENG/411.html. For thirteen of the fifteen countries there is at least one break in series: Australia (1998); Austria (1990); Belgium(2003, 2005); Canada(1995); France (1995); Germany (1992); Japan (1995); Netherlands (1998, 2003); Norway (1999); Spain (1999, 2003); Sweden (1993, 2001); Switzerland (1995); UK (1997).
5. Specifically, the OECD adjusts nominal health expenditures based upon a general economy-wide price index for the country. The OECD notes that health care inflation may be higher than economy-wide inflation, so the adjusted amounts may not eliminate all of the impacts of health care price inflation. See “Comparability over time” athttp://www.ecosante.org/OCDEENG/411.html.
6. The growth rates reflect changes in health spending levels in each country based on its own currency and adjusted for inflation, so all figures are in Year 2000 National Currency Units (NCUs). These growth rates will differ from the apparent growth that could be calculated from Table 1, which is based on U.S. dollars adjusted for purchasing power parity.
In 2011, the Kaiser Family Foundation began a new partnership with GlobalPost to help support original reporting on global health policy issues. As part of the partnership, the Foundation is working with GlobalPost to support its coverage of global health, including reporting on U.S. global health policy issues. Through the partnership, GlobalPost also created Global Pulse, a blog which will examine the Global Health Initiative in the field. The Foundation is also sponsoring the work of three Kaiser/GlobalPost Global Health Reporting Fellows. The Fellows are completing paid internships in the U.S. and abroad starting in Spring 2011. The three fellows were chosen by GlobalPost and the Foundation from students and/or recent graduates of the Columbia Journalism School: Selena Ross, Lomi Kriel and Marija Karimjee.
Funding for this project is provided by the Foundation through its U.S. Global Health Policy program, which receives support from the Bill & Melinda Gates Foundation. GlobalPost operates independently and is responsible for all editorial content, including editorial decisions about what stories to cover and how to cover them. John Donnelly is the lead reporter/editor for the series, and the project is overseen by Charles Sennott, the executive editor at GlobalPost.
With Medicaid being the focus of federal and state debate on deficits, the Kaiser Family Foundation’s President and CEO examines recent poll findings about the program’s popularity that may be a surprise considering the current discussion.