Quality of Care in Community Health Centers and Factors Associated with Performance

Authors: Julia Paradise, Peter Shin, Jessica Sharac, and Sara Rosenbaum
Published: Jun 10, 2013

This study examines quality performance among community health centers (CHC) on three key measures of primary and preventive care — diabetes and blood pressure control and timely Pap tests — using quality in Medicaid managed care organizations (MCO) as a benchmark. The study also identifies factors that differ significantly between high- and lower-performing health centers. Most health centers perform better than 75% of all Medicaid MCOs on the two chronic care measures, and more than 1 in 10 exceed this benchmark on all three quality measures. Few health centers lag behind average Medicaid MCO performance on all three measures. Lower-performing health centers have very high uninsured and homeless rates, while high performers have higher rates of Medicare and privately insured patients, a finding that suggests that the ACA expansion of Medicaid and private insurance may foster gains in health center quality performance.

Medicare Advantage 2013 Spotlight: Enrollment Market Update

Published: Jun 10, 2013

This data spotlight provides an overview of Medicare Advantage enrollment patterns in March 2013 and examines variations by plan type, state, and firm. It also analyzes trends in premiums paid by beneficiaries enrolled in Medicare Advantage plans, including variations by plan type, and describes the out-of-pocket limits and prescription drug coverage in the Part D “donut hole” provided by the plans in 2013.

This analysis finds that 14.4 million Medicare beneficiaries are enrolled in private Medicare Advantage plans in 2013, up nearly 10 percent from 2012. Since 2010, enrollment in Medicare Advantage plans has grown by 30 percent in spite of concerns that the payment changes enacted in the 2010 Affordable Care Act would lead to significant reductions in enrollment. While about 28 percent of Medicare beneficiaries nationally are now enrolled in Medicare Advantage plans, the share varies greatly by state — ranging from 49 percent in Minnesota to less than 1 percent and 3 percent in Alaska and Wyoming, respectively. Medicare Advantage enrollment continues to be concentrated among a small number of organizations. Beneficiaries in Medicare Advantage Prescription Drug plans (MA-PDs) pay about the same premium ($35 per month) in 2013, on average, as plan enrollees in 2012, with somewhat lower premiums in health maintenance organizations (HMOs) and higher premiums in other plan types. While the vast majority of beneficiaries (98%) have access to a MA-PD with no premium, slightly more than half (55%) of beneficiaries are enrolled in a zero-premium plan in 2013, varying by plan type and locale. All Medicare Advantage plans have a limit on out-of-pocket spending, and nearly half of all Medicare Advantage enrollees are in a plan with a limit at or below $3,400 per year.

The analysis is authored by researchers at Mathematica Policy Research Inc. and the Kaiser Family Foundation.

Beyond Rebates: How Much Are Consumers Saving from the ACA’s Medical Loss Ratio Provision?

Published: Jun 6, 2013

Most of the conversation around the Affordable Care Act’s Medical Loss Ratio (MLR) provision has centered on the requirement that insurers issue consumer rebates when they fall short of spending a certain portion of premium dollars on health care and quality improvement expenses.  This makes sense as rebates are one of the more tangible ways consumers have benefited from the law so far, and it likely contributes to the MLR provision being among the more popular aspects of the health reform law.

However, as we’ve written before, rebates represent only a portion, albeit the most concrete portion, of the MLR rule’s savings to consumers.  The primary role of an MLR threshold is to encourage insurers to spend a certain percentage of premium dollars on health care and quality improvement expenses (80 percent in the individual and small group market and 85 percent in the large group market).  The MLR rebate requirement operates as a backstop if insurers do not set premiums at a level where they would be paying out the minimally acceptable share of premiums back as benefits.  Only if those thresholds are not met are insurers required to provide rebates to consumers or businesses. (You can read more about the MLR rule here).

Consumers and businesses, therefore, can realize savings in two ways as a result of the MLR requirement: by paying lower premiums than they would have been charged otherwise (as a result of lower administrative costs and profits), or by receiving rebates after the fact. So while insurers paid out considerable amounts for rebates – last year’s rebates totaled $1.1 billion – this is not the whole story for consumers.

Of course, it is hard to know with certainty what premiums would have been if the MLR rules were not in place: we cannot know for sure how insurers would have priced their products or what rates regulators would have allowed (to the extent that they reviewed rates prior to the ACA). It is also difficult to separate out the direct effects of the MLR provision from other aspects of the health reform law, particularly rate review, which works to moderate unreasonable premium increases and thus increase loss ratios.  There are also data limitations. For example, prior to new reporting requirements put in place to enforce the MLR provision, there were not good data sources that break out premiums and claims on a consistent basis for major medical coverage by all types of carriers. In the initial years this data became available (2010 and 2011), there were some issues with the quality of the data, particularly regarding expenses for quality improvement and other new categories of administrative expenses that are reported on the exhibit.

Within these limitations, we constructed an analysis that looks at the basic proportion of premiums that health plans paid out as claims for medical care over the three years since the ACA was passed, both before and after the MLR requirement went into effect for coverage in 2011.  These proportions do not include adjustments for quality improvement expenses, taxes or other factors that are used when determining whether or not rebates need to be paid; they simply represent the total payments for medical care as a proportion of premiums.  This is the traditional way medical loss ratios have been calculated.  Generally, if the proportion is rising, that means insurers are paying out more of each dollar they receive on enrollee health care, which in most cases would mean that enrollees are getting better value for the premiums they pay. We then quantify what the change in the traditional MLR means to enrollees by estimating how much they would have paid in premium if the observed MLR for 2010 (before the MLR requirement went into effect) were held constant for 2011 and 2012.1  This approach addresses the following question: If insurers had targeted the same claims to premium ratio for 2011 and 2012 as they achieved in 2010, would premiums have been higher or lower, and by how much?  In other words, it addresses how much consumers may have saved in lower premiums as a result of the MLR threshold in addition to receiving rebates.

Our analysis uses insurer data filed to state regulators and compiled by Mark Farrah Associates. These data (filed on the Supplemental Health Care Exhibit) suggest that the main beneficiaries of the MLR rule’s upfront premium savings are people who purchase insurance on their own.  The majority of plans sold to small and large businesses were already in compliance with their respective MLR thresholds before the law went into effect, and our analysis shows that traditional MLRs (claims divided by premiums) for group plans have stayed relatively flat over the past three years.  In the individual market, by contrast, fewer than half of plans were in compliance with the ACA’s MLR thresholds in 2010, and the average traditional MLRs in this market have been steadily increasing since the requirement went into effect. This means that individual market insurers are devoting a greater portion of premium dollars to health care claims and less to administrative costs and profits compared to before the ACA’s MLR rule went into effect.

Weighted Average Traditional MLRs by Market Segment

This pattern is consistent with the idea that some insurers needed to improve their MLRs to comply with the new rebate requirements.  We know that the individual market MLR requirements in the ACA are higher than those that were in effect in many states, and there have been numerous reports that insurers worked to reduce their commissions and other administrative expenses to become more efficient.

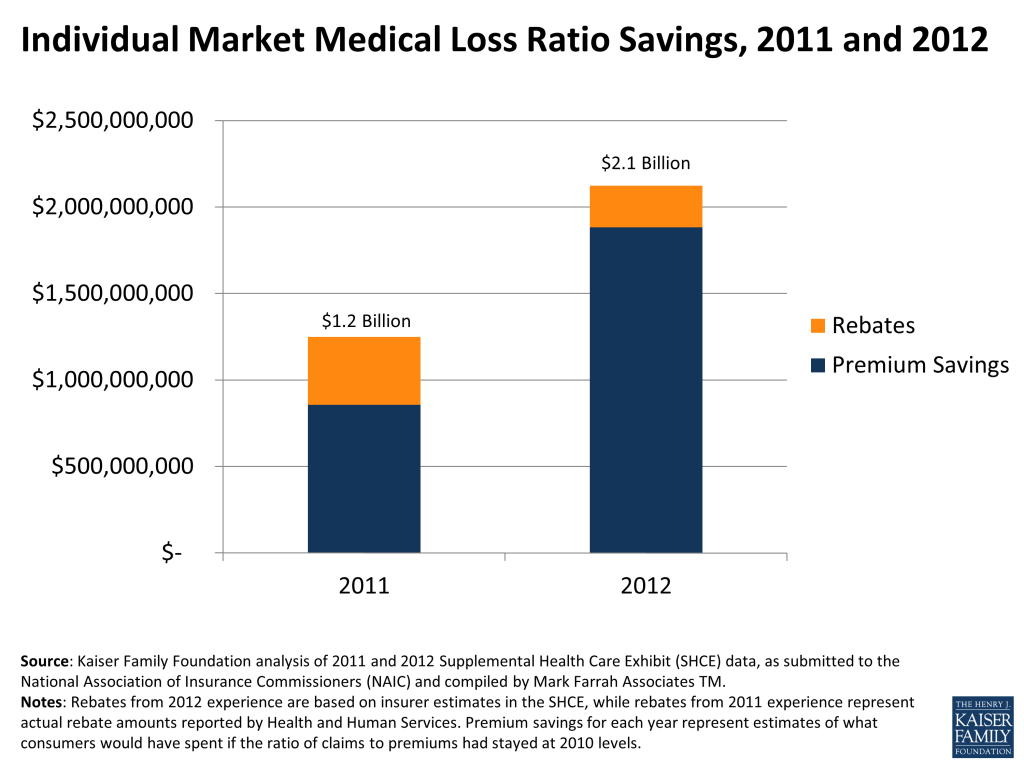
So how might these changes have affected premiums?  As noted above, one way to address this question is to compute what these consumers would have paid in premiums in 2011 and 2012 had traditional individual market MLRs stayed at 2010 levels (the year before the provision went into effect). Looked at this way, premiums would have been $856 million higher in 2011, and premiums would have been $1.9 billion higher in 2012.

Individual Market Medical Loss Ratio (MLR) Savings

Adding to the premium savings the amount individual market consumers received in rebates yields a total savings of $1.2 billion for 2011. This year, individual market insurers are expecting to issue $241 million in rebates (based on our analysis of early estimates from insurers filed with state insurance departments), bringing the total estimated savings for 2012 to $2.1 billion. While this savings was not distributed evenly (with more going to people enrolled in plans that had low MLRs prior to the law), when averaged across all individual market enrollees, this amounts to a savings of $204 per person ($181 in premium savings and $23 in rebates) in 2012. Taking into account both premium savings and estimated rebates, people purchasing insurance on their own in 2012 spent 7.5% less on average on insurance than they might otherwise have in the absence of the law.

There are some potential limitations to this approach. While the pattern of increasing MLRs over the three years makes sense given the incentives under the ACA and reports of insurer behavior, we do not have comparable data from earlier years to tell us whether or not the 2010 MLR was typical for the pre-ACA period (though the available evidence suggests that it was).2  Also, MLRs in 2011 and 2012 might be overstated because insurers simply underestimated how much health care expenses would rise following the recession, though increasing MLRs still means that consumers have been getting better value for their premium dollars. Finally, rebate amounts for 2012 are based on preliminary estimates filed on the Supplemental Health Care Exhibit to state insurance departments, and actual rebate amounts will be based on insurer filings with the Department of Health and Human Services, which were due June 1.

If insurers’ preliminary estimates hold true, this year’s rebates (at a total of $571 million across all markets) are expected to be about half the amount of last year’s $1.1 billion in insurer rebates. Smaller rebates, however, are not an indication that consumers are now saving less money as a result of the MLR provision, but rather that insurers are coming closer to meeting the ACA’s MLR requirements and that this provision is having its intended effect of consumers getting more value for the money they spend on premiums. In fact, in the individual market, the $241 million consumers are expected to receive in rebates for 2012 represents roughly one tenth of our estimate of the overall savings from the provision in that year. Perhaps ironically, when the MLR provision is working as intended and insurers set premiums to meet the thresholds, consumers save money but are less likely to get a check in the mail as tangible demonstration of those savings.

Updated June 6, 2013 11:30 AM PT

  1. See methodology attached ↩︎
  2. Based on our analysis of the Accident and Health Experience Exhibit submitted to state regulators, which has been required of all insurance entities since 2006 but is not directly comparable to newer and more precise data, the weighted average traditional loss ratio in 2010 was slightly higher (80%) than the average of previous years (79%). Our premium savings estimates for 2012 and 2011 are thus likely conservative compared with estimates that used MLRs in prior years. ↩︎

Key Lessons from Medicaid and CHIP for Outreach and Enrollment Under the Affordable Care Act

Published: Jun 4, 2013

The Affordable Care Act (ACA) will significantly increase coverage options through an expansion of Medicaid and the creation of new health insurance exchange marketplaces. However, effective outreach and enrollment efforts will be key to ensuring that new coverage opportunities translate into increased coverage. Based on a review of existing research, this brief identifies five key lessons learned through previous Medicaid and CHIP experience to help inform outreach and enrollment under the ACA. The brief is part of the “Getting into Gear for 2014” series examining key implementation issues as states prepare for the Affordable Care Act (ACA) coverage expansions.

Issue Brief

INTRODUCTION


The Affordable Care Act (ACA) provides a historic opportunity to significantly reduce the number of uninsured through new coverage options provided through an expansion in Medicaid and the creation of new health insurance exchange marketplaces. While the ACA intended for the Medicaid expansion to occur in all states, the Supreme Court ruling on the ACA effectively made the Medicaid expansion a state option. If a state does not expand Medicaid, poor adults in that state will not gain a new coverage option and likely remain uninsured. Regardless of state decisions to expand Medicaid, however, the ACA will establish new streamlined eligibility, enrollment, and renewal policies as of 2014 for Medicaid, CHIP, and Exchange coverage. Even with these new streamlined enrollment processes in place, effective outreach and enrollment efforts will be fundamentally important for translating the new coverage opportunities into increased coverage. To help inform these efforts, this brief identifies five key lessons learned about outreach and enrollment through previous Medicaid and CHIP experience, based on a review of existing research.

 BACKGROUND

 Medicaid and CHIP serve as key sources of coverage for low- and moderate-income children, but Medicaid eligibility for low-income adults lags far behind. As of January 2013, all but four states cover children in families with incomes up to at least 200% of the federal poverty level through Medicaid and CHIP. States have not expanded Medicaid coverage for adults to the extent that they have done so for children. As of January 2013, 33 states limited Medicaid eligibility for parents to less than 100% of the federal poverty level, with 16 of these states limiting eligibility to less than half of the poverty level. Moreover, in most states, other non-disabled adults remain ineligible for Medicaid regardless of their income. As such, the ACA Medicaid expansion to adults up to 138% FPL would significantly increase eligibility for low-income parents and adults in many states.

Most eligible children are enrolled in Medicaid and CHIP, but eligible, uninsured children remain and participation rates are lower for eligible adults. As of 2010, 86% of children who were eligible for Medicaid and CHIP were enrolled, with participation rates across states ranging from 67% in Nevada to 97% in the District of Columbia.1  While most eligible children are enrolled in Medicaid and CHIP, eligible but uninsured children remain. Nationwide, it is estimated that as of 2010, over two-thirds (4.4 million) of the 6 million uninsured children were eligible for Medicaid or CHIP but not enrolled.2  Moreover, certain groups of uninsured children are more likely to be eligible but not enrolled in coverage, including teens2 , Latinos2 , non-citizen children3 , children in families with mixed citizenship status such as citizen children with non-citizen parents4 , and children in families with mixed eligibility for Medicaid and CHIP (in which one child is eligible for Medicaid and another is eligible for CHIP).5  Research also suggests that Medicaid participation rates for eligible adults are lower relative to children. Sommers and Epstein estimated that between 2007 and 2009, fewer than two-thirds (62%) of adults eligible for Medicaid were enrolled.6  As is the case for children, adult participation rates also varied significantly by state, from less than 44% in Florida, Oklahoma, and Oregon to 88% in DC.7 

Individuals have historically faced a variety of barriers to enrollment in Medicaid. One key barrier has been lack of knowledge, including how and where to enroll, as well as misunderstanding of  eligibility requirements.7  In addition, difficulty completing the enrollment process, particularly providing required documentation or paperwork, has served as a barrier.8  Language and low literacy levels create additional enrollment challenges for some individuals.8   Moreover, studies suggest that many eligible immigrant families are reluctant to apply due to fears about jeopardizing their ability to obtain permanent status and/or exposing undocumented family members, despite federal guidance clarifying that enrollment in Medicaid and CHIP will not negatively affect an individual’s immigration status.8   Research also shows that even modest premiums can negatively affect low-income families’ participation in Medicaid and CHIP.8  In addition, perceived costs can deter enrollment—for example, 16 percent of low-income parents in one study believed that they would not be able to afford Medicaid or CHIP coverage.9  Over time, many states have streamlined enrollment processes and developed outreach and enrollment initiatives to reduce these enrollment barriers. The ACA’s new streamlined enrollment and renewal requirements that go into place in 2014 build on these previous efforts.

FIVE KEY LESSONS LEARNED ABOUT OUTREACH AND ENROLLMENT

States’ experience with Medicaid and CHIP has provided important understanding of the barriers families face to enrolling in coverage as well as effective strategies to overcome these challenges. Following are five key lessons learned based on this experience, which may help inform outreach and enrollment efforts under the ACA.

1.        Individuals want health coverage and value the Medicaid program for the key benefits it provides to their health and lives more broadly.

 Most individuals believe that having health coverage is important and say they would enroll in Medicaid if eligible. One national study conducted in 2000 found that 97 percent of parents of Medicaid-enrolled children and 91 percent of parents with uninsured children reported that having health coverage for their children was very important.10  The study also revealed that over 9 in 10 (93%) parents of eligible uninsured children would be willing to enroll their child in Medicaid.11  More recent survey data also show that adults want health coverage for themselves, with over three-quarters of low-income adults reporting that they would be interested in enrolling in Medicaid if they were uninsured and learned that they could qualify.12 


Individuals highly value the Medicaid program. Numerous studies have documented parents’ satisfaction with the Medicaid program as an affordable source of health coverage for their children.12  A recent national survey of low-income parents found that nearly three-quarters perceive Medicaid or CHIP as a good program (Figure 1).13  In other studies, over 9 in 10 parents (94%) of children enrolled in Medicaid think it is a good program.14  Specifically, parents value that Medicaid is affordable and that it provides access to a regular doctor and coverage of comprehensive services, including prescription drugs, dental care, preventive check-ups, and care in case of serious illness.14  About 7 in 10 parents also cite peace of mind as a reason for enrolling their child in Medicaid or CHIP.15  In addition, survey data show that low-income adults value Medicaid for themselves. In surveys with low-income adults in Alabama, Maryland, and Michigan, approximately 8 in 10 adults described the program as very or somewhat good.16  Key motivations that low-income adults cited for enrolling in Medicaid included security in case of unexpected accidents, protection from large medical bills, and the ability to have regular medical check-ups to remain healthy. 17 


Enrolling in Medicaid coverage has important benefits for individuals’ health and their lives more broadly. Findings from Oregon demonstrated that adults who obtained Medicaid coverage had higher health care utilization, lower medical debt, and better self-reported physical and mental health than adults that remained uninsured.18  In addition, focus groups with previously uninsured, low-income adults who gained Medicaid coverage found that obtaining coverage enabled them to get treatment for health needs and preventive care that they went without while uninsured. Many focus group participants also noted that having Medicaid enabled them to establish a relationship with a primary care physician and seek medical care from a physician early, rather than delaying care until their conditions worsened or relying on the emergency room. Moreover, by helping individuals get their health needs under control, Medicaid coverage facilitated individuals’ ability to focus on other priorities and goals, including work and caring for family members.19 

2.       A combination of broad and targeted outreach strategies is key for reaching eligible families.

Families learn about Medicaid and CHIP through multiple avenues including by word of mouth, mass media, and healthcare providers.20  Families also have varied preferences about where and how to receive information.21  Half of parents in a recent survey reported that they would want to obtain information about Medicaid and CHIP from a doctor’s office, approximately 4 in 10 (38%) would prefer to receive information from a clinic or from their child’s school (38%), and about a quarter (24%) would prefer to receive information from a TV advertisement.22  Preferences also differ by subgroup. For example, Spanish-speaking parents are less likely than English-speaking parents to prefer information from a doctor’s office, but are more likely to prefer information from a clinic, television ad, or from their child’s school (Figure 2).

Broad-based messages effectively educate families about coverage, but targeted messages and efforts are important for reaching and enrolling hard-to-reach individuals. In the initial years after CHIP was launched, many states successfully used a variety of broad-based outreach strategies, including mass media and partnerships with celebrities and professional sports teams to inform families about new coverage options.22  Today, a number of creative mass media outreach approaches for Medicaid and CHIP continue to be used, including Alameda County’s recent “Cover Your Family” campaign (Figure 3). These broad marketing strategies effectively educate families about the availability of coverage, but analysis of their continued effectiveness over time and their ability to increase enrollment is mixed.22  Combining these broad messages with more targeted outreach approaches, often through trusted community-based partners, is important to help reach and enroll hard-to-reach groups.22 

Health care providers can serve as an important and trusted link to health coverage. For example, half of low-income parents in one survey reported wanting to receive information about Medicaid and CHIP from doctors’ offices, and over half (57%) reported that they would trust a doctor a lot about whether they should enroll in Medicaid or CHIP.23  Moreover, community health centers can serve as a key source for providing trusted and linguistically and culturally appropriate outreach and enrollment assistance.24  Further, providers have incentive to enroll uninsured patients in health coverage to claim payment for services that may otherwise result in uncompensated care.25  As such, many states conduct outreach through hospitals, clinics, and other health providers.26 

Several states have documented success with school-based outreach approaches. These initiatives involve a range of efforts including enrolling children through school-based health centers, conducting back-to-school enrollment campaigns, and partnering with school sports teams to ensure all eligible players are enrolled.27  Grantees of the Covering Kids and Families Initiative identified school-based outreach as the most promising strategy to enroll eligible, uninsured children in coverage.28  A California study also found school-based enrollment strategies to be highly effective.29 

Having outreach materials and application forms available in plain language and in multiple languages may reduce enrollment barriers for individuals with LEP and low literacy. For example, in one survey, half of Spanish-speaking parents said that the belief that application materials would not be available in their language discouraged them from trying to enroll their child. 30  Moreover, half of parents with eligible uninsured children say that receiving help from someone who spoke their language would make them much more likely to enroll. 31  Recent efforts by some groups to provide outreach flyers and notices in multiple languages appear to have increased enrollment and retention among children in Medicaid and CHIP.32 

3.       Providing accessible, welcoming, and family-friendly application and enrollment processes helps reduce enrollment barriers for families.

Simplifying enrollment policies and procedures facilitates enrollment in Medicaid and CHIP. Numerous studies find that simplifying enrollment procedures, including eliminating interviews, coordinating program rules between Medicaid and CHIP, offering multiple enrollment methods, and reducing documentation requirements, contribute to increases in enrollment among Medicaid-eligible groups.32  For example, as part of the temporary Disaster Relief Medicaid (DRM) program created after the September 11th attacks in 2001, New York utilized a vastly streamlined one-page application, allowed applicants to self-attest to eligibility criteria such as income, and provided applicants with an on-the-spot eligibility determination.32  There was rapid enrollment in DRM, and many of those applying reported that they preferred the simplified application process.33  Studies also demonstrate that reinstatement of enrollment barriers leads to significant enrollment declines. For example, in September 2003, Texas increased premiums, established a waiting period, and moved from a twelve- to six-month renewal period for children enrolled in the state’s CHIP program and experienced a nearly 30 percent declined in enrollment decreased in the nine-month period after these changes were implemented.34 

Families want a variety of methods available to apply for coverage. In one recent survey, over half (55%) of parents said they would be likely to apply for Medicaid and CHIP by mail, while nearly two-thirds (62%) said they would be likely to apply online, and about one-third (34%) said they would be likely to apply at a government office. 35  As of January 2013, nearly all states allow children to apply for Medicaid and CHIP by mail, although somewhat fewer states provide this option to parents.36  In recent years, states have also increasingly provided families with the option to apply online (Figure 4). Oklahoma is the first state to implement a fully-automated, real-time electronic eligibility system that enables families to apply at any time and receive a determination within 15-20 minutes (Box 1).37 


Box 1: Oklahoma’s Online, Real-Time Medicaid Enrollment System


Oklahoma is the first state to maximize the use of technology through a web-based, fully-automated real-time eligibility determination system that is available 24 hours a day, seven days a week. The system allows individuals to apply online and receive an immediate or “real-time” decision on their application after the system has queried various electronic data sources to verify eligibility. Thereafter, individuals can use the account to renew coverage and update information such as an address or change in family status or employment. Using this system, the state processes more than a thousand applications per day, and 90 percent receive on-the-spot eligibility decisions, even when state offices are closed.

Use of electronic data to verify information and automatically enroll individuals into coverage reduces paperwork burdens for families and eligibility workers. Over the past several years, states have increasingly relied on electronic data matches to verify eligibility criteria. For example, nearly all states (45) now conduct an electronic data match with the SSA to verify citizenship. Early adopters of the SSA data match found that it reduced the administrative burden for both states and families applying for coverage.38  Moreover, as of January 2013, thirteen states have adopted the Express Lane Eligibility (ELE) option to enroll or renew children in Medicaid or CHIP using data from other benefit programs.39  When California piloted an ELE-like program in 2003-2004, the state was able to enroll hard-to-reach children that the state had not previously been able to connect to through traditional enrollment methods.40  Similarly, Louisiana enrolled more than 10,000 children in Medicaid in the month following implementation of ELE, and its volume and quality of eligibility processing remained steady despite a 12 percent reduction in the state Medicaid workforce.41 

Shifts in eligibility worker culture also support outreach and enrollment. Studies suggest that families’ perceptions of unfriendly eligibility staff and stigma associated with Medicaid can be deterrents to seeking coverage.41  While the direct impact of organizational culture has not been measured, states that have undergone cultural changes within eligibility offices have seen positive results in enrollment.42  For example, Louisiana attributes some of its success in enrolling and retaining eligible children in Medicaid and CHIP to internal marketing in eligibility offices about the importance of coverage and other efforts to change caseworker culture.43  To reduce stigma associated with coverage, Kansas also trained staff to shift away from describing health coverage as a social services program.44 

 4.       One-on-one enrollment assistance provided by trusted individuals within the community is a key component of successful enrollment efforts.

 Direct one-on-one enrollment assistance is associated with increased enrollment rates. For example, a study of Latino families in Boston found that those assigned to case managers who provided direct assistance were nearly twice as likely to obtain health coverage for their children as those without a case manager (Figure 5). Moreover, families with case managers were nearly three times as likely as those without assistance to report that they were “very satisfied” with the process of obtaining insurance.45  Similarly, children whose families were provided one-on-one application assistance at a Utah clinic were nearly three times more likely than those without direct assistance to enroll in coverage (Box 2).

Box 2: One-on-One Assistance through Community Health Centers in Utah


To increase enrollment in Medicaid and CHIP among uninsured low-income children, health centers in Utah launched a successful initiative that provides enrollment specialists in clinics to assist families through each step of the application and enrollment process. An evaluation of the program’s pilot clinic found that nearly three-quarters of children (74%) in families that were provided application assistance were successfully enrolled compared to about a quarter (26%) of children at a comparison clinic in which families were provided a Medicaid/CHIP application but no direct enrollment assistance. Children whose families received enrollment assistance also were subsequently more likely to utilize preventive care.


Out-stationed state eligibility workers can provide enrollment assistance and preliminary eligibility determinations at hospitals, clinics, schools, and other locations within the community. As of January 2013, 35 states have out-stationed workers in hospitals, FQHC’s, public health offices or schools (Figure 6). 46  These workers can make preliminary eligibility decisions for children and pregnant women and help families enroll in coverage, thereby increasing enrollment within the communities they serve. 47  For example, in Kansas out-stationed state workers have increased enrollment by conducting outreach and enrollment assistance with the help of community partners.48  Mississippi was also able to increase enrollment among American Indians after assigning out-stationed workers to a reservation.49 

Community-based organizations (CBOs) are able to provide culturally competent and trusted information and assistance at convenient times and locations. CBOs are able to provide trustworthy assistance, tailored messaging, flexible schedules, and proximity to eligible uninsured populations.50  For certain populations, such as immigrant families, those with language or cultural differences, or those with negative past experiences with government agencies, CBOs and other local enrollment partners can serve as important trusted resources to help overcome fears and language barriers. 50  For example, the involvement of trusted community leaders in outreach activities in familiar locations like churches and housing developments was a primary contributor to high take-up of public health insurance among low-income uninsured Latino families in Massachusetts.51  Moreover, several states that achieved significant success in covering children identified strong relationships with trusted community partners and advocacy groups as important for broadening outreach, facilitating enrollment of families, and identifying opportunities for continued improvement.52  Community-based assisters also can provide sustained contact with families to ensure they successfully obtain coverage, access needed health services, and maintain coverage over time.53  Surveys also have noted that community-based assisters help reduce stigma, clarify income eligibility rules, and provide enrollment support.54 

Nearly half of states (23) fund community-based application assistors, who serve as a key enrollment avenue for eligible families. These programs provide funding to community partners to support enrollment assistance. For example, New York provides funding to a network of multilingual facilitated enroller partners, which include managed care plans and CBOs, to help individuals enroll. Reflecting this broad network of community-based assistance, only 20 percent of new enrollees apply for coverage in a traditional Medicaid office.55  Similarly, as of February 2010, California had over 20,000 Certified Application Assistants (CAAs), many of whom are multilingual and mirror the ethnic and racial composition of the communities they serve. 56  Statewide, applications submitted with the help of CAAs are over four times less likely to be incomplete (1.9% vs. 8.4%) than those submitted without assistance.56 

 5.       Facilitating renewals of coverage is important for promoting stability of coverage over time.

Gaps in Medicaid and CHIP coverage due to coverage losses at renewal increase costs and have a negative impact on quality of care. One national study estimated that 42 percent of eligible but uninsured children had been enrolled in CHIP or Medicaid in the prior year but had lost coverage because of fluctuations in income or failure to renew coverage.57  In addition, before implementing several renewal simplifications in 2011, South Carolina found that each year, about 140,000 children were losing coverage, with 90,000 returning within the year—60,000 of whom were returning within one month.58  A study of California’s Medi-Cal program also found that approximately 1 in 5 children disenrolled and subsequently reenrolled in the program during the three-year study period, often within a short time frame.59  This churning onto and off of coverage increases costs; creates burdens for administrative staff, families, and providers; and has a negative impact on quality of care.60  One 2005 study estimated that California spent over $120 million annually to reenroll children previously covered in Medicaid or CHIP.61  Further, in 2002, Medicaid managed care organizations in Virginia and Rhode Island estimated that churning in coverage cost between $230,000 and $286,000 annually. 62  For families, evidence suggests that even brief periods without coverage has a negative impact on health.62  Children with interrupted coverage are less likely than those who are continuously insured to seek preventive health services and are more likely to delay care or have an unmet medical care need.63 

Extending the length of time between renewals and providing continuous eligibility help families maintain stable coverage.64  For example, Washington experienced sharp declines in enrollment of children when it moved from a twelve to six-month renewal period; however, enrollment quickly rebounded when the state returned to a twelve-month renewal period and instated a continuous eligibility policy (Figure 7)64  All but two states now use a 12-month renewal period for children in their Medicaid and CHIP programs, while six states still require parents to renew coverage every six months.65  States also have the option to implement 12-month continuous eligibility for children’s coverage, which guarantees coverage for enrolled individuals for 12 months, regardless of fluctuations in income. Continuous eligibility has been shown to improve retention in Medicaid and CHIP and reduce the administrative costs associated with reenrollment.66  More than half (32) states use 12-month continuous eligibility for children in their Medicaid or CHIP programs.67  However, states do not have the option to provide 12-month continuous eligibility to adults.

Simplifications in renewal procedures, often through use of technology and electronic data matches, support increases in retention. States are increasingly providing new options for families to renew coverage, including by phone and online (Figure 8), as well as using electronic data matches to verify eligibility criteria at renewal.68  For example, Louisiana implemented an administrative renewal process in 2005, which automatically renewed coverage for some families based on electronic data links to state databases. Following implementation of this policy, the proportion of children in CHIP who lost coverage at renewal due to procedural or administrative reasons fell from 17 percent to less than 1 percent.69  Moreover, as of January 2013, three states have adopted the Express Lane Eligibility (ELE) option to use data from other state agencies to renew children’s Medicaid or CHIP coverage. Following the implementation of ELE at renewal in South Carolina, the state renewed coverage for about 80,000 children in just nine months.70 

Coordinating transitions between Medicaid and CHIP helps maintain children’s coverage. Approximately 2.4 million children transition between Medicaid and CHIP each year and are more likely to experience gaps in coverage as their eligibility transitions from one program to another.70  There is widespread evidence suggesting that states can minimize coverage losses as families move between programs by coordinating program rules and renewals.70  For example, an evaluation of CHIP programs in ten states found that Medicaid expansion programs and those with separate CHIP programs where coverage was coordinated with Medicaid were less likely to have children disenroll from coverage.70  North Carolina, which coordinated renewals between the two programs and jointly reviewed eligibility for Medicaid and CHIP, had the highest Medicaid coverage rates and lowest uninsured rates among its CHIP disenrollees.70  In Iowa, after an electronic referral process was implemented to transfer children from Medicaid to CHIP when family income increased, referrals between the programs increased more than threefold, and there was a reduction in the volume of paperwork for eligibility workers to process.70 

LOOKING AHEAD

The ACA will significantly increase coverage options through an expansion in Medicaid and the creation of new health insurance exchange marketplaces in 2014. These new coverage opportunities offer the potential to significantly reduce the number of uninsured. However, the Supreme Court ruling on the ACA effectively made the Medicaid expansion a state option, and, in states that do not expand Medicaid, poor adults will not gain a new coverage option and likely remain uninsured.

Regardless of state decisions to expand Medicaid, the ACA will establish new streamlined eligibility, enrollment, and renewal policies as of 2014. For most non-disabled individuals, financial eligibility for Medicaid will be based solely on income, eliminating the need for applicants to provide documentation of assets. The ACA also establishes a streamlined, integrated, technology-driven enrollment process for Medicaid, CHIP, and exchange coverage. For example, states will be required to provide multiple options for families to enroll, including in-person, by mail, by phone, and online. States also must attempt to verify eligibility criteria through electronic data matches with other data sources to the greatest extent possible, which will help minimize documentation burdens and barriers for families. In addition, states will be required to provide a 12-month renewal period for many Medicaid-eligible groups and must seek to renew coverage based on available information before requesting information from a family. Lastly, states must create coordinated eligibility and enrollment systems across the various coverage programs to facilitate transitions in coverage. Many of the new enrollment and renewal requirements under the ACA build on the key lessons identified here as strategies to facilitate enrollment and improve retention in coverage, and experience suggests that these new requirements will help alleviate many historic barriers families faced to enrolling in and maintaining coverage.

Even with new streamlined enrollment processes in place, a broad range of outreach and enrollment strategies, including targeted approaches for specific populations, will be important to reach and enroll eligible individuals. The existing research and experience highlighted here points to the need for diverse outreach messages and strategies to help educate families about the availability of coverage and communicate their eligibility for different new coverage options. While broad-based messages through mass media will be important, targeted approaches will also be vital to help reach and enroll hard-to-reach groups such as individuals with LEP, individuals in immigrant families, and individuals living in rural areas. Past experience suggests it will be important for states and the federal government to build partnerships and maximize the use of ethnic media, CBOs, and other trusted individuals, such as those in the faith-based community to reach out to uninsured families.

One-on-one enrollment assistance provided by trusted individuals within the community will be key for translating the coverage expansions into increased coverage. As demonstrated by past experience, ensuring adequate direct one-on-one assistance will be available through a diverse range of assisters who can provide culturally competent, trusted assistance in languages spoken by the individuals they serve will be a fundamental component of successful enrollment efforts. Moreover, a recent survey of low-income uninsured individuals found that nearly 8 in 10 (77%) say they would want in-person assistance to apply for Medicaid coverage in 2014.70  The ACA establishes consumer assistance resources and requirements, including varied programs to provide in-person assistance.70  However, resources to support this assistance will be varied across states. Moreover, coordinating outreach and enrollment efforts between assistance programs and across different coverage types will likely be challenging. These challenges will be amplified in states that do not expand Medicaid, where there will remain a coverage gap for poor adults. In these states, it will be important to determine how these adults and other individuals who remain ineligible for coverage, including undocumented immigrants, can be directed to safety-net resources for care if they attempt to apply for coverage.

In conclusion, Medicaid and CHIP are important coverage programs for millions of low-income Americans, and they have been important contributors to a reduction number of uninsured, particularly for children. State experiences with outreach and enrollment in Medicaid and CHIP indicate that families value the programs, but can face numerous barriers to enrollment. The ACA provides historic new coverage opportunities as well as new tools and policies to reduce barriers to enrollment. However, even with new simplified processes in place, outreach and assistance provided through trusted individuals within the community will remain important for reaching and enrolling eligible individuals, particularly among hard-to-reach groups. Major education and outreach efforts about new coverage options will begin in Summer 2013 in preparation for the October 1, 2013 open enrollment date for the new exchange marketplaces. However, it is important to recognize that enrollment into new coverage options will likely be a long-term effort. As such, it will be important for there to be adequate resources for outreach and enrollment over time to identify and utilize lessons learned as new enrollment efforts and experiences unfold.

 

Endnotes

  1. G. Kenney, et al. “Medicaid/CHIP Participation Among Children and Parents.” December 2012. http://www.rwjf.org/en/research-publications/find-rwjf-research/2012/12/medicaid-chip-participation-among-children-and-parents.html. ↩︎
  2. Ibid. ↩︎
  3. G. Kenney, et al., 2012 ↩︎
  4. “Covering Uninsured Children: Reaching and Enrolling Citizen Children with Non-Citizen Parents.” KCMU. http://modern.kff.org/uninsured/7845.cfm. ↩︎
  5. J. Hudson. “Families with Mixed Eligibility for Public Coverage: Navigating Medicaid, CHIP, and Uninsurance.” Health Affairs. 28.4. (August 2009) ↩︎
  6. B. Sommers & A. Epstein. “Medicaid Expansion – The Soft Underbelly of Health Care Reform?” NEJM. November 2010. 363.22. ↩︎
  7. Ibid. ↩︎
  8. Ibid.  ↩︎
  9. Lake Research Partners, 2011.  ↩︎
  10. “Medicaid and Children: Overcoming Barriers to Enrollment. Findings from a National Survey.” Kaiser Commission on Medicaid and the Uninsured. January 2000. http://modern.kff.org/medicaid/2174-index.cfm ↩︎
  11. Ibid. ↩︎
  12. Lake Research Partners, June 2012 ↩︎
  13. Ibid. ↩︎
  14. “Medicaid and Children: Overcoming Barriers to Enrollment. Findings from a National Survey.” Kaiser Commission on Medicaid and the Uninsured. January 2000. http://modern.kff.org/medicaid/2174-index.cfm ↩︎
  15. Lake Research Partners, 2011. ↩︎
  16. Lake Research Partners. Preparing for 2014: Findings from Research with Lower-Income Adults in Three States. June 2012.  ↩︎
  17. Ibid.  ↩︎
  18. Finkelstein, A, et al. “The Oregon Health Insurance Experiment: Evidence from the First Year.” July 2011. http://www.nber.org/papers/w17190. ↩︎
  19. Faces of the Medicaid Expansion: How Obtaining Coverage Impacts Low-Income Adults. KCMU. January 2013. http://modern.kff.org/medicaid/8404.cfm ↩︎
  20. Perry, M. and J. Paradise, 2007. ↩︎
  21. “Next Steps in Covering Uninsured Children: Findings from the Kaiser Survey of Children’s Health Coverage.” January 2009. http://modern.kff.org/uninsured/7844.cfm ↩︎
  22. Lake Research Partners, 2011. ↩︎
  23. Lake Research Partners, 2011. ↩︎
  24. Edwards, J., Rodin, D., and S. Artiga, “Profiles of Medicaid Outreach and Enrollment Strategies: One-on-One Assistance through Community Health Centers in Utah,” Kaiser Commission on Medicaid and the Uninsured, March 2013, http://modern.kff.org/medicaid/issue-brief/profiles-of-medicaid-outreach-and-enrollment-strategies-one-on-one-assistance-through-community-health-centers-in-utah/↩︎
  25. Willams and Rosenbach, 2007. ↩︎
  26. National Association of Community Health Centers. “Promising Practices #5. Innovative CHIP/Medicaid Outreach and Enrollment Strategies.” http://www.nachc.com/client/Promising%20Practices%205%20FINAL.pdf ↩︎
  27. M. Rickard  “School Superintendents’ Perceptions of Schools Assisting Students in Obtaining Public Health Insurance.” Journal of School Health. 81.12 (December 2011) ↩︎
  28. Woolridge, J.  “Covering Kids and Families Evaluation: A Continuing Program for Increasing Insurance Coverage Among Low-Income Families.” (June 2010). ↩︎
  29. M. Cousineau et al. “Measuring the Impact of Outreach and Enrollment Strategies for Public Health Insurance in California” Health Services Research. 2011 ↩︎
  30. KCMU. Overcoming Barriers to Enrollment. Findings from a National Survey. January 2000.  ↩︎
  31. Ibid.  ↩︎
  32. Community Health Center Network. Member Retention Top Priority. December 2011. http://chcnetwork.org/member-retention-top-priority/ ↩︎
  33. KCMU and United Hospital Fund, 2002.  ↩︎
  34. Dunkelberg, A. and M. O’Malley. “Children’s Medicaid and SCHIP in Texas: Tracking the Impact of Budget Cuts. Kaiser Commission on Medicaid and the Uninsured. July 2004. http://modern.kff.org/medicaid/7132.cfm ↩︎
  35. Lake Research Partners, 2011. ↩︎
  36. Heberlein, M. et al, 2013. ↩︎
  37. “Oklahoma Health Care Authority launches online Medicaid enrollment.” June 2012. http://h20195.www2.hp.com/v2/GetPDF.aspx/4AA3-9191ENW.pdf ↩︎
  38. Ross, D., 2010.  ↩︎
  39. Heberlein, M. et al, 2013. ↩︎
  40. Horner, D. et al. “Building an On-Ramp to Children’s Health Coverage: A Report on California’ Express lane Eligibility Option.” The Children’s Partnership and KCMU. http://modern.kff.org/medicaid/7173.cfm ↩︎
  41. “Optimizing Medicaid Enrollment: Spotlight on Technology- Louisiana’s Express Lane Eligibility.”  http://modern.kff.org/healthreform/8088.cfm ↩︎
  42. Wachino and Weiss, 2009. ↩︎
  43. Ibid.  ↩︎
  44. Rosenbach et al. 2007. ↩︎
  45. Flores  et al, 2005. ↩︎
  46. Heberlein, M. et al, 2013. ↩︎
  47. Williams and Rosenbach, 2007. ↩︎
  48. Miller, C. “KATCH-ing the Uninsured: Lessong from Kansas’ Out-stationed Eligibility Workers. Enroll America.  http://www.enrollamerica.org/blog/katch-ing-the-uninsured-lessons-from-kansas-out-stationed-eligibility-workers ↩︎
  49. Williams and Rosenbach, 2007. ↩︎
  50. Chung, P, et al. “Trusted Hands: The Role of Community-Based Organizations in Enrolling Children in public Health Insurance Programs.” The Colorado Trust. February 2010. ↩︎
  51. Abreu and Hynes 2009  ↩︎
  52. J. Guyer, T. Brooks, and S. Artiga, January 2012. ↩︎
  53. Abreu and Hynes, 2009.  ↩︎
  54. Goldstein, 2010. ↩︎
  55. Cadogan, M. “Connecting New York City’s Uninsured to Coverage: A Collaborative Approach to Reaching Residents Eligible for Public Health Insurance but not Enrolled.” NYC Human Resources Administration Office of Citywide Health Insurance Access. May 2010. ↩︎
  56. California Healthy Families Program Enrollment Entities and Certified Application Assistant Program Information Available at: http://www.healthyfamilies.ca.gov/EEs_CAAs/Forms.aspx#CAA_Agreement↩︎
  57. Wachino and Weiss, 2009  ↩︎
  58. “Using Data and Technology to Drive Process Improvement in Medicaid and CHIP: Lessons from South Carolina.” KCMU. http://modern.kff.org/medicaid/quicktake_using_data.cfm ↩︎
  59. Fairbrother, G. and J. Schuchter. “Stability and Churning in Medi-Cal and Healthy Families.” March 2008 ↩︎
  60. Thompson, F. “Children and the Take-Up Challenge: Renewal Processes in Medicaid and CHIP.” February 2003. ↩︎
  61. Fairbrother, and Schuchter, 2008.  ↩︎
  62. Ku, L. and D. Cohen Ross. “Staying Covered: The Importance of Retaining Health Insurance for Low-Income Families.” The Commonwealth Fund. December 2002.  ↩︎
  63. “Retaining Eligible Children and Families in Medicaid and SCHIP” June 2003.  ↩︎
  64. Rosenbach, 2007. ↩︎
  65. Heberlein, M. et al, 2013. ↩︎
  66. Program Design Snapshot: 12-Month Continuous Eligibility. Center for Children and Families. March 2009.  ↩︎
  67. Heberlein, M. et al, 2013. ↩︎
  68. Ibid. ↩︎
  69. Wachino and Weiss, 2009 ↩︎
  70. “Using Data and Technology to Drive Process Improvement in Medicaid and CHIP.” ↩︎

U.S. Funding for Global Health: The President’s FY 2014 Budget Request

Published: May 23, 2013

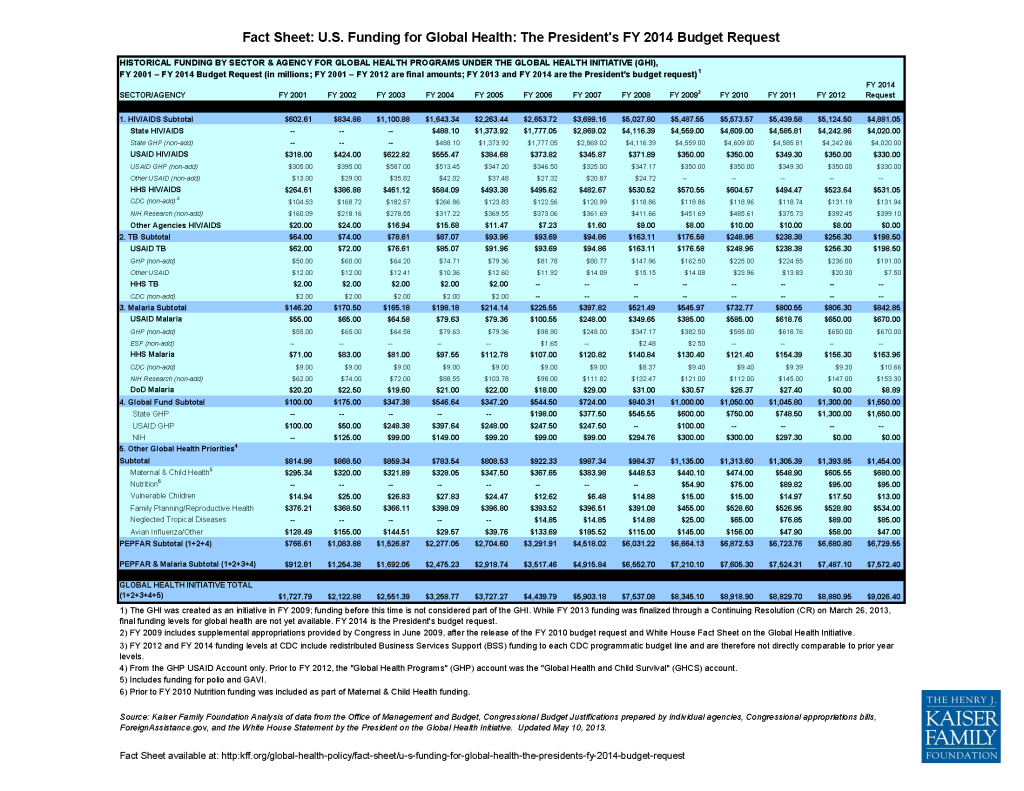
President Obama’s Fiscal Year (FY) 2014 federal budget request, released on April 10, includes an estimated $9.0 billion for global health programs under the Global Health Initiative (GHI).1  This would represent a 1.6% increase ($145 million) above FY 2012, which totaled $8.9 billion.2  Because funding for the current fiscal year, 2013, was only recently completed through a Continuing Resolution (CR) (signed by the President on March 26, 2013), which continued funding at FY 2012 levels for many programs, although made changes to others, and includes rescissions and a mandated sequestration, funding levels are not yet available for most global health programs; therefore comparisons made here are between the FY 2014 budget request and FY 2012, unless otherwise noted.3  Detailed data for FY 2009-FY 2014 are provided in Table 1.

Understanding the Global Health Budget

Figure 1: Global Health Funding, FY 2001-FY 2014

The U.S. government provides funding for global health programs through several agencies and multiple accounts. The agencies include the Department of State, U.S. Agency for International Development (USAID), National Institutes of Health (NIH), Centers for Disease Control and Prevention (CDC), and the Department of Defense (DoD).4  The main accounts are Global Health Programs (GHP), Development Assistance (DA), Economic Support Fund (ESF), and International Organizations and Programs (IO&P), all of which are managed by the State Department and USAID.5 

In 2009, President Obama launched the Global Health Initiative (GHI), which acts as an “umbrella” over most but not all existing U.S. global health programs, accounting for more than 80% of the U.S. global health funding investment.6   The GHI brings together several different existing funding streams for global health, most of which are designated by Congress for specific global health activities but which have not historically been aggregated into a single “global health budget.”7  These include funding for: HIV/AIDS, tuberculosis (TB), and the Global Fund to Fight AIDS, Tuberculosis and Malaria (Global Fund) under the President’s Emergency Plan for AIDS Relief (PEPFAR); malaria, including the President’s Malaria Initiative (PMI); neglected tropical diseases (NTDs); maternal, newborn and child health (MNCH); family planning and reproductive health (FP/RH); and nutrition.

The GHI funding umbrella does not include all U.S. funding for global health. For instance, some funding for MNCH, nutrition, and FP/RH; funding for water, sanitation, and hygiene (WASH) programs; funding for health projects under the Millennium Challenge Corporation (MCC); and most global health activities carried out by the Department of Defense (DoD) are not included in its total. Since these funding amounts are usually determined at the agency level, and may not be earmarked by Congress, they are not included in this analysis.

Funding for global health is entirely discretionary, determined annually by Congress during the appropriations process. Since there are five U.S. government (USG) departments and agencies that receive appropriations for global health programs – United States Agency for International Development (USAID), Department of State, National Institutes of Health (NIH), Centers for Disease Control and Prevention (CDC), and Department of Defense (DoD) – funding is subject to multiple appropriations bills and Congressional appropriations subcommittees.

Status of the FY 2013 Global Health Budget8 

While Congress finalized FY 2013 appropriations prior to release of the FY 2014 budget request, funding amounts for most programs are not yet known, in part due to the impacts of sequestration. Additionally, the only global health funding levels specified by Congress for FY 2013 were HIV bilateral funding ($4,070 million) through the Department of State, funding for the Global Fund ($1,650 million), and a topline global health funding level at USAID ($2,756 million), without specific funding levels by programmatic area. Due to uncertainty in FY 2013 final funding levels, all FY 2014 comparisons are to FY 2012 levels.

FY 2014 Global Health Budget Snapshot8 

  • The FY 2014 budget request for global health of $9.0 billion represents an increase of $145 million, or 1.6%, above FY 2012 levels.
  • The majority of global health funding in the FY 2014 budget request is directed to the State Department ($5.7 billion), followed by USAID ($2.7 billion).   The Department of Health and Human Services, through NIH and the CDC, receives the third highest share ($0.7 billion) in the FY 2014 request, and a small amount goes to the Department of Defense.
  • The majority of global health funding is provided through bilateral programs, which account for 78% ($7.1 billion) of the FY 2014 budget request.
  • $2.0 billion of the global health FY 2014 budget request, or 22%, is for contributions to multilateral organizations including the Global Fund, the Global Alliance for Vaccines and Immunisation (GAVI), the International AIDS Vaccine Initiative (IAVI), and the Joint United Nations Programme on HIV/AIDS (UNAIDS). U.S. contributions to the Global Fund ($1.65 billion) account for the largest share of multilateral funding in the request.
  • Funding for PEPFAR, which includes HIV/AIDS, TB, and the Global Fund, totals $6.7 billion, or 75%, of the global health budget request. This represents an increase of $49 million, or 0.7%, above FY 2012 PEPFAR totals, but is $142 million below the highest level of funding in FY 2010.

FY 2014 Global Health Budget by Program Area[footnote KFFAnalysis FY14CBJ FtFGuide]

GHI activities are focused on 9 program areas. In some, but not all areas, funding is provided by multiple agencies and/or accounts. In the FY 2014 budget request, funding for these areas is as follows:

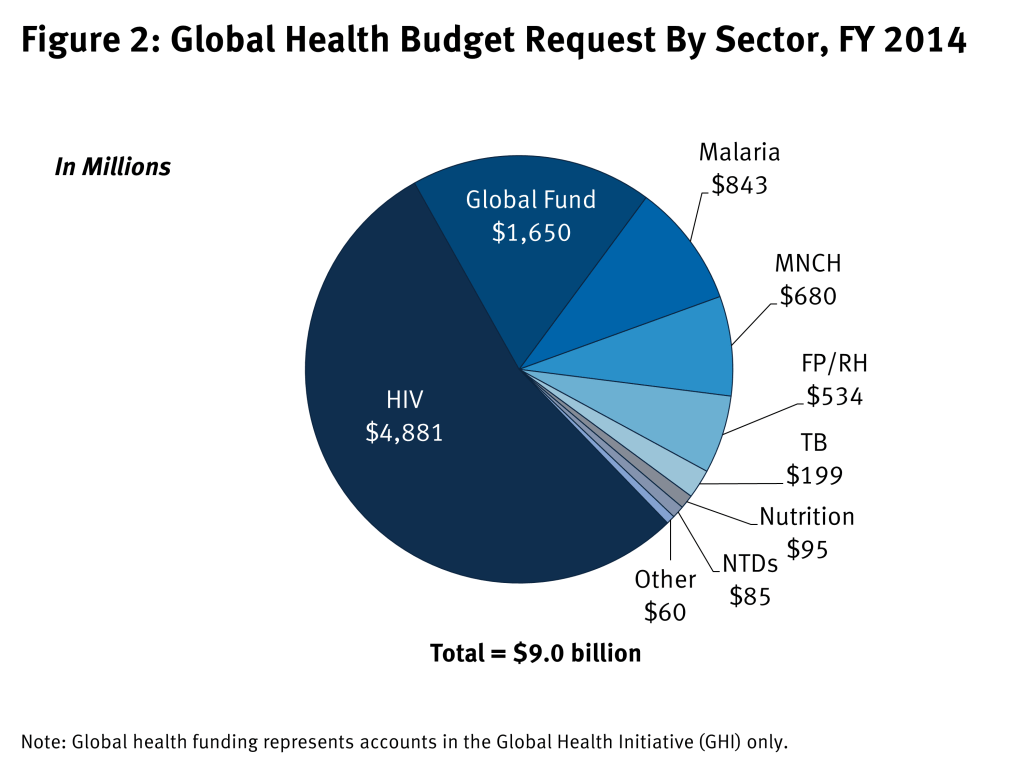
Figure 2: Global Health Budget Request By Sector, FY 2014
  • HIV/AIDS: Funding for bilateral HIV/AIDS totals $4.9 billion in the FY 2014 budget request, a decrease of $243 million (5%) below FY 2012. HIV/AIDS funding, part of PEPFAR, comprises the largest portion (54%) of the global health budget.  The majority of funding for HIV/AIDS is provided to the State Department ($4.0 billion) followed by NIH ($399 million), USAID ($330 million), and the CDC ($132 million).
  • TB: Funding for bilateral TB totals $199 million, a decrease of $58 million (23%) below FY 2012, the largest percentage decrease among all global health program areas and the lowest level of TB funding since FY 2009. All TB funding is considered part of PEPFAR and is primarily overseen by USAID.
  • Malaria: Malaria bilateral funding is $843 million in the FY 2014 budget request, an increase of $37 million (5%). The majority of this funding is directed to the President’s Malaria Initiative (PMI), first launched in 2005 and led by USAID. NIH ($153 million) and the CDC ($11 million) also receive funding dedicated to malaria activities.
  • Global Fund: The U.S. contribution to the Global Fund is $1.65 billion in the FY 2014 budget request, an increase of $350 million, or 27%, above FY 2012. Funding is provided entirely through the State Department and is used by the Global Fund to support HIV, TB, and malaria programs in low- and middle-income countries.
  • NTDs: Funding aimed at addressing NTDs is $85 million in the request, a decrease of $4 million (4%) below FY 2012.
  • MNCH: Global health funding for MNCH under the GHI is $680 million in the request, an increase of $74 million (12%) above FY 2012. This includes $175 million for GAVI.  Additional U.S. funding for MNCH efforts provided through other accounts administered by USAID and the State Department (e.g. the U.S. contribution to the United Nations Children’s Fund) is not currently counted as part of the GHI.
  • FP/RH: Global health funding for FP/RH under the GHI is $534 million in the request, an increase of $5 million (1%) over FY 2012. More than $100 million in additional U.S. funding for FP/RH efforts provided through other accounts administered by USAID and the State Department, including the $37 million U.S. contribution to the United Nations Population Fund, is not currently counted as part of the GHI.
  • Nutrition: Funding for nutrition totals $95 million in the FY 2014 request matching the FY 2012 funding level. Nutrition programs under the GHI are coordinated with the U.S. Feed the Future (FTF) Initiative.

    Figure 3: Global Health Funding, Percent Change by Sector, FY 2012-FY 2014

Looking Forward

U.S. global health programs, like many U.S. programs, face the challenge of being implemented during a time of significant budgetary uncertainty, spending scale-backs, and potential trade-offs in funding between program areas. While funding for U.S. global health programs has fared relatively well in the current budget environment, it too has been subject to funding pressures and reductions in some areas. With funding levels for FY 2013 not yet finalized for all global health programs, including the unknown impacts of sequestration, combined with continued efforts to address budgetary constraints, uncertainty over final global health funding levels remains.

Historical Funding by Sector & Agency for Global Health Programs under the Global Health Initiative (GHI), FY 2001-FY 2014 Budget Request

Kaiser’s Budget Tracker will monitor the plan as Congress considers and revises it during the budget and appropriations process.

  1. KFF analysis of data from: FY 2014 Budget of the United States and Congressional Budget Justifications; Congressional Appropriations Bills and Conference Reports; Agency operational plans; ForeignAssistance.gov; Office of Management and Budget, personal communication, April 2013. ↩︎
  2. KFF analysis of data from: FY 2014 Budget of the United States and Congressional Budget Justifications; Congressional Appropriations Bills and Conference Reports; Agency operational plans; ForeignAssistance.gov; Office of Management and Budget, personal communication, April 2013. ↩︎
  3. U.S. Congress. Public Law No: 113-6, March 26, 2013. ↩︎
  4. KFF. “The U.S. Government Engagement in Global Health: A Primer,” January 2013. ↩︎
  5. KFF. “The U.S. Government Engagement in Global Health: A Primer,” January 2013. ↩︎
  6. The White House, Office of the Press Secretary. Statement by the President on Global Health Initiative; May 5, 2009. ↩︎
  7. KFF. “The U.S. Global Health Initiative: Overview and Budget Analysis,” December 2009: http://modern.kff.org/globalhealth/8009.cfm. ↩︎
  8. U.S. Congress. Public Law No: 113-6, March 26, 2013. ↩︎

Visualizing Health Policy: The Role of Medicaid and Medicare in Women’s Health Care

Published: May 14, 2013

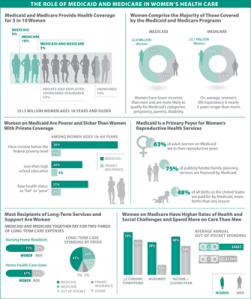
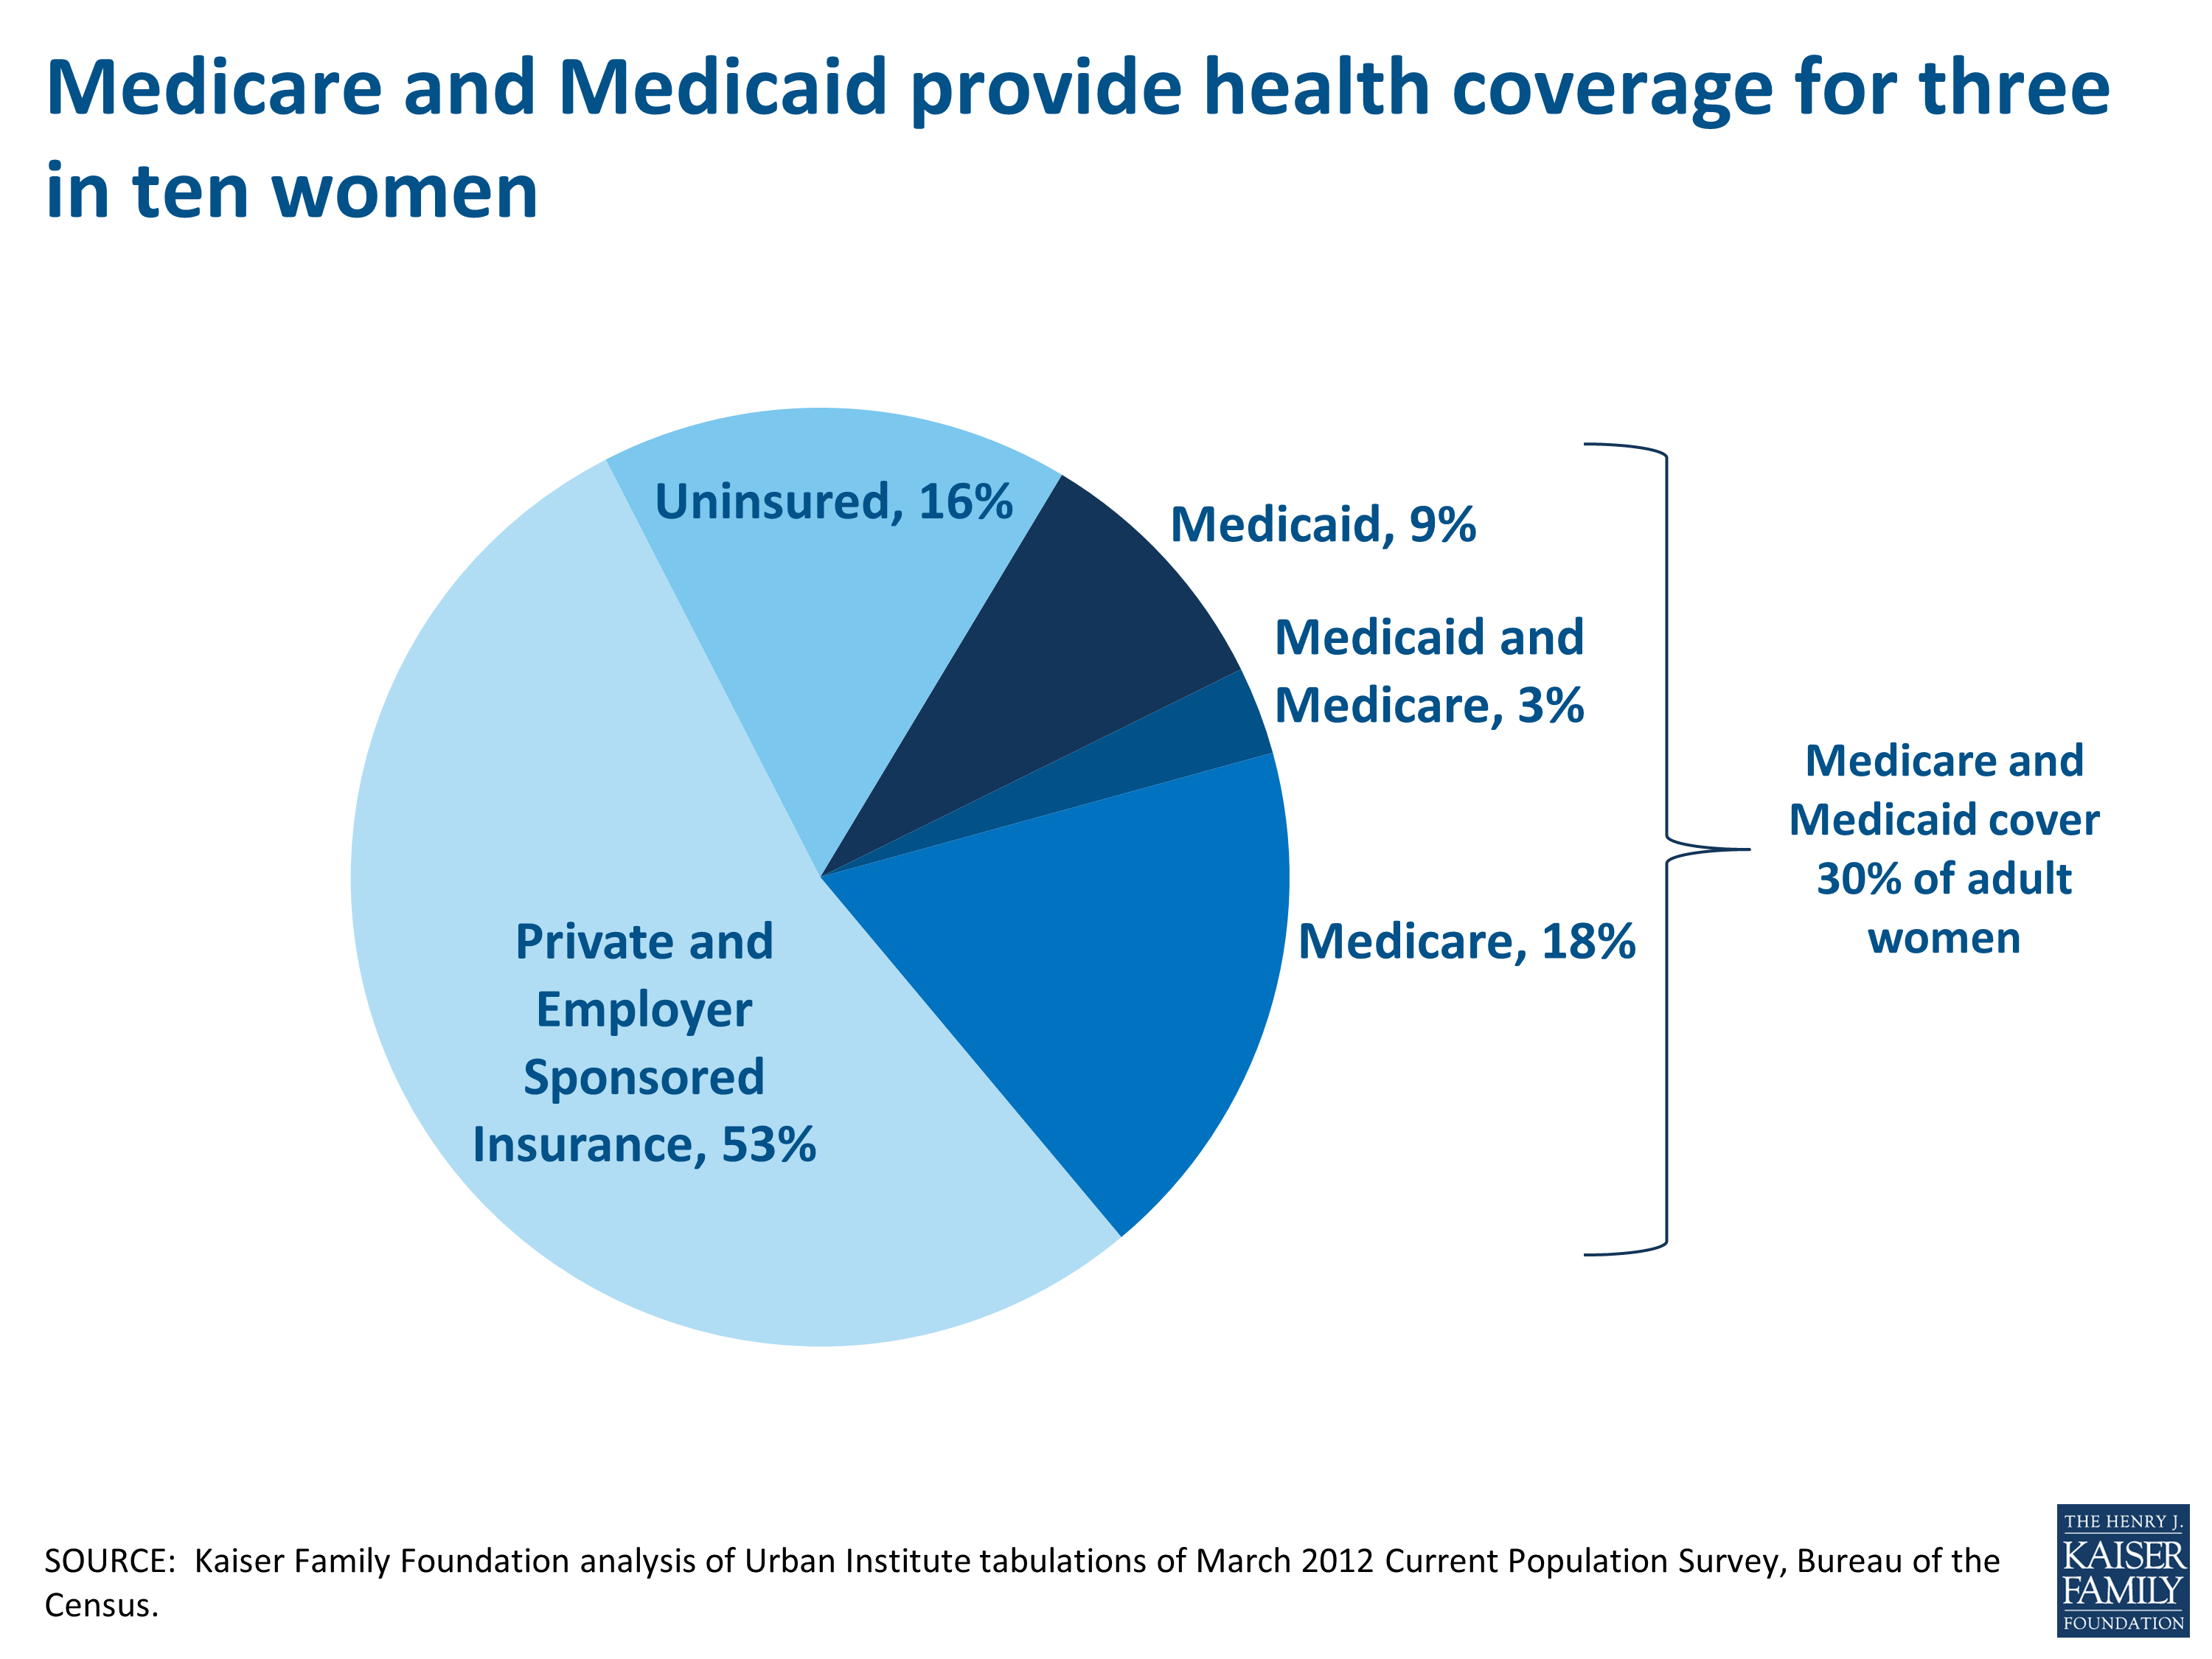
This month’s Visualizing Health Policy infographic provides information about the role of Medicaid and Medicare in women’s health care: the proportion of US women who are covered by Medicaid and Medicare; how women comprise the majority of those covered by the Medicaid and Medicare programs and the majority of those receiving long-term services and supports (such as home health care); how women on Medicaid are poorer and sicker than women with private coverage; how Medicaid is a primary payer for women’s reproductive health services; and how women on Medicare spend more than their male counterparts on medical care and also have higher rates of health problems and social challenges.

jama_infographic_women_April2013

Full-size infographic is available on the JAMA website

View the related Slideshow

Source: Kaiser Family Foundation analysis. Original data and detailed source information are available here.

Profiles of Medicaid Outreach and Enrollment Strategies: Helping Families Maintain Coverage in Michigan

Published: May 14, 2013

This brief provides insight into lessons learned from Medicaid and CHIP outreach and enrollment strategies by profiling a successful initiative of the Michigan Primary Care Association to facilitate coverage renewals through a systematic, technology-based reminder system coupled with one-on-one assistance. The brief is part of the “Getting Into Gear for 2014″ series examining key implementation issues as states prepare for the Affordable Care Act (ACA) coverage expansions.

Issue Brief (.pdf)

Financing Medicaid Coverage Under Health Reform: What is in the Law and the New FMAP Rules

Published: May 9, 2013

This brief examines the ACA law and new regulations related to the match rates for coverage under the ACA for Medicaid and Children’s Health Insurance Program. Under the ACA, the federal government will finance 100% of the costs of those newly eligible for Medicaid from 2014 through 2016 and then the federal contribution phases down to 90 percent by 2020 and beyond. States would continue to pay the traditional Medicaid match rate for increased participation among those currently eligible. Final regulations issued on April 2, 2013 specify the process by which states identify enrollees for the applicable match rate.