A Guide to the Supreme Court’s Review of the Contraceptive Coverage Requirement

Published: Dec 9, 2013

Executive Summary

Shortly after the Department of Health and Human Services (HHS) announced the new federal rule that required all new private plans to cover prescribed FDA approved contraceptive methods without cost-sharing, a number of corporations sued claiming that this new requirement violates their religious rights. These lawsuits have worked their way through the Federal Courts and, on November 26, 2013, the Supreme Court agreed to hear two cases that involve for-profit corporations. The Court agreed to hear a case from the Tenth Circuit Court of Appeals, which ruled in favor of Hobby Lobby, an Oklahoma-based chain of craft stores owned by a Christian family who claim that the contraceptive coverage requirement violates their company’s religious freedom. The Court also agreed to hear a case from the Third Circuit Court of Appeals, which ruled against the corporation and its owners, finding that Conestoga Wood Specialties, a cabinet manufacturer, does not have religious rights. The Supreme Court decided to take these cases to resolve the conflict between these two decisions and other U.S. Courts of Appeals’ rulings.

Over forty other lawsuits have been filed by for-profit secular corporations challenging the contraceptive coverage requirement. In addition, over forty religiously affiliated nonprofit corporations are also challenging the contraceptive coverage requirement claiming that the accommodation for religiously affiliated nonprofits is insufficient and still burdens their religious rights. It is likely that some of these nonprofit cases will request the Supreme Court to review these cases in future sessions. The oral argument for the Hobby Lobby and Conestoga Wood Specialties cases is scheduled to be heard in Spring 2014 and the decision will likely be announced in June 2014.

At the crux of these cases is a question that the Supreme Court has not previously addressed: Do for-profit corporations have protections under the 1993 Religious Freedom Restoration Act1  (RFRA)? If the Court finds that for-profit corporations have protections under the RFRA, then the Court will need to determine if it is a violation of the RFRA to require a business to provide insurance that includes coverage for contraceptives when that coverage violates the owners’ personal religious beliefs. The Court will also consider whether the contraceptive coverage requirement violates the First Amendment’s protection for free exercise of religion.2  The corporations’ owners have also asserted rights under the RFRA and the First Amendment. The Court will need to determine if the owners’ rights are violated by a regulation imposed on the corporation.

While the Court’s decision in Hobby Lobby and Conestoga Woods Specialties will have a direct effect on women’s access to contraceptive coverage, it may also have broader ramifications for civil rights protections in the workplace. This policy brief explains the issues raised by the cases pending, answers some key questions about the parties’ legal arguments and considers possible effects of the potential decisions.

Issue Brief: Background

In addition to expanding access to health insurance, the Affordable Care Act (ACA) requires new private plans to provide coverage for a broad range of preventive services that fall under four broad categories: evidence-based screenings and counseling, routine immunizations, childhood preventive services, and preventive services for women. Health plans with grandfathered status are not required to provide all of the benefits and consumer protections, including preventive health services, required of other health plans. Grandfathered health plans are plans that were in existence on March 23, 2010 and have stayed basically the same.

The preventive services for women that must be covered include eight additional services, identified by an Institute of Medicine expert panel. These include screening for intimate partner violence, well woman visits, breastfeeding supports as well as prescription contraceptives and services, including all methods approved by the Food and Drug Administration. In August 2011, HHS adopted these recommendations, adding these eight services to the preventive services originally included in the ACA legislation. Initially, the rule requiring coverage of contraceptives included a very narrow exemption only for houses of worship3  that object to the contraceptive coverage requirement. In February 2012, this rule was modified, giving other religiously affiliated nonprofit employers such as hospitals and universities who hold religious objections to contraceptives a one-year “safe harbor” or grace period (until August 2013), during which they did not have to comply with the regulation.

After some religious leaders called for a broader exemption, the Administration responded by modifying the rule again in July 2013 allowing religiously affiliated nonprofits to request an “accommodation.” This accommodation “protects certain nonprofit religious organizations with religious objections to providing contraceptive coverage from having to contract, arrange, pay, or refer for such coverage”4  instead requiring their insurers to bear the cost of employees’ contraceptive coverage. The accommodation is intended to release nonprofit religiously affiliated employers that oppose birth control from the requirement of paying for contraceptive coverage, and assure that the employees and their dependents are still able to obtain full coverage for contraceptives directly from the insurer as they are entitled to under the law. This “accommodation” is only available to “eligible organizations” meeting the criteria: 1) opposes providing for some or all of any contraceptive coverage on account of religious objections; 2) has nonprofit status; 3) holds itself out as a religious organization; and 4) self-certifies that it meets the first three criteria.5 

No exemption or accommodation, however, is available to for-profit employers. All for-profit employers with fifty or more employees must provide the contraceptive coverage unless they are offering coverage through a grandfathered plan. Small employers (less than fifty employees) are not penalized for not offering health insurance to their workers. However, if a small employer does provide health insurance it must cover preventive services, including contraceptives for women.

Figure 1: Contraceptive Coverage Rules

What is required to be covered?All FDA approved contraceptive methods, as prescribed, must be covered without cost-sharing. At least one version of each method must be covered, including brand-name versions if no generic option is available.
Who is required to cover contraceptives?All new private health insurance plans offering prescription drug coverage. This includes all non-group, small and large group and self-funded plans. Grandfathered plans do not have to comply with this requirement or the other insurance reforms in the ACA.
Who is exempt from the contraceptive mandate or can request an accommodation?Religious institutions defined as “houses of worship” are exempt. Women employees or dependents of those working for an employer which is exempt may not have insurance coverage for contraceptives if their employer has a religious objection to contraceptives.Religiously affiliated organizations that oppose providing contraceptive coverage due to religious objections, are nonprofit, and identify as a religious organization can request an accommodation. These organizations must self-certify that they are eligible organizations and will be granted an accommodation so they are not required to purchase contraceptive coverage, but employees and their dependents will still have access to contraceptive coverage through insurance companies or third party administrators without cost-sharing.
How do employees of organizations with accommodations obtain contraceptive coverage?Insurance companies are required to cover the cost of contraceptives for employees of religiously affiliated organizations that have requested an accommodation at no cost to the employees or the employers.Third-party administrators of self-funded health plans must provide or arrange payments for contraceptive coverage for the workers of the employer requesting the accommodation and offset the costs of the contraceptive coverage by payment reductions in the fees paid to the federal exchange.6 

Issue Brief: Legal Challenges

Since HHS issued the regulation regarding preventive services for women, over eighty corporations have filed lawsuits challenging the contraceptive coverage requirement. Some of these corporations are challenging the requirement that they cover the full range of contraceptives while others are contesting providing coverage for emergency contraception, finding it to be objectionable because they believe it is an abortifacient, despite its classification as a contraceptive by the FDA. The legal challenges fall into two groups: those filed by for-profit corporations and those filed by nonprofit organizations. More than forty cases have been filed by for-profit corporations and their owners who are claiming that 1) the requirement that they provide health insurance coverage for their employees which includes contraceptives violates their constitutional rights under the First Amendment to free exercise, speech and association, and 2) they have been unjustly burdened under the Religious Freedom Restoration Act (RFRA). Religiously affiliated nonprofit organizations are also making claims under the First Amendment and the RFRA. The RFRA was enacted in 1993 to protect “persons” from generally applicable laws that burden their free exercise of religion.

The two cases that will be heard by the Supreme Court pose a fundamental question whether the guarantee of the free exercise of religion applies to secular for-profit corporations. The for-profit corporations challenging the women’s preventive health care requirements are owned by religious families who believe they are running their businesses in line with their faith, and their religious views impart to their businesses. Both the owners and the corporations are contending that their rights are violated under the RFRA and the First Amendment.

Hobby Lobby Stores, Inc. and Conestoga Wood Specialties, Corp.

The Supreme Court is reviewing the legal challenges brought by Hobby Lobby Stores Inc. and Conestoga Wood Specialties, Corp. The Green family, Protestants of Oklahoma, owns Hobby Lobby, a national chain of craft stores, and Mardel, a chain of book stores. The Greens contend they operate their businesses in line with their faith and that their religious beliefs prohibit them from providing health insurance coverage for Ella and Plan B (emergency contraceptives) and IUDs. Hobby Lobby currently operates 514 stores in over 41 states, and has 13,240 employees. Mardel, Inc. has 35 stores in 7 states and has 372 full-time employees. The Tenth Circuit ruled on June 27, 2013 that Hobby Lobby is likely to succeed on the merits of the RFRA claim. Conestoga Wood Specialties Corporation is a for- profit corporation owned by the Hahn family, practicing Mennonites of Pennsylvania. Conestoga manufactures cabinets and has 950 full time employees. The Hahn family opposes providing insurance coverage for Plan B and Ella. In this case, on July 26, 2013, the Third Circuit ruled against Conestoga Wood Specialties and the Hahn family.
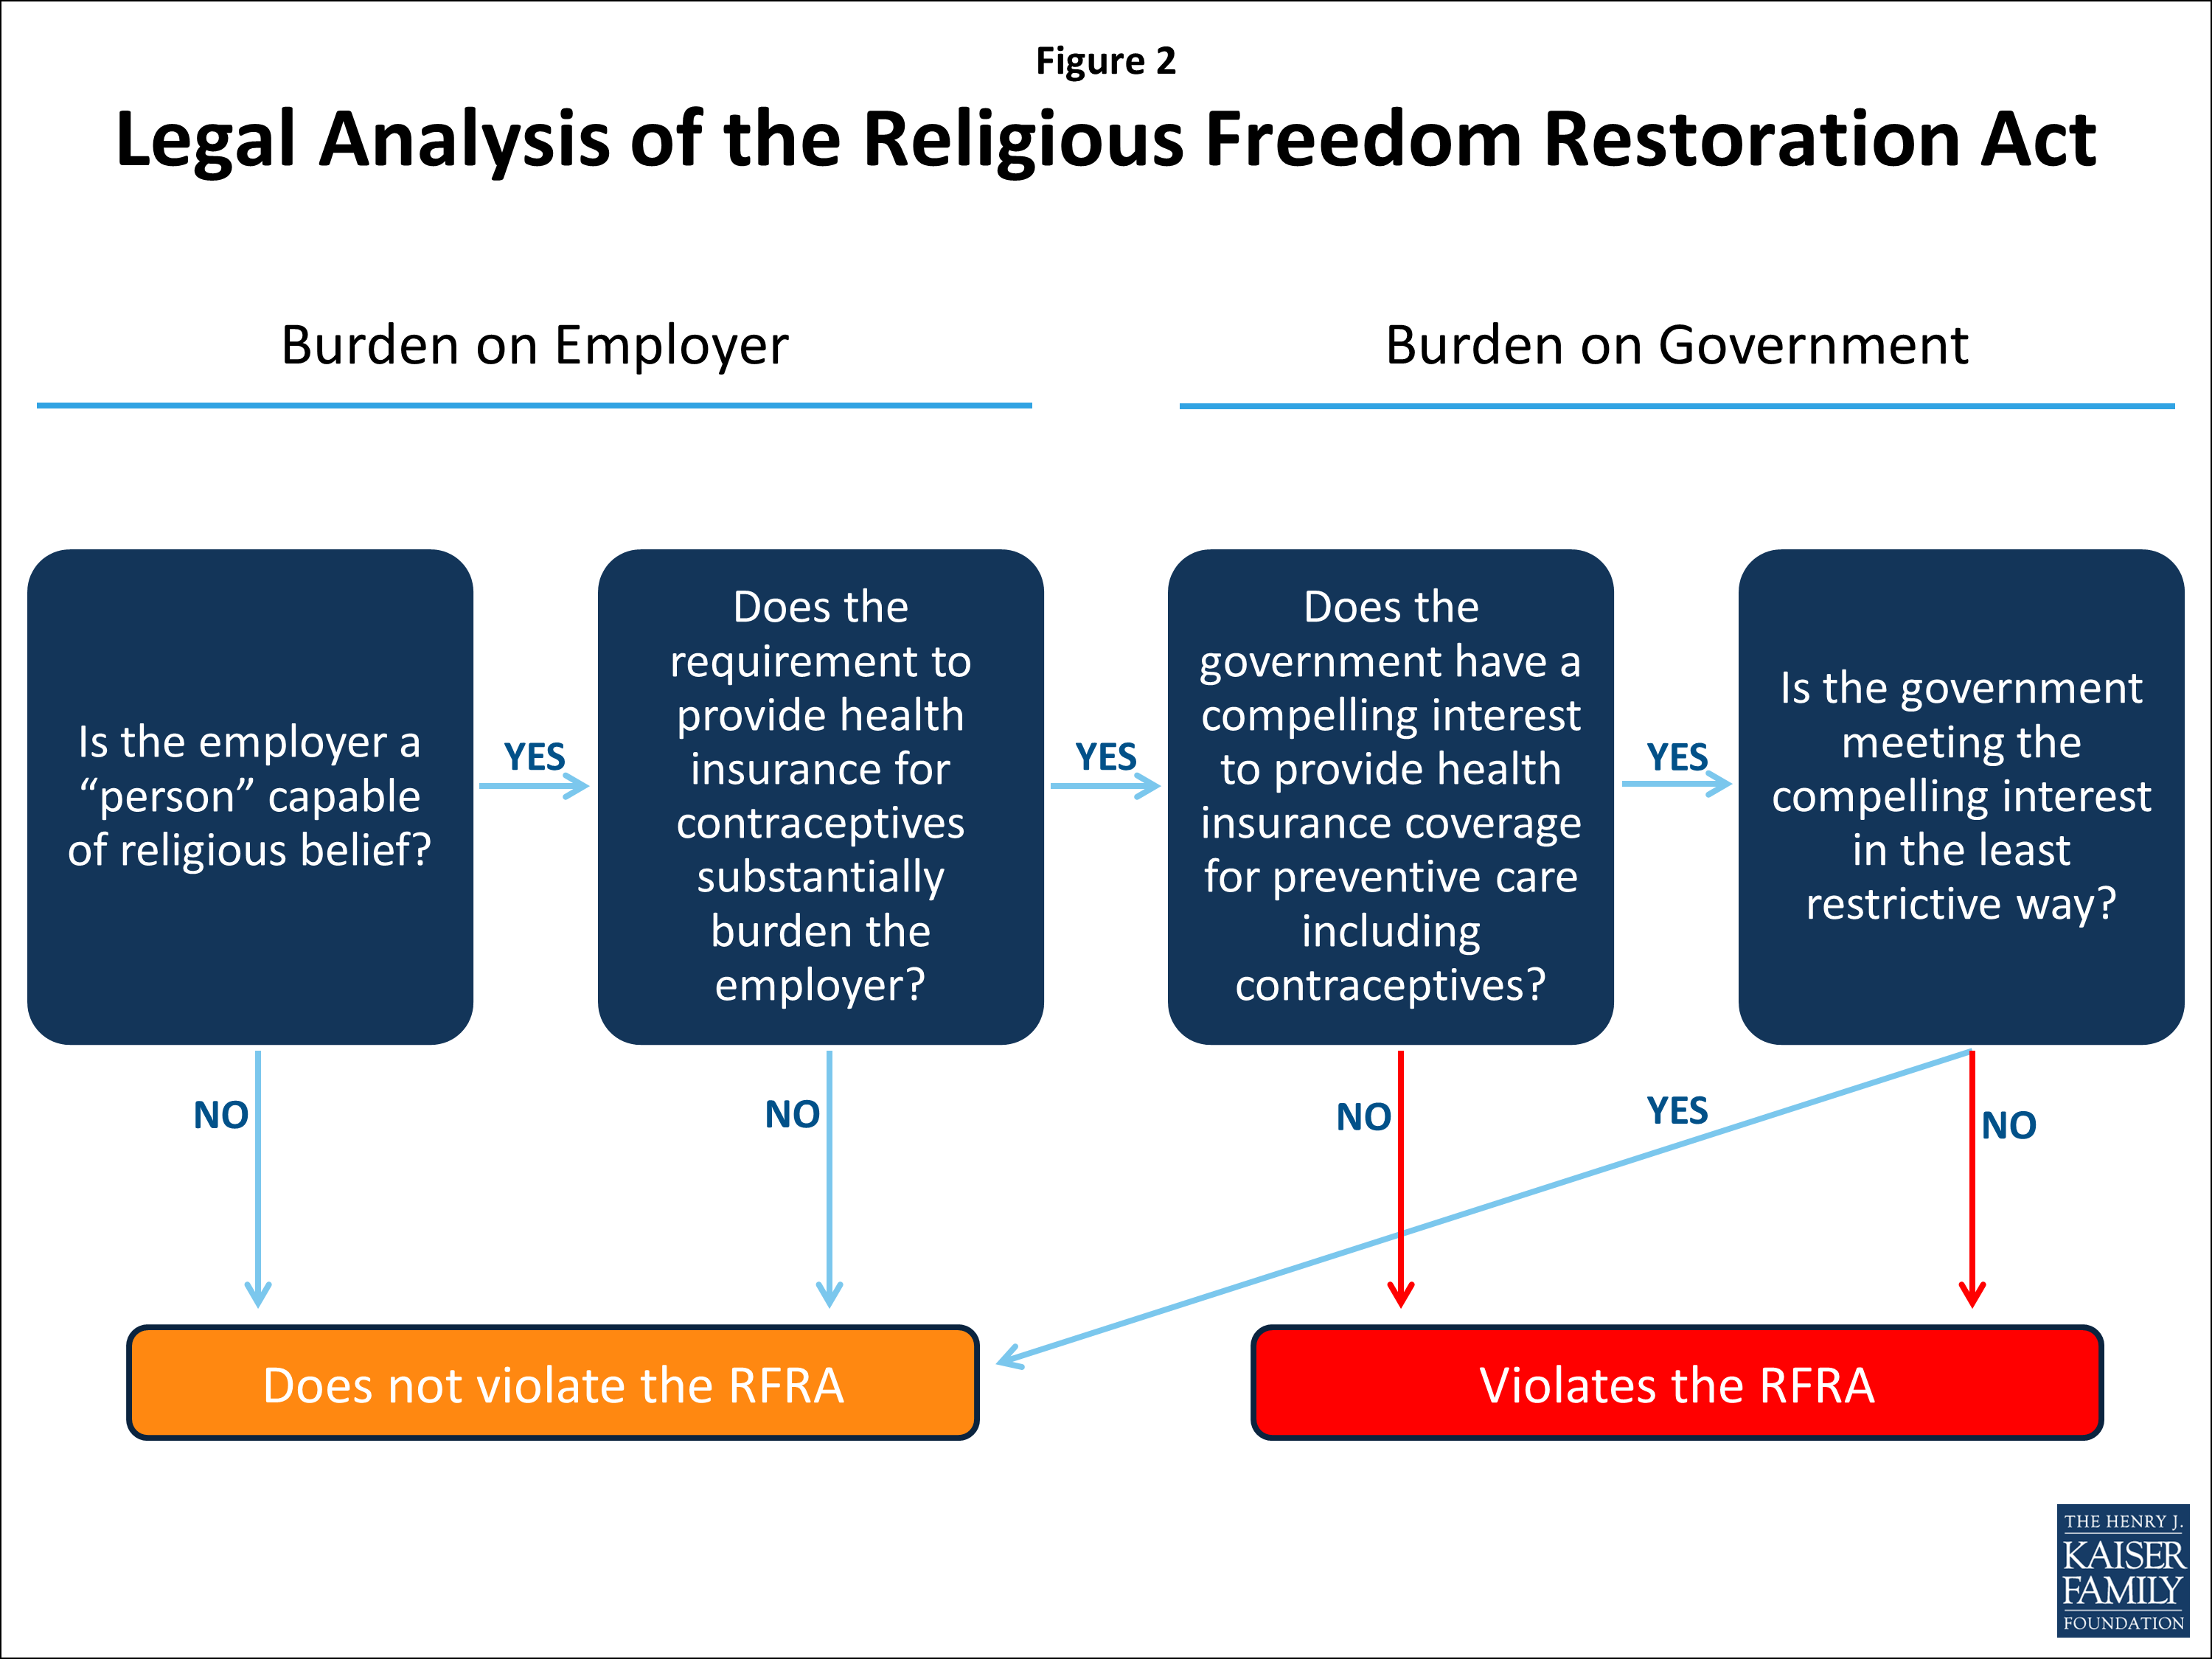
8523 - Contraceptive Coverage Figure 2

Five federal circuit courts have issued rulings on the RFRA and constitutional challenges brought by the owners and the corporations: the Third, Sixth, Seventh, Tenth, and D.C. Circuit.7  (See Appendices A and B) Like the Third Circuit, the Sixth Circuit also ruled that the corporation has no religious rights, and the owners could not challenge the law on their own. However, in line with the Tenth Circuit, the DC Circuit ruled that the owners, but not the corporation, were likely to succeed on the merits. The Seventh Circuit ruled that both the corporation and the owners were likely to succeed on the merits of the RFRA challenge. After the Supreme Court rules on Hobby Lobby and Conestoga Woods Specialties, the lower courts will apply this decision to the other pending cases.

The Religious Freedom Restoration Act of 1993, which the corporations claim is violated by the contraceptive coverage requirement, was intended to protect people from laws that burden their exercise of religion. In other words, the Act requires the government to show the law in question, in this case the requirement that plans include coverage of all prescribed FDA approved contraceptives, furthers a “compelling interest” in the “least restrictive means” when it “substantially burdens a person’s exercise of religion.”

The Court must consider a series of threshold questions in deciding whether the contraceptive coverage requirement is in violation of the RFRA (Figure 2). The first threshold question that must be met in these cases is: Can a for-profit corporation be defined as a “person” capable of religious expression under the RFRA? The owners of the corporations are contending that their personal religious views also belong to the corporation. In addition to claiming the corporation is burdened, they are asserting that the owners are substantially burdened by the government’s requirement that the corporation, which they own, provide contraceptive coverage to their workers. They are arguing that the corporation is indistinguishable from its owners, and therefore the owners are burdened by action required by the corporation because it violates their personal religious rights. The courts must consider if the corporation or the owners are substantially burdened by this provision of the ACA. The corporations are asserting that they are left with a choice to provide the “objectionable” coverage or pay a hefty fine. If the corporation can show that it is substantially burdened, then HHS must demonstrate that it is furthering a compelling government interest in the least restrictive means.

In these cases, the government is asserting that its compelling interest is in 1) safeguarding the public health, 2) promoting a woman’s compelling interest in autonomy and 3) promoting gender equality.8  Lastly the government must show it is meeting the compelling interest in the least restrictive means. The plaintiffs contend, on the other hand, that the government cannot have a compelling interest when it does not apply this requirement equally to all employers, effectively exempting those with less than fifty employees that do not provide health insurance, grandfathered plans, and some religious organizations (houses of worship and religiously affiliated nonprofits that are eligible for an accommodation). They also argue there are less restrictive ways to accomplish the same goals including: “Provide a tax credit to employees who purchase emergency contraceptives with their own funds; Directly provide the drugs at issue or directly provide insurance coverage for them through the state and federal health exchanges; Empower willing actors – for instance, physicians, pharmaceutical companies or various interest groups to deliver the drugs and sponsor education about them; Use their own resources to inform the public that these drugs are available in a wide array of publicly-funded venues.”9 

Under the First Amendment claims that are being made under these two cases, the Court must determine if a for-profit corporation can “exercise religion.” The plaintiff corporations, Hobby Lobby and Conestoga Wood Specialties, are offering two ways that corporations can exercise religion: 1) directly relying on the Supreme Court’s recent decision in Citizens United v. Fed. Election Comm’n10 holding that “the Government may not suppress political speech on the basis of the speaker’s corporate identity,” and thus striking down a law restricting corporate political donations; and 2) under a “passed through” theory which assumes the corporation is an extension of the beliefs of the owners of the corporation.11 

Nonprofit Organizations’ Legal Challenges

While the Supreme Court is hearing two cases that involve for-profit corporations, forty-one nonprofit organizations have also filed cases challenging that the “accommodation” made by HHS is not sufficient. The nonprofits argue that when the insurer separately contracts with an employer’s workers to cover contraceptives at no cost, it remains part of the employer’s plan and is financed by the employer. While the nonprofit religious corporations may be able to demonstrate that they can “exercise religion” under the RFRA, the nonprofit corporations must then demonstrate that the regulation, even with the “accommodation,” substantially burdens their exercise of religion. Just as in the cases brought by for-profit corporations, if the nonprofit corporation can show that it is substantially burdened, then the government will then have the burden to show that the contraceptive coverage requirement is a “compelling interest” that is met in the “least restrictive means.”

Many of the nonprofit plaintiffs filed their cases before July 2013 when the final regulation was issued providing the “accommodation,” but some of the nonprofits re-filed after the regulation was finalized. Therefore, these cases are not as far along in the court system as the cases brought by for-profit corporations and are not currently before the Supreme Court.12  It is likely that some of these nonprofit cases will petition the Supreme Court for review after they make it through the U.S. Courts of Appeals, as was done by the for-profit corporations.

Issue Brief: Broader Ramifications

If the Supreme Court finds that for-profit secular corporations have religious rights or the business owners’ religious rights are burdened by a regulation imposed on the business, the implications of this ruling will likely affect contraceptive coverage for many women, and also go far beyond contraceptive coverage. They could affect employer requirements regarding employees’ health insurance benefits as well as the scope of employee protections against discrimination. A decision in favor of the corporation would mean women’s access to contraceptives would be dependent on the religious views of the owners of her employer. In the health care context, employers could ask for other exemptions based on their religious beliefs. Some business owners may have religious beliefs that conflict with blood transfusions, vaccinations, infertility treatments, psychiatry treatment and drugs, and health insurance all together.

Beyond health care, a decision allowing for-profit secular corporations an exemption from a law based on religious beliefs could have implications for the interpretation and enforcement of laws ranging from civil rights to fair housing protections. The Supreme Court’s decision in the cases of Hobby Lobby and Conestoga Wood Specialties will likely be announced in June 2014, but given the litigation that nonprofit corporations have filed and that are working their way through the courts, this may not be the final word of the Supreme Court on the contraceptive coverage requirement and the religious rights of corporations.

Appendices

Appendix A

Selected cases where the Court of Appeals found neither the corporation nor the owners have protected rights

LawsuitOwnersType of BusinessRequestDecision
Conestoga Wood Specialties Corp. v. SebeliusFiled 12/4/2012Hahn family, Mennonites of PennsylvaniaConestoga manufactures wood cabinets and has 950 full time employees.Hahns object to providing health insurance coverage for Plan B and Ella.Third Circuit found that neither the for-profit corporation nor the owners have religious rights under the RFRA or under the First Amendment.
AutoCam Corp. v. Sebelius Filed 10/8/2012Kennedy family, Roman Catholics of MichiganAutoCam, a high-volume manufacturing for automotive and medical industries, with 14 facilities worldwide and 661 employees in the U.S.Kennedys object to providing health insurance for all contraceptives, sterilization, related education and counseling.Sixth Circuit13  found that AutoCam is not a “person” capable of “religious exercise.” The Court also denied the Kennedys’ legal challenge because they are not being required to act.

Appendix B

Selected Cases14  where the Court of Appeals found the corporation or owners have protected rights

LawsuitOwnersType of BusinessRequestDecision
Hobby Lobby v. SebeliusFiled 9/12/2012Green family, Protestants of OklahomaHobby Lobby is a national chain of craft stores with over 500 stores in over 41 states and over 13,000 employees; Mardel is a chain of book stores (also owned by the Green family) with 35 stores in 7 states and 372 full- time employees.Greens object to providing health insurance coverage for Ella, Plan B, and the IUDs.Tenth Circuit15  held that Hobby Lobby and Mardel are likely to succeed on the merits of the RFRA claims. The majority opinion did not address the Green family legal challenge or any of the claims under the First Amendment.
Korte & Luitjohan Contractors Inc. v. SebeliusKorte and Luitjohan Filed 10/9/2012Grote Industries v. SebeliusFiled 10/29/2012Korte family, Catholic of Illinois (own 87% of stock of Korte and Luitjohan Contractors, Inc.) Grote family, Catholic of IndianaKorte & Luitjohan Contractors, a construction company in Illinois has 90 full time employees, 70 of whom belong to a union that sponsors their health-insurance plan. Grote Industries, Inc. a manufacturer of vehicle safety systems based in Indiana. Grote industries has 1,148 full time employees.Both families oppose providing health insurance coverage for all contraceptives, and sterilization. The Korte family is willing to provide coverage for limited situations where the drugs are being prescribed with the intent to treat certain medical conditions.Seventh Circuit found both the corporations and the owners can challenge the law under the RFRA.
Gilardi v. Department of Health and Human ServicesFiled 1/24/2013Gilardi family, Roman Catholic of Ohio (owns Freshway Foods and Freshway Logistics)Freshway Foods and Freshway Logistics -food are processing companies based in Ohio and employ about 400 employees.Gilardis oppose all forms of contraceptives and sterilization.DC Circuit found that corporations cannot “exercise religion” but owners have religious rights under the RFRA.

Endnotes

  1. U.S.C. § 2000bb et. seq. ↩︎
  2. U.S. Const. Amend. I, Free Exercise Clause: “Congress shall make no law respecting the establishment of religion or prohibiting the free exercise thereof.” ↩︎
  3. 45 CFR § 147.30 (B): “For the purposes of this subsection, a “religious employers” is an organization that meets all of the following criteria: (1) The inculcation of religious values is the purpose of the organization; (2) The organization primarily employs persons who share the religious tenets of the organization; (3) The organization serves primarily persons who share the religious tenets of the organization; and (4) The organization is a non-profit organization described in section 6033(a)(1) and section 6033(a)(3)(A)(i) or (iii) of the Internal Revenue Code of 1986 as amended.” ↩︎
  4. Federal Register, Vol. 78, No. 127, July 2, 2013 at page 39873 ↩︎
  5. 26 CFR § 54.9815-2713A; 29 CFR § 2590-2713A; 45 CFR § 147.31 ↩︎
  6. A participating issuer offering a plan through a Federally-facilitated Exchange may qualify for an adjustment in the Federally-facilitated Exchange user fee for payments made for contraceptive services for employers that self-certified for the accommodation. Adjustments of Federally-Facilitated Exchange User Fees:45 CFR § 156.50(d) and 156.80(d). ↩︎
  7. In two cases, the Eighth Circuit has granted preliminary injunctions pending appeal but without much discussion of the issues: O’Brien v. U.S. Department of Health and Human Services, Annex Medical, Inc. v. Sebelius   ↩︎
  8. Brief for the Appellees (HHS) for Hobby Lobby case in 10th Circuit Court of Appeals filed March 13, 2013, at pages 33-40. ↩︎
  9. Hobby Lobby brief appealing to the 10th Circuit Court of Appeals filed February 11, 2013 at page 47. ↩︎
  10. Citizens United v. Fed. Election Comm’n., 558 U.S. 310, 365 (2010). ↩︎
  11. See Conestoga Wood Specialties brief in Third Circuit Court of Appeals filed March 15, 2013, at pages 23 and 33. See Hobby Lobby brief in Tenth Circuit Court of Appeals filed February 11, 2013 at pages 33-4. ↩︎
  12. On December 2, 2013, the Supreme Court denied certiorari for Liberty University v. Lew.  Liberty University filed a lawsuit challenging other aspects of the ACA before the final regulations on the contraceptive coverage requirement were issued. Liberty University added the challenge to the contraceptive coverage requirement late in the litigation process. ↩︎
  13. The Sixth Circuit ruled the same way in Eden Foods Inc. v. Sebelius. ↩︎
  14. In two cases, the Eighth Circuit has granted preliminary injunctions pending appeal but without much discussion of the issues: O’Brien v. U.S. Department of Health and Human ServicesAnnex Medical Inc. v. Sebelius.     ↩︎
  15. The Tenth Circuit issued similar decisions in Armstrong v. Sebelius and Newland v. Sebelius. ↩︎

State Marketplace Profiles: California

Published: Nov 26, 2013
California

Final update made on November 26, 2013 (no further updates will be made)

Establishing the Marketplace

On September 30, 2010, former Governor Arnold Schwarzenegger (R) signed into law two complementary bills, AB 1602 and SB 900, to establish the California Health Benefit Exchange. California was the first state in the nation to pass legislation creating a health insurance Marketplace after the enactment of federal health reform.1   Current Governor Jerry Brown (D) called a special legislative session in late 2012 to allow the state to draft additional supplementary legislation to implement the Affordable Care Act (ACA) in California. In October 2012, the Marketplace announced that its new name would be ‘Covered California.’

Structure: The legislation defines California’s Marketplace as a quasi-governmental organization, specifically an “independent public entity not affiliated with an agency or department.”

Governance: Covered California is governed by a five-member board, including the Secretary of California Health and Human Services (or designee) as a voting, ex officio member, two members appointed by the Governor, one member appointed by the Senate Committee on Rules, and one member appointed by the Speaker of the Assembly. The legislation specifies that each appointed member of the Board should possess expertise in key subject areas such as, individual or small employer health care coverage, health benefits plan administration, or health care finance. While serving on the Board, members must not be affiliated in any way with a carrier or other insurer, an agent or broker, a health care provider, a health care facility or clinic, or a trade association for these entities. Also, members must not be health care providers, unless receiving no compensation for services provided.

Current Board members are:

  • Diana S. Dooley (Chair), Secretary of California Health and Human Services
  • Kimberly Belshé, First 5 LA
  • Paul Fearer, Union Bank and Pacific Business Group on Health
  • Susan Kennedy, former Chief of Staff for Governor Schwarzenegger
  • Dr. Robert Ross, The California Endowment

The Board of Covered California has been meeting monthly since April 2011 and hired an Executive Director who began on October 17, 2011. Covered California has a staff of 138 employees.

In September 2012, the Board approved the creation of three key stakeholder advisory groups meant to inform the Board’s policy decisions and shape the implementation of Covered California. Stakeholder advisory groups will include, Plan Management and Delivery System Reform; Marketing, Outreach and Enrollment Assistance; and the Small Employer Health Options Program.2   In November 2012, Covered California adopted a Tribal Consultation Policy and added a Tribal Consultation advisory group to help structure the relationship between the Tribes and Covered California, build a partnership, and maximize the participation of eligible American Indians in the Marketplace.3  In January 2013, the membership of the four stakeholder advisory groups was announced.

Contracting with Plans: The Board will selectively contract for health coverage offered through Covered California, “seek[ing] to contract with carriers so as to provide health care coverage choices that offer the optimal combination of choice, value, quality, and service.” California has experience acting as an active purchaser from other programs, such as the Children’s Health Insurance Program (CHIP), small-business purchasing pool, and the state employee purchasing pool. The legislation directs the Board to define minimum requirements that carriers must meet to be considered for participation in Covered California.

To mitigate the risk of adverse selection, carriers are required to offer at least one choice at each of the four coverage levels, whether or not they participate in Covered California. Catastrophic plans will only be offered by carriers participating in Covered California. Also, products offered through Covered California, either for individuals or small employers, must be offered to that population outside the Marketplace. Covered California permits variations in premiums based on age, family status, and geography for 16 rating areas. Covered California does not allow for premium rating based on tobacco use.

In 2012, Covered California led multiple stakeholder group sessions with consumer advocates, brokers, and business representatives to gather feedback on plan selection and design issues including, the optimal number of plans with which to contract, network criteria, out-of-pocket cost design, dental and vision coverage, and health system reform. Covered California released a draft report in July 2012 on QHP options and recommendations based largely on stakeholder feedback.4 5  Initial recommendations on plan and network design included requiring all QHPs to offer all metal tiers, limiting each issuer to propose 2-3 products per geographic region, and standardizing family tiers and tier ratios.

In September 2012, the Board approved using the eValue8 tool, which measures and evaluates health plan performance, as part of the QHP solicitation to support a quality rating system.6 

On February 13, 2013, Covered California announced that it will require standardized benefits and cost-sharing across all the health plans that participate in the Marketplace. The final benefit plan designs specify the benefits that will be offered by all plans and the deductible, copayment, and co-insurance amounts that will be required of plans at different metal tiers.7  Carriers are required to offer at least one of Covered California’s adopted standardized benefit plan designs in each region for which they submit a bid; however, they may also propose an alternative benefit design and may offer the standardized Health Savings Account-eligible (HSA) design.

On November 16, 2012, the Board released a final Qualified Health Plan (QHP) Solicitation to carriers for bids to offer, market, and sell QHP coverage through the Covered California beginning in 2013.8  Bids were due from carriers by January 20, 2013. The bids were evaluated based on the mix of health plans in each region of the state that meet the Marketplace’s goals to promote affordability, competition, alignment of delivery systems, and long-term partnerships. The Board also developed a model QHP contract. On August 7, 2013, Covered California announced it had signed contracts with 12 health insurers to offer plans on the individual Marketplace. Six of those insurers will also offer products in the SHOP.9   Since that announcement, one insurer did not receive final approval to sell in the Marketplace and currently 11 insurers are offering plans through Covered California’s individual Marketplace. Covered California had previously announced the rates for plans in individual Marketplace in May and the SHOP in August.

Dental and Vision Benefits: In October 2012, the Board adopted a policy supporting stand-alone pediatric vision plans on the same terms as pediatric dental benefits in both the Individual and SHOP Marketplaces. Also, the Board approved offering stand-alone vision plans providing services to adults and children for benefits not offered through the EHB benchmark plan.10  On January 8, 2013, the Board released a solicitation inviting vision and dental issuers to submit bids to offer supplemental dental and vision plans through Covered California.11  Bids were due April 8, 2013.

On June 25, 2013, Covered California announced that six issuers would sell nine pediatric stand-alone dental plans. These products can also be bundled with the QHP for a single premium. There are three different product types available: Dental Preferred Provider Organizations; Dental Exclusive Provider Organizations; and Dental Health Maintenance Organizations. Each plan is offered at a high actuarial value (85%) and low actuarial value (70%).12 

For 2014, Covered California will not offer QHPs that embed pediatric dental benefits.  However, the Board voted on August 8, 2013 to offer pediatric dental benefits as an embedded benefit beginning in 2015.

Risk adjustment, Reinsurance, and Risk corridors: Covered California decided it will initially rely on the federal government to administer risk adjustment and reinsurance programs for the state.

Consumer Assistance and Outreach: Covered California has developed a multi-pronged outreach, education, and marketing campaign to raise awareness about new coverage options and to provide enrollment assistance.  The state procured subcontractors to develop the outreach, marketing, and education strategy and has detailed enrollment goals which have been broken out by potential enrollees’ insurance status and demographic characteristics.13  Based on this strategy, several programs will provide outreach, education, and enrollment assistance, including the Outreach and Education Grant Program, the Enrollment Assistance Program, and the Community Outreach Network.

The Outreach and Education grant program provides grants to community-based organizations to provide targeted outreach to eligible populations.  This program complements the state’s broader marketing strategy and helps build capacity for the Assister Program. On January 21, 2013, Covered California released the Request for Applications for the program.14  On May 14, 2013, Covered California announced the award of $37 million in grants to 48 lead organizations throughout the state.  The lead organizations will be supported by 226 subcontracting organizations. The bulk of the grant funding, $34 million, went to organizations targeting individuals, while $3 million was allocated to organizations providing outreach to small businesses.15  Covered California set aside another $3.1 million to fund four medical associations to educate providers about the ACA.16 

Covered California also established an Assisters Program to provide direct assistance to consumers to help them enroll in coverage. Given California’s complex linguistic and cultural diversity and its size, the state solicited broad stakeholder input for the Assister program. In June 2012, Covered California subcontractors released recommendations and a final work plan for Phase 1 and 2 of the statewide Assisters Program.17 18   The Assisters Program consists of In-person Assisters, called Certified Enrollment Entities (CEEs) and Certified Enrollment Counselors (CECs), and Navigators. that will include non-profit organizations, community clinics, faith-based organizations, tribal organizations, community colleges, school districts, and labor unions. Other entities that may participate as enrollment assisters but will not be paid by Covered California include health insurance agents, hospitals, and providers. CECs will be paid $58 per successful enrollment in a QHP through Covered California or in Medi-Cal and $25 for QHP or Medi-Cal renewal. Navigators will be supported by $5 million in annual grant funding. The Navigator funding is divided into two pools: $1 million for the targeted funding pool to support organizations that target hard-to-reach populations; and $4 million for the regional funding pool to support organizations that foster regional collaborations.19  The CEE and CEC application process is ongoing while the Navigator application is expected to be released in February 2014 with grant awards announced in April. CEEs, CECs, and Navigators must complete a 3-day training program, pass a certification exam, and pass a finger-printing and criminal background check.20 

Covered California has also developed the Community Outreach Network, which consists of organizations that have partnered with Covered California to assist in the effort to raise awareness about the Marketplace. Participating organizations are not compensated for their work. To date, 90 organizations have signed partnership agreements for the Community Outreach Network. Another 367 organizations and individuals have expressed interest in joining and are currently going through the agreement signing process.

In February 2013, Covered California announced the launch of its new consumer and business website (www.coveredca.com) to provide information on the coverage opportunities that will be available. The website is available in English and Spanish and numerous fact sheets have been translated into 11 other languages.

Covered California established three Service Center sites throughout the state.  Service Centers in Contra Costa County and Rancho Cordova opened for a soft launch in September.  The Fresno Service Center opened in November.  The number of staff across all three Service Centers is expected to reach 500 by the end of the year.

In September 2013, Covered California launched its advertising campaign, with tv, radio and digital media ads in three test markets—San Diego, Sacramento, and Chico/Redding. Ads in both English and Spanish were included in the launch.The campaign expanded to additional markets in October and included print ads and ads in additional languages. The campaign also includes out-of-home advertising and a presence on social media, including Facebook and Twitter. Covered California plans to spend $20 million in marketing through the end of December and $45 million for the entire open enrollment period from October 1, 2013 through March 31, 2014.21 

Small Business Health Options Program (SHOP) Marketplace:  In October 2012, the state released a solicitation for the Administration of SHOP Operations.22  On April 4, 2013, Covered California announced that it had awarded a contract to Pinnacle Claims Management Inc. to administer the SHOP Marketplace. The contract includes maintenance and enhancements of the SHOP Marketplace through December 2015. California intends to pursue the option for the employer to choose the plan tier, while the employee chooses the issuer and plan. To be eligible to purchase through the SHOP, small employers must meet minimum participation and contribution requirements. At least 70% of qualified employees (does not include those employees enrolled in other coverage) must enroll in a QHP in the SHOP and the employer must contribute at least 50% of the lowest cost coverage in the tier selected by the employer. On August 7, 2013, Covered California announced it had finalized contracts with six insurers to sell products in the SHOP.

Basic Health Program (BHP): California has considered an optional coverage program available through the ACA which allows states to use federal funding to offer subsidized health insurance to adults with incomes between 139 and 200% of the federal poverty level (FPL) who would otherwise be eligible to purchase subsidized coverage through an Marketplace. Following delay in the release of federal guidance on the BHP, California developed an alternative Bridge Plan proposal that would certify certain Medi-Cal managed care plans as bridge plans, allowing individuals transitioning from Medi-Cal to the Marketplace to remain in the same plans. These would also offer lower premiums, thereby increasing the affordability of coverage for low-income enrollees.23  On March 11, 2013, Covered California sent a letter to HHS requesting approval of the proposed Bridge Plan.24  The California legislature passed SBx1 3 authorizing the bridge program and the Governor signed the bill on July 11, 2013.

Essential Health Benefits (EHB): The ACA requires that all non-grandfathered individual and small-group plans sold in a state, including those offered through the Covered California, cover certain defined health benefits. Legislation selecting the Kaiser small group HMO plan as the state’s EHB benchmark plan and the state’s Healthy Families (CHIP) program as the pediatric dental supplemental benefit was signed into law in October 2012 (AB 1453/SB 951).25 

Marketplace Funding

The legislation creates the California Health Trust Fund within the State Treasury, which will be continuously appropriated and used to manage the finances of Covered California. The legislation also authorizes a loan of up to $5 million from the California Health Facilities Financing Authority to assist in establishment and operation of the Marketplace. The California HealthCare Foundation and the Blue Shield California Foundation also funded activities in preparation for applying for the federal Establishment grant.26 

In September 2010, the California Health and Human Services Agency received a federal Exchange Planning grant of $1 million. The state also received a federal Level One Establishment grant of $39.4 million on August 12, 2011 which will be used for overall business and operational planning, research and analysis, and implementation of an information technology system. The state was awarded a second Level One Establishment grant in June 2012 for $196.4 million for continued Marketplace development.27   In January 2013, the state received a $674 million federal Level Two Establishment grant that will enable the state to finance Covered California’s operations through December 2014.28 

Next Steps

On January 3, 2013, California received conditional approval from the U.S. Department of Health and Human Services (HHS) for its State-based Marketplace.29   Covered California launched on October 1 and began enrolling qualified individuals, families, and small businesses into coverage.

Additional information about Covered California can be found at https://www.coveredca.com/ or http://www.healthexchange.ca.gov/.

  1. California State Assembly Bill 1602. California State Senate Bill 900.  (Accessed June 22, 2011) ↩︎
  2. California Health Benefit Exchange Stakeholder Engagement Plan. Approved September 18, 2012.  ↩︎
  3. California Exchange Tribal Consultation Policy. November 11, 2012.  ↩︎
  4. California Health Benefit Exchange. The California Path to Achieving Effective Health Plan Design and Selection and Catalyzing Delivery System Reform: Stakeholder Input on Key Strategies. May 18, 2012.   ↩︎
  5. Qualified Health Plan Policies and Strategies to Improve Care, Prevention and Affordability. Discussion Draft- Options and Recommendations. July 16, 2012.  ↩︎
  6. CA Health Benefit Exchange Board Meeting Minutes. September 18, 2012.  ↩︎
  7. Final benefit plan designs released March 15, 2013 ↩︎
  8. California Health Benefit Exchange. 2012-2013 Initial Qualified Health Plan Solicitation to Health Issuers. November 16, 2012.  ↩︎
  9. Covered California press release, “Covered California Health Plan Contracts Signed,” August 7, 2013.   ↩︎
  10. Letter to CCIIO from Peter Lee. November 9, 2012.  ↩︎
  11. Supplemental Dental and Pediatric Dental Essential Health Benefit Solicitation, as amended on March 29, 2013.   Supplemental Vision Benefit Solicitation, as amended March 29, 2013  ↩︎
  12. Covered California, “Children’s Dental Insurance Plan Rates 2014,” June 25, 2013 (updated September 6, 2013).  ↩︎
  13. Marketing, Outreach, and Education and the Assister Program for the “California Coverage.” May 16, 2012.   ↩︎
  14. Outreach and Education Grant Program Application, released January 25, 2013. ↩︎
  15. Covered California, “Grant Funding Announcement Report,” May 23, 2013. ↩︎
  16. Covered California press release, “Medical Associations Awarded $3.1 in Grants to Educate Providers about Health Insurance Marketplace,” August 29, 2013. ↩︎
  17. Phase I and II Statewide Assisters Program Design Options, Recommendations and Final Work Plan for the California Health Benefits Marketplace. June 26, 2012. RHA.   ↩︎
  18. Assisters Program for the California Helath Benefits Marketplace. Exchange Board Meeting. May 22, 2012. ↩︎
  19. Covered California, “Navigator Program Stakeholder Webinar,” October 28, 2103. ↩︎
  20. Covered California, “In-Person Assistance Program,” September 6, 2013. ↩︎
  21. Covered California, Marketing, Outreach, and Enrollment Assistance Advisory Group Meeting presentation slides, September 12, 2013. ↩︎
  22. HBEX 11- Administration of the Small Business Health Options Program (SHOP) Solicitation. October 12, 2012.   ↩︎
  23. Bridge Plan: A Strategy to Promote Continuity of Care & Affordability through Contracts with Medi-Cal Managed Care Plans, Board Recommendation Brief, March 2013.  ↩︎
  24. Letter from Peter Lee to Gary Cohen at CCIIO requesting approval of the Bridge Plan, March 11, 2013  ↩︎
  25. AB 1453. 2012 Session; SB 951. 2012 Session ↩︎
  26. Exchange Planning Grant and Exchange Establishment Grant. Presented at California Health Benefit Exchange Board meeting on April 20, 2011.  ↩︎
  27. Level 1 Establishment Grant Application↩︎
  28. HealthCare.gov. “California Affordable Insurance Exchange Grants Award List.”   ↩︎
  29. HHS letter to Governor Brown, January 3, 2013.  ↩︎

Long-Term Services and Supports in the Financial Alignment Demonstrations for Dual Eligible Beneficiaries

Author: MaryBeth Musumeci
Published: Nov 25, 2013

The Centers for Medicare and Medicaid Services (CMS) and selected states are implementing demonstrations, beginning in 2013, to integrate care and align financing for beneficiaries who are dually eligible for Medicare and Medicaid.  Seven states (CA, IL, MA, NY, OH, SC, VA) are testing a capitated model in which managed care plans will provide and coordinate Medicare and Medicaid acute, physical health, behavioral health, pharmacy, and long-term services and supports (LTSS).  For many dual eligible beneficiaries, the financial alignment demonstrations will be the first time that LTSS will be coordinated with other health care services. This issue brief compares the treatment of LTSS in the seven approved capitated financial alignment demonstrations.

The Role of Medicaid in State Economies and the ACA

Published: Nov 25, 2013

The Affordable Care Act (ACA) calls for a Medicaid expansion to cover nearly all adults with incomes at or below 138% of the Federal Poverty Level (FPL)($15,856 for an individual, $32,499 for a family of four). The federal government pays 100% of the cost of coverage from 2014-2016, eventually scaling down to 90% in 2020 and beyond (compared to current matching rates of 50% – 73.4%). However, the Supreme Court decision in June 2012 effectively makes the Medicaid expansion a state option.

Many analyses were conducted to assess the coverage and fiscal implications of the Medicaid expansion for individual states.  Most of these studies have examined new state costs tied to the Medicaid expansion as well as savings opportunities due to reductions in spending for uncompensated care or funding for other indigent care programs, while a number also included estimates of the broader economic effects of the Medicaid expansion such as the impact on gross state product (GSP), state and local revenues, or jobs. This brief summarizes findings from 32 studies in 26 states analyzing the anticipated impact of the ACA Medicaid expansion (and in some cases full ACA implementation) on state and local economies.

Medicare Advantage 2014 Spotlight: Plan Availability and Premiums

Authors: Marsha Gold, Gretchen Jacobson, Anthony Damico, and Tricia Neuman
Published: Nov 25, 2013

Issue Brief: Issue Brief

Under the current Medicare program, beneficiaries may enroll in either the traditional Medicare fee-for-service program, or in a private plan, such as an HMO or preferred provider organization (PPO), in what is now known as the Medicare Advantage program. Medicare Advantage plans receive funds from the federal government (Medicare) to provide Medicare-covered benefits to enrollees.  As of September 2013, 15 million Medicare beneficiaries (29%) were enrolled in a Medicare Advantage plan.  The Affordable Care Act of 2010 (ACA) enacted reductions in payments to Medicare Advantage plans with the goal of creating greater parity in payments between the traditional Medicare program and Medicare Advantage.1 

Beneficiaries will see limited changes in the number of plans offered in 2014. Our analysis finds that beneficiaries will be able to choose from 18 plans, on average, in 2014, down from an average of 20 plans in 2013.  While some plans will leave the market in 2014, others are coming in or expanding.  A small share of enrollees will have to find new plans because their 2013 plan will no longer be available to them in 2014.  Almost all will be able to stay in a similar type plan, often with the same company.  Beneficiaries will continue to have access to plans with relatively low premiums.  Beneficiaries who remain in the same Medicare Advantage plan in 2013 and 2014 are likely to see modest increases in premiums, on average, but could avoid higher premiums by changing plans, although there are other tradeoffs to consider when switching plans.  Of note, out-of-pocket limits are expected to be higher in 2014 than in 2013, on average, providing less financial protection to enrollees.

This Data Spotlight, like those prepared by us in previous years, reviews trends in Medicare Advantage plan choices available to beneficiaries, premiums and other plan characteristics in 2014. The brief does not, however, analyze changes in benefits or cost sharing requirements for individual services, which could be major factors in an enrollee’s out of pocket expenses,2  nor does it examine changes in provider networks that could affect beneficiaries’ access to preferred physicians and other health care providers.3  This spotlight is part of a series of spotlights tracking key changes in the Medicare Advantage program. The analysis is based on publicly available data from the Centers for Medicare and Medicaid Services (CMS).4 

.

Summary of Findings

A total of 2014 Medicare Advantage plans will be available nationwide for general enrollment in 2014, down 60 plans from 2013, taking into account new entrants, consolidations, and departures.5  On average, Medicare beneficiaries will be able to choose from among 18 plans in 2014, two fewer than in 2013. As in prior years, choice will be more extensive in metro than non-metro areas (on average 20 versus 11 plans, respectively).  About 526,000 of current 2013 Medicare Advantage enrollees (5%) will have to make some change because their plan is not available in 2014. However, almost all of these enrollees (91%) will still be able to choose a plan of the same type, and often a plan that is offered by the same company. Virtually all (99%) beneficiaries in plans that are withdrawing from their area will continue to have access to one or more Medicare Advantage plans.

Medicare Advantage choices available to beneficiaries in 2014 generally are similar to those in the past.  Average unweighted monthly plan premiums in 2014 are $49, down from $51 in 2013. Most beneficiaries (84%) will have access to a Medicare Advantage plan offered in their area for no additional premium.  Enrollees who stay with their current plan (if available) will find that, on average, their premiums will increase by almost $5, from $35 to $39.

As required by CMS, all Medicare Advantage plans will include an annual limit on out-of-pocket costs.  However, the average out-of-pocket limit will increase from $4,333 in 2013 to $4,797 in 2014; 41 percent of plans will have out-of-pocket limits of $5,000 or more.  As a result, beneficiaries may want to carefully consider their choices in 2014 to understand how change will affect them and how they might want to respond.

Back to top

.

Change in Overall Plan Availability in 2014

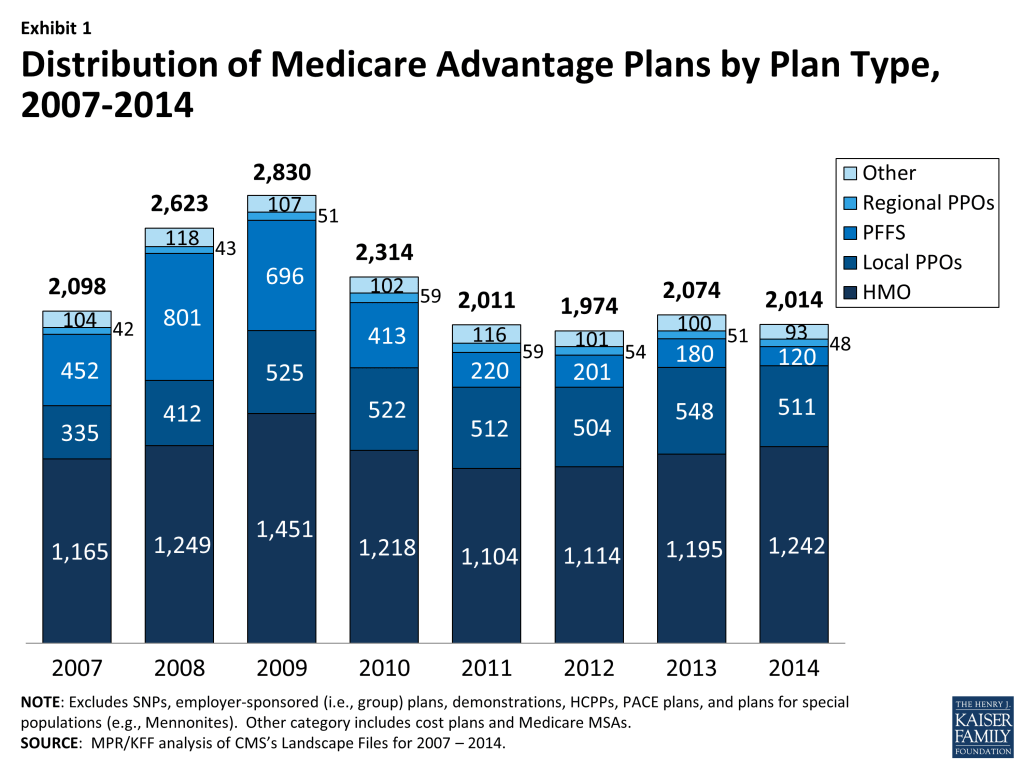
In total, there will be 2014 Medicare Advantage plans nationwide available for individual enrollment in 2014 (Exhibit 1).  In aggregate, 60 fewer plans will be available in 2014 than in 2013, a relatively small change that reflects offsets of plan expansion and contraction (discussed below). The average Medicare beneficiary will have 18 plans available from which to choose in 2014, with beneficiaries in metro areas having an average of 20 choices and those in non-metro areas having an average of 11 choices, each down by two since 2013 (Table A1).  Conceptually, the number of choices in 2014 is a combination of the number offered in 2013 that remain in the market in 2014 and any new plans that enter. Table A2 provides additional detail on the dynamics of change in available plans between 2013 and 2014 and the effects on current enrollees.

Exhibit 1. Distribution of Medicare Advantage Plans by Plan Type, 2007-2014

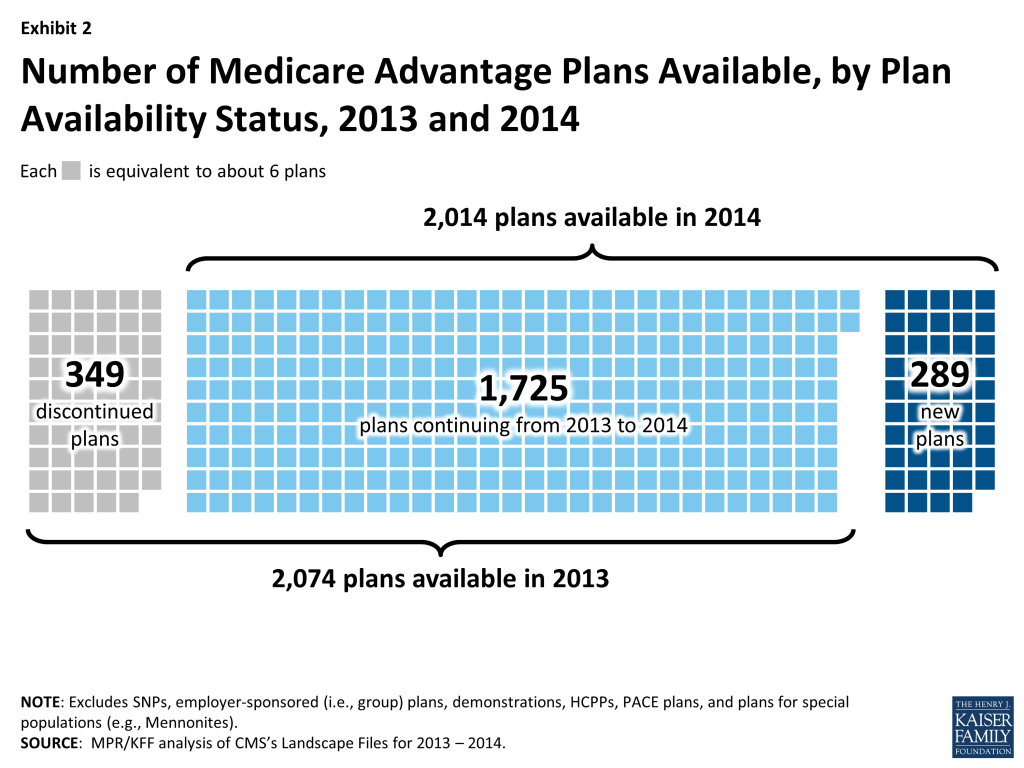
Staying Plans. Of the 2074 plans offered in 2013, 1725 (83%) will continue to be available in 2014, including 1,221 plans that will continue with the same service area, 219 plans that will have an expanded service area, and 194 plans that will have a reduced service area (Exhibit 2).  These plans account for five percent of total 2013 enrollment.  Plan service areas are defined by counties, except for regional PPOs which serve one or more states. Generally, a beneficiary must live in the service area of a plan to enroll.

Exhibit 2. Number of Medicare Advantage Plans Available, by Plan Availability Status, 2013 and 2014

New Entrants.  Among the 289 new plans offered in 2014, 80 percent are HMOs, the historically dominant plan type, 19 percent are local Preferred Provider Organizations (PPOs), and the remainders are Private Fee-for-Service (PFFS) plans and regional PPOs.

Departing Plans.   In general, firms with a plan departing are not leaving areas but instead are making changes to the selection of plans available to beneficiaries in the area.  Of the 349 plans that will no longer be offered in 2014, PFFS plans are disproportionately represented, and account for over half (34 out of 66 plans) of the contract terminations. The role of PFFS plans in the Medicare Advantage marketplace has been declining substantially since the Medicare Improvements for Patients and Providers Act (MIPPA) of 2008 required most PFFS plans to adopt provider networks, and this historical trend will continue in 2014.

As a result of firm consolidations, 208 of all Medicare Advantage plans in 2013 will be consolidated into 91 plans, resulting in the departure of 117 plans. Reasons for such consolidation include acquisitions or mergers of firms with similar plans, firms consolidating plans in response to market forces, and CMS’s push to have firms eliminate plans with few enrollees or that are very similar to others offered by the firm in the same service area.

Effects on Beneficiaries. The overall effect of plan departures on beneficiaries will be mitigated because new plans are entering the market and other plans are expanding their service areas. As a result, the average beneficiary will see only a small change in the number of plans available.   However, some beneficiaries (526,127 beneficiaries or 5 percent of all those enrolled in Medicare Advantage plans) will be required to either switch to another Medicare Advantage plan or return to the traditional Medicare program.

Given the pattern of departures, most enrollees affected by departures will find that their choices will not change dramatically between 2013 and 2014.  Beneficiaries in some types of plans, particularly PFFS plans, will be more affected by plan withdrawals.  Overall, half of enrollees in departing plans will be able to choose a plan of the same plan type (e.g., HMO, local PPO) from the same company and 62 percent will be able to stay with the same company if they enroll in a different type of plan.  Overall, less than one percent of beneficiaries enrolled in a Medicare Advantage plan in 2013 will not be able to enroll in a Medicare Advantage plan in 2014.

Back to top.

2014 Plan Choices and Geographic Variation

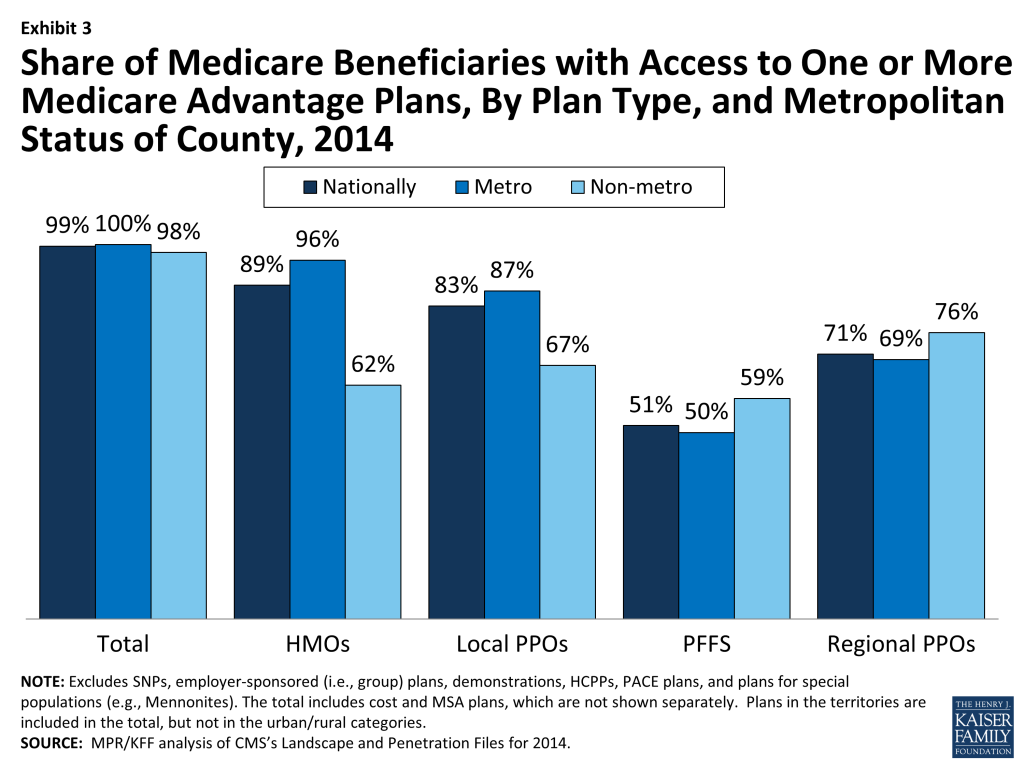
In 2014, as in recent years, virtually all Medicare beneficiaries will have access to a Medicare Advantage plan as an alternative to traditional Medicare (Exhibit 3).  Nationwide 99 percent of all beneficiaries (100 percent in metro areas and 98 percent in non-metro areas) have one or more Medicare Advantage choices, and most have a wide range of plans available to them.  The largest difference in 2014 is that fewer beneficiaries—but still a majority – will have a choice of a PFFS plan.

Exhibit 3. Share of Medicare Beneficiaries with Access to One or More Medicare Advantage Plans, By Plan Type, and Metropolitan Status of County, 2014

In 2014, 89 percent of Medicare beneficiaries will have access to an HMO and 83 percent to a local PPO.  Among beneficiaries in non-metro areas, 62 percent will have access to an HMO and 67 percent will have access to a local PPO.  In metro areas, 96 percent and 87 percent of beneficiaries, respectively, will have access to an HMO or local PPO.  Regional PPOs will be somewhat less commonly available, but such plans will be available to 69 percent of metro beneficiaries and 76 percent of non-metro beneficiaries.

Consistent with recent trends, the availability of PFFS plans nationwide continues to decrease, and 51 percent of beneficiaries (50% of beneficiaries in metro areas and 59% of beneficiaries in non-metro areas) will have access to a PFFS plan in 2014, down from 59 percent in 2013.

Back to top.

Availability by Level of Traditional Medicare Spending

Historically, beneficiaries in counties with the highest per capita spending for traditional Medicare (top quartile) have had more Medicare Advantage plans available to them than have beneficiaries in lower cost counties (Table A1).  In 2012, the first year of Medicare Advantage payment reform under the ACA (See Box on Recent Legislative and Regulatory Changes), the number of plans available to beneficiaries decreased within each quartile, with the largest decreases in the highest cost counties.  In 2014, the average number of plan choices within the highest cost counties will decline to 21 in 2014, down from 24 in both 2013 and 2012.  Beneficiaries in the lowest cost counties will continue to have an average of 17 plan options, the same number available, on average, for the past two years.

Back to top.

Availability of Special Needs Plans in 2014

Special Needs Plans (SNPs), a type of Medicare Advantage plan, were authorized in 2003 to provide a managed care option for beneficiaries with significant or relatively specialized health care needs, including Medicare beneficiaries who are dually eligible for Medicare and Medicaid (“dual eligibles”), beneficiaries requiring an institutional-level of care (e.g., nursing home residents), and beneficiaries with severe or chronic disabling conditions. Most SNPs are HMOs, but they can also be local PPOs or regional PPOs.

When SNPs were authorized, there were few requirements beyond those otherwise required of other Medicare Advantage plans.  The Medicare Improvements for Patients and Providers Act (MIPPA) of 2008 required SNPs to conform to the specialized enrollment role originally set for them. For example, authority for chronic or disabling conditions was limited to specific diagnoses or conditions and all SNPs were required to provide a care management plan to document how care would be provided for the unique subgroups covered by the plan. The number of SNPs declined in 2010 in response to the additional requirements placed upon SNPs in MIPPA.  As part of the ACA, SNPs for dual eligibles are required to have a contract with the Medicaid agency for every state in which the plan operates, beginning in 2013; CMS was flexible about the scope of agreement required. In 2014, the availability of special needs plans for those dually eligible for Medicare and Medicaid in some states also may be influenced by activity to improve the financial alignment between these two programs and better integrate care for this vulnerable subgroup of Medicare beneficiaries.6 

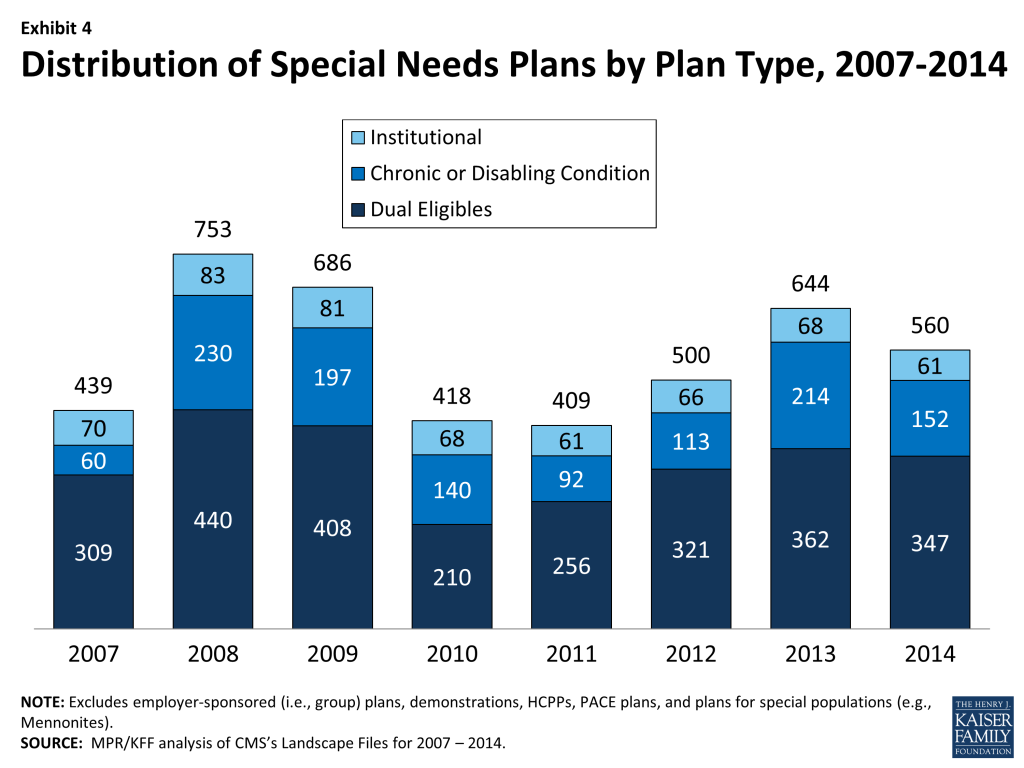
In 2014, 560 SNPs in total will be available nationwide to those eligible for enrollment, down from 644 plans in 2013 (Exhibit 4; Table A3).  Most of the decline between 2013 and 2014 reflects a drop in chronic care SNPs, from 214 plans in 2013 to 152 plans in 2014.  Institutional SNPs, always limited in number, will decline from 68 plans in 2013 to 61 plans in 2014. SNPs for dually eligible beneficiaries will continue to be the most common type of SNP, though the number will decline from 362 plans in 2013 to 347 plans in 2014.

Exhibit 4. Distribution of Special Needs Plans by Plan Type, 2007-2014

SNP availability will continue to vary across states in 2014 as in prior years.  At least one SNP of any type will be available in all states but eight (AK, ME, MT, NH, ND, SD, VT, and WY).  SNPs will be most numerous in selected high population states, notably Florida (130 plans), California (64 plans), New York (57 plans), and Texas (35 plans).  From 2013 to 2014, Florida experienced a notable growth in SNPs (from 112 plans in 2013 to 130 plans in 2014), which reflects proportionate increases in all three types of SNPs. In most other states, change was more limited.  There are no obvious geographical explanations for the overall decline in SNPs nationwide from 2013 to 2014.

Back to top.

Market Dynamics and Turnover

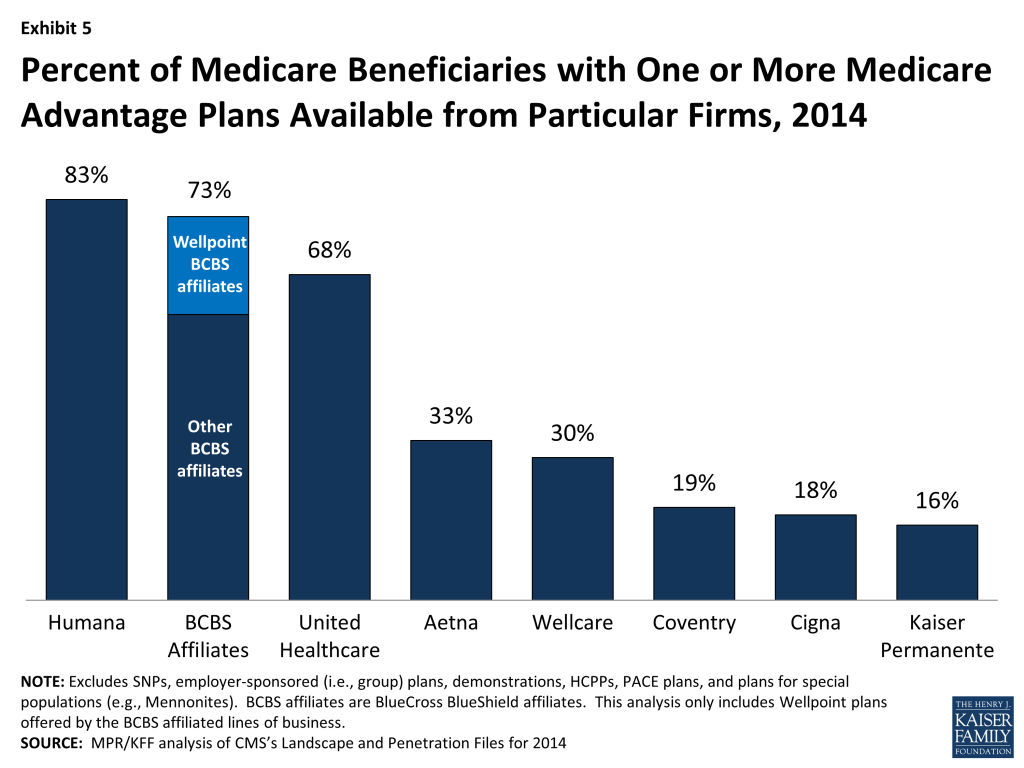
While many organizations offer Medicare Advantage plans, a few – particularly Humana, United Healthcare, and the Blue Cross and Blue Shield (BCBS) affiliates – have particularly large geographic spread and these organizations historically account for a disproportionate share of enrollment. In 2014, 44 percent of available plans are being offered by one of these three firms or affiliates (Table A4).  Plans offered by these firms are available to most beneficiaries.  Nationwide, 83 percent of Medicare beneficiaries will have access to one or more Humana plans, 73 percent will have access to a BCBS affiliated plan (including BCBS plans offered by Wellpoint), and 68 percent will have access to a United Healthcare plan (Exhibit 5; Table A5).  The general availability of these firms’ products has not noticeably changed from 2013 to 2014.  However, the similarities in BCBS offerings from 2013 to 2014 obscure a decline in availability of BCBS branded Wellpoint plans (declining from 88 plans to 55 plans between 2013 and 2014), which is mostly offset by the growth in plans offered by other BCBS affiliates (growing from 205 plans to 233 plans between 2013 and 2014).

Exhibit 5. Percent of Medicare Beneficiaries with One or More Medicare Advantage Plans Available from Particular Firms, 2014

Aetna also has a large geographic spread. Aetna plans are available to 33 percent of all beneficiaries and 19 percent of beneficiaries will have access to a plan from Coventry, Aetna’s recent acquisition, in 2014; a total of 44 percent of beneficiaries will be access to a plan either from Coventry or Aetna.  Other firms with plans available across a large share of the market include Wellcare, Cigna and Kaiser Permanente.

Humana and UnitedHealthcare, and to a lesser extent the BCBS affiliates, define the regional PPO market; no other company operates in this market now.

Back to top

.

Premiums and Benefits in 2014

Premiums, benefits, cost sharing requirements and provider networks are important plan characteristics for beneficiaries to consider when choosing among Medicare Advantage plans, because of the potential effect on beneficiaries’ out-of-pocket costs and their access to preferred health care providers. This analysis focuses on national trends in premiums, out-of-pocket spending limits and Part D drug coverage, using data CMS released in September 2013. The analysis is based on Medicare Advantage plans that offer prescription drug coverage (and excludes the minority of Medicare Advantage plans that do not cover prescription drugs) because most Medicare Advantage plans (83%) offer drug coverage and holding drug coverage constant makes for clearer comparisons of premiums over time or by plan type.

This brief does not include information on cost sharing requirements for individual services, such as hospitalizations or physician visits, which could be a major factor in an enrollee’s out-of-pocket expenses. It also does not examine changes in provider networks, which some plans have reportedly changed for 2014.  Thus, it is possible that plans are making changes in benefit design, supplemental benefits and networks that could have important implications for enrollees, but are beyond the scope of this paper.  It also focuses on national averages, rather than a comparison of the specific plans available where an individual beneficiary lives and how they are changing over time.

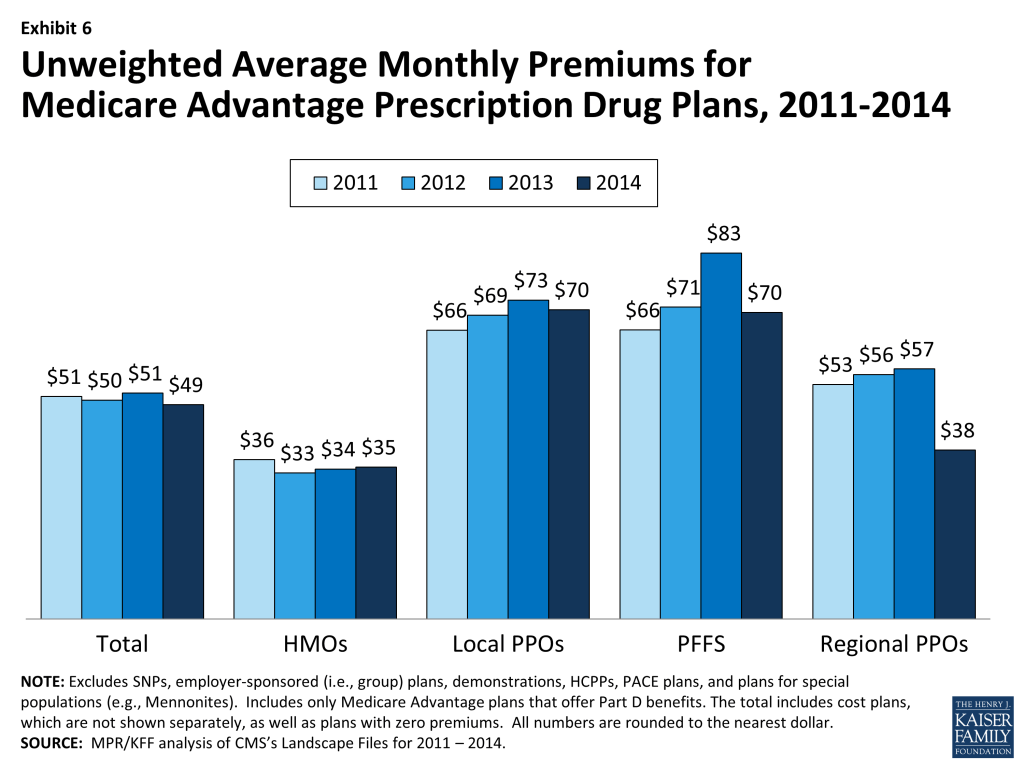
Monthly Premiums (Unweighted).  Medicare beneficiaries enrolled in Medicare Advantage plans pay the Part B premium like other beneficiaries (less any rebate provided by the Medicare Advantage plan), and any additional monthly premium charged by the Medicare Advantage plan for plan benefits and prescription drug coverage (Part D).7  The latter is paid directly to the Medicare Advantage plan. Premiums presented in this Spotlight are not weighted by enrollment.  Such “unweighted” premiums show the change in premiums for plans available to beneficiaries.  The “weighted” average Medicare Advantage premium, in contrast, reflects what beneficiaries currently in plans will pay in 2014 if they stay in the same plan and do not make any changes in the open enrollment period.   Historically, average premiums are lower once beneficiaries respond to new plan choices;8  we will be providing this analysis for 2014 once enrollment stabilizes after the open enrollment period.

In 2014, the average unweighted monthly premium for Medicare Advantage  Prescription Drug plans (MA-PDs) will be $49—a $2 decrease from 2013 and lower than the premium in 2011 or 2012 (Exhibit 6).

Exhibit 6. Unweighted Average Monthly Premiums for Medicare Advantage Prescription Drug Plans, 2011-2014

Premiums for HMOs will average $35 per month in 2014, up $1 from 2013 but still lower than the average monthly premium for regional PPOs ($38), and substantially lower than the average monthly premiums for local PPOs ($70) and PFFS plans ($70).  In 2014, the only plan type with large changes in premiums  is PFFS plans, where average premiums of $70 are down $13 from $83 in 2013.

Among large national firms, average premiums are similar for HMOs offered by UnitedHealthcare, Humana, and Wellpoint affiliated BCBS plans and are substantially lower than those for Kaiser or other Blue Cross and Blue Shield Affiliates.  Among other plan types, UnitedHealthcare’s premiums are lower, on average, than those charged by these firms (where applicable) in 2014 (Table A6).   However, comparisons among firms should be interpreted cautiously since the firms offer plans in different counties.

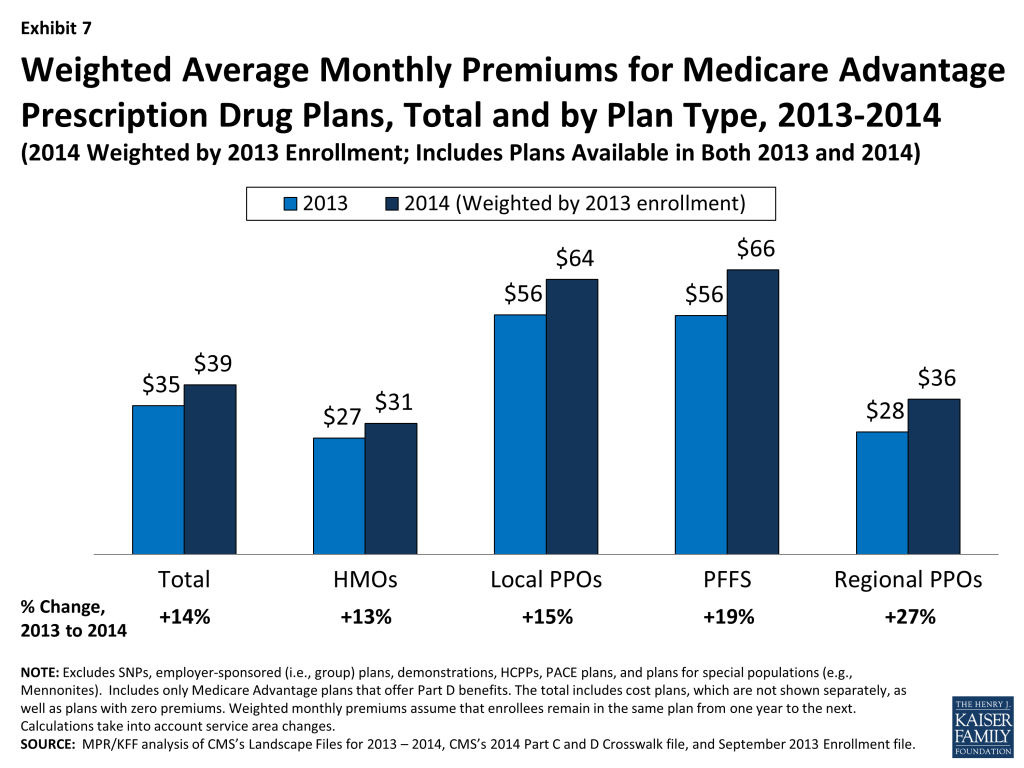
Monthly Premiums, Assuming Enrollees Remain in the Same Plan for 2013 and 2014. Although the average premium actually paid by Medicare Advantage enrollees in 2014 will not be known until after beneficiaries are enrolled in plans for 2014, we use MA-PD enrollment patterns in 2013 for plans that will also be offered in 2014 to estimate what the average current Medicare Advantage enrollee would pay for a plan in 2014.  If enrollees in MA-PDs in 2013 remain in their plan in 2014 they will see their monthly premiums rise from $34.61 in 2013 to $39.46 in 2014 – a monthly increase of almost $5 or 14 percent (Exhibit 7; Table A7).

Exhibit 7. Weighted Average Monthly Premiums for Medicare Advantage Prescription Drug Plans, Total and by Plan Type, 2013-2014

HMO enrollees will see the lowest premium increase, both in absolute terms (from an average of $27.09 in 2013 to $30.51 in 2014) and percentage terms (13%), if they stay in the same plan for 2014.  Average monthly premiums for enrollees in local PPOs will increase from an average of $55.73 in 2013 to $63.96 in 2014 ($8.23 average increase), while monthly premiums for enrollees in PFFS plans will increase slightly more, from an average of $55.56 in 2013 to an average of $66.22 in 2014 ($10.65 average increase).  Premiums for enrollees in regional PPOs will increase by $7.66 per month, on average, from $28.48 in 2013 to $36.14 in 2014.

After weighting premiums by 2013 enrollment, average premiums in 2013 are generally lower for the 2013 plans that will be offered in 2014 than for plans that are terminating at the end of 2013  ($34.61 versus $41.13). This is true both in the aggregate and for most plan types, which could mean higher premium plans departing were less competitive.  PFFS plans are an exception to this pattern, as the average premium for departing plans ($37.07) in 2013 was much lower than the average premium for remaining plans ($55.56) in 2014.  Since PFFS plan departures also are much more likely to reflect contract non-renewals, this could imply that PFFS plans in general were not competitive in those markets or were not competitive for specific firms.

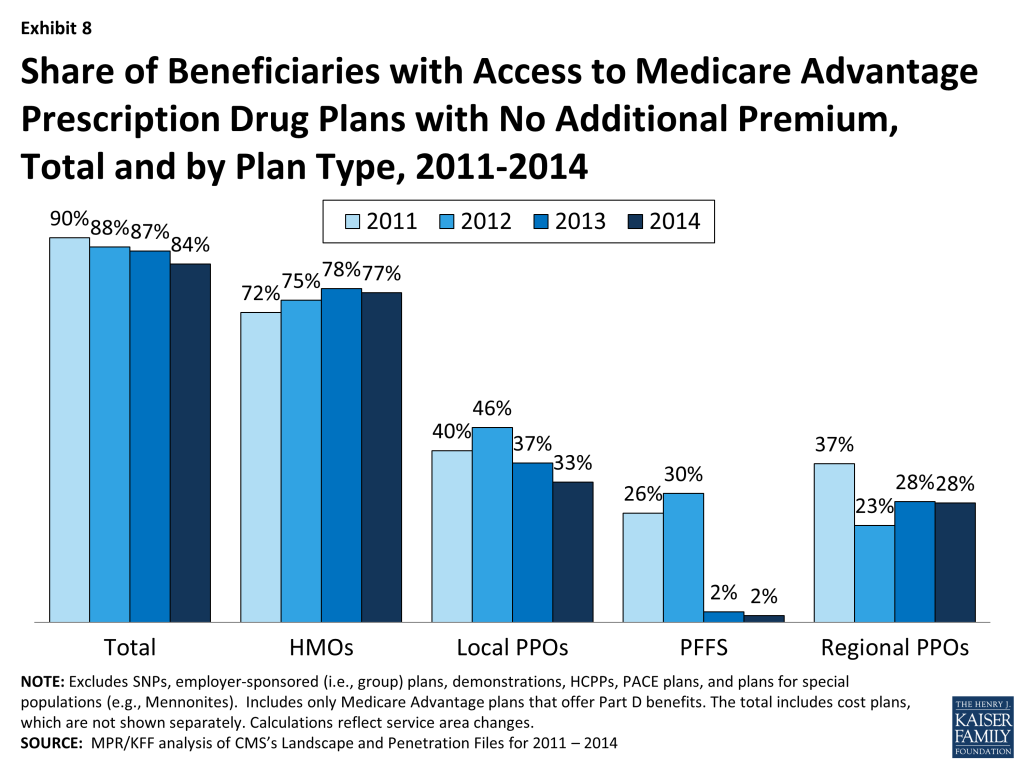
Availability of “Zero Premium” MA-PDs.  As in prior years, most Medicare beneficiaries nationwide (84%) will have access to at least one MA-PD that charges them no additional premium for coverage, other than the monthly Part B premium, also known as “zero premium plans” (Exhibit 8).

Exhibit 8. Share of Beneficiaries with Access to Medicare Advantage Prescription Drug Plans with No Additional Premium, Total and by Plan Type, 2011-2014

Beneficiaries are most likely to have zero premium HMOs available and least likely to have zero premium PFFS plan available. In 2014, 77 percent of beneficiaries will have at least one zero premium HMO available; in comparison, 28 percent of beneficiaries will have access to a zero premium regional PPO, 33 percent will have access to a zero premium local PPO, and 2 percent will have access to a zero premium PFFS plan.

Back to top

.

Limits on Out-of-Pocket Spending

The traditional fee-for-service Medicare program does not include a limit on out-of-pocket spending for services covered under Parts A and B, which is one reason most beneficiaries have supplemental coverage to limit their financial liability.  When HMOs were first offered under the risk contracting program in the mid-1980s, they covered most of Medicare’s cost sharing requirements, making out-of-pocket limits unnecessary. However cost sharing requirements have increased over time in Medicare Advantage plans, reflecting cost growth and other societal trends.9  In 2006, when they were first authorized, regional PPOs were required by law to have a limit on out-of-pocket spending for benefits under Parts A and B. Beginning with the 2011 plan year, CMS required all other Medicare Advantage plans to include a limit on enrollees’ out-of-pocket expenses, set to no more than $6,700. CMS encouraged plans to limit enrollees’ out-of-pocket expenses to no more than $3,400 per year.

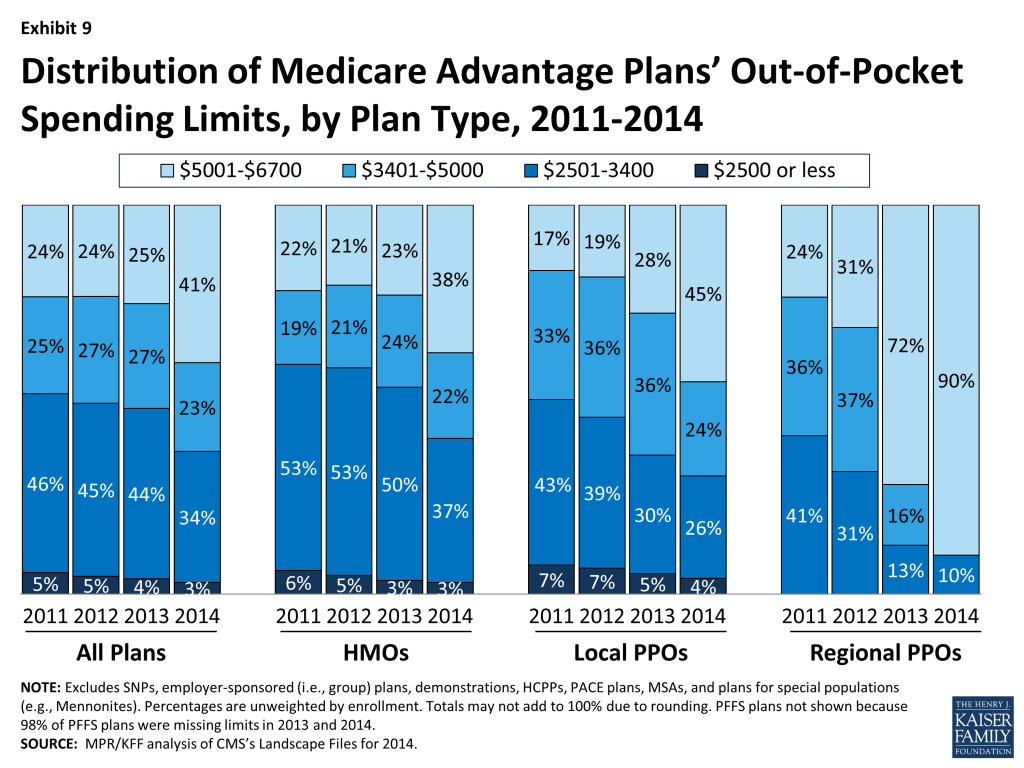
Average out-of-pocket limits in 2014 will be higher than in 2013, providing less protection to enrollees with relatively high out-of-pocket costs ($4,797 versus $4,333).  In 2014, about one-third (37%) of plans set limits at or below CMS’s recommended limit of $3,400, a decline from almost half in 2013 (48%), 2012 (50%) and 2011(51%).  Conversely, the share of plans with a limit exceeding $5,000 is higher in 2014 than in 2013 (41% versus 25%, respectively; Exhibit 9).

Exhibit 9. Distribution of Medicare Advantage Plans’ Out-of-Pocket Spending Limits, by Plan Type, 2011-2014

Average out-of-pocket limits vary by plan type in 2013, as they have historically. In 2014, the average limit on out-of-pocket spending is lower for HMOs ($4,707) than local PPOs ($4,927) – both of which are substantially lower than for regional PPOs ($6,137).  Across all plan types, a fairly large share of plans have limits in excess of $5,000, including HMOs (38%), local PPOs (45%) and the vast majority (90%) of regional PPOs.

If MA-PD enrollees stay in the same plan in 2014, out of pocket limits will rise by about 15 percent, from an average of $4,294 in 2013 to $4,900 in 2014 (Table A7).  Average limits will be higher by about the same dollar amount for each type of plan, although they will continue to be lower for those in HMOs ($4,705) and local PPOs ($4,980) than regional PPOs ($6,348).

In other work, we also have documented variation across plans and found that it persists even when Medicare Advantage payment rates are taken into consideration.10  From a beneficiary perspective, this variation, together with the increase in out-of-pocket limits, means that it is important to review the details of plan benefits each time they are choosing a plan and to review such choices annually.

Back to top

.

Prescription Drug Coverage

Prior to 2006, traditional Medicare did not offer an outpatient prescription drug benefit, and Medicare Advantage plans were an important source of prescription drug coverage for people on Medicare. Many plans offered some coverage for prescription drugs, which they often financed in part with the net difference between Medicare Advantage payments for Part A and B benefits and the plan’s cost for such benefits. Beginning in 2006, all beneficiaries had access to a prescription drug plan, either through free-standing prescription drug plans (PDPs) or a Medicare Advantage plan that included drug coverage (MA-PD). With some limited exceptions, beneficiaries choosing to enroll in a Medicare Advantage plan who wish to get the Part D drug benefit must receive the drug coverage from the Medicare Advantage plan selected. Today, 83 percent of Medicare Advantage plans offer prescription drug coverage. Many of the plans that do not offer drug coverage are designed for beneficiaries who may have access to other sources of prescription drug coverage, including former employers such as the Department of Veterans Affairs.

The initial design of the Medicare drug benefit included a coverage gap, or “doughnut hole” that required beneficiaries with relatively high drug costs to pay 100 percent of their expenses in the gap until they qualified for catastrophic protection.  The ACA phases in coverage in the gap, and eliminates the gap altogether by 2020.  In 2014, beneficiaries will be responsible for no more than 47.5 percent of the cost of brand-name drugs and 72 percent of the cost of generic drugs in the gap.

Medicare Advantage Prescription Drug Plans. More than one third (37 percent) of all Medicare beneficiaries enrolled in Part D in late 2013 were in an MA-PD, with the remaining 63 percent in a freestanding PDP.11  Many MA-PDs provide prescription drug coverage and other supplemental benefits available for no additional premium.12 

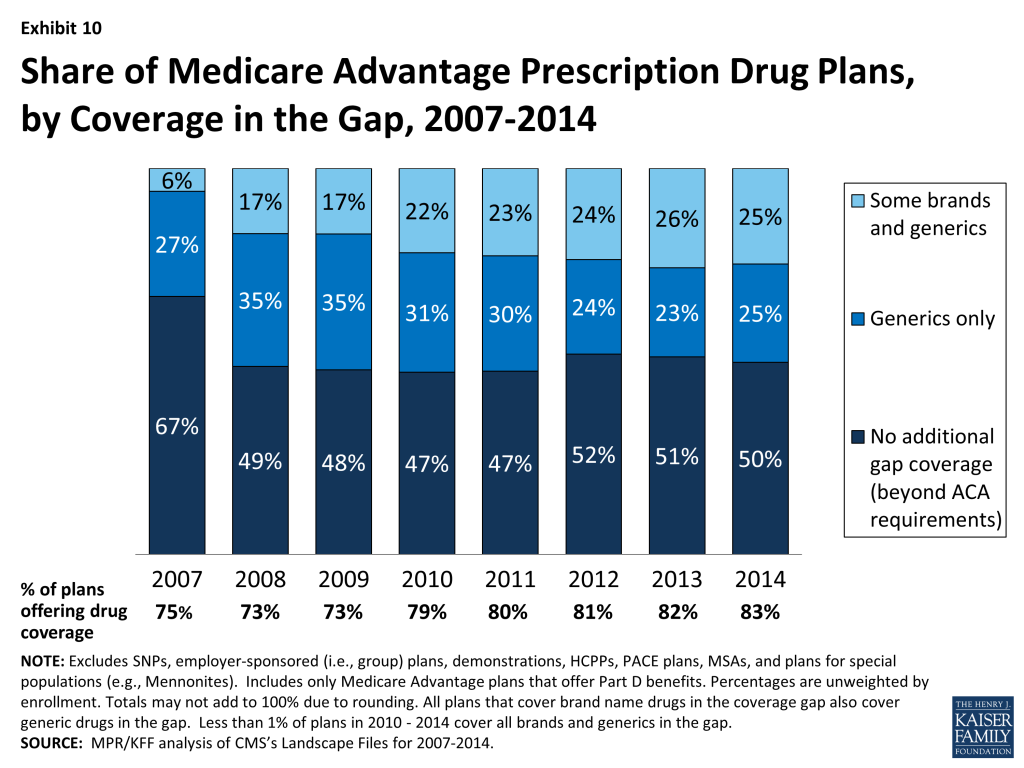
    • Half (50 percent) of MA-PD plans will offer some additional prescription drug coverage in the Part D coverage gap, also known as the Part D “donut hole”, other than that required by the ACA (Exhibit 10).
    • Among MA-PDs providing coverage in the gap beyond that which is required by current law, half increase coverage only for generic drugs and half also include some expanded brand coverage as well.
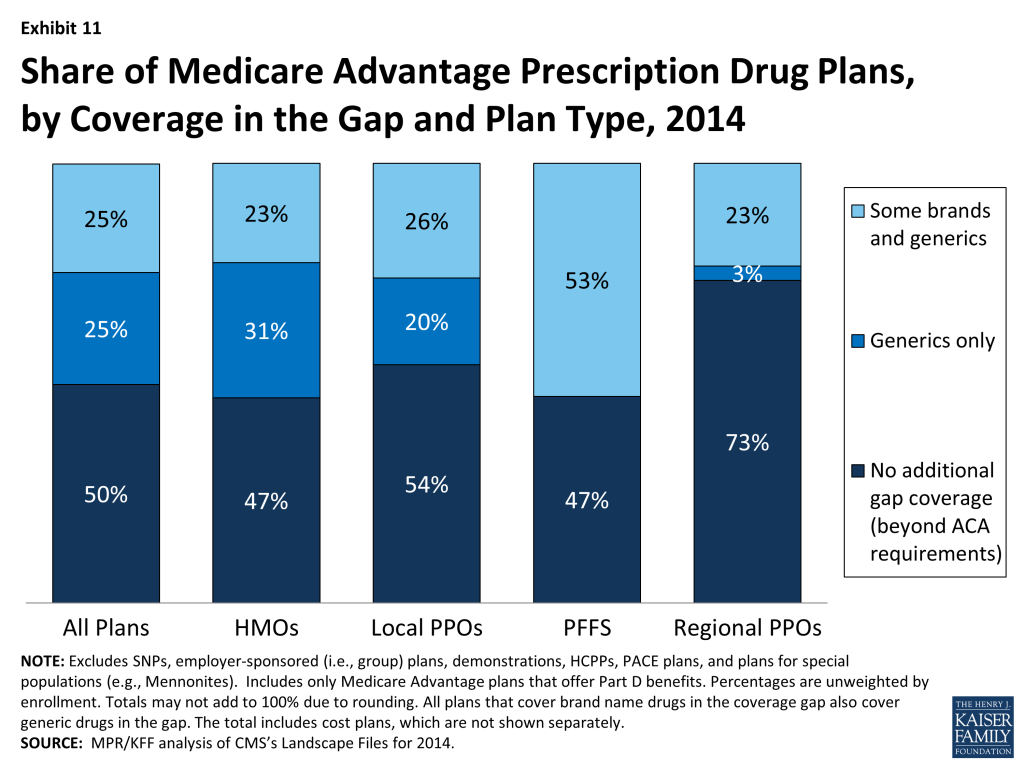
    • In 2014, as in 2013, a smaller share of regional PPOs (26%) than other plan types will provide any additional gap coverage, including HMOs (53%), local PPOs (46%), and PFFS plans (53%) (Exhibit 11).
Exhibit 10. Share of Medicare Advantage Prescription Drug Plans, by Coverage in the Gap, 2007-2014
Exhibit 11. Share of Medicare Advantage Prescription Drug Plans, by Coverage in the Gap and Plan Type, 2014

A larger share of MA-PDs than PDPs will provide some form of gap coverage. Fifty percent of MA-PDs will provide some form of gap coverage in 2013, as compared to 17 percent of PDPs, down from 30 percent in 2013.13  One reason for this difference is that the structure of MA-PDs allows plans to offset prescription drug costs using any savings in Part A and B services. These savings are declining because the ACA gradually reduces the Medicare Advantage benchmark payments, which currently are higher on average than the per capita costs of traditional Medicare in many counties.

Back to top

.

Discussion

In 2014, Medicare beneficiaries will continue to be able to choose from among many Medicare Advantage plans, offered by many firms, in virtually all parts of the country. HMOs continue to be more numerous than other plan types, but the availability of local PPOs is growing. Regional PPOs also remain available to many Medicare beneficiaries, although a relatively small number of firms offer them.  While PFFS plans were available in large numbers between 2006 and 2009, many fewer PFFS plans are now being offered and their role has been eclipsed by local and regional PPOs.  The reduction in PFFS plans is generally consistent with the federal intent behind MIPPA that established network requirements for PFFS plans in order to enhance the value of these plans for beneficiaries and improve their ability to manage care.  The dominance of a few large firms in the Medicare Advantage marketplace probably warrants ongoing monitoring to ensure that such concentration does not limit competition, particularly on value and quality of care.

While the 2014 Medicare Advantage marketplace will look much as it does in 2013, five percent of Medicare Advantage enrollees will need to change plans as their plan will no longer be available in 2014, most of whom should have little problem finding a substitute plan with similar characteristics, often from the same company.  Current MA-PD enrollees who stay in the same plan in 2014 are expected to see average monthly premiums rise by nearly $5.  Limits on out-of-pocket spending are also expected to rise, by just over $600, on average.  The uptick in premiums for enrollees who do not switch plans, and the increase in average out-of-pocket limits, may be a response by insurers to the payment reforms included in the ACA. Additional research is needed to explore whether plans are making other changes in 2014 to constrain costs, for example, by increasing cost-sharing requirements for individual services or narrowing provider networks, which might have important implications for beneficiaries.

Beneficiaries who review the plans offered in their area may be able to find a plan that could lower their costs.  Yet, a growing body of evidence suggests a high level of inertia, with few beneficiaries in Part D switching plans from one year to the next.14   As the Medicare program and Medicare Advantage continue to evolve, it will be important to continue to monitor change in the choices available to beneficiaries, including plan availability, premiums, benefits, cost sharing, and provider networks, to assess what this means for the financial protection of beneficiaries, and the ability of beneficiaries to access quality care in Medicare Advantage plans.

Back to top

.

Recent Legislative and Regulatory Changes for Medicare Advantage

Over the years, Congress and various Administrations have made a number of changes to payments and participation rules for private risk-bearing plans that contract with the federal government to provide Medicare covered benefits, now called Medicare Advantage plans.  In the past, for example, Congress expanded the range of plans that could be offered to beneficiaries (BBA 1997 and MMA 2003) and imposed new requirements for plans, such as requiring PFFS plans to have networks of providers in most counties (MIPPA 2008).

The Administration also made changes to the rules for Medicare Advantage plans, including policies seeking to encourage the consolidation of low enrollment and duplicative (“look alike”) plans and limit the use of cost sharing features that might adversely affect high cost beneficiaries, beginning in 2010.  In 2011, CMS began requiring plans to limit beneficiaries’ out-of-pocket expenditures to no more than $6,700 annually, with reduced scrutiny of beneficiary cost-sharing for plans that limited out-of-pocket expenses to $3,400 or less.

With respect to payments, after years of increasing federal payments in order to encourage more plans to participate, Congress enacted changes in payment policy in 2010 in response to evidence that Medicare was paying more for Medicare beneficiaries enrolled in Medicare Advantage plans than it would have paid for such beneficiaries in the traditional Medicare program. The Affordable Care Act (ACA) of 2010 (the Patient Protection and Affordable Care Act of 2010 as amended by the Health Care Education Reconciliation Act of 2010) imposed a freeze on maximum payments to plans (benchmarks) through 2010 and 2011, with payment reductions phasing in beginning in 2012, based on relative per capita traditional Medicare costs in the county.  Counties experiencing larger reductions will see them phased in over a longer period of time to minimize disruption. Also, beginning in 2012, plans’ quality ratings are being used to provide bonus payments and determine which plans can enroll beneficiaries throughout the calendar year.

Payments to plans for 2014 will be adjusted for differences in diagnostic coding intensity between Medicare Advantage plans and traditional Medicare (i.e., “coding intensity adjustments”), as well as the possible sequestration of payments to plans as a result of the Budget Control Act.  Plans in 2014 and subsequent years will be required to maintain a medical loss ratio (i.e., the share of federal payments and beneficiary premiums spent on medical services) of at least 85 percent, limiting the amount spent on administrative expenses, including profits, and a new tax on all insurance plans, including Medicare Advantage plans will go into effect beginning in 2014.

For additional information on changes see Kaiser Family Foundation, “Explaining Health Reform: Key Changes in the Medicare Advantage Program,” May 2010; Kaiser Family Foundation, “Medicare Advantage Plan Star Ratings and Bonus Payments in 2012,” November 2011; and Kaiser Family Foundation, “The Budget Control Act of 2011:  Implications for Medicare,” September 2011. 

Back to top

Marsha Gold is with Mathematica Policy Research; Gretchen Jacobson, Anthony Damico, and Tricia Neuman are with the Kaiser Family Foundation.

Issue Brief: Appendix

Appendix

Endnotes

  1.     See Kaiser Family Foundation “Explaining Health Reform: Key Changes in the Medicare Advantage Program, April 29, 2010 http://modern.kff.org/health-reform/issue-brief/explaining-health-reform-key-changes-in-the/. ↩︎
  2.    Plan specific information about cost-sharing requirements and benefits is at www.medicare.gov on the “Find Health and Drug Plan” database. However, this database does not include summary statistics on the characteristics of plans available nationwide or in particular areas. Further research is needed to assess changes in benefits and cost sharing among Medicare Advantage plans over time. ↩︎
  3.   There have been anecdotal reports of some plans making changes in provider networks in 2014.  See, for example, Matthew Sturdevant, “Insurer’s Move Draws Attention of Delegation, AMA,” The Hartford Courant, October 10, 2013. However, data to assess broad-based trends is lacking, making it difficult to assess whether such phenomena reflect specific localized situations or more general trends. ↩︎
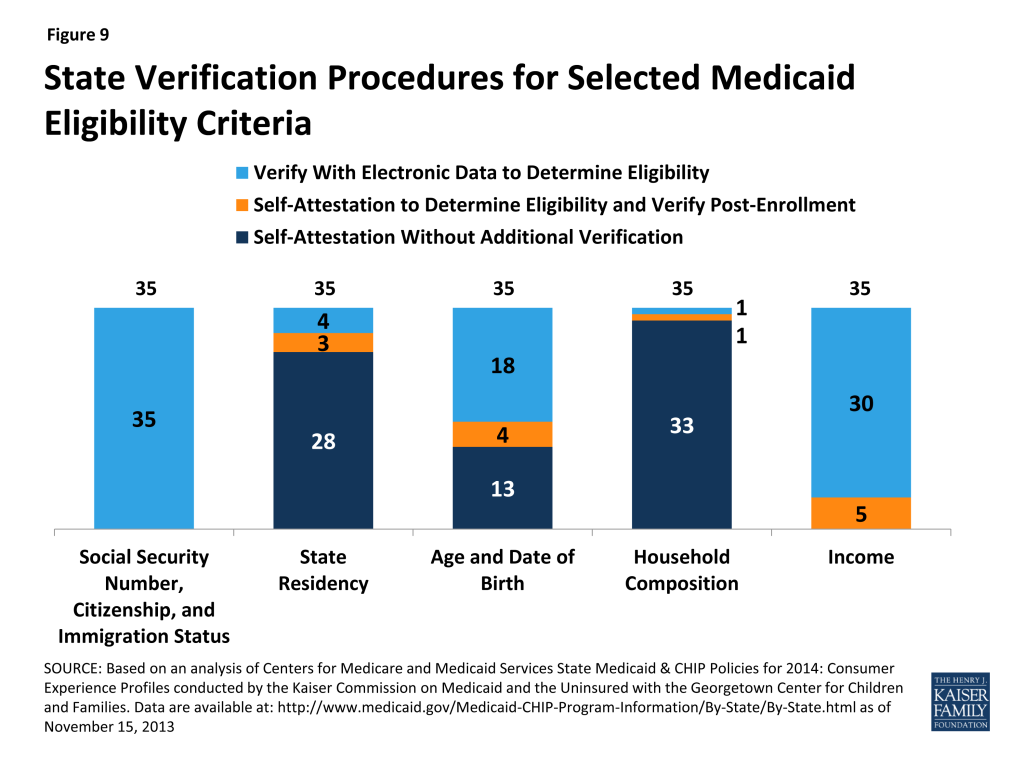
  4.   Data for individual plans offered are contained in the MA and SNP Landscape Source files for 2014 and previous years. http://www.cms.gov/Medicare/Prescription-Drug-Coverage/PrescriptionDrugCovGenIn/index.html ↩︎
  5.    Plan counts exclude group plans and SNPs since they are not available to all beneficiaries for individual enrollment. They also exclude plans with special eligibility or other requirements, including Health Care Prepayment Plans (HCPPs), the Program for All Inclusive Care for the Elderly (PACE), demonstrations, and plans offered by selected groups like the Mennonites. ↩︎
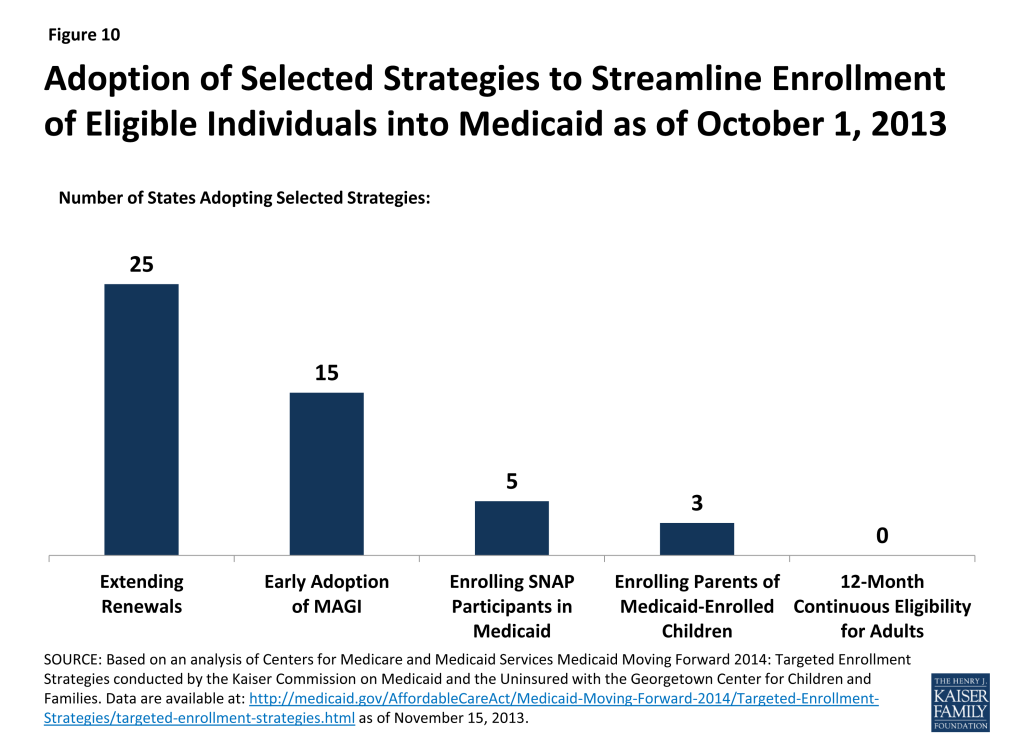
  6.   For additional information see, https://modern.kff.org/medicaid/fact-sheet/state-demonstration-proposals-to-integrate-care-and-align-financing-for-dual-eligible-beneficiaries/ and M. Gold, W. Wang, and G. Jacobson. “Medicare Health Plans and Dually Eligible Beneficiaries:  Industry Perspectives on the Current and Future Market, Kaiser Family Foundation, March 2013. ↩︎
  7. Medicare Advantage plans are required to cover all Part A and B Medicare benefits on an actuarially equivalent basis. While they are not precluded from charging beneficiaries an extra premium for those benefits if the plan’s costs exceed what Medicare pays for such benefits, this is not a very likely option in the current environment given current benchmarks used to set Medicare Advantage rates and the important role premiums play in competing for enrollment. ↩︎
  8.           For 2013 enrollment weighted statistics, see M. Gold, G. Jacobson, A. Damico and T. Neuman. “Medicare Advantage 2013 Spotlight: Enrollment Market Update, June 2013. ↩︎
  9.   M. Gold “Medicare+Choice: An Interim Report Card” Health Affairs 40(4): 120-138, July 2001. See also, M. Gold, M. Hudson, G. Jacobson, and T. Neuman “Medicare Advantage 2010 Data Spotlight: Benefits and Cost Sharing” Kaiser Family Foundation, February 2010. ↩︎
  10.    M. Gold. “Making Sense of the Change in How Medicare Advantage Plans are Paid.” Issue Brief. New York: The Commonwealth Fund, May 2013; and M. Gold and M. Hudson, “Analysis of the Variation in Efficiency of Medicare Advantage Plans Relative to Medicare FFS.” Paper developed for the Commonwealth Fund. Washington, DC: Mathematica Policy Research, Research Brief, May 2013. ↩︎
  11.   This statistic includes both those enrolled in individual and group plans because CMS does not breakdown MA-PD data this way; it only breaks down overall Medicare Advantage data and some of those enrollees are not in a Part D plan. Authors’ calculation from October 2013 data from the 10.17.13 Medicare Advantage, Cost, PACE, Demo and Prescription Drug Plan Organizations—Monthly Summary Report released by CMS on its website at: http: //www.cms.hhs.gov/MCARAdvPartDEnrolData/.) ↩︎
  12. In contrast, free-standing prescription drug plans all have some associated premium, with the average monthly PDP premium in 2013 at $39.90 (weighted by 2013 enrollment, assuming currently enrolled beneficiaries remain in their current plan). This is a 5 percent increase from the weighted average monthly premium of $38.14 in 2013 and a 54 percent increase from 2006, the first year of the Medicare Part D drug benefit.  See J. Hoadley, et al. “Medicare Part D: A First Look at Plan Offerings in 2014” Kaiser Family Foundation Issue Brief, October 2013. ↩︎
  13.            J. Hoadley, et al. op site. The paper indicates that 82 percent of PDPs will offer no or limited gap coverage, including 76 percent with nothing and an additional 6 percent with fewer than 10 percent of drugs on their formulary coverage. ↩︎
  14. J. Hoadley, et al. “To Switch or Not to Switch: Are Medicare Beneficiaries Switching Drug Plans to Save Money?”  Kaiser Family Foundation, October 10, 2013. ↩︎
Poll Finding

Kaiser Health Tracking Poll: November 2013

Published: Nov 22, 2013

The latest Kaiser Health Tracking Poll finds the public’s views souring on the Affordable Care Act (ACA) in November, with about half having an unfavorable view of the law and a third having a favorable view, a gap that was seen only once before, during the Republican presidential primaries in 2011. This negative shift in opinion comes amid heavy news coverage of the website problems plaguing the law’s online health insurance exchanges and stories about individuals being dropped from their insurance coverage because their plans don’t meet minimum requirements set by the ACA, stories that were followed closely by more than half the American public this month. The partisan divide on the law continues, but support among Democrats dropped sharply this month after rallying in September and October. Views among women also shifted this month, and for the first time in Kaiser tracking, the share of women with an unfavorable view outnumbered those with a favorable view by a large margin (48 percent versus 32 percent). Visibility of the health insurance exchanges increased among the public overall in November, but reaching the uninsured with information remains a challenge – about four in ten uninsured say they’ve heard nothing at all about the new marketplaces to date, and two-thirds say they still don’t have enough information about the law to know how it will impact them. Still, nearly six in ten of those who currently lack coverage say they plan to get insurance in 2014.

Overall Views Of The ACA Take A Negative Turn

Amid heavy news coverage of HealthCare.gov’s website problems and stories about individuals being dropped from their insurance plans, the American public’s overall views of the ACA took a negative turn in November. This month, roughly half (49 percent) say they have an unfavorable view of the law and a third (33 percent) have a favorable view. In nearly four years of Kaiser tracking on the law, the gap between negative and positive views (currently 16 percentage points) has been this large only once before, in October 2011 (17 percentage points) when the ACA was getting lots of negative attention in the Republican presidential primaries and the country was focused on the upcoming election and the Occupy Wall Street movement.

Figure 1

Views of the law shifted more negative this month among most demographic groups, but the drop was sharpest among Democrats. After rebounding in September and October, the share of Democrats viewing the law favorably stands at 55 percent in November, closer to where it had been earlier in 2013.

Figure 2

Women, who have historically been evenly divided on the law, registered their most negative views on the law to date, with 48 percent saying they have an unfavorable view of the law and 32 percent favorable. The gap between unfavorable and favorable views among women is up 15 percentage points since last month.

Figure 3

This negative shift in views of the law may be driven more by concern about the law’s impact on the country overall than on one’s personal situation. While a plurality says they don’t think the law will make much difference for their own families (a share that hasn’t changed much over the past year), the share saying the country will be worse off under the law reached a new high in Kaiser polling this month. Forty-three percent now say the law will leave the country worse off (up from 38 percent last month), compared with 34 percent who think the country will be better off and 15 percent who say it won’t make much difference.

Figure 4

Figure 5

More Than Half Paying Attention To News About Website Problems And Dropped Coverage

This negative shift in views comes at a time when the public reports paying close attention to news stories related to the ACA. Over half (55 percent) say they have followed news about website problems with the health law’s online insurance marketplaces “very” or “fairly” closely (roughly equal to the share who reported following these stories in October). The same share reports paying close attention to news stories about people being dropped from their health insurance. Attention to both of these news stories trails behind attention to reports about U.S. economic conditions.

Figure 6

The public’s evaluation of the news coverage they’ve seen is somewhat mixed. More than half say news coverage of the law has been mostly about politics and controversies, while fewer than one in ten say it’s been mostly about how the law will impact people and three in ten say it’s been a mix of the two. While four in ten say the news coverage they’ve seen has been mostly balanced, almost twice as many believe coverage is biased against the law as say it is biased in favor (33 percent versus 17 percent).

Figure 7

Visibility Of Health Insurance Marketplaces Increases, But Reaching The Uninsured With Information Remains A Challenge

Just over a month into open enrollment in the ACA’s health insurance exchanges, visibility of the new marketplaces has increased. This month, 42 percent of the public say they have heard “a lot” or “some” about the health insurance marketplace, twice the share who reported hearing as much in September. Among the uninsured, a key target group for outreach, visibility of the exchanges has also increased since September (from 15 percent to 29 percent), though it remains lower than among the general public.

FIGURE 8: Visibility of ACA’s Health Insurance Marketplaces Increases in November
As you may know, the health care law creates health insurance exchanges or marketplaces where people who don’t get coverage through their employers can shop for insurance and compare prices and benefits. How much, if anything, have you heard about this new health insurance marketplace, also known as (STATE EXCHANGE NAME)] in your state?
Total publicUninsured (age<65)
Nov-2013Sept-2013Nov-2013Sept-2013
A lot225154
Some20141411
Only a little31323332
Nothing at all25483852

Reaching the uninsured with information remains a challenge – 38 percent of those without insurance say they have heard “nothing at all” about the health insurance marketplace, and two-thirds (65 percent) still feel they do not have enough information about the law to understand how it will impact them and their family. Advertising is one way the uninsured may learn about the law, and this month, 35 percent of the uninsured say they saw at least one ad providing information about how to get coverage.

Despite the information challenge, nearly six in ten (58 percent) of the uninsured say they plan to get health insurance in 2014, while a third (34 percent) say they won’t get coverage and 8 percent are unsure.

Historical Lessons From Medicare Part D?

Since October 1, many journalists and others have drawn parallels between the ACA’s troubled rollout and the Medicare “Part D” prescription drug benefit, which some say had a similarly rocky launch in 2006. Among seniors, the program was unpopular at first; 50 percent had an unfavorable view of the program and 28 percent a favorable view in December 2005, just before enrollment began. In November 2006, when the first year enrollment was complete and most of those who enrolled had some experience using their new plans, views were more positive, with 42 percent of seniors expressing a favorable view of the program and 34 percent an unfavorable one.

The latest Kaiser Health Tracking poll finds that seven years later, the Medicare Part D benefit is quite popular: 63 percent of seniors view it favorably and just 14 percent view it unfavorably. Among those who are enrolled in a prescription drug plan, 85 percent say their experiences using the benefit have been positive, including six in ten (59 percent) who say they’ve been “very” positive.

Of course, it is far too early to tell what will happen to public opinion on the ACA as it moves through the next phase of implementation, but the Medicare Part D experience suggests that it is not unusual for a new law of this sort to be poorly perceived at the outset.

Figure 9

This Kaiser Health Tracking Poll was designed and analyzed by public opinion researchers at the Kaiser Family Foundation (KFF) led by Mollyann Brodie, Ph.D., including Liz Hamel, Bianca DiJulio, and Jamie Firth. The survey was conducted November 13-18, 2013, among a nationally representative random digit dial telephone sample of 1,204 adults ages 18 and older, living in the United States, including Alaska and Hawaii (note: persons without a telephone could not be included in the random selection process). Computer-assisted telephone interviews conducted by landline (602) and cell phone (602, including 342 who had no landline telephone) were carried out in English and Spanish by Princeton Data Source under the direction of Princeton Survey Research Associates International (PSRAI). Both the random digit dial landline and cell phone samples were provided by Survey Sampling International, LLC. For the landline sample, respondents were selected by asking for the youngest adult male or female currently at home based on a random rotation. If no one of that gender was available, interviewers asked to speak with the youngest adult of the opposite gender. For the cell phone sample, interviews were conducted with the person who answered the phone. KFF paid for all costs associated with the survey.

The combined landline and cell phone sample was weighted to balance the sample demographics to match estimates for the national population using data from the Census Bureau’s 2011 American Community Survey (ACS) on sex, age, education, race, Hispanic origin, nativity (for Hispanics only), and region along with data from the 2010 Census on population density. The sample was also weighted to match current patterns of telephone use using data from the July-December 2012 National Health Interview Survey. The weight takes into account the fact that respondents with both a landline and cell phone have a higher probability of selection in the combined sample and also adjusts for the household size for the landline sample. All statistical tests of significance account for the effect of weighting.

The margin of sampling error including the design effect for the full sample is plus or minus 3 percentage points. Numbers of respondents and margin of sampling error for key subgroups are shown in the table below. For results based on other subgroups, the margin of sampling error may be higher. Sample sizes and margin of sampling errors for other subgroups are available by request. Note that sampling error is only one of many potential sources of error in this or any other public opinion poll.

GroupN (unweighted)M.O.S.E.
Total1204±3 percentage points
Uninsured, under age 65151±8 percentage points
Age 65 or older356±6 percentage points
Democrats346±6 percentage points
Republicans295±7 percentage points
Independents388±6 percentage points
Men578±5 percentage points
Women626±5 percentage points
Poll Finding

Data Note: Attempting to Measure Early Impact of the ACA through National Public Opinion Polls- A Note of Caution and What to Watch For

Published: Nov 22, 2013

October 1, 2013 was a landmark date for the Affordable Care Act (ACA), with the start of open enrollment in the law’s Health Insurance Marketplaces and the growth of Medicaid enrollment in some states. Several weeks into open enrollment, many people – including journalists, policymakers, and the public at large – are eager for early data indicating how the law is working from the perspective of potential enrollees. In particular, given the problems with Healthcare.Gov and some of the state exchange websites, many people want quantitative data about people’s experiences attempting to purchase or enroll in some sort of health insurance coverage using these mechanisms. In the long run, data from large federal surveys will be available to help answer questions about the enrollment experience, but in the short term, some may turn to national public opinion polls to see what can be learned.

In this Data Note, we raise a note of caution about the possible pitfalls of using standard national public opinion polls to make judgments about Americans’ early experiences with health plan enrollment under the ACA.

What To Watch For: Incidence Of Key Groups Is Low

The primary issue with trying to assess the early impact of the ACA through national, random sample surveys that use a standard methodology and sample size comes down to raw numbers. There generally just aren’t enough people to look at.

Let’s start with the broadest group that stands to be impacted by the ACA’s coverage expansions: the roughly 40 million adults who are currently uninsured, comprising roughly 21 percent of the nonelderly adult population. While a substantial share by most measures, this amounts to relatively few interviews when translated to a nationally representative, random sample survey.

To make it more concrete, a typical national public opinion poll with a total sample size of 1,200 adults yields between 140 to 175 interviews with uninsured individuals.1  The margin of sampling error (MOSE) around survey estimates based on this group is in the range of plus or minus 8 to 10 percentage points. While it’s possible to use a poll of this type to report broadly on the views and experiences of the uninsured, the sample size constrains pollsters’ ability to detect changes over time. For example, in a typical national public opinion poll with a MOSE of plus or minus 3 percentage points, if the survey finds 35 percent of people overall report a certain behavior, the chances are very high (95 out of 100) that if you interviewed the whole population, the “real” answer would lie between 32 percent and 38 percent.  For a subgroup the size of the uninsured, with a MOSE of plus or minus 10 percentage points, the likely range of answers widens from 25 percent to 45 percent. One of the key questions people will want to answer about ACA enrollment is whether the share of the uninsured who are attempting to sign up for coverage is increasing or decreasing. With such a wide MOSE range around each point estimate, it will be difficult for pollsters to answer this type of question by detecting changes over time. Further, starting with a group of this size makes it difficult (and sometimes impossible) to analyze subgroups of interest within the uninsured (for example, young adults).

Another group that the media has focused on recently amid reports of cancelled insurance policies is those who purchase insurance on the individual market. This group amounts to about 8.5 million adults, or roughly 5 percent of the nonelderly adult population, and represents fewer than 100 interviews out of a typical 1,200 person survey. In this case, the MOSE is so large that most researchers consider estimates based on this population to be too unreliable to report.2 

Further complicating matters is the fact that looking at all the uninsured as one undifferentiated group misses some of the important complexities of the law. In fact, there are many individual characteristics that will impact people’s eligibility for various coverage options under the ACA. For example, subsidies to help people purchase coverage are available for those within a certain income range based on the federal poverty level (FPL), which is calculated using a formula that includes household size and income.3  Asking the right questions to determine where an individual falls on the FPL scale is complicated, and survey respondents are often hesitant to divulge all of the information necessary to make the calculation. While researchers often ask these questions on surveys that focus on poverty and income, these questions take up valuable time on a survey, and are outside the scope of most national opinion polls.

Determining eligibility for the Medicaid expansion is also complicated. Prior to the ACA, each state had its own set of rules to determine eligibility. The law was initially intended to expand Medicaid to cover all individuals with incomes of 138 percent of the FPL or less, but the 2012 Supreme Court ruling made the Medicaid expansion optional for states. As a result, determining whether an individual is eligible for Medicaid depends not only on where they fall on the FPL scale, but also on the state in which they reside. The bottom line for national public opinion polls with traditional sample sizes in the range of 1,000 to 1,200 is that it will be impossible to break out the experiences of these various groups with any specificity.

It is also worth noting that some people will think they are eligible for coverage under the ACA when in fact they are not.  For example, undocumented immigrants are not eligible to enroll in Medicaid or participate in the exchanges, but in some parts of the country they make up a significant share of the uninsured.  A recent Kaiser survey of the uninsured in California found that about a fifth of the state’s uninsured self-identified as being undocumented,4  and that nearly half this group thought they may be eligible for coverage through Medicaid or the California exchange. Ideally, the undocumented should be excluded from survey estimates of enrollment experiences. However, like income, immigration status is a sensitive topic, and while it is possible to tackle this issue in more targeted projects like the Kaiser California Uninsured Survey, this is another topic that is outside the scope of most national surveys.

When it comes to quantifying the experiences of those who have enrolled so far, the case for using national surveys is even bleaker. The Obama Administration reported that as of the start of November, 106,185 people had enrolled using the exchanges and 396,261 were deemed eligible for Medicaid or the Children’s Health Insurance Program.5  This represents a tiny fraction of the overall adult population, and would be impossible to identify in a typical national random sample survey.

Even by the end of 2014, when CBO projects that roughly 7 million people will enroll in health insurance through the exchanges and 9 million will gain coverage through Medicaid or the Children’s Health Insurance Program,6  this only represents roughly 2 to 3 percent of the total nonelderly population (including children) and is still too few to expect to reliably break out in a national survey with a typical sample size.

FIGURE 1: Numbers And Percentages Of Some Key Groups Of Interest In Measuring ACA Impact
Estimated number of nonelderly adults (millions)Percent of nonelderly adult populationEase of identifying via surveyNumber of interviews in a typical national random sample survey (N=1200)MOSE range (plus or minus X percentage points)
Currently uninsured7 40.221%Easy140-1758 to 10
Currently purchase own insurance in individual market8 8.55%Easy75-9012 to 13
Eligible for subsidies to purchase insurance in the exchanges (includes currently insured)9 16.39%Difficult (requires FPL calculation)65-8013 to 14
Uninsured and eligible for Medicaid as of January 2014 (includes newly eligible + previously eligible)10 8.75%Very difficult (requires FPL calculation and varies by state)30-40>15
Uninsured and undocumented11 5.73%Difficult (sensitive questions)15-30>15
Currently uninsured, not tax credit eligible, and would have been eligible for Medicaid but live in a state not expanding (the “gap” group)12 4.8 3%Very difficult (requires FPL calculation and varies by state)15-30>15

What To Watch For: Impacted Groups Are Under-Represented In Surveys

Another complicating factor in using standard national public opinion polls to measure early ACA impact is that some of the groups most likely to have early experiences with the law, including those with lower incomes and those who speak a language other than English, are populations that are often under-represented in surveys. Weighting survey data to national demographic benchmarks helps account for this under-representation and ensures that the overall survey results are nationally representative, but the fact remains that this phenomenon exacerbates the issue of having too few interviews with individuals in these groups to reliably describe their experiences with the law.

This is even the case with the Kaiser Health Tracking Poll, despite the fact that we take special measures and make extra efforts to maximize inclusion of these groups, such as completing half the survey interviews via cell phones (which younger people and racial and ethnic minorities use in disproportionate numbers) and offering respondents the option of being interviewed in Spanish or English. The tracking poll has a minimum overall sample size of 1,200 and in some months is increased to 1,500. These extra measures all increase the cost of conducting a survey, which does not fit within many polling organizations’ budgets. As a result, many polls reported in the news are based on surveys with smaller overall sample sizes, fewer cell phone interviews, and English-only interviewing. While these methodological details may not have a significant impact on a survey’s ability to represent the overall views of adults nationally, they can make a big difference when it comes to measuring the experiences of some of the groups described above. Surveys conducted via the Internet can be particularly problematic, given the lower level of Internet access and online experience among this population.

What To Watch For: Asking The Right Questions To Determine Actual Experiences Is Complicated

Another major challenge is designing survey questions that will correctly identify those who actually tried to sign up for coverage through the ACA and what their experiences were. While it might be tempting to just ask Americans whether they had tried to sign up for health insurance at Healthcare.Gov, this would certainly provide a misleading result. While much of the news coverage has focused on enrollment through the federal website, there are actually many different ways people can start the enrollment process, many different pathways through the process, and many different potential outcomes. Individuals attempting to sign up online may start not at Healthcare.Gov but at their own state’s exchange website (if they live in a state that is administering its own exchange). Alternatively, they may go to a state Medicaid office, meet with an ACA Navigator or Assister, or call either a national or state-based telephone help line. Some may start the process at the health insurance exchange but end up enrolling in Medicaid. Others may find that they’re eligible to purchase coverage through the exchange but not to receive federal subsidies to help pay for their coverage. Some may go to the website or seek in-person help with the intention of signing up for coverage right away, and others may go to gather information and plan to sign up for coverage later. Many will have no idea that their experience was brought to them by the ACA at all. These are just a few of the factors that complicate any effort to quantify a single “enrollment experience.”

Moving Forward: What Can We Learn About ACA Implementation From National Public Opinion Polls, And What Other Vehicles Might We Look To For Reliable Information?

While not a good vehicle for measuring early enrollment experiences, national public opinion polls can provide other types of useful information for those trying to gauge how ACA implementation is going. For example, polls can measure the public’s perceptions (how well do people think the rollout is going?), understanding and awareness (are they learning more about the law over time?), media exposure (what are they hearing on the news and what is their reaction to the news?), and opinions (does all of this change how they feel about the law overall, or not?). National polls can also be used to gauge the types of discussions people are having with their family and friends about their experiences, giving a sense of what the national dialogue is like. These are the types of questions we have asked over time in the Kaiser Health Tracking Poll, and we’ll continue to do so going forward.

With the Kaiser Health Tracking poll, we’ll also continue to report broadly on the views of the uninsured. While we can’t use this survey to break them down into the Medicaid eligible or the exchange shoppers, or to quantify their enrollment experiences, we can measure things like the extent to which they feel they understand the law, the extent to which they feel the law is helping or hurting them, their awareness of the individual mandate, and whether they intend to seek coverage over the next year or plan to remain uninsured.

For more in-depth data on enrollment experiences, we’ll rely on specially designed projects, like the Foundation’s panel survey of 2,000 randomly selected uninsured Californians.13  The baseline survey was conducted last summer, before the ACA open enrollment period, and the next wave will follow up with the same respondents in March, exploring who signed up for coverage, what choices they made, and how they evaluate their experience and the coverage they obtained. Projects like this take a longer time to field than a typical national opinion poll, but allow us to address some of the methodological concerns raised above to provide reliable data describing the experiences of key groups targeted by coverage expansion under the ACA.

  1. For comparison, a survey of that size yields roughly 500 interviews with people ages 18 to 64 with employer-sponsored coverage, with a margin of sampling error (MOSE) of about plus or minus 5 percentage points. ↩︎
  2. Our own standard for the Kaiser Health Tracking Poll is not to report on subgroups with a sample size under N=100 in any given survey. ↩︎
  3. For questions of health insurance eligibility, the FPL calculation is actually even more complicated, since both income and family size are based not on total household members, but on “health insurance units,” defined as members of a family who can be covered under one insurance policy, which requires additional questions about family composition. ↩︎
  4. See https://modern.kff.org/health-reform/report/californias-uninsured-on-the-eve-of-aca-open-enrollment/. In that survey, undocumented immigrants were defined as those who reported they were born outside the United States, came to the U.S. without a green card, and have not received a green card or become a permanent resident since arriving. ↩︎
  5. HHS press release, Nov. 13, 2103: http://www.hhs.gov/news/press/2013pres/11/20131113a.html ↩︎
  6. Congressional Budget Office May 2013: http://www.cbo.gov/publication/44190 ↩︎
  7. Kaiser Family Foundation, The Uninsured: A Primer – Key Facts about Health Insurance on the Eve of Coverage Expansions, http://modern.kff.org/uninsured/report/the-uninsured-a-primer-key-facts-about-health-insurance-on-the-eve-of-coverage-expansions/ ↩︎
  8. Kaiser Family Foundation analysis of the Survey of Income and Program Participation, April to July 2010 (unpublished number) ↩︎
  9. Kaiser Family Foundation analysis of 2012-2013 Current Population Survey (unpublished number) ↩︎
  10. Kaiser Family Foundation analysis of 2012-2013 Current Population Survey (unpublished number) ↩︎
  11. Kaiser Family Foundation analysis of 2012-2013 Current Population Survey (unpublished number) ↩︎
  12. Kaiser Family Foundation, The Coverage Gap: Uninsured Poor Adults in States that Do Not Expand Medicaid, http://modern.kff.org/health-reform/issue-brief/the-coverage-gap-uninsured-poor-adults-in-states-that-do-not-expand-medicaid/ ↩︎
  13. California’s Uninsured on the Eve of ACA Open Enrollment: The Kaiser Family Foundation Baseline Survey, https://modern.kff.org/health-reform/report/californias-uninsured-on-the-eve-of-aca-open-enrollment/ ↩︎

Leveraging Medicaid in a Multi-Payer Medical Home Program: Spotlight on Rhode Island’s Chronic Care Sustainability Initiative

Authors: Julia Paradise, Marsha Gold, and Winnie Wang
Published: Nov 21, 2013

This last of three case studies examining key operational aspects of coordinated care initiatives in Medicaid focuses on Rhode Island’s Chronic Care Sustainability Initiative (CSI), a multi-payer patient-centered medical home program in which the one Medicaid health plan and all commercial health plans in the state participate. Hallmarks of the initiative are the engaged leadership of the health insurance commissioner and key stakeholders; mandatory participation by commercial insurers, but participatory governance; a common developmental contract used by all payers; and investments in health information technology and other support for practice transformation. Medicaid’s large role as a payer makes it a key source of leverage in multi-payer initiatives, and Medicaid plan and provider experience serving populations with complex needs can also benefit such endeavors. Alignment of goals, performance metrics, practice transformation resources, and incentives across payers sends practices and providers coherent policy and financial signals regarding desired models and outcomes of health care delivery, and increases their potential impact.

Executive Summary

This last of three case studies examining key operational aspects of coordinated care initiatives in Medicaid focuses on Rhode Island’s Chronic Care Sustainability Initiative (CSI). This multi-payer, patient-centered medical home (PCMH) initiative includes the one Medicaid health plan in the state and the commercial health plans, one of the largest of which has many Medicaid as well as commercial enrollees. These payers provide practices that participate in the CSI with financial incentives and practice transformation resources to develop a sustainable model of patient-centered chronic care for adults. The payers use a common contract with the practices that specifies uniform requirements and performance metrics, and they pay practices a uniform monthly per capita care management fee to support nurse care managers, who are integral to Rhode Island’s model. These fees and other investments in practice transformation also help finance data infrastructure at the practice level that is necessary to support a PCMH. CSI policy development and practices are guided by a multi-stakeholder group in a governance structure shaped by the consensus-oriented style and leadership of Rhode Island’s health insurance commissioner. The Office of the Health Insurance Commissioner (OHIC) and the Executive Office of Health and Human Services (EOHHS), where the Medicaid program resides, convene the project jointly.

KEY THEMES

The common contract is central to the multi-payer system. When multiple payers use a common contract, practices face uniform metrics, requirements, and incentives, and can invest in practice improvements that benefit all patients. In the CSI, common contract specifications were developed through a consensus process that included plans and providers. Because an OHIC representative was present at the meetings, antitrust restrictions that would otherwise have barred this process could be waived.

Medicaid participation in a multi-payer initiative presents opportunities and challenges. Because Medicaid is a large purchaser, leveraging its impact matters. Medicaid plan and provider experience in serving high-need populations has benefited the initiative. At the same time, plans and practices with sizeable Medicaid patient panels face challenges, as performance metrics are not risk-adjusted. However, the CSI rewards safety-net practices if they get “half-way to the goal.”

Combining a collaborative model with a mandate is useful. Multi-payer initiatives require buy-in. Even beginning as a voluntary pilot, the CSI might have been hard to launch without the health insurance commissioner’s leadership. Plans acknowledged that the subsequent mandate to participate probably helped move the PCMH effort forward statewide, but, importantly, consensus-style governance has lent acceptability to the mandate. Because the mandate operates through the OHIC, it covers commercial insurers, but it does not extend to self-insured employers or public purchasers. However, the Medicaid plan has always participated, and commercial plans must now pay practices care management fees for their Medicaid as well as their commercial members.

Collaboration requires time, effort, and leadership. The operation of a multi-payer initiative requires plans, practices, and purchasers to make significant commitments of time, focus, and effort on an ongoing basis. Active stakeholder leadership and engagement are necessary to build trust among parties and confidence that aligned action can advance shared goals for patient care and delivery system performance.

Multi-payer initiatives and practice transformation require infrastructure and entail new costs. Convening meetings, collecting data centrally to aggregate across payers, and other activities required to manage a multi-payer initiative all cost money. In addition to the overhead and infrastructure costs to manage the system are significant costs for developing infrastructure at the practice level for data collection and analytics, and for other changes, such as integration of nurse care managers. Care management payments to practices provide critical financing to support such transformation. With the expiration of federal grant funds to support health information technology, maintaining adequate funding is challenging.

Maintaining payer support may require evidence of savings. Health plans’ willingness to provide practices with additional support may ultimately depend on a demonstrated return on investment – evidence that investing in primary care is not only improving patient care, but also generating savings somewhere in the system. Some payers wondered whether payment to practices should be more strongly tied to their performance on clinical process and outcome metrics.

Practice transformation is the beginning, not the end, of system change. The CSI has focused mainly on what goes on in primary care practices, but, ultimately, performance should be measured not just at the practice level, but at the system level, using metrics like aggregate rates of hospitalization and emergency department use. At this writing, hospitals were not yet at the CSI table, but, more recently, the state has been engaging hospitals and has added performance measures on hospital use that are tied to payment.

LOOKING AHEAD

Rhode Island has been successful in engaging plans, providers, and purchasers in a broad medical home initiative. A multi-payer system, including Medicaid in this case and several others nationwide, translates into important advantages for practices and providers, giving them a common, aligned set of goals, performance metrics, practice transformation resources, and incentives. Rhode Island’s ability to implement the CSI was enhanced by engaged leadership, a mixed regulatory-collaborative approach, the state’s small size, and the small number of major payers. Even under these conducive conditions, the organizational commitment, investment, and resources required to develop and implement a multi-payer PCMH initiative have been extensive, and mustering the necessary financing is a formidable, ongoing challenge. While the CSI model may not be feasible in other states, or may need adaptation, it illustrates the potential to leverage Medicaid’s role as a payer to transform health care delivery. Ultimately, to succeed most fully in improving care and reducing costs, multi-payer initiatives will need to extend beyond the sphere of primary care to engage specialists, hospitals, and others in the medical neighborhood. As the ACA expansion of coverage takes effect, and states and other entities seek to improve care delivery and orient payment toward performance, both the scale and momentum of multi-payer initiatives like the CSI can be expected to grow.

Issue Brief: Introduction

In recent years, a growing number of states have undertaken major delivery system reforms in Medicaid, seeking to improve care coordination and health outcomes for Medicaid beneficiaries, and to reduce spending growth in the program. To help inform the development of such initiatives in other places, the Kaiser Commission on Medicaid and the Uninsured worked with Mathematica Policy Research to examine key operational features of coordinated care initiatives in Medicaid in three states – Colorado, North Carolina, and Rhode Island. This issue brief focuses on Rhode Island’s Chronic Care Sustainability Initiative (CSI), a multi-payer, statewide patient-centered medical home (PCMH) initiative. Because Medicaid is the largest health care purchaser in the state, the program’s participation in Rhode Island’s initiative is one crucial source of its leverage.

The information and perspectives presented here are based on a review of CSI program documents and on telephone interviews with the program managers, two large participating health plans, and two participating practices with Medicaid patients — a community health center, and an office-based practice with both commercially-insured and Medicaid patients.

Issue Brief: Program Overview

The CSI, which launched in 2008, had its origins in Rhode Island’s participation in a 2006 foundation-funded initiative that aimed to align public purchasers, private purchasers, and health plans in regional partnerships to more effectively leverage improvements in care for people with chronic conditions.1  Rhode Island has used this multi-payer strategy to support the PCMH model statewide.2  With strong leadership from the state’s health insurance commissioner, a multi-stakeholder group determined that the pilot program should align quality improvement and financial incentives among purchasers, health plans, and providers; improve chronic care in primary care settings; and make primary care a more attractive and viable specialty in Rhode Island.3  The idea was to use the leverage of the state’s large capitated health plans and Medicaid’s major role as a purchaser to drive the desired improvements.

Participating payers

Since the beginning, the CSI has included the two largest commercial health plans in the state – Blue Cross & Blue Shield of Rhode Island (BCBS) and UnitedHealth Care (UHC) – and the state’s one Medicaid health plan, Neighborhood Health Plan of Rhode Island (NHP). (UHC has many Medicaid as well as commercial members.) These payers provide practices that participate in the CSI with financial incentives and practice transformation resources to develop a sustainable model of patient-centered chronic care for adults.

Originally a voluntary pilot, the CSI was formalized in 2011 by state legislation, sponsored by the health insurance commissioner, mandating that all state-regulated (i.e., commercial) health plans participate. In 2012, Rhode Island required all commercial plans with Medicaid contracts to participate in the CSI. As a result, these plans are now required to pay supplemental care management fees to participating practices not just for their commercial enrollees, but also for their Medicaid enrollees if the practice serves at least 200 of them. Medicare began to participate in the initiative when CMS selected Rhode Island for the Multi-Payer Advanced Primary Care Practice (MAPCP) demonstration in July 2011. Therefore, participating practices now receive supplemental payments for Medicare beneficiaries, Medicaid beneficiaries in managed care (about 60% of the total Medicaid population), and privately insured patients. Because the CSI does not include Medicaid patients who are enrolled in the state’s fee-for-service primary care case management (PCCM) program, the PCCM program was outside the scope of this study. However, we were told that, like CSI practices, primary care providers in the PCCM program receive supplemental fees to support nurse care managers, and that the state uses the same performance metrics in both programs. In addition, the Executive Office of Health and Human Services (EOHHS), where the Medicaid program resides organizationally, is a co-convener of the project with the Office of the Health Insurance Commissioner (OHIC) and has taken a more active role in the initiative in recent years. State Medicaid officials attend CSI meetings and the program provides non-financial support for the initiative.

Participating practices

Practices must be selected for the CSI in order to receive supplemental payments from plans. Initially, in 2008, five primary care practices identified as “champions” were selected to participate. Eight more practices were added in 2010, three were added in 2012, and consistent with the state’s strategic plan, 20 practices were added in 2013, including several multi-site practices. The initiative now includes 36 practices, 48 practice sites, and 297 physicians serving an estimated 250,000 Rhode Islanders, approximately 25% of the state’s total population. Under the strategic plan, another 20 practices will be added in each of the next four years and the initiative is slated to serve more than 500,000 patients.  At the end of 2012, Medicaid managed care enrollees accounted for about 25% of patients in CSI practices, commercial enrollees constituted 51%, Medicare Advantage enrollees made up 9%, and Medicare fee-for-service beneficiaries made up 15%.4 

Core features

The following elements are central to the multi-payer medical home initiative:

A common developmental contract, which all health plans use with participating practices.5  Appendix 1 outlines key elements of the developmental contract: supplemental payments, required practice improvements, performance metrics, and staging of the contract provisions as practices come on line.

A uniform per member per month (PMPM) fee for care coordination, which all plans pay participating practices, and which help finance the practice infrastructure needed to support a PCMH. Practices can also earn additional performance incentive payments.

Practice transformation investments, to support the addition of a nurse care manager, in particular. These investments also support the development and use of electronic health record (EHR)-based performance metrics, and participation in learning collaboratives.

A multi-stakeholder leadership group, which guides CSI policy development and practice transformation.

Governance, authority, and operational management

The health insurance commissioner’s leadership and Rhode Island’s small size and long history of collaboration among major stakeholders have had a defining influence on the CSI’s development and structure. All those interviewed considered the health insurance commissioner’s leadership to have been instrumental in engaging commercial insurers in the initiative and enabling them to develop a common contract. The fact that many of the key actors in the CSI go back years together has also been helpful. The medical directors from several health plans trained together, the health insurance commissioner was formerly the director of NHP, and the current Medicaid medical director was the original CSI project staff person.

Governance. Governance of the CSI was structured to be collaborative and participatory.6  A large Steering Committee and a smaller Executive Committee set strategic direction for the CSI and are responsible for its overall governance; they include representation from the three major stakeholder groups – providers, payers, and purchasers (i.e., employers and Medicaid). The Steering Committee develops consensus on major issues, such as chronic conditions to be targeted, metrics, and payment strategies. While not required to do so, the Executive Committee also operates by consensus. Appendix 2 shows the governance structure, which, besides the Steering Committee and an Executive Committee, includes Working Committees on data and evaluation; practice training support and transformation; practice reporting; payment reform/contracting; and service expansion and integration. The purpose and scope of these Working Committees are outlined in Appendix 3.

The governance structure has remained largely unchanged, although it is now being refined and more formally constituted. In 2013, a Patient Advisory Subcommittee is being introduced to serve as the voice of patients and families and provide advice and input to the Steering and Executive Committees.7  In addition, a new Marketing and Communications Subcommittee is charged with increasing awareness of PCMH among employers and labor unions, increasing patient participation in PCMH practices; supporting the Patient Advisory Subcommittee, and conducting liaison with other community agencies.

Authority. A broader goal of the health insurance commissioner’s is to increase the role of primary care in health care delivery. Operationally, his strategy is to shift Rhode Island’s “primary care spend” from 8% of total health care spending currently, to 30%. To move in this direction, he has required state-regulated insurers to increase the share of their premiums spent on primary care by 1 percentage point per year over the period 2010-2014. Insurer investments in the CSI (e.g., their supplemental payments to participating practices) count toward this required annual increase. The health insurance commissioner has also interpreted his authority to allow him to require plans to contribute to the overhead costs of the data and related infrastructure for the CSI; these costs have grown recently because the federal Beacon Community Program, which provided grants for health information technology and other infrastructure, has ended. Insurer expenditures on these costs also count toward the primary care spend goal.

Operational management. The OHIC, with the support of a staff person then at the state’s Quality Improvement Organization (and now the state’s Medicaid medical director), was responsible for appointing the original Steering Committee and managing CSI’s day-to-day operations. At that time, staffing for the initiative was minimal— just two full-time staff funded by a foundation grant and the health plans. The Rhode Island Foundation, the state’s only community foundation, later served as a vehicle for accepting and handling external funding support for the CSI, and also provided office space for the program. When the original staff left in 2011, the state issued a competitive solicitation for project direction and project management support, and the contract was awarded to Commonwealth Medicine, the medical school at the University of Massachusetts.

Infrastructure. Substantial infrastructure is needed for the CSI to work. Essential components include:

  • Support (staff and facilities) for governance, coordination, and convening;
  • Technical support to assist practices in constructing all-payer, EHR-based clinical metrics and using them to improve performance;
  • Development of interim all-payer, claims-based metrics (e.g., all-cause hospitalizations; ED use) until a permanent, consistent data base that integrates EHR clinical data can be developed;
  • Coaching in practice transformation, particularly for practices newly entering the PCMH; and
  • An annual Consumer Assessment of Healthcare Providers and Systems (CAHPS) survey of patients in CSI practices.

For part of the CSI’s history, the Beacon grant provided crucial financing to the Rhode Island Quality Institute (RIQI) for some of these infrastructure costs (except for the first item).8 9  With Beacon’s expiration, the costs are now being transferred to the CSI itself and payers are being asked to cover more of them. (The RIQI will continue to do portions of the work related to data collection and analysis, but practice transformation services are no longer procured through the RIQI.) As the CSI expands to include more practices, the needs for infrastructure development and funding will grow. In 2013, the annual cost of administering CSI will be $2.2 million, up from about $0.5 million for its first contract, which started in December 2011.10  About half of the total budget will go to organizations providing support to the RIQI for work previously funded under the Beacon grant.11  In early 2013, Rhode Island received a federal grant for up to $1.6 million under the Center for Medicare and Medicaid Innovation (CMMI) State Innovation Models (SIM) initiative, which is designed to foster state-based models for multi-payer payment and health care delivery system transformation.12  Interviewees expressed hope that the award will allow the CSI to develop a more permanent operating model suitable to a broad-based permanent program.

Issue Brief: Key Themes

The common contract is central to the multi-payer model. The common developmental contract was not easily developed, but its use is central to the CSI. The consistency across all payers of a core set of required metrics, and fixed supplemental payments to practices tied to performance expectations, align the incentives and goals that practices face, and encourage practices to pool the supplemental revenues from all their payers to invest in improvements that benefit all their patients. Interviewees representing practices favored having common metrics over different metrics for four or five different payers, and they pointed out that common metrics also reduce overhead costs for practices.

The common requirements were developed through a consensus process involving participating stakeholders (largely plans and providers). Plans had to be willing to modify their existing contract requirements, at least to some extent. For example, a plan might have to give up “home-grown” requirements of its own in favor of the common contract’s emphasis on NCQA accreditation. Similarly, national firms with common requirements across their health plans had to be willing to make exceptions for a plan operating in Rhode Island if the firm’s and the CSI’s requirements differed. Because of anti-trust laws that limit health plans’ ability to discuss pricing with each other, the deliberations that produced consensus on certain requirements of the common contract would not have been feasible except for the health insurance commissioner’s central convening authority. Specifically, the common developmental contract requires health plans to make a uniform contribution to practices to finance infrastructure-building. Such payments are legally considered to be pricing-related, but the discussion could take place as long as it was convened by OHIC.

Medicaid participation in a multi-payer system presents opportunities and challenges.

Leverage and experience. Because Medicaid is such a large purchaser in Rhode Island – it accounts for a substantial share of health care costs in the state – the ability to leverage the program is integral to the CSI’s impact. Although the majority of adults in Rhode Island are commercially insured, Medicaid is the dominant source of coverage in some CSI practices and covers a substantial share of patients in others. As Medicaid plan officials see it, an important gain from the CSI is that, with all payers at the table, Medicaid and commercial plans can learn from each another. Small plans get what one interviewee described as “a brain trust of medical directors committed to improving quality and re-engineering change in office-based care.” CSI principals say that the initiative has benefited significantly from the experience of plans and safety-net providers serving Medicaid patients, as they have been leaders in quality improvement and have a greater understanding of what it takes to coordinate care, often among many providers, for populations with complex needs for health services and other supports. The CSI provides a framework and environment for consultation and sharing of knowledge and ideas, and helps to avoid the problem of “reengineering a system that works for only one-third of [a] health plan’s members.”

Patient mix differences and fair payment. CSI plans and practices with a sizeable share of Medicaid patients face some unique challenges. Performance metrics are not currently risk-adjusted, possibly because of delays in data acquisition and a lack of resources and expertise to develop a methodology. The RIQI is now taking on the methodological work for risk-adjustment through a subcontract with Research Triangle Institute. Compared with the privately insured, Medicaid patients are more likely to have mental health co-morbidities as well as socioeconomic hardships that contribute to poorer health outcomes. In addition, a substantial share of the patients served by community health centers participating in the CSI are uninsured, making management of their care more challenging and performance benchmarks harder to achieve. (Health centers generally include the uninsured in their performance metrics because they operate on a philosophy that all patients are treated the same and that performance metrics need to be practice-wide, not payer-specific.) Recognizing the potentially higher risk profile of Medicaid and uninsured patients, and seeking to be fair to practices, the CSI established a “half-way to the goal line” approach that rewards practices with incentive payments if they get half-way to the performance benchmark relative to where they started. Stakeholders speaking from a Medicaid perspective praised this measure as a constructive compromise that rewards practices and providers in the safety-net space for their progress toward CSI goals. They expressed concern that plans not view the practices to which this policy applies as “slackers,” but highlighted that the consensus-oriented governance of the CSI provides a structure for discussing and resolving issues that have different implications for different stakeholders.

Combining a collaborative model with a mandate is useful.

Consensus helps legitimate authority. Getting multiple payers to work together on a unified strategy requires a lot of buy-in. Having the CSI pilot begin on a voluntary basis almost certainly helped foster willingness to participate. But even the voluntary initiative might well have been harder to achieve without Rhode Island’s long history of collaboration and what stakeholders describe as the talented leadership of the health insurance commissioner. The health plan representatives who were interviewed do not like the requirement to participate, but acknowledged that the mandate was probably valuable to the effort to extend the chronic care initiative to all adults statewide. By pairing a mandate for commercial insurer participation with a consensus-oriented approach to governance, the state is able to exert leverage that is needed to direct health plans to do some things differently and to spend money in ways that, except for the primary care spend requirement, they would not. It is likely that one reason private insurers have accepted the mandate is that, while their participation is required, they are also part of the consensus process that determines the specific requirements of the initiative.

The locus of authority determines its reach. Because the mandate to participate in the CSI operates through the OHIC, it does not reach all plans or purchasers in the state. The OHIC’s authority covers commercial insurers, but does not extend to self-insured employers or to public purchasers. Although the legislative mandate does not apply to the Medicaid plan, this plan has participated voluntarily in the CSI from the beginning, and, since 2012, the state has required all health plans with Medicaid contracts to pay the supplemental care management fees to practices on behalf of their Medicaid as well as their commercial enrollees, if the practice serves at least 200 of their Medicaid members. The CSI mandate does not apply to the Medicare program, but Medicare participates under the aegis of the Multi-payer Advanced Primary Care Practice (MAPCP) demonstration.

Collaboration requires time and effort and leadership.

Stakeholder commitment. The development and operation of a governance process that is based on consensus decision-making require heavy investments of time by many parties, and a strong commitment to work together to hammer out common goals and objectives and implement the initiative. Ongoing operation of the CSI succeeds because its key stakeholders — plans, practices, and purchasers — continually commit significant time, focus, and effort to the enterprise. To illustrate, the administrator of one participating family medicine practice with eight providers reported that she routinely attends five different CSI-related meetings monthly, as well as ad hoc meetings. Collectively, two or three other individuals in the practice attend another five to six meetings each month on data, reporting, care management, and other topics.

Engaged leadership. Leadership from all the stakeholder groups has been critical to the CSI’s success. Even in a state with a collaborative tradition, there exist competing interests, gaps in trust, and other sources of tension between parties that must be addressed. Individual stakeholders with different perspectives must, through dialogue and other interaction, gain confidence in the other participants and the fairness of the project to perceive an alignment between their own goals and interests and the initiative’s aims. The CSI management team highlighted plan and provider engagement in the initiative as a key to building increased trust between these two groups. Conversations facilitated by the learning collaboratives helped to give plans confidence in providers’ commitment to practice transformation and the use of metrics to drive change, and to give providers confidence that plans are paying them fairly and giving them the data they need to improve care management.

Broad-scale initiatives and practice transformation both require infrastructure.

Overhead costs. Convening meetings, collecting and reporting data centrally for aggregation across payers, and providing assistance to help practices change, are all overhead costs that require funding. Perhaps because the CSI started out as a small pilot, such costs were underestimated initially. Also, because administrative and staff support for the initiative was limited early on, development of a formal organizational structure (e.g., by-laws) was delayed. Funding constraints also led the CSI to rely on different financing approaches for learning collaboratives at different times, rather than on an established and stable means of support.

The timing of the Beacon grant to Rhode Island was fortunate. The overlap between the needs of the CSI and the purposes of the grant – to link development of EHRs to clinical practice improvement and enhanced outcomes – gave the state access early on to substantial support to build infrastructure. However, such grants are not routine and they are typically time-limited. With the Beacon grant’s termination, the CSI health plans are providing additional funding for infrastructure (over and above their care management payments to practices) for at least one year, but there is concern about their ability and willingness to maintain this support over time, particularly if the amount required of them grows. Some expressed the view that, because more work on the data infrastructure was not accomplished earlier, progress was delayed and opportunities were lost, adding to health plans’ and practices’ current costs. For example, if the infrastructure for the exchange of clinical data had been more developed, CSI would not have to invest as much now in claims-based “work-arounds” to analyze costs across all payers.

Costs of practice-level infrastructure-building. Like other efforts to develop patient-centered models of primary care, the CSI generates new needs for spending – to manage the multi-payer effort, collect data, create metrics and reporting processes, and support practice transformation. Primary care practices need to set up systems to track data relevant to the metrics they must report and integrate these metrics into their performance improvement programs. The supplemental payments to participating practices provide critical additional funding to support other required practice changes as well, such as expanded use of nurse care managers who can spend more clinical time with patients. One practice manager reported that the supplemental payments have allowed her to fund a nurse care manager, hire a full-time quality assistant who can do “deeper dives” into the data (e.g., to understand outliers), and keep the practice open longer hours. Some practices had already made some of the needed investments before the supplemental payments became available, but even for these practices that are farther along, the care management fees help finance intensified efforts and additional staff time to participate in learning collaboratives with other practices.

At least some of the CSI practices are finding the supplemental payments insufficient to cover all the costs involved in participating. They explained that they continue to participate for the good of their patients, whom they see getting better care because of the practice changes spurred by the initiative. Consensus is lacking on what level of support participating practices require. Sponsors of similar initiatives elsewhere can also anticipate debate about the appropriate levels of payment to support the practice-level infrastructure needed to support patient-centered care.

Maintaining payer support for CSI may require evidence of savings.

Those we interviewed noted that the health care environment is very fluid in Rhode Island, as it is elsewhere in the nation. The practices that participated in the CSI from the outset were early adopters of change who were philosophically committed to its success; the practices joining now may not be as committed to doing what is necessary internally to develop clinical data and use them to improve performance, although they should be able to benefit from the experience of the established practices. Health plans say that their willingness to provide practices with additional support ultimately depends on a demonstrated return on investment. In today’s payment reform environment, they say, they need evidence that investing in primary care is not only improving patient care and patient experience, but also generating savings somewhere in the system. Some payers wondered aloud whether practices should have more “skin in the game” – that is, whether their payment should be more strongly tied to their performance on clinical process and outcome metrics. It could be that the ability to maintain support for these kinds of initiatives will require settling the return-on-investment question, challenging though that may be.

Practice transformation is the beginning, not the end, of system change.

There was agreement that, ultimately, performance should be measured not just at the level of individual practices, but also at the system level, using metrics like aggregate ED, hospitalization, and readmission rates. Clearly, hospitals are integral to true systemic change. At this writing, hospitals were not yet at the CSI table, and stakeholders reported that they were still relatively traditional, with a primary focus on filling beds; they added that ACO development and hospital acquisition of practices remained limited in the state. As a consequence, the CSI has been focused mainly on what goes on in primary care practices. More recently, however, the state says it has been engaging hospitals, and has added performance measures on hospitalization and ED use that are tied to payment. One interviewee placed the CSI in the broader context of system transformation this way: “I think we’re working towards a system that is more integrated and will address the whole triple aim. Has that been proved yet? I don’t know. I think we’re still walking down the road. We certainly can’t continue in this [current] system. I think this (medical home model) has more optimism around it than other types of approaches. But…we’re not there yet. This is new territory.

Issue Brief: Looking Ahead

Rhode Island has been successful in engaging health plans, providers, and purchasers in a multi-payer collaboration to support PCMHs, with the goal of improving chronic care for all Rhode Island adults. The leverage exerted by a multi-payer strategy, including Medicaid in this case and several others nationwide, translates into important advantages for practices, giving them a common, aligned set of goals, metrics and performance benchmarks, practice transformation resources, and incentives, across payers and purchasers, to support practice changes that will benefit all their patients.

Rhode Island’s ability to implement the CSI was enhanced by a number of factors. The distinctive leadership of the health insurance commissioner, and his preference for collaboration around policy goals rather than a purely regulatory approach, were crucial. In a different state context, mandating payer participation and the “primary care spend” could be more challenging. The small number of major payers in the state also helped, and the fact that many stakeholders knew each other and understood each other’s goals made it easier for them to “get on same page.” In addition, many Rhode Island practices and providers serve patients with a mix of health insurance, and may be receptive to participating in an initiative that standardizes the requirements and incentives they face from different payers.

But while Rhode Island has some distinctive attributes, the state has confronted some challenges and issues that are likely to be common to states pursuing multi-payer initiatives. Rhode Island’s need to identify new resources for implementation, and the finding that buy-in is important to maintain support for the initiative, are lessons useful to states broadly. The kinds of tensions between plans, practices, and providers that have required negotiation in Rhode Island are pretty universal; other states may wish to consider whether the inclusive and consensus-oriented approach to development and governance that Rhode Island adopted might help bridge differences and build trust among the stakeholders in their environments.

The reality that system-level health improvements and cost savings require change beyond the sphere of primary care is also not unique to Rhode Island, and states generally can benefit from CSI leadership’s observation that specialists, hospitals, and others in the medical neighborhood must also be engaged for multi-payer medical home initiatives to succeed most fully. While the CSI model may not be feasible in other states, or may warrant adaptation, it demonstrates how Medicaid’s role as a major payer can be leveraged to transform health care delivery and payment. As the ACA expansion of coverage brings more Americans into the health care system, and states and other entities seek to improve care delivery and orient payment toward performance, both the scale and momentum of multi-payer efforts like the CSI can be expected to grow.

This Kaiser Commission on Medicaid and the Uninsured (KCMU) issue brief was prepared by Marsha Gold and Winnie Wang of Mathematica Policy Research and Julia Paradise of the Kaiser Family Foundation.

The authors express their appreciation to David Bourassa, Renee Bromley, Deidre Gifford, Debra Hurwitz, Mack Johnston, David Keller, and Renee Rulin, whose expertise and insights were invaluable to this project.

Appendices

Appendix 1: CSI Common Developmental Contract, April 2012

Performance Targets

Target 1:  Structural Improvements (Practice Metric): Hire a nurse care manager; establish a compact with four specialists including a hospitalist; establish a plan/policy for after-hours care; have an electronic medical record and achieve Level 1 meaningful use; comply with the Quality Partners of Rhode Island Hospital and community physician best practices; demonstrate best practices for outpatient transitions of care; demonstrate use of evidence-based care; submit quality data

Target 2: Clinical Process Measures (Provider Metric): Achieve benchmark goals on specified CAHPS survey items; meet benchmark goal or achieve 50 percent improvement on at least four of seven metrics: Diabetes HbA1C <8, Diabetes BP<140/90,Diabetes LDL <100,Hypertension <140/90,Tobacco Cessation, Adult BMI (18-64), Adult BMI (65+)

Target 3: Outcome Measures (Provider Metric): CSI practices, in aggregate, to reduce emergency department and all-cause inpatient hospital admission rates by 7.5% and 5% respectively, relative to a comparison group

Staging

  1. Start-up Year
    • Payments support transformation and measure development
    • $4.50 PMPM to practices who attain NCQA Level 1 PCMH recognition, report common quality metrics, and achieve a number of process requirements.
    • Practices are required to participate in project governance, evaluation and CSI learning collaborative.
  2. Transition Year
    • Payment commits practices to use data measurement to drive performance
    • $5.50 PMPM for demonstrating evidence of data-driven performance and attaining NCQA Level 2 recognition
  3. Performance Year 1
    • Pay practices based on performance
    • $5.00 PMPM if 0-1 performance targets are met
    • $5.50 PMPM if 2 performance targets are met
    • $6.00 PMPM if all 3 performance targets are met
    • Practices agree to attain NCQA Level 3 PCMH recognition by end of performance year 2
  4. Performance Year 2
    • Pay practices based on performance
    • $5.00 PMPM if 0-1 performance target is met
    • $5.50 if two performance targets are met
    • $6.00 if all three  performance targets are met
    • Practices must attain NCQA Level 3 PCMH recognition by end of year

Appendix 2: CSI Governance Structure

Appendix 2: CSI Governance Structure

Source: CSI-RI: Strategic Planning, Final Plan, February 21, 2013. http://www.pcmhri.org/files/uploads/CSI_Strategic_Plan_Summary%20March%202013.pdf

Appendix 3: CSI Working Committees: Purpose and Scope

  • Data and Evaluation– performance improvement; measure selection; measurement definition/harmonization; goals and benchmarks; evaluation; research; and liaison with other committees
  • Practice Training  Support and Transformation– conferences, learning collaboratives, coaching, and other forms of assistance
  • Practice Reporting– review of quarterly practice data, data validation and public reporting, support for practice improvement and data sharing, support with EHR/IT issues
  • Payment Reform/Contracting– contract development, patient attribution, alternative payment models, issues associated with PCMH as part of a delivery system
  • Service Expansion and Integration– develop additional service capabilities (e.g., behavioral health, transitional care, oral health) and expand to additional populations (e.g., dual eligibles, children)

Source: CSI-RI: Strategic Planning, Final Plan, February 21, 2013. http://www.pcmhri.org/files/uploads/CSI_Strategic_Plan_Summary%20March%202013.pdf

Endnotes

  1. Regional Quality Improvement Initiative, Center for Health Care Strategies. Available at http://www.chcs.org/info-url_nocat3961/info-url_nocat_show.htm?doc_id=377021 ↩︎
  2. Case Study: Rhode Island Pilots Innovative, Cross-Payer Patient-Centered Medical Home Model, Center for Health Care Strategies, July 2009. Available at http://www.chcs.org/publications3960/publications_show.htm?doc_id=985380 ↩︎
  3. Ibid. ↩︎
  4. Quarterly MAPCP report on Rhode Island (quarter ending December 31, 2012). Provided to authors by CSI management staff.   ↩︎
  5. The mechanism is actually a common contract amendment that all payers incorporate into their existing contracts with practices.  ↩︎
  6. Rhode Island Chronic Care Sustainability Initiative (CSI-RI) Governing Structure, December 2006. Available at http://www.chcs.org/publications3960/publications_show.htm?doc_id=534883  ↩︎
  7. CSI-RI: Strategic Planning, Final Plan, February 21, 2013. Available at http://www.pcmhri.org/files/uploads/CSI_Strategic_Plan_Summary%20March%202013.pdf ↩︎
  8. Rhode Island Beacon Community Program: 2012 Annual Report, Rhode Island Quality Institute, December 5, 2012. Available at http://www.pcmhri.org/files/uploads/Rhode%20Island%20Beacon%20Community%20Program%20Annual%20Report_FINAL12-21-12.pdf ↩︎
  9. Rhode Island Quality Institute (Fact Sheet, last updated November 29, 2012), Office of the National Coordinator for Health Information Technology. Available at http://www.healthit.gov/sites/default/files/beacon-factsheet-ri.pdf ↩︎
  10. University of Massachusetts program office communication. ↩︎
  11. Under a major subcontract to the University of Massachusetts, the Rhode Island Quality Institute will continue quality measurement and reporting tasks, utilization measurement (working with Research Triangle Institute), and administration of an annual Consumer Assessment of HealthCare Providers and Systems (CAHPS) survey. The University of Massachusetts will develop additional subcontracts, the largest of which will involve support for training and technical support for practices. Another will allow the program to develop and pilot two community health teams to help small practices become PCMHs. Others will support evaluation, grants management, marketing, and similar specialized needs. The remainder of the funds will be used to support the current staff at the University of Massachusetts and expand staff to handle the selection and training of new practices sites and increased needs for coordination. ↩︎
  12. http://innovation.cms.gov/initiatives/State-Innovations-Model-Design/ ↩︎

Getting into Gear for 2014: Shifting New Medicaid Eligibility and Enrollment Policies into Drive

Authors: Martha Heberlein, Tricia Brooks, Samantha Artiga, and Jessica Stephens
Published: Nov 21, 2013

On January 1, 2014, many key provisions of the Affordable Care Act (ACA) will start to go into effect, including the expansion of Medicaid to low-income adults and the launch of new Medicaid eligibility and enrollment processes, which are designed to move toward a coordinated enrollment system across health coverage programs, including Medicaid, CHIP, and the new Health Insurance Marketplaces. Over the past year, states have made steady and significant progress preparing for these changes, but readiness varies considerably as 2014 nears, and implementation work and ongoing process improvements will continue into the foreseeable future. To provide greater insight into the status of implementation, this report provides an overview of key state Medicaid eligibility and enrollment policies slated to go into effect, based on data released by the Centers for Medicare and Medicaid Services (CMS). The data provide insight into who will be eligible for Medicaid and CHIP across states and how individuals will enroll in coverage.

Executive Summary

On January 1, 2014, many key provisions of the Affordable Care Act (ACA) will start to go into effect, including the expansion of Medicaid to low-income adults and the launch of new Medicaid eligibility and enrollment processes, which are designed to move toward a coordinated enrollment system across health coverage programs, including Medicaid, CHIP, and the new Health Insurance Marketplaces. Over the past year, states have made steady and significant progress preparing for these changes, but readiness varies considerably as 2014 nears, and implementation work and ongoing process improvements will continue into the foreseeable future. To provide greater insight into the status of implementation, this report provides an overview of key state Medicaid eligibility and enrollment policies slated to go into effect based on data released by the Centers for Medicare and Medicaid Services (CMS). (See the Appendix Tables for state-specific data.)

Medicaid Eligibility as of January 2014

The ACA, as enacted, expands Medicaid to nearly all adults at or below 138 percent of the federal poverty level (FPL) as of January 1, 2014. This expansion, however, was effectively made a state option as a result of the Supreme Court ruling on the constitutionality of the ACA, and as of October 24, 2013, 26 states, including DC, are moving forward with the expansion, while the remaining 25 states are not moving forward at this time (Figure ES-1). There is no deadline for states to adopt the expansion, and several states are still actively considering it.

Figure ES – 1: Status of State Medicaid Expansion Decisions, as of October 24, 2013

Eligibility levels for parents and other adults will significantly increase in states implementing the Medicaid expansion, while large coverage gaps will remain in states not expanding at this time. In the 26 states expanding Medicaid, the median eligibility threshold for parents will increase from 106 to 138 percent of the FPL and the median limit for adults without dependent children will significantly rise from 0 to 138 percent of the FPL (Figure ES-2). However, many poor parents and other adults will remain ineligible in the 25 states not expanding at this time. In 21 states, parent eligibility levels will remain below 100 percent of the FPL, with eligibility levels below half of poverty in 14 states. Overall, the median eligibility level for parents in these states will be just 47 percent of the FPL and only Wisconsin will provide full Medicaid coverage to adults without dependent children. Parents and other adults with incomes above these limited Medicaid eligibility levels but below 100 percent of the FPL will fall into a coverage gap, since they will earn too much to qualify for Medicaid but too little to qualify for premium tax credits in the Marketplaces, which begin at 100 percent of the FPL. This gap will leave nearly five million uninsured adults without a new coverage option.

Figure ES – 2: Median Medicaid Eligibility Limits for Adults as a Percent of the FPL, January 2013 and January 2014

Coverage for children and pregnant women through Medicaid and CHIP will remain strong in 2014. More than half of the states (30, including DC) will cover children in families with incomes at or above 250 percent of the FPL and 20, including DC, will cover children in families with incomes at or above 300 percent of the FPL. Moreover, despite some eligibility reductions for pregnant women, as of January 1, 2014, 32 states, including DC, will cover pregnant women at or above 200 percent of the FPL. As such, while coverage for parents and childless adults will markedly improve in states implementing the Medicaid expansion, their median eligibility level will still remain lower than that of children and pregnant women (Figure ES-3). These disparities in eligibility across groups will be even starker in states that are not expanding Medicaid.

Figure ES – 3: Median Medicaid/CHIP Eligibility Thresholds as a Percent of the Federal Poverty Level, January 2014

Connecting People to Coverage through Streamlined Enrollment Processes

The ACA envisions seamless and timely access to the continuum of health coverage options regardless of where or how someone applies. To achieve these objectives, the ACA establishes new expectations for simplifying the application process, coordinating enrollment, and moving toward paperless verification of eligibility. These include state adoption of a single streamlined application that screens for all health coverage options, electronic transfers of accounts between agencies to facilitate transitions across health coverage programs, and reliance on trusted sources of electronic data rather than requesting paper documentation to verify eligibility criteria.

As of October 1, 2013, 43 of 50 reporting states have deployed a single, streamlined application through their Medicaid agency. The seven remaining reporting states are in the process of developing their single, streamlined application, and nearly all anticipate having it in place by January 2014. In the interim, these states are utilizing their existing Medicaid applications and individuals who may be eligible for premium tax credits are being directed to apply through the federal Marketplace. Among the 43 Medicaid agencies that have a single streamlined application as of October 1, 2013, all had a paper version available while 36 had an online version. Looking ahead, states will continue work to make the application available through multiple modes, including online, phone, in-person, or mail. Moreover, in 32 states, further revisions will be made to their single streamlined application to meet the ACA standards, for example, by removing questions that are not relevant to eligibility.

The ability to electronically transfer individual accounts between state Medicaid/CHIP agencies and Marketplaces to coordinate enrollment is in various stages of development. Among the 17 states with State-based Marketplaces (SBMs), all but two (2) have an integrated or linked technology system that determines eligibility for all insurance affordability options and facilitates the next steps for enrollment. However, in states using the Federally-Facilitated Marketplace (FFM), electronic transfers of individual accounts between the FFM and Medicaid/CHIP agencies are essential for coordinating enrollment. Due to ongoing technological challenges with the FFM, these transfers have been delayed and alternative strategies have been put into place. For example, until the FFM can begin transferring electronic accounts to state Medicaid and CHIP agencies, it is sending batches of basic data on individuals the FFM has determined or assessed as potentially eligible for Medicaid/CHIP. Similarly, if a state Medicaid/CHIP agency is unable to transfer an account to the FFM, it can direct individuals to apply directly through the FFM. Moving forward, implementing electronic account transfers will be key to minimizing burdens on consumers and ensuring they are successfully enrolled in the coverage for which they are eligible regardless of where they apply, providing “no wrong door” access to coverage envisioned by the ACA.

States are submitting verification plans to CMS that outline the electronic data sources and procedures they will use to verify eligibility criteria. As of November 15, 2013, 35 verification plans have been approved by CMS and made publicly available. States continue to have the option to accept self-attestation without additional verification for non-financial eligibility criteria except for Social Security Numbers, citizenship, and immigration status, which states are required to verify under law. The majority of reporting states will rely on self-attestation of state residency (28 of 35), and household composition (33 of 35), while fewer will do so for age and date of birth (13 of 35). The remaining states will either verify these criteria to determine eligibility or post-enrollment. For income, states must verify financial information from an electronic data source; however, this can be done post-enrollment after the state determines eligibility based on the individual’s attestation. All 35 reporting states will verify income through electronic sources, with 30 states doing so to determine eligibility and five (5) states verifying income post-enrollment. In addition, 23 states will conduct routine ongoing post-enrollment checks of financial information, although consumers also are required to report changes that may affect eligibility.

New Options to Facilitate Enrollment and Renewal

CMS has offered states five strategies to facilitate processing applications for large numbers of people who become newly eligible for Medicaid on January 1 and the transition to new enrollment processes. All of the approaches are intended to promote enrollment and retention, while minimizing administrative burdens for states. They include early adoption of MAGI-based eligibility standards, extending renewal periods for existing enrollees, enrolling eligible Supplemental Nutrition Assistance Program participants in Medicaid based on available data, enrolling parents in Medicaid based on their children’s eligibility information, and providing 12-month continuous eligibility for parents and other adults. A state may adopt any of these facilitated enrollment approaches regardless of whether it plans to implement the Medicaid expansion. Nearly half (25) of states have taken up the option to extend renewals, 15 have adopted MAGI early, five (5) are enrolling individuals based on SNAP data, and three (3) are using eligibility data for children to enroll their parents (Figure ES- 4). Overall, 30 states have adopted at least one of the strategies, and 11 have adopted two or more of these approaches. Three (3) states (NJ, OR, and WV) have adopted four of the five.

Figure ES – 4: Adoption of Selected Strategies to Streamline Enrollment of Eligible Individuals into Medicaid as of October 1, 2013

Conclusion

Looking ahead to 2014, coverage for parents and other adults will significantly improve in the 26 states implementing the Medicaid expansion and eligibility levels for children and pregnant women will remain strong across states. As such, as the ACA is fully implemented, Medicaid offers the potential to significantly reduce the number of uninsured. Outreach and enrollment efforts will be key for increasing coverage and it will be important for these efforts to be ongoing throughout the year since Medicaid enrollment is not limited to the Marketplace’s open enrollment period. In contrast to gains in states expanding Medicaid, large coverage gaps will remain in the states that do not expand, leaving millions of poor uninsured adults without access to a new coverage option.

To date, states have made meaningful progress in implementing key provisions of the ACA to provide streamlined Medicaid eligibility and enrollment processes, but readiness varies considerably. Moreover, the technology problems that have hampered the launch of open enrollment through the new Marketplaces, particularly the federal Marketplace (HealthCare.gov), have led to delays in coordination across Medicaid, CHIP, and Marketplace coverage. However, even with these early implementation challenges, some states have been successfully enrolling people in Medicaid and several have gotten a significant jump-start through the facilitated enrollment strategies offered by CMS. In the coming months, work will continue to deploy new processes and systems to move toward the ACA’s vision of a simplified, consumer-friendly experience. As such, January 2014 will represent the first step toward a modernized, streamlined system to connect individuals to expanded coverage options as established through the ACA, but fully achieving that vision will require time, persistence, and a commitment to continual program improvement.

Introduction

As the first day of coverage under the Affordable Care Act (ACA) approaches, states are continuing work to modernize their procedures and systems to implement key provisions of the law to simplify enrollment in Medicaid and CHIP and coordinate with the new Health Insurance Marketplaces, which opened their doors on October 1, 2013. Beginning January 1, 2014, low-income adults will become newly eligible for Medicaid in the 26 states that have chosen to implement the ACA’s Medicaid expansion. Additionally, all states will transform their processes to align eligibility requirements for Medicaid, CHIP, and premium tax credits in the Marketplaces, streamline and modernize the application experience, and move toward a coordinated enrollment system across health coverage programs. Over the past year, states have made steady and significant progress preparing for these changes, but readiness varies considerably as 2014 nears, and work on implementation and process improvements will continue into the foreseeable future. This report provides an overview of key state Medicaid eligibility and enrollment policies that will be in effect as of January 1, 2014, based on data released by the Centers for Medicare and Medicaid Services (CMS). The data provide insight into who will be eligible for Medicaid and CHIP across states and how individuals will enroll in coverage. (See Appendix Tables 1 through 9 for state-specific data on policies.)

Background

Throughout the last year, political divides continued over the ACA, but the law remains in place. With open enrollment for coverage through the new Marketplaces beginning on October 1st, the country is turning its attention to how the ACA is implemented, including a number of key provisions that impact Medicaid and CHIP eligibility and enrollment.

As enacted, the ACA extends Medicaid to nearly all adults at or below 138 percent of the federal poverty level (FPL) as of January 1, 2014. However, as a result of the Supreme Court ruling on the ACA, implementation of the Medicaid expansion is now effectively a state option. As of October 24, 2013, 26 states, including DC, are moving forward with the expansion (Figure 1). In some cases, CMS is working with states to develop expansion approaches under Section 1115 waiver authority (Box 1). There is no deadline for states to adopt the expansion, and several states are still actively considering the option. However, states delaying the expansion will miss out on the opportunity to receive the 100 percent federal funding for newly eligible individuals available in calendar years 2014 through 2016.

Figure 1: Status of State Medicaid Expansion Decisions, as of October 24, 2013

Regardless of state decisions to expand Medicaid, all states must implement new streamlined enrollment processes under the ACA. These procedures are designed to align eligibility determinations for Medicaid, CHIP, and premium tax credits in the Marketplaces. They also aim to establish a faster, more consumer-friendly enrollment experience, provide individuals multiple avenues to apply, and rely on electronic data instead of paper documentation to verify information where possible. To implement these new processes, almost all states are building new Medicaid eligibility and enrollment systems or conducting major upgrades of their existing systems. The federal government has provided time-limited 90 percent federal funding to support this system development work. CMS issued a final set of rules for these eligibility and enrollment changes in July 2013, providing guidelines for states as they were rewriting policies, revamping business processes, and developing their systems.

Box 1: Section 1115 Waivers and the Medicaid ExpansionTo date, of the states moving forward with the Medicaid expansion, three (AR, IA, and MI) are pursuing approaches that require Section 1115 waiver demonstration authority. As of November 15, 2013, Arkansas is the only state to have received approval. The state will use Medicaid funds to subsidize the purchase of coverage for Medicaid-eligible individuals through qualified health plans (QHP) in the Marketplace, with supplemental benefits and cost-sharing protections to meet minimum Medicaid standards. Iowa and Michigan await federal action their proposals. Additionally, there are a number of states with waivers that currently provide more limited coverage to parents and/or adults without dependent children. Most of these waivers are set to expire December 31, 2013, when this coverage could transition to the Medicaid expansion as it goes into effect. Some of these waivers were “bridge” waivers that were specifically designed to help states get an early start on the expansion. While most states with these expiring waivers are implementing the full Medicaid expansion, two states (Indiana and Oklahoma) not moving forward at this time. These states received approval to extend their waivers for one year, preserving their existing limited waiver coverage. However, many poor adults in these states who would have gained full Medicaid coverage under the expansion will not obtain access to a new coverage option in its absence and will likely remain uninsured.

For more details, see: Kaiser Commission on Medicaid and the Uninsured, “A Look at Section 1115 Medicaid Demonstration Waivers Under the ACA: A Focus on Childless Adults.” October 2013.

To further assist states in implementing the Medicaid provisions of the ACA, CMS offered new opportunities to facilitate enrollment. In May, the administration provided states five (5) new targeted enrollment and renewal strategies. These options are designed to help states accommodate application and enrollment increases as they transition to the new eligibility rules, with the hope of easing the administrative burden for states and simplifying the process for consumers.

To date, states have made significant progress in implementing these Medicaid and CHIP provisions but readiness varies considerably. Moreover, the technology problems that have hampered the launch of open enrollment through the new Marketplaces, particularly the federal Marketplace (HealthCare.gov), have led to challenges and delays with new processes designed to coordinate enrollment for Medicaid, CHIP, and Marketplace coverage. With 2014 quickly approaching, state implementation work remains in high gear and the coming weeks are important for states to meet specific milestones. States that will not be able to implement all of the new processes within the timeline established by the law are working with CMS to develop mitigation plans designed to help ensure individuals can still connect to coverage. Even with these early implementation challenges, some states have been successfully enrolling people into Medicaid as they have addressed technological glitches with their state Marketplace websites. Moreover, several states have gotten a significant jump-start through the facilitated enrollment strategies offered by CMS.

Medicaid And Chip Eligibility As Of January 1, 2014

Conversion to Modified Adjusted Gross Income to Determine Financial Eligibility

The ACA changes how financial eligibility will be determined for many Medicaid beneficiaries, standardizing the approach across states as well as health insurance affordability programs. Beginning January 2014, financial eligibility for parents, pregnant women, children, and the expansion adults will be based on Modified Adjusted Gross Income (MAGI), as defined in the Internal Revenue Code. The move to MAGI for these non-elderly, non-disabled groups will result in some changes from current Medicaid rules related to calculating family size and income and will largely align Medicaid financial eligibility determinations with the standards used to determine eligibility for premium tax credits and cost-sharing reductions in the new Marketplaces.1  Aligning the determination requirements across all insurance affordability programs is intended to promote seamless coordination and avoid gaps or overlaps in eligibility.2 

To carry out the transition to MAGI, states must convert their existing Medicaid and CHIP eligibility levels for these groups to MAGI-equivalent levels. Today there is significant variation across states and eligibility categories in how income disregards and deductions are applied to determine if an individual meets the financial eligibility requirements for Medicaid or CHIP. For example, a state often disregards certain income from an individual’s gross income (e.g., $90 for a working parent), deducts certain expenses (e.g., childcare), and then compares the result to a net income standard.3  When states transition to MAGI, they will discontinue the use of these disregards and deductions; instead, they will use the MAGI-equivalent income threshold that takes into account states’ previous use of disregards and deductions and apply a standard disregard of five percentage points of the federal poverty level in certain circumstances (Box 2). States worked with CMS to develop their converted MAGI levels using one of three available methods.4 

Box 2: Use of the Five Percentage Point of the Federal Poverty Level Disregard Under MAGI

Under the new MAGI rules, a standard income disregard of five percentage points of the federal poverty level will be applied, but only if it affects an individual’s eligibility. For example, the Medicaid expansion for adults extends eligibility to 133 percent of the FPL. However, a parent with income at 138 percent of the FPL in a state implementing the expansion would be determined eligible because after the five percentage point disregard, he or she would meet the income standard of 133 percent FPL. Upper income levels reported in this brief take into account this standard disregard.

The MAGI converted thresholds are intended to approximate states’ existing eligibility levels in the aggregate to prevent individuals from losing coverage due to the transition to MAGI. While MAGI converted thresholds differ from existing levels, they are designed to result in roughly the same number of people being eligible under the new standard as would have been eligible under the old standard (Box 3). In some cases, the converted thresholds will be the income eligibility limits in place as of January 1, 2014. For example, in most of the states not implementing the Medicaid expansion, the income limit for parents will be the MAGI conversion of their existing parent eligibility level. The MAGI converted thresholds will also be used for a number of other purposes, including 1) maintaining Medicaid and CHIP eligibility levels for children through October 1, 2019, as required by the ACA; 2) establishing minimum eligibility thresholds for parents, pregnant women, and other adults;5  3) determining the income levels at which premiums will apply; and 4) calculating the availability of the enhanced matching rate for newly-eligible adults.

Box 3: Understanding Differences Between January 2013 and January 2014 Eligibility Levels

Appendix Tables 1-3 show income eligibility levels for children, pregnant women, parents and other adults as of January 2013 and January 2014.

  • In some cases, differences between the 2013 and 2014 levels represent state changes in eligibility policy, such as the Medicaid expansion to parents and other adults.
  • In other cases, the differences stem from distinctions in how disregards were reflected in the January 2013 and January 2014 levels and do not represent a change in eligibility. For example, January 2013 eligibility levels for working parents reflect the maximum amount of income or earnings disregards, but not other deductions, that were applied in that state under previous rules. In contrast, the January 2014 MAGI-converted thresholds were calculated based on the average use of all disregards and deductions. For children and pregnant women, the January 2014 MAGI converted levels are higher than previously reported income thresholds because the January 2013 thresholds did not reflect states’ use of disregards or deductions.

States that had previously aligned children’s coverage levels across the different age groups merged the groups for conversion purposes in order to preserve the alignment. Otherwise, states were required to convert each eligibility category separately, including their Medicaid thresholds for infants, children ages one to five, and children ages six to eighteen. If the amount of the average disregards and/or the original threshold differed between the groups, disparate converted levels across the ages could result, as is seen in 18 states (Appendix Table 1). States have an opportunity to standardize their eligibility thresholds by adjusting the level for the older group to match that of the younger group, but only until December 31, 2013.6 

Income Eligibility Limits as of January 1, 2014

Beginning in 2014, as part of the continuum of coverage, the ACA expands Medicaid to nearly all adults with incomes at or below 138 percent of the FPL. Moreover, the ACA requires states to maintain eligibility thresholds for children that are at least equal to those they had in place at the time the law was enacted through September 30, 2019. To help preserve the base of coverage upon which the ACA expansions build, states were also required to maintain eligibility levels for other groups, but this requisite will end on January 1, 2014.

Eligibility levels for parents and childless adults will significantly increase in the 26 states, including DC, that are expanding Medicaid to adults. Fifteen (15) of the 26 states moving forward with the Medicaid expansion already cover parents at or above the poverty level through Medicaid, but adults without dependent children are eligible for full Medicaid coverage in just nine (9) of these states (AZ, CO, CT, DE, DC, HI, MN, NY, and VT), of which only six (6) cover them at or above poverty (Appendix Table 2). In the expansion states, eligibility levels will increase for parents in 16 states and for childless adults in 24 states. Overall, the median eligibility threshold for parents in these states will increase from 106 to 138 percent of the FPL, while the median threshold for adults without dependent children will increase from 0 to 138 percent of the FPL. Three (3) states (CT, DC, and MN) will cover parents above the new expansion level of 138 percent of the FPL (Figure 2) and the District of Columbia and Minnesota will cover adults without dependent children above this level (Figure 3), although Minnesota will reduce eligibility levels for parents relative to its 2013 levels. In addition, four (4) other states (NJ, NY, RI, and VT) that previously extended Medicaid eligibility to parents with incomes above 138 percent of the FPL are reducing eligibility to 138 percent of the FPL as of January 2014; many of these parents will be eligible for tax credits to purchase coverage through the new Marketplaces.

Figure 2: Medicaid Eligibility for Parents of Dependent Children by Income, January 2014
Figure 3:  Medicaid Eligibility for Childless Adults by Income, January 2014

In the 25 states not expanding Medicaid at this time, many poor parents and other adults will remain ineligible for coverage. In 21 of the states, eligibility levels for parents will be below 100 percent of the FPL, with eligibility levels remaining below half of poverty in 14 states. In addition, Maine and Wisconsin will reduce eligibility for parents from 133 to 105 percent of the FPL and 200 to 100 percent of the FPL, respectively, as the requirement to maintain coverage ends on January 1, 2014. Adults without dependent children generally will remain ineligible for full Medicaid coverage in non-expansion states. Overall, in these 25 states, the median eligibility level for parents will be just 47 percent of the FPL, with only four (4) states (AK, ME, TN, and WI) covering parents with incomes at or above poverty; only Wisconsin will provide full Medicaid coverage to adults without dependent children. Parents and other adults with incomes above these limited Medicaid eligibility levels but below 100 percent of the FPL will fall into a coverage gap, which will leave nearly five million uninsured adults without access to a new coverage option (Box 4).

Box 4: The Coverage Gap Could Leave Nearly 5 Million Poor Adults Uninsured

Nationally, nearly five million poor uninsured adults will fall into the “coverage gap” because they live in states that are not expanding Medicaid to adults at this time. Those in the gap earn too much to qualify under their state’s Medicaid eligibility guidelines and too little to qualify for premium tax credits to purchase coverage through the new Marketplaces. More than one-third of those falling in the gap reside in just two states – Texas (22 percent) and Florida (16 percent) (Figure 4).

See: Kaiser Commission on Medicaid and the Uninsured, “The Coverage Gap: Uninsured Poor Adults in States that Do Not Expand Medicaid.” October 2013.

Figure 4: Distribution of Poor Uninsured Nonelderly Adults in the Coverage Gap.

Coverage for children through Medicaid and CHIP will remain strong in 2014, with the median eligibility level at 255 percent of the FPL. More than half of the states (30, including DC) will cover children in families with incomes at or above 250 percent of the FPL and 20, including DC, will cover children in families with incomes at or above 300 percent of the FPL (Figure 5 and Appendix Table 1). Moreover, 18 states currently covering older children up to 133 percent of the FPL in separate CHIP programs will shift coverage for these children to Medicaid, as the ACA establishes a minimum Medicaid eligibility level of 138 percent of the FPL for all children up to age 19.7  Prior to the ACA, states were required to cover children up to age 6 with incomes up to 133 percent of the FPL through Medicaid, but the minimum eligibility level for older children was 100 percent of the FPL. This shift from CHIP to Medicaid must occur regardless of whether the state is expanding Medicaid to adults; states will continue to receive the enhanced CHIP matching rate for uninsured children in this income group. CMS has been assisting states with this shift and, in some cases, may permit an alternative transition approach, such as at a child’s next regularly scheduled renewal rather than by January 1, 2014.

Figure 5: Children’s Eligibility for Medicaid/CHIP by Income, January 2014

Despite two (2) states reducing eligibility, most will continue to cover pregnant women above the federal minimum standards. As of January 1, 2014, the median eligibility level for pregnant women will be 203 percent of the FPL, with 31 states, including DC, covering pregnant women at or above 200 percent of the FPL (Figure 6 and Appendix Table 3). Two states, Oklahoma and Virginia, will reduce eligibility for pregnant women from 185 to 133 percent of the FPL and 200 to 143 percent of the FPL, respectively, as the requirement to maintain coverage ends on January 1, 2014. Louisiana has also indicated plans to reduce eligibility for pregnant women as of January 1, 2014, but this change was not reflected in the data from CMS as of November 15, 2013.8 

Figure 6: Eligibility for Pregnant Women in Medicaid/CHIP by Income, January 2014

Eligibility for parents and other adults will continue to lag behind that of children and pregnant women. While coverage for parents and childless adults will markedly improve in states implementing the Medicaid expansion, their median eligibility levels will still remain significantly lower than that of children and pregnant women. These disparities in eligibility across groups will be even starker in states that are not expanding Medicaid (Figure 7).

Figure 7: Median Medicaid/CHIP Eligibility Thresholds as a Percent of the Federal Poverty Level, January 2014

Connecting People To Coverage Through Streamlined Enrollment Processes

The ACA envisions seamless and timely access to the continuum of coverage options regardless of where or how someone applies. To achieve these objectives, the ACA establishes new expectations for simplifying the application process, coordinating enrollment, and moving toward paperless verification of eligibility. Many of these changes accelerate successful state strategies in harnessing technology to make the process work better for both individuals and state agencies.

Applying for Coverage

The ACA requires Medicaid, CHIP, and the new health insurance Marketplaces to adopt a single, streamlined application that screens eligibility for all coverage options. To this end, HHS created a consumer-tested model application, which states can customize to better fit their programs. For example, states can substitute state agency names, logos, and phone numbers. States can also eliminate questions that aren’t applicable, such as how long a child has been uninsured in a state that does not impose a waiting period in CHIP. Alternatively, states may develop their own single, streamlined application, subject to HHS approval. However, alternative applications may only include questions relevant to the eligibility and administration of all of the insurance affordability programs, and only for individuals who are applying for coverage.

Most states (43) will use a state alternative online application, while seven (7) will adopt the HHS model online application. Fewer states (30) are using or plan to use a state alternative for their paper application (Figure 8). In 32 of the states using an alternative application, the version that is initially available will need further revisions to fully comply with the ACA standards, for example, by removing questions that are not relevant to eligibility. Notably, in 15 states, multi-benefit applications are available that allow individuals to simultaneously apply for health coverage and other benefits such as food or childcare assistance. Like the alternative application, a multi-benefit application must ask the relevant questions for all health insurance affordability programs. It must also clearly indicate which questions are optional for determining eligibility for health insurance coverage only.

Figure 8: Features of Single, Streamlined Medicaid Application

State Medicaid agencies are required to make the single streamlined application available through multiple modes, including online, by phone, and on paper by January 1, 2014. As of October 1, 2013, 43 of 50 reporting states have deployed a single, streamlined application through their Medicaid agency, with 43 state Medicaid agencies having a paper version in place and 36 having launched an online version. The seven (7) remaining reporting states are in the process of developing their single, streamlined applications with nearly all anticipating completion by January 1, 2014 (Appendix Table 4). In the interim, these states are continuing to utilize their existing Medicaid applications and individuals who may be eligible for premium tax credits are being directed to apply through the federal Marketplace.9  Looking ahead states will continue work to make the single streamlined application available through all required modes, although some state agencies may not have all of these avenues available until later in 2014. In these cases, CMS is working with states to develop mitigation plans to help ensure consumers can connect to coverage.

Coordinating Enrollment Across Health Coverage Programs

Coordination between Medicaid, CHIP, and the Marketplace will be key for achieving the ACA’s no wrong door approach to coverage. States have the option to decide whether the Marketplace (State-based (SBM) or Federally-facilitated (FFM)) will determine eligibility for Medicaid and CHIP or assess potential eligibility and send the case to the Medicaid and CHIP agency for a final determination.10  To facilitate coordination across programs and prevent individuals from having to provide information more than once, state agencies and Marketplaces are expected to electronically transfer an account with all of the individual’s information promptly and without undue delay and are not allowed to request any information or documentation that the individual has already provided.

Coordination processes will vary based on whether the Marketplace has the authority to assess or determine Medicaid eligibility. For example, if an individual applies through a Marketplace that determines Medicaid/CHIP eligibility, the Marketplace will make a final eligibility determination and transfer the account of any eligible individual to the Medicaid/CHIP agency for enrollment, without a second review of eligibility. In contrast, if an individual applies through a Marketplace that assesses Medicaid/CHIP eligibility, it will transfer the account for any individual assessed as potentially eligible for Medicaid/CHIP for a final determination by the Medicaid/CHIP agency. If determined eligible for Medicaid/CHIP, the individual will be enrolled. If determined ineligible for Medicaid/CHIP, the agency will transfer the individual’s account back to the Marketplace for a review of eligibility for premium tax credits. As a result, some individuals may be transferred back and forth between coverage programs before they are determined eligible. Among the 34 federal or partnership Marketplace states, as well as Idaho and New Mexico (which are initially relying on the FFM to handle Marketplace eligibility and enrollment), the FFM will assess Medicaid/CHIP eligibility in 24 states and make final Medicaid/CHIP eligibility determinations in 12 states. In seven (7) of these 12 states, the FFM will make determinations temporarily until the state’s Medicaid/CHIP eligibility system is able to meet the ACA requirements (Appendix Table 5).

The ability to electronically transfer individual accounts between state Medicaid/CHIP agencies and the Marketplaces is in various stages of development. All but two (2) of the 17 states with SBMs share an integrated or linked technology system that determines eligibility for all insurance affordability options and facilitates the next steps for enrollment. However, in states using the FFM, electronic transfers of individual accounts between the Marketplace and Medicaid/CHIP agencies are essential for coordinating enrollment. Due to ongoing technological challenges with the FFM, these transfers have been delayed. As such, alternative strategies have been put into place. For example, until the FFM can begin transferring electronic accounts to state Medicaid and CHIP agencies, it is sending batches with basic data on individuals the FFM has assessed as potentially eligible for Medicaid/CHIP. Similarly, if a state Medicaid/CHIP agency is unable to screen for premium tax credits and transfer the account to the FFM it can advise potentially-eligible individuals to apply directly through the FFM. Moving forward, implementing electronic account transfers will be key to minimizing burdens on consumers and ensuring that they only need to submit a single application, as envisioned by the ACA’s no wrong door approach to coverage.

Verification of Eligibility Criteria

Beginning in January 2014, states are expected to rely on trusted electronic data sources rather than paper documentation to verify eligibility. Only when information cannot be obtained through an electronic data source or is not ‘‘reasonably compatible’’ with information provided by the consumer can additional information, including paper documentation, be requested. To facilitate electronic verification, states are expected to establish data linkages with federal and state data sources. A federal data hub provides access to information from multiple federal agencies including the Internal Revenue Service (IRS), the Social Security Administration (SSA), and the Department of Homeland Security (DHS). In addition, states are commonly accessing databases that collect state wage information, unemployment compensation information, vital statistics, and eligibility data for other public programs. Ultimately the goal is for these data interfaces to provide real-time or immediate access to data, however, in some cases, data may continue to be exchanged in a process that “batches” requests for information for multiple people on a daily or other periodic basis. In these instances, data is also returned in batches, which may result in a lag before the requested data is available and can be used to verify eligibility. When this is the case, states may pend or hold the application until the data is received and reviewed. Alternatively, some states may use the data to verify eligibility after they have enrolled the individual based on his/her self-attestation.

States are submitting verification plans to CMS, which outline the electronic data sources and procedures they will use to verify eligibility criteria. For the majority of states, the heightened reliance on electronic verification requires a redesign of business practices to implement a real-time, data-driven approach to verification. Each state must file a plan with CMS describing the agency’s verification policies and procedures including the data sources used at application and renewal, the frequency of data checks, and how the state determined the usefulness of electronic data sources.11  While there is no formal process for federal approval, the verification plans are used to confirm state implementation of the new standards established by the ACA, and will be used for quality and audit purposes going forward.12  As of November 15, 35 verification plans have been approved and made publicly available.

States continue to have the option to accept self-attestation for all non-financial eligibility criteria except where otherwise required by statute. Under law, states must verify Social Security Numbers (SSNs), citizenship, and immigration status. For other non-financial aspects of eligibility (e.g., state residency, age/date of birth, and household composition), states have more flexibility and may choose 1) to rely on self-attestation without additional verification, 2) rely on self-attestation to make the eligibility determination and verify post-enrollment, or 3) verify data to determine eligibility. For pregnancy, states must accept self-attestation, although they may request verification if multiple babies are expected. If states verify non-financial eligibility criteria, they are expected to use electronic data and eliminate or minimize requirements for paper documentation at both application and renewal. Even in states accepting self-attestation without further verification, the state may have access to electronic data for some people (for example, if the consumer is also enrolled in SNAP), which may be used to confirm eligibility.13  Moreover, states always have the option to verify any data that it considers questionable. All 35 reporting states will verify SSNs, citizenship, and immigration status through federal data sources as required by law. Most states plan to rely on self-attestation of state residency (28 of 35) and household composition (33 of 35). In contrast, the majority of the reporting states (22 of 35) plan to verify age and date of birth, with 18 verifying data to make the eligibility determination and 4 doing so post-enrollment (Figure 9 and Appendix Table 6).

Figure 9: State Verification Procedures for Selected Medicaid Eligibility Criteria

For income, states must verify financial information from an electronic data source; however, this can be done post-enrollment after the state determines eligibility based on the individual’s attestation.14  States also may accept self-attestation for certain types of income that cannot be verified through an electronic source. All 35 reporting states will verify income through electronic sources, with 30 states doing so to determine eligibility and five (5) states verifying income post-enrollment (Figure 9 and Appendix Table 7). In addition, 23 states will be conducting routine ongoing post-enrollment checks of financial information to identify changes in income over time, although the frequency of these checks varies. Consumers are still required to report changes that may impact their eligibility.

States are relying on a variety of data sources to verify eligibility criteria. States have latitude to determine if a particular income data source is “useful” but neither the age nor cost of obtaining the data can be used as a reason to continue requiring paper documentation. SSNs and citizenship will be verified via an electronic match with the SSA, while immigration status will be verified through the DHS Systematic Alien Verification for Entitlements (SAVE) database. Frequently-used data sources for other non-financial eligibility criteria include the SSA, the Public Assistance Reporting Information System (PARIS), and state databases, such as the Department of Motor Vehicles (DMV), vital statistics, and public assistance records for Temporary Assistance to Needy Families (TANF) and SNAP. The most common data sources that states will use to verify income at application, renewal and post-enrollment include the IRS, SSA, state wage data, state unemployment data and commercial databases that provide payroll information for some employers, such as TALX (also known as the Work Number) (Appendix Table 8).

States may set “reasonable compatibility” standards to address situations in which self-attested income and electronic sources are inconsistent. In Medicaid and CHIP, data are always considered reasonably compatible if the individual’s self-attested income and the electronic data source are both at, below, or above the income standard—in these cases, the difference does not impact eligibility. In cases where self-attested income is above the standard and electronic data are below, or vice versa, states have flexibility to define when inconsistencies between the two sources are considered reasonably compatible. If the difference between the electronic data and the consumer’s self-attestation is within the reasonable compatibility standard, the self-attestation is used. If the data are not reasonably compatible under this standard, the state may accept a reasonable explanation of the difference and/or request paper documentation of income

  • For cases in which self-attested income is below the income standard, but electronic data sources show income above the standard, 27 of the 35 reporting states have set a reasonable compatibility standard. If the data are not within the reasonable compatibility standard, 26 of the 35 states will ask for a reasonable explanation of the difference before requesting paper documentation, while nine (9) will always request paper documentation to verify income.
  • For cases in which self-attested income is above the income standard, but electronic data sources show income below the standard, the vast majority of states are not setting a reasonable compatibility standard. Thirty (30) of 35 reporting states will accept the self-attestation, deny Medicaid eligibility, and screen for eligibility for premium tax credits, regardless of the size of the discrepancy between the attestation and the electronic data source. One state (NJ) will also accept self-attested income if the difference is no more than 10 percent, the state’s reasonable compatibility standard. Given that individuals may overstate their income if they are not aware that certain income and pre-tax contributions (e.g., dependent care expenses) should not be counted, this policy may result in a Medicaid denial and determination for premium tax credits even though the individual is, in fact, eligible for Medicaid. Three (3) states ask for a reasonable explanation of the difference before requesting paper documentation, while two (2) will always require paper documentation to verify income and process the eligibility determination.
Table 1: Reasonable Compatibility Approaches Used by Medicaid Agencies at Application
Total Number of States Reporting35
If attestation and data are both
Below the income limit, determined eligible for Medicaid35 (required)
Abovethe income limit, determined ineligible for Medicaid and screen for advance premium tax credits35 (required)
If attestation is below and data are above the income limit:
Determine eligible for Medicaid if within reasonable compatibility standard27
If not within the reasonable compatibility standard:
Ask for reasonable explanation from individual26
Require paper documentation of income9
If attestation is above and data are below the income limit:
Determine ineligible for Medicaid, screen for advance premium tax credits30
Ask for a reasonable explanation of the difference from the individual*3
Require paper documentation of income2
*Note if the reasonable explanation is not sufficient, states may ask for paper documentation.Source: Based on analysis of Centers for Medicare and Medicaid Services State Medicaid & CHIP Policies for 2014: Medicaid/CHIP Verification Plans conducted by the Kaiser Commission on Medicaid and the Uninsured with the Georgetown Center for Children and Families. Data are available at: http://www.medicaid.gov/Medicaid-CHIP-Program-Information/By-State/By-State.html

New Options To Facilitate Enrollment And Renewal

To facilitate processing applications for large numbers of people who become newly eligible for Medicaid on January 1, CMS has offered states five strategies to help manage the transition. Highlighted in a May 17, 2013 letter to state officials,15  these approaches are intended to promote enrollment and retention, while smoothing the administrative burden as states shift to new eligibility processes. A state may adopt any of these facilitated enrollment approaches regardless of whether it plans to implement the Medicaid expansion, and as of October 1, a number of states have taken up at least one of these options (Figure 10 and Appendix Table 9).

Figure 10: Adoption of Selected Strategies to Streamline Enrollment of Eligible Individuals into Medicaid as of October 1, 2013

Overall, 30 states have adopted at least one of the strategies, and 11 have adopted two or more of these approaches. Three (3) states (NJ, OR, and WV) have adopted four of the five. These strategies include:

  • Extending Renewal Periods. The ACA protects individuals currently enrolled in Medicaid from losing coverage solely as a result of the conversion to MAGI-based eligibility until March 31, 2014 or their next renewal date (whichever is later). To abide by this provision, states would need to apply both the new MAGI rules and the existing rules to determine eligibility for those whose coverage is up for renewal between before March 31, 2014. To avoid this duplication of effort, CMS offered states the option to extend renewal dates beyond this three-month transition period and begin applying only MAGI-based eligibility rules to all regularly scheduled renewals beginning on April 1, 2014. States have flexibility to structure how the delays will take place, for example, by delaying renewals for 90 days, as long as they establish a reasonable timeframe within which the renewals will be completed. Twenty-five (25) states have taken up this strategy, many adopting it over a longer timeframe than those scheduled for the first quarter of 2014.
  • Early Adoption of MAGI Eligibility. Through the initial months of open enrollment (October through December 2013), all individuals applying for or renewing Medicaid/CHIP coverage should have their eligibility determined under existing rules and also be assessed for eligibility using the new MAGI-based methodologies to determine if they will be eligible for coverage as of January 1, 2014. To avoid having to utilize two sets of eligibility rules, and possibly two different eligibility systems during this time, CMS offered states the option to adopt the MAGI methodology as of October 1 for all eligibility determinations going forward, which 15 states accepted.16 
  • Enrolling Eligible Supplemental Nutrition Assistance Program (SNAP) Participants in Medicaid. This temporary option is available to states through the end of 2015, and allows them to use data available from SNAP (also known as food stamps) to enroll eligible participants in Medicaid. To qualify for SNAP, a household’s gross income cannot generally exceed 130 percent of the FPL, which aligns well with the new Medicaid threshold of 138 percent of the FPL, although states may use this option for a subset of SNAP participants. Because SNAP enrollment data include verified information for many of the criteria necessary to determine Medicaid eligibility, a state can use that information along with a signed letter or phone call as a Medicaid application and enroll individuals once certain non-financial information, including citizenship or immigration status, is verified. Five (5) states (AR, IL, NJ, OR, and WV) have adopted this approach.
  • Enrolling Parents in Medicaid Based on their Children’s Eligibility Data. In 2010, 3.5 million uninsured parents who could gain Medicaid coverage under the ACA expansion already had a child who was enrolled in Medicaid or CHIP.17  CMS offered states a temporary opportunity to expedite the enrollment of these parents. States can adopt this option by reactivating recent parent applications that have been denied or by reviewing children’s cases to identify eligible parents and requesting any additional information needed to make an eligibility determination. States may also send parents a pre-populated application or ask for additional information from the parent on the child’s renewal form. Three (3) states (NJ, OR, and WV) have moved forward with this approach.
  • 12-Month Continuous Eligibility for Parents and Other Adults. States have long had the option to provide 12-month continuous eligibility for children regardless of certain changes in family circumstances, including fluctuations in income. Almost half of states (23) have adopted this option in Medicaid, strengthening the continuity of care and promoting ongoing coverage of children. CMS has offered to extend this effective retention strategy to adults and is working on implementation details.18 

Two of these strategies, enrolling eligible SNAP participants and enrolling parents based on their children’s eligibility data, allow states to get a jump-start on their Medicaid expansions by significantly streamlining the process and utilizing data already available to states. Experiences in the four states that have already launched these strategies indicate they can be highly successful in connecting people to coverage, reaching a significant share of adults eligible for the Medicaid expansion while minimizing burdens for both eligibility staff and individuals and reducing traffic through enrollment systems. Overall, in these four states, over 223,000 individuals have been enrolled through these strategies as of November 15, 2013.19 

Conclusion

Looking ahead to 2014, coverage for parents and other adults will significantly improve in the 26 states implementing the Medicaid expansion and eligibility levels for children and pregnant women will remain strong across states. As such, as the ACA is fully implemented, Medicaid offers the potential to significantly reduce the number of uninsured. Outreach and enrollment efforts will be key for increasing coverage and it will be important for these efforts to be ongoing throughout the year since Medicaid enrollment is not limited to the Marketplace’s open enrollment period. In contrast to gains in states expanding Medicaid, large coverage gaps will remain in the states that do not expand, leaving millions of poor uninsured adults without access to a new coverage option.

To date, states have made meaningful progress in implementing key provisions of the ACA to provide streamlined Medicaid eligibility and enrollment processes, but readiness varies considerably. Moreover, the technology problems that have hampered the launch of open enrollment through the new Marketplaces, particularly the federal Marketplace (HealthCare.gov), have led to delays in coordination across Medicaid, CHIP, and Marketplace coverage. However, even with these early implementation challenges, some states have been successfully enrolling people in Medicaid and several have gotten a significant jump-start through the facilitated enrollment strategies offered by CMS. In the coming months, work will continue to deploy new processes and systems to move toward the ACA’s vision of a simplified, consumer-friendly experience. As such, January 2014 will represent the first step toward a modernized, streamlined system to connect individuals to expanded coverage options as established through the ACA, but fully achieving that vision will require time, persistence, and a commitment to continual program improvement.

Endnotes

  1. A number of income sources, such as child support and Social Security benefits, which are currently counted for Medicaid eligibility, are excluded from taxable income and MAGI-based determinations. States also take a different approach to determining the size of family, often based on who is applying for benefits. But under the new MAGI rules, household size will be based on the tax-filing unit, with all individuals claimed as dependents included when determining that taxpayer’s family size. ↩︎
  2. Despite the attempt at coordination, there will be cases in which the definitions of household and income will not align across the various coverage programs. For example, Medicaid/CHIP eligibility will still be based on monthly income, whereas eligibility for premium credits in the Marketplace will be based on annual income. Additionally, certain types of income, such as educational grants, are not included when determining eligibility in Medicaid, but are when determining eligibility for Marketplace coverage. The household composition, such as for married couples, may also be counted differently in Medicaid. However, there is a safe harbor provision for individuals and families who are determined ineligible for Medicaid by the Medicaid agency, but are found to have income below 100 percent of the FPL based on the methods used by the Marketplace. In such cases, Medicaid eligibility will be determined using the tax definition (i.e., what was used by the Marketplace), allowing the applicant(s) to secure coverage in Medicaid and avoid a gap in coverage. ↩︎
  3. Note that not all states apply earnings disregards or other deductions and may simply use a gross income standard. ↩︎
  4. CMS provided states with the option of using the HHS-standardized method or a state-proposed alternative for calculating the MAGI-equivalent standards. Most states used a standard model that simulated the average value of disregards and deductions for families with net income within 25 percentage points of a state’s upper eligibility limit. This value is expressed as a percentage of the FPL and added to the state’s existing eligibility level to create the new MAGI-equivalent standard. Alternatively, states could take this same approach using their own administrative data on the use of disregards and deductions. States could also work with HHS to develop their own methodology to more adequately fit unique circumstances, for example, to account for unusual disregards. Of the 46 MAGI conversion plans available, just three (3) states (AK, NE, and NV) chose this alternative approach. C. Mann, Director of Centers for Medicaid and CHIP Services letter to State Health Officials and State Medicaid Directors, SHO #12-003 (December 28, 2012). ↩︎
  5. In an attempt to simplify eligibility categories, the ACA collapses many of the existing ones into three broad groups: parents, pregnant women, and children under age 19. States will set income eligibility standards for parents, pregnant women, and children subject to federally specified minimums and maximums. The minimum eligibility level for parents is tied to states’ historical eligibility levels for Aid to Families with Dependent Children, while the minimum level for pregnant women and children generally is 133 percent of the FPL, although may be higher in some states for pregnant women. ↩︎
  6. In order to equalize their eligibility thresholds, states would need to use a “less restrictive methodology” for determining income, effectively disregarding the income between the two converted thresholds for the older children. This option, under section 1902(r)(2), is no longer available with the switch to the new MAGI methodology on January 1, 2014. ↩︎
  7. While the new mandatory minimum eligibility threshold is 133 percent of the FPL, the standard five percentage point of the FPL disregard is included to represent the highest threshold at which an older child may be eligible for Medicaid. ↩︎
  8. Louisiana Department of Health and Hospitals. “Changes to Medicaid Eligibility Criteria Effective January 1.” Friday, August 16, 2013 available at: http://www.dhh.louisiana.gov/index.cfm/newsroom/detail/2854 ↩︎
  9. Colorado and Maine are using a two-step process, where those who may be eligible for premium tax credits are directed to additional questions that will need to be answered to determine eligibility for premium tax credits in the marketplace. These states are considered by CMS to have a single, streamlined application. ↩︎
  10. If a Marketplace is operated by a non-governmental agency, the authority to conduct final Medicaid determinations is limited to MAGI-based determinations. In some cases in which the Marketplace is operated by a governmental agency, the Marketplace may be able to make non-MAGI determinations or enter into contracts with government agencies to do so. ↩︎
  11. Verification Plan Template – Guidance and Instructions; Phase I – MAGI-based Eligibility. ↩︎
  12.  CMS eligibility audits through the Payment Rate Error Measurement (PERM) review and Medicaid Eligibility Quality Control (MEQC) evaluate whether eligibility determinations are made in accordance with state policy. Verification plans and other documents describing state policies and procedures are the basis for conducting the audits. ↩︎
  13.  These states are counted under the “Self-Attestation Accepted at Application without Additional Verification” column, as this is the process they will use for the majority of their population. ↩︎
  14.  Section 1137 of the Social Security Act requires states to have in effect an income and eligibility verification system. 42 CFR 435.948(a)(1) requires states to verify information (to the extent the agency determines such information is useful), related to wages, net earnings from self-employment, unearned income and resources from the State Wage Information Collection Agency (SWICA), the Internal Revenue Service (IRS), the Social Security Administration (SSA), the agencies administering the State unemployment compensation laws, the State administered supplementary payment programs under section 1616(a) of the Act, and any State program administered under a plan approved under Titles I, X, XIV, or XVI of the Act. ↩︎
  15.  C. Mann, Director of Centers for Medicaid and CHIP Services letter to State Health Officials and State Medicaid Directors, SHO #13-003 (May 17, 2013). ↩︎
  16.  Note that Pennsylvania is adopting the early MAGI option in its Medicaid program only. ↩︎
  17.  M. Heberlein, et al., “Medicaid Coverage for Parents under the Affordable Care Act,” Georgetown University Center for Children and Families (June 2012). ↩︎
  18.  The option was in Arkansas’ waiver application, but because the state could not secure the 100 percent federal match for these adults for their full-year of coverage, the state chose not to go forward. The newly eligible matching rates is only applicable for individuals who meet the statutory eligibility requirements, and as such is not available to those individuals who remain enrolled but whose income or other eligibility criteria changes over the year in ways that would make them no longer eligible under the category. New York had pre-existing waiver approval to extend 12-month continuous eligibility to parents and New Mexico included the policy for all adults in its recently approved waiver, but neither state has yet implemented it. ↩︎
  19. J. Guyer, et al., “Fast Track to Coverage: Facilitating Enrollment of Eligible People into the Medicaid Expansion,” Kaiser Commission on Medicaid and the Uninsured (November 2013). ↩︎