Wisconsin’s BadgerCare Program and the ACA

Authors: Alexandra Gates and Robin Rudowitz
Published: Feb 25, 2014

Summary

Prior to the Affordable Care Act (ACA), states could only cover childless adults and receive federal Medicaid funds by obtaining a Section 1115 waiver which allowed states to operate their Medicaid programs in ways not otherwise allowed under federal laws to promote the objectives of the program.  In Wisconsin, BadgerCare was originally created in 1999 as a way to provide a health care safety net for low-income families transitioning from welfare to work. In 2008, BadgerCare Plus was created to expand Medicaid coverage to all uninsured children (through age 18), pregnant women with incomes below 300% of the Federal Poverty Level (FPL), and parents and caretaker relatives with incomes below 200% FPL. In 2009, childless adults with incomes below 200% FPL were also included; however, enrollment was capped. In 2012, parents and caretakers with incomes above 133% FPL were required to pay a monthly premium.

The ACA expands Medicaid to adults with significant federal funding so states do not need waivers for this purpose.  While most states with waiver coverage in place prior to the ACA are transitioning this coverage to new coverage under the ACA, Wisconsin sought and received approval to continue coverage of childless adults through a waiver. As a result of Wisconsin’s higher eligibility levels prior to the enactment of the ACA, Wisconsin is restricting Medicaid eligibility for parents and some childless adults to 100% FPL, but also expanding coverage to make it available to nearly all non-elderly childless adults with incomes below 100% FPL (without an enrollment cap). Because coverage is limited to 100% FPL this is considered a partial expansion and is not eligible for enhanced federal matching funds provided in the ACA.  There is no gap in coverage that is typical in other states not implementing the Medicaid expansion because individuals with incomes above 100% are eligible for tax credits to purchase coverage in the Marketplaces. For more information on how the ACA affects Wisconsin’s uninsured population, please read How Will the Uninsured in Wisconsin Fare Under the Affordable Care Act?.

This brief provides an overview of the BadgerCare Plus and how the waiver relates to the ACA.

Background

As enacted, the ACA called for an expansion of Medicaid for nearly all non-disabled adults with incomes at or below 138% of the Federal Poverty Level (FPL) that is largely funded with federal dollars.  However, as a result of the Supreme Court ruling on the ACA, the Medicaid expansion is effectively a state option.  Prior to the enactment of the ACA, a number of states used Section 1115 Medicaid Demonstration Waivers to expand coverage to adults and to operate Medicaid programs in ways not otherwise allowed under federal rules.  In states moving forward with the Medicaid expansion, many of adults covered through 1115 waivers will transition to new coverage under the ACA and states will receive enhanced matching funds for this coverage.  A few states with waiver coverage in place prior to the ACA are not implementing the ACA in 2014 like Wisconsin.  Wisconsin received approval of a new waiver to provide coverage to childless adults up to 100% FPL, but this coverage is not eligible for enhanced ACA matching funds.

BadgerCare Pre-ACA

In Wisconsin, BadgerCare was originally created in 1999 as a way to provide a health care safety net for low-income families transitioning from welfare to work. In 2008, BadgerCare Plus was created to expand Medicaid coverage to all uninsured children (through age 18), pregnant women with incomes below 300% of the Federal Poverty Level (FPL), and parents and caretaker relatives with incomes below 200% FPL. In 2009, childless adults with incomes below 200% FPL were also included; however, enrollment was capped. In 2012, parents and caretakers with incomes above 133% FPL were required to pay a monthly premium. As approved in 2012, BadgerCare Plus covered the following populations: uninsured children regardless of income; pregnant women through 300% FPL; parents and caretakers through 200% FPL; childless adults through 200% FPL; and Transitional Medical Assistance (TMA) families FPL.

Enrollment for childless adults has been capped since October 2009 due to budget neutrality maintenance requirements. As such, average enrollment for this population steadily decreased between State Fiscal Year 2010 and 2013 from 50,627 enrollees to 17,791 (in June 2013).  In August 2013, there were 157,259 individuals from the childless adult populations on the wait list. Numerous studies from 2009 and 2010 found that the eligibility expansion of BadgerCare increased access to coverage and enrollment among low-income Wisconsinites among both the previously and newly eligible populations.1 ,2 ,3 ,4 

In 2012, Wisconsin received approval to apply premium payments to TMA adults above 138%FPL with a 12-month restrictive re-enrollment policy as a penalty for failure to pay premiums.  In 2012, the Wisconsin Department of Health Services (DHS) studied the effects of the increased and expanded premiums implemented on TMA individuals above 138% FPL. This study found that between July 2012, when the premium provision was implemented, and December 2012 over two thirds (69%) of the 18,544 individuals between 133% and 150% FPL had left the program. About one in five (21%) of that population lost coverage due to failure to pay within the initial six months.5 

Key Elements of BadgerCare Reform Waiver

The BadgerCare Reform waiver will cover childless adults with incomes up to 100% FPL with no enrollment cap.  Compared to the previous waiver, the BadgerCare Reform waiver will decrease BadgerCare Plus eligibility levels from 200% FPL to 100% FPL for childless adults and current enrollees with income greater than 100% FPL will be transitioned to coverage in the Marketplace as of April 1, 2014.6   In states not expanding Medicaid, individuals with incomes between 100 and 138% FPL are eligible for tax credits to help purchase coverage through the new Marketplaces.  Unlike the original waiver, childless adults will not be limited by an enrollment cap. Wisconsin estimates that approximately 99,000 childless adults will enroll in BadgerCare in 2014 (an increase of approximately 83,000 individuals) and that nearly 5,000 individuals will transition to the federal Marketplace.7  TMA adults with incomes above 100% FPL who completed their time-limited TMA will be reviewed first for Medicaid eligibility and then assessed for Marketplace eligibility.  In addition, Wisconsin intends to make corresponding changes through a State Plan Amendment (SPA) to limit Medicaid coverage for parents and caretaker relatives to 100% FPL beginning April 1, 2014.

The 2014 waiver approval allows the state to require premiums to adults who qualify for Medicaid through TMA with incomes above 100% FPL (previously at 138%).  The sliding scale premiums under the demonstration will align with Marketplace premium levels (i.e. 2% of income for individuals with incomes between 100 and 133% FPL).8   The demonstration permits the state to charge premiums to TMA adults with incomes above 133% FPL from the date of TMA enrollment and to TMA adults with incomes between 100 and 138% FPL after 6 months of TMA coverage.  Failure to pay premiums after a 30-day grace period may result in loss of eligibility for 3 months before an individual may re-enroll (without a requirement to repay the owed premium).

The BadgerCare Reform provides more comprehensive benefits to childless adults compared to the previous waiver.  Under the previous waiver, childless adults were covered by a separate, less comprehensive benefits plan called the BadgerCare Plus Core Plan. The BadgerCare Reform waiver eliminates that plan and provides all individuals with benefits through the BadgerCare Plus Standard Plan, which is more comprehensive. Childless adults will not be offered family planning services or tuberculosis-related services. Additionally, both childless adults and TMA adults will not receive pregnancy related services, but will be assessed for pregnancy related Medicaid coverage. All BadgerCare beneficiaries will be required to enroll in a Medicaid Managed Care Organization (MCO).

The waiver approval requires demonstration of public notice and tribal consultation as a condition for amendments to the waiver.  The ACA required the Department of Health and Human Services to issue regulations designed to ensure that the public has meaningful opportunities to provide input into the Section 1115 waiver approval process. The rules, issued in February 2012, require public notice and comment periods at the state and federal levels before waivers are approved by CMS.  The rules apply to new Section 1115 waivers and extensions of existing waivers.9   The waiver approval requires demonstration of public notice and tribal consultation as a condition for amendments to the waiver.

Conclusion

Prior to the ACA, states could only cover childless adults and receive federal Medicaid funds by obtaining a Section 1115 waiver; however, the ACA expands Medicaid to adults with significant federal funding so states do not need waivers for this purpose.  While most states with waiver coverage in place prior to the ACA are transitioning this coverage to new coverage under the ACA, Wisconsin sought and received approval to continue coverage of childless adults through a waiver.  As a result of Wisconsin’s higher eligibility levels prior to the enactment of the ACA, Wisconsin is restricting Medicaid eligibility for parents and some childless adults to 100% FPL, but also expanding coverage to make it available to nearly all non-elderly childless adults with incomes below 100% FPL (without an enrollment cap). Because coverage is limited to 100% FPL this is considered a partial expansion and is not eligible for enhanced federal matching funds provided in the ACA. There is no gap in coverage that is typical in other states not implementing the Medicaid expansion because individuals with incomes above 100% are eligible for tax credits to purchase coverage in the Marketplaces.

  1. Katherine Wigert, BadgerCare Plus: Medicaid and Subsidies Under One Umbrella (Princeton, NJ: Robert Wood Johnson Foundation and the National Academy for State Health Policy, August 2009), http://www.rwjf.org/en/research-publications/find-rwjf-research/2009/08/badgercare-plus.html ↩︎
  2. Thomas DeLiere, Donna Frieddam, Lara Dague, Daphne Kuo, Lindsey Leininger, Sarah Meier, Kristen Voskuil, “Has Wisconsin Achieved the Policy Goal of 98% Access to Health Insureance Coverage?,” in Evaluation of Wisconsin’s BadgerCare Plus Health Care Coverage Program, December 2010, http://uwphi.pophealth.wisc.edu/publications/other/badgercare-plus-6-98-percent.pdf. ↩︎
  3. Thomas Deleire, Laura Dague, Lindsey Leininger, Kristen Voskuil, Donna Friedsam, “Wisconsin Experience Indicates that Expanding Public Insurance to Low-Income Childless Adults Has Health Care Impacts,” Health Affairs vol. 32 no. 6(June 2013): 1037-1045, doi: 10.1377/hlthaff.2012.1026, http://content.healthaffairs.org/content/32/6/1037.abstract ↩︎
  4. Wisconsin Department of Health Services, BadgerCare Plus 1115 Demonstration Project Application (Madison, Wisconsin: Wisconsin Department of Health Services, August 15, 2013), http://www.dhs.wisconsin.gov/badgercareplus/waiver081513.pdf. ↩︎
  5. “DHS Submits BadgerCare Waiver to Change Adult Coverage,” Jon Peacock, Wisconsin Council on Children and Families, http://www.wiskids.blogspot.com/2013/08/dhs-submits-badgercare-waiver-to-change.html#more, August 12, 2013. ↩︎
  6. The waiver was intended to be in effect as of January 1, 2014, but Wisconsin extended coverage for individuals above 100% until April 1, 2014 due to issues enrolling in the federal marketplace. ↩︎
  7. Centers for Medicare and Medicaid Services, Special Terms and Conditions for BadgerCare, http://www.dhs.wisconsin.gov/badgercareplus/pubs/stc.pdf, last accessed on January 16, 2014. ↩︎
  8. 100-132.9%FPL is 2% of income; 133-139.9% FPL is 3% of income; 140-149.9% FPL is 3.5% of income; 150-159.9% FPL is 4% of income; 160-169.9% FPL is 4.5% of income; 170-179.9% FPL is 4.9% of income; 180-189.9% FPL is 5.4% of income; 190-199.9% FPL is 5.8% of income; 200-209.9% FPL is 6.3% of income; 210-219.9% FPL is 6.7% of income; 220-229.9% FPL is 7% of income; 230-239.9% FPL is 7.4% of income; 240-249.9% FPL is 7.7% of income; 250-259.9% FPL is 8.05% of income; 260-269.9% FPL is 8.3% of income; 270-279.9% FPL is 8.6% of income; 280-289.9% FPL is 8.9% of income; 290-299.9% FPL is 9.2% of income; and 300% and above is 9.5% of income. ↩︎
  9. The New Review and Approval Process Rule for Section 1115 Medicaid and CHIP Demonstration Waivers.  Kaiser Commission on Medicaid and the Uninsured, May 2012.  https://modern.kff.org/health-reform/fact-sheet/the-new-review-and-approval-process-rule/ ↩︎

Visualizing Health Policy: Physicians and Medicare

Published: Feb 25, 2014

The February 2014 Visualizing Health Policy infographic takes a look at physicians and Medicare, including information about Medicare’s payment formula for physicians and about access to health care for people covered by Medicare.

m_jvh140001fa

Visualizing Health Policy is a monthly infographic series produced in partnership with the Journal of the American Medical Association (JAMA). The full-size infographic is freely available on JAMA’s website and is published in the print edition of the journal.

>>View source slides

State Medicaid Coverage of Routine HIV Screening

Published: Feb 25, 2014

Introduction

The Centers for Disease Control and Prevention (CDC) recommends that HIV screening be a part of routine medical care for all patients between the ages of 13 and 64.1  These recommendations are intended for all health care providers in both the public and private sectors. This fact sheet assesses coverage of routine HIV screening by state Medicaid fee-for-service programs; Medicaid is the largest source of care and coverage for people with HIV/AIDS in the United States,2  but routine HIV screening for adults is an optional Medicaid benefit which states may choose to cover.

HIV Screening

HIV testing is integral to HIV prevention, treatment, and care efforts.3   Knowledge of one’s HIV status is important for preventing the spread of disease and for being linked to medical care and services, which in turn have also been shown to have significant public health benefits.4 

Yet the CDC estimates that of the more than 1.1 million people living with HIV/AIDS in the U.S., one in six (16%) do not know they are infected.5   To increase HIV testing rates and knowledge of HIV status, CDC released revised screening guidelines in 2006, recommending, for the first time, routine HIV screening in all health care settings for 13 to 64 year-olds, unless a patient opts out.  Routine HIV screening is broad, population-based screening, in contrast with “medically necessary” testing and testing targeted at those at higher risk.6  The CDC’s routine HIV screening recommendations are intended for health care providers, who are central to their implementation in clinical practice.

A key decision that impacts the implementation of these guidelines came in April 2013, when the U.S. Preventive Services Task Force (USPSTF) gave routine HIV screening of all adolescents and adults, ages 15 to 65, an “A” rating – generally aligning the rating with the CDC’s HIV screening guidelines.  This rating expands the already existing “A” rating for people at increased risk for HIV (such as injection drug users and men who have sex with men), and for all pregnant women.7   The USPSTF ratings are developed by an independent panel of clinicians and scientists, and are important because many private and public insurers link their coverage of preventive services to ones rated “A” or “B” by the USPSTF.  The “A” rating has further implications given the Affordable Care Act (ACA), which requires or incentivizes new private health plans, Medicare, and Medicaid to provide preventive services rated “A” or “B” at no cost to patients.8 

Medicaid & HIV

One of the most important sources of care and coverage for people with HIV/AIDS in the U.S. is Medicaid, the nation’s principal safety net health insurance program for low-income Americans.  Medicaid is estimated to provide insurance coverage to almost half of all those with HIV who are in regular care.9  In addition, a significant share of those newly diagnosed with HIV have been found to already be covered by Medicaid.10   Thus, Medicaid provides an important potential entry point for assessing implementation of routine HIV screening in health care settings.

While all state Medicaid programs must cover medically necessary HIV testing,11  and the ACA offers states financial incentives to cover certain preventive services (including routine HIV screening) at no cost to consumers, state coverage of routine HIV screening varies because it is an optional benefit under Medicaid.12   Medicaid, while jointly financed by the federal government and the states, is designed and administered by the states within broad federal guidelines.  States can opt to provide routine HIV screening as part of the more general “diagnostic, screening, or preventive” benefit.13 

Looking ahead, one of the major vehicles in the ACA to increase health insurance coverage is an expansion of Medicaid to adults with incomes at or below 138% of the federal poverty level (FPL). While the expansion was intended to be implemented in all states, as a result of the Supreme Court decision on the ACA, it is now effectively a state choice. States that implement the expansion will cover most of the newly-eligible adults through Medicaid benchmark plans, referred to as Alternative Benefit Plans (ABPs). These ABPs are required to cover the Essential Health Benefits, which include all preventive services rated A or B by the USPSTF at no cost to the beneficiary. However, the ACA does not require states to cover the Essential Health Benefits under their traditional Medicaid benefit packages; coverage of routine screening for HIV and other preventive services in traditional Medicaid benefit packages will remain optional.

To assess coverage of routine HIV screening, along with coverage of other preventive services for adults in Medicaid fee-for-service programs, the Kaiser Family Foundation’s Commission on Medicaid and the Uninsured surveyed Medicaid officials in all 50 states and the District of Columbia in 2010 and in 2013.13 

State Medicaid Coverage of Routine HIV Screening

Findings

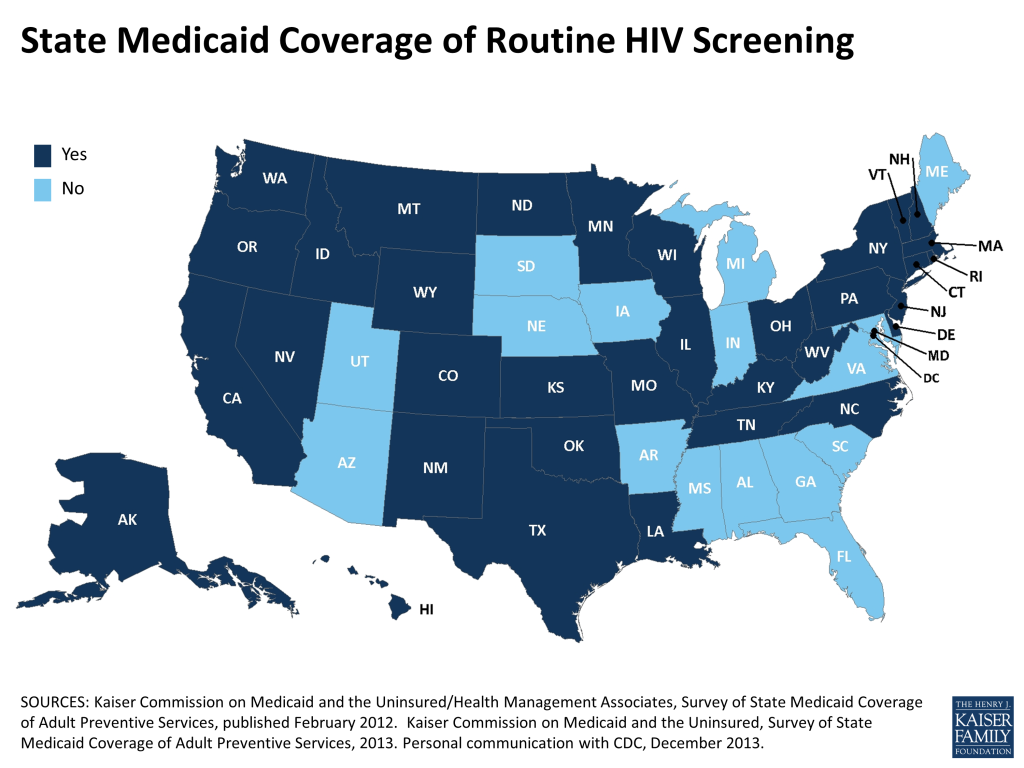
Across the two surveys, all fifty states and the District of Columbia responded to the question on routine HIV screening, with more than two thirds (35 states) reporting coverage of routine HIV screening under their Medicaid programs and 16 states reporting coverage of medically necessary testing only (See Table 1).13 

States in the Northeastern region of the U.S. were most likely to cover routine screening (89%, or 8 out of 9 states), followed by states in the West (85%, or 11 of 13).  Over half (58%, or 7 of 12 states) of states in the Midwest reported covering routine testing.  States in the South were least likely to cover routine HIV screening (53%, or 9 of 17).  Among those states who reported data for both surveys, 11 states expanded their coverage – moving from medically necessary HIV testing only to coverage of routine HIV screening – and 3 states shifted in the opposite direction, limiting their Medicaid coverage of HIV screening to medically necessary testing only.13 

Table 1: State Medicaid Coverage of Routine HIV Screening*
U.S. Total35 Routine Screening16 Medically Necessary
AlabamaMedically Necessary
AlaskaRoutine Screening
ArizonaMedically Necessary
ArkansasMedically Necessary
CaliforniaRoutine Screening
ColoradoRoutine Screening
ConnecticutRoutine Screening
DelawareRoutine Screening
District of ColumbiaRoutine Screening
Florida**Medically Necessary
Georgia**Medically Necessary
HawaiiRoutine Screening
IdahoRoutine Screening
IllinoisRoutine Screening
Indiana***Medically Necessary
IowaMedically Necessary
Kansas**Routine Screening
KentuckyRoutine Screening
LouisianaRoutine Screening
MaineMedically Necessary
MarylandMedically Necessary
MassachusettsRoutine Screening
MichiganMedically Necessary
MinnesotaRoutine Screening
MississippiMedically Necessary
MissouriRoutine Screening
MontanaRoutine Screening
Nebraska**Medically Necessary
NevadaRoutine Screening
New HampshireRoutine Screening
New JerseyRoutine Screening
New Mexico***Routine Screening
New YorkRoutine Screening
North CarolinaRoutine Screening
North DakotaRoutine Screening
Ohio**Routine Screening
OklahomaRoutine Screening
OregonRoutine Screening
PennsylvaniaRoutine Screening
Rhode IslandRoutine Screening
South Carolina***Medically Necessary
South DakotaMedically Necessary
TennesseeRoutine Screening
TexasRoutine Screening
UtahMedically Necessary
Vermont***Routine Screening
VirginiaMedically Necessary
WashingtonRoutine Screening
West VirginiaRoutine Screening
WisconsinRoutine Screening
WyomingRoutine Screening
*Table reflects the most recent data available. Unless otherwise noted, data represent benefits coverage as of January 1, 2013; Note – all states cover medically necessary HIV testing.
**State did not respond to the 2013 survey; data are based on responses from the October 2010 survey.
***Data for these states was provided via personal communication with the Centers for Disease Control and Prevention (CDC).  CDC verified data through State Health Officials, November-December 2013.
Sources: Kaiser Commission on Medicaid and the Uninsured (KCMU)/Health Management Associates, Survey of State Medicaid Coverage of Adult Preventive Services, published February 2012; KCMU, Survey of State Medicaid Coverage of Adult Preventive Services, 2013.
Notes: 1) In Pennsylvania, routine HIV screening is covered as part of an office visit.  2) TennCare does not pay for testing that is not medically necessary and so that is the provision of when coverage would be denied. Testing according to USPSTF guidelines is considered medically necessary according to TennCare rules (1200-13-16-.05 (3) (b) 3). HIV testing to satisfy administrative requirements such as employment or school would not meet this criterion and would not be covered by TennCare.  3) In Virginia, HIV Screening is reimbursed by Medicaid under the Plan First program. Plan First is a Medicaid program that pays for birth control and family planning services for women and men. It is a limited coverage program and not considered full coverage Medicaid. Also, if a member is under 21, routine HIV testing is covered through EPSDT; if the member is over 21, coverage is limited to Medically Necessary testing only.

While routine HIV screening is intended to help reach the estimated one in five people infected with HIV who do not yet know it, data on their distribution by state are not currently available.  Instead, data on diagnosed HIV prevalence by state provides a proxy measure of the concentration of overall HIV prevalence across the country.14   By this measure, seven in ten people living with HIV who have been diagnosed (70%) reside in states reporting coverage of routine HIV screening in their Medicaid programs; three in ten (30%) reside in states reporting coverage of medically  necessary testing only.15 

Among Medicaid beneficiaries with HIV specifically, the distribution holds a similar pattern, with about seven in ten enrollees having the benefit of routine screening. Seventy-two percent of Medicaid beneficiaries with HIV reside in states reporting coverage of routine HIV screening under Medicaid; three in ten (29%) reside in states that cover medically necessary testing only.16 

Summary & Implications

Medicaid, as the largest source of coverage for people with HIV/AIDS in the U.S., is an important entry point for assessing implementation of CDC and USPSTF routine HIV screening recommendations. We found that more than two thirds of all states now cover routine HIV screening and there has been an overall trend toward expanding coverage to include routine screening in the last few years.  There is variation in coverage by region, as well as of those living with HIV and of Medicaid beneficiaries with HIV.

Going forward, it will be important to monitor state Medicaid coverage of routine HIV screening.  Such tracking has gained new significance in light of the recent decision by the USPSTF to provide an “A” rating to routine HIV screening.17   Beyond these issues is the broader question of whether coverage of routine HIV screening actually translates into its provision by Medicaid providers as part of their patients’ regular health care.

  1. CDC. “Revised Recommendations for HIV Testing of Adults, Adolescents, and Pregnant Women in Health-Care Settings”, MMWR, 55(RR14);1-17; September 22, 2006. ↩︎
  2. Kates. Medicaid and HIV: A National Analysis, Kaiser Family Foundation; September 2011. ↩︎
  3. CDC. “Revised Recommendations for HIV Testing of Adults, Adolescents, and Pregnant Women in Health-Care Settings”, MMWR, 55(RR14);1-17; September 22, 2006. ↩︎
  4. Cohen MS, Chen YQ, McCauley M, et al. “Prevention of HIV-1 infection with early antiretroviral therapy,” N Engl J Med; Vol 365(6):493-505; August 2011. ↩︎
  5. CDC. HIV Supplemental Surveillance Report, Vol. 18, No. 5; October 2013. ↩︎
  6. CDC. “Revised Recommendations for HIV Testing of Adults, Adolescents, and Pregnant Women in Health-Care Settings”, MMWR, 55(RR14);1-17; September 22, 2006. ↩︎
  7. See http://www.uspreventiveservicestaskforce.org/uspstf/uspshivi.htm. ↩︎
  8. The ACA requires new private health plans to cover A and B rated services, eliminates Medicare cost-sharing for A and B rated services, and provides a one percentage point increase in federal matching payments for preventive services in Medicaid for states that offer Medicaid coverage with no patient cost sharing for A and B rated services.  Additionally, Medicaid benchmark coverage (referred to as Alternative Benchmark Plans, or ABPs) must include coverage of A and B rated services without cost-sharing as well. ↩︎
  9. Kates. Medicaid and HIV: A National Analysis, Kaiser Family Foundation; September 2011. ↩︎
  10. Kates, Levi, Neal, & Gallagher. “Learning more about the HIV-infected population not in care in the United States: Using public health surveillance data to inform current policy challenges in enhancing access. Poster session (Poster TuPeG 5690), presented at the International AIDS Conference, Barcelona, Spain; July 7-12, 2002. ↩︎
  11. Each state Medicaid program determines its own definition of medical necessity, although it generally refers to procedures recommended by a physician.  In the case of HIV, for example, HIV testing is clinically indicated based on a patient’s risk factors and/or signs of HIV infection. ↩︎
  12. The exception is for Medicaid-eligible children under the age of 21, for whom coverage of routine HIV screening, in addition to otherwise medically necessary HIV testing, is mandatory as part of the Early and Periodic Screening, Diagnostic, and Treatment (EPSTD) benefit, as described in sections 1905(a)(4)(B) and 1905(r) of the Social Security Act. ↩︎
  13. As described in section 1905(a)(13) of the Social Security Act. ↩︎
  14. Of the more than 1.1 million people living with HIV/AIDS in the U.S., approximately 870,000 adults and adolescents have been diagnosed. See, HIV Surveillance Report, Vol. 23; February 2013. ↩︎
  15. Kaiser Family Foundation analysis based on data from CDC HIV Surveillance Report, Vol. 23; February 2013. ↩︎
  16. Kaiser Family Foundation analysis. Data source: Kaiser Commission on Medicaid and the Uninsured and Urban Institute estimates based on data from FY 2010 MSIS and CMS-64 reports.  Accessed at: http://modern.kff.org/hivaids/state-indicator/enrollment-spending-on-hiv/. ↩︎
  17. See http://www.uspreventiveservicestaskforce.org/uspstf/uspshivi.htm. ↩︎

Health Care Access and Coverage for the Lesbian, Gay, Bisexual, and Transgender (LGBT) Community in the United States: Opportunities and Challenges in a New Era

Authors: Jennifer Kates and Usha Ranji
Published: Feb 21, 2014

By many measures, societal acceptance and support of LGBT rights in the United States have increased significantly in the last decade, especially in the last couple of years.  Perhaps most notably has been the increase in public support for legalization of same-sex marriage, as well as gains in legal recognition, including the June 2013 Supreme Court decision which overturned a major portion of the Defense of Marriage Act (DOMA), resulting in federal recognition of same-sex marriage in the U.S.

At the same time, however, a majority of states continue to impose bans on same-sex marriage and most offer no protections based on sexual orientation and gender identity in the areas of employment and housing, and many LGBT individuals report having experienced some form of discrimination based on their sexual orientation or gender identity.  Ongoing discrimination, violence, and stigma compromise access to needed health services by LGBT individuals.

In a new issue brief  from the Kaiser Family Foundation, we examine what is known about LGBT health status, coverage, and access in the U.S., and look at recent changes within the legal and policy landscape which serve to increase access, in particular, the pivotal impact of the Affordable Care Act (ACA) and Supreme Court’s DOMA decision.  Both have the potential to dramatically reduce the rate of uninsured and make the health system more equitable in LGBT communities, although many outstanding questions remain.

Our summary of the data shows the importance of improving coverage and access to care for this community.  Sexual and gender minorities experience worse physical and mental health outcomes and face unique health challenges compared to their heterosexual counterparts.  These include a higher prevalence of HIV, mental illness, substance use, smoking, and other health conditions.  The impact of the HIV epidemic is particularly alarming, with gay and bisexual men accounting for two-thirds of new HIV infections, and studies reporting that more than one in four (28%) transgender women are HIV positive. Because of this impact, the Foundation recently launched Speak Out, a new campaign aimed at raising awareness of HIV in the LGBT community.

LGBT individuals also face a number of challenges when trying to access health services, including barriers in obtaining insurance coverage, gaps in coverage, cost-related hurdles, and poor treatment by health care providers.  For example, a recent survey found that one in three LGBT individuals with incomes under 400% FPL are uninsured, a group that could qualify for assistance under the ACA.  Challenges are often greater for transgender individuals who are even more likely to be poor and uninsured than LGB individuals and have often been left out of the system either due to denial of coverage or provider inexperience with their health needs.

The ACA and the Supreme Court’s DOMA ruling will help mitigate some of these challenges.  The ACA extends coverage to millions who are uninsured through the expansion of Medicaid (in states that choose to expand), as well as the creation of new federally subsidized health insurance marketplaces in each state, and it includes non-discrimination protections on the basis of health status, sexual orientation, and gender identity.  The DOMA ruling has resulted in federal recognition of all legally married same sex couples, including health coverage for same sex spouses of federal employees and the workplace protections of the federal Family Medical Leave Act (FMLA).

While these changes are expected to increase health insurance coverage and access for LGBT individuals and their families, many challenges and questions remain, including:

What will be the impact of state policy choices on access and coverage?

A key outstanding issue in assessing the impact of these policy changes is the wide variation in state policy choices, particularly regarding Medicaid expansion and recognition of same sex marriage.   Because about half the states do not plan to expand Medicaid at this time, the estimated number of LGBT uninsured adults who will qualify for new coverage is much less than originally expected and  many will find themselves in a “coverage gap” – not eligible for Medicaid but too poor to qualify for subsidized coverage in state insurance Marketplaces.  Additionally, while the DOMA ruling resulted in federal recognition of same-sex marriages, most states still do not recognize same-sex marriage, which limits the availability of dependent coverage for same-sex spouses in the private insurance market.  Despite the potential of the ACA and the Supreme Court ruling to broaden coverage, the impact will be uneven across the country, and raises concern that many LGBT people will remain uninsured.

How will new protections against discrimination be translated into practice and where do gaps remain?

The ACA’s nondiscrimination protections and insurance reforms broaden LGBT individuals’ access to the insurance market as well as the practice setting.  Plans can no longer refuse coverage based on pre-existing conditions, such as HIV, substance abuse or a transgender medical history.  The ACA and other federal regulations also provide new non-discrimination protections based on sex, defined to include gender identity and sex stereotypes, in any health program receiving federal funds (such as Medicaid and Medicare), and extend this to include sexual orientation in state marketplaces.  In addition, virtually all hospitals and long-term care facilities must guarantee visitation rights to same-sex partners.  As important as these protections are, however, they are uneven and do not affect other policies in place, such as the fact that in most states employers can still fire, and thus effectively end health coverage to, an employee because she is LGBT.  In addition, as currently interpreted, federal regulations do not prohibit discrimination based on sexual orientation outside of state marketplaces, where many lesbian and gay individuals will continue to get their care and coverage.  Beyond these issues, questions remain regarding how providers, payers, and policymakers will utilize these protections to promote access to care.

Will LGBT people be able to find care that is responsive to their health needs?

While systems level policy and regulatory changes are important, the provider-patient relationship is at the heart of health care.  High quality health care must provide a safe and welcoming environment for all patients. However, studies have shown that LGBT individuals often face discrimination and stigma by their health care providers, including refusal to provide care, discrimination that compromises care, and discomfort and lack of knowledge about caring for LGBT patients.  Fear and the actual experience of stigma and discrimination can discourage people from seeking needed care and result in missed opportunities for prevention and treatment.  With more LGBT people becoming insured and entering the system, it will be critical for clinicians to be properly trained to meet the health needs of a changing patient population.  Filling the current gaps in education and training can be a starting point for this, and some professional organizations have already issued policies that include non-discrimination protections based on sexual orientation and gender identity.

How will access to and quality of care for LGBT communities be monitored?

The historical lack of data and research on sexual orientation and gender identity has impeded the understanding of the health and care needs of LGBT communities. To date, most federally-sponsored surveys have not collected and reported national data on the health of sexual minorities.  The ACA calls for the inclusion of routine data collection and surveillance on disparities, which includes LGBT populations.  While this effort has begun with initial testing of questions in some federal public health surveys, it will be up to researchers, providers, and advocates to ensure that data collection efforts are realized and that results are analyzed and disseminated broadly throughout public health research. 

***

While recent policy changes stand to increase access to care and coverage for LGBT individuals in the U.S., an insurance card alone does not guarantee access to quality care.  The ultimate impact of these changes on people’s lives will depend on a range of factors, including further interpretations of federal regulations and state policy decisions, shifts in how care is delivered and structured, and the ability to reduce stigma and discrimination against LGBT individuals at the system and provider levels.   There is progress, but the struggle for equal rights and access to care is far from over.

The Uninsured at the Starting Line in California: California findings from the 2013 Kaiser Survey of Low-Income Americans and the ACA

Authors: Rachel Licata, Rachel Arguello, and Rachel Garfield
Published: Feb 19, 2014

This report presents data on the population targeted for coverage expansions under the Affordable Care Act (ACA) in California, and aims to help policymakers target early efforts and evaluate the ACA’s longer-term effects. The report is part of an ongoing series of comprehensive surveys nationally and in select states that will provide data on these groups’ experience with health coverage, current patterns of care, and family finances. The California report, based on the baseline 2013 Kaiser Survey of Low-Income Americans and the ACA, provides a snapshot of health insurance coverage, health care use and barriers to care, and financial security among insured and uninsured adults in California across the income spectrum at the starting line of ACA implementation.

Section:
0 / 0

Executive Summary

In January 2014, the major coverage provisions of the 2010 Affordable Care Act (ACA) went into full effect. These provisions include the creation of new Health Insurance Marketplaces (known in California as Covered California) where low and moderate income families can receive premium tax credits to purchase coverage and, in states that opted to expand their Medicaid (known in California as Medi-Cal) programs, the expansion of Medicaid eligibility to adults with incomes at or below 138% of the federal poverty level (FPL). The ACA has the potential to reach many of the 47 million Americans who lack insurance coverage, including 7 million in California, as well as millions of insured people who face financial strain or coverage limits related to health insurance.

California was one six states that opted to expand health coverage early to low-income adults in preparation for the ACA.1  The state did so through its §1115 Bridge to Reform Medicaid waiver, which created the Low-Income Health Program (LIHP).2  LIHP reached many uninsured adults, and millions more are eligible for coverage through the Medi-Cal expansion or through Covered California.3  Though implementation is underway in California and across the country and people are already enrolling in coverage, policymakers continue to need information to inform the early stages of these coverage expansions. Data on Californians targeted for coverage expansions’ experience with health coverage, current patterns of care, and family situation can help state policymakers target early efforts and provide insight into some of the challenges that are arising in the first months of new coverage.

This report, based on findings from the 2013 Kaiser Survey of Low-Income Americans and the ACA, provides a snapshot of health insurance coverage, health care use and barriers to care, and financial security among insured and uninsured California adults across the income spectrum at the starting line of ACA implementation. The survey, conducted between July and September 2013, is a nationally representative survey that also includes a state-representative sample of over 2,500 nonelderly (age 19-64) adults in California. It was designed to focus on the low- and moderate-income populations in the state and includes over-samples of people in the income range for financial assistance under the ACA (≤ 138% FPL for Medi-Cal and 139-400% FPL for Covered California), as well as a comparison group with incomes over 400% FPL. The survey includes adults with employer coverage, nongroup, Medi-Cal, and other sources of coverage, as well as those with no health insurance. The California component of the survey and report on its findings complements a report on similar findings for the nation.4 

This survey and report provides new data to help policymakers further understand early challenges in implementing health reform and assist outreach and enrollment workers, health plans, and providers and health systems. This survey also provides a baseline for future assessment of the impact of the ACA in California on health coverage, access, and financial security of low- and moderate-income individuals. Detailed information on the survey design, sample, and analysis can be found in the Methods section at the end of the full report.

Background: The Challenge of Expanding Health Coverage in California

Prior to implementation of the ACA, nearly 7 million Californians—21% of the state’s nonelderly population—were without health insurance coverage. Because publicly-financed coverage has already been expanded to most low-income children and Medicare covers nearly all of the elderly, the vast majority of uninsured people in California and across the country are nonelderly adults.5  The main barrier that people have faced in obtaining health insurance coverage is cost: health coverage is expensive, and few people can afford to buy it on their own. While most Americans traditionally obtain health insurance coverage as a fringe benefit through an employer, not all workers are offered employer coverage. Medi-Cal covers many low-income children, but eligibility for parents and adults without dependent children was limited before the ACA, leaving many adults without affordable coverage.

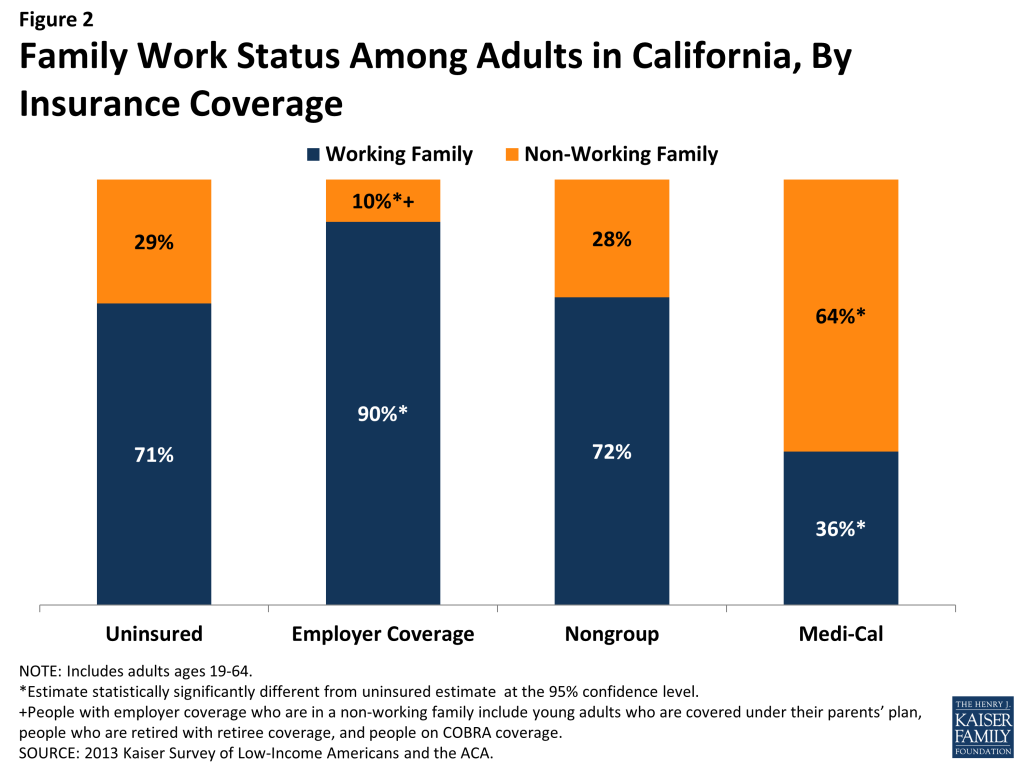
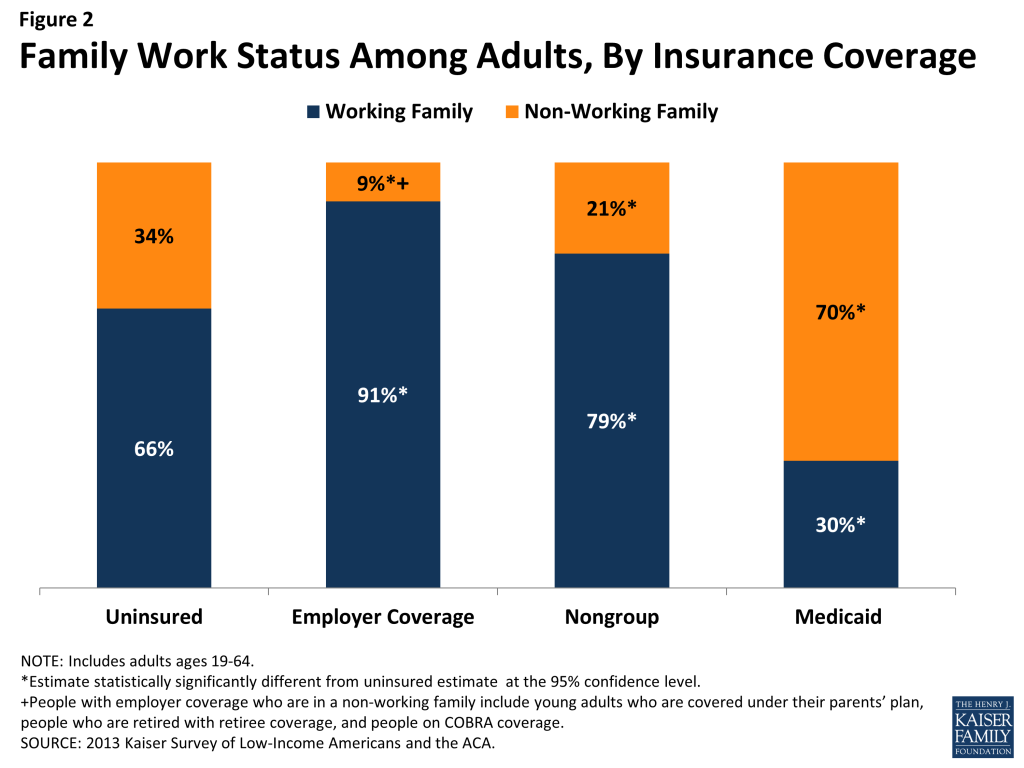
Barriers to coverage are reflected in the characteristics of the uninsured population in California. Uninsured California adults are more likely to be low-income than Californians with private health insurance (including employer coverage and nongroup coverage), while adults with Medi-Cal coverage are particularly low-income (reflecting pre-ACA eligibility limits). Though the majority of uninsured adults are in a family with either a full- or part-time worker, uninsured California adults are less likely than privately insured adults to be in families with either a full- or part-time worker. The unique demographics of the state population also play a role in shaping the profile of uninsured Californians. California is a highly-diverse state, with 60% of the state population identifying as a race other than White, and the state is home to more than 10 million immigrants. The state also has the largest number of undocumented immigrants in the nation. While these demographics characterize the entire state population, the majority of uninsured adults in California are people of color (74%), and over a third (36%) are not U.S. citizens. These demographics have implications for outreach efforts as well as eligibility, since non-citizens may face restrictions on eligibility depending on their documentation status.

I. Patterns of Coverage and the Need for Assistance

Examining patterns of coverage and the reasons the uninsured lack coverage can inform both outreach avenues and potential barriers to outreach and enrollment. Key survey findings on access to coverage include:

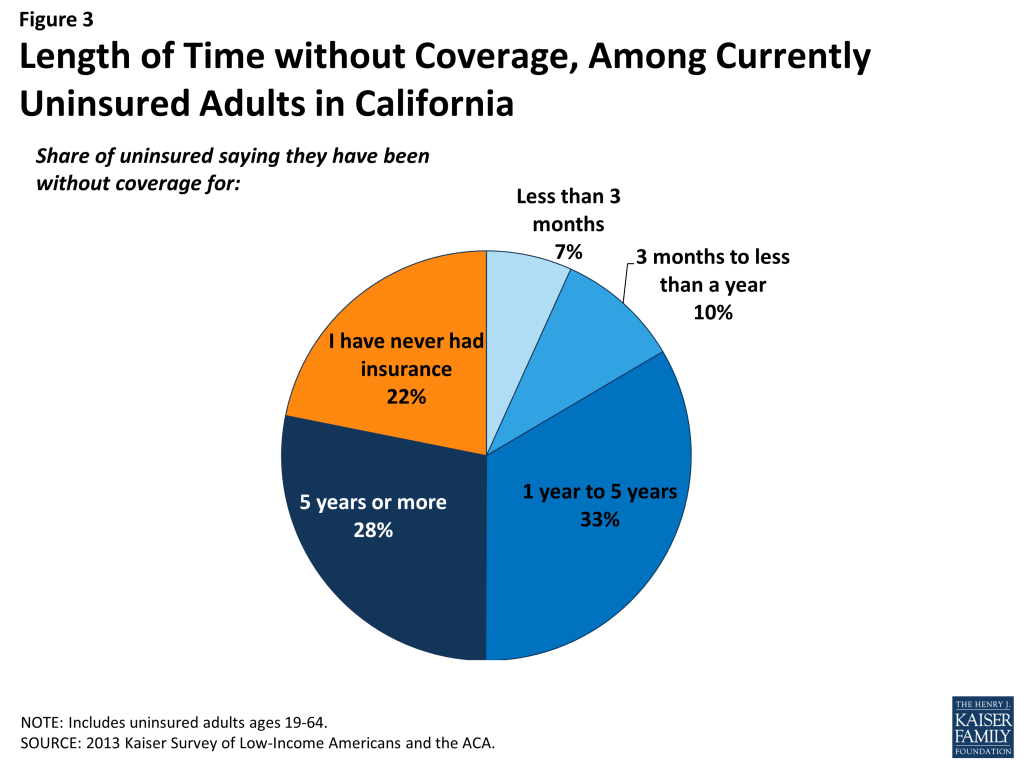
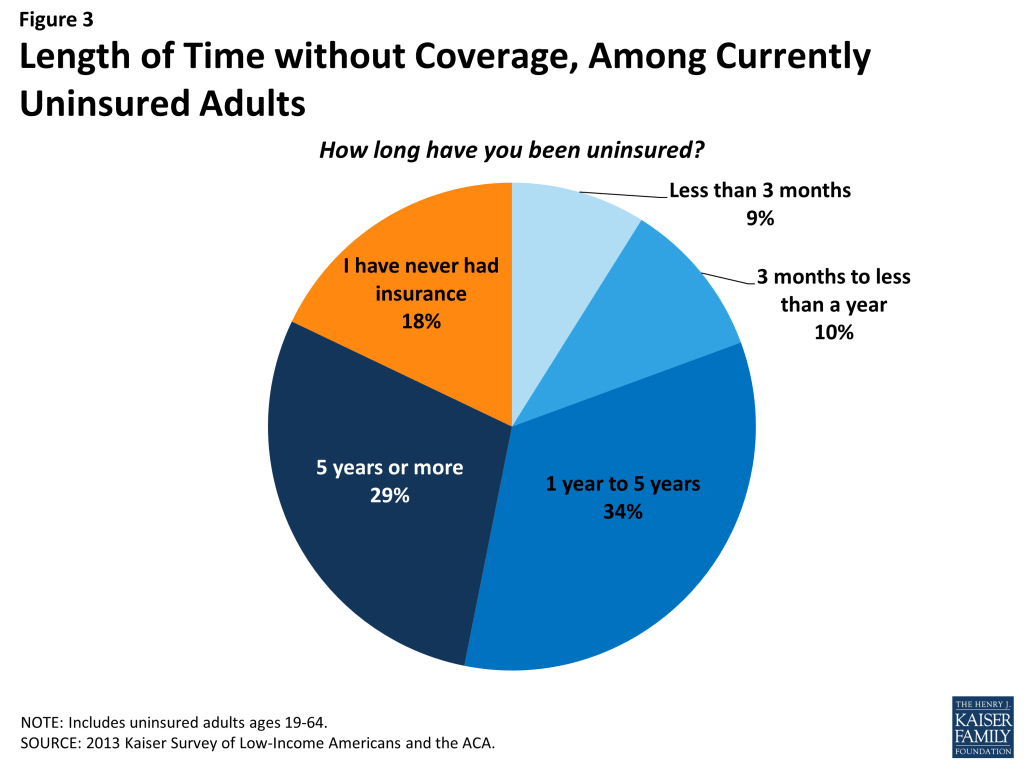
For most currently uninsured adults in California, lack of coverage is a long-term issue. While some people experience short spells of uninsurance due to job changes, income fluctuations, or renewal issues, for most uninsured California adults, lack of coverage is a chronic issue. The survey shows that half (50%) of uninsured adults report being uninsured for 5 years or more, including 22% of the uninsured who report that they have never had coverage in their lifetime.

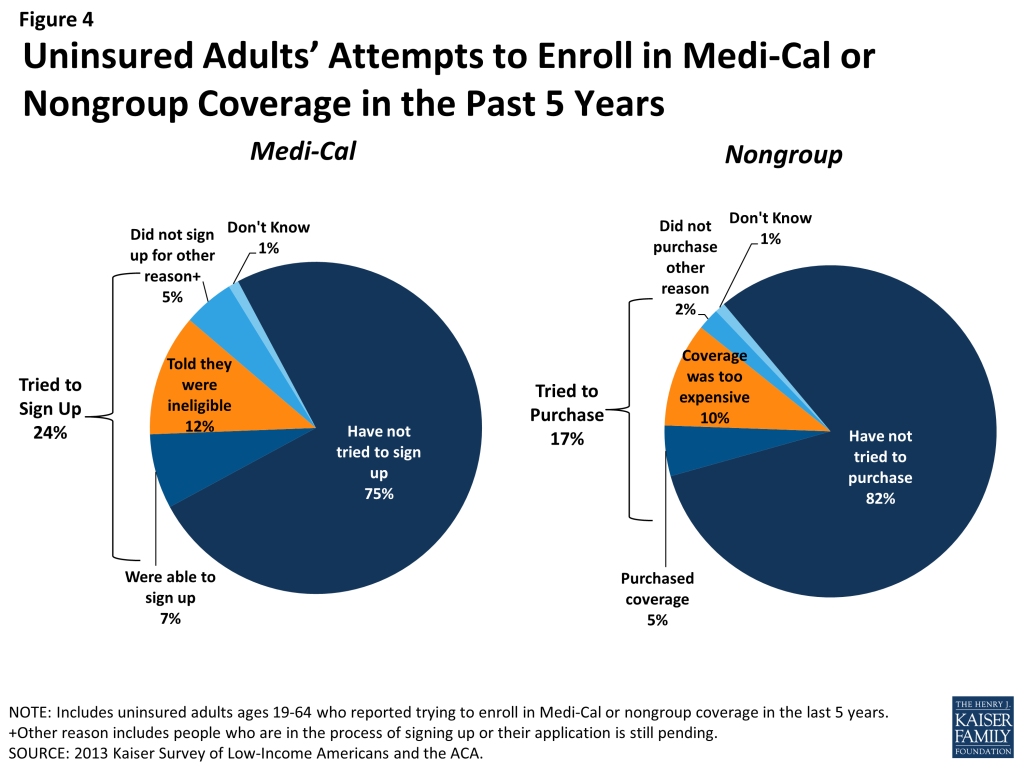
Many uninsured adults in California report trying to obtain insurance coverage in the past, but most did not have access to affordable coverage. Prior to the ACA, California’s uninsured reported difficulty gaining insurance coverage due to the high cost of coverage and limits on Medi-Cal eligibility for adults. More than eight in ten (82%) uninsured adults report no access to employer insurance, and the majority of people who had access to coverage through an employer report that the coverage offered to them is not affordable. One-quarter of uninsured California adults (24%) reported trying to sign up for Medi-Cal in the past five years, and the majority of them were unsuccessful because they were told they were ineligible. And one in six uninsured California adults (17%) reported trying to obtain nongroup coverage in the past five years, with most not purchasing a plan because the policy they were offered was too expensive.

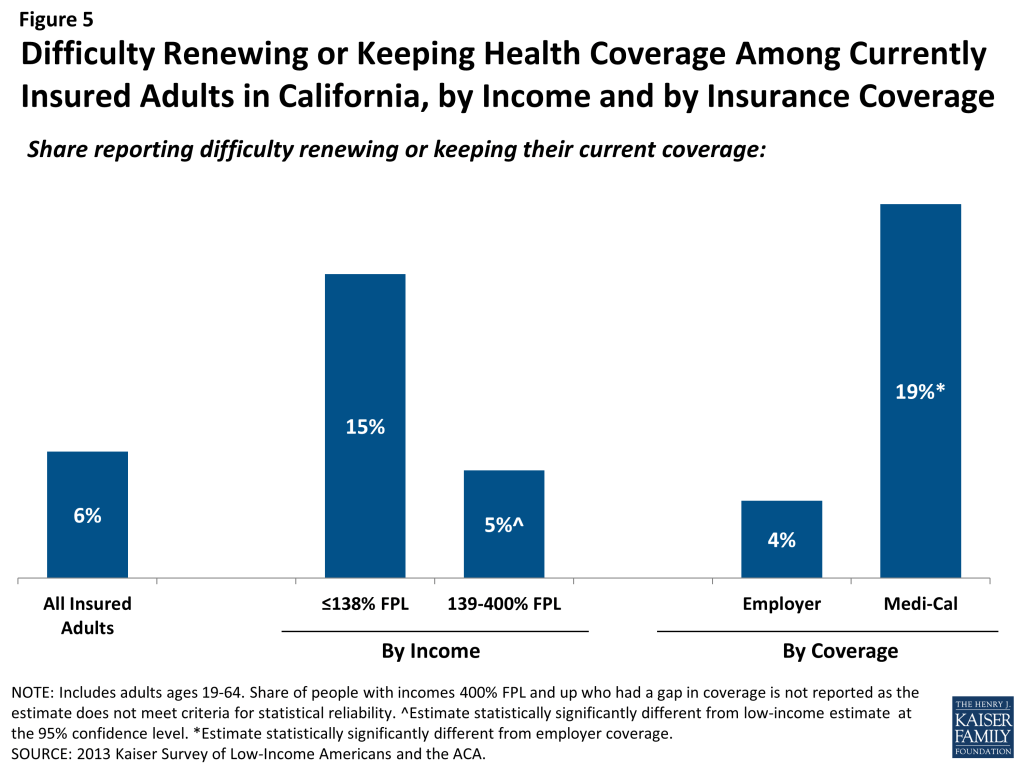
Health insurance coverage is not always stable. For most insured adults in California, coverage is continuous throughout the year and over time, but a sizable number have a gap or change in coverage. When accounting for both insured Californians with a gap in their coverage and uninsured Californians who recently lost coverage, the survey indicates that 8% of adults in California, or almost 2 million people, lose or gain coverage over the course of a year. In addition to those who lose or gain coverage over the course of a year, 1.4 million continuously insured adults report having a change in their health insurance plan. The most common reasons for a change in coverage appear to be related to employment. Last, a small number of insured California adults report challenges in either renewing or keeping their coverage, another indication of instability in coverage throughout the year.

Informing California’s ACA Implementation: Many of the barriers to coverage that California’s uninsured reported facing in the past are addressed by the ACA’s provisions to expand Medi-Cal and provide premium tax credits for Covered California coverage. However, some uninsured adults may continue to face financial barriers to coverage, as undocumented immigrants are excluded from receiving financial assistance under the ACA. Californians targeted by the ACA have varying levels of experience with the insurance system. A large share of uninsured adults in California has been outside the insurance system for quite some time, and the long-term uninsured may require targeted outreach and education efforts to link them to the health care system and help them navigate their new health insurance. In addition, people who have attempted to obtain coverage in the past may be unaware that rules and costs have changed under the ACA; outreach and education will be needed to inform people that eligibility rules have changed and that financial assistance is available to offset the cost of coverage.

While there has been much focus on enrolling currently uninsured people into Medi-Cal or Covered California coverage, survey findings demonstrate that people will continue to move around within the insurance system throughout the year as their income or job situations change. Thus, implementation is not a “one shot” effort that will be done once Californians are enrolled or transferred to Medi-Cal or Covered California in the early part of 2014, but rather will require a continuous effort to enroll and keep people in coverage. With this challenge in mind, California has sought federal grants and other investments for ongoing outreach, enrollment, and education efforts. However, efforts at all levels within the state will need to be sustained looking forward.

II. What to Look for in Enrolling in New Coverage

While many currently uninsured adults in California have limited experience in signing up for and using health coverage, the past successes and challenges of insured low-and moderate income adults can inform the experiences of those seeking coverage under the ACA. Key survey findings related to plan enrollment and plan choice are:

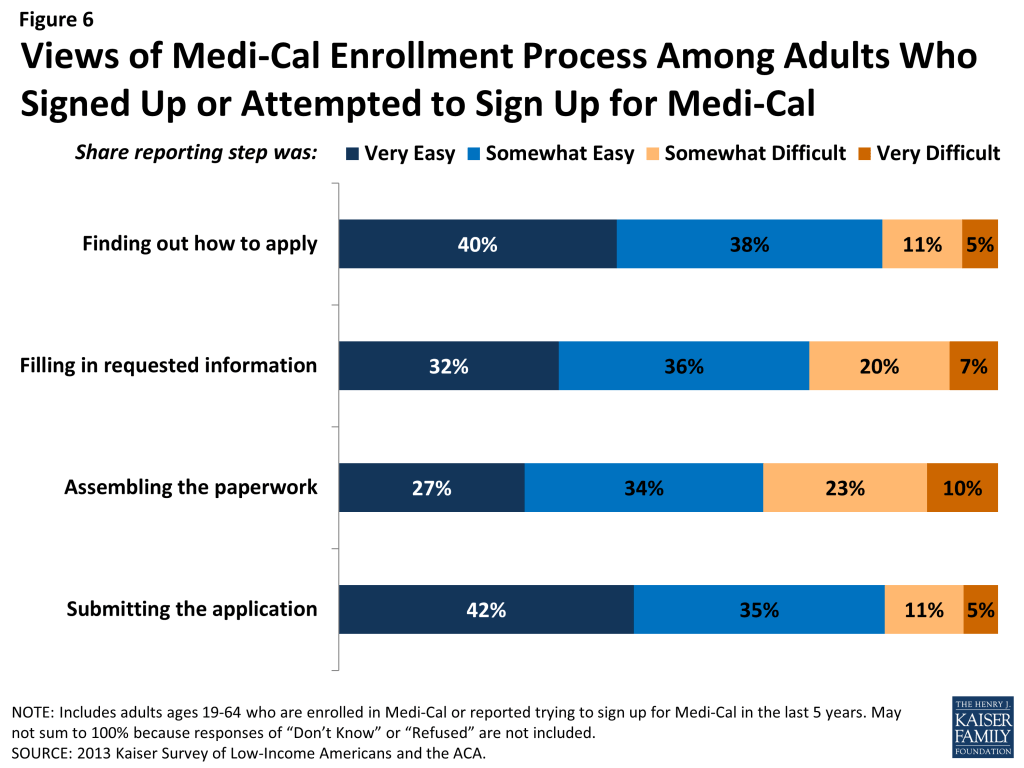
While many adults in California report facing no difficulty in applying for Medi-Cal coverage prior to the ACA, some encountered difficulties in the process of applying for public coverage in the past. California adults who currently have Medi-Cal or who have attempted to enroll in the past five years reported little difficulty in taking steps to enroll in Medi-Cal, with almost half (48%) saying the entire process was very or somewhat easy. However, the rest found at least one aspect of the process – finding out how to apply, filling out the application, assembling the required paperwork, or submitting the application – to be somewhat or very difficult. The most commonly-reported difficulty was assembling the required paperwork, which about a third of Californians who applied or enrolled said was somewhat or very difficult.

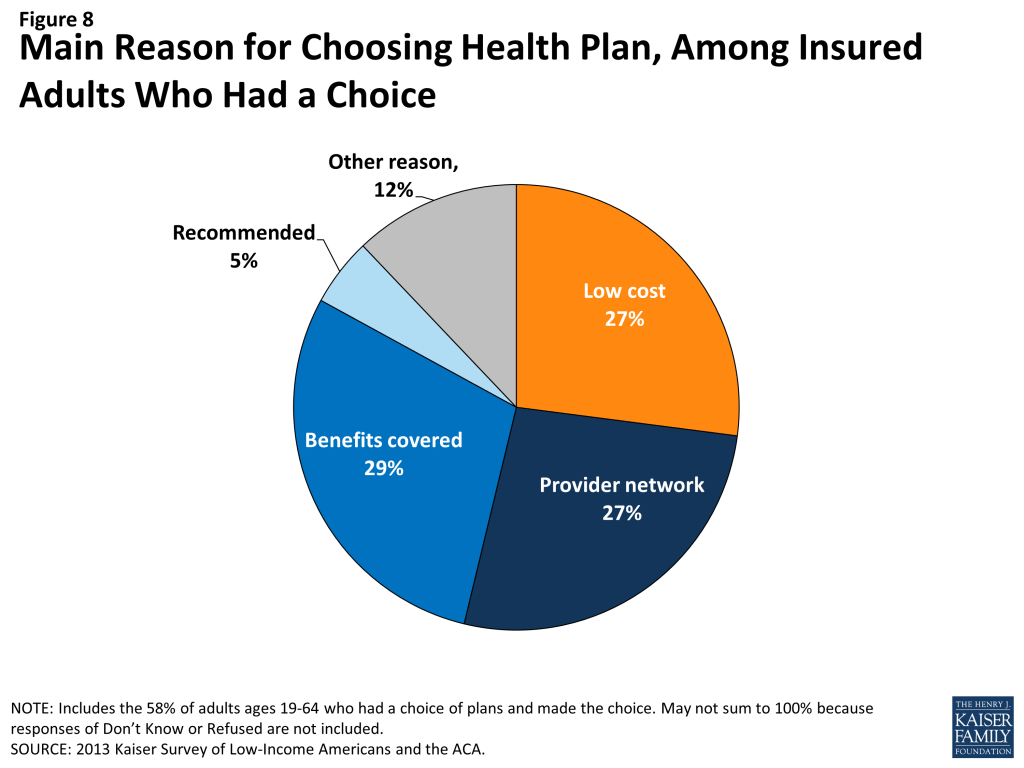
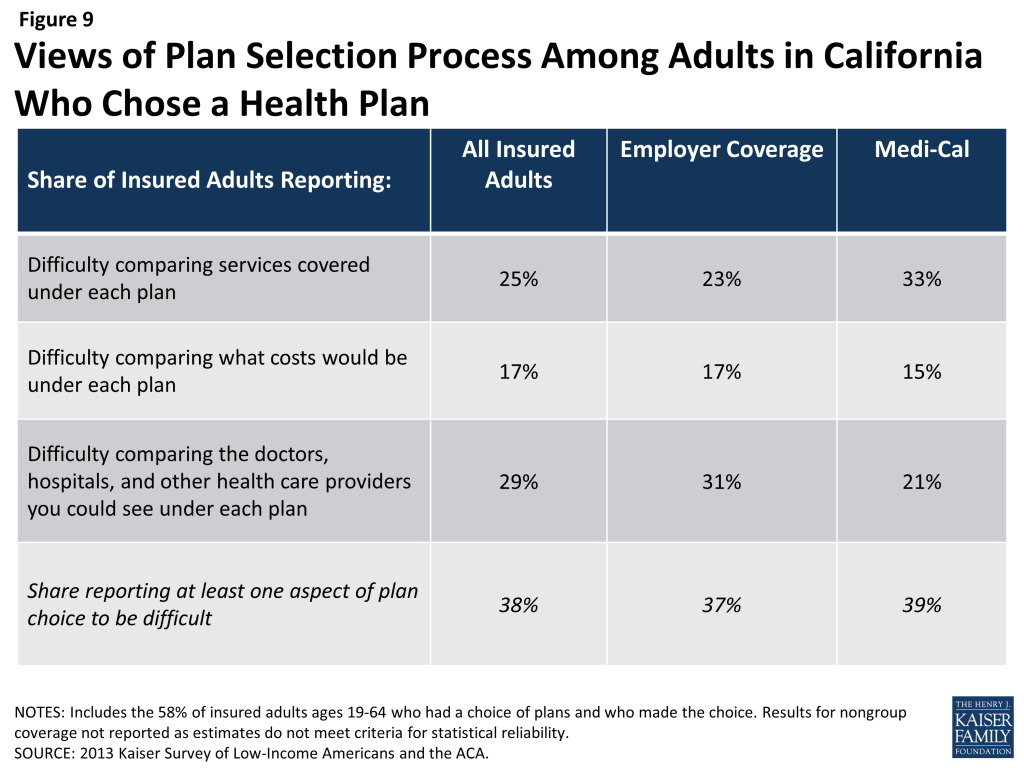
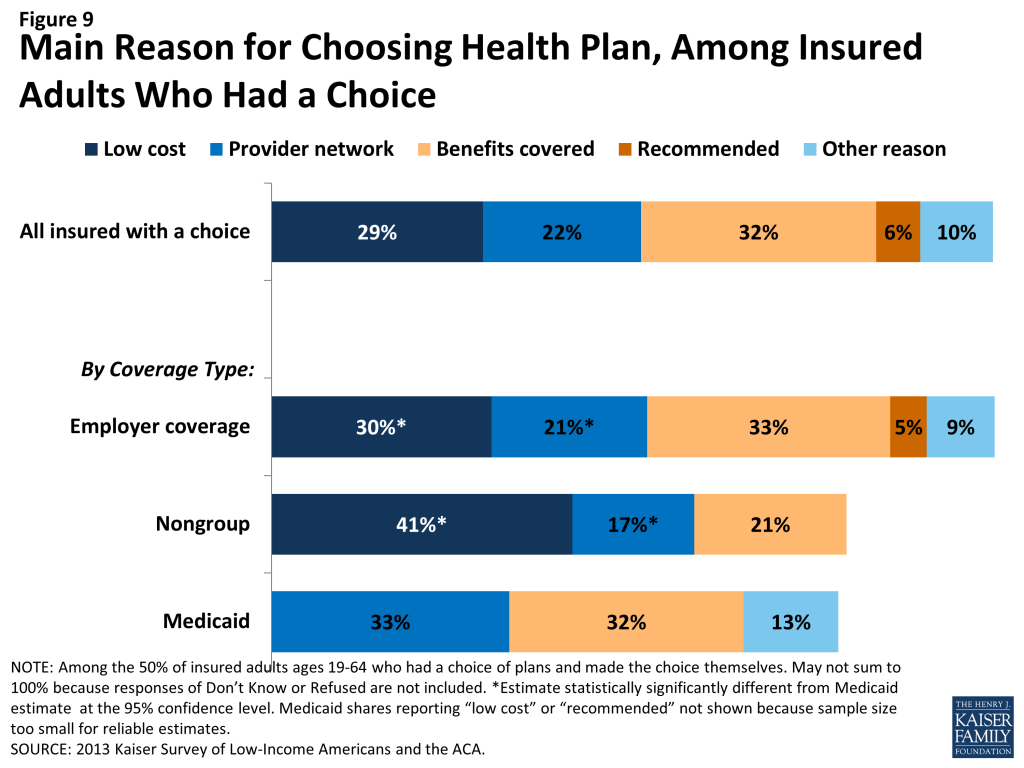
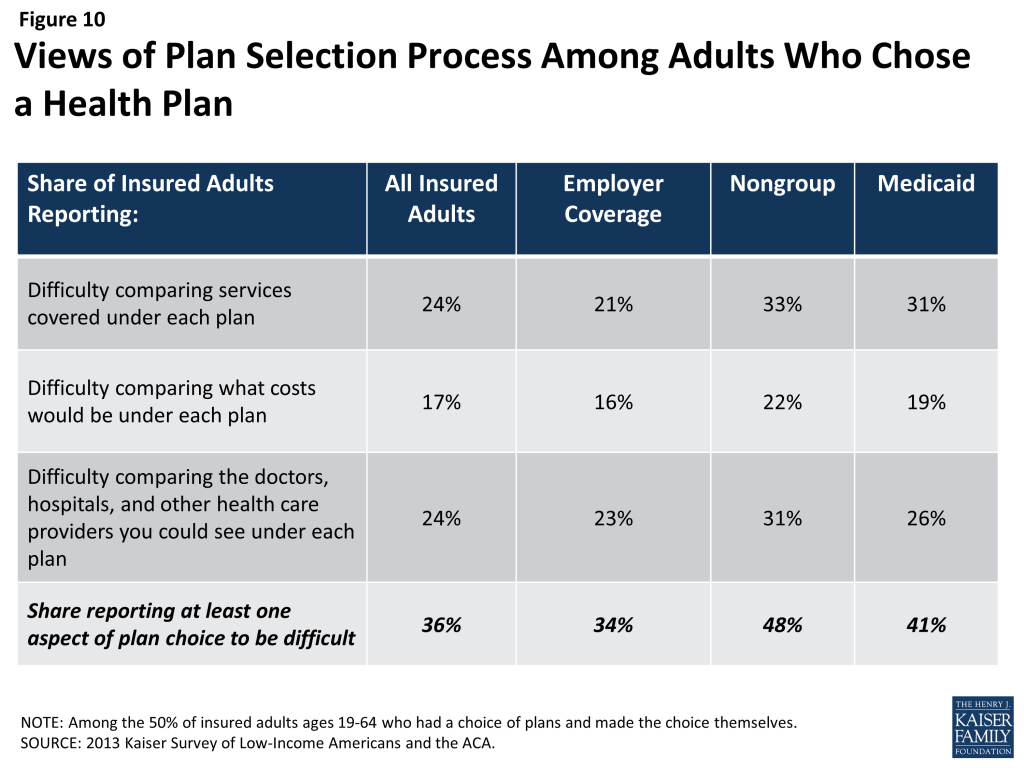
When adults with Medi-Cal or private insurance have a choice of plan, they do not always prioritize costs over other plan features in making that choice, and many find some aspect of the plan choice process to be a challenge.  Adults chose health plans for various reasons, with 29% of those who had and made a choice of plan reporting that they chose their plan because it covered a wide range of benefits or a specific benefit that they need, 27% because their costs would be low, and 27% because the plan had a broad selection of providers or included their doctor. In choosing a plan, even if they have limited options, Californians may face challenges in comparing costs, services, and provider networks, as these factors have typically varied greatly across plans in the past. In general, insured adults in California report that they did not have difficulty in comparing their plan choices, but 38% found some aspect of plan choice—comparing services, comparing costs, and comparing providers— to be difficult.

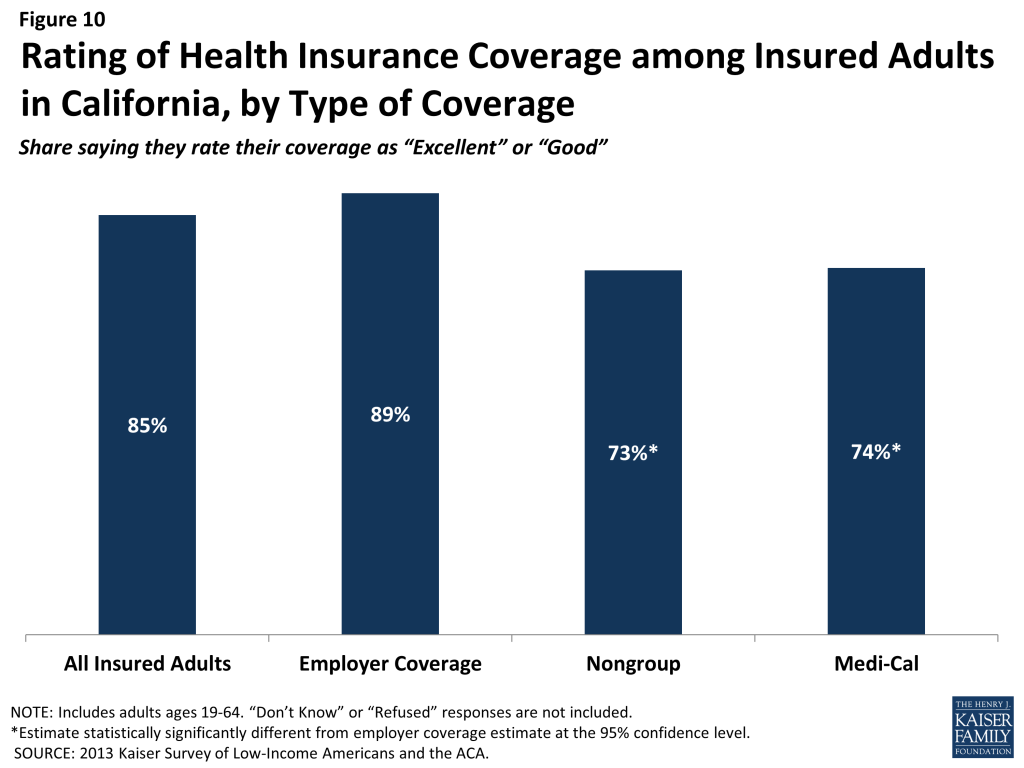
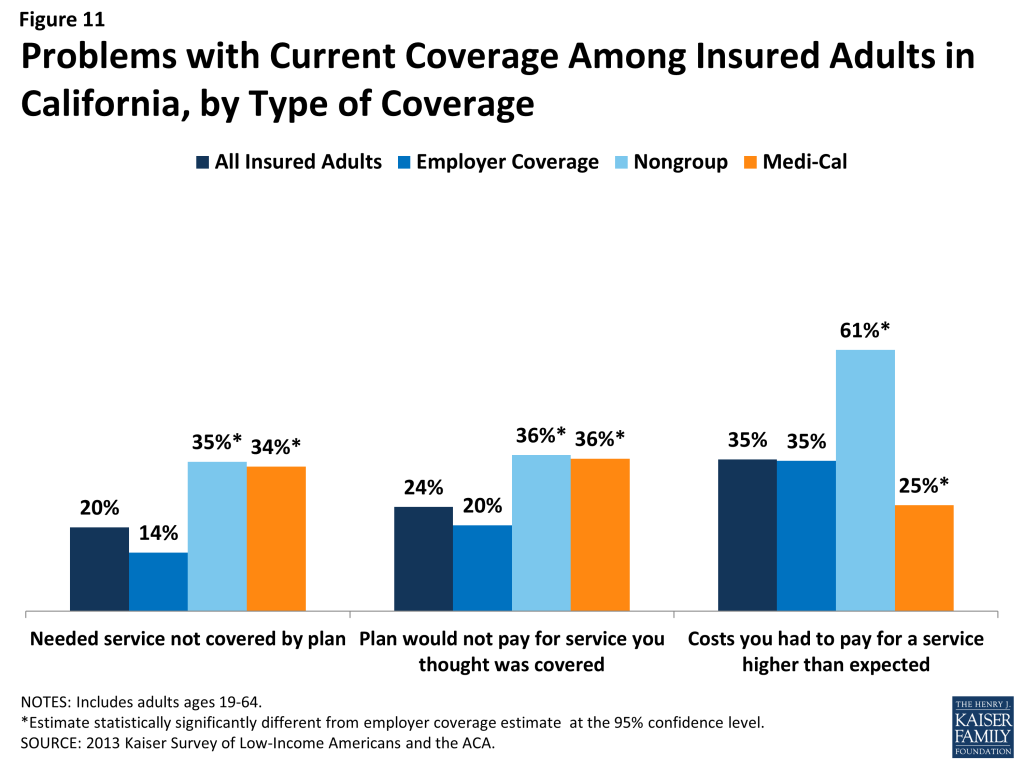
Overall, adults in California with employer coverage, nongroup, or Medi-Cal report satisfaction with their current coverage but also report gaps in covered services and problems when using their coverage. Most (85%) insured adults in California rate their pre-ACA coverage as excellent or good, but they also report gaps in services that are covered by their current insurance. One in five (20%) insured adults in California report needing a service that is not covered by their current plan, typically ancillary services, such as dental, vision care, and chiropractor services. Many insured adults in California reported experiencing a problem with their current insurance plan covering a specific benefit, either because they were denied coverage for a service they thought was covered (24%) or their out-of-pocket costs for a service were higher than they expected (35%).

Informing ACA Implementation. The ACA includes provisions to simplify the Medi-Cal application and enrollment process for coverage. The ACA also requires plans in the Covered California Marketplace to provide detailed, standardized plan information for people to compare coverage options. Uninsured California adults applying for coverage after these new processes are implemented should encounter fewer challenges in navigating enrollment and plan choice than applicants have in the past. However, in evaluating the success of plan enrollment, it is important to bear in mind that, even prior to the ACA, insured adults faced some challenges in comparing and selecting insurance coverage. While provisions in the ACA could address these challenges, some are inherent to the complexity of insurance coverage. Ongoing efforts in the state are also trying to make the process of enrolling in Medi-Cal coverage a more positive and welcoming experience, which calls for a culture shift to reorient Medicaid management, systems, and caseworker training away from welfare-style “gatekeeping” and toward encouraging participation.6  It is also important to remember that people place utility on a range of factors related to insurance, including scope of services and provider networks. Assessments of whether people are choosing the optimal plan for themselves and their family will need to consider the multiple priorities that people balance in plan selection. Last, while the ACA aims to ensure coverage of at least a basic set of essential health benefits (EHB), many of the ancillary services that people report needing coverage for—such as dental services—are not included in the EHB. Newly-insured Californians may be surprised to learn that some ancillary services are not included in their plan, and education efforts will be needed to help Californians understand their coverage.

III. Gaining Coverage, Getting Care

As uninsured adults in California gain coverage, there are likely to be changes in how often they seek care, what type of care they seek, and where they seek care. By comparing their current interactions with the health care system to their insured counterparts, the survey can provide insight into likely changes. Key findings in this area include:

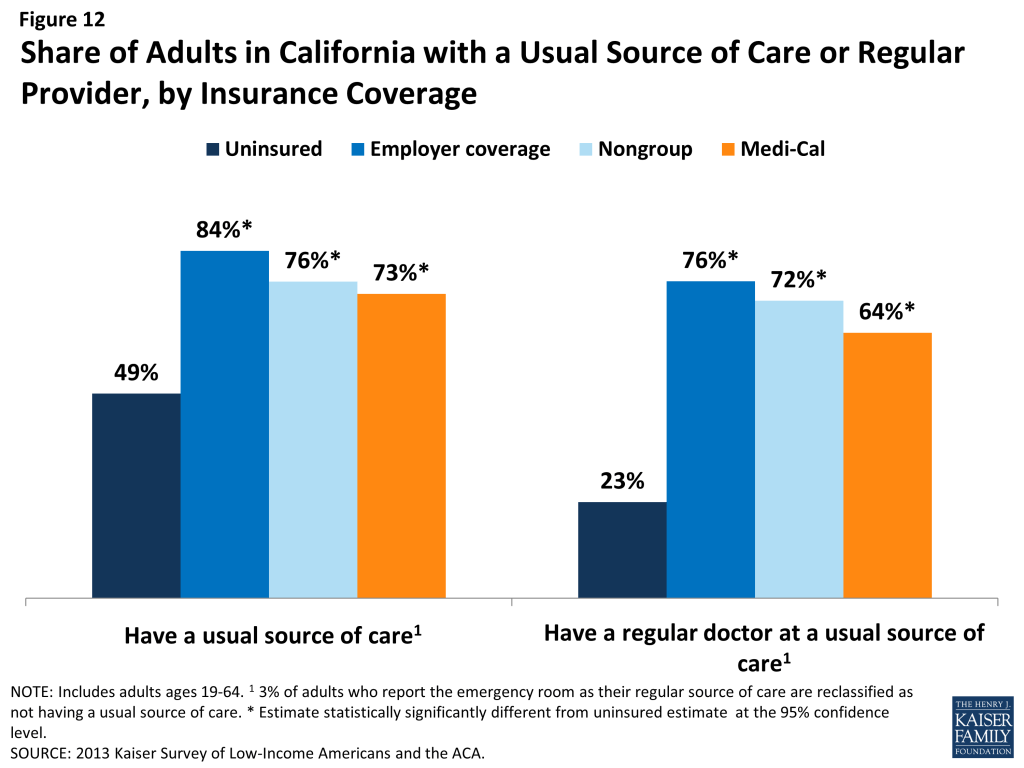
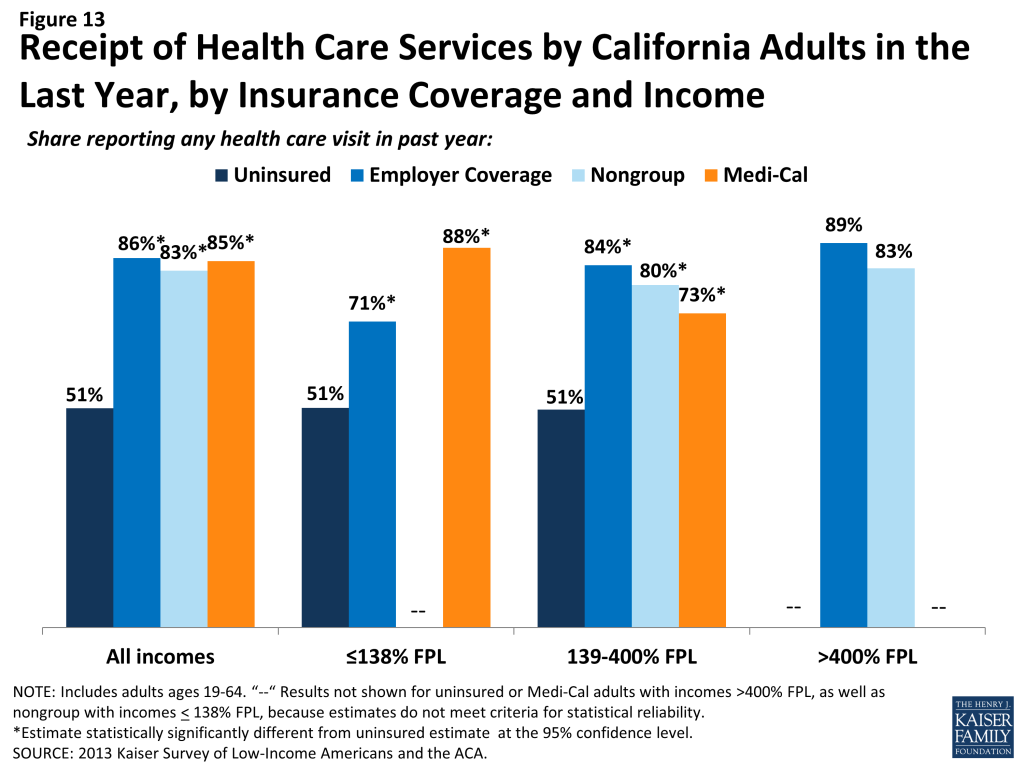
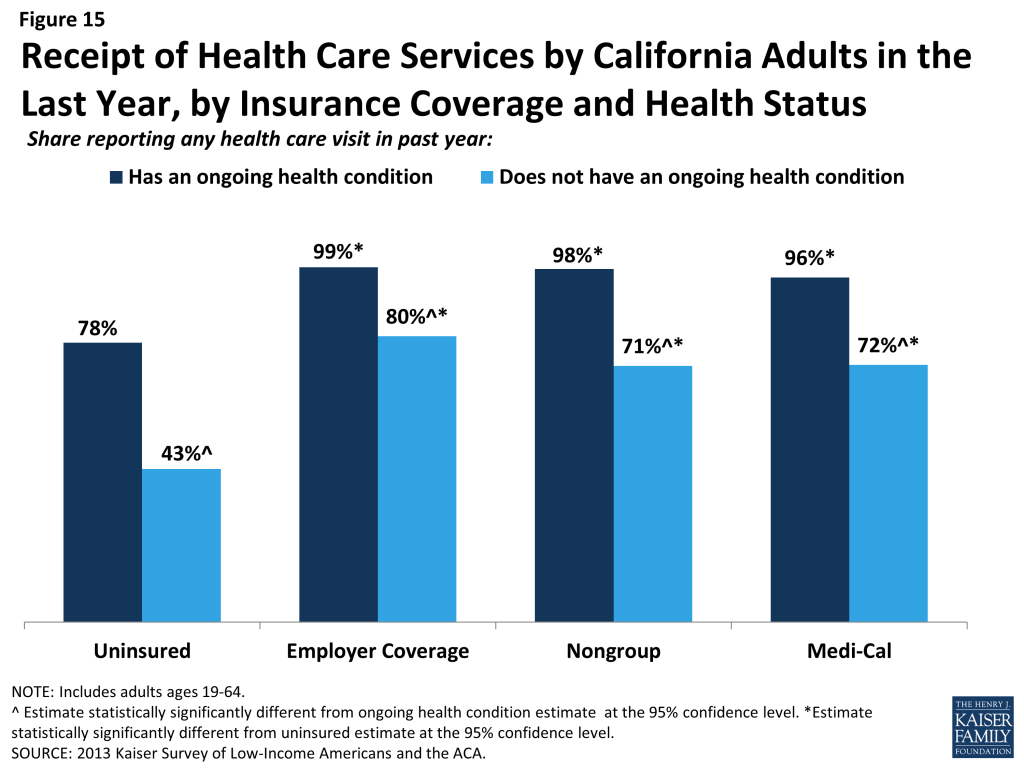
A large segment of the uninsured in California has little or no connection to the health care system. Most uninsured adults report few connections to the health care system. Only 49% of uninsured adults report that they have a usual source of care, or a place to go when they are sick or need advice about their health, and only 23% of uninsured adults say they have a regular doctor, one-third of the rate of insured adults in California. This lack of a connection to the health care system leads many uninsured adults to go without care. Nearly five in ten uninsured adults in California (49%) reported no health care visits in the past year, compared to 15% of Medi-Cal beneficiaries and 14% of adults with employer coverage.

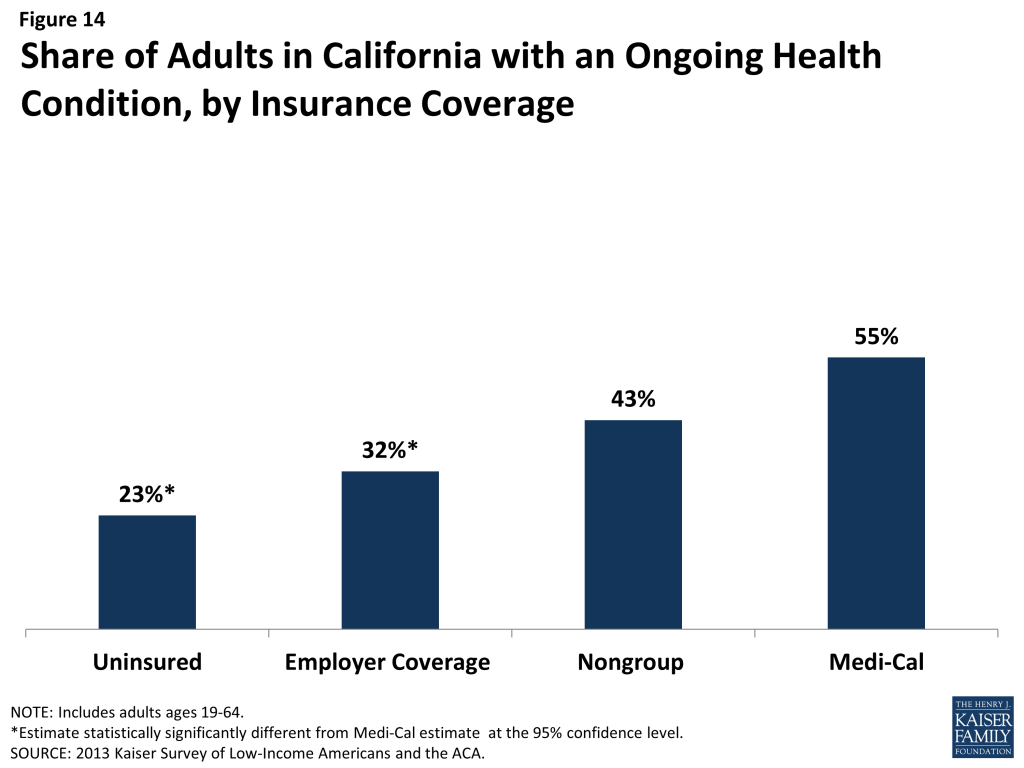
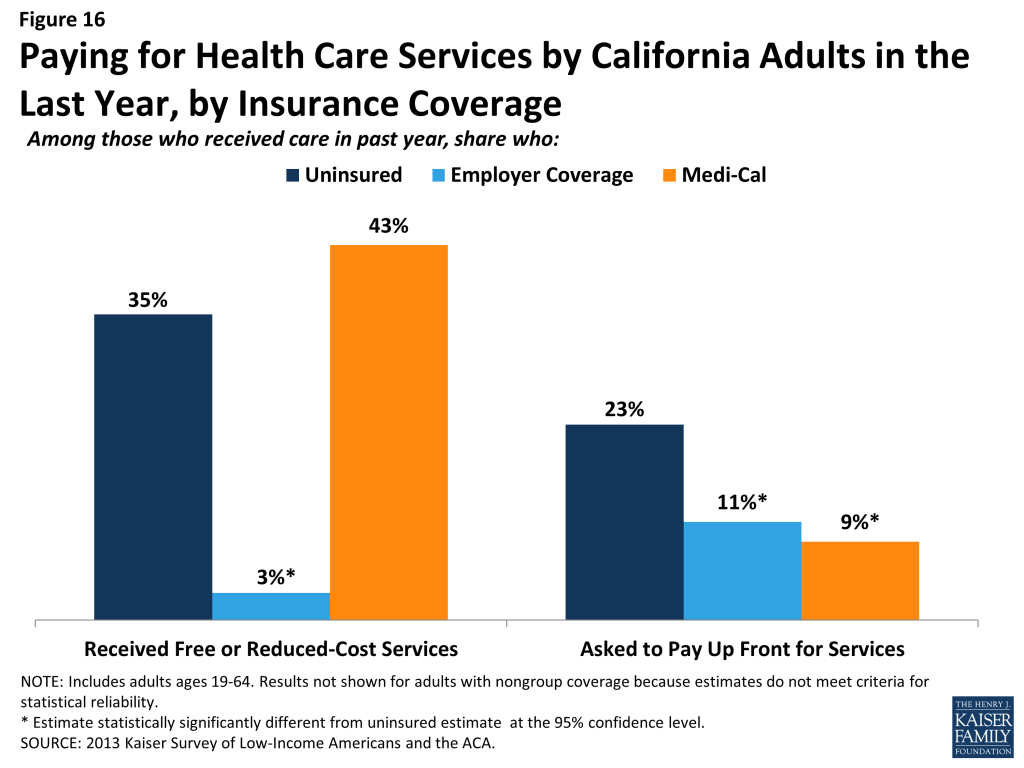
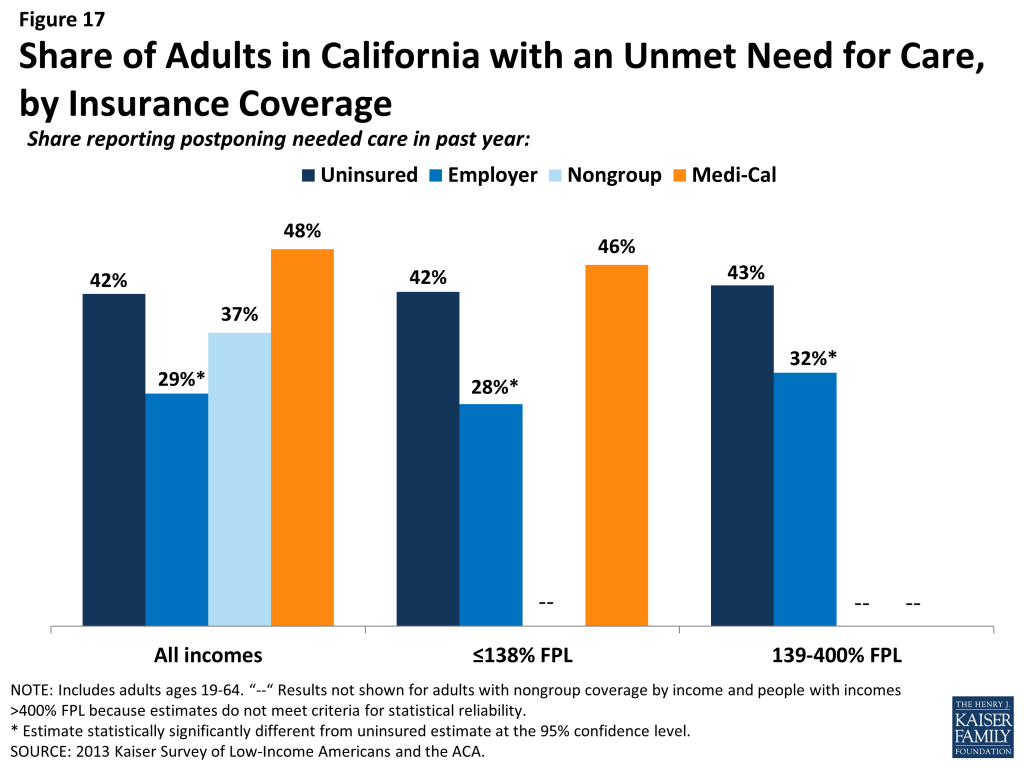
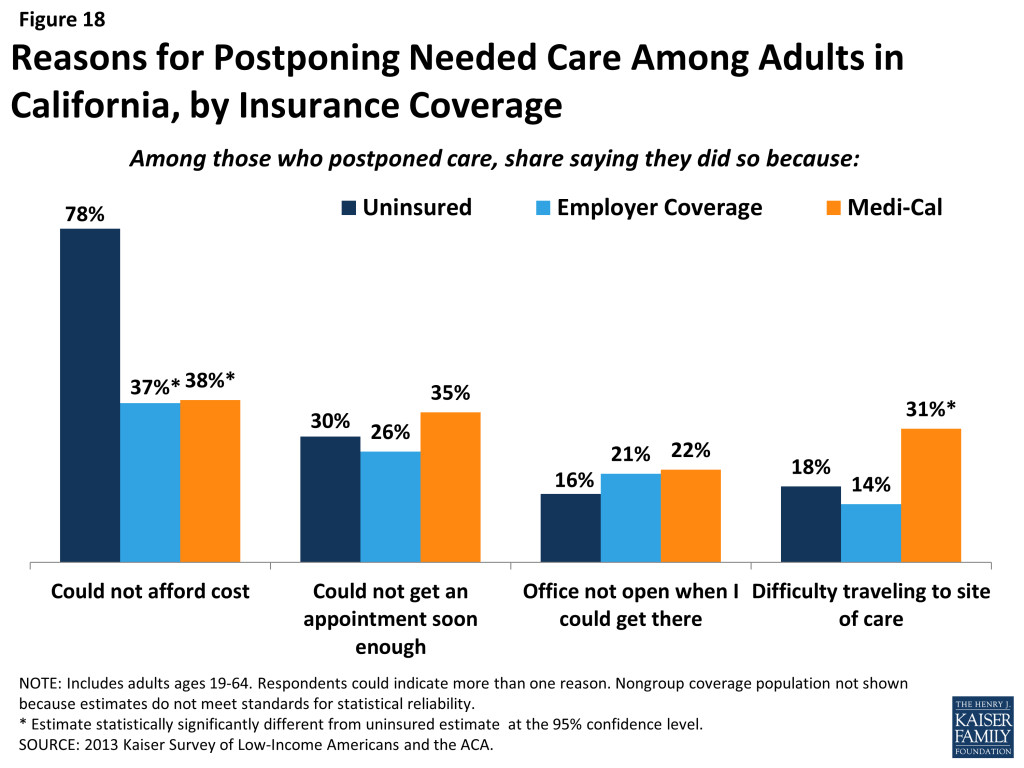
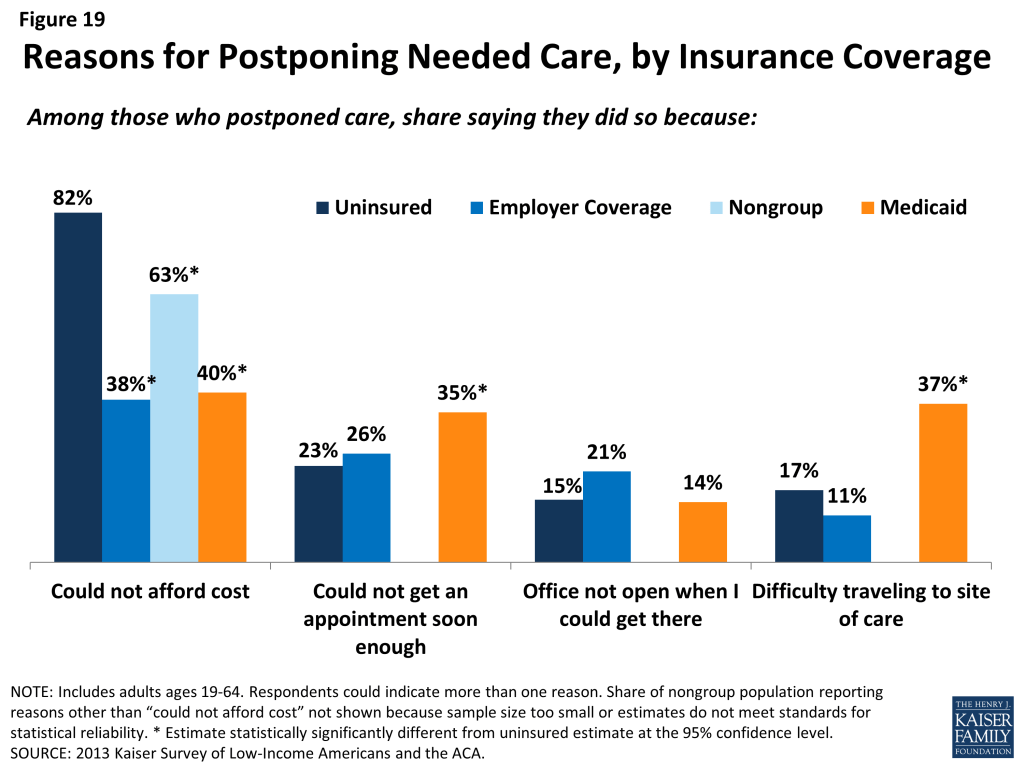
Many uninsured Californians have health needs, many of which are unmet or only met with difficulty. Uninsured adults are less likely than their insured counterparts to report receiving care for an ongoing health condition. When uninsured individuals do receive care, they sometimes receive free or reduced-cost care, though the majority who use services do not. More than four in ten (42%) of the uninsured and almost half (48%) of Medi-Cal beneficiaries in California report needing but postponing care, compared to 29% of adults with employer coverage. The most common reason for postponing care among the uninsured is cost, as the uninsured have no coverage to help them with the cost of care.

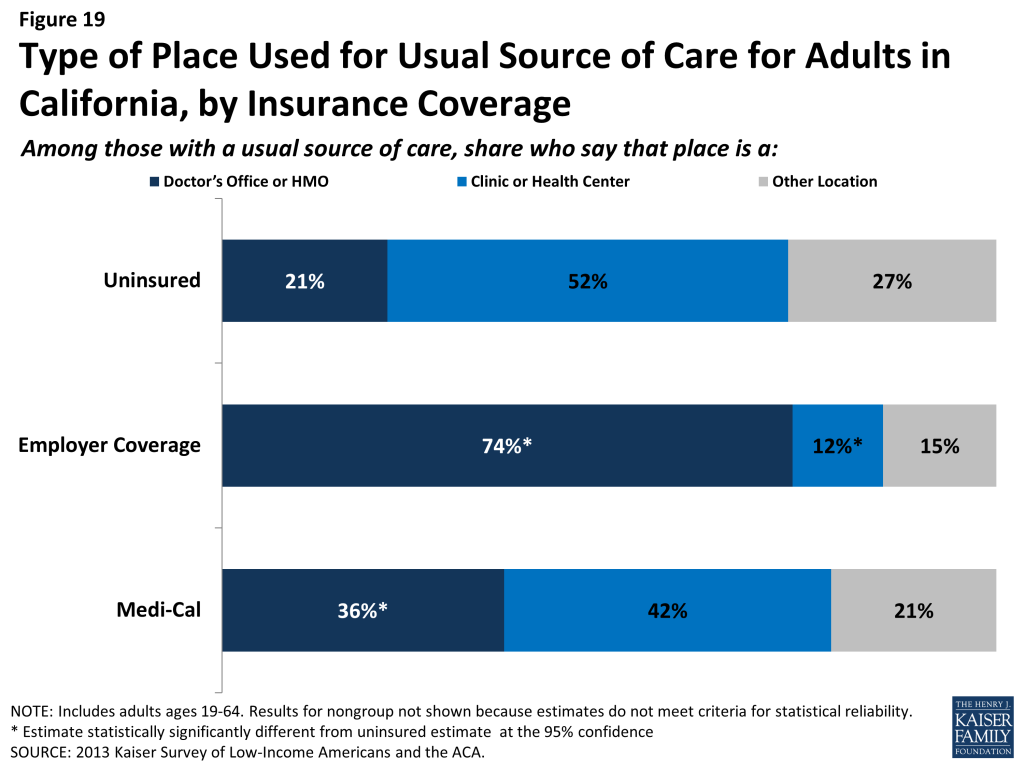
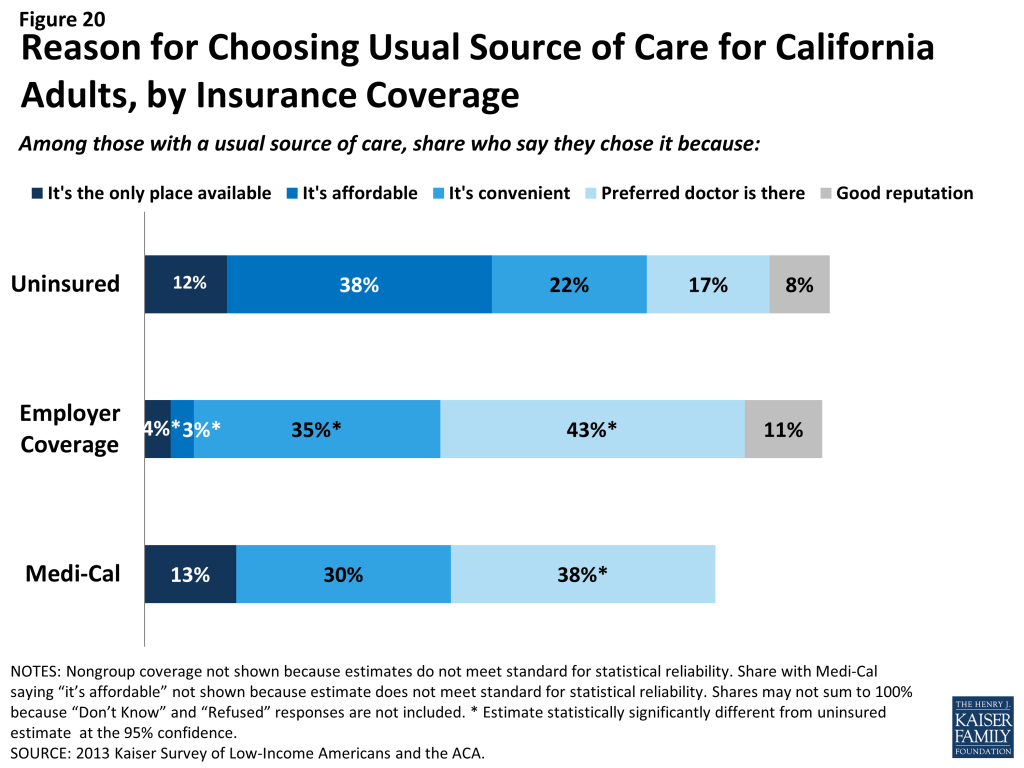
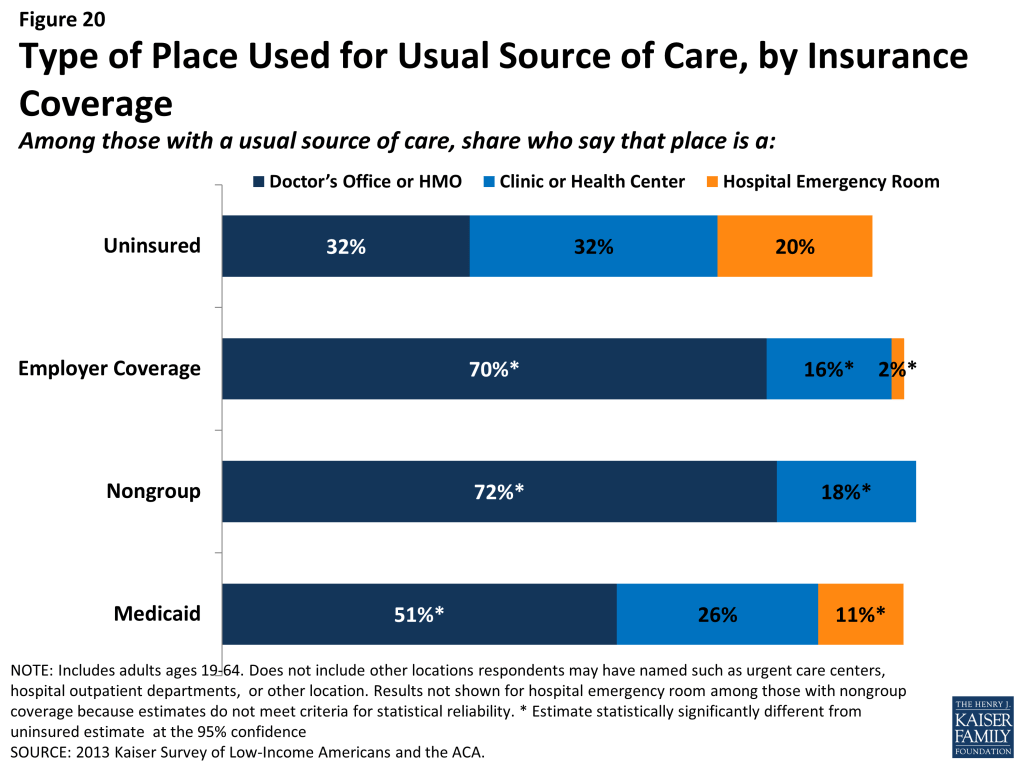
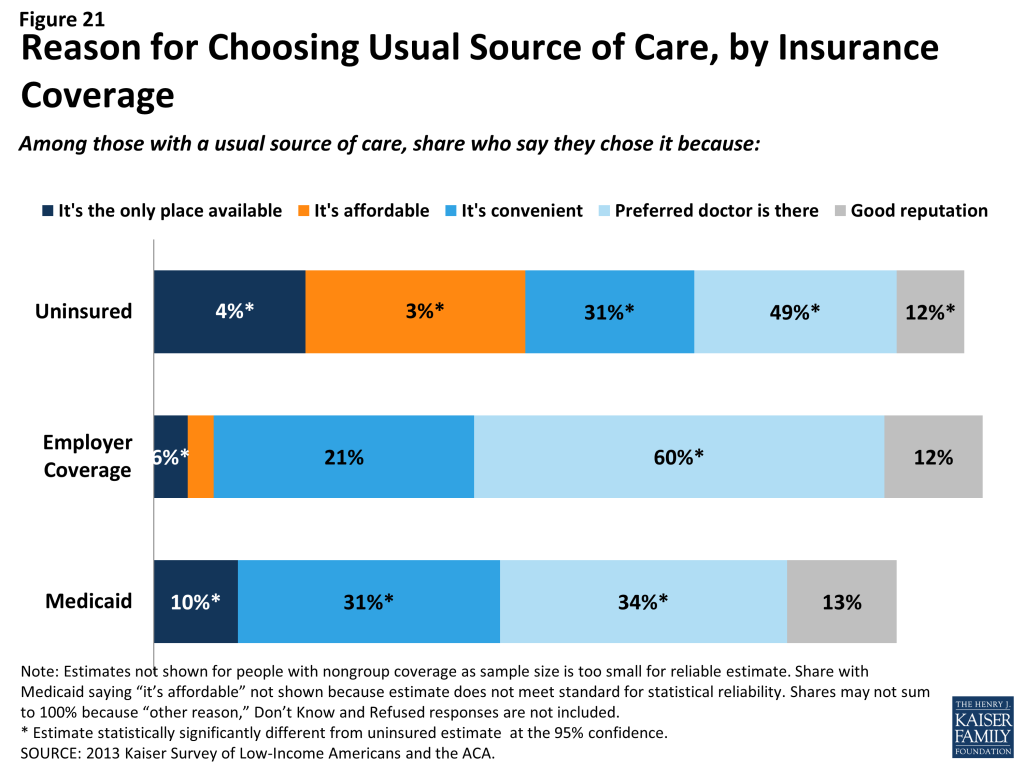
Many uninsured Californians report limited options for receiving health care when they need it. Uninsured adults in California are less likely than their insured counterparts to receive care in a private physician’s office when they do get care. Uninsured adults and adults with Medi-Cal are more likely than privately-insured adults to report that they have limited options for their usual source of care, with 12% of the uninsured and 13% of Medi-Cal beneficiaries reporting that they chose their usual source of care because it is the only option available to them, compared to 4% with employer coverage.

Informing ACA Implementation: The survey findings reinforce conclusions based on prior research: having health insurance affects the way that people interact with the health care system, and people without insurance have poorer access to services than those with coverage. Thus, gaining coverage is likely to connect many currently uninsured California adults to the health care system. Given the health profile of California’s currently uninsured population, there is likely to be some pent-up demand for health care services among the newly-covered. However, outreach may be needed to link the newly-insured to a regular provider and help them establish a pattern of regular preventive care. In particular, some individuals who have relied on emergency rooms or urgent care centers as their usual source of care may require help in establishing new patterns of care and navigating the primary care system. While California’s uninsured may have more options for where to receive their care once they obtain coverage under the ACA, clinics and hospitals that already see a large share of uninsured adults may continue to play an important role in serving this population once they gain insurance. Last, while coverage gains may reduce cost barriers to care, it will be important to monitor whether other barriers to care among the low-income population—such as transportation or wait times for appointments—continue to pose a challenge for access.

IV. Health Coverage and Financial Security

In addition to facilitating access to health care, health insurance serves primarily to protect people from high, unexpected medical costs. However, for low-income families in California, health costs can still be a burden, even if they have insurance. Understanding these issues can help policymakers monitor ongoing financial barriers to health services.

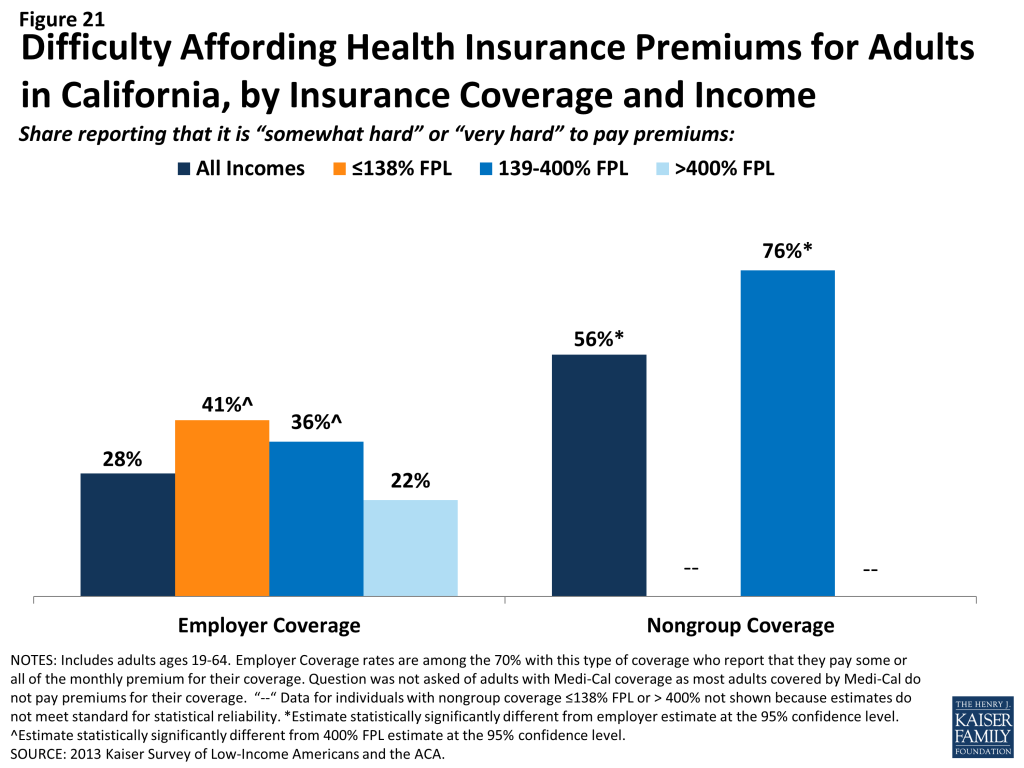
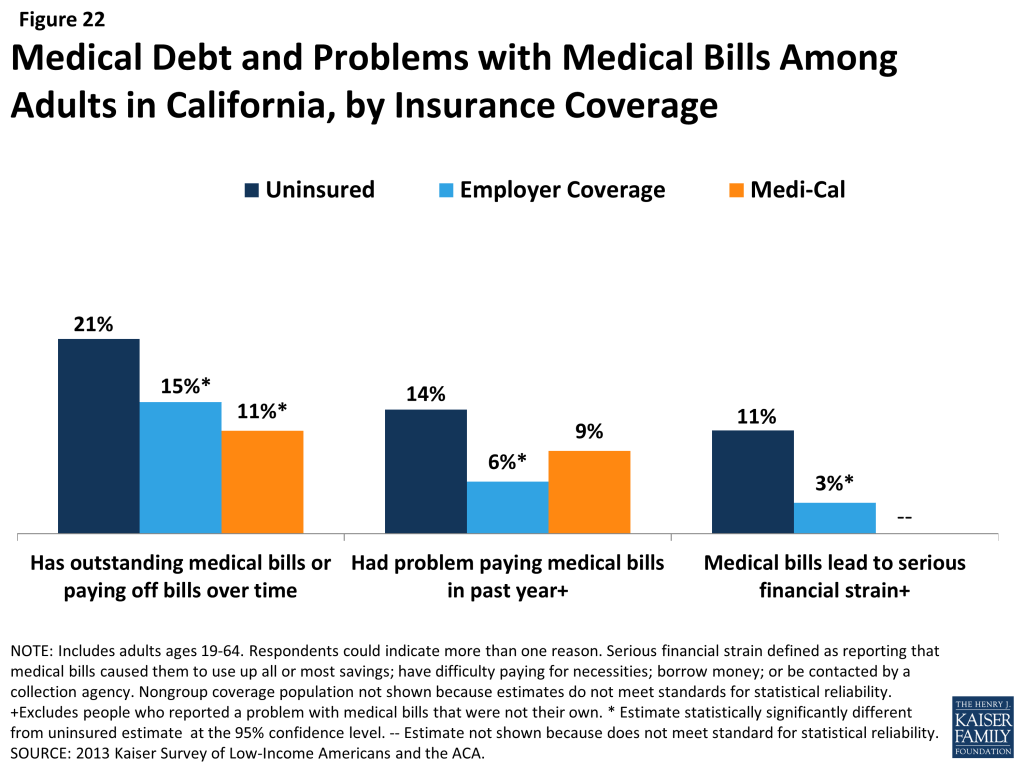
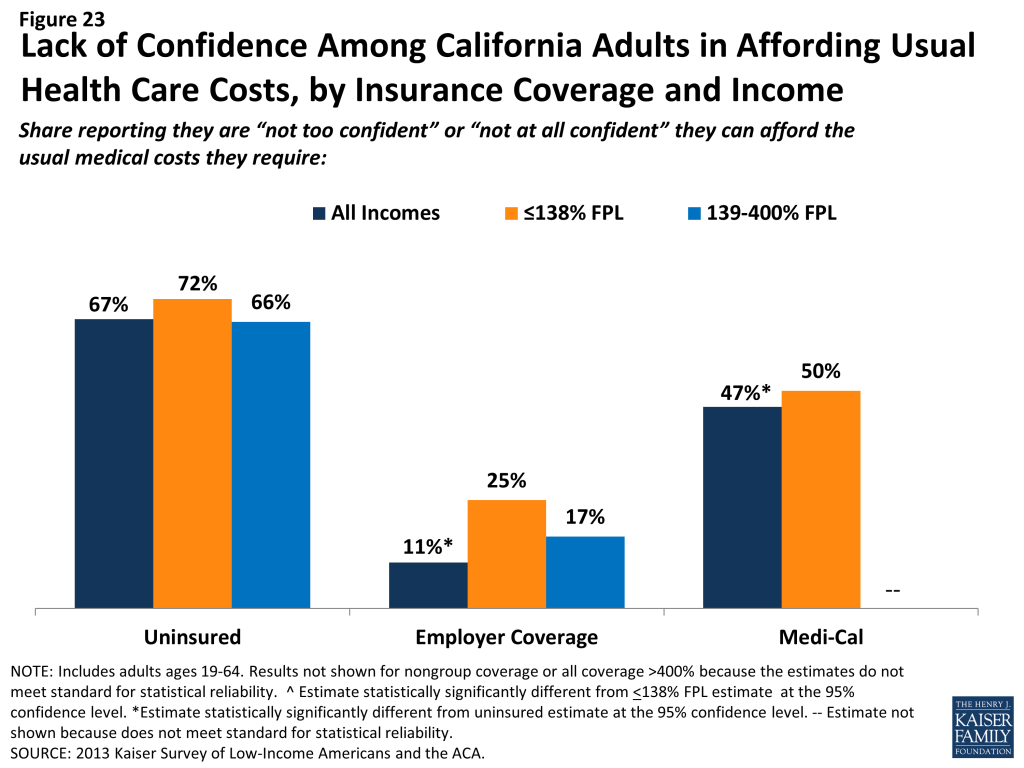
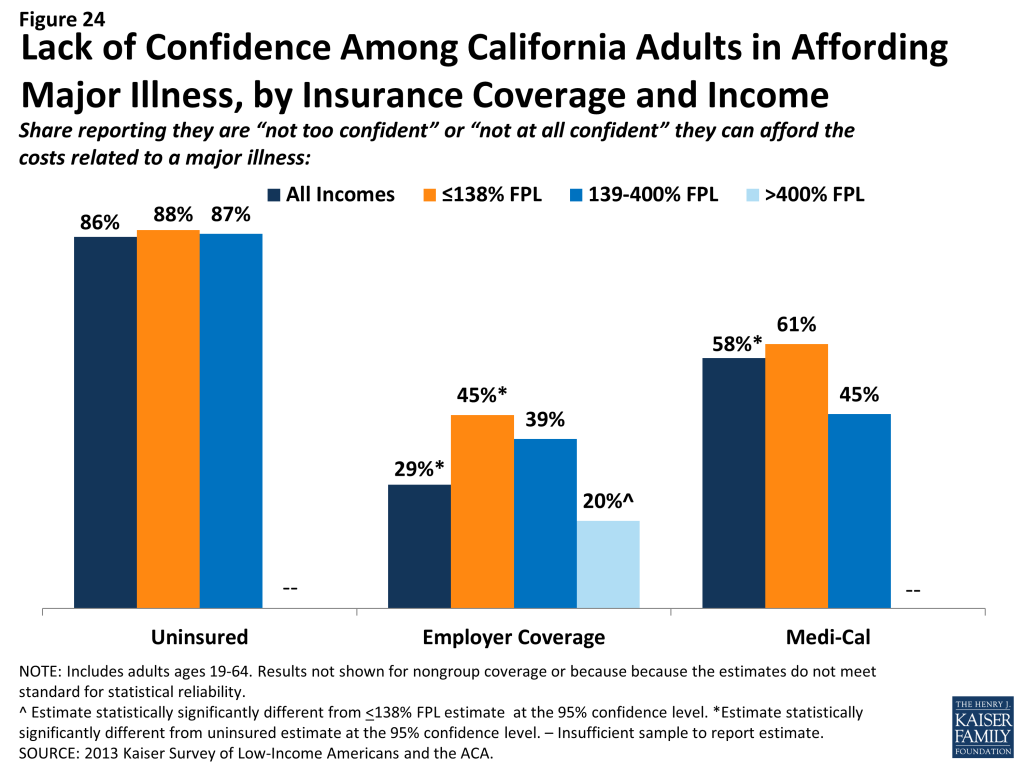
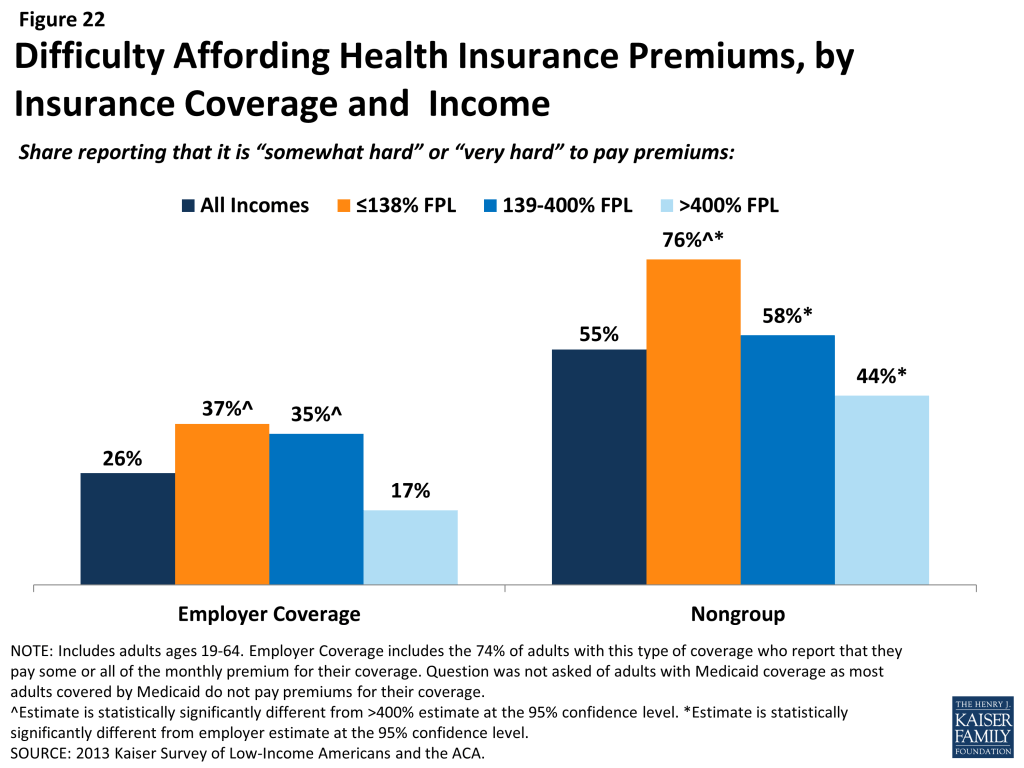
Health care costs pose a challenge for low- and moderate-income families in California, even if they have insurance coverage. Even among those with insurance, health care costs can be a burden, particularly for low- and moderate-income adults. About a third of low- and moderate-income adults in California who are covered by employer coverage report that their share of the premium is somewhat hard or very hard for them to afford, and three-quarters (76%) of moderate-income adults in California with nongroup coverage report difficulty paying their premiums. Health care costs translate to medical debt for many l0w-income adults, and these medical bills can cause serious financial strain. Notable shares of low-income insured adults also report that they lack confidence in their ability to afford health care, given their current finances and health insurance situation.

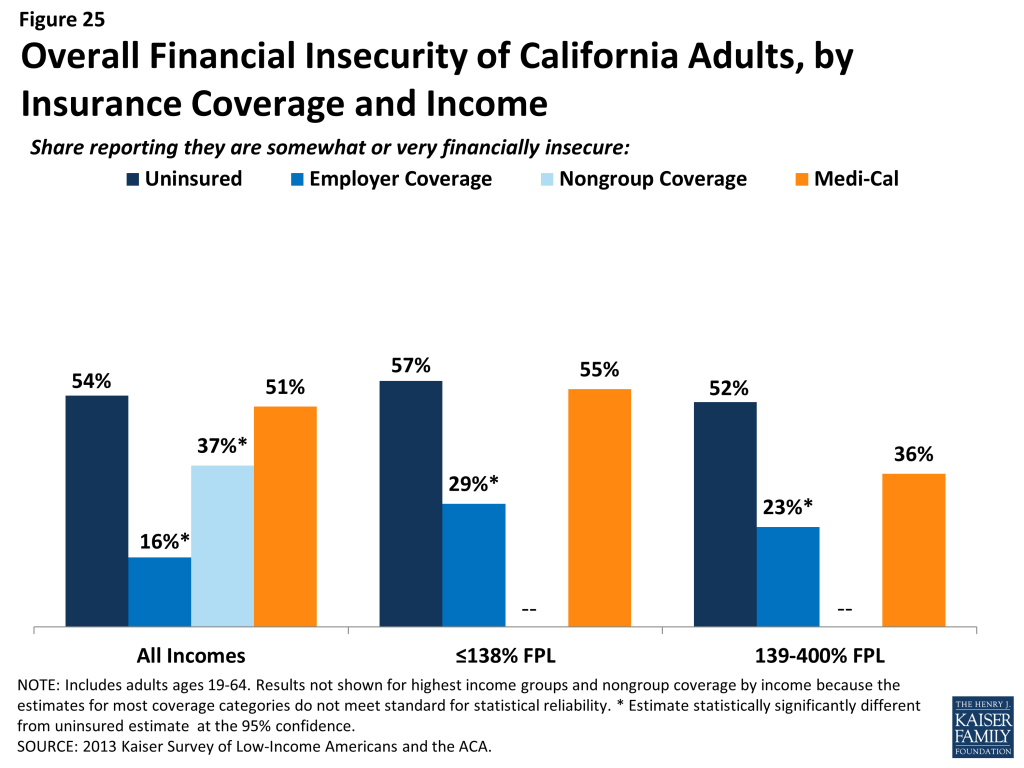
Low-income families face fragile financial circumstances. Low- and moderate-income adults in California across coverage groups report not being financially secure. However, adults who are low-income and uninsured or covered by Medi-Cal are particularly vulnerable to financial insecurity even outside of health care. General financial insecurity translates to concrete financial difficulties in making ends meet. Uninsured adults and those enrolled in Medi-Cal are more likely than privately-insured adults to have difficulty paying for other necessities, such as food, housing, or utilities, with 59% of the uninsured and 66% of those on Medi-Cal reporting such difficulty compared to 18% of those with employer coverage and 31% of those with nongroup coverage. While low-income adults across the coverage spectrum report high rates of difficulty paying for necessities, those with employer coverage report the lowest rates in this income group. These individuals may have stronger or more stable ties to employment than their counterparts with other or no insurance coverage. Higher rates of financial insecurity among Medi-Cal enrollees may reflect pre-ACA Medicaid eligibility rules, which targeted very vulnerable adults.

Informing ACA Implementation: Both insured and uninsured low-income adults in California struggle with medical bills and debt, and coverage expansions, assistance with premium costs and, for some, cost-sharing, and limits on out-of-pocket costs under the ACA have the potential to ameliorate the financial issues associated with the cost of health care. However, given survey findings that many low-income insured Californians continue to face financial challenges related to health care, it will be important to track whether there are ongoing financial barriers as people enroll in coverage and seek care. While insurance coverage can provide financial protection in the event of illness or injury, it is not curative of all of the financial burdens faced by low-income families. Given their overall situation, health insurance alone may not lift low-income Californians out of poverty, and many low-income California adults may continue to face financial challenges even after gaining coverage.

V. Low- and Moderate-income Uninsured California Adults’ Readiness for the ACA

As outreach and enrollment efforts are underway in California, information on low- and moderate-income adults’ access to tools for signing up for coverage and connections to outreach avenues can be helpful in addressing barriers. Key survey findings in this area include:

A majority of uninsured adults in California who are income eligible for coverage expansions reported knowing little or nothing about Medi-Cal and Covered California programs prior to the start of open enrollment. Despite ongoing media attention on the ACA, three-quarters (76%) of uninsured adults in California with incomes in the Medi-Cal target range (≤138% FPL) said they knew nothing at all or only a little about the Medi-Cal program, and five out of six (84%) uninsured adults in the income range for Covered California subsidies (139-400% FPL) reported that they knew nothing at all or only a little about Covered California. More recent national polling data indicates that lack of awareness remains high despite recent media attention on the ACA.

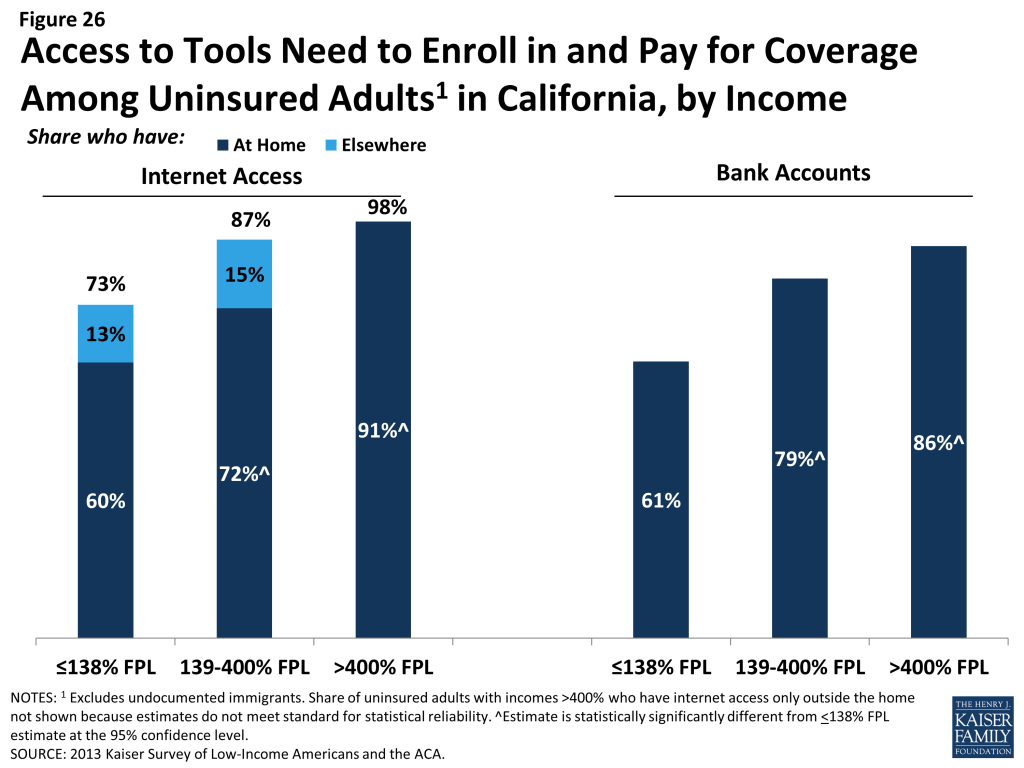
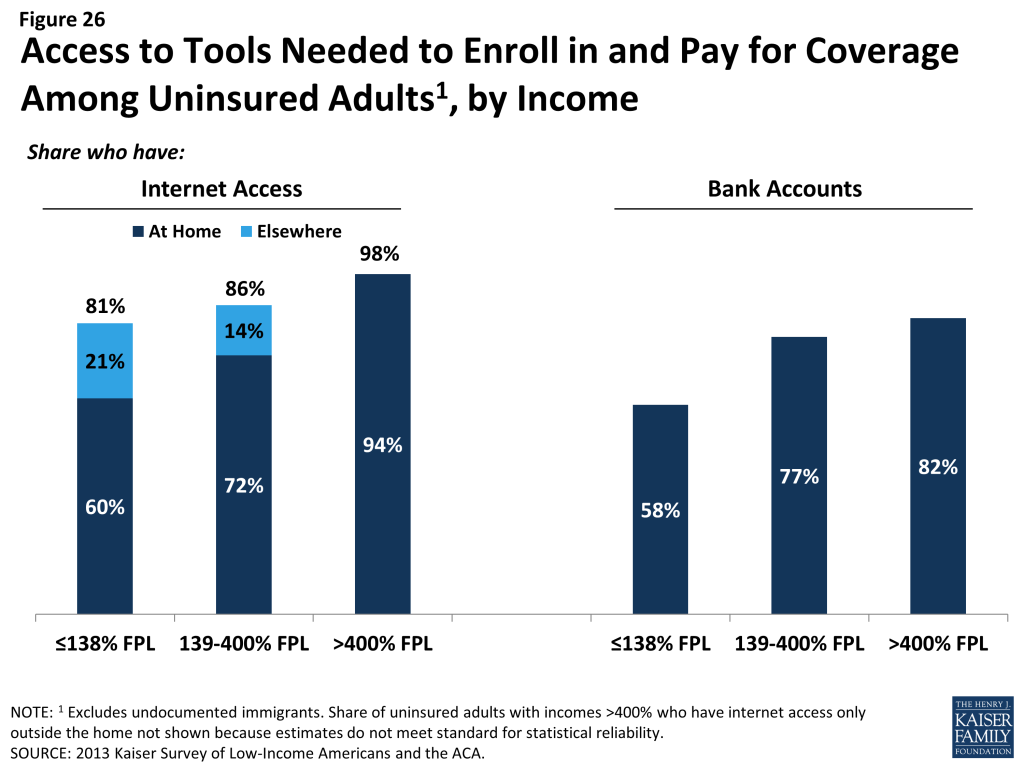
While most uninsured adults in California have the necessary tools for enrolling in coverage, some will experience additional logistical issues in signing up. Under the ACA, internet access is an important tool in accessing coverage. While the majority of uninsured adults have access to the internet either at home or outside the home, 27% of low-income (≤138% FPL) and 13% of moderate income (139-400% FPL) uninsured adults report that they do not have internet access readily available. For Covered California coverage, people will require a means to pay their premiums on a regular basis. While plans must accept various forms of payment, direct withdrawal from a checking account is a simple and reliable way to ensure that premiums are paid on time. However, over a fifth (21%) of uninsured adults in the income range for Covered California subsidies report that they do not have a checking or savings account.

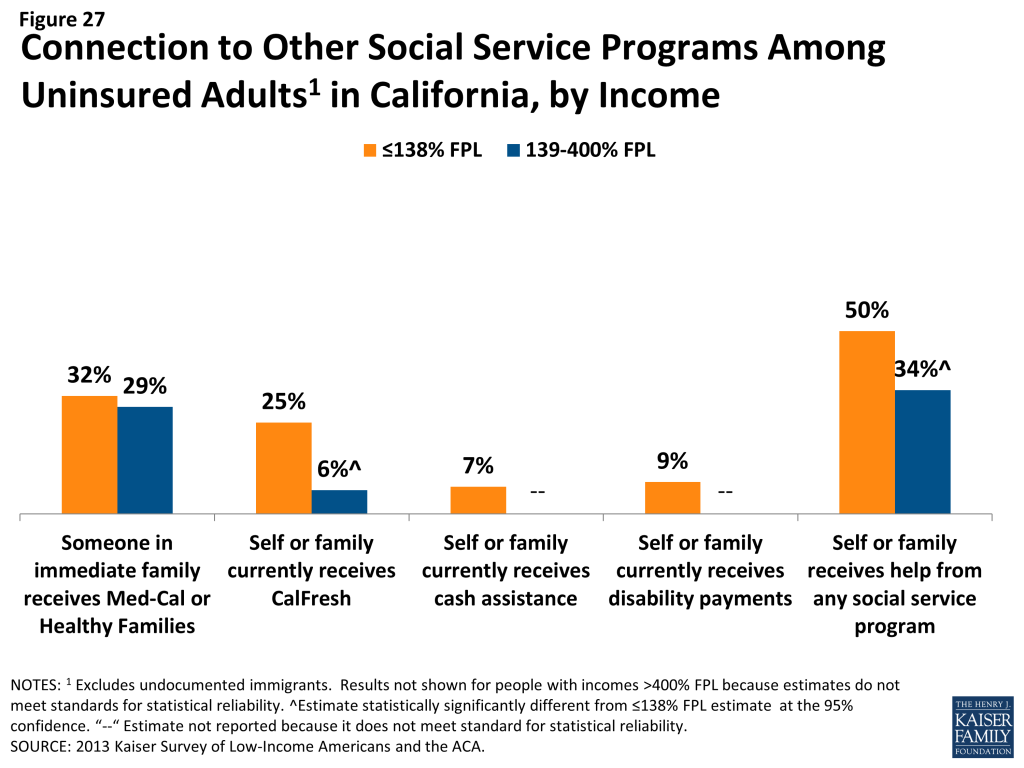
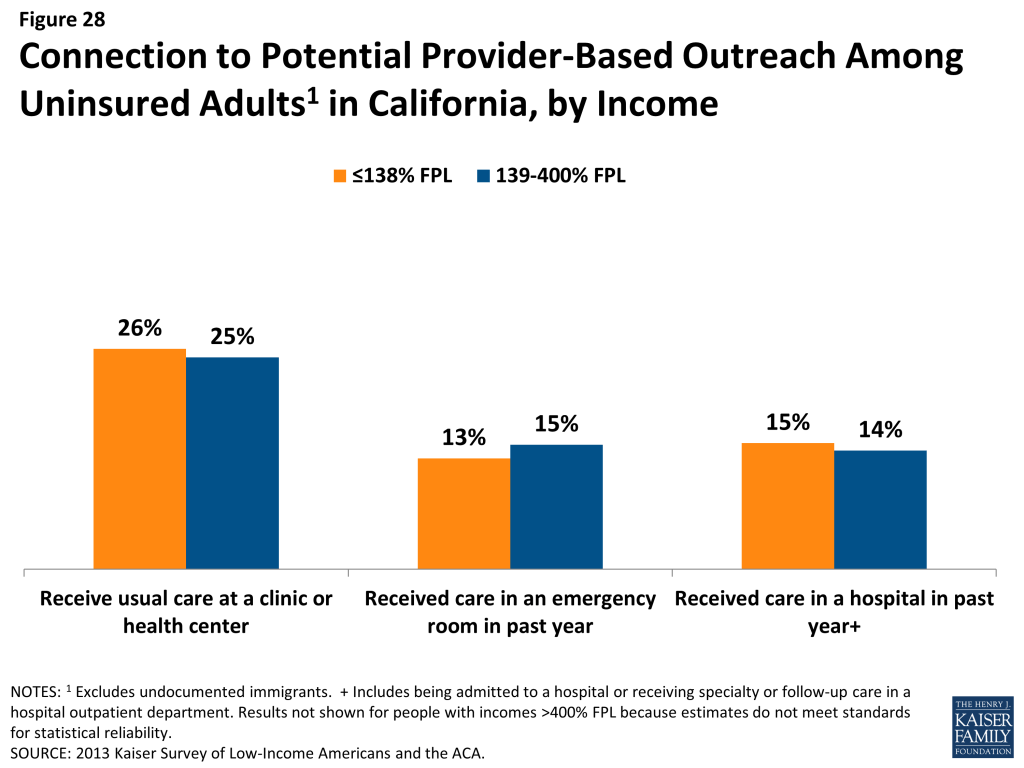
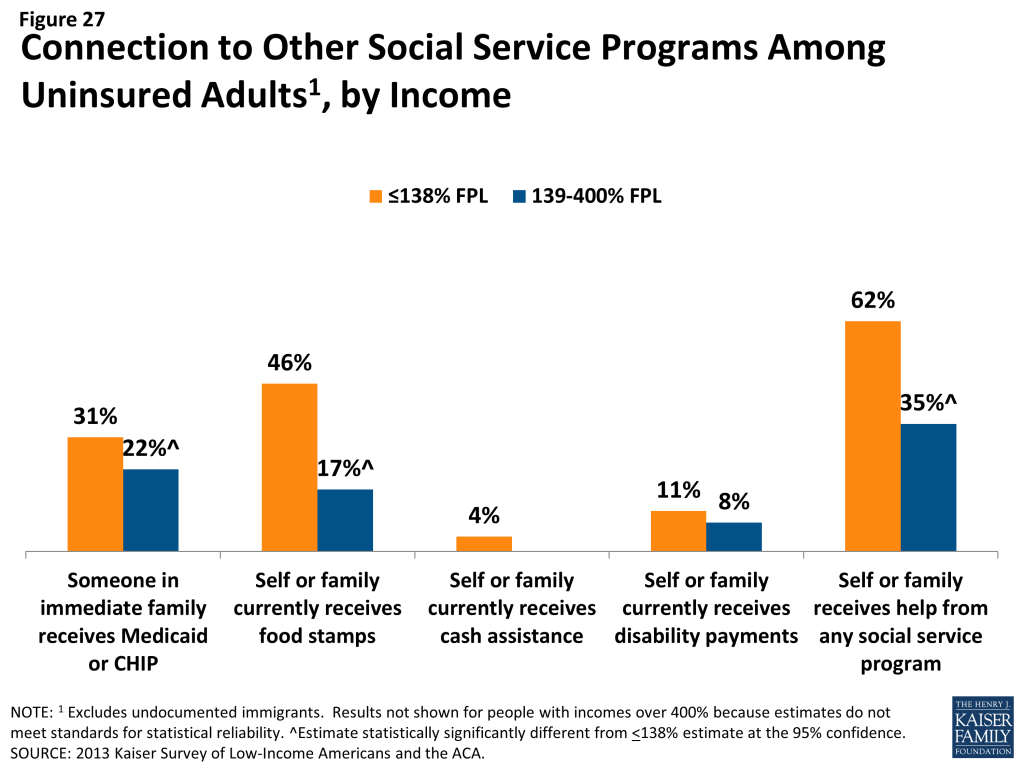
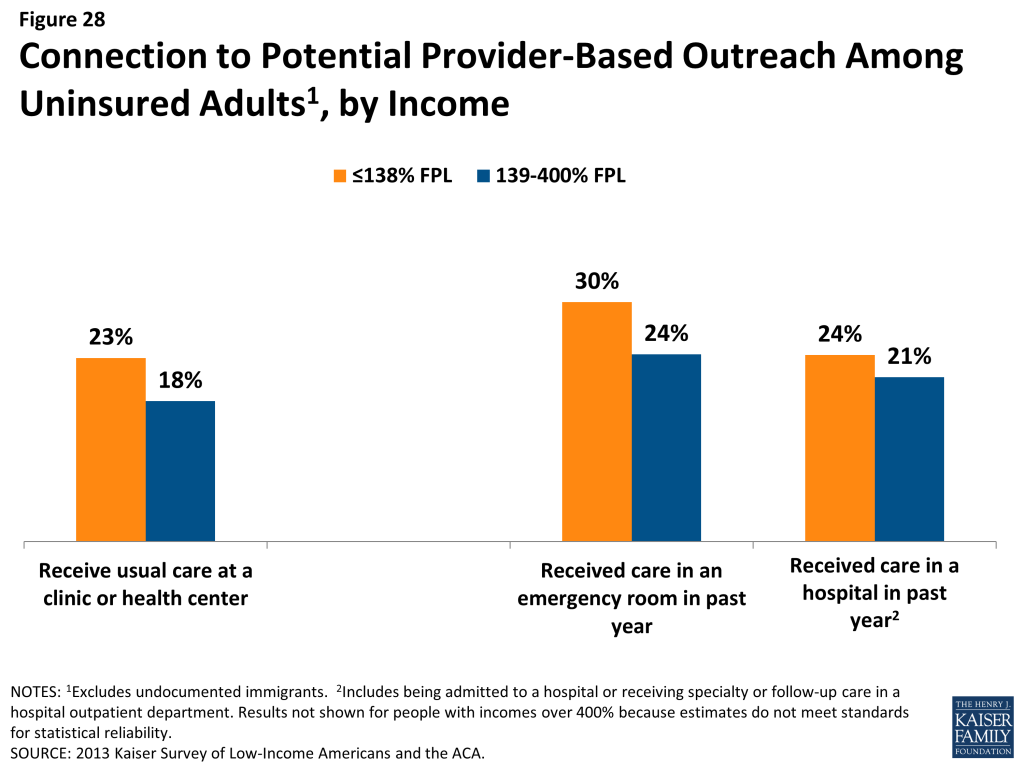
Many uninsured adults in California could be reached through targeted outreach avenues. Among uninsured adults in California with incomes in the range for Medi-Cal eligibility (≤138% FPL), half (50%) report that they or someone in their immediate family receives either CalFresh (California’s Supplemental Nutritional Assistance Program), cash assistance, disability payments, or Medi-Cal, making “fast track” enrollment efforts through using information collected by other agencies a promising avenue for outreach. For those without a connection to social services agencies, outreach through providers may be a promising approach, as about one-quarter of low- or moderate-income uninsured adults in California report that they use a clinic or health center as their usual source of care. While fewer report using a hospital outpatient department for regular care, hospitals reach many uninsured California adults through periodic visits.

Informing ACA Implementation: Both survey findings and more recent polling data indicate that there is a great need for education about new coverage options among Californians targeted for expansions. Even once eligible individuals learn about coverage options, they may face logistical challenges in signing up. Californians without internet access may be able to enroll through other more traditional avenues, such as over the phone or in person at county or provider offices, but efforts may be needed to inform people of these other application routes, and some using them may experience a slower enrollment process than they would if they applied online. Finally, “fast track” enrollment efforts are a promising approach to facilitating enrollment, but broader efforts will also be needed to reach California’s eligible uninsured population. Replicating successful outreach and “inreach” strategies involving service providers and advocacy groups used during LIHP enrollment may be useful for reaching individuals for and Medi-Cal enrollment.7  Prior barriers to Medi-Cal and LIHP enrollment efforts, including language and cultural barriers, immigration status, and misconceptions about the programs, may continue to be challenges during the current and future enrollment efforts.
Report: Introduction

In January 2014, the major coverage provisions of the 2010 Affordable Care Act (ACA) went into full effect in California and across the country. These provisions include the creation of a new Health Insurance Marketplace, known in the state as Covered California, where moderate income families can receive premium tax credits to purchase coverage and, in states like California that opted to expand their Medicaid program, the expansion of Medi-Cal eligibility to low-income adults. With these coverage provisions, the ACA has the potential to reach many of the 7 million uninsured Californians. The ACA also makes improvements to coverage for people who already have insurance by setting new requirements for health plans.

To help the state prepare for the 2014 ACA coverage expansions, the federal government approved California’s five-year “Bridge to Reform” §1115 Medicaid Demonstration Waiver in 2010. In addition to other provisions,8  the waiver allows for federal matching funds for the creation of a county-based coverage expansion program for low-income adults not otherwise eligible for Medi-Cal, known as the Low Income Health Program (LIHP). This waiver coverage was intended to seamlessly transition to the ACA coverage expansions when they took effect. The majority of counties in the state participated in the LIHP program, and as of 2014 these enrollees were transitioned to Medi-Cal or Covered California coverage.9 ,10 

LIHP reached many uninsured adults, and millions more are eligible for coverage through the Medi-Cal expansion or through Covered California.11  Though the ACA implementation is underway and people are already enrolling in coverage, policymakers in California continue to need information to inform the early stages of these coverage expansions. Reports of difficulties in enrolling in coverage and continued confusion and lack of information about the law point to some early challenges with implementation. Detailed data on the population targeted for coverage expansions and their past experiences with health coverage, current patterns of care, and family situation, can help policymakers target early efforts and provide insight into some of the challenges that are arising in the first months of new coverage.

Based on findings from the 2013 Kaiser Survey of Low-Income Americans and the ACA, this report provides a snapshot of health insurance coverage, health care use and barriers to care, and financial security among insured and uninsured adults in California at the starting line of ACA implementation and discusses how these findings can inform early implementation. The survey, conducted between July and September 2013, is a nationally representative survey that also includes a state-representative sample of over 2,500 nonelderly (age 19-64) adults in California. It was designed to focus on people targeted for financial assistance under the ACA and includes nonelderly adults with low incomes (≤138% FPL, or about $27,000 for a family of three in 2014) or moderate incomes (139-400% FPL, between approximately $27,000 and $79,000 for a family of three), as well as a comparison group with incomes over 400% FPL. The survey includes adults with employer coverage, nongroup, Medi-Cal, and other sources of coverage, as well as those with no health insurance. The California component of the survey and report on its findings complements a report on similar findings for the nation.12  This survey and report provides new data to help policymakers further understand early challenges in implementing health reform and assist outreach and enrollment workers, health plans, and providers and health systems. The survey also provides a baseline for future assessment of the impact of the ACA on health coverage, access, and the financial security of low- and moderate-income individuals in California. A detailed explanation of the methods underlying the survey and analysis is available in the Methods section of the report.

Report: Background: The Challenge Of Expanding Health Coverage In California

Lack of insurance coverage has been a longstanding policy challenge both nationwide and in California. Not having health insurance has well-documented adverse effects on people’s use of health care, health status, and mortality, as the uninsured are more likely to delay or forgo needed care leading to more severe health problems.13  Lack of insurance coverage also has implications for people’s personal finances, providers’ revenue streams, and system-wide financing.14 ,15 ,16  Because public coverage has been extended to many children and Medicare covers nearly all of the elderly, the vast majority of uninsured people are non-elderly adults. To address the challenge of the uninsured, the Affordable Care Act (ACA) includes an expansion of Medicaid (known in California as Medi-Cal) and the creation of new Health Insurance Marketplaces (known in California as Covered California).

California, the nation’s most populous state, has the largest number of uninsured of any state across the country. In 2012, twenty-one percent of the state’s nonelderly population was uninsured, or about 7 million people, which accounts for 15% of the uninsured nationwide.17  Los Angeles County alone, which has a population the size of many states, has a greater number of uninsured residents (2.2 million) than found in any state except New York, Florida, or Texas.18  Therefore, California’s actions to expand coverage through the Medi-Cal expansion and Covered California have implications not only for health coverage and access within the state but also for national goals of reducing the total number of uninsured.

California also is a highly diverse state, with 60% of the state identifying as a race other than White.19  The state is home to more than 10 million immigrants,20  including more than five million non-citizens, and has the largest number of undocumented immigrants in the nation.21  These unique characteristics of the state shape the challenge of extending health coverage and in implementing the ACA.

California’s Health Insurance Environment

Prior to the ACA, California had one of the highest uninsured rates in the nation and, correspondingly, one of the lowest rates of private insurance coverage, which includes group coverage obtained through an employer and individual coverage purchased directly from an insurance company (nongroup).22  One reason for the low rate is coverage is California’s unemployment rate, which at 8.7% is higher than the national average (7.3%).23  However, many workers in California lack health insurance: in 2012, one in four California workers was uninsured.24     Workers lack coverage for a variety of reasons, including not being offered coverage by their employer and not being able to afford coverage. Premiums and copayments for health coverage in California have been steadily rising over the past decade, and average premiums for nongroup coverage in California are higher than the national average ($572 per month in California compared to $490 per month nationally).25 

Still, as in other states, private coverage is the main source of insurance among those with coverage in California, and the private insurance market accounts for nearly three quarters of covered lives in California (excluding the elderly population).26  California has a concentrated private insurance market, with six insurers accounting for three-quarters of the market in 2011.27  The state also has a long history of managed care, with the majority of enrollees receiving coverage through a managed care plan.28 

Medi-Cal is a large player in the state, accounting for over a quarter of nonelderly covered lives, or about 7.3 million individuals.29  While Medi-Cal covers children in families with incomes up to 250% FPL[endnote 102550-49], eligibility for parents and adults without dependent children was more limited prior to the ACA and LIHP, leaving many adults without affordable coverage. Specifically, Medi-Cal was available only to parents with incomes up to the poverty level, and non-disabled adults without children were ineligible for coverage. The state also had adopted the option to eliminate the five year waiting period for coverage for eligible lawfully residing pregnant women and children and adopted the unborn child option to provide care to pregnant women, regardless of immigration status.30  However, other lawfully residing immigrants remained subject to a five-year waiting period before they could enroll in coverage, and undocumented immigrants remained ineligible to enroll in coverage.

California has the lowest Medicaid payment rates to physicians in the nation. In 2012, Medi-Cal payment rates to physicians for primary care services were 43% of Medicare rates, compared to a national average of 59%.31  Due to budget shortfalls, the state passed a 10% provider rate cut for most Medi-Cal providers, and this cut was implemented in January 2014.32 ,33  Simultaneously, under the ACA, California is required to pay certain physicians Medi-Cal fees that are at least equal to Medicare’s for a list of 146 primary care services; this fee increase is in place for 2013 and 2014, and the federal government will pay 100% of the cost of the difference between the increased rate and the state’s rate in place in 2009.34 ,35  Thus, fees paid to certain physicians for primary care services will be protected from the Medi-Cal rate cut in 2014 (because the federal government will fund the difference between the state’s rates and Medicare rates), but this federal funding and protection from rate cuts ends in 2015.

For uninsured residents in California, health care services are primarily financed and administered at the county level. Under California law, the state’s counties are “providers of last resort” for health services to low-income uninsured adults without other sources of care. California’s counties, therefore, have a history of financing, and in some instances delivering, health care to low-income, underserved, and uninsured individuals. All of California’s 58 counties have at least one health program for Medically Indigent Adults (MIA), and counties vary on the quantity and scope of health services covered.36  California also has a robust network of county hospitals, community health centers, and community clinics that make up a significant share of the state’s safety net system.37  These providers will play an important role in reaching, educating, and enrolling newly eligible individuals into coverage under the ACA.

Health Reform in California

Under the ACA, California will extend Medi-Cal coverage to citizens and eligible legal immigrants (those who have been U.S. residents for more than five years) with incomes up to 138% FPL ($16,105 for an individual or $27,210 for family of three in 2014). It is estimated that between 990,000 and 1.4 million Californians will enroll in Medi-Cal under the expansion by 2019.38 

To assist the state in preparing for the Medi-Cal expansion in 2014, the federal government approved California’s five-year “Bridge to Reform” Section 1115 Medicaid Demonstration Waiver in November 2010.39  The waiver provides the opportunity for California’s safety net hospitals, including county and University of California hospitals, to draw down federal matching funds to develop new programs and innovative approaches to improve quality of care through the creation of the Delivery System Reform Incentive Program (DSRIP). Federal funds are available for four priority areas, including (1) infrastructure development, (2) innovation and redesign, (3) population-focused improvement, and (4) urgent improvement in care.40  Twelve of California’s 21 designated safety net hospitals are participating in DSRIP, and each has developed a plan that describes specific improvement projects and related milestones. Milestones are reported to the state through semi-annual reports, incentive payments are tied to achieving each milestone.41 

In addition to DSRIP and authority to transition Medi-Cal-only seniors and persons with disabilities (SPDs) to managed care arrangements,42  the Bridge to Reform waiver allowed the state to draw down federal matching funds to expand coverage to low-income uninsured adults through the creation of a county-based Low-Income Health Program (LIHP). LIHP consisted of two programs: the Medicaid Coverage Expansion (MCE) for non-elderly, non-pregnant adults with family incomes at or below 133% FPL and the Health Care Coverage Initiative (HCCI) for non-elderly, non-pregnant adults with family incomes between 133-200%.43  Counties could elect to participate in LIHP and, if participating, decide whether to expand coverage to individuals with family incomes up to 133% FPL or up to 200% FPL (or a lower threshold set by the county). As of September 2013, 53 of the state’s 58 counties were participating in the LIHP program, and over 667,000 adults were enrolled.44 ,45  The state worked with the counties to transition LIHP enrollees to coverage options available under the ACA as of January 2014, transitioning nearly 644,000 beneficiaries to Medi-Cal and 24,000 beneficiaries to Covered California coverage in 2014.46 ,47 

Also under the ACA, people with incomes up to 400% FPL who do not have an affordable offer of coverage are eligible to receive tax credits to purchase coverage through Health Insurance Marketplaces; citizens and legal immigrants who are not eligible for tax credits can purchase unsubsidized coverage. California was the first state in the country to pass legislation to create a state-based Marketplace under the ACA. The Marketplace, called Covered California, is governed by an appointed five-member board and operates as an independent public agency. Since its inception, Covered California has actively pursued grant funding to assist with planning and operations and received about $910 million in federal grants.48  Covered California enrollees can select among the plans offered by the participating 13 commercial health plans.49  Over three million Californians are estimated to be eligible to purchase coverage through Covered California, with about two million of those individuals eligible for premium tax credits.50 

California’s early efforts enabled the state to reach many uninsured targeted for coverage expansions early in ACA implementation. For example, by September 2013, nearly all (almost 70,000) individuals eligible for the Medi-Cal expansion had enrolled in LIHP in Alameda County.51  However, many eligible uninsured remain across the state. For these individuals, outreach and enrollment efforts are essential to help educate them about coverage options and help them successfully complete an application. There are a range of outreach and education efforts underway in the state, including statewide marketing campaigns, community mobilization to reach people at the local level, provider training, outreach to transition people from LIHP coverage to Medi-Cal, and targeted efforts to reach vulnerable populations who may be newly-eligible for Medi-Cal.52  For example, the California Department of Health Care Services and The California Endowment, a private grant-making foundation, have been awarded federal matching funds for a $23 million Outreach and Enrollment Grant to enhance outreach and increase Medi-Cal enrollment, including support for Certified Enrollment Counselors.53  The funds will be distributed by the state to 36 county and regional organizations that must use the funds to target uninsured people who are difficult to reach or enroll, such as those with mental health needs, substance abuse disorders, the homeless, young men of color, as well as people with limited English proficiency.54  In addition, 125 health centers operating over 1,000 sites throughout the state received $25.1 million in federal grants in fiscal years 2013 and 2014 to help with outreach and enrollment assistance.55 

Covered California is also investing heavily in outreach and enrollment efforts. For example, Covered California is using federal funding for an Outreach and Education Grant Program to engage the state’s uninsured population and increase awareness and understanding of health coverage options.56 ,57  The program has allocated $43 million in grants to 48 community organizations, including $37 million that was distributed in 2013 and $6 million allotted for 2014.58  These grants were primarily to organizations targeting individuals but also include some organizations targeting small businesses or providers.59  Covered California also established an Assisters Program and is working with community organizations to provide direct assistance to consumers to help them enroll in coverage. To further expand marketing and outreach, especially efforts aimed at uninsured young adults and uninsured Hispanics to bolster enrollment assistance and to sustain Marketplace operations, Covered California was awarded a $155 million federal grant in January 2014.60  These efforts overlay other state and local campaigns and ongoing outreach and enrollment activities.

A Profile of The Uninsured in California

Barriers to coverage in the past and state demographics are reflected in the characteristics of the uninsured population in California. For example, a majority of uninsured adults (52%) are low-income, in contrast to 10% of adults with employer coverage (Figure 1 and Appendix Table A1). Adults with Medi-Cal are the most likely of any coverage group to be low-income, reflecting the fact that prior to the ACA, adult income eligibility was limited. Further, the majority of uninsured Californians live in families where they or their spouse are working (71%)(Figure 2).  However, not surprisingly, uninsured adults in California are less likely than adults with employer coverage to be in a working family.

Figure 1: Income Distribution Among Adults in California, By Insurance Coverage
Figure 2: Family Work Status Among Adults in California, By Insurance Coverage

Uninsured adults in California also differ from insured adults with regards to demographic characteristics, often reflecting association with income or work status. Uninsured adults are likely to be younger than insured adults, as younger adults have lower incomes and looser ties to employment than older adults. Two-thirds (66%) of uninsured adults are ages 19-44 as compared to 56% of adults with employer coverage or 52% with Medi-Cal (Appendix Table A1). There also are significant racial and ethnic differences in health coverage among nonelderly adults, primarily reflecting differences in income by race/ethnicity. For example, uninsured adults are more likely to be Hispanic – 52% of uninsured adults are Hispanic – than adults with employer coverage (26%). Over one third of uninsured adults in the state are noncitizens (36%), compared to 20% of adults with Medi-Cal or 10% of adults with employer coverage. Citizenship status may leave many uninsured adults ineligible for assistance, increasing the likelihood they will remain uninsured.

As efforts continue to reach, educate, and enroll individuals into health coverage under the ACA, it is important to remember who the ACA aims to help and how their characteristics and previous interactions with the health system may inform efforts to connect with them.

Report: I. Patterns Of Coverage And The Need For Assistance

Coverage Dynamics among the Insured and Uninsured

Health insurance coverage is dynamic, and every year thousands of Californians gain, lose, or change their health coverage. However, for most uninsured adults in California, lack of coverage is a long-term issue that spans many years. Many uninsured adults in California reported trying to obtain coverage in the past but were unsuccessful due to barriers such as ineligibility for public coverage or high costs of private coverage. Under the ACA, millions of uninsured are projected to gain coverage as those barriers are removed, but some may continue to experience gaps or changes in coverage.

For most currently uninsured adults in California, lack of coverage is a long-term issue.

While some people lack health insurance coverage during short periods of unemployment or job transitions, for many uninsured adults in California, lack of coverage is a chronic problem. The survey shows that a large share of uninsured adults in California have been without insurance for a very long period of time: half (50%) reported being uninsured for 5 years or more, including 22% of the uninsured who reported that they have never had coverage in their lifetime (Figure 3). The length of time adults have been uninsured does not differ significantly by income in California (see Appendix Table A2). However, Hispanic uninsured adults were more likely than non-Hispanic uninsured adults to report that they have never had coverage in their lifetime (data not shown).

Figure 3: Length of Time without Coverage, Among Currently Uninsured Adults in California

It is important for policymakers in California implementing coverage expansions to be aware that people targeted by the ACA have varying levels of experience with the insurance system. While some previously had coverage, a large share of uninsured adults in California has been outside the insurance system for quite some time. The long-term uninsured may require targeted outreach and education efforts to link them to the health care system and help them navigate their new health insurance. As enrollment has lagged among the Hispanic population in California, it is particularly important to ensure that translation issues or lack of clarity on use of immigration information does not impede outreach and education efforts.61  Special efforts in the state to target the Hispanic population, as well as others who have been outside the health coverage system, are therefore particularly important.

Many uninsured adults in California report trying to obtain insurance coverage in the past, but most did not have access to affordable coverage.

The uninsured report a desire to obtain coverage, but prior to implementation of the ACA in California, options for coverage—particularly for the low-income—were limited. The vast majority of uninsured adults in California do not have access to employer coverage. More than eight in ten (82%) uninsured adults in California report no access to employer coverage, either because no one in their family is working for an employer, their or their spouse’s employer does not offer coverage, or they are ineligible for that coverage (Table 1). For example, 45% of uninsured adults in California are in a family without an employer, meaning both they and their spouse (if married) are either not working or are working but are self-employed. Over a quarter (28%) of uninsured adults are in a family that has an employer who does not offer coverage to any workers, and nearly one in ten (8%) are in a family that works for an employer who offers coverage but they are ineligible for that coverage. Most of whom are ineligible because they work part-time or are in a waiting period. About one in five (18%) uninsured adults in California does have access to coverage through an employer, but the majority report that the coverage offered to them is not affordable.

Table 1: Access to Employer Health Coverage Among Uninsured Adults in California
AllBy Income
≤138% FPL139-400% FPL
%%%
No Access to ESI82%84%79%
No one in family has an employer*45%53%33%^
Firm doesn’t offer coverage28%25%35%^
Not eligible for coverage8%11%
Access to ESI18%16%21%
Cannot afford premium10%8%13%
Don’t think need coverage
Some other reason6%6%6%
Notes: Don’t Know and Refused responses not shown, they account for less than 5% of the uninsured population.* Individuals who are self-employed without other employment are treated as not having an employer.”–“: Estimates with relative standard errors greater than 30% or unweighted cell sizes below 30 are not provided.^ Estimate statistically significantly different from ≤138% FPL at the 95% confidence level.SOURCE: 2013 Kaiser Survey of Low-Income Americans and the ACA.

Similarly, low-income adults had limited access to coverage through Medi-Cal prior to the ACA. While the state had expanded eligibility to children through Medi-Cal and Healthy Families (California’s former Children’s Health Insurance Program, which has now been consolidated into Medi-Cal), Medi-Cal eligibility for adults remained very limited (see Background for more detail). Prior to the state’s early expansion efforts through the LIHP, Medi-Cal eligibility for parents was limited to those with incomes below poverty, and non-disabled adults without dependent children were ineligible regardless of their income.62  While eligibility for low-income adults began to be expanded through the creation of the LIHP in 2010, county participation in the program was phased in and the income level at which individuals were covered varied across counties. In addition, some individuals who were eligible for Medi-Cal remained uninsured because they were not aware that they were eligible for coverage or they faced application or enrollment barriers. While California had already adopted many enrollment simplifications for children prior to the ACA, the enrollment processes for adults remained more burdensome than those for children.63 

The previous gaps in Medi-Cal eligibility for adults and difficulties with the enrollment process posed barriers for many low-income adults seeking coverage. Nearly one quarter of uninsured adults in California (24%) reported trying to sign up for Medi-Cal in the past five years (Figure 4 and Appendix Table A2). The majority of adults in California who tried to sign up for Medi-Cal were unsuccessful, and among those, most (12% of the uninsured) were unable to sign up because they were told they were ineligible (Figure 4). Notably, results are similar when looking at just uninsured Californian adults in the income range for Medi-Cal expansion under the ACA (≤138% FPL). While some of the individuals who were told they were ineligible for Medi-Cal may have been eligible for other programs, such as LIHP, most likely remained ineligible for public coverage until the ACA expansion in January 2014, barring a change in their income.64 

Prior to the ACA, there were also barriers to obtaining coverage on the nongroup, or individual, market. This type of coverage was not guaranteed in California, and insurance companies could charge higher premiums for sicker or older individuals, making coverage unaffordable for many uninsured adults.65  Uninsured Californians also report trying to obtain nongroup coverage. One in six uninsured adults in California (17%) reported trying to obtain nongroup coverage in the past five years. Most of these Californians (10% of the uninsured) did not purchase a plan because the policy they were offered was too expensive (Figure 4).

Figure 4: Uninsured Adults’ Attempts to Enroll in Medi-Cal or Nongroup Coverage in the Past 5 Years

Many of the barriers to coverage that the uninsured have reported facing in the past are addressed by the ACA. Large employers (>50 workers) face penalties if they do not offer affordable coverage to their workers,66  and in states that chose to expand Medicaid such as California, eligibility for Medicaid includes most adults with incomes at or below 138% FPL. Further, millions of uninsured families are now able to purchase coverage in the Marketplaces and receive premium tax credits to reduce the cost. Insurers are no longer able to deny coverage based on health status and are limited in what they charge people based on age, location, and tobacco use status. However, some uninsured adults may continue to face barriers to coverage. As was the case before the ACA, undocumented immigrants remain ineligible to enroll in Medicaid, and recent lawfully residing immigrants are subject to certain Medicaid eligibility restrictions. One in five uninsured adults in California is an undocumented immigrant67  and will not have access to coverage under the ACA.

For those who are eligible for assistance, education efforts regarding new coverage options are important. People who have attempted to obtain coverage in the past may be unaware that rules and costs have changed under the ACA. Outreach and education will be needed to inform people that eligibility rules have changed and that financial assistance is available to offset the cost of coverage.

Health coverage is not always stable.

For most insured adults in California, coverage is continuous throughout the year and over time. However, when accounting for both insured people with a gap in their coverage and uninsured people who recently lost coverage, the survey indicates that sizeable shares of adults in California lose or gain coverage over the course of a year.

Among California adults who were insured at the time of the survey, 5% reported being uninsured at some point in the past year (see Table 2), and those who had a gap in coverage were uninsured for nearly half the year (7.4 months) on average (data not shown). Further, some currently uninsured adults had coverage at some point within the past year. Among uninsured adults in California, nearly one in six (16%) reported having lost coverage within the last year. Among both those with a gap in coverage or who recently lost coverage, the majority reported that they most recently had employer coverage (data not shown).

In addition to those who lose or gain coverage over the course of a year, many adults in California who have coverage throughout the entire year have a change in their health insurance plan. Among adults with insurance coverage, 9% had coverage for the entire year but reported that they had a change in their coverage (Table 2). Coverage changes may be due to a number of different factors including changes in employment, changes in eligibility for public programs, or simply a change in plan or insurance carrier. The most common reasons for a change in coverage appear to be related to changes in employment or changes in plans during open enrollment, as most Californians with coverage change reported changing from an employer plan to another employer plan.

Table 2: Coverage Dynamics Among Insured and Uninsured Adults In California, by Income and Current Coverage
AllBy IncomeBy Current Coverage
≤138% FPL139-400% FPL>400% FPLEmployerNongroupMedi-Cal
%%%%%%%
Insured Adults100%100%100%100%100%100%100%
Gap in Coverage in Past Year5%10%7%3%13%
Changed Coverage During Year9%8%9%8%
Same Coverage for Full Year87%82%85%90%^89%85%80%
Uninsured Adults100%100%100%100%100%100%100%
Uninsured Full Year83%84%84%76%NANANA
Lost Coverage Within Past Year16%16%16%NANANANA
NOTES: Don’t Know and Refused responses not shown. Excludes people covered by other sources, such as Medicare, VA/CHAMPUS, or other state programs. “–“: Estimates with relative standard errors greater than 30% or unweighted cell sizes below 30 are not provided.^ Estimate is statistically significantly different from ≤138% FPL estimate at the 95% confidence level.SOURCE: 2013 Kaiser Survey of Low-Income Americans and the ACA.

Last, a small number of insured adults in California reported challenges in either renewing or keeping their coverage, another indication of instability in coverage throughout the year. Reflecting eligibility rules, adults with Medi-Cal are the most likely to report a challenge (19%) compared to adults with other insurance types (Figure 5). Medi-Cal eligibility is closely tied to income, and adults’ income may fluctuate throughout the year; adults must report changes in income that may affect their eligibility throughout the year, and low-income people are very likely to have part-time or seasonal work that leads to income fluctuations over the course of a year. In addition, adults must renew their Medi-Cal coverage either in person or online at least annually.

Figure 5: Difficulty Renewing or Keeping Health Coverage Among Currently Insured Adults in California, by Income and by Insurance Coverage

The survey findings on changes in insurance coverage during the year have implications for implementation of health reform in California. While there has been much focus on enrolling currently uninsured people into Medi-Cal or Covered California coverage, survey findings demonstrate that people will continue to move around within the insurance system throughout the year. Many people lose or gain employer coverage over the course of a year due to changing economic conditions and the delicate relationship between employment and health insurance. Further, there is some churning in insurance coverage resulting from Medi-Cal income eligibility limits: as adults’ income fluctuates, they may gain or lose Medi-Cal eligibility. Adults may also experience gaps in Medi-Cal coverage due to renewal requirements.

Gaps in coverage can cause people to postpone or forgo health care or accumulate medical bills,68  and changes in insurance plans may disrupt continuity of treatment. By providing for insurance options across the income spectrum and facilitating coverage outside the employment-based system, the ACA may help adults have coverage continuously throughout the year. Renewal simplifications for Medi-Cal coverage enacted as part of the ACA may also address issues in coverage disruptions: whereas previously all adults in California had to submit a paper form and documentation of income for Medi-Cal renewal, provisions under the ACA provide new options for them to renew on-line or by phone and use pre-populated forms when possible to reduce the need for paper documentation.69 

However, even after implementation, adults are likely to experience coverage changes due to job changes or income fluctuation. To further help reduce churning on and off of Medicaid coverage, CMS has offered states the ability to adopt 12-month continuous eligibility for parents and other adults through Section 1115 Medicaid demonstration authority, and the federal government is finalizing policies regarding matching funds for this provision. Though many states use continuous eligibility for children in Medicaid, as of fall 2013, no state, including California, had adopted this strategy for adults. Other potential efforts to address churning in insurance coverage include plan coordination across Medi-Cal and Covered California—for example, requiring plans to provide for transition plans, engage in information sharing, or align provider networks—and having an ongoing presence of application assistants to help with coverage transitions.70  Because implementation is not a “one shot” effort that will be done once Californians are enrolled or transferred to Medi-Cal in the early part of 2014, it will be important to have ongoing efforts to enroll and keep people in coverage.

Report: Ii. What To Look For In Enrolling In New Coverage

How Low-and Moderate-Income Adults in California Sign Up For and View Their Coverage

While many currently uninsured adults in California have limited experience in signing up for and using health coverage, past successes and challenges of insured low- and moderate-income adults can inform the experiences of those seeking coverage under the ACA. A majority of insured Californians do not experience problems choosing, enrolling in, and using their coverage, and this pattern holds true for both those in Medi-Cal and private insurance. Still, based on the experience of their insured counterparts, the uninsured population in California that is being targeted by the ACA coverage expansions is likely to encounter some barriers in the process of choosing and enrolling in coverage. While the ACA aims to make the process smoother, it is likely that some challenges inherent in the complexity of health coverage will require concerted efforts to address.

While many adults in California reported facing no difficulty in applying for Medi-Cal coverage prior to the ACA, some encountered difficulties in the process of applying for public coverage in the past.

In comparison to the process for gaining coverage through an employer—which is typically facilitated by the firm or a representative and may require limited action on the part of the insured—applying for publicly-financed coverage typically requires proactive steps to gain coverage. Adults in California who currently have Medi-Cal or who have attempted to enroll in the past five years reported little difficulty in enrolling in Medi-Cal. Almost half of adults (48%) who applied to Medi-Cal said the entire process was very or somewhat easy. However, the rest found at least one aspect of the process – finding out how to apply, filling out the application, assembling the required paperwork, or submitting the application – to be somewhat or very difficult. The most commonly reported difficulty was assembling the required paperwork, which over a third (34%) of Californians who enrolled or applied said was somewhat or very difficult (Figure 6 and Appendix Table A3).

Figure 6: Views of Medi-Cal Enrollment Process Among Adults Who Signed Up or Attempted to Sign Up for Medi-Cal

In recent years, California, along with many other states, has made strides towards providing individuals multiple avenues to enroll in coverage, including through online applications to facilitate access to coverage and ease administrative burdens.71  However, more than four in ten California adults (42%) who have applied to Medi-Cal in the past five years reported that they did so through traditional routes—that is, in person at a state or county government office—and only 7% reported using an online application (Figure 7).

Figure 7: Mode of Application Among Adults in California Who Signed Up or Attempted to Sign Up for Medi-Cal

The ACA includes provisions to further simplify the application, enrollment, and renewal process for coverage in all states. These requirements include the adoption of a single streamlined application that is available online, by phone, and on paper and that screens for all health coverage options; electronic transfers of accounts between agencies to facilitate transitions across health coverage programs; and reliance on trusted sources of electronic data, rather than requesting paper documentation, to verify eligibility criteria.72 As of late 2013, California and other states were still in the process of implementing many of these changes and coordinating enrollment processes with Covered California.73  Ongoing efforts in the state are also trying to make the process of enrolling in Medi-Cal coverage a more positive and welcoming experience, which calls for a culture shift to reorient Medicaid management, systems, and caseworker training away from welfare-style “gatekeeping” and toward encouraging participation.74 

In addition, state and county investments are being made to train professionals and dedicate resources to assist with enrollment into new Medi-Cal and Covered California coverage options. Through federal grant funds, private investments, and dedicated local efforts, California has developed a robust outreach network that relies heavily on community organizations, such as community health centers. In-Person Assisters, referred to in California as certified enrollment counselors, and Navigators are being trained by Covered California to help individuals and families enroll in both public and private coverage. However, backlogs in certifying enrollment counselors have delayed the rollout of assistance available at the local level.75  It is possible that uninsured Californians applying for coverage after these new processes are implemented and the full range of assistance is in place will encounter fewer challenges in navigating the enrollment process than applicants have in the past.

When adults with Medi-Cal or private insurance plan have a choice of plan, they do not always prioritize costs over other plan features in making that choice, and many find some aspect of the plan choice process to be a challenge.

As Californians gain coverage, many will have the option to select an insurance plan. People may chose a particular plan for a variety of reasons, including low cost, choice of providers, recommendations from friends and family, or coverage of a particular benefit. Among the 58% of insured adults in California who had a choice of plans,76  roughly three in ten (27%) reported that they chose their plan because their costs would be low, 29% because it covered a wide range of benefits or a specific benefit that they need, and 27% because of its provider network (Figure 8 and Appendix Table A4).

Figure 8: Main Reason for Choosing Health Plan, Among Insured Adults Who Had a Choice

In choosing a plan, Californians may face challenges in comparing costs, services, and provider networks across plans, as these factors typically varied greatly across plans in the past. In general, insured adults in California reported that they did not have difficulty in comparing their plan choices, but 38% found some aspect of plan choice—comparing services, comparing costs, and comparing providers— to be difficult (Figure 9 and Appendix Table A4). Insured adults in California were least likely to report difficulty comparing costs (versus providers or services) across plans (17%).

Figure 9: Views of Plan Selection Process Among Adults in California Who Chose a Health Plan

As enrollment numbers for particular plans are released and policymakers in California begin to assess plan choice among new enrollees, these findings can inform evaluations of plan choice under the ACA. While California has a concentrated private health insurance market, with six insurance carriers accounting for three-quarters of business, each offers a variety of plans to choose from. In Medi-Cal, not all enrollees have a choice of plans,77  and those that do have a choice face a limited number of standardized options. Still, people may face challenges in choosing among even limited options. While the ACA requires health plans in Covered California to provide a standard set of benefits and provide detailed information about what services are covered, which could make it easier for individuals to select a plan, it is important to bear in mind that, even before the ACA, insured adults faced some challenges in comparing and selecting insurance coverage. While provisions in the ACA could address these challenges, some are inherent to the complexity of insurance coverage. In particular, low-income adults who receive Medi-Cal may require assistance in navigating plan choices if they live in counties that have more than one plan, as provisions requiring comparable information on plans do not apply to Medi-Cal.

Further, contrary to expectations that people may opt for the lowest cost plan,78  survey findings indicate that Californians place value on a range of factors related to insurance, including scope of services and provider networks. Thus, assessments of whether people are choosing the optimal plan for themselves and their families will need to consider the multiple priorities that people balance in plan selection.

Overall, insured adults in California reported satisfaction with their current coverage but also reported gaps in covered services and problems when using their coverage.

Most insured adults in California reported high levels of satisfaction with their current coverage, but they also reported gaps in services that are covered by their current insurance. Eighty-five percent of insured adults in California rate their coverage as excellent or good (Figure 10). Adults with employer coverage gave plans high ratings, with 89% grading their plans as excellent or good. Adults with Medi-Cal or nongroup coverage were less likely to give their plans high ratings, but nearly three-quarters in each coverage group (74% and 73%, respectively) rated their plans as excellent or good.

Figure 10: Rating of Health Insurance Coverage among Insured Adults in California, by Type of Coverage

Despite the high ratings, notable shares of insured adults in California reported a problem with their plan. Specifically, one in five (20%) insured adults reported needing a service that is not covered by their current plan (Figure 11 and Appendix Table A5). People with Medi-Cal coverage (34%) or nongroup coverage (35%) are more likely to report that their plan does not cover certain services compared to those with employer coverage (14%). The most frequently reported services people say they need but lack coverage for are ancillary services, such as dental, vision care, and chiropractor services. In private health coverage, these ancillary services are often covered under stand-alone private insurance policies that must be purchased separately from health coverage, and in Medicaid, most are not federally-required benefits, but rather are covered at state option. Lack of coverage for adult dental services in Medicaid—the most frequently reported service needed but excluded from coverage—has been a longstanding issue facing beneficiaries and providers, despite a particularly high need among the low-income population.79  In SFY2010, California had eliminated most adult dental services in Medi-Cal due to budget restrictions,80  though the state plans to restore this benefit as of May 2014.81 

Figure 11: Problems with Current Coverage Among Insured Adults in California, by Type of Coverage

Insured adults in California also reported experiencing other problems with their insurance plans. Many insured adults reported facing a problem with their current insurance plan covering a specific benefit, either because they were denied coverage for a service they thought was covered (24%) or their out-of-pocket costs for a service were higher than they expected (35%). Some of these services may be over-the-counter products, which are excluded from the majority of insurance plans but which people may believe their plans should cover. Reports of these difficulties varied by insurance coverage. California adults with Medi-Cal or with nongroup coverage (both 36%) were more likely than those with employer coverage (20%) to report they were surprised that their plan would not cover a service they believed was covered. Pre-ACA, adults with Medi-Cal coverage had particularly high health needs, which could explain why they reported relatively high rates of problems. In contrast, the results for nongroup could reflect limits on coverage. Adults with Medi-Cal (25%) were less likely to report facing higher costs than expected than privately insured adults (35% among those employer coverage and 61% among those with nongroup). This pattern most likely reflects the nominal out of pocket costs Medi-Cal beneficiaries are required to pay compared to the high cost-sharing of many private plans.

Among the goals of the ACA was ensuring that the coverage people gained provided at least a basic level of coverage and that the Marketplaces helped people navigate their insurance coverage. Thus, new coverage must include a set of essential health benefits (EHB), and participating plans in Covered California must report information on claims payment policies, cost-sharing requirements, out-of-network policies, and enrollee rights in plain language. These provisions may address some of the problems that insured adults in California have experienced with their coverage in the past. However, many of the services that people report needing coverage for—such as dental services—are not included in the EHB. Many newly-insured Californians may be surprised to learn that some ancillary services are not included in their plan, and education efforts will be needed to make sure people understand their coverage. In addition, some uninsured people who gain coverage may need help with plan selection, having not navigated the process before. Despite these possible challenges, most insured people—even those who reported difficulties—are overall satisfied with their coverage.

Report: Iii. Gaining Coverage, Getting Care

How New Insurance Coverage Could Change How Californians Use Health Care

Uninsured adults in California generally do not seek or receive health care services at the same rate as insured adults, even when they have a need for care. Many uninsured adults have substantial health care needs that are not monitored by a physician. Cost is the main reason uninsured Californians do not receive care when needed, and many lack a regular provider to facilitate follow-up or ongoing care. When uninsured adults do receive care, they often have limited options. As coverage expands under the ACA, uninsured adults are likely to get care more frequently and establish relationships with providers. Patterns of care may shift, and providers may see an increase in patients who may have previously untreated or undiagnosed health care problems.

A large segment of the uninsured in California has little or no connection to the health care system.

While some uninsured adults in California did report receiving health care services, most reported few connections to the health care system. Only about half of uninsured adults in California (49%) report that they have a usual source of care, or a place to go when sick or need advice about their health (not counting the emergency room). Having a usual source of care is an indicator of being linked in to the health care system and having regular access to services. In comparison, nearly all insured adults in California —84% of those with employer coverage, 76% of those with nongroup coverage, and 73% of those with Medi-Cal coverage— have a usual source of care (Figure 12). In addition, uninsured adults in California are less likely to have a regular doctor at their usual source of care, with only about one-quarter (23%) of uninsured adults reported having a regular doctor, about one third the rate of insured adults. Notably, low-income uninsured adults in California are the least likely to have a usual source of care or a regular physician (Table 3).

Figure 12: Share of Adults in California with a Usual Source of Care or Regular Provider, by Insurance Coverage
Table 3: Share of Adults in California with Usual Source of Care or Regular Provider, by Income and Coverage
UninsuredInsured
EmployerNongroupMedi-Cal
Has a usual source of care^
All49%84%*76%*73%*
By Income
≤138% FPL50%64%*74%*
139-400% FPL50%81%*76%*71%*
>400% FPL89%76%
Has a regular provider at usual source of care^
All23%76%72%64%
By Income
≤138% FPL21%47%*65%*
139-400% FPL25%75%*69%61%*
>400% FPL82%73%
NOTES: Don’t Know and Refused responses not shown.”–“: Estimates with relative standard errors greater than 30% or unweighted cell sizes below 30 are not provided.3% of adults who report the emergency room as their regular source of care are reclassified as not having a usual source of care. Excludes people covered by other sources, such as Medicare, VA/CHAMPUS, or other state programs.*Estimate is statistically significantly different from uninsured estimate at the 95% confidence level.SOURCE: 2013 Kaiser Survey of Low-Income Americans and the ACA.

This lack of a connection to the health care system leads many uninsured adults in California to go without care. Nearly half of uninsured adults in California (49%) reported no health care visits—including hospital visits, doctor’s office or clinic visits, mental health services, or trips to the emergency room— in the past year, compared to 15% of Medi-Cal beneficiaries and 14% of adults with employer coverage (Figure 13). This pattern holds across all income groups. Of particular concern is the lack of preventive visits among uninsured Californians. One third (33%) of uninsured adults reported a preventive visit with a physician in the last year, compared to 75% of adults with employer coverage and 62% of adults with Medi-Cal (data not shown).

Figure 13: Receipt of Health Care Services by California Adults in the Last Year, by Insurance Coverage and Income

The survey findings reinforce conclusions based on prior research: having health insurance affects the way that people interact with the health care system, and people without insurance have poorer access to services than those with coverage.82 ,83 ,84  Thus, gaining coverage is likely to connect many currently uninsured adults in California to the health care system. However, outreach may be needed to link the newly-insured to a regular provider and help them establish a pattern of regular preventive care. In addition, resources may be needed to reach out to the remaining uninsured in California—including undocumented immigrants who are ineligible for coverage expansions—to link them to the health care system and help them obtain preventive and acute health care services.

Many uninsured Californians have health needs, many of which are unmet or are being met with difficulty.

Californians who lack health insurance still have health care needs. Nearly one-quarter (23%) of uninsured adults reported an ongoing health condition, compared to 32% with employer coverage and 55% with Medi-Cal (Figure 14). The lower percent of uninsured adults reporting an ongoing health condition, compared to those with insurance, may reflect lower rates of disease detection among this group due to their lack of access to primary and preventative care.85  In contrast, Medi-Cal beneficiaries are most likely to report having an ongoing health condition, which reflects Medi-Cal’s role in caring for people with substantial health needs, such as individuals with disabilities or people who become impoverished due to high health care expenses. These findings hold across income groups (Table 4). As low-income uninsured gain coverage under reform, Medi-Cal’s role will expand to include a broader scope of the adult population.

Figure 14: Share of Adults in California with an Ongoing Health Condition, by Insurance Coverage
Table 4: Health Status of California Adults, by Income and Coverage
UninsuredInsured
Employer CoverageNongroupMedi-Cal
Fair or Poor Overall HealthAll33%10%*19%*49%*
By Income
≤138% FPL38%16%*53%*
139-400% FPL30%16%*
>400% FPL7%
Fair or Poor Mental HealthAll15%6%*32%*
By Income
≤138% FPL18%32%
139-400% FPL12%6%
>400% FPL
Have ongoing health condition that needs to be monitored regularly or needs regular careAll23%32%*43%55%*
By Income
≤138% FPL23%21%58%*
139-400% FPL21%26%49%*47%*
>400% FPL37%
Take prescription medication on regular basis^All20%38%49%58%
By Income
≤138% FPL20%23%60%
139-400% FPL16%32%48%52%
>400% FPL44%
NOTES: Don’t Know and Refused responses not shown. Excludes people covered by other sources, such as Medicare, VA/CHAMPUS, or other state programs.”–“: Estimates with relative standard errors greater than 30% or unweighted cell sizes below 30 are not provided.Excludes birth control.*Estimate statistically significantly different from uninsured estimate at the 95% confidence level.SOURCE: 2013 Kaiser Survey of Low-Income Americans and the ACA.

While uninsured Californians with an ongoing health condition are more likely than those without to report receiving services (Figure 15), they are still less likely than their insured counterparts to receive care. While less than half (43%) of uninsured adults without an ongoing health condition say they received health care services in the last year, more than three-quarters (78%) of uninsured adults with a health condition received health care services. However, this rate is still lower than adults who have a health condition and have employer coverage, nongroup coverage, or Medi-Cal, nearly all of whom (99%, 98%, and 96%, respectively) reported receiving medical services over the course of the year.

Figure 15: Receipt of Health Care Services by California Adults in the Last Year, by Insurance Coverage and Health Status

When uninsured Californians do receive care, they sometimes receive free or reduced-cost care, though the majority does not. Among adults in California who reported that they received a health care service in the past year, 35% of uninsured adults in California reported receiving free or reduced cost care, versus just 3% of those with employer coverage (Figure 16). Notably, 43% of adults with Medi-Cal who received services reported that they received free or reduced cost care. They may have done so during a period of uninsurance in the previous year or may associate the fact that they pay little or no costs when they see a provider as receiving “free or reduced cost” care. Uninsured adults in California who received care were much more likely than their insured counterparts to be asked to pay up front for care: almost one-quarter (23%) reported being asked to pay for the full cost of medical care (not counting copayments) before they could see the doctor or provider, compared to just 11% of those with employer coverage and 9% of adults with Medi-Cal.  Again, adults with employer coverage or Medi-Cal may have experienced these issues during a period in the past year when they lacked coverage or when using a service not covered by their insurance.

Figure 16: Paying for Health Care Services by California Adults in the Last Year, by Insurance Coverage

Although some uninsured and insured adults in California reported receiving free or reduced cost health care services, a larger share reported an unmet need for care. More than four in ten (42%) of the uninsured and almost half (48%) of Medi-Cal beneficiaries in California reported needing but postponing care, compared to 29% of adults with employer coverage, and this pattern holds across income groups (Figure 17). The relatively high rate among Medicaid beneficiaries reflects higher need: when examining rates for only people without an ongoing health condition, uninsured adults reported the highest rates of unmet need and Medi-Cal adults reported rates similar to people with other coverage (data not shown).

Figure 17: Share of Adults in California with an Unmet Need for Care, by Insurance Coverage

The most common reason for postponing care among uninsured Californians is cost (78%). Adults with employer coverage (37%) or Medi-Cal (38%) are less likely to report cost as a reason for postponing care because presumably their insurance pays most or all of that cost (Figure 18). However, adults with Medi-Cal were more likely than other adults to report that they postponed care because they had difficulty traveling to the doctor’s office or clinic. These issues may reflect problems with provider participation in Medicaid, limits on Medicaid coverage of transportation services, or transportation barriers unique to the low-income population (such as not having a car). Low-income adults may also experience access challenges due to difficulty getting time off from work or obtaining childcare for the time when they are at the provider.

Figure 18: Reasons for Postponing Needed Care Among Adults in California, by Insurance Coverage

Given the health profile of currently uninsured adults in California, there is likely to be some pent-up demand for health care services among the newly-covered. Health systems may see increases in adults seeking care and will need to prepare for the newly insured. As people gain coverage under the ACA, the cost barriers to health care services will be reduced, but other barriers such as transportation or wait times for appointments may remain. Cuts to Medi-Cal payment rates, on top of already low rates and low provider participation, may pose a challenge for newly-insured low-income individuals’ ability to find a provider to treat them.86 ,87  In addition, it is important to bear in mind continuing access barriers among the population that remains uninsured under the ACA. As resources and attention shift to the newly-insured population, individuals left out of coverage expansions (such as undocumented immigrants) will continue to have health needs. The ACA included funds to expand service capacity in medically underserved areas, including expansion of community health centers, nurse-managed health centers, and school-based clinics. To meet the health care needs of both insured and uninsured individuals, it is important that these systems develop flexible treatment times and new models of care to accommodate people’s availability and expand capacity in areas where low-income individuals reside or seek care.

Many uninsured Californians reported limited options for receiving health care when they need it.

Uninsured adults in California are less likely than their insured counterparts to receive care in a private physician’s office. Only two in ten (21%) uninsured California adults who have a regular source of care reported that it is a physician’s office or HMO, compared to nearly three-quarters (74%) of adults with employer coverage and more than one third with Medi-Cal (36%)(Figure 19). Over half (52%) of uninsured adults in California who have a regular source of care reported clinics or health centers as their usual source of care, four times as high as adults with employer coverage (12%). Notably, 9% of uninsured adults in California reported the emergency room as their usual source of care – substantially higher than any other group, but lower than the rate for uninsured adults nationwide (data not shown).88 

Figure 19: Type of Place Used for Usual Source of Care for Adults in California, by Insurance Coverage

Uninsured and Medi-Cal adults in California are more likely than other adults to reported that they have limited options for their usual source of care. Among people with a usual source of care, 12% of the uninsured and 13% of Medi-Cal beneficiaries reported that they chose their usual source of care because it is the only option available to them, compared to 4% with employer coverage (Figure 20). Compared to adults with employer coverage, uninsured adults in California are also more likely to choose their usual source of care because it’s affordable and less likely to choose their site of care because of convenience. Both Medi-Cal adults and adults with employer coverage are more likely to choose a site of care based on the ability to see their preferred provider. Most of those who say they chose their usual source of care based on cost chose to go to a clinic or health center, reflecting the fact that these providers often have a mission to serve low-income populations and offer services with sliding scale fees.89 

Figure 20: Reason for Choosing Usual Source of Care for California Adults, by Insurance Coverage

Based on the experience of their insured counterparts, the uninsured in California may have more options for where to receive their care once they obtain coverage under the ACA. Specifically, as people gain insurance coverage, they may be less likely than those without coverage to choose a usual provider based on cost; thus, they may feel they have more options for where to receive their care. For adults covered by Medi-Cal, clinics and health centers are a leading source of care. These providers already see a large share of uninsured adults and may play an important role in serving this population even once they gain insurance. They will also continue to serve an important role in caring for the remaining uninsured population. Many of these providers offer services at reduced or sliding scale cost and will be the only option for people who have no insurance to help cover the cost of their care.

However, consumer preferences for site of care function against a backdrop of policy decisions that affect provider participation and capacity. For example, clinics and health centers’ ongoing role in serving the uninsured population—and people’s continuity of treatment— will depend in part on whether they are included in plan networks under both Medi-Cal and Covered California plans. Further, many Medi-Cal providers throughout the state are starting to face a 10% provider rate cut, and it will be important to monitor whether this provider rate cut negatively affects private provider participation in Medi-Cal and beneficiaries’ ability to see providers in this setting if they choose. It will also be important to evaluate whether efforts to expand capacity for primary and specialty services among safety net hospitals participating in DSRIP affects capacity and sites of care available to new and existing Medi-Cal beneficiaries.

Last, some Californians who have relied on emergency rooms or urgent care centers as their usual source of care may require help in establishing new patterns of care and navigating the primary care system. However, it may be possible to change health care usage patterns over time. A study of Health Care Coverage Initiative enrollees who were enrolled in a medical home from September 2007 to August 2010 found that, although emergency department usage increased initially, both emergency room visits and hospitalizations decreased over the three year study period, while primary care visits increased significantly.90 

Report: Iv. Health Coverage And Financial Security

How the ACA Might Affect Low- and Moderate- Income Californians’ Financial Situation

Low-income families in California face multiple financial challenges on a daily basis, but a major challenge is the cost of health care. Insurance provides some financial protection for many low-income adults in California, but many still struggle to pay their share of premiums or other costs associated with care. Low-income adults without coverage are particularly vulnerable, facing even more financial strain than their insured counterparts. Both insured and uninsured low-income adults in California struggle with medical bills and debt. Coverage expansions, assistance with premium costs, and limits on out-of-pocket costs under the ACA have the potential to ameliorate the financial issues associated with the cost of health care.

Health care costs pose a challenge for low- and moderate-income families in California, even if they have insurance coverage.

Health care accounts for a major budget item for low-income families, and affordability is a concern for many. Even among those with insurance, the cost of insurance itself can be a burden. Seven in ten adults in California with employer coverage (70%) say they pay at least some part of their premium (data not shown), and adults with nongroup coverage pay premiums directly to insurers themselves. Of adults in California who pay at least some portion of their premium, those with low and moderate incomes are most likely to report difficulty paying these costs (Figure 21). Forty-one percent of low-income (≤138% FPL) adults and 36% of moderate-income adults (139%-400% FPL) in California who pay a share of the premium for employer coverage reported that their share is somewhat hard or very hard for them to afford, compared to 22% of higher-income (>400% FPL) adults with this coverage. For California adults with nongroup coverage, the rates are higher, with 76% of moderate income adults reporting difficulty paying their premiums. Since most adults with employer coverage share the cost of the premium with their employer, it is not surprising that rates of difficulty are higher among those with nongroup coverage, who pay the entire cost themselves.

Figure 21: Difficulty Affording Health Insurance Premiums for Adults in California, by Insurance Coverage and Income

Health care costs translate to medical debt for many l0w-income adults. While one in five (21%) uninsured adults in California have outstanding medical bills, many insured California adults also reported high rates of medical bills that are unpaid or being paid off over time (Figure 22). For example, 15% of adults with employer coverage and 11% of adults with Medi-Cal coverage reported having medical debt.

People may report medical debt but not have a problem paying that debt. However, when asked directly whether they had problems paying medical bills in the past year, notable shares of uninsured adults (14%) and adults with Medi-Cal (9%) reported that they did (Figure 22).  In many cases, the problems people had paying medical bills were severe. Many reported that medical bills caused them to either use up all or most of their savings, have difficulty paying for necessities, borrow money, or be contacted by a collection agency.

Figure 22: Medical Debt and Problems with Medical Bills Among Adults in California, by Insurance Coverage

In addition to many low-income adults in California reporting that they experienced financial strain or difficulty with health care costs, many live with worry about their ability to afford costs in the future. The vast majority of uninsured California adults across all income groups reported that they lack confidence that they can afford either the cost of care for services they typically require (Figure 23) or the cost of care should they face a major illness (Figure 24). While not surprising, this finding indicates that uninsured adults in California are aware of the high cost of health care services, as even those with moderate or high incomes do not believe they can afford these costs.

Figure 23: Lack of Confidence Among California Adults in Affording Usual Health Care Costs, by Insurance Coverage and Income
Figure 24: Lack of Confidence Among California Adults in Affording Major Illness, by Insurance Coverage and Income

One role of insurance coverage is to protect people against these costs, particularly unexpected costs related to major illnesses or accidents. However, notable shares of low-income insured California adults reported that they lack confidence in their ability to afford health care, given their current finances and health insurance situations. Nearly half of adults with Medi-Cal coverage reported lack of confidence in affording usual costs and over half reported lack of confidence in affording costs for a major illness; these findings appears to be driven by higher need among Medi-Cal beneficiaries (as those with disabilities reported particularly high rates) or worry about keeping coverage (as those who had problems with renewal also reported high rates) (data not shown). Of particular note is the finding that 45% of low-income adults in California with employer coverage do not feel confident that they could afford costs related to a major illness given their coverage and financial situation. Lack of confidence may reflect worry about affording out-of-pocket costs or concerns over limits on coverage.

Affordability provisions in the ACA may ameliorate some of the challenges that low-income insured Californians face in affording care. Under the law, qualified health plans must cover preventive services with no cost sharing and are prohibited from placing annual or lifetime caps on the dollar value of insurance coverage. In addition, plans may not exclude coverage for pre-existing conditions, which often were excluded from nongroup plans in the past and may have led to high out-of-pocket costs for insured individuals. Last, Californians who purchase coverage through Covered California and have incomes up to 400% FPL receive tax credits to help them pay for their premiums, and those with incomes up to 250% FPL also receive subsidies to help with cost sharing under their plans. As was the case in the past, people covered by Medi-Cal do not pay premiums and face only nominal cost sharing for services. However, given survey findings that many low-income insured people continue to face financial challenges related to health care, people may perceive even limited out-of-pocket costs to be unaffordable. It will be important to track whether there are ongoing financial barriers as people enroll in coverage and seek care.

Low-income families face fragile financial circumstances.

As discussed above, low-income California adults across coverage groups experience difficulty or worry about paying for health care. These challenges translate to expenses in other areas as well, and low- and moderate-income adults across coverage groups reported not being financially secure. However, adults in California who are low-income and uninsured or covered by Medi-Cal are particularly vulnerable to financial insecurity even outside of health care.  Among the low-income, uninsured adults are much more likely than adults with employer coverage to report that they feel generally financially insecure (Figure 25). Notably, adults with Medi-Cal coverage reported rates of financial insecurity closer to those of their uninsured counterparts. This pattern may reflect pre-ACA Medi-Cal eligibility rules, which targeted very vulnerable adults, such as poor adults with disabilities.

Figure 25: Overall Financial Insecurity of California Adults, by Insurance Coverage and Income

General financial insecurity translates to concrete financial difficulties in making ends meet. Uninsured adults and those on Medi-Cal are more likely than privately-insured adults (those with employer coverage or nongroup) to have difficulty paying for other necessities, such as food, housing, or utilities, with 59% and 66%, respectively, reporting such difficulty, compared to 18% of those with employer coverage and 31% of those with nongroup coverage (Table 5). While low-income adults (≤138% FPL) in California across the coverage spectrum reported high rates of difficulty paying for necessities, those with employer coverage reported the lowest rates in this income group. These individuals may have the stronger or more stable ties to employment than their counterparts with other or no insurance coverage. A similar pattern holds for people’s ability to get ahead financially, either saving money or paying off debt.

While similarly high levels of adults across income and coverage groups reported that they have taken on debt or taken money out of their savings to pay bills in the past year (Table 5), uninsured adults in California are more likely than their insured counterparts to report changing their living situation or postponing marriage or children for financial reasons.

Table 5: Financial Difficulty Among Adults in California, by Income and Coverage
 Uninsured Insured
 EmployerNongroupMedi-Cal
Has difficulty paying for necessities      
All59% 18%*31%*66%
By Income     
≤138% FPL69% 40%*70%
139-400% FPL54% 25%*48%
>400% FPL 
      
Has difficulty saving money      
All80% 51%*63%*83%
By Income     
≤138% FPL84% 56%*84%
139-400% FPL77% 61%*67%77%
>400% FPL 45%
      
Has difficulty paying off debt       
All57% 29%*34%*59%
By Income     
≤138% FPL58% 38%*62%
139-400% FPL57% 38%*52%
>400% FPL 23%
      
Taken on debt or took money out of savings to pay bills     
All44% 40%50%39%
By Income     
≤138% FPL39% 35%39%
139-400% FPL54% 53%59%
>400% FPL 33%
      
Changed living situation or postponed marriage/children for financial reasons     
All35% 15%*21%*31%
By Income     
≤138% FPL34% 29%32%
139-400% FPL39% 23%
>400% FPL 8%
NOTES: “–“: Estimates with relative standard errors greater than 30% or unweighted cell sizes below 30 are not provided. Excludes people covered by other sources, such as Medicare, VA/CHAMPUS, or other state programs. *Estimate statistically significantly different from uninsured estimate at the 95% confidence level. SOURCE: 2013 Kaiser Survey of Low-Income Americans and the ACA.

Though it is not surprising that many low-income families are in a precarious financial situation, it is notable that low-income adults who lack insurance coverage or who were covered by Medi-Cal before the ACA are more financially unstable than their privately-insured counterparts. Historically, Medi-Cal coverage for adults was targeted to those with the greatest need, and this role is reflected in the fact that they face similar financial challenges as their uninsured counterparts. While insurance coverage can provide financial protection in the event of illness or injury, it is not curative of all of the financial burdens faced by low-income families. Given their overall situation, health insurance alone may not lift low-income people out of poverty, and many low-income adults may continue to face financial challenges even after gaining coverage. However, gains in coverage under the ACA may address some of the consequences of financial instability among low-income families, and linking low-income adults with other support systems may help address the broader financial challenges that they face.

Report: V. Poised At The Starting Line

Low- and Moderate-income Uninsured California Adults’ Readiness for the ACA

Low- and moderate-income adults in California are the main targets of the ACA expansions, but prior to the start of open enrollment, many remained unaware of their coverage options under the law. Further, while there were well-documented technical problems with initial enrollment efforts, some uninsured adults may face additional challenges in signing up for coverage, as they lack basic tools needed for this process such as internet access or bank accounts. Outreach and enrollment will be crucial to the ultimate success of the ACA in expanding coverage, yet many uninsured adults in California have limited connection to potential outreach avenues. Past experience demonstrates that both broad and targeted outreach efforts and direct one-on-one enrollment assistance will be key for successful enrollment.91 

A majority of uninsured adults in California who are income eligible for coverage expansions reported knowing little or nothing about Medi-Cal and Covered California prior to the start of open enrollment.

Despite ongoing media attention to the ACA, most uninsured adults in California who are likely eligible for coverage under the law[endnote 102614-17] reported that they knew little about either Medi-Cal or Covered California prior to the start of open enrollment. More than three-quarters (76%) of uninsured adults in California with incomes in the Medi-Cal target range (≤138% of poverty) say they knew nothing at all or only a little about their state’s Medi-Cal program, and five out of six (84%) of uninsured California adults in the income range for Covered California subsidies (139-400% of poverty) reported that they knew nothing at all or only a little about Covered California (Appendix Table A6). While these shares are fairly constant across coverage categories, they point to the need for substantial outreach and education efforts among the target population for coverage expansions. Recent media attention to the challenges faced in initial enrollment efforts has likely increased awareness of coverage options; however, it is not clear to what extent media attention has translated to understanding of what is available and how to enroll, or discouraged attempts to enroll. More recent national polling data indicates that nearly half of the nonelderly uninsured of all incomes were not aware that the law provides help to low- and moderate-income Americans to help them purchase coverage, and two-thirds of nonelderly uninsured (all incomes) say they don’t have enough information to understand how the law will impact their families, a share that has been fairly consistent since Fall 2013.92 

While most uninsured adults in California have the necessary tools for enrolling in coverage, some will experience additional logistical issues in signing up.

Under the ACA, online applications through the California Healthcare Eligibility, Enrollment and Retention System (CalHEERS) portal are the primary mode for signing up for coverage in Covered California; in addition, California is required to accept online applications for Medi-Cal (in addition to paper, phone, and in-person applications), and many people who are eligible for Medi-Cal may first apply for coverage through the Covered California web site. Thus, internet access is an important tool in accessing coverage under the law. While the majority of uninsured adults in California have access to the internet either at or outside the home (Figure 26), 27% of low-income (≤138% FPL) and 13% of moderate income (139-400% FPL) uninsured adults in California reported that they do not have internet access readily available. Further, some people who reported having internet access may be using their mobile devices for access, but currently Covered California is not configured to allow for application via mobile device. Californians without internet access may be able to enroll through other more traditional avenues, such as county offices or providers, but efforts may be needed to inform people about these other application routes, and some using them may experience a slower enrollment process than if they applied online.

Figure 26: Access to Tools Need to Enroll in and Pay for Coverage Among Uninsured Adults in California, by Income

Once people are enrolled in coverage, those in Covered California coverage will require a means to pay their premiums on a regular basis. While plans must accept various forms of payment,93  direct withdrawal from a checking account is a simple and reliable way to ensure that premiums are paid on time. However, over a fifth (21%) of uninsured adults in California in the income range for Covered California subsidies (139-400% FPL) and one in seven (14%) of uninsured adults in California who could gain unsubsidized coverage through Covered California reported that they do not have a checking or savings account. These “unbanked” uninsured adults in California may face some logistical barriers to paying premiums that those who can use direct withdrawal do not.

Many uninsured adults in California could be reached through targeted outreach avenues.

Across the state, a variety of outreach and enrollment efforts are underway to help connect eligible people to coverage, ranging from broad marketing and media campaigns to direct one-on-one assistance. Moreover, a wide array of groups and individuals are involved in outreach and enrollment, including community-based organizations, providers, health centers, and faith-based groups.94  As mentioned earlier, many groups will require targeted outreach to be informed of new coverage options under the ACA.

States are also utilizing new “fast track enrollment” opportunities to efficiently enroll large numbers of eligible individuals in their Medicaid programs.95  Specifically, CMS offered states the opportunity to facilitate enrollment of eligible people into Medicaid by using data already available to states through the Supplemental Nutritional Assistance Program (known in California as CalFresh) and children’s eligibility data for Medicaid (Medi-Cal) and the Children’s Health Insurance Program (in California, formerly Healthy Families, now Medi-Cal). Experiences in states that have already launched these strategies indicate they can be highly successful in connecting people to coverage, reaching a significant share of adults eligible for the Medicaid expansion while minimizing burdens for both individuals and eligibility staff.96 

California recently received approval for these fast track enrollment strategies, which will allow the state to utilize data from CalFresh and its children’s eligibility data from Medi-Cal to facilitate enrollment of eligible individuals.97  Survey findings indicate these efforts are a promising avenue for outreach in the state. Among uninsured adults in California with incomes in the range for Medi-Cal eligibility (≤138% FPL), half reported that they or someone in their immediate family receives CalFresh, cash assistance, disability payments, or Medi-Cal, or Healthy Families (Figure 27). After Medi-Cal or Healthy Families (32%), CalFresh is the most common connection to social services programs among the low-income uninsured (25%). These programs already have much of the information needed to determine eligibility for Medi-Cal under the ACA, such as income, residence, and family structure, and could provide an efficient route to enrolling the uninsured in coverage. While lower shares of moderate-income uninsured adults in California reported a connection to a social service program, outreach to this group of uninsured adults could also reach many eligible for coverage. Successful outreach and “inreach” strategies involving service providers and advocacy groups during LIHP enrollment may be useful for reaching individuals for and Medi-Cal enrollment.98  However, prior barriers to Medi-Cal and LIHP enrollment efforts, including language and cultural barriers, immigration status, and misconceptions about the programs, may continue to be challenges during the current and future enrollment efforts.
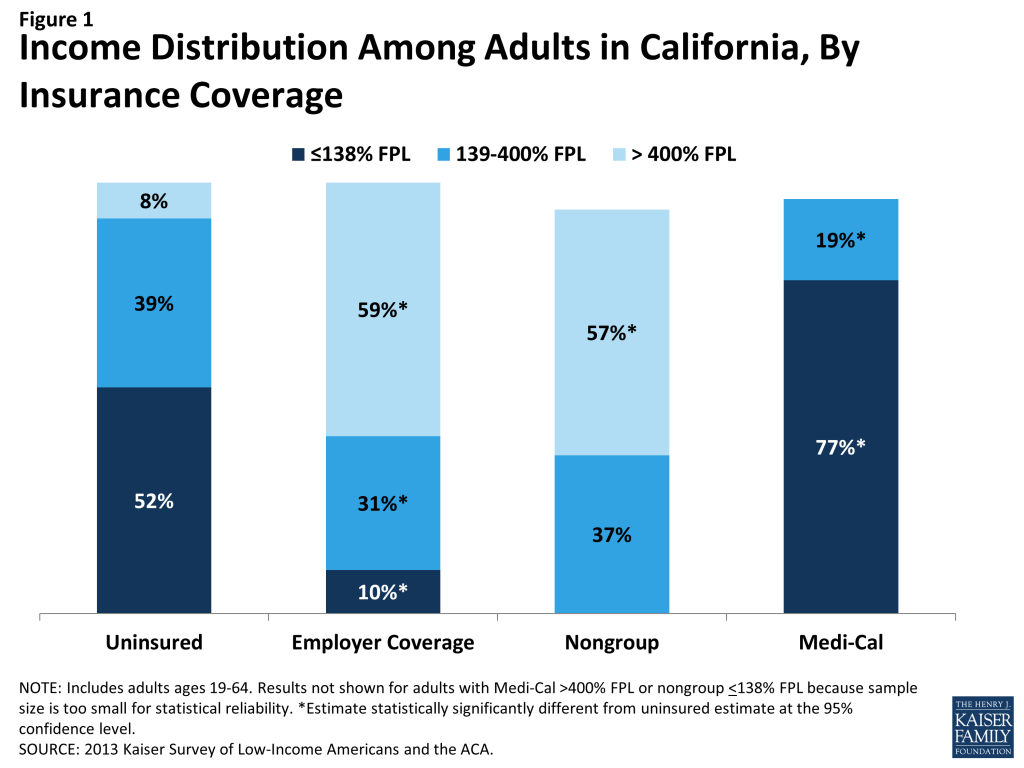
Figure 27: Connection to Other Social Service Programs Among Uninsured Adults in California, by Income

For those without a connection to social services agencies, outreach through providers may be an important approach. Many community health centers or hospitals and health systems are very involved with outreach and enrollment efforts, sometimes having enrollment workers in-house to help patients with ACA enrollment. California clinics are a promising outreach location, as one in four low- or moderate-income uninsured adults reported that they use a clinic or health center as their usual source of care (Figure 28). California health care centers are already acting on these opportunities: in May 2013, 125 health centers in California received $25 million in federal funding to help with ACA enrollment,99  and clinics and health centers are taking an active role in “inreach” to their patient populations.100 

Figure 28: Connection to Potential Provider-Based Outreach Among Uninsured Adults in California, by Income

Hospitals are another effective place to reach uninsured individuals, since at least one in seven low- or moderate-income adults in California reported visiting a hospital in the past year for either emergency services or for inpatient or outpatient care. Under the ACA, hospitals are permitted to immediately enroll uninsured individuals (via a simplified online application) temporarily into Medicaid during their hospital stay, if they are presumed to be eligible for the program.101  California developed a Hospital Presumptive Eligibility program to reach out to people through emergency rooms, and the program went into effect on January 1, 2014.102  The Department of Health Care Services has made forms and resources for interested and participating providers available on their website,103  and the federal government has released additional information to assist with the implementation of presumptive eligibility.104  Patients who seek episodic care in emergency rooms or hospitals may be receptive to outreach efforts, as they have a demonstrated need for services and are likely to face high bills if they remain uninsured; however, outreach workers may be challenged to engage individuals in the application process at a time when they are seeking services for an urgent or acute problem.105  Additionally, undocumented immigrants, who also may seek episodic care in hospitals, are eligible for emergency, but not full scope Medi-Cal services, including pregnancy-related care.106  While outreach to undocumented individuals via hospital programs may cover the cost of their emergency visit, these individuals will still be left without an ongoing source of coverage.

Conclusion & Policy Implications

Conclusion & Policy Implications

The survey findings related to: i) patterns of insurance coverage, ii) the process of enrolling in and choosing health coverage, iii) interactions with the health care system, iv) financial security, and v) readiness for ACA coverage expansions have implications for early implementation of the ACA in California. Uninsured adults in California are generally in low-income, working families and have lacked insurance coverage for quite some time. Many have substantial health care needs but have only loose ties to the health system. Uninsured adults in California are also disproportionately Hispanic, and many may be ineligible for ACA assistance due to their immigration status. Below, we summarize how this pre-ACA baseline data can inform outreach and enrollment, plan selection and scope of coverage, and providers and health systems.

Reaching Eligible Uninsured Adults

Outreach and enrollment will be an ongoing process. While there is much focus on the initial push to enroll people in coverage under the ACA, enrollment is not a “one shot” effort that will be completed in the first few months of implementation. The survey findings reveal that millions of Californians lose and gain coverage throughout the year because of job changes, income fluctuations, or problems at renewal. Thus, implementing the ACA will require ongoing efforts to enroll and keep people in coverage, and efforts to promote coverage stability are important. There have already been substantial investments in outreach and education in California, including statewide marketing campaigns, community mobilization to reach people at the local level, provider training, outreach to transition people from LIHP coverage to Medi-Cal, and targeted efforts to reach vulnerable populations who may be newly-eligible for Medi-Cal.107  Many of these initiatives include funding through 2014 and beyond, and it will be important to sustain efforts throughout 2014 and in future years to reach people who have a need for ACA coverage in the future. As more people are enrolled in coverage under the ACA, the focus of these efforts may also shift from initial enrollment to ensuring continuous, stable coverage.

Some eligible uninsured adults in California have little or no connection to pre-ACA health or social services systems and may be hard to reach. Many people targeted for coverage expansions are not currently connected to the health care system, have been outside the health insurance system for quite some time, or are not linked to social services programs. The survey shows that nearly half of uninsured adults have lacked coverage for five years or longer, most do not have a regular source of care, and many have no health care visits over the course of a year. Further, while many low-income (≤138% FPL) uninsured California adults have a family connection to a social services program, the majority of moderate-income (139-400% FPL) uninsured adults do not. Efforts in California to reach individuals through community mobilization, fast-track enrollment, and provider outreach are a promising approach to reach the notable shares of uninsured adults who have ties to health systems, social services, or community groups. However, marketing campaigns are also important avenues for reaching the “unconnected” uninsured, and it will be important to focus them on both people who may be eligible for Covered California and those eligible for Medi-Cal.

Many eligible uninsured adults in California have experience with pre-ACA health care, health insurance, or social services systems, but there is great need for continued education about new coverage options. Some people targeted for coverage expansions have experience with the health care system and health insurance but may be unaware that eligibility and costs have changed under the ACA. Despite some early outreach and enrollment efforts in the state, notable shares reported in the survey that they were unaware of new coverage options at the start of open enrollment. Further, many reported pre-ACA experiences of trying to get coverage and encountering cost or eligibility barriers. It will be important for outreach messages to emphasize how coverage options have changed in order to reach out to people who have tried to apply for coverage in the past. The state’s plan to reach people through “fast track” enrollment108  may be particularly fruitful for reaching low-income uninsured Californians, as these approaches require limited paperwork and reach people with known eligibility.

Connecting People to Suitable Coverage

In addition to technical issues with the Covered California website, it will be important to monitor whether other challenges in enrolling in health coverage that existed prior to the ACA are addressed by ACA simplification provisions. Policymakers have made strides in addressing many of the website glitches that plagued early enrollment efforts under the ACA, and they continue to focus attention on addressing these technical issues. However, there are other challenges to enrolling in coverage and picking a plan that policymakers may still need to address. Survey results indicate that, before the ACA, some insured Californians reported challenges in compiling required paperwork to apply for Medi-Cal. Adults also reported challenges with the next stage of enrollment: comparing plan information to choose a plan. While Medi-Cal enrollees have more limited choices and face standardized plans, they were more likely than adults with other types of coverage to report challenges in selecting a plan. The ACA includes provisions to simplify the application process for Medi-Cal and to ease the plan selection process for people purchasing coverage through Covered California. The ACA also provides for enrollment assistance for people applying to both Covered California and Medi-Cal, and the state is using a wide range of entities—including community groups, schools, health care providers, insurance brokers, unions, and other organizations—to provide one-on-one assistance to applicants. Further, LIHP enrollees across the state are being automatically transitioned to new coverage under the ACA, primarily Medi-Cal. Additional technical support may be needed to assist with transferring data from the county to state level, and additional education and training may be needed to help beneficiaries and providers understand changes to coverage as a result of the transition.109  While it is still early to evaluate the success or challenges of these efforts, it will be important to track implementation of these simplifications to ensure that challenges that some people faced in the past do not carry over to ACA enrollment.

Early assessments of plan choice under the ACA may account for the fact that cost is only one factor in Californians’ preferences for health coverage. Much focus in early coverage of ACA enrollment has been on the premiums and deductibles that people will face under their new coverage. These features provide concrete measures that people can examine, and certainly costs are a key concern for new enrollees. However, the survey shows that Californians also value other aspects of their coverage, such as benefits and networks, sometimes even more than low out-of-pocket costs. Future evaluations of coverage, therefore, may consider how well new plans are meeting the full range of priorities and preferences for health coverage, and future changes to plan offerings under the law may consider the broad range of people’s priorities for their coverage.

Even once Californians have insurance, they may face issues with their plans covering the range and scope of services they need. Survey findings reveal that the vast majority of enrollees in various types of coverage reported being satisfied with their plan, but notable shares reported a problem with their scope of coverage. Many adults on Medi-Cal reported needing coverage for dental services that are not included in their plan, and Californians with private coverage also reported gaps in ancillary services. New Medi-Cal enrollees in California will receive the same benefits as currently-enrolled adults, and while the state plans to reinstate coverage of dental services, it will be important to monitor access to this and other ancillary services.  In addition, while people gaining coverage under Medi-Cal and Covered California will receive coverage for essential health benefits, it will be important to assess whether the scope of coverage Californians have under the law meets their needs and work to educate people about both what is and what is not included in their coverage.

While the ACA could ameliorate the financial burden of health care for many, affordability of health services may remain a challenge. In addition to the goal of facilitating access to health care services, a goal of coverage expansions is to provide financial protection from medical expenses. As survey findings show, even among Californians who have insurance, health care costs can be a challenge. Though less likely than their uninsured counterparts to have difficulties with medical costs, low-income insured adults in California reported challenges in paying premiums, copayments, out-of-pocket costs for uncovered services, and other health care expenses. In addition, all low-income families, regardless of insurance coverage, face financial hardship in making ends meet. While affordability provisions in the ACA may address some of the challenges that low-income insured individuals face in affording medical care, it will be important to track ongoing financial barriers and financial instability even among those who have coverage. Early evaluation of premiums for plans in Covered California indicates that, for a 40-year old at 250% FPL, subsidized premiums in California for the second-lowest cost silver plan ($193/month) and the lowest-cost bronze plan ($125/month) are at the median of plans analyzed across states.110  Ongoing efforts may assess people’s other out-of-pocket costs and affordability of these expenses.

Adapting the Health System and Patterns of Care to Meet New Needs

Based on demonstrated need and barriers to care among the uninsured in California prior to the ACA, health care providers may see increases in California adults seeking care. Ultimately, the goal of coverage expansions under the ACA is to help people access needed health care services. Thus, once people gain coverage, providers and health systems will need to be prepared to serve newly insured people. Survey findings reinforce conclusions from prior research that gaining health coverage is likely to alter the way that people interact with the health system. Compared to their insured counterparts, uninsured California adults face barriers to care, despite many having a demonstrated need. Some uninsured California adults have ongoing health conditions yet still are not receiving regular care, and others have postponed preventive or other services, primarily due to cost. These findings indicate that there is likely to be some pent-up demand for health care services among California’s newly-covered. However, survey findings indicate that barriers to seeking care, such as difficulty traveling to a provider’s office, may continue to persist among insured adults, particularly Medi-Cal beneficiaries. Outreach and education may be needed to link the newly-insured to a regular provider and help them establish a pattern of regular preventive care. In addition, efforts to ensure access to care for low-income adults with coverage, such as Medi-Cal, will be important to continue.

Changes in insurance coverage may lead people to use new or different providers, but clinics and health centers will continue to serve many of California’s vulnerable populations. Many are concerned about shifting patterns of care under the ACA, as changes where people receive care may alter revenue streams for providers. The effect of changing revenue streams for different types of providers is unclear at this point. Based on the survey findings, uninsured Californians are likely to have more options for where to receive their care once they obtain coverage under the ACA. Compared to their insured counterparts, prior to the ACA, they were more likely to seek care in clinics and to report that finances drove their decisions about where to seek care. As people gain Medi-Cal or Covered California coverage, they may shift their service locations to more closely resemble that of people who had Medi-Cal or private coverage prior to the ACA, respectively. Clinics and health centers are likely to continue to see a substantial share of the low-income population, and these providers also may continue to see high levels of the uninsured. As markets evolve in the wake of ACA coverage changes, these providers may be strained to meet demand in the face of shrinking resources.111 

As implementation unfolds, California providers may continue to be on the front lines of not only service delivery but also outreach and enrollment. Providers are one avenue that policymakers are using to reach out to uninsured adults who may be eligible for coverage expansions under the ACA. Survey findings indicate that emergency rooms and hospitals may be promising avenues for reaching eligible individuals who have episodic interactions with the health system, and community health centers can reach a share of the uninsured who use them for ongoing care. California is already acting on these opportunities: clinics and health centers are taking an active role enrollment, including in “inreach” to their patient populations,112  and the state’s hospital presumptive eligibility program may reach many people who find themselves in need of hospital services.

Moving Forward in ACA Implementation

As enrollment in new coverage options grows and people begin to use their coverage, survey findings point to several issues that can inform ongoing efforts to implement the ACA. Future reports using the 2013 Kaiser Survey of Low-Income Americans and the ACA will continue to delve into these issues and provide state-specific findings, and future surveys can assess whether and how coverage, access, and family finances change under the law.

Methods

This report is based on findings from the California component of the 2013 Kaiser Survey of Low-Income Americans and the ACA. This survey, conducted by the Kaiser Family Foundation (KFF) and funded by the Blue Shield of California Foundation (BSCF), examines health insurance coverage, health care use and barriers to care, and financial security among insured and uninsured adults across the income spectrum, with a focus on populations targeted for coverage expansions under the Affordable Care Act (ACA). The survey provides a baseline against which future surveys can assess the impact of the ACA on low- and moderate-income adults. The 2013 Kaiser Survey of Low-Income Americans and the ACA includes a national sample as well as three state-specific samples in California (conducted with support BSCF), Missouri (conducted with support from the Missouri Foundation for Health (MFH)), and Texas.

The survey was designed and analyzed by researchers at KFF, with feedback on the California and Missouri state-specific components from BSCF and MFH, respectively. Social Science Research Solutions (SSRS) collaborated with KFF researchers on sample design and weighting; SSRS also supervised the fieldwork.

The survey was conducted by telephone from July 24 through September 29, 2013, from a representative random sample of California residents between the ages of 19-64. In total, 2,558 interviews were completed with respondents living in California. Computer-assisted telephone interviews (CATI) conducted by landline (1,274) and cell phone (1,284) were carried out in English and Spanish by SSRS.

Because the study was designed to focus on the low-income population, the sample was designed to over-sample this group. To efficiently reach lower-income respondents, the sample was stratified based on the estimated income level of geographic areas within the state. This process was done separately for the landline and cell phone sampling frames. For the landline sample, strata were defined based on the median income within telephone exchanges; for the cell phone sample, strata were defined based on the household income associated with the billing rate-center to which the cell phone number is linked. The exact criteria for distinguishing between the strata varied from state to state. In addition, a small number of interviews (<1% of the total sample) were conducted with respondents who were previously interviewed by SSRS as part of omnibus surveys of the general public and indicated they were ages 19-64, resided in the state, and reported annual income of less than $25,000. These previous surveys were conducted with nationally representative, random-digit-dial landline and cell phone samples.

Screening for the survey involved verifying that the respondent (or another member of the household for the landline sample) met the criteria of:  1) being 19-64 years old; and 2) providing income information that allowed them to be classified by family income. Respondents were classified by family income as a share of the federal poverty level (FPL) based on their family size and total annual gross income.[endnote 102702-7] Poverty level groups included income ≤138% of FPL (the income range for the Medi-Cal expansion), income of 139-400% FPL (the income range for Covered California tax credits), and income of over 400% FPL (eligible only for unsubsidized coverage). For the landline sample, if two or more people met the criteria, a respondent was randomly selected by the CATI program.  Selected respondents were asked to confirm their state of residence.

A multi-stage weighting approach was applied to ensure an accurate representation of the various income groups ages 19 to 64. The weighting process involved corrections for sample design as well as sample weighting to match known demographics of the target populations in order to correct for systematic non-response along these parameters.  The base weight accounted for the oversamples used in the sample design, as well as the likelihood of non-response for the re-contact sample, number of eligible household members for the landline sample, and a correction to account for the fact that respondents with both a landline and cell phone have a higher probability of selection. Demographic weighting parameters were based on population estimates for the 19-64 year old poverty-level population in the state based on the U.S. Census Bureau’s 2011 American Community Survey (ACS). The weighting parameters for each poverty-level group were: age, education, race/ethnicity, presence of own child in the household, marital status, region, and phone-status. All statistical tests of significance account for the effect of weighting.

The number of respondents and margin of sampling error (including the design effect) for the entire California sample and for subgroups based on income are shown in Table A. For results based on other subgroups, the margin of sampling error may be higher. Sample sizes and margin of sampling errors for other subgroups are available by request. In reporting results, any estimate with a relative standard error (standard error divided by the point estimate) greater than 30 percent or based on an unweighted cell size less than 30 is considered unreliable and not reported. Note that sampling error is only one of many potential sources of error in this or any other survey.

Table A: Number of Respondents and Margin of Sampling Error for California Sample
NMargin of Sampling Error
California Total2,558+/- 3 percentage points
≤138% FPL1,020+/- 5 percentage points
139% – 400% FPL1,007+/- 5 percentage points
>400% FPL531+/- 6 percentage points

In analyzing results, we group respondents into mutually exclusive insurance categories of: Uninsured (report that they are not covered by health insurance), Employer Coverage (report that they have a plan through their own employer, a spouse’s employer, or a parent’s employer), nongroup Coverage (report that they purchase their coverage themselves, and Medi-Cal (including people who are dually eligible for Medicare coverage). In capturing Medi-Cal coverage, the state-specific program name was used. A small number of people report that they are covered by other sources, including Medicare (<3%), a government program besides Medi-Cal or Medicare (<3%), or some other source such as the VA, school-based coverage, or an unnamed source (<1%). We do not report results for people covered by these other coverage categories, as sample sizes were generally too small for reliable estimates.

Because eligibility for two of the law’s main coverage provisions– the Medi-Cal expansion and tax credits to purchase insurance through Covered California– is based on an individual’s family income relative to the federal poverty level (FPL), in most cases we report survey results by FPL categories that match eligibility levels under the ACA. These categories are 1) those with incomes 138% FPL or less (roughly $32,000 a year for a family of 4), the income range for the Medi-Cal expansion; 2) those with incomes of 139 to 400% FPL (roughly $32,000-$94,000 for a family of 4), the income range for tax credits in the Covered California Marketplace; and 3) those with incomes above 400% FPL, who are not be eligible for financial assistance in gaining coverage. This classification is not intended to fully capture eligibility, as not everyone in these income ranges will be eligible for coverage under the ACA. For example, undocumented immigrants are ineligible for coverage under the ACA, and recent legal immigrants cannot receive Medi-Cal coverage (though they can purchase subsidized coverage through Covered California). In addition, some people may be ineligible for premium subsidies through Covered California because they have access to affordable employer coverage. However, the income categories provide a picture of the population targeted by various expansions, rather than a picture of the specific population eligible under the law.

For results that examine the uninsured population’s readiness for the ACA (Section V), we exclude individuals who are undocumented immigrants, as this group is ineligible for any coverage under the ACA. We define undocumented immigrants as those who reported 1) they were born outside the United States, 2) are not a citizen, 3) did not have a green card when they arrived in the United States, and 4) have not received a green card or become a permanent resident since arriving. This measure may be subject to error in several ways. First, it relies on self-reporting, and respondents have an incentive not to reveal unlawful immigration status. Second, those that did not answer all questions in the series of immigration status items (41 respondents) were not able to be categorized and were therefore included; if they are in fact undocumented, then the results may differ slightly. Third, a small number of people may have a legal status besides permanent residency or green card (such as refugees, asylees or other humanitarian immigrants). Unfortunately, due to time constraints, the survey was not able to fully explore all of these immigration pathways.

This report includes analysis of findings from the survey that may inform early challenges in implementing health reform. It does not include a full reporting of all the findings from the survey. Survey toplines with overall frequencies for all items in the questionnaire are available upon request.

Appendix: Additional Tables

Table A1: Demographics of Adults in California, by Insurance Coverage
UninsuredInsured
EmployerNongroupMedi-Cal
Income
≤138% FPL52%10%*78%*
139-400% FPL39%31%*37%19%*
>400% FPL8%59%*
Family Work Status
Working Family71%90%*72%*36%*
Non-Working Family29%10%*64%*
Age
19-2517%11%*
26-3428%18%*18%*
35-4422%26%23%
45-6433%44%*66%*48%*
Health Status
Ongoing Health Condition23%32%*43%*55%*
No Ongoing Health Condition75%68%57%*45%*
Fair or Poor Health Status
Excellent/Very Good/Good67%90%*82%*51%*
Fair or Poor33%10%*49%*
Race
White, Non-Hispanic26%50%*56%*33%
Hispanic52%26%*43%*
Black, Non-Hispanic5%
Asian/Pacific Islander13%
American Indian Alaska Native
Other/DK, Non-Hispanic6%
Citizenship
Citizen64%89%*92%*80%*
Non-Citizen36%10%*20%*
NOTES: Don’t Know and Refused responses not shown. Excludes people covered by other sources, such as Medicare, VA/CHAMPUS, or other state programs. NA: Not applicable”–“: Estimates with relative standard errors greater than 30% or unweighted cell sizes below 30 are not provided.* Estimate statistically significantly different from uninsured estimate at the 95% confidence level.SOURCE: 2013 Kaiser Survey of Low-Income Americans and the ACA.
Table A2: History of Uninsurance and Attempts to Gain Coverage Among Currently Uninsured Adults in California, by Income
AllBy Income
≤138% FPL139-400% FPL
Length of Time Uninsured
< 3 months7%
3 Months to Less than a Year10%8%11%
1 Year to 5 years33%34%31%
5 Years or More28%26%31%
Have Never Had Coverage22%25%21%
Attempts to Gain Coverage
Applied for Medi-Cal in past 5 years24%28%18%^
Applied for Medi-Cal but did not enroll15%17%12%
Applied for Medi-Cal but told ineligible12%14%10%
Tried to purchase nongroup coverage in past 5 years17%12%22%^
Tried to purchase nongroup coverage but did not purchase policy12%8%17%^
Tried to purchase nongroup coverage but too expensive10%7%13%
NOTES: Don’t Know and Refused responses not shown.Excludes people covered by other sources, such as Medicare, VA/CHAMPUS, or other state programs.”–“: Estimates with relative standard errors greater than 30% or unweighted cell sizes below 30 are not provided.NA: Not applicable. Estimates not shown for >400% as estimates do not meet criteria for statistical reliability.^ Estimate statistically significantly different from <138% FPL estimate at the 95% confidence level.SOURCE: 2013 Kaiser Survey of Low-Income Americans and the ACA.
Table A3: Ease of Applying for Medi-Cal, Among Adults who Have Applied, by Income
AllBy Income
≤138% FPL139-400% FPL
Share reporting step was somewhat or very easy:
Finding out how to apply78%77%84%
Filling in requested information68%65%72%
Assembling the required paperwork61%60%56%
Submitting the application77%78%75%
Share reporting all steps were somewhat or very easy48%47%46%
NOTE: Includes adults who either are currently covered by Medi-Cal or report that they have applied for the program within the past 5 years. Estimates not shown for >400% as estimates do not meet criteria for statistical reliability.SOURCE: 2013 Kaiser Survey of Low-Income Americans and the ACA.
Table A4: Reasons For and Problems With Choosing Health Plan, Among Adults in California Who Had and Made a Choice, by Income
AllBy Income
≤138% FPL139-400% FPL>400% FPL
Share who chose plan primarily because:
Your costs under the plan were low27%20%23%31%
The selection of health care providers was broad or included your doctor27%28%24%27%
The plan covered a wide range of benefits or a specific benefit that you need29%22%33%29%
Friends or family recommended the plan5%
Other members of your family were already enrolled in this plan4%
Some other reason8%12%8%
Share of Insured Adults Reporting:
Difficulty comparing services covered under each plan25%28%29%22%
Difficulty comparing what costs would be under each plan17%18%20%15%
Difficulty comparing the doctors, hospitals, and other health care providers you could see under each plan29%19%26%33%
At least one aspect of plan choice to be difficult38%37%37%38%
NOTES: Among 58% insured adults who had a choice of plans and reported that they made the choice themselves. Excludes those who responded Don’t Know or Refused.”–“: Estimates with relative standard errors greater than 30% or unweighted cell sizes below 30 are not provided.SOURCE: 2013 Kaiser Survey of Low-Income Americans and the ACA.
Table A5: Problems with Health Coverage Among Insured Adults in California, by Coverage
Insured
EmployerNongroupMedi-Cal
Share who: 
Rate Health Coverage as “Not so good” or “Poor”9%23%*23%*
Share who report that: 
Needed Service Not Covered by Plan14%35%*34%*
Plan Would Not Pay for Service You Thought Was Covered20%36%*36%*
Costs You Had to Pay for a Service Were Higher Than Expected35%61%*25%*
NOTES: Excludes people covered by other sources, such as Medicare, VA/CHAMPUS, or other state programs.”–“: Estimates with relative standard errors greater than 30% or unweighted cell sizes below 30 are not provided.*Estimate statistically significantly different from employer estimate at the 95% confidence level.SOURCE: 2013 Kaiser Survey of Low-Income Americans and the ACA.
Table A6: Californians’ Knowledge of Coverage Pathways Available Under the ACA, by Income and Coverage
Uninsured^Insured
Employer CoverageNongroupMedi-Cal
Know “only a little” or “nothing at all” about Medi-Cal
All74%71%82%52%*
By Income
≤138% FPL76%76%47%*
139-400% FPL74%73%81%65%
>400% FPL69%80%
Know “only a little” or “nothing at all” about Covered California
All85%67%70%84%
By Income
≤138% FPL89%82%85%
139-400% FPL84%80%71%80%
>400% FPL57%67%
NOTES: Excludes people covered by other sources, such as Medicare, VA/CHAMPUS, or other state programs.^Uninsured excludes undocumented immigrants.”–“: Estimates with relative standard errors greater than 30% or unweighted cell sizes below 30 are not provided.*Estimate statistically significantly different from uninsured estimate at the 95% confidence level.SOURCE: 2013 Kaiser Survey of Low-Income Americans and the ACA.


Endnotes

  1. Kaiser Commission on Medicaid and the Uninsured, States Getting a Jump Start on Health Reform’s Medicaid Expansion (April 2012), https://modern.kff.org/health-reform/issue-brief/states-getting-a-jump-start-on-health/. ↩︎
  2. Kaiser Commission on Medicaid and the Uninsured, California’s “Bridge to Reform” Medicaid Demonstration Waiver (Kaiser Family Foundation, October 2011), https://modern.kff.org/health-reform/fact-sheet/californias-bridge-to-reform-medicaid-demonstration-waiver/. ↩︎
  3. Kaiser Family Foundation, How Will the Uninsured in California Fare Under the Affordable Care Act? (Washington, DC:  Kaiser Family Foundation, January 6, 2014), https://modern.kff.org/health-reform/fact-sheet/state-profiles-uninsured-under-aca-california/. ↩︎
  4. Rachel Garfield, Rachel Licata, and Katherine Young, The Uninsured at the Starting line:  Findings from the 2013 Kaiser Survey of Low-Income Americans and the ACA (Washington, DC:  Kaiser Family Foundation, 2014), https://modern.kff.org/uninsured/report/the-uninsured-at-the-starting-line-findings-from-the-2013-kaiser-survey-of-low-income-americans-and-the-aca/. ↩︎
  5. Kaiser Commission on Medicaid and the Uninsured, The Uninsured:  A Primer- Key Facts about Health Insurance on the Eve of Coverage Expansions (Washington, DC:  Kaiser Family Foundation), October 23, 2013, https://modern.kff.org/uninsured/report/the-uninsured-a-primer-key-facts-about-health-insurance-on-the-eve-of-coverage-expansions/. ↩︎
  6. Helen Lee and Shannon McConville, Expanding Medi-Cal Profiles of Potential New Users (San Francisco, CA: Public Policy Institute of California, August 2011), http://www.ppic.org/main/publication.asp?i=868. ↩︎
  7. Ying-Ying Meng, Livier Cabezas, Dylan Roby, Nadereh Pourat, Gerald Kominski, Successful Strategies for Increasing Enrollment in California’s Low Income Health Program (LIHP) (UCLA Center for Health Policy Research, September 2012), http://healthpolicy.ucla.edu/publications/Documents/PDF/lihppolicynotesep2012.pdf. ↩︎
  8. In addition, the waiver allows the state to enroll Medicaid-eligible seniors and persons with disabilities (excluding dual eligibles) into managed care plans and allows for the creation of the Delivery System Reform Incentive Pool (DSRIP) for University of California and county hospitals. ↩︎
  9. California Department of Health Care Services, LIHP September 2013 Monthly Enrollment (November 15, 2013), http://www.dhcs.ca.gov/provgovpart/Documents/LIHP/September%20Enrollment.pdf. ↩︎
  10. California Department of Health Care Services, “California’s Low Income Health Program Transitions Hundreds of Thousands of New Members to Medi-Cal” (December 31, 2013), http://www.dhcs.ca.gov/formsandpubs/publications/opa/Documents/2013/13-07%20LIHP%20Medi-Cal%20Expansion%2012-31-13%20Final%20Version.pdf. ↩︎
  11. Kaiser Family Foundation, How Will the Uninsured in California Fare Under the Affordable Care Act? ↩︎
  12. Garfield, The Uninsured at the Starting Line. ↩︎
  13. Care without Coverage: Too Little, Too Late, Committee on the Consequences of Uninsurance, Board on Health Care Services, Institute of Medicine, National Academy Press, 2002 ↩︎
  14. J. Hadley, J. Holahan, T. Coughlin, and D. Miller, 2008 “Covering The Uninsured In 2008: Current Costs, Sources Of Payment, And Incremental Costs” Health Affairs 27 (5) w399 (published online 25 August 2008). ↩︎
  15. G. Anderson, 2007, “From ‘Soak The Rich’ To ‘Soak The Poor’: Recent Trends In Hospital Pricing.” Health Affairs 26(4): 780-789. ↩︎
  16. D. Himmelstein et al., 2009. “Medical bankruptcy in the United States, 2007: results of a national study.” Am J Med. 122(8): 741-6. Available at: http://www.pnhp.org/new_bankruptcy_study/Bankruptcy-2009.pdf. ↩︎
  17. Urban Institute and Kaiser Commission on Medicaid and the Uninsured estimates based on the Census Bureau’s March 2011 and 2012 Current Population Survey (CPS: Annual Social and Economic Supplements), https://modern.kff.org/other/state-indicator/total-population/?state=CA. ↩︎
  18. For state uninsured population: Urban Institute and Kaiser Commission on Medicaid and the Uninsured estimates based on the Census Bureau’s March 2012 and 2013 Current Population Survey (CPS: Annual Social and Economic Supplements); for LA County uninsured population: U.S. Census Bureau, 2008-2012 American Community Survey results for Los Angeles County. ↩︎
  19. Urban Institute and Kaiser Commission on Medicaid and the Uninsured estimates based on the Census Bureau’s March 2012 and 2013 Current Population Survey (CPS: Annual Social and Economic Supplements). ↩︎
  20. Hans Johnson and Marisol Mejia. Just the Facts: Immigrants in California (Public Policy Institute of California, May 2013), http://www.ppic.org/content/pubs/jtf/JTF_ImmigrantsJTF.pdf. ↩︎
  21. Urban Institute and Kaiser Commission on Medicaid and the Uninsured estimates based on the Census Bureau’s March 2012 and 2013 Current Population Survey (CPS: Annual Social and Economic Supplements). ↩︎
  22. Urban Institute and Kaiser Commission on Medicaid and the Uninsured estimates based on the Census Bureau’s March 2012 and 2013 Current Population Survey (CPS: Annual Social and Economic Supplements). ↩︎
  23. California figure from the Table 3, Regional and State Employment and Unemployment: October 2013, and Unemployment rates by State, seasonally adjusted: October 2012 and 2013, Bureau of Labor Statistics, http://www.bls.gov/news.release/laus.t03.htm; U.S. figures from Bureau of Labor Statistics, http://data.bls.gov/cgi-bin/surveymost?bls. ↩︎
  24. California Health Care Almanac, California’s Uninsured: By the Numbers (California HealthCare Foundation, December 2013), http://www.chcf.org/publications/2013/12/californias-uninsured/. ↩︎
  25. California Health Care Almanac, California Employer Health Benefits Survey: Workers Feel the Pinch (California HealthCare Foundation, January 2014), http://www.chcf.org/publications/2014/01/employer-health-benefits. ↩︎
  26. Urban Institute and Kaiser Commission on Medicaid and the Uninsured estimates based on the Census Bureau’s March 2012 and 2013 Current Population Survey (CPS: Annual Social and Economic Supplements). ↩︎
  27. The five insurers were Kaiser Permanente (34%), Anthem Blue Cross (15%), Health Net (10%), Blue Shield (9%), and United Health Care (8%). California HealthCare Foundation. California Health Care Almanac: California Health Plans and Insurers (March 2013), http://www.chcf.org/~/media/MEDIA%20LIBRARY%20Files/PDF/C/PDF%20CAHealthPlansInsurersAlmanac2013.pdf. ↩︎
  28. Ibid. ↩︎
  29. Urban Institute and Kaiser Commission on Medicaid and the Uninsured estimates based on the Census Bureau’s March 2012 and 2013 Current Population Survey (CPS: Annual Social and Economic Supplements). ↩︎
  30. Martha Heberlein, Tricia Brooks, Jocelyn Guyer, Samantha Artiga, and Jessica Stephens, Performing Under Pressure: Annual Findings of a 50-State Survey of Eligibility, Enrollment, Renewal, and Cost-Sharing Policies in Medicaid and CHIP, 2011-2012 (Kaiser Family Foundation, January 2012), https://modern.kff.org/medicaid/report/performing-under-pressure-annual-findings-of-a/. ↩︎
  31. Stephen Zuckerman and Dana Goin. How Much Will Medicaid Physician Fees for Primary Care Rise in 2013? Evidence from a 2012 Survey of Medicaid Physician Fees (Urban Institute and Kaiser Commission on Medicaid and the Uninsured), December 2012, http://modern.kff.org/medicaid/issue-brief/how-much-will-medicaid-physician-fees-for/. ↩︎
  32. This payment cut was implemented in 2011 and upheld by the 9th Circuit Court of Appeals in May 2013. See: United States Court of Appeals for the 9th Circuit. Managed Pharmacy Care v. Sebelius (May 24, 2013), http://www.dhcs.ca.gov/Documents/AB97OpinionDocument.pdf. ↩︎
  33. California Department of Health Care Services, Implementation of Assembly Bill 97 Reductions (August 15, 2013), http://files.medi-cal.ca.gov/pubsdoco/newsroom/newsroom_21682_1.asp. ↩︎
  34. California Department of Health Care Services, ACA Increased Medicaid Payment for Primary Care Physicians, http://files.medi-cal.ca.gov/pubsdoco/aca/aca_form_landing.asp. ↩︎
  35. For more information about the primary care rate increase, see: Lucian Wulsin, Primary Care Rate Increases: Why are they Important and What’s the Reason for the Delay in Implementation in California (Insure the Uninsured Project, August 2013), http://itup.org/wp-content/uploads/downloads/2013/10/Primary-Care-Rate-Increases.pdf. ↩︎
  36. California HealthCare Foundation, County Programs for the Medically Indigent in California (October 2009), http://www.chcf.org/publications/2009/10/county-programs-for-the-medically-indigent-in-california. ↩︎
  37. Public Policy Institute of California, California’s Health Care Safety Net (October 2013), http://www.ppic.org/main/publication_show.asp?i=1074. ↩︎
  38. Laurel Lucia, Ken Jacobs, Greg Watson, Miranda Dietz, and Dylan H. Roby. Medi-Cal Expansion under the Affordable Care Act: Significant Increase in Coverage with Minimal Cost to the State (UC Berkeley Center for Labor Research and Education and UCLA Center for Health Policy Research, January 2013), http://laborcenter.berkeley.edu/healthcare/medi-cal_expansion13.pdf. ↩︎
  39. Department of Health & Human Services, California Bridge to Reform Waiver Approval Letter, November 2, 2010, http://www.dhcs.ca.gov/provgovpart/Documents/Waiver%20Renewal/CA%20Waiver%20Approval%20Letter.pdf. ↩︎
  40. Kaiser Commission on Medicaid and the Uninsured. Key Facts on California’s “Bridge to Reform” Medicaid Demonstration Waiver (Kaiser Family Foundation, October 2011), http://modern.kff.org/medicaid/8197.cfm. ↩︎
  41. California Department of Health Care Services, Delivery System Reform Incentive Payments (DSRIP), http://www.dhcs.ca.gov/provgovpart/Pages/DSRIP1.aspx. ↩︎
  42. For more information on the SPD transition to Medi-Cal managed care, see: Carrie Graham, et al., Transitioning Beneficiaries with Complex Care Needs to Medicaid Managed Care: Insights from California (July 2013), https://modern.kff.org/medicaid/issue-brief/transitioning-beneficiaries-with-complex-care-needs-to-medicaid-managed-care-insights-from-california/. ↩︎
  43. The LIHP program is an extension of the HCCI program in California’s 2005 Medicaid Waiver. For more information about the 2005-2010 HCCI program and a comparison of the two waivers, see: Peter Harbage and Meredith Ledford King. A Bridget to Reform: California’s Medicaid Section 1115 Waiver (California HealthCare Foundation, October 2012), http://www.chcf.org/~/media/MEDIA%20LIBRARY%20Files/PDF/B/PDF%20BridgeToReform1115Waiver.pdf. ↩︎
  44. California Department of Health Care Services. LIHP September2013 Monthly Enrollment (November 15, 2013). ↩︎
  45. California Department of Health Care Services. Consumer Information – Local Low Income Health Program (LIHP) Contracts (November 2013). ↩︎
  46. California Department of Health Care Services, LIHP September 2013 Monthly Enrollment (November 15, 2013), http://www.dhcs.ca.gov/provgovpart/Documents/LIHP/September%20Enrollment.pdf. ↩︎
  47. California Department of Health Care Services, “California’s Low Income Health Program Transitions Hundreds of Thousands of New Members to Medi-Cal” (December 31, 2013). ↩︎
  48. The Center for Consumer Information & Insurance Oversight (CCIIO), California Health Insurance Marketplace Grants Awards List (CMS), updated January 22, 2014, http://www.cms.gov/CCIIO/Resources/Marketplace-Grants/ca.html. ↩︎
  49. Covered California. Health Plans & Rates for 2014: Making the Individual Market in California Affordable (May 23, 2013), http://coveredca.com/news/PDFs/CC_Health_Plans_Booklet.pdf?elq=012957b360434a93b4502bfb84654239&elqCampaignId=2141. ↩︎
  50. Kaiser Family Foundation analysis of the March 2012 and 2013 CPS, https://modern.kff.org/report-section/state-by-state-estimates-of-the-number-of-people-eligible-for-premium-tax-credits-under-the-affordable-care-act-table-1/. ↩︎
  51. UCLA Center for Health Policy Research, Low-Income Health Program Performance Dashboard: Alameda July 1, 2011 – September 30, 2013, http://healthpolicy.ucla.edu/programs/health-economics/projects/coverage-initiative/Documents/Dashboard_Alameda.pdf. ↩︎
  52. Community Health Councils. On the Path to Enrollment: Getting Californians Covered Under the ACA. California Healthcare Foundation. October 2013. Available at: http://www.chcf.org/publications/2013/10/path-enrollment-aca. ↩︎
  53. California Department of Health Care Services, “Outreach and Enrollment Workgroup,” (November 1, 2013), Accessed February 10, 2014, http://www.dhcs.ca.gov/services/medi-cal/eligibility/Pages/OEworkgroup.aspx ↩︎
  54. The California Endowment, “The Department of Health Care Services and The California Endowment Announce $23 Million in Grants to Boost County-Based Medi-Cal Enrollment Efforts” (January 28, 2014), http://tcenews.calendow.org/releases/department-of-health-care-services-and-the-california-endowment-announce-23-million-in-grants-to-boost-county-based-medi-cal-enrollment-efforts. ↩︎
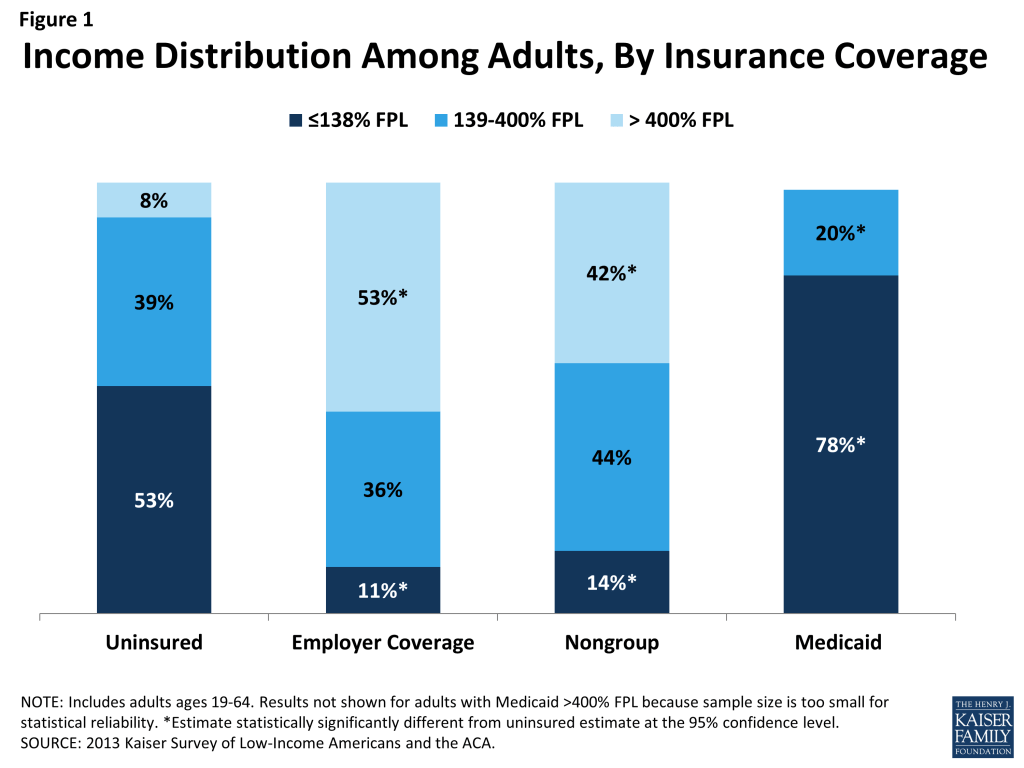
  55. Health Resources and Services Administration, California: Health Center Outreach & Enrollment Assistance, http://www.hrsa.gov/about/news/2013tables/outreachandenrollment/ca.html. ↩︎
  56. California Health Benefit Exchange. Outreach and Education Grant Webinar (September 27, 2012), http://www.healthexchange.ca.gov/StakeHolders/Pages/2012StakeholderArchive.aspx. ↩︎
  57. California Health Benefit Exchange. Outreach and Education Grant Webinar (September 27, 2012), http://www.healthexchange.ca.gov/StakeHolders/Pages/2012StakeholderArchive.aspx. ↩︎
  58. Covered California. Covered California to Award Community Organizations $37 Million in Grants for Outreach and Education (May 2013), http://www.healthexchange.ca.gov/Documents/COVERED%20CA-Grantee%20Announcement%20Press%20Release%205-14-13.pdf. ↩︎
  59. Kaiser Family Foundation, State Marketplace Profiles: California (November 26, 2013), https://modern.kff.org/health-reform/state-profile/state-exchange-profiles-california/. ↩︎
  60. CCIIO, California Health Insurance Marketplace Grants Awards List, January 22, 2014. ↩︎
  61. PBS NewsHour, “Language Barrier, Immigration Status Keep Some Latinos From Health Care Enrollment” (February 5, 2014), http://www.pbs.org/newshour/bb/language-immigration-keep-some-latinos-health-care-enrollment/. ↩︎
  62.   See: Kaiser Commission on Medicaid and the Uninsured, Medicaid Eligibility for Adults as of January 1, 2014 (October 1, 2014), http://modern.kff.org/medicaid/fact-sheet/medicaid-eligibility-for-adults-as-of-january-1-2014/ for more detail on pre- and post-ACA Medicaid eligibility for adults. ↩︎
  63. Martha Heberlein, Tricia Brooks, and Joan Alker, Georgetown Center for Children and Families, Samantha Artiga and Jessica Stephens, Kaiser Commission on Medicaid and the Uninsured, Getting into Gear for 2014: Findings from a 50-State Survey of Eligibility, Enrollment, Renewal, and Cost-Sharing Policies in Medicaid and CHIP, 2012-2013, (Washington, DC:  Kaiser Family Foundation), January 2013.  Available at: http://modern.kff.org/medicaid/report/getting-into-gear-for-2014-findings-from-a-50-state-survey-of-eligibility-enrollment-renewal-and-cost-sharing-policies-in-medicaid-and-chip-2012-2013/ ↩︎
  64. Between July 2012 and July 2013, nearly 150,000 individuals enrolled in LIHP. California Department of Health Care Services, LIHP July 2012 Monthly Enrollment (September 2012), http://www.dhcs.ca.gov/provgovpart/Documents/LIHP/DY8-M01_Enrl_Rpt.pdf and LIHP July 2013 Monthly Enrollment (September 2013), http://www.dhcs.ca.gov/provgovpart/Documents/LIHP/LIHP%20July%202013%20Monthly%20Enrollment.pdf. ↩︎
  65. See “Protections in individual insurance markets” at https://modern.kff.org/state-category/health-insurance-managed-care/. ↩︎
  66. On February 10, 2014, the Obama Administration delayed penalties associated with this Employer Responsibility Provision until 2015. U.S. Department of the Treasury, Treasury and IRS Issue Final Regulations Implementing Employer Shared Responsibility Under the Affordable Care Act for 2015 (February 10, 2014), http://www.treasury.gov/press-center/press-releases/Pages/jl2290.aspx. ↩︎
  67. 2013 Kaiser Survey of Low-Income Americans and the ACA. ↩︎
  68. Collins S, et al. 2012. “Gaps in Health Insurance: Why So Many Americans Experience Breaks in Coverage and How the Affordable Care Act Will Help.” The Commonwealth Fund. http://www.commonwealthfund.org/~/media/Files/Publications/Issue%20Brief/2012/Apr/1594_collins_gaps_in_hlt_ins_tracking_brief_v2.pdf;  Cassedy A, Fairbrother G, and Newacheck PW. 2008. “The Impact of Insurance Instability on Children’s Access, Utilization, and Satisfaction with Health Care. Ambulatory Pediatrics. 8(5):321-8. ↩︎
  69. Martha Heberlein, et al., Getting into Gear for 2014:  Findings from a 50-State Survey of Eligibility, Enrollment, Renewal, and Cost-Sharing Policies in Medicaid and CHIP, 2012-2013 (Kaiser Family Foundation), January 2013. ↩︎
  70. Veronica Guerra and Shannon McManon, Minimizing Care Gaps for Individuals Churning Between the Marketplace and Medicaid: Key State Considerations (Center for Health Care Strategies, Inc., January 2014), http://www.statecoverage.org/files/CHCS_Minimizing_Churn.pdf. ↩︎
  71. Martha Heberlein, et al., Getting into Gear for 2014:  Findings from a 50-State Survey of Eligibility, Enrollment, Renewal, and Cost-Sharing Policies in Medicaid and CHIP, 2012-2013 (Kaiser Family Foundation), January 2013. ↩︎
  72. For more information, see: Martha Heberlein, Tricia Brooks, Samantha Artiga, and Jessica Stephens, Getting into Gear for 2014: Shifting New Medicaid Eligibility and Enrollment Policies into Drive (Kaiser Family Foundation), November 2013, http://modern.kff.org/medicaid/report/getting-into-gear-for-2014-shifting-new-medicaid-eligibility-and-enrollment-policies-into-drive/. ↩︎
  73. Martha Heberlein, et al., Getting into Gear for 2014: Shifting New Medicaid Eligibility and Enrollment Policies into Drive (Kaiser Family Foundation), November 2013. ↩︎
  74. Helen Lee, Expanding Medi-Cal Profiles of Potential New Users (Public Policy Institute of California). ↩︎
  75. Adrian Florido, “Delays Persist in Certifying Covered California Enrollment Counselors” (KPCC Southern California Public Radio, December 13, 2013), http://www.scpr.org/news/2013/12/13/40891/delays-persist-in-certifying-covered-california-en/. ↩︎
  76. Includes people who had a choice of plans and reported that they made the choice themselves. ↩︎
  77. California Department of Health Care Services, “Medi-Cal Managed Care Health Plan Directory,” (2014), Accessed February 10, 2014, http://www.dhcs.ca.gov/individuals/Pages/MMCDHealthPlanDir.aspx. ↩︎
  78. Zhou, C. and Zhang, Y. (2012). The vast majority of Medicare Part D beneficiaries still don’t choose the cheapest plans that meet their medication needs.  Health Affairs, 31: 2259-2264; McLaughlin, C.G., Chernew, M., & Taylor, E.F. (2002).  Medigap premiums and Medicare HMO enrollment.  Health Services Research 37: 1445-1468. ↩︎
  79. Kaiser Commission on Medicaid and the Uninsured. Oral Health and Low-Income Nonelderly Adults:  A Review of Coverage and Access (Washington, DC:  Kaiser Family Foundation), June 2012.  Available at: http://modern.kff.org/medicaid/issue-brief/access-to-affordable-dental-care-gaps-for/. ↩︎
  80. Vernon Smith, Kathleen Gifford, Eileen Ellis, Robin Rudowitz, and Laura Snyder, Hoping for Economic Recovery, Preparing for Health Reform: A Look at Medicaid Spending, Coverage and Policy Trends. Results from a 50-State Medicaid Budget Survey for State Fiscal Years 2010 and 2011 (Kaiser Family Foundation), September 2010, https://modern.kff.org/medicaid/report/hoping-for-economic-recovery-preparing-for-health-reform-a-look-at-medicaid-spending-coverage-and-policy-trends-results-from-a-50-state-medicaid-budget-survey-for-state-fiscal-years-2010-and-201/. ↩︎
  81. Vernon Smith, Kathleen Gifford, Eileen Ellis, Robin Rudowitz, and Laura Snyder, Medicaid in a Historic Time of Transformation: Results from a 50-State Medicaid Budget Survey for State Fiscal Years 2013 and 2014 (Kaiser Family Foundation), October 2013, https://modern.kff.org/medicaid/report/medicaid-in-a-historic-time-of-transformation-results-from-a-50-state-medicaid-budget-survey-for-state-fiscal-years-2013-and-2014/, (see page 96). ↩︎
  82. Institute of Medicine, Committee on the Consequences of Uninsurance, Board on Health Care Services, Care without Coverage: Too Little, Too Late (Washington, DC: National Academy Press: Institute of Medicine), May 2002, http://www.iom.edu/~/media/Files/Report%20Files/2003/Care-Without-Coverage-Too-Little-Too-Late/Uninsured2FINAL.pdf. ↩︎
  83. Institute of Medicine, Committee on the Consequences of Uninsurance, Board on Health Care Services Coverage Matters: Insurance and Health Care (Washington, DC: National Academy Press: Institute of Medicine), 2001. ↩︎
  84. Julia Paradise and Rachel Garfield, What is Medicaid’s Impact on Access to Care, Health Outcomes, and Quality of Care? Setting the Record Straight on Evidence (Washington, DC:  Kaiser Commission on Medicaid and the Uninsured), August 2, 2013, https://modern.kff.org/medicaid/issue-brief/what-is-medicaids-impact-on-access-to-care-health-outcomes-and-quality-of-care-setting-the-record-straight-on-the-evidence↩︎
  85. Wilper AP, Woolhandler S, Lasser KE, McComick D, Bor DH, Himmelstein DU. Hypertension, diabetes, and elevated cholesterol among insured and uninsured US adults. Health Affairs. 2009;28(6):w1151-9. ↩︎
  86. Stephen Zuckerman and Dana Goin, The Urban Institute, How Much Will Medicaid Physician Fees for Primary Care Rise in 2013?  Evidence from a 2012 Survey of Medicaid Physician Fees, (Washington, DC:  Kaiser Commission on Medicaid and the Uninsured, December 2012), https://modern.kff.org/medicaid/issue-brief/how-much-will-medicaid-physician-fees-for/. ↩︎
  87. Sandra L. Decker, “Two-thirds of Primary Care Physicians Accepted New Medicaid Patients in 2011-12: A Baseline to Measure Future Acceptance Rates,” Health Affairs 32, no. 7 (Jul. 2013): 1183-7, http://content.healthaffairs.org/content/32/7/1183.abstract. ↩︎
  88. Garfield, The Uninsured at the Starting Line. ↩︎
  89. Kaiser Commission on Medicaid and the Uninsured, Community Health Centers in an Era of Health Reform: An Overview and Key Challenges to Health Center Growth (Washington, DC:  Kaiser Family Foundation), March 1, 2013, https://modern.kff.org/health-reform/issue-brief/community-health-centers-in-an-era-of-health-reform-overview/. ↩︎
  90. Gerald Kominski, et al., Final Evaluation of the Health Care Coverage Initiative in California (UCLA Center for Health Policy Research, January 2014), http://healthpolicy.ucla.edu/publications/search/pages/detail.aspx?PubID=1266. ↩︎
  91. Kaiser Commission on Medicaid and the Uninsured, Key Lessons from Medicaid and CHIP Outreach and Enrollment Under the Affordable Care Act (Washington, DC:  Kaiser Family Foundation), June 2013, https://modern.kff.org/wp-content/uploads/2013/06/8445-key-lessons-from-medicaid-and-chip.pdf. ↩︎
  92. Kaiser Family Foundation, Kaiser Health Tracking Poll: January 2014 (conducted January 14-21, 2014), https://modern.kff.org/health-reform/poll-finding/kaiser-health-tracking-poll-january-2014/. ↩︎
  93. [45 CFR] § 156.124o, http://www.ofr.gov/OFRUpload/OFRData/2013-21338_PI.pdf. ↩︎
  94. Community Health Councils. On the Path to Enrollment: Getting Californians Covered Under the ACA. California Healthcare Foundation. October 2013. Available at: http://www.chcf.org/publications/2013/10/path-enrollment-aca. ↩︎
  95. Kaiser Commission on Medicaid and the Uninsured. Fast Track to Coverage: Facilitating Enrollment of Eligible People into the Medicaid Expansion (Washington, DC:  Kaiser Family Foundation), November 19, 2013, http://modern.kff.org/medicaid/issue-brief/fast-track-to-coverage-facilitating-enrollment-of-eligible-people-into-the-medicaid-expansion/. ↩︎
  96. Ibid. ↩︎
  97. Medicaid.gov, Targeted Enrollment Strategies, October 1, 2013, http://www.medicaid.gov/AffordableCareAct/Medicaid-Moving-Forward-2014/Targeted-Enrollment-Strategies/targeted-enrollment-strategies.html. ↩︎
  98. Ying-Ying Meng, Livier Cabezas, Dylan Roby, Nadereh Pourat, Gerald Kominski, Successful Strategies for Increasing Enrollment in California’s Low Income Health Program (LIHP) (UCLA Center for Health Policy Research, September 2012), http://healthpolicy.ucla.edu/publications/Documents/PDF/lihppolicynotesep2012.pdf. ↩︎
  99. Health Resources and Services Administration, California: Health Center Outreach & Enrollment Assistance, http://www.hrsa.gov/about/news/2013tables/outreachandenrollment/ca.html. ↩︎
  100. Rafael A. Gomez and Bobbie Wunsch. Ready, Set, Enroll: Community Health Center Strategies to Facilitate Enrollment of Uninsured Patients into Coverage Under the Affordable Care Act. Pacific Health Consulting Group/Blue Shield of California Foundation. 2013. Available at: www.blueshieldcafoundation.org/sites/default/files/publications/downloadable/Ready_Set_Enroll_9_26_2013.pdf. ↩︎
  101. Centers for Medicare & Medicaid Services, Final Rule for Strengthening Medicaid, The Children’s Health Insurance Program and The New Health Insurance Marketplace (July 5, 2013), http://www.cms.gov/Newsroom/MediaReleaseDatabase/Fact-Sheets/2013-Fact-Sheets-Items/2013-07-05.html. Final Rule included in July 15, 2013 Federal Register, https://www.federalregister.gov/articles/2013/07/15/2013-16271/medicaid-and-childrens-health-insurance-programs-essential-health-benefits-in-alternative-benefit#h-34. ↩︎
  102. California Department of Health Care Services, Hospital Presumptive Eligibility (PE) Program, http://www.dhcs.ca.gov/services/medi-cal/eligibility/Pages/HospitalPE.aspx. ↩︎
  103. California Department of Health Care Services, ACA Hospital Presumptive Eligibility (PE) Program, http://files.medi-cal.ca.gov/pubsdoco/aca/aca_HPE_landing.asp. ↩︎
  104. Cindy Mann, Implementation of Hospital Presumptive Eligibility (Center for Medicaid & CHIP Services, Centers for Medicare & Medicaid Services, January 2014), http://www.naph.org/Links/POL/CMS-Presumptive-Eligibility-Bulletin-14214.aspx. ↩︎
  105. Varney, Sarah. “Emergency Rooms Are Front Line For Enrolling New Obamacare Customers.” Kaiser Health News/NPR, January 14, 2014; available at: http://www.kffhealthnews.org/stories/2014/january/14/signing-up-for-obamacare-in-the-er.aspx. ↩︎
  106.   California Department of Health Care Services, “Medi-Cal Eligibility and Covered California – Frequently Asked Questions,” (2014), Accessed February 10, 2014, http://www.dhcs.ca.gov/services/medi-cal/eligibility/Pages/Medi-CalFAQs2014b.aspx. ↩︎
  107. Community Health Councils, On the Path to Enrollment: Getting Californians Covered Under the ACA. (California Healthcare Foundation, October 2013), Available at: http://www.chcf.org/publications/2013/10/path-enrollment-aca. ↩︎
  108. California Department of Health Care Services, Express Lane, http://www.dhcs.ca.gov/services/medi-cal/eligibility/Pages/ExpressLane.aspx. ↩︎
  109. Elizabeth Lytle, et al., Smooth Transitions into Medi-Cal: Ensuring Continuity of Coverage for Low Income Health Program Enrollees (UC Berkeley Labor Center and UCLA Center for Health Policy Research, April 2013), http://laborcenter.berkeley.edu/healthcare/lihp_medi_cal13.pdf. ↩︎
  110. Cynthia Cox, Gary Claxton, Larry Levitt, Hana Khosla. An Early Look at Premiums and Insurer Participation in Health Insurance Marketplaces, 2014. Kaiser Family Foundation, Updated Table, as of October 22, 2013; available at: https://modern.kff.org/health-reform/issue-brief/an-early-look-at-premiums-and-insurer-participation-in-health-insurance-marketplaces-2014/. ↩︎
  111. Center for Studying Health System Change. Ready or Not: Are Health Care Safety-Net Systems Prepared for Reform? June 2013. Available at: http://www.chcf.org/publications/2013/06/regional-safety-net-systems. ↩︎
  112. Rafael A. Gomez and Bobbie Wunsch. Ready, Set, Enroll: Community Health Center Strategies to Facilitate Enrollment of Uninsured Patients into Coverage Under the Affordable Care Act. Pacific Health Consulting Group/Blue Shield of California Foundation. 2013. Available at: www.blueshieldcafoundation.org/sites/default/files/publications/downloadable/Ready_Set_Enroll_9_26_2013.pdf ↩︎

Integrating Physical and Behavioral Health Care: Promising Medicaid Models

Authors: Mike Nardone, Sherry Snyder, and Julia Paradise
Published: Feb 12, 2014

Executive Summary

Many individuals receiving care for behavioral health conditions also have physical health conditions that require medical attention, and the inverse is also true. Unfortunately, our physical and behavioral health care systems tend to operate independently, without coordination between them, and gaps in care, inappropriate care, and increased costs can result. This brief examines five promising approaches currently underway in Medicaid to better integrate physical and behavioral health care. They can be arrayed along a continuum that ranges from relatively modest steps to coordinate care between the two systems, to more ambitious efforts to implement a single integrated system of care.

  1. Universal Screening.Integrated care begins with screening patients for conditions in addition to the ones they present for. A number of evidence-based tools are available for primary care providers to use to screen for behavioral health disorders easily. Routine screening for common medical conditions among adults with behavioral health conditions can be accomplished by providing behavioral health practitioners with basic equipment like a scale, a blood pressure cuff, and a stethoscope, along with training in how to use them. Early identification of conditions helps to prevent or mitigate their progression.
  2. Navigators. Even when individuals get screened for other conditions and referred for care, obtaining the recommended services can be challenging. Many Medicaid programs are deploying a new cadre of “navigators,” who may be nurses, social workers, or trained paraprofessionals, to help Medicaid beneficiaries navigate the health care system. Navigators’ functions can range from simply helping individuals to seek care, to interacting with their health care providers on their behalf, to improving home and community-based support for their clients. Navigators also foster patient engagement.
  3. Co-location. Geographic distance between physical and behavioral health provider settings can itself be a significant barrier to coordinated care. Community health centers are leaders in the “co-location” of physical and behavioral health care at the same site. Medicaid’s system of prospective, cost-based payment for health centers supports this model because the costs of licensed behavioral health practitioners can be included in the calculation of health centers’ prospective rates.
  4. Health Homes. A growing number of states are using the Medicaid “health home” option, established by the ACA, to advance the integration of physical and behavioral health care for Medicaid beneficiaries with serious mental illness. Health home services, which are eligible for a 90% federal match for two years, include comprehensive care management, transitional care, referral to community and social services, and other services to foster integrated care for people with complex conditions and needs. Community mental health centers are one natural choice to be designated health home providers for Medicaid beneficiaries with serious mental illness.
  5. System-Level Integration of Care. System-level integration of services and fiscal accountability underpins truly person-centered, holistic care and represents the most advanced model on the integration continuum. A fully integrated system for Medicaid beneficiaries is one that directly provides and is at financial risk for the entire complement of acute physical and behavioral health services covered by Medicaid.

Issue Brief

Introduction

In 2006, a report issued by the National Association of State Mental Health Program Directors cited research showing that adults with serious mental illness (SMI) die, on average, 25 years earlier than the general population, and that the rates of illness and death in this population have been on the rise.1  Much of the excess mortality among people with SMI is explained by their disproportionately high rates of mortality from the same preventable conditions, including cardiovascular and pulmonary disease, that are among the leading causes of death in the general population. People with SMI also have higher rates of modifiable risk factors for these conditions, such as smoking and obesity; experience higher rates of homelessness, poverty, and other causes of vulnerability; and face symptoms associated with SMI, such as disorganized thought and decreased motivation, that impair compliance and self-care. Further, co-occurring substance use disorders are prevalent among individuals with SMI. But despite the high rate of substance abuse comorbidities among people with SMI, the mental health and substance abuse systems are often entirely separate, and both are segregated from the physical health system. This fragmentation of the health care system can lead to inappropriate care, disjointed care, gaps in care, and redundant care, and can result in increased health care costs.

Medicaid, the nation’s public health insurance program for low-income people, is the chief source of coverage for low-income individuals with disabilities, including many who have behavioral health needs. Mental illness is more than twice as prevalent among Medicaid beneficiaries as it is in the general population, and roughly 49% of Medicaid beneficiaries with disabilities have a psychiatric illness.2  As might be expected given its coverage role, Medicaid is also a major source of financing for mental health services. The Medicaid program finances more than one-quarter of the nation’s spending for behavioral health care and it is, by far, the largest single source of funding for public mental health services.3  Mental health care is an important driver of Medicaid costs. Among the highest-cost 5% of Medicaid-only* enrollees with disabilities, three of the five most prevalent disease pairs include psychiatric illness. The most common disease pair is cardiovascular disease and psychiatric illness, found in 40% of the Medicaid beneficiaries in this top spending group.4 

Given the prevalence of mental illness in the Medicaid population, the high level of Medicaid spending on behavioral health care, and the adverse impact that uncoordinated care can have on the physical health of people with SMI and, thus, on total spending, it is not surprising that Medicaid directors consider initiatives to integrate physical and behavioral health care to be one of their top priorities. According to a 50-state Medicaid survey conducted by the Kaiser Commission on Medicaid and the Uninsured in 2012, a large majority of states had initiatives underway in state fiscal year (FY) 2012 or planned for FY 2013 to better coordinate care between the two systems.5  The Affordable Care Act (ACA) also places a heavy emphasis on this issue, responding to shortcomings of the current fragmented systems of care, and setting forth expectations for better outcomes and reduced costs for those with comorbid conditions. In addition to increasing access to care by expanding Medicaid and private health coverage, the ACA specifically includes mental health and substance use disorder services as one of the ten categories of required “essential health benefits,” and the law requires parity between the mental and physical health benefits covered by health plans. The ACA also establishes new mechanisms and funding opportunities designed to promote coordinated and person-centered care, such as a new Medicaid option for health homes, a large trust fund dedicated to expanding health center services and capacity, and initiatives to develop Accountable Care Organizations (ACOs).

Interested in both improving care and controlling Medicaid costs, and aided by federal reforms and investment, states, health plans and provider systems are increasingly developing and implementing strategies to better integrate physical and behavioral health services. Efforts to date have taken a variety of forms, but two central themes emerge. One is the importance of identifying all of a patient’s health care needs regardless of why or through what door he or she entered the health care system. The other is the broad goal of person-centered care and the specific role of care coordination in achieving it. This brief examines several approaches that state Medicaid programs, health plans, and providers are pursuing, ranging from relatively modest steps to improve coordination between the physical and behavioral health systems, to more ambitious efforts to fully integrate them.

A Continuum of Approaches to Physical and Behavioral Health Care Integration

In a recent paper on integrated physical and behavioral health (PH/BH) care, the SAMHSA-HRSA Center for Integrated Health Solutions (CIHS) outlined a continuum of collaboration/integration, ranging from separate systems and settings with little communication between them, to PH/BH co-location with some degree of collaboration in screening and treatment planning, to fully integrated care, manifested when behavioral and physical health care providers and other providers function as a true team in a shared practice and with a shared vision, and both providers and patients experience the operation as a single system treating the whole person.6  (Figure 1)

Figure 1 - Integrating Physical 8533

Considering different strategies as stages along an integration continuum can help states, health plans, and providers assess where they are currently and determine what next steps they might take to further integrate the care that Medicaid beneficiaries receive, even if full integration cannot be achieved.

Nationwide, many state agencies, plans and providers are implementing PH/BH integration strategies in Medicaid that can be mapped loosely to the different levels of collaboration/integration identified in the SAMHSA-HRSA framework. This brief highlights five strategies currently underway in Medicaid: universal screening; navigators; co-location; health homes; and system-level integration. These models may offer those seeking to advance PH/BH care integration in Medicaid promising directions for change.

1. Universal Screening

Box 1: Screening, Brief Intervention, Referral to Treatment (SBIRT) is a comprehensive approach to identifying persons with or at risk of substance use disorders who present at primary care centers, emergency departments, trauma centers, and other community settings. Screening at the time of intake to assess the severity of substance use and determine the appropriate level of treatment affords the opportunity for early intervention, before more serious consequences occur. Brief Intervention focuses on increasing the individual’s awareness of his or her substance use problem and his or her motivation to change the behavior. Referral to Treatment provides access to the needed specialty care. SAMHSA reports a growing body of evidence in support of SBIRT’s clinical and cost-effectiveness in identifying and treating risky alcohol and tobacco use.

The foundation of integrated care is a holistic view of the individual and personal health as complex, integrated systems, rather than a simple sum of independent body systems. It follows that integrated care begins with an assessment of patients for conditions and/or the risk of developing conditions in addition to the ones they present for. As a practical matter, this means the adoption by primary health care providers of tools to screen for behavioral health needs and, by the same token, the adoption by behavioral health providers of tools to screen for physical health needs. Today, it is more common for primary care providers (PCP) to screen for behavioral health needs than for behavioral health providers to screen for physical health needs.

Numerous studies have documented the effectiveness of screening for behavioral health disorders in primary care settings, and a number of evidence-based tools to screen for depression, anxiety, post-traumatic stress disorder, and substance use disorders are quick and easy to administer and are available in the public domain.7  Screening, Brief Intervention, Referral to Treatment (SBIRT), a method of screening for substance use disorders, represents one such evidenced-based practice that is reimbursable under many state Medicaid programs (see Box 1).8  Oregon is including an SBIRT benchmark and improvement target among the measures for which its ACO-like Medicaid Coordinated Care Organizations (CCOs) will be accountable. The CCOs will be eligible for incentive funds based on their performance on the SBIRT metric.9 

Routine screening for common medical conditions among adults with behavioral health conditions is equally critical. Such screening can be accomplished by providing behavioral health practitioners with basic equipment like a scale, a blood pressure cuff, and a stethoscope, along with training in how to use them. The Small County Care Integration Quality Improvement Collaborative, established by the California Institute of Mental Health, takes this approach to assessing clients at the time of their intake at publicly funded behavioral health settings. County mental health centers participating in the Collaborative measure and record blood pressure, weight, and body mass index at each patient visit. When they identify a health concern, they refer patients for medical care as appropriate.

Screening for behavioral health problems is especially important as a prevention strategy for children and adolescents. According to the 2003 report from President George W. Bush’s New Freedom Commission on Mental Health, undetected and untreated “early childhood mental health disorders may persist and lead to a downward spiral of school failure, poor employment opportunities and poverty in adulthood.”10  Researchers have estimated that over 1 million children and adolescents experience problems suggestive of a pre-psychosis risk state.11  Early intervention may prevent the onset of psychosis among at-risk individuals, and also avert other adverse mental health outcomes associated with psychosis risk states, such as mood syndromes, substance use disorders, and functional decline.12  The earlier that depression is identified and treatment begins, the more effective the treatment is likely to be and the less likely recurrence becomes.

As with adults, physical health screens for children and adolescents with a behavioral health disorder or condition are as important as behavioral health screens for those who present for physical health reasons. For example, a child taking medication for Attention Deficit Hyperactivity Disorder (ADHD) may develop tachycardia and high blood pressure, and a child in active treatment for a behavioral health disorder may begin to experience symptoms of an emerging medical condition such as asthma. Routine medical screening by the principal behavioral health provider serves to foster identification of physical health conditions when they first appear and thereby prevent or mitigate their progression.

2. Navigators

Even when individuals with behavioral health problems get screened for other medical conditions and referred for care, obtaining the recommended follow-up services can be extremely challenging. People with serious behavioral health conditions often lack trust in professionals and agencies. Also, by the nature of their disorders, they may find the task of seeking medical care overwhelming or frightening. Further, people with chronic mental illness can be poor “historians” of their own health and unable to provide information that medical professionals need to diagnose their medical problems. For Medicaid beneficiaries and other low-income people with behavioral health conditions, these obstacles are compounded by poverty and other disadvantages. Recognizing the difficulties of navigating the health care system, professionals in both the physical and behavioral health spheres have affirmed the benefit of having an informed companion help patients with this challenge, and Medicaid programs are exploring opportunities to use a new cadre of “navigators” to serve in this role.

The navigator workforce in behavioral health settings includes professionals such as nurses and licensed clinical social workers as well as paraprofessionals. The role of navigators may be as simple as assisting individuals with behavioral health conditions in seeking medical help, or as sophisticated as directly interacting with medical professionals to advocate for a certain medical procedure or reconcile medications. Their role also involves promoting patient engagement to help achieve better-integrated, more holistic care. Whatever their formal credentials, effective navigators must have the ability to establish a trusting relationship with their clients. In addition, the relationships they establish with providers can foster a culture of coordination and integration between physical and behavioral health professionals. “Wellness Recovery Teams” offer an example of a clinical team-based navigator model that has improved access to and integration of primary care for patients with SMI (see Box 2).13  In another model, Medicaid programs in 30 states and the District of Columbia cover the services of “Certified Peer Specialists,”individuals who have personal experience with behavioral health needs and have completed training and certification to apply that experience to help their clients.14  Peer Specialists often interact with Medicaid beneficiaries outside of office-based settings, supporting them in their homes and communities. Evidence has shown that peer navigators are effective at improving “patient activation,” a construct that measures an individual’s self-management capacity, and at increasing the likelihood that a person with SMI will use primary care medical services.15 

Box 2: Wellness Recovery Teams, piloted in Montgomery County, Pennsylvania, represent a clinical team-based navigator model that includes Medicaid-funded navigators, a registered nurse (RN) with behavioral health training and experience, and a Master’s-prepared or licensed behavioral health professional. The Wellness Recovery Teams identify and engage with adults with SMI who also have at least one chronic medical condition. These navigator teams form a virtual multidisciplinary treatment team with each individual they serve by building relationships with professionals from all the agencies involved in their client’s care, including the PCP, medical specialists, social service providers, family members, Certified Peer Specialists, and other community-based service providers. Important functions of the RNs are to review clients’ medications and contact their PCPs to reconcile them if necessary, and to provide clinical insights and behavioral health consultation to the PCPs. The RNs also coach patients before their medical visits about what to expect and what kinds of information to share. Teaching clients self-advocacy and self-management is a priority.

In the first six months of the pilot, emergency department (ED) visits for medical care declined by 11% relative to the preceding six months, and psychiatric and medical inpatient admissions fell by 43% and 56%, respectively. All participating adults were connected with a PCP and 92% were connected to a medical specialist. Nearly 90% made progress toward recovery from substance abuse; 44% reported improved physical health. The pilot has produced other positive outcomes, too. Since working with the navigator teams, primary care practices have become more collaborative and willing partners in treating individuals with serious behavioral health disorders. ED physicians have also expressed strong support for the navigators, and at least one hospital developed a mental health rotation for its ED physicians following its experience with the teams.

3. Co-location

The physical distance between separate physical and behavioral health provider settings can itself pose a significant barrier to coordinated care. Especially for Medicaid beneficiaries and other low-income people, the child care and transportation costs associated with making trips to multiple locations can be prohibitive. Increasingly, an approach that is being used to address this problem is “co-location” – the provision of physical and behavioral health care at the same site.

The co-location trend is particularly visible in community health centers. In 2012, about 1,200 federally qualified health centers (FQHCs) operating in nearly 9,000 sites served more than 21 million patients in low-income communities; 41% of those served were Medicaid beneficiaries.16  The ACA established a dedicated five-year $11 billion trust fund for the health center program, primarily to increase health center capacity to meet expected increased demand for health care as coverage expands;17  this significant new investment has enabled many health centers to enhance the medical, oral, and behavioral health services they offer. The National Association of Community Health Centers’ (NACHC) reported that, in 2010, over 70% of health centers provided mental health services, 55% provided substance abuse treatment services, and 65% provided components of integrated care, such as a shared treatment plan.18  Health centers provide behavioral health services either by employing or contracting with licensed behavioral health practitioners, primarily to treat patients with mild to moderate behavioral health disorders. Some health centers provide a broader scope of behavioral health services and treat individuals with more serious and chronic mental health conditions. Golden Valley Health Centers in California is an example of a community health center that provides an array of behavioral health services to achieve integrated treatment for its patients (see Box 3).

Box 3: Golden Valley Health Centers, located in Merced and Stanislaus Counties, California, which serve a large number of Medicaid beneficiaries, have co-located behavioral and physical health services. They employ a psychologist, licensed clinical social workers, associate social workers, and psychiatrists to provide a full array of treatment for persons with SMI as well as milder depression, anxiety, substance abuse, and stress. The availability of physical and behavioral health services at the same site, an organizational culture of integration, and the use of an integrated care plan promote integrated care for Golden Valley patients with behavioral health conditions.

Changing the culture in provider settings is challenging and time-consuming. Clinicians in settings serving low-income populations and communities, in particular, face heavy caseloads and are stretched thin just to meet patients’ primary physical health care needs. Medical professionals may view initiatives that expand their work to encompass behavioral health issues as overwhelming, because identifying additional health needs and arranging for follow-up and referrals require more time and effort. The director of behavioral health services at Golden Valley reports that it took a few years for the medical staff, who ultimately did embrace integrated care, to recognize that the added time and effort up-front resulted in more effective and efficient care for their patients in the long run.

Medicaid’s system of prospective, cost-based payment for health centers supports the provision of behavioral health care in this setting because health centers can include the costs of licensed behavioral health practitioners in the calculation of their prospective rates. This integration of Medicaid funding for physical and behavioral services in the health center context contrasts with Medicaid fee-for-service payment, in which primary care and behavioral health providers are reimbursed separately for the specific services they deliver. Still, health centers may face other Medicaid payment barriers. For example, some states do not allow health centers to include the costs of multiple services provided to the same individual on the same day, such as a physical health and a behavioral health service. Other states prohibit same-day billing for certain combinations of behavioral health services.19  Also, although Medicaid covers the services and allows the costs of licensed behavioral health practitioners, many of the substance use treatment professionals employed by or under contract to health centers are not licensed; therefore, health centers must find other financing sources for these services. Finally, some states have not activated billing codes established specifically for Medicaid payment for SBIRT, hindering health centers from providing these particular services.

While co-location enables health centers to provide highly integrated care “within their walls,” this model has also been enhanced in some cases. For example, in Genesee County, Michigan, a pilot project involving a partnership between a health center and a community-based behavioral health provider located on the same campus has produced encouraging results (see Box 4).20  The pilot is a hybrid of co-location and navigator models that extends the reach of care integration by employing navigator teams to help clients gain access to specialty care and support services that are not available through either of the co-located entities.

Box 4: Genesee Health System health center and Hope Network. The Genesee Health System’s health center and Hope Network, a human services agency serving a predominantly Medicaid and low-income population, are located on a shared campus. Hope Network connects patients with PCPs in the health center, who share patient medical information and develop treatment plans collaboratively with Hope Network staff. The health center also provides pharmacy support, facilitating access to medication and educating patients about medication compliance. Hope Network employs Navigator Teams to monitor and support clients who are receiving primary care at the health center, locate needed specialty care that is not available through the health center, and connect patients with community-based services and supports. All needed services and supports are encompassed in a single integrated care plan that is coordinated by the Navigator Teams.
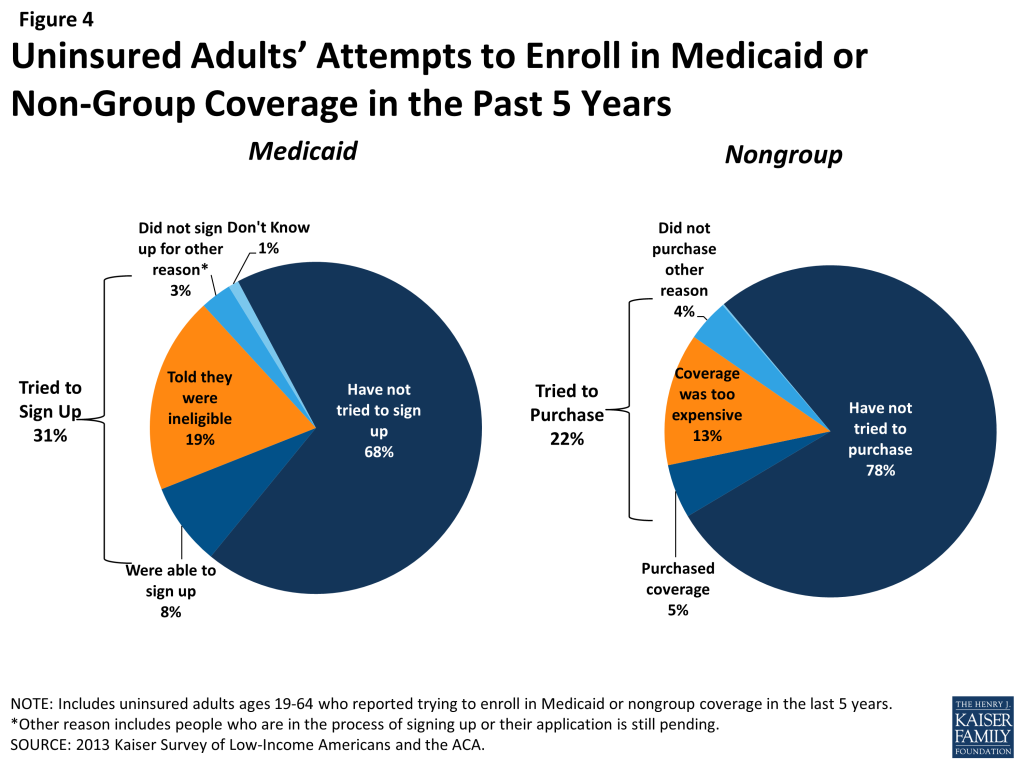
Hope Network reports that, for the small cohort of clients who received Navigator Team services and for whom longitudinal data were available, psychiatric inpatient admissions per person fell from an average of 1.95 in the year prior to receipt of navigator services, to .48 after receiving navigator services for one year.

4. Health Homes

“Health homes,” a new Medicaid state plan option established by the ACA, are designed to support comprehensive, coordinated care for Medicaid beneficiaries with complex health care needs. Medicaid health homes can be viewed as an outgrowth and enhancement of the patient-centered medical home (PCMH) model, a care delivery approach designed to promote care that is patient-centered, coordinated across the health care spectrum, and provided by a team of professionals led by a patient’s personal physician.21  The ACA provides for a temporary 90% federal Medicaid matching rate for health home services provided to Medicaid beneficiaries who have two chronic conditions, or have one chronic condition and are at risk for another, or have one serious and persistent mental health condition.22  Health home services include comprehensive care management; care coordination and health promotion; comprehensive transitional care; patient and family support; referral to community and social support services; and the use of health information technology to support these services. The idea is that health home services connect, coordinate, and integrate the many services and supports, including primary health care, behavioral health care, acute and long-term services, and family and community-based services, that Medicaid beneficiaries with chronic and often complex conditions need.

In health home programs for Medicaid beneficiaries with serious mental health conditions, behavioral health agencies are a natural choice to be the designated health home providers. However, there are some challenges to overcome. First, behavioral health providers must be willing and able to provide the holistic and longitudinal care expected from the health home model, which may not have been their mode of practice previously. Second, state and federal laws intended to protect client confidentiality regarding the use of mental health and substance abuse treatment services have had the unintended consequence of preventing information-sharing that is essential to support integrated care for individuals with both physical and behavioral health needs. Third, both low Medicaid reimbursement rates for behavioral health services and fee-for-service payment have worked against a more integrated approach to care. In combination, these factors have contributed to a siloed system of behavioral health care, with limited incentives and capacity for coordination and collaboration aimed at producing more comprehensive and integrated care.

A growing number of states are using the health home option and its enhanced federal support to advance PH/BH integration for Medicaid beneficiaries. Missouri was the first state to adopt health homes specifically for individuals with SMI (see Box 5). Since then, four additional states (Rhode Island, Ohio, Iowa, and Maryland) have received approval for health home programs targeted to this population, and all but two of the 13 states with approved health home programs include SMI as one of the chronic conditions that can qualify Medicaid beneficiaries to enroll in health homes. The comprehensive nature of health home services and the holistic approach to care that health homes represent place health homes further “east” on the PH/BH integration continuum than the models discussed earlier.

Box 5: In Missouri’s health home program for people with behavioral health conditions, community mental health centers (CMHCs) certified by the state Department of Mental Health serve as designated providers, responsible for providing health home services as well as behavioral health treatment to participating Medicaid beneficiaries. In addition to meeting federal health home requirements, the CMHCs must also meet state-established criteria in order to provide health home services, including active use of the state’s electronic health record for care coordination and prescription monitoring; access standards; NCQA recognition as a PCMH; and improvement on state-specified clinical indicators.

Health home providers receive a per member per month fee that is based on the costs of establishing a clinical and administrative team to provide health home services, including a health home director responsible for leading practice transformation and day-to-day operation of the health home, and, at a minimum, nurse care managers with primary care backgrounds, primary care providers under contract to provide medical consultation and treatment, and administrative support staff. Since becoming designated health home providers, the CMHCs have provided extensive training to staff on topics such as patient engagement in treatment, support for patients with complex medical conditions, and team-based care. The CMHCs screen for medical concerns and use evidence-based practice guidelines to treat identified conditions, such as heart disease and diabetes. Additional strategies include comprehensive care management and care coordination, wellness education and self-care management, and integrated care plans, all of which are supported by the state’s electronic health record system for Medicaid enrollees.

Missouri has enrolled close to 19,000 Medicaid beneficiaries in CMHC-led health homes. Preliminary results reported by the state indicate that the percentage of beneficiaries in these health homes who had one hospitalization or more declined by 27% between 2011 and 2012. In addition, adults continuously enrolled since the inception of the program (approximately 2,800 individuals) showed marked improvement in key quality metrics related to management of diabetes, blood pressure, and cholesterol levels.23  These preliminary data suggest the potential that PH/BH integration through health homes might hold to improve outcomes, decrease unnecessary hospital utilization, and reduce costs for high-need Medicaid members.

5. System-Level Integration of Care

While the approaches described above involve efforts to coordinate physical and behavioral health care that sometimes extend well beyond the organizational boundaries of clinicians, practices, and agencies, each model stops short of fully integrated services and fiscal accountability, which underpin truly person-centered and holistic care. Such system-level or systemic integration represents the most advanced stage on the PH/BH integration continuum.

Box 6: In Maricopa County’s model, funding and accountability for care provided to county residents with SMI will rest with one managed care entity that is responsible for providing behavioral health care that encompasses recovery services for those with the most serious mental health and substance use disorders, and for providing physical as well as behavioral health services for Medicaid-covered adults with SMI. The managed care entity is expected to build on the use of SMI health homes, blending strengths of the PCMH model with best practices from the behavioral health system, including:

  • Health education and health promotion;
  • Primary prevention;
  • Early identification and intervention that reduce the incidence and severity of serious physical and mental illness;
  • Member-defined engagement, treatment planning, and service delivery;
  • Peer and family members actively involved participants at all levels; and
  • Implementation of SAMHSA evidence-based practices designed to promote and support Recovery for adults with SMI including Supported Employment, Permanent Supportive Housing and Assertive Community Treatment a multidisciplinary team approach that provides off-site treatment, rehabilitation and support to persons with serious and persistent mental illness.

Additionally, the managed care plan would have to meet specific benchmarks designed to measure the plan’s performance in improving care and the patient care experience and in reducing growth in aggregate physical and behavioral health care costs.

One model of system-level integration can be seen in the Medicaid managed care program in Maricopa County, Arizona (see Box 6). Many states with Medicaid managed care programs include limited behavioral health benefits in their contracts with managed care organizations (MCOs) – typically, a limited psychiatric inpatient benefit, outpatient therapy and, sometimes, inpatient detoxification. Behavioral health services for Medicaid enrollees who require more intensive treatment and rehabilitation services and supports have often been viewed as beyond the scope of Medicaid MCO contracts, and beneficiaries generally obtain these services on a fee-for-service basis, or through a separate Behavioral Health Organization (BHO), or through the local or state mental health and substance abuse authorities. In a departure from this model, Arizona recently issued a procurement for a contractor to serve as the Regional Behavioral Health Authority in Maricopa County, which would be responsible for providing all Medicaid and other publicly-funded behavioral health services for county residents and, in the case of adult Medicaid beneficiaries with SMI, for providing Medicaid-covered physical health services as well. In this way, Arizona is seeking a comprehensive, fully integrated health plan to provide the full complement of physical and behavioral health care for adult Medicaid enrollees with SMI, including coordination of Medicare and Medicaid benefits for dual eligible members. In addition to integrated PH/BH care for adults with SMI, the chosen vendor will also be responsible for behavioral health services for both children and other adults in Medicaid, and for non-Medicaid children and adults for whom the Arizona Department of Health Services’ Division of Behavioral Health Services receives funding. The state recently issued a Request for Information (RFI) exploring the feasibility of implementing a similar model statewide. An assessment of whether the approach – that is, holding a managed care entity accountable and at financial risk for the full spectrum of behavioral health and Medicaid-covered physical health services for the Medicaid SMI population – results in a high degree of PH/BH integration will be of wide interest to other state Medicaid programs. It may also help to inform federal initiatives to promote innovative models of coordinated and accountable care that are focused particularly on individuals and populations with the most complex and high-cost needs for care.

Conclusion

The rising human as well as economic costs of fragmented health care, especially for those with the most complex needs, have fueled interest in and demand for more patient-centered approaches to providing care to Medicaid beneficiaries. Because of the morbidity and mortality risk profile of those with behavioral health conditions, Medicaid’s large role in covering this population, and the fact that individuals with behavioral health comorbidities are among the program’s highest-cost beneficiaries, models that improve the integration of physical and behavioral health care are attracting keen attention and taking hold in many places. No single approach in Medicaid is likely to be a universal solution; rather, a diversity of promising strategies present options for states, health plans, and providers seeking to move further in the direction of integrating care. As different models emerge and evolve, it will be important to examine how they operate and what they require, and to evaluate their performance from the perspective of patient outcomes and experience and other Medicaid program goals.

This brief was prepared by Mike Nardone and Sherry Snyder of Health Management Associates and Julia Paradise of the Kaiser Family Foundation.


* Medicaid enrollees who are also eligible for Medicare are excluded from these data.

Endnotes

  1. Parks J et al., Mortality and Morbidity in People with Serious Mental Illness, National Association of State Mental Health Program Directors, October 2006. http://www.dsamh.utah.gov/docs/mortality-morbidity_nasmhpd.pdf ↩︎
  2. Kronick R et al., The Faces of Medicaid III: Refining the Portrait of People with Multiple Chronic Conditions, Center for Health Care Strategies, October 2009. http://www.chcs.org/publications3960/publications_show.htm?doc_id=1058416 ↩︎
  3. Mental Health Financing in the United States: A Primer, Kaiser Commission on Medicaid and the Uninsured, April 2011. ↩︎
  4. Kronick et al. Op. cit. ↩︎
  5. Smith V et al., Medicaid Today, Preparing for Tomorrow: A Look at State Medicaid Program Spending, Enrollment, and Policy Trends, Kaiser Commission on Medicaid and the Uninsured, October 2012. ↩︎
  6. Heath B et al., A Standard Framework for Levels of Integrated Healthcare, SAMHSA-HRSA Center for Integrated Health Solutions, March 2013. ↩︎
  7. Integrated Publicly Funded Physical and Behavioral Health Services: A Description of Selected Initiatives, Final Report, prepared by Health Management Associates for the Robert Wood Johnson Foundation, February 2007 ↩︎
  8. Screening, Brief Intervention and Referral to Treatment in Behavioral Healthcare, SAMHSA White Paper, April, 2011. ↩︎
  9. See Oregon CCO Incentive Measures, Oregon Health Authority website, http://www.oregon.gov/oha/Pages/CCO-Baseline-Data.aspx ↩︎
  10. Achieving the Promise: Transforming Mental Health Care in America, The President’s New Freedom Commission on Mental Health, Final Report, July 2003. ↩︎
  11. Kelleher I et al., Identification and Characterization of Prodromal Risk Syndromes in Young Adolescents in the Community: A Population-Based Clinical Interview Study, Schizophrenia Bulletin 38 (2), March 2012. http://www.ncbi.nlm.nih.gov/pubmed/22101962 ↩︎
  12. McGorry P et al., Early Intervention in Psychosis: Concepts, Evidence and Future Directions, World Psychiatry 7(3), October 2008.  http://onlinelibrary.wiley.com/doi/10.1002/j.2051-5545.2008.tb00182.x/full ↩︎
  13. This pilot was developed through a collaborative effort between the state Medicaid program and the Office of Mental Health and Substance Abuse Services, Montgomery County Office of Behavioral Health, and its managed care partner, Magellan Behavioral Health of Pennsylvania. ↩︎
  14. “’Peers’ Seen Easing Mental Health Worker Shortage,” Kaiser Health News, September 11, 2013. http://www.kffhealthnews.org/stories/2013/september/11/peer-mental-health-workers.aspx?referrer=search ↩︎
  15. Druss B et al., The Health and Recovery Peer Program: A Peer-Led Intervention to Improve Medical Self-Management for Persons with Serious Mental Illness, Schizophrenia Research 118(1-3), May 2010.  http://www.ncbi.nlm.nih.gov/pmc/articles/PMC2856811/ ↩︎
  16. http://bphc.hrsa.gov/healthcenterdatastatistics/index.html ↩︎
  17. Public Law 111-148, The Patient Protection and Affordable Care Act, Section 10503 (a) and (b). ↩︎
  18. Lardiere M et al., NACHC 2010 Assessment of Behavioral Health Services Provided in Federally Qualified Health Centers, National Association of Community Health Centers, January 2011.  http://www.nachc.com/client/NACHC%202010%20Assessment%20of%20Behavioral%20Health%20Services%20in%20FQHCs_1_14_11_FINAL.pdf ↩︎
  19. Brolin M et al., Financing of Behavioral Health Services within Federally Qualified Health Centers, SAMHSA/HRSA, July 23, 2012. http://www.integration.samhsa.gov/Financing_BH_Services_at_FQHCs_Final_7_23-12.pdf ↩︎
  20. Recovery Navigation Teams, The Hope Network Diversion Program Report, 2013. ↩︎
  21. Joint Principles of the Patient-Centered Medical Home, American Academy of Family Physicians,  American Academy of Pediatrics, American College of Physicians, and American Osteopathic Association, February 2007. http://www.aafp.org/dam/AAFP/documents/practice_management/pcmh/initiatives/PCMHJoint.pdf ↩︎
  22. P.L. 111-148, The Patient Protection and Affordable Care Act, Section 2703. ↩︎
  23. October 29, 2013 PowerPoint document provided by Dr. Joseph Parks, Chief Clinical Officer, Missouri Department of Mental Health.  ↩︎

The Uninsured at the Starting Line: Findings from the 2013 Kaiser Survey of Low-Income Americans and the ACA

Authors: Rachel Garfield, Rachel Licata, and Katherine Young
Published: Feb 6, 2014

Executive Summary

In January 2014, the major coverage provisions of the 2010 Affordable Care Act (ACA) went into full effect. These provisions include the creation of new Health Insurance Marketplaces where low and moderate income families can receive premium tax credits to purchase coverage and, in states that opted to expand their Medicaid programs, the expansion of Medicaid eligibility to almost all adults with incomes at or below 138% of the federal poverty level (FPL). The ACA has the potential to reach many of the 47 million Americans who lack insurance coverage, as well as millions of insured people who face financial strain or coverage limits related to health insurance.

Though implementation is underway and people are already enrolling in coverage, policymakers continue to need information to inform coverage expansions. Data on the population targeted for coverage expansions can help policymakers target early efforts, provide insight into some of the challenges that are arising in the first months of new coverage, and evaluate the ACA’s longer-term effects. The Kaiser Family Foundation has launched a new series of comprehensive surveys of the low and moderate income population to provide data on these groups’ experience with health coverage, current patterns of care, and family situation. This report, based on the baseline 2013 Kaiser Survey of Low-Income Americans and the ACA, provides a snapshot of health insurance coverage, health care use and barriers to care, and financial security among insured and uninsured adults across the income spectrum at the starting line of ACA implementation. The report also examines how findings from the baseline survey can help policymakers understand and address early challenges in implementing health reform.  Detailed information on the survey design, sample, and analysis can be found in the Methods section at the end of the full report.

Background

Prior to implementation of the ACA, over 47 million Americans—nearly 18% of the population—were without health insurance coverage. Because publicly-financed coverage has been expanded to most low-income children and Medicare covers nearly all of the elderly, the vast majority of uninsured people are nonelderly adults.1  The main barrier that people have faced in obtaining health insurance coverage is cost: health coverage is expensive, and few people can afford to buy it on their own. While most Americans traditionally obtain health insurance coverage as a fringe benefit through an employer, not all workers are offered employer coverage, and not all adults are working. Medicaid and the Children’s Health Insurance Program (CHIP) cover many low-income children, but eligibility for parents and adults without dependent children is limited, leaving many adults without affordable coverage.

These barriers to coverage are reflected in the characteristics of the uninsured population. Uninsured adults are more likely to be low-income than people with private health insurance, while adults with Medicaid coverage are particularly low-income (reflecting very low pre-ACA eligibility limits). Corresponding to their lower incomes, uninsured adults are less likely than privately insured adults to be in a working family; however, the majority of uninsured adults are in a family with either a full- or part-time worker. Uninsured adults also differ from insured adults with regards to other demographic characteristics, often reflecting association with income or work status. For example, they are more likely to be younger than insured adults, as younger adults have lower incomes and looser ties to employment than older adults. There also are significant racial and ethnic differences in health coverage among nonelderly adults, primarily reflecting differences in income by race/ethnicity.

I. Patterns of Coverage and the Need for Assistance

Examining patterns of coverage and the reasons the uninsured lack coverage can inform both outreach avenues and potential barriers to outreach and enrollment. Key survey findings on access to coverage include:

For most currently uninsured adults, lack of coverage is a long-term issue. While some people experience short spells of uninsurance due to job changes, income fluctuations, or renewal issues, for most uninsured adults, lack of coverage is a chronic issue. The survey shows that almost half (47%) of uninsured report being uninsured for 5 years or more, and 18% report that they have never had coverage in their lifetime.

Many uninsured adults report trying to obtain insurance coverage in the past, but most did not have access to affordable coverage. Prior to the ACA, the uninsured reported difficulty gaining insurance coverage due to the high cost of coverage and limits on Medicaid eligibility for adults. Eight in ten uninsured adults report no access to employer insurance, and the majority of people who had access to coverage through an employer report that the coverage offered to them is not affordable. One in three uninsured adults (31%) reported trying to sign up for Medicaid in the past five years, and the majority of them were unsuccessful because they were told they were ineligible. And one in five uninsured adults (22%) reported trying to obtain non-group coverage in the past five years, with most not purchasing a plan because the policy they were offered was too expensive.

Health insurance coverage is not always stable. For most insured adults, coverage is continuous throughout the year and over time, but a sizable number have a gap or change in coverage. When accounting for both insured people with a gap in their coverage and uninsured people who recently lost coverage, the survey indicates that nearly 18 million adults lose or gain coverage over the course of a year. In addition to those who lose or gain coverage over the course of a year, 17 million continuously insured adults have a change in their health insurance plan. The most common reasons for a change in coverage appear to be related to employment. Last, a small number of insured adults report challenges in either renewing or keeping their coverage, another indication of instability in coverage throughout the year.

Informing ACA Implementation:  Many of the barriers to coverage that the uninsured report facing in the past are addressed by the ACA’s provisions to expand Medicaid and provide premium tax credits for Marketplace coverage. However, some uninsured adults may continue to face barriers to coverage, as not all employers are required to offer coverage and not all states are expanding their Medicaid programs. People targeted by the ACA have varying levels of experience with the insurance system. A large share of uninsured adults has been outside the insurance system for quite some time, and the long-term uninsured may require targeted outreach and education efforts to link them to the health care system and help them navigate their new health insurance. In addition, people who have attempted to obtain coverage in the past may be unaware that rules and costs have changed under the ACA; outreach and education will be needed to inform people that eligibility rules have changed and that financial assistance is available to offset the cost of coverage.

Survey findings on changes in insurance coverage over the course of the year indicate that, even after implementation, adults are likely to experience coverage changes due to job changes or income fluctuation. While there has been much focus on the early effort to enroll currently uninsured people in coverage, these findings demonstrate that implementation is not a “one shot” effort that will be done once people are enrolled in the early part of 2014 but rather will require a continuous effort to enroll and keep people in coverage.

II. What to Look for in Enrolling in New Coverage

While many currently uninsured adults have limited experience in signing up for and using health coverage, the past successes and challenges of insured low-and moderate income adults can inform the experiences of those seeking coverage under the ACA. Key survey findings related to plan enrollment and plan choice are:

Most adults did not report problems in applying for and enrolling in Medicaid coverage prior to the ACA, but some encountered difficulties in the process of gaining public coverage in the past. Adults who currently have Medicaid or who have attempted to enroll in the past five years report little difficulty in taking steps to enroll in Medicaid, with half saying the entire process was very or somewhat easy. However, the rest found at least one aspect of the process – finding out how to apply, filling out the application, assembling the required paperwork, or submitting the application – to be somewhat or very difficult.

In choosing their Medicaid or private insurance plan, adults do not always prioritize costs, and many find some aspect of the plan choice process to be a challenge.  Adults choose health plans for various reasons, with 32% reporting that they chose their plan because it covered a wide range of benefits or a specific benefit that they need, 29% because their costs would be low, and 22% because the plan had a broad selection of providers or included their doctor. In choosing a plan, people may face challenges in comparing costs, services, and provider networks, as these factors typically varied greatly across plans in the past. In general, insured adults report that they did not have difficulty in comparing their plan choices, but 36% found some aspect of plan choice—comparing services, comparing costs, and comparing providers— to be difficult.

Overall, insured adults report satisfaction with their current coverage but also report gaps in covered services and problems when using their coverage. Most (85%) insured adults rate their pre-ACA coverage as excellent or good, but they also report gaps in services that are covered by their current insurance. One in six (17%) insured adults report needing a service that is not covered by their current plan, typically ancillary services such as dental, vision care, and chiropractor services. Many insured adults reported experiencing a problem with their current insurance plan covering a specific benefit, either because they were denied coverage for a service they thought was covered (25%) or their out-of-pocket costs for a service were higher than they expected (37%).

Informing ACA Implementation. The ACA includes provisions to simplify the Medicaid application and enrollment process for coverage in all states, regardless of whether they are expanding their Medicaid program. The ACA also requires plans in the Marketplace to provide detailed, standardized plan information for people to compare coverage options. Uninsured adults applying for coverage after these new processes are implemented should encounter fewer challenges in navigating enrollment and plan choice than applicants have in the past. However, in evaluating the success of plan enrollment, it is important to bear in mind historical challenges people have faced in comparing and selecting insurance coverage. It is also important to remember that people place utility on a range of factors related to insurance, including scope of services and provider networks. Assessments of whether people are choosing the optimal plan for themselves and their family will need to consider the multiple priorities that people balance in plan selection. Last, while the ACA aims to ensure coverage of at least a basic set of essential health benefits (EHB), many of the ancillary services that people report needing coverage for—such as dental services—are not included in the EHB. Newly-insured people may be surprised to learn that some ancillary services are not included in their plan, and education efforts will be needed to make sure people understand their coverage.

III. Gaining Coverage, Getting Care

As uninsured adults gain coverage, there are likely to be changes in how often they seek care, what type of care they seek, and where they seek care. By comparing their current interactions with the health care system to their insured counterparts, the survey can provide insight into likely changes. Key findings in this area include:

A large segment of the uninsured has little or no connection to the health care system. Most uninsured adults report few connections to the health care system. Only 51% of uninsured adults report that they have a usual source of care, or a place to go when sick or need advice about their health, and only 33% of uninsured adults have a regular doctor, half the rate of insured adults. This lack of a connection to the health care system leads many uninsured adults to go without care. More than four in ten uninsured adults (41%) reported no health care visits in the past year, compared to 10% of Medicaid beneficiaries and 13% of adults with employer coverage.

A substantial share of the uninsured has health needs, many of which are unmet or only met with difficulty. Despite being as likely as those with private insurance to report having an ongoing health condition, uninsured adults are less likely than their insured counterparts to receive care. When uninsured individuals do receive care, they sometimes receive free or reduced-cost care, though the majority who use services do not. Almost half (49%) of the uninsured report needing but postponing care compared to 28% of adults with employer coverage, 36% with nongroup coverage, and 41% of Medicaid beneficiaries. The most common reason for postponing care among the uninsured is cost, as the uninsured must pay the full cost of their care.

Many of the uninsured report limited options for receiving health care when they need it. Uninsured adults are less likely than their insured counterparts to receive care in a private physician office when they do get care. Uninsured adults are more likely than other adults to report that they have limited options for their usual source of care, with 18% of uninsured people reporting that they chose their usual source of care because it is the only option available to them, compared to 10% of adults with Medicaid and 4% with employer coverage.

Informing ACA Implementation: The survey findings reinforce conclusions based on prior research: having health insurance affects the way that people interact with the health care system, and people without insurance have poorer access to services than those with coverage. Thus, gaining coverage is likely to connect many currently uninsured adults to the health care system. Given the health profile of the currently uninsured population, there is likely to be some pent-up demand for health care services among the newly-covered. However, outreach may be needed to link the newly-insured to a regular provider and help them establish a pattern of regular preventive care. In particular, some individuals who have relied on emergency rooms or urgent care centers as their usual source of care may require help in establishing new patterns of care and navigating the primary care system. While the uninsured may have more options for where to receive their care once they obtain coverage under the ACA, clinics and hospitals that already see a large share of uninsured adults may play an important role in serving this population once they gain insurance. Last, while coverage gains may reduce cost barriers to coverage, it will be important to monitor whether other barriers to care among the low-income population—such as transportation or wait times for appointments—continue to pose a challenge for access.

IV. Health Coverage and Financial Security

In addition to facilitating access to health care, health insurance serves primarily to protect people from high, unexpected medical costs. However, for low-income families, health costs can still be a burden, even if they have insurance. Understanding these issues can help policymakers monitor ongoing financial barriers to health services.

Health care costs pose a challenge for low- and moderate-income families, even if they have insurance coverage. Even among those with insurance, health care costs can be a burden, particularly for low- and moderate-income adults. About a third low- and moderate-income adults covered by employer coverage report that their share is somewhat hard or very hard for them to afford, and 76% of the low-income and 58% of moderate income adults with nongroup coverage report such difficulty. Health care costs translate to medical debt for many l0w-income adults, and these medical bills can cause serious financial strain. Among those who reported a problem with medical bills, the vast majority in every coverage and income category reported that medical bills caused them to either use up all or most of their savings, have difficulty paying for necessities, borrow money, or be contacted by a collection agency. Notable shares of low-income insured adults also report that they lack confidence in their ability to afford health care, given their current finances and health insurance situation. Of particular note is the finding that about half of adults with nongroup coverage do not feel confident that they could afford costs related to a major illness given their coverage and financial situation.

Low-income families face fragile financial circumstances. Low- and moderate-income adults across coverage groups report not being financially secure. However, adults who are low-income and uninsured or covered by Medicaid are particularly vulnerable to financial insecurity even outside of health care. General financial insecurity translates to concrete financial difficulties in making ends meet. Uninsured adults and those on Medicaid are more likely than privately-insured adults to have difficulty paying for other necessities such as food, housing, or utilities, with 58% reporting such difficulty compared to 19% of those with employer coverage and a quarter of those with nongroup coverage. While low-income adults across the coverage spectrum report high rates of difficulty paying for necessities, those with employer coverage report the lowest rates in this income group. These individuals may have the stronger or more stable ties to employment than their counterparts with other or no insurance coverage.

Informing ACA Implementation: Both insured and uninsured low-income adults struggle with medical bills and debt, and coverage expansions, assistance with premium costs, and limits on out-of-pocket costs under the ACA have the potential to ameliorate the financial issues associated with the cost of health care. However, given survey findings that many low-income insured people continue to face financial challenges related to health care, it will be important to track whether there are ongoing financial barriers as people enroll in coverage and seek care. While insurance coverage can provide financial protection in the event of illness or injury, it is not curative of all of the financial burdens faced by low-income families. Given their overall situation, health insurance alone may not lift low-income people out of poverty, and many low-income adults may continue to face financial challenges even after gaining coverage.

V. Low- and Moderate-income Uninsured Adults’ Readiness for the ACA

As outreach and enrollment efforts are underway, information on low- and moderate-income adults’ access to tools for signing up and connections to outreach avenues can be helpful in addressing barriers. Key survey findings in this area include:

A majority of uninsured adults who are income eligible for coverage expansions reported knowing little or nothing about Medicaid and Marketplace programs prior to the start of open enrollment. Despite ongoing media attention to the ACA, seven in ten uninsured adults with incomes in the Medicaid target range (<138% FPL) said they knew nothing at all or only a little about their state’s Medicaid program, and eight in ten uninsured adults in the income range for Marketplace subsidies (139-400% FPL) reported that they knew nothing at all or only a little about the Marketplaces. More recent polling data indicates that lack of knowledge remains high despite recent media attention to the ACA.

While most uninsured adults have the necessary tools for enrolling in coverage, some will experience additional logistical issues in signing up. Under the ACA, internet access is an important tool in accessing coverage. While the majority of uninsured adults have access to the internet either at home or outside the home, 19% of low-income (<138% FPL) and 14% of moderate income (139-400% FPL) uninsured adults report that they do not have internet access readily available. For Marketplace coverage, people will require a means to pay their premiums on a regular basis. While plans must accept various forms of payment, direct withdrawal from a checking account is a simple and reliable way to ensure that premiums are paid on time. However, nearly a quarter (23%) of uninsured adults in the income range for Marketplace subsidies report that they do not have a checking or savings account.

Many uninsured adults could be reached through targeted outreach avenues. Among uninsured adults with incomes in the range for Medicaid eligibility (<138% FPL), over six in ten (62%) report that they or someone in their immediate family receives either SNAP, cash assistance, disability payments, or Medicaid or CHIP, making “fast track” enrollment efforts through using information collected by other agencies a promising avenue for outreach. For those without a connection to social services agencies, outreach through providers may be a promising approach, as about one in five low- or moderate-income uninsured adults report that they use a clinic or health center as their usual source of care. While fewer report using a hospital outpatient department for regular care, hospitals reach many uninsured adults through periodic visits.

Informing ACA Implementation: Both survey findings and more recent polling data indicate that there is a great need for education of new coverage options among people targeted for expansions. Even once eligible individuals learn about coverage options, they may face logistical challenges in signing up. People without internet access via a computer may be able to enroll through other more traditional avenues such as over the phone or in person at county offices or providers, but efforts may be needed to inform people of these other application routes, and some using them may experience slower enrollment process than they would if they applied online. Finally, “fast track” enrollment efforts are a promising approach to facilitating enrollment, but broader efforts will also be needed to reach the eligible uninsured population.

Report: Introduction

In January 2014, the major coverage provisions of the 2010 Affordable Care Act (ACA) went into full effect. These provisions include the creation of new Health Insurance Marketplaces where low and moderate income families can receive premium tax credits to purchase coverage and, in states that opted to expand their Medicaid programs, the expansion of Medicaid eligibility to almost all adults with incomes at or below 138% of the federal poverty level (FPL) ($15,856 for an individual or $26,951 for family of three in 2013). With these coverage provisions, ACA has the potential to reach many of the 47 million Americans who lack insurance coverage, as well as millions of insured people who face financial strain or coverage limits related to health care.

Though ACA implementation is underway and people are already enrolling in coverage, policymakers continue to need information to inform coverage expansions. Reports of difficulties in enrolling in coverage, continued confusion and lack of information about the law point to challenges in the early stages of implementation. In the future, data will be needed to assess whether and how the ACA is helping low- and moderate-income families gain affordable coverage, access needed care, and obtain financial security. Detailed data on the population targeted for coverage expansions’ experience with health coverage, current patterns of care, and family situation can help policymakers target early efforts, provide insight into some of the challenges that are arising in the first months of new coverage, and evaluate the ACA’s longer-term affects.

To that end, the Kaiser Family Foundation has launched a new series of comprehensive surveys of the low and moderate income population. This report, based on the baseline 2013 Kaiser Survey of Low-Income Americans and the ACA, provides a snapshot of health insurance coverage, health care use and barriers to care, and financial security among insured and uninsured adults across the income spectrum at the starting line of ACA implementation. It also provides a baseline for future assessment of the impact of the ACA on health coverage, access, and financial security of low- and moderate-income individuals nationwide. Future reports using this baseline survey will provide additional in-depth analysis of issues in ACA implementation, such as differences between states expanding their Medicaid programs and those not expanding; in-depth analysis of issues in affordability of health care and family finances; Medicaid’s role in facilitating access to care; and challenges facing part-time workers, among others. Forthcoming separate state reports focusing on California, Missouri, and Texas will analyze these issues in the context of state-specific efforts to implement the law.

This report examines how findings from the baseline survey can help policymakers understand and address early challenges in implementing health reform.  Throughout sections that focus on findings related to i) patterns of insurance coverage, ii) the process of selecting and enrolling in health coverage, iii) interactions with the health care system, iv) financial security, and v) readiness for ACA coverage expansions, the report highlights findings that can inform outreach and enrollment workers, health plans, and providers and health systems. A detailed explanation of the methods underlying the survey and analysis is available in the Methods section of the report.

Report: Background: The Challenge Of Gaining Insurance Coverage Prior To The Aca

Prior to implementation of the ACA, over 47 million Americans—nearly 18% of the population—were without health insurance coverage. Because publicly-financed coverage has been expanded to most low-income children and Medicare covers nearly all of the elderly, the vast majority of uninsured people are nonelderly adults.2  Not having health insurance has well-documented adverse effects on people’s use of health care, health status, and mortality, as the uninsured are more likely to delay or forgo needed care leading to more severe health problems.3  Lack of insurance coverage also has implications for people’s personal finances, providers’ revenue streams, and system-wide financing.4 ,5 ,6  The coverage provisions in the 2010 Affordable Care Act (ACA) sought to address these issues by making coverage more available and affordable, particularly for people with low or moderate incomes.

The main barrier that people have faced in obtaining health insurance coverage is cost: health coverage is expensive, and few people can afford to buy it on their own. While most Americans traditionally obtain health insurance coverage as a fringe benefit through an employer, not all workers are offered employer coverage, and not all adults are working. Medicaid and the Children’s Health Insurance Program (CHIP) cover many low-income children, but eligibility for parents and adults without dependent children is limited, leaving many adults without affordable coverage.

These barriers to coverage are reflected in the characteristics of the uninsured population. Compared to those with private coverage, uninsured adults are more likely to be low-income (Figure 1). A majority of uninsured adults (53%) are low-income, or have incomes at or below 138% FPL, in contrast to 11% of adults with employer coverage and 14% of adults with nongroup. Adults with Medicaid are the most likely of any coverage group to be low-income, reflecting the fact that prior to the ACA, adult income eligibility limits were generally very low (often below half the poverty level). Less than one in ten uninsured adults have incomes greater than 400% FPL, compared to over half of adults with employer coverage (53%) and 42% of adults with nongroup coverage.

Figure 1: Income Distribution Among Adults, By Insurance Coverage

Corresponding to their lower incomes, uninsured adults are less likely than privately insured adults to be in a working family; however, the majority of uninsured adults are in a family with either a full- or part-time worker. About two-thirds (66%) of uninsured adults are in a working family (that is, either they, or their spouse if they are married, report working either full or part-time), in contrast to 91% of adults with employer coverage and 79% of adults with nongroup coverage (Figure 2). Adults with Medicaid are the least likely to be in a working family (30%), again reflecting very low income eligibility limits for adults prior to the ACA.

Figure 2: Family Work Status Among Adults, By Insurance Coverage

Uninsured adults also differ from insured adults with regards to other demographic characteristics. Uninsured adults are likely to be younger than insured adults, as younger adults have lower incomes and looser ties to employment than older adults. Two-thirds (67%) of uninsured adults are ages 19-44 as compared to 56% of adults with employer coverage or Medicaid and 41% of adults with nongroup coverage (Appendix Table A1).

There also are significant racial and ethnic differences in health coverage among nonelderly adults. For example, uninsured adults are more likely to be Hispanic – 30% of uninsured adults are Hispanic – than adults with employer coverage (11%), nongroup coverage (9%), or Medicaid (18%). About half (49%) of uninsured adults are White, non-Hispanic, compared to 75% of adults with nongroup coverage, and 70% of adults with employer sponsored insurance. Racial and ethnic differences in coverage rates, which are reflective of differences in income and work status by race/ethnicity, have implications for efforts to address health care disparities. Also, about one in five uninsured adults is a noncitizen (19%), compared to less than 7% of adults with Medicaid or employer coverage. Citizenship status may leave many uninsured adults ineligible for Medicaid, increasing the likelihood they will remain uninsured.

Among the primary goals of the ACA were filling in gaps in the availability of public coverage by expanding Medicaid eligibility for low-income adults and making private coverage more affordable for moderate-income adults who lack access to coverage through a job. The ACA also aims to simplify and coordinate eligibility and enrollment across programs, ensure coverage for a basic package of health benefits, and facilitate innovations in service delivery. As policymakers embark on early implementation of the law, it is important to remember who the ACA aims to help and how their characteristics may inform efforts to reach them.

Report: I. Patterns Of Coverage And The Need For Assistance

Coverage Dynamics among the Insured and Uninsured

Health insurance coverage is dynamic, and every year millions of Americans gain, lose, or change their health coverage. However, for most uninsured adults, lack of coverage is a long-term issue that spans many years. Many uninsured adults report trying to obtain coverage in the past but were unsuccessful due to barriers such as ineligibility for public coverage or high costs of private coverage. Under the ACA, millions of uninsured are projected to gain coverage as those barriers are removed, but some may continue to experience gaps or changes in coverage.

For most currently uninsured adults, lack of coverage is a long-term issue.

While some people lack health insurance coverage during short periods of unemployment or job transitions, for many uninsured adults, lack of coverage is a chronic problem. The survey shows that a large share of uninsured adults have been without insurance for a very long period of time: Almost half (47%) report being uninsured for 5 years or more, and 18% report that they have never had coverage in their lifetime (Figure 3 and Appendix Table A2).

Figure 3: Length of Time without Coverage, Among Currently Uninsured Adults

Perhaps not surprisingly, adults who have been without insurance coverage for at least five years are, on average, older than those who have been uninsured for shorter periods of time. Nearly two-thirds (63%) of adults who have been uninsured for five years or more are ages 35-64, compared to just 47% of adults who have been uninsured for less than a year (data not shown). However, on other characteristics, such as race, gender, citizenship, income, and health status, long-term and short-term uninsured adults resemble each other.

“I don’t know how to go about getting insurance.”
Alexa (TX), long-term uninsured

It is important for policymakers implementing coverage expansions to be aware that people targeted by the ACA have varying levels of experience with the insurance system. While some only recently lost coverage, a large share of uninsured adults has been outside the insurance system for quite some time. The long-term uninsured may require targeted outreach and education efforts to link them to the health care system and help them navigate their new health insurance.

Many uninsured adults report trying to obtain insurance coverage in the past, but most did not have access to affordable coverage.

The uninsured report a desire to obtain coverage, but prior to implementation of the ACA, options for coverage—particularly for the low-income—were limited. The vast majority of uninsured adults do not have access to employer coverage. Eight in ten uninsured adults report no access to employer  insurance, either because no one in their family is working for an employer, their or their spouse’s employer does not offer coverage, or they are ineligible for that coverage (Table 1). For example, 47% of uninsured adults are in a family without an employer, meaning both they and their spouse (if married) are either not working or are working but are self-employed. A quarter of uninsured adults are in a family that has an employer who does not offer coverage to any workers, and 10% are in a family that works for an employer who offers coverage but they are ineligible for that coverage. Most are ineligible because they work part-time or are in a waiting period.  Less than one in five (18%) uninsured adults does have access to coverage through an employer, but the majority of those people report that the coverage offered to them is not affordable.

Table 1: Access to Employer Health Coverage Among Uninsured Adults
All UninsuredUninsured by Income
<138% FPL139-400% FPL>400% FPL
%%%%
No Access to ESI82% 86%78%^78%
No one in family has an employer*47%54%37%^51%
Firm doesn’t offer coverage25%25%30%
Not eligible for coverage10%7%12%
Access to ESI18% 14%22%^
Cannot afford premium11%8%12%
Don’t think need coverage
Some other reason6%5%9%
Note:  Don’t Know and Refused responses are not shown, they account for less than 3% of the uninsured population.”–“: Estimates with relative standard errors greater than 30% or cell sizes below 50 are not provided.NA: Not applicable* Individuals who are self-employed without other employment are treated as not having an employer.^ Estimate statistically significantly different from <138% FPL estimate at the 95% confidence level.SOURCE: 2013 Kaiser Survey of Low-Income Americans and the ACA.

Prior to the ACA, Medicaid eligibility for adults was very limited in most states. Eligibility generally was limited to parents with very low incomes (often below about half the federal poverty level), and in all but a handful of states, adults without dependent children were ineligible for Medicaid regardless of their income.7  Further, application processes were sometimes very complex, requiring face-to-face interviews, assessments of assets, or paper documentation.8  Eligibility and application processes posed barriers for many low-income adults seeking Medicaid coverage.

One in three uninsured adults (31%) reported trying to sign up for Medicaid in the past five years (Figure 4). Low-income uninsured adults (those with family income up to 138% FPL) were more likely than those with moderate incomes to report trying to sign up for Medicaid (38%) (see Appendix Table A2). The majority of adults who tried to sign up for Medicaid (22% of the uninsured) were unsuccessful, and among those, most (19% of the uninsured) were unable to sign up because they were told they were ineligible. Notably, a quarter of uninsured adults in the income range for Medicaid expansion under the ACA (<138% FPL) have tried to sign up for Medicaid in the past but were told they were ineligible.

Figure 4: Uninsured Adults’ Attempts to Enroll in Medicaid or Non-Group Coverage in the Past 5 Years

Prior to the ACA, there were also barriers to obtaining coverage on the non-group, or individual market. This type of coverage was not guaranteed in all states, and insurance companies could often charge higher premiums for sicker individuals or place limits on coverage for pre-existing conditions, making coverage unaffordable for many uninsured adults. The uninsured also report trying to obtain non-group coverage prior to the ACA. One in five uninsured adults (22%) reported trying to obtain non-group coverage in the past five years. Most of these adults (13% of the uninsured) did not purchase a plan because the policy they were offered was too expensive (Figure 4).

“We are very lucky that we have not had any catastrophic incidents, because we could not afford the catastrophic insurance premiums [for nongroup coverage] that we were quoted.”
Jose (FL), on trying to buy coverage on his own before the ACA

Many of the barriers to coverage that the uninsured report facing in the past are addressed by the ACA. Large employers (>50 workers) face penalties if they do not offer affordable coverage to their workers, and in states that chose to expand Medicaid, eligibility for Medicaid includes almost all adults with incomes at or below 138% FPL. Further, millions of uninsured families are now able to purchase coverage in the Marketplaces and receive premium tax credits to reduce the cost. Insurers are no longer able to deny coverage based on health status and are limited in what they charge people based on age, location, and tobacco use status. However, some uninsured adults may continue to face barriers to coverage. Employers are not required to offer coverage to part-time employees, and only large businesses will be subject to a fine for not offering affordable coverage to full-time employees, beginning in 2015.  In states that did not expand Medicaid, eligibility remains limited, leaving many ineligible for Medicaid and without an affordable coverage option. Last, people who have attempted to obtain coverage in the past may be unaware that rules and costs have changed under the ACA. Outreach and education will be needed to inform people that eligibility rules have changed and that financial assistance is available to offset the cost of coverage.

Health insurance coverage is not always stable.

For most insured adults, coverage is continuous throughout the year and over time, but a sizable number experience a gap or change in coverage. When accounting for both insured people with a gap in their coverage and uninsured people who recently lost coverage, the survey indicates that nearly 18 million adults lose or gain coverage over the course of a year.

Among adults who were insured at the time of the survey, 7% reported being uninsured at some point in the past year (see Figure 5 and Table 2), and those who had a gap in coverage were uninsured for nearly half the year (5.7 months) on average (data not shown). Low-income insured adults (those with family income up to 138% FPL) are particularly vulnerable to gaps in coverage, with 13% reporting a coverage gap in the past 12 months compared to 8% of those with incomes between 139 and 400% FPL (Figure 5).

Figure 5: Disruptions in Health Coverage Among Adults, by Income

Further, some currently uninsured adults had coverage at some point within the past year. Among uninsured adults, nearly one in five (19%) report having lost coverage within the last year. Among both those with a gap in coverage or who recently lost coverage, the majority report that they most recently had employer coverage (data not shown).

Table 2: Coverage Dynamics among Insured and Uninsured Adults, by Income and Current Coverage
AllBy IncomeBy Current Coverage
<138% FPL139-400% FPL>400% FPLEmployerNongroupMedicaid
%%%%%%%
Insured Adults100%100%100%100%100%100%100%
Gap in Coverage in Past Year7%13%8%^5%*13%
Changed Coverage During Year12%7%11%^16%^14%*3%
Same Coverage for Full Year81%79%81%82%80%84%81%
Uninsured Adults100%100%100%100%100%100%100%
Uninsured Full Year80%83%78%75%NANANA
Lost Coverage Within Past Year19%16%22%NANANA
Notes: Don’t Know and Refused responses not shown. Excludes people covered by other sources, such as Medicare, VA/CHAMPUS, or other state programs.”–“: Estimates with relative standard errors greater than 30% or cell sizes below 50 are not provided.NA: Not applicable.^ Estimate statistically significantly different from <138% FPL estimate at the 95% confidence level.* Estimate statistically significantly different from Medicaid estimate at the 95% confidence level. SOURCE: 2013 Kaiser Survey of Low-Income Americans and the ACA.

In addition to those who lose or gain coverage over the course of a year, millions of adults who have coverage throughout the entire year have a change in their health insurance plan. Among adults with insurance coverage, 12% (17 million people) had coverage for the entire year but report that they had a change in their coverage (Table 2). Coverage changes may be due to a number of different factors including changes in employment, changes in eligibility for public programs, or simply a change in insurance carrier. The most common reasons for a change in coverage appear to be related to employment, as most people with a coverage change report changing from an employer plan to another employer plan.

Last, a small number of insured adults report challenges in either renewing or keeping their coverage, another indication of instability in coverage throughout the year. Reflecting eligibility rules and sometimes burdensome renewal processes, adults with Medicaid are the most likely to report a challenge (13%) compared to adults with employer coverage (Figure 6). Medicaid eligibility is closely tied to income, and adults’ income may fluctuate throughout the year; in addition, adults must renew their Medicaid coverage annually.

Figure 6: Difficulty Renewing or Keeping Health Coverage Among Currently Insured Adults, by Income and by Insurance Coverage

“So there for a while, for a few weeks, a month, 6 weeks, I’m without insurance. And then during that time, I cannot get medical care.”
Julie (MO), on having gaps in coverage

The survey findings on changes in insurance coverage over the course of the year have implications for implementation of health reform. Prior to the ACA, many people lost and gained employer coverage over the course of a year, due to changing economic conditions and the delicate relationship between employment and health insurance. Further, there was some churning in insurance coverage resulting from Medicaid income eligibility limits: as adults’ income fluctuates, they may gain or lose Medicaid eligibility.  Adults also experienced gaps in Medicaid coverage due to frequent renewal requirements. Gaps in coverage can cause people to postpone or forgo health care or accumulate medical bills.9  By providing for insurance options across the income spectrum and facilitating coverage outside the employment-based system, the ACA may help adults have coverage continuously throughout the year. However, even after implementation, adults are likely to experience coverage changes due to job changes or income fluctuation. While there has been much focus on the early effort to enroll currently uninsured people in coverage, these findings demonstrate that people will continue to move around within the insurance system throughout the year. Thus, implementation is not a “one shot” effort that will be done once people are enrolled in the early part of 2014 but rather will require a continuous effort to enroll and keep people in coverage.

Report: Ii. What To Look For In Enrolling In New Coverage

How Low and Moderate Income Adults Sign Up For and View Their Coverage

While many currently uninsured adults have limited experience in signing up for and using health coverage, the past successes and challenges of insured low-and moderate income adults can inform the experiences of those seeking coverage under the ACA. A majority of insured adults do not experience problems in choosing, enrolling in, and using their coverage, and this pattern holds true for both people with Medicaid and private insurance. Still, based on the experience of their insured counterparts, the uninsured population targeted by the ACA coverage expansions is likely to encounter some barriers in the process of choosing and enrolling in coverage. While the ACA aims to make the process smoother, it is likely that some challenges inherent in the complexity of health coverage will require concerted efforts to address.

Most adults did not report problems in applying for and enrolling in Medicaid coverage prior to the ACA, but some encountered difficulties in the process of gaining public coverage in the past.

In comparison to the process for gaining coverage through an employer—which is typically facilitated by the firm or a representative and may require limited action on the part of the insured—applying for publicly-financed coverage typically requires proactive steps to gain coverage. Adults who currently have Medicaid or who have attempted to enroll in the past five years report little difficulty in taking steps to enroll in Medicaid. Half of adults (50%) who applied to Medicaid said the entire process was very or somewhat easy. However, the rest found at least one aspect of the process – finding out how to apply, filling out the application, assembling the required paperwork, or submitting the application – to be somewhat or very difficult. The most commonly reported difficulty was assembling the required paperwork, which a third (33%) of people who enrolled or applied said was a somewhat or very difficult (Figure 7 and Appendix Table A3).

Historically, the Medicaid application process often required in-person visits to state or county welfare offices and completion of paper-based applications. In recent years, most states have made strides towards developing web-based applications to facilitate access to coverage and ease administrative burdens.10  However, a plurality (38%) of people who have applied to Medicaid in the past five years report that they did so through traditional routes—that is, in person at a state or county government office—and only 17% reported using an online application (Figure 8).

The ACA includes provisions to simplify the application and enrollment process for coverage in all states, regardless of whether they are expanding their Medicaid program. For example, the ACA establishes new requirements for simplifying the Medicaid application, coordinating enrollment across programs, and moving toward paperless verification of eligibility. These requirements include state adoption of a single streamlined application that is available online, by phone, and on paper and that screens for all health coverage options; electronic transfers of accounts between agencies to facilitate coordination across health coverage programs; and reliance on trusted sources of electronic data rather than requesting paper documentation to verify eligibility criteria.11  Further, under the ACA, assisters are available in each state to help individuals and families enroll in coverage. Thus, uninsured adults applying for coverage should encounter fewer challenges in navigating the enrollment process than applicants have in the past. However, in states that do not expand their Medicaid programs, few adults applying for coverage are likely to be eligible, given very low income eligibility limits in those states. As a result, the primary barrier of lack of eligibility will remain.

Figure 7: Views of Medicaid Enrollment Process Among Adults Who Signed Up or Attempted to Sign Up for Medicaid Prior to the ACA
Figure 8: Mode of Application Among Adults Who Signed Up or Attempted to Sign Up for Medicaid Prior to the ACA

In choosing their Medicaid or private insurance plan, adults do not always prioritize costs, and many find some aspect of the plan choice process to be a challenge.

As people gain coverage, many will have the option to select an insurance plan. People may chose a particular plan for a variety of reasons, including low cost, choice of providers, recommendations from friends and family, or coverage of a particular benefit. Among the 50% of insured adults who chose a health plan,[endnote 101630-5] 32% reported that they chose their plan because it covered a wide range of benefits or a specific benefit that they need, while 29% reported that they chose their plan because their costs would be low and 22% because the plan had a broad selection of providers or included their doctor (Figure 9). This pattern differs by coverage type (see Appendix Table A4). For example, among Medicaid beneficiaries who had a plan choice, 33% reported provider network as the main reason for plan choice compared to 17% of adults with non-group coverage and 21% with employer coverage. These findings may reflect the fact that Medicaid benefits and costs are largely standardized across plans, while networks may vary.

In choosing a plan, people may face challenges in comparing costs, services, and provider networks, as these factors typically varied greatly across plans in the past. In general, insured adults report that they did not have difficulty in comparing their plan choices, but 36% found some aspect of plan choice—comparing services, comparing costs, and comparing providers— to be difficult (Figure 10 and Appendix Table A4). Insured adults were least likely to report difficulty comparing costs across plans (17%). This finding is particularly interesting as most people reported choosing their plan based on covered services or benefits as compared to costs. As enrollment numbers for particular plans are released and policymakers begin to assess plan choice among new enrollees, these findings can inform evaluations of plan choice under the ACA. Contrary to expectations that people may opt for the lowest cost plan,12  survey findings indicate that people place value on a range of factors related to insurance, including scope of services and provider networks. Thus, assessments of whether people are choosing the optimal plan for themselves and their families will need to consider the multiple priorities that people balance in plan selection. Further, while ACA provisions requiring plans in the Marketplace to provide a standard set of benefits as well as more detailed information on what is included in plans could potentially increase the ease of plan selection, it is important to bear in mind historical challenges people have faced in comparing and selecting insurance coverage. In particular, low-income adults who receive Medicaid may require assistance in navigating plan choices, as provisions requiring comparable information on plans for coverage in the Marketplaces do not apply to Medicaid. However, states can make such information available to Medicaid enrollees as part of an effort to improve the plan selection process.

Figure 9: Main Reason for Choosing Health Plan, Among Insured Adults Who Had a Choice
Figure 10: Views of Plan Selection Process Among Adults Who Chose a Health Plan

Overall, insured adults report satisfaction with their current coverage but also report gaps in covered services and problems when using their coverage.

Most insured adults report high levels of satisfaction with their current coverage, but they also report gaps in services that are covered by their current insurance. Nearly 85% of insured adults rate their coverage as excellent or good, while 13% rate their coverage as not so good or poor (Figure 11). Adults with employer coverage gave their plans the highest ratings, 88% grading their plans as excellent or good. Adults with nongroup coverage or Medicaid were less likely to give their plans high ratings, but a majority (71% and 81%, respectively) still rates their plans as excellent or good.

Despite the high ratings, notable shares of insured adults report a problem with their plan. Specifically, one in six (17%) insured adults report needing a service that is not covered by their current plan (Figure 12 and Appendix Table A5). People with Medicaid coverage (26%) or non-group coverage (27%) are more likely to report that their plan does not cover certain services compared to those with employer coverage (13%). The most frequently-reported services people say they need but lack coverage for are ancillary services such as dental, vision care, and chiropractor services. In private health coverage, these ancillary services are often covered under stand-alone private insurance policies that must be purchased separately from health coverage. In Medicaid, most are not federally-required benefits for adults but rather are covered at state option; while states must provide a broad spectrum of Medicaid benefits for children, they have more flexibility in designing benefits for adults. Lack of coverage for adult dental services in Medicaid—the most frequently reported service needed but excluded from coverage—has been a longstanding issue facing beneficiaries and providers, despite a particularly high need among the low-income population.13 

Insured adults also report experiencing other problems with their insurance plan. Many insured adults reported experiencing a problem with their current insurance plan covering a specific benefit, either because they were denied coverage for a service they thought was covered (25%) or their out-of-pocket costs for a service were higher than they expected (37%). Some of these services may be over-the-counter products, which are excluded from the majority of insurance plans but which people believe their plan should cover. Reports of these difficulties varied by insurance coverage. Adults with Medicaid or with nongroup coverage (both 34%) were more likely than those with employer coverage (21%) to report they were surprised that their plan would not cover a service they believed was covered. However, adults with Medicaid (22%) were less likely to report facing higher costs than expected than privately insured adults (38% among those employer coverage and 48% among those with non-group). This pattern most likely reflects the nominal out of pocket costs Medicaid beneficiaries are required to pay compared to the high cost-sharing of many private plans.

Among the goals of the ACA are ensuring that the coverage people gain provides at least a basic level of coverage and that new ways of purchasing coverage via the Marketplaces make it easier for people to navigate the insurance system. Thus, new coverage must include a set of essential health benefits (EHB), and participating plans in the Marketplace must report information on claims payment policies, cost-sharing requirements, out-of-network policies, and enrollee rights in plain language. These provisions may address some of the problems that insured adults have experienced with their coverage in the past, but uninsured adults—particularly those with limited experience enrolling in coverage—may need more help with plan selection. Further, many of the services that people report needing coverage for—such as dental and vision services—are not included in the EHB. Many newly-insured people may be surprised to learn that some ancillary services are not included in their plan, and education efforts will be needed to make sure people understand their coverage. Despite these possible challenges, most insured people—even those who report difficulties—are satisfied with their coverage overall.

Figure 11: Rating of Health Insurance Coverage among Insured Adults, by Insurance Coverage
Figure 12: Problems with Current Coverage Among Insured Adults, by Insurance Coverage

Report: Iii. Gaining Coverage, Getting Care

How New Insurance Coverage Could Change How People Use Health Care

Uninsured adults generally do not seek or receive health care services at the same rate as insured adults, even when they have a need for care. Many uninsured adults have substantial health care needs that are not monitored by a physician. Cost is the main reason the uninsured do not receive care when needed, and many lack a regular provider to facilitate follow-up or ongoing care. When uninsured adults do receive care, they often have limited options. As coverage expands under the ACA, uninsured adults are likely to get care more frequently and establish relationships with physicians. Patterns of care may shift, and providers may see an increase in patients who may have previously untreated or undiagnosed health care problems.

A large segment of the uninsured has little or no connection to the health care system.

While some uninsured adults do report receiving health care services, most uninsured adults report few connections to the health care system. Only about half of uninsured adults (51%) report that they have a usual source of care, or a place to go when sick or need advice about their health (not counting the emergency room). Having a usual source of care is an indicator of being linked in to the health care system and having regular access to services. In comparison to the uninsured, most insured adults—82% of those with employer coverage, 78% of those with nongroup coverage, and 76% of those with Medicaid coverage— have a usual source of care (Figure 13). Uninsured adults also are less likely to have a regular doctor at their usual source of care – only 33% of uninsured adults have a regular doctor, half the rate of insured adults. Notably, low-income uninsured adults are the least likely to have a usual source of care or a regular physician (Table 3).

Figure 13: Share of Adults with a Usual Source of Care or Regular Provider, by Insurance Coverage
Table 3: Share of Adults with Usual Source of Care or Regular Provider, by Income and Coverage
UninsuredInsured
EmployerNongroupMedicaid
Has a usual source of care^
All51%82%*78%*76%*
By Income
<138% FPL49%67%*73%*74%*
139-400% FPL51%81%*69%*80%*
>400% FPL67%85%89%
Has a regular provider at usual source of care^
All33%71%*68%*66%*
By Income
<138% FPL27%56%*61%*64%*
139-400% FPL36%70%*56%*71%*
>400% FPL74%84%*
Notes: Don’t Know and Refused responses not shown. Excludes people covered by other sources, such as Medicare, VA/CHAMPUS, or other state programs.”–“: Estimates with relative standard errors greater than 30% or cell sizes below 50 are not provided.^ 5% of adults who report the emergency room as their regular source of care are reclassified as not having a usual source of care.* Estimate statistically significantly different from uninsured estimate at the 95% confidence level. SOURCE: 2013 Kaiser Survey of Low-Income Americans and the ACA.

This lack of a connection to the health care system leads many uninsured adults to go without care. More than four in ten uninsured adults (41%) reported no health care visits (including hospital visits, doctors’ or clinic visits, mental health services, or trips to the emergency room) in the past year, compared to 10% of Medicaid beneficiaries and 13% of adults with employer coverage (Figure 14). This pattern holds across income groups. Of particular concern is the lack of preventive visits among the uninsured. Only 1 in 3 uninsured adults (33%) reported a preventive visit with a physician in the last year (data not shown), compared to 74% of adults with employer coverage and 67% of adults with Medicaid.

Figure 14: Receipt of Health Care Services in the Last Year, by Insurance Coverage and Income

The survey findings reinforce conclusions based on prior research: having health insurance affects the way that people interact with the health care system, and people without insurance have poorer access to services than those with coverage.14 ,15 ,16  Thus, gaining coverage is likely to connect many currently uninsured adults to the health care system. However, outreach may be needed to link the newly-insured to a regular provider and help them establish a pattern of regular preventive care.

A substantial share of the uninsured has health needs, many of which are unmet or only met with difficulty.

People who lack health insurance still have health care needs. In fact, uninsured adults in the survey were just as likely as those with private insurance to report having an ongoing health condition, with about 3 in 10 uninsured (30%) and privately insured adults (32% for both employer and nongroup coverage) reporting having an ongoing health condition (Figure 15). Given that the uninsured are more likely than people with coverage to have undiagnosed illness,17  actual rates of illness among the uninsured may be even higher.  In contrast to those with private insurance, adults with Medicaid are twice as likely as uninsured adults to report having a health condition, with 60% of Medicaid beneficiaries reporting an ongoing health condition. This finding, which holds across income groups (Table 4) reflects Medicaid’s pre-ACA role in caring for people with substantial health needs (such as individuals with disabilities or people who become impoverished due to high health care expenses). As low-income uninsured gain coverage under reform, Medicaid’s role will expand to include a broader scope of the adult population.

Figure 15: Share of Adults with an Ongoing Health Condition, by Insurance Coverage
Table 4: Health Status of Adults by Income and Coverage
UninsuredInsured
EmployerNongroupMedicaid
Fair or poor overall health
All32%12%*14%*45%*
By Income
<138% FPL37%18%*47%*
139-400% FPL29%14%*35%
>400% FPL9%*
Fair or poor mental health
All18%6%*34%*
By Income
<138% FPL21%12%*33%*
139-400% FPL18%9%*38%*
>400% FPL
Have an ongoing health condition that needs to be monitored regularly orneeds regular care
All30%32%32%60%*
By Income
<138% FPL32%23%*63%*
139-400% FPL29%30%33%50%*
>400% FPL36%27%
Take prescription medication on regular basis^
All28%42%*45%*71%*
By Income
<138% FPL31%34%71%*
139-400% FPL28%37%*43%74%*
>400% FPL47%45%
Notes: Don’t Know and Refused responses not shown. Excludes people covered by other sources, such as Medicare, VA/CHAMPUS, or other state programs.”–“: Estimates with relative standard errors greater than 30% or cell sizes below 50 are not provided.^ Excludes birth control.* Estimate statistically significantly different from uninsured estimate at the 95% confidence level.Source: 2013 Kaiser Survey of Low-Income Americans and the ACA.

While uninsured individuals with an ongoing health condition are more likely than those without to report receiving services (Figure 16), they are still less likely than their insured counterparts to receive care. Half (50%) of uninsured adults without an ongoing health condition, received services in the past year compared to 81% of uninsured adults with a health condition. However, this rate is still lower than adults who have a health condition and have employer coverage, nongroup coverage, or Medicaid, nearly all of whom (97%, 96%, and 95%, respectively) received medical services over the course of the year.

Figure 16: Receipt of Health Care Services in the Last Year, by Insurance Coverage and Health Status

When uninsured individuals do receive care, they sometimes receive free or reduced-cost care, though the majority who use services do not. Among adults who reported that they received a health care service in the past year, 38% of uninsured adults report receiving free or reduced cost care, versus just 3% of those with employer coverage (Figure 17). Notably, about a third of adults with Medicaid who received services reported that they received free or reduced cost care. They may have done so during a period of uninsurance in the previous year or may associate the fact that they pay little or no costs when they see a provider as receiving “free or reduced cost” care. Uninsured adults who received care were much more likely than their insured counterparts to be asked to pay up front for care: nearly a third (31%) report being asked to pay for the full cost of medical care (not counting copayments) before they could see the doctor or provider, versus just 13% of those with employer coverage and 10% of adults with Medicaid. Again, insured adults may have experienced these issues during a period in the past year when they lacked coverage.

Figure 17: Paying for Health Care Services in the Last Year, by Insurance Coverage

Despite some uninsured adults reporting that they receive free or reduced cost services, a larger share report an unmet need for care. Almost half (49%) of the uninsured report needing but postponing care compared to 28% of adults with employer coverage, 36% with nongroup coverage, and 41% of Medicaid beneficiaries (Figure 18). The relatively high rate among Medicaid beneficiaries reflects higher need: among Medicaid beneficiaries without a disability or ongoing health condition, rates of unmet need are similar to adults with other sources of coverage (data not shown).

Figure 18: Share of Adults with an Unmet Need for Care, by Insurance Coverage

The most common reason for postponing care among the uninsured is cost, as the uninsured must pay the full cost of their care. Adults with employer coverage (38%), nongroup coverage (63%) or Medicaid (40%) are less likely to report cost as a reason for postponing care because presumably their insurance pays most or all of that cost (Figure 19). However, adults with Medicaid were more likely than other adults to report that they postponed care because they were unable to get an appointment soon enough or because they had difficulty traveling to the doctor’s office or clinic. These issues may reflect problems with provider participation in Medicaid, limits on Medicaid coverage of transportation services, or transportation barriers unique to the low-income population (such as not having a car). The only barrier that adults with employer coverage were more likely than other adults to report is the clinic or doctor’s office not being open at times when they could get there. This issue is a particular challenge for low-income workers, who often lose income when they take time off for a medical appointment during the day.

Figure 19: Reasons for Postponing Needed Care, by Insurance Coverage

Given the health profile of the currently uninsured population, there is likely to be some pent-up demand for health care services among the newly-covered. Health systems may see increases in adults seeking care and will need to prepare for the newly insured. As people gain coverage under the ACA, the cost barriers to health care services will be reduced, but other barriers such as transportation or wait times for appointments may remain. The ACA included funds to expand service capacity in medically underserved areas, including expansion of community health centers, nurse-managed health centers and school-based clinics. To meet the health care needs of both insured and uninsured individuals, it is important that these systems develop flexible treatment times to accommodate people’s availability and expand capacity in areas where low-income individuals reside or seek care.

Many of the uninsured report limited options for receiving health care when they need it.

Uninsured adults are less likely than their insured counterparts to receive care in a private physician office when they do get care. About a third of uninsured adults (32%) report that a physician’s office or HMO is their regular source of care, compared to 70% of adults with employer coverage and more than half with Medicaid or other coverage (Figure 20). A third of uninsured adults who have a regular source of care (32%) report clinics or health centers as their usual source of care, twice as high as adults with employer coverage (16%). Notably, 20% of uninsured adults report the emergency room as their usual source of care – almost double the share of adults with Medicaid and ten times higher than adults with employer coverage (2%).

Figure 20: Type of Place Used for Usual Source of Care, by Insurance Coverage

Uninsured adults are more likely than other adults to report that they have limited options for their usual source of care. Among people with a usual source of care, 18% of uninsured people report that they chose their usual source of care because it is the only option available to them, compared to 10% of adults with Medicaid and 4% with employer coverage (Figure 21). Of uninsured adults who say they had only one choice for care, almost half say that choice was the emergency department (data not shown). Uninsured adults are also more likely than other adults to choose their usual source of care because it’s affordable and less likely than other adults to choose their site of care because of convenience or ability to see their preferred provider. Most of those who say they chose their usual source of care based on cost say they chose a clinic or health center, reflecting that these providers often have a mission to serve low-income populations and offer services on a sliding scale.18 

Figure 21: Reason for Choosing Usual Source of Care, by Insurance Coverage

Based on the experience of their insured counterparts, the uninsured may have more options for where to receive their care once they obtain coverage under the ACA. Clinics and hospitals that already see a large share of uninsured adults may play an important role in enrolling this population in coverage and serving them once they gain insurance. However, these providers’ ongoing role—and people’s continuity of treatment— will depend in part on whether they are included in plan networks under both Medicaid and Marketplace plans. Further, many uninsured adults live in medically underserved areas, and it will be important to monitor whether coverage provisions are accompanied by delivery system reforms and new resources for primary care to expand access. Some individuals who have relied on emergency rooms or urgent care centers as their usual source of care may require help in establishing new patterns of care and navigating the primary care system. Last, in states that do not expand Medicaid, clinics and hospitals may continue to see high levels of the uninsured population and will remain the “safety net” for people who lack financial resources but need care.

Report: Iv. Health Coverage And Financial Security

How the ACA Might Affect Low and Moderate Income People’s Financial Situation

Low-income families face multiple financial challenges on a daily basis, but a major challenge is the cost of health care. Insurance provides some financial protection for many low-income adults, but many still struggle to pay their share of premiums or other costs associated with care. Low-income adults without coverage are particularly vulnerable, facing even more financial strain than their insured counterparts. Both insured and uninsured low-income adults struggle with medical bills and debt, and coverage expansions, assistance with premium costs, and limits on out-of-pocket costs under the ACA have the potential to ameliorate the financial issues associated with the cost of health care.
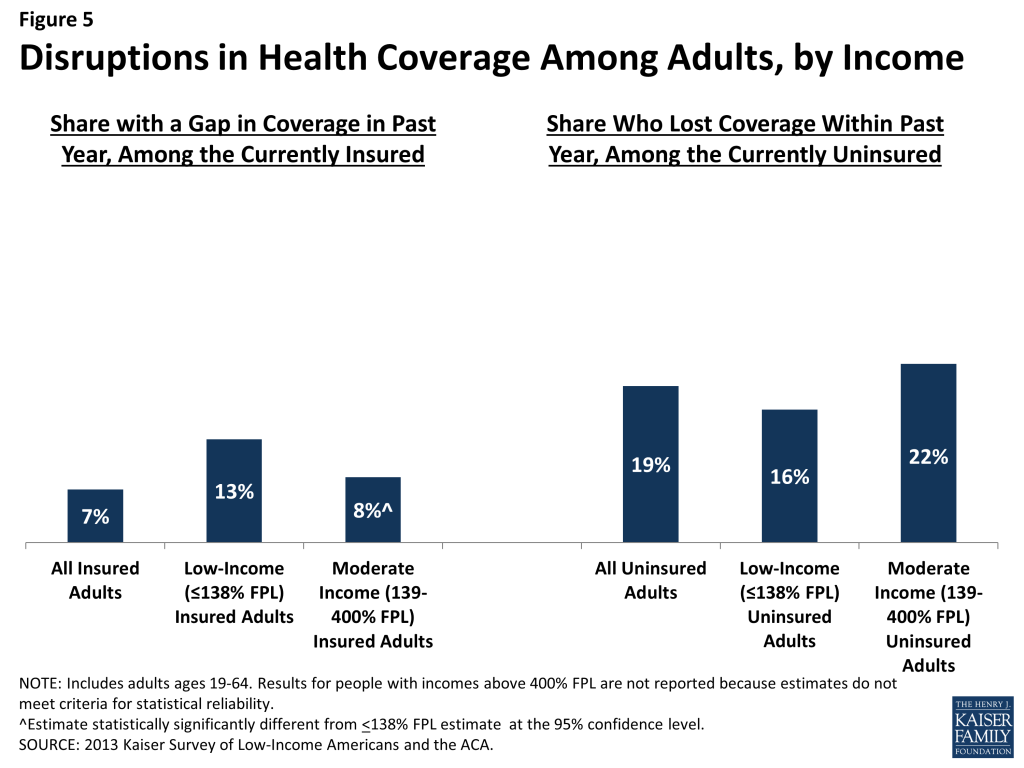
Health care costs pose a challenge for low- and moderate-income families, even if they have insurance coverage.

Health care accounts for a major budget item for low-income families, and affordability is a concern for many. Even among those with insurance, costs can be a burden. One source of cost burden is the cost of insurance itself. Nearly three-quarters of adults with employer coverage (74%) say they pay at least some part of their premium (data not shown), and adults with non-group coverage pay premiums directly to insurers themselves. Of adults who pay at least some portion of their premium, those with low incomes are most likely to report difficulty paying these costs (Figure 22). Thirty-seven percent of low-income (< 138% FPL) adults and 35% of moderate-income adults (139%-400% FPL) who pay a share of the premium for employer coverage report that their share is somewhat hard or very hard for them to afford, compared to 17% of higher-income (>400% FPL) adults with this coverage. For adults with non-group coverage, the rates are higher, with 76% of the low-income, 58% of the moderate income, and 44% of the higher income reporting difficulty paying their premiums. Since most adults with employer coverage share the cost of the premium with their employer, it is not surprising that rates of difficulty are higher among those with non-group coverage, who all pay the entire cost themselves.

Figure 22: Difficulty Affording Health Insurance Premiums, by Insurance Coverage and Income

Health care costs translate to medical debt for many l0w-income adults. While uninsured adults of all incomes are most likely to have outstanding medical bills, many low- and moderate-income insured adults also report high rates of medical bills that are unpaid or being paid off over time (Table 5). For example, 26% of low-income (<138% FPL) adults with employer coverage and 28% of low-income adults with Medicaid coverage report having medical debt. Some of these bills may reflect people’s coverage not covering all of their medical expenses, and some have been incurred during periods of uninsurance: 34% of insured adults with a gap in coverage have outstanding medical bills, compared to 23% with no gaps in coverage (data not shown). Some adults with Medicaid may have become eligible for their coverage as a result of having high medical bills, qualifying through a “medically needy” pathway for people who have high medical expenses.19  Once uninsured adults gain coverage, they may still have lingering medical bills from the past.
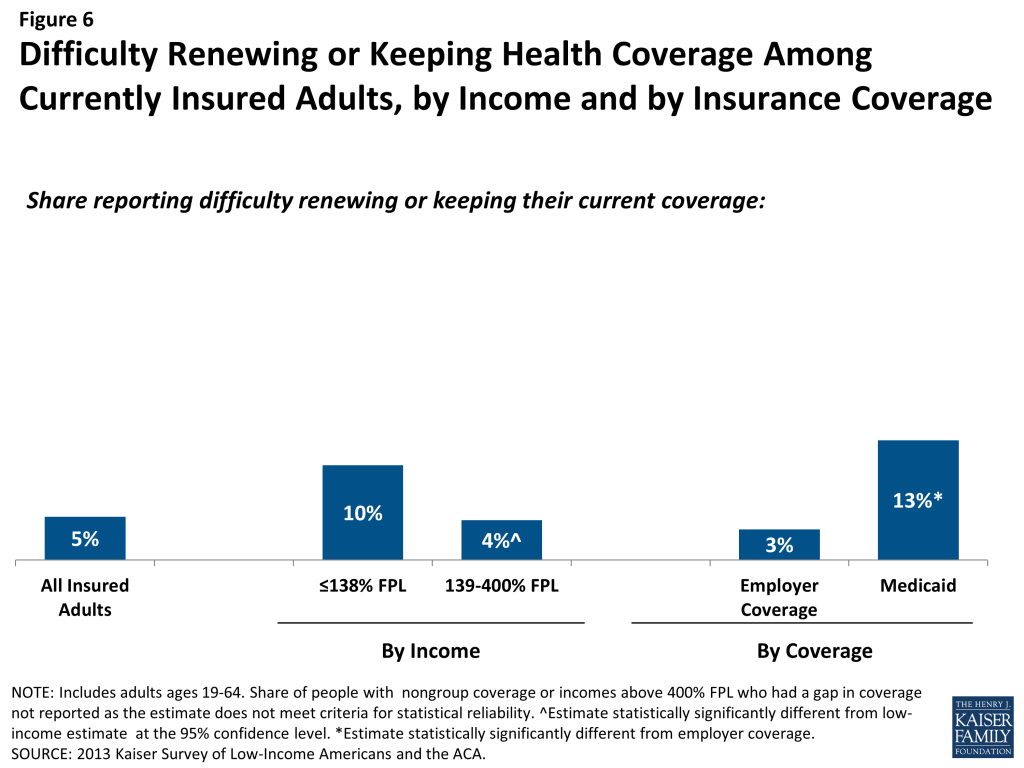
Regardless of coverage, medical bills can cause serious financial strain. People may report medical debt but not have a problem paying that debt. However, when asked directly whether they had problems paying medical bills in the past year, notable shares of low- and moderate-income adults reported that they did (Table 5). In many cases, the problems people had paying medical bills were severe.  Adults in every coverage and income category reported that medical bills caused them to use up all or most of their savings, have difficulty paying for necessities, borrow money, or be contacted by a collection agency (Table 5).

Table 5: Medical Debt and Problems with Medical Bills among Adults, by Income and Coverage
UninsuredInsured
EmployerNongroupMedicaid
Has Outstanding Medical Bills or Paying Off Bills Over Time
All39%21%*28%*30%*
By Income
<138% FPL40%26%*28%*
139-400% FPL38%28%*31%
>400% FPL15%
Had Problem Paying Medical Bills in Past Year^
All22%9%*12%*15%*
By Income
<138% FPL25%18%17%*
139-400% FPL17%13%
>400% FPL4%
Medical Bills Led to Serious Financial Strain^,^^
All20%7%*11%*12%*
By Income
<138% FPL23%13%*14%*
139-400% FPL15%11%
>400% FPL
Notes: Excludes people covered by other sources, such as Medicare, VA/CHAMPUS, or other state programs.”–“: Estimates with relative standard errors greater than 30% or cell sizes below 50 are not provided.^ Excludes people who reported a problem with medical bills that were not their own.^^ Defined as reporting that medical bills caused them to use up all or most savings; have difficulty paying for necessities; borrow money; or be contacted by a collection agency.* Estimate statistically significantly different from uninsured estimate at the 95% confidence level.SOURCE: 2013 Kaiser Survey of Low-Income Americans and the ACA.

In addition to many low-income adults reporting that they have experienced financial strain or difficulty with health care costs, many live with worry about their ability to afford costs in the future. The vast majority of low- and moderate-income uninsured adults report that they lack confidence that they could afford either the cost of care for services they typically require (Figure 23) or the cost of care should they face a major illness (Figure 24). While not surprising, this finding indicates that uninsured adults are aware of the high cost of health care services, as even those with moderate or high incomes do not believe they can afford these costs. One role of insurance coverage is to protect people against these costs, particularly unexpected costs related to major illnesses or accidents. However, notable shares of low-income insured adults report that they lack confidence in their ability to afford health care, given their current finances and health insurance situation. Over a third of adults on Medicaid report lack of confidence in affording usual costs, a finding that appears to be driven by higher need among Medicaid beneficiaries (as those with disabilities report particularly high rates) or worry about keeping coverage (as those who had problems with renewal also report high rates) (data not shown). Of particular note is the finding that about half of adults with nongroup coverage do not feel confident that they could afford costs related to a major illness given their coverage and financial situation. This lack of confidence may reflect worry about affording out-of-pocket costs or concerns over limits on coverage.
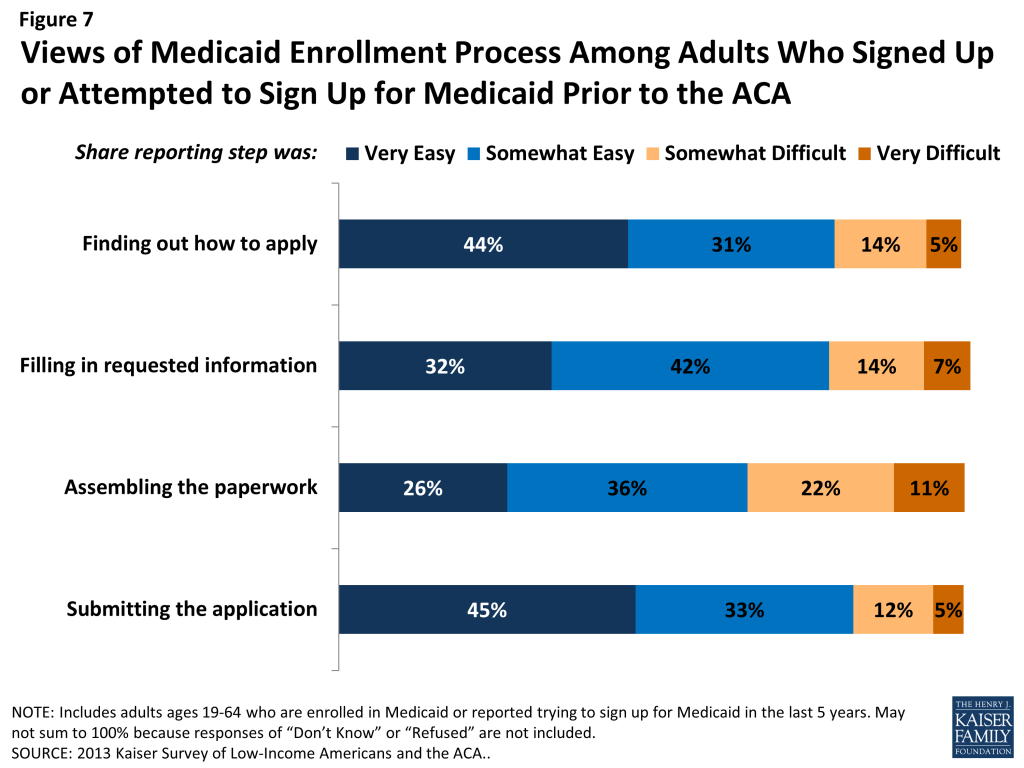
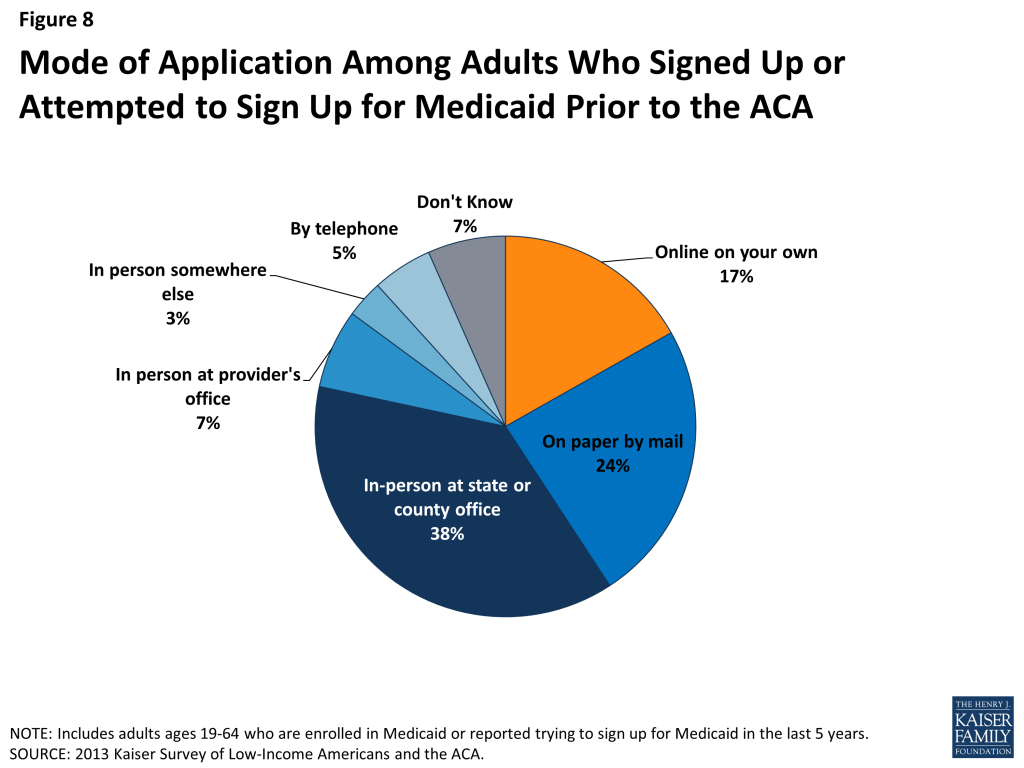
Figure 23: Lack of Confidence in Affording Usual Health Care Costs, by Insurance Coverage and Income
Figure 24: Lack of Confidence in Affording Major Illness, by Insurance Coverage and Income

Affordability provisions in the ACA may ameliorate some of the challenges that low-income insured individuals face in affording care. Under the law, qualified health plans must cover preventive services with no cost sharing and are prohibited from placing annual or lifetime caps on the dollar value of insurance coverage. In addition, plans may not exclude coverage for pre-existing conditions, which often was excluded from nongroup plans in the past and may have led to high out-of-pocket costs for insured individuals. Last, people who purchase coverage through the Marketplaces and have incomes up to 400% FPL receive tax credits to help them afford their premiums, and those with incomes up to 250% FPL also receive subsidies to help with cost sharing under their plans. As was the case in the past, people covered by Medicaid do not pay premiums and face only nominal cost sharing for services.  However, given survey findings that many low-income insured people continue to face financial challenges related to health care, it will be important to track whether there are ongoing financial barriers as people enroll in coverage and seek care.

Low-income families face fragile financial circumstances.

 “We went from basically not having any debt to $25,000 I think so far just in medical debt by itself.  It’s very challenging- very rough.”
Jeff (MO), on medical costs while uninsured

As discussed above, low- and moderate-income adults across coverage groups experience difficulty or worry paying for health care. These challenges translate to expenses in other areas as well, and low- and moderate-income adults across coverage groups report not being financially secure. However, adults who are low-income and uninsured or covered by Medicaid are particularly vulnerable to financial insecurity even outside of health care. Among the low-income, uninsured adults are more likely than adults with employer coverage to report that they feel generally financially insecure (Figure 25). Notably, adults with Medicaid coverage reported rates of financial insecurity closer to those of their uninsured counterparts. This pattern may reflect historical Medicaid eligibility rules, which were targeted very vulnerable adults: in most states, adults were only eligible if their incomes were below half the federal poverty level, and some adults had to deplete their income or resources before they could be eligible for assistance.

Figure 25: Overall Financial Insecurity, by Insurance Coverage and Income

General financial insecurity translates to concrete financial difficulties in making ends meet. Uninsured adults and those on Medicaid are more likely than privately-insured adults to have difficulty paying for other necessities such as food, housing, or utilities, with 58% reporting such difficulty compared to 19% of those with employer coverage and a quarter of those with nongroup coverage (Table 6). While low-income adults across the coverage spectrum report high rates of difficulty paying for necessities, those with employer coverage report the lowest rates in this income group. These individuals may have the stronger or more stable ties to employment than their counterparts with other or no insurance coverage. A similar pattern holds for people’s ability to get ahead financially, either saving money or paying off debt.

While similarly high levels of adults across income and coverage groups report that they have taken on debt or taken money out of their savings to pay bills in the past year (Table 6), uninsured adults are more likely than adults with employer or nongroup coverage to report changing their living situation or postponing marriage or children for financial reasons.

Table 6: Financial Difficulty among Adults, by Income and Coverage
UninsuredInsured
EmployerNongroupMedicaid
Has difficulty paying for necessities
All58%19%*25%*58%
By Income
<138% FPL68%40%*59%*
139-400% FPL54%26%*23%*55%
>400% FPL
Has difficulty saving money
All82%50%*61%*80%
By Income
<138% FPL87%61%*73%82%
139-400% FPL78%60%*69%76%
>400% FPL73%41%*48%*
Has difficulty paying off debt
All57%30%*37%*59%
By Income
<138% FPL61%41%*63%
139-400% FPL53%38%*43%49%
>400% FPL22%*
Taken on debt or took money out of savings to pay bills
All46%42%53%45%
By Income
<138% FPL44%41%43%
139-400% FPL50%52%54%53%
>400% FPL36%49%
Changed living situation or postponed marriage/children for financial reasons
All39%17%*11%*32%
By Income
<138% FPL46%35%*32%*
139-400% FPL35%20%*
>400% FPL11%
Notes: Excludes people covered by other sources, such as Medicare, VA/CHAMPUS, or other state programs.”–“: Estimates with relative standard errors greater than 30% or cell sizes below 50 are not provided.* Estimate statistically significantly different from uninsured estimate at the 95% confidence level.SOURCE: 2013 Kaiser Survey of Low-Income Americans and the ACA.

 “I don’t have enough for health insurance, rent, and bills.”
Celina (MO), on family finances and health insurance

While it is not surprising that many low-income families are in a precarious financial situation, it is notable that low-income adults who lack insurance coverage or who were covered by Medicaid before the ACA are more financially unstable than their privately-insured counterparts. Prior to the ACA, Medicaid coverage for adults was targeted to those with the greatest need, and this role is reflected in the fact that they face similar financial challenges as their uninsured counterparts. While insurance coverage can provide financial protection in the event of illness or injury, it is not curative of all of the financial burdens faced by low-income families. Given their overall situation, health insurance alone may not lift low-income people out of poverty, and many low-income adults may continue to face financial challenges even after gaining coverage. However, gains in coverage under the ACA may address some of the consequences of financial instability among low-income families, and linking low-income adults with other support systems may help address the broader financial challenges that they face.

Report: V. Poised At The Starting Line

Low- and Moderate-income Uninsured Adults’ Readiness for the ACA

Low-and moderate income adults are the main targets of the ACA expansions, but prior to the start of open enrollment, many remained unaware of their coverage options under the law. Confusion over state decisions about whether to expand their Medicaid programs or operate their own Marketplaces may have clouded messaging on new coverage options. Further, while there were well-documented technical problems with initial enrollment efforts, some uninsured adults may face additional challenges in signing up for coverage, as they lack basic tools needed for this process such as internet access or bank accounts. Outreach and enrollment will be crucial to the ultimate success of the ACA in expanding coverage, yet many uninsured adults have limited connection to potential outreach avenues. Past experience demonstrates that both broad and targeted outreach efforts and direct one-on-one enrollment assistance will be key for successful enrollment.20 

A majority of uninsured adults who are income eligible for coverage expansions reported knowing little or nothing about Medicaid and Marketplace programs prior to the start of open enrollment.

Despite ongoing media attention to the ACA, most uninsured adults who are likely eligible for coverage under the law21  reported that they knew little about either Medicaid or Marketplaces prior to the start of open enrollment. Seven in ten uninsured adults with incomes in the Medicaid target range (<138% FPL) say they knew nothing at all or only a little about their state’s Medicaid program, and eight in ten uninsured adults in the income range for Marketplace subsidies (139-400% FPL) reported that they knew nothing at all or only a little about the Marketplaces. While these shares are fairly constant across coverage categories (see Appendix Table A6), they point to the need for substantial outreach and education efforts among the target population for coverage expansions. Recent media attention to the challenges faced in initial enrollment efforts likely has increased awareness of coverage options; however, it is not clear to what extent media attention has translated to understanding of what is available and how to enroll, or discouraged attempts to enroll. More recent polling data indicates that 46% of the nonelderly uninsured of all incomes were not aware that the law provides help to low- and moderate-income Americans to help them purchase coverage, and two-thirds (66%) of nonelderly uninsured (all incomes) say they don’t have enough information to understand how the law will impact their families, a share that has been fairly consistent since Fall 2013.22 

While most uninsured adults have the necessary tools for enrolling in coverage, some will experience additional logistical issues in signing up.

Under the ACA, online applications through Healthcare.gov or state-specific Marketplace sites are intended to be the primary mode for signing up for coverage in the Marketplace. In addition, all states are required to accept online applications for Medicaid (in addition to paper, phone, and in-person applications), and many people who are eligible for Medicaid may first apply for coverage through the Marketplace web site. Thus, internet access is an important tool in accessing coverage under the law. While the majority of uninsured adults have access to the internet either at home or outside the home (Figure 26), 19% of low-income (<138% FPL) and 14% of moderate income (139-400% FPL) uninsured adults report that they do not have internet access readily available. Further, some people who report having internet access may be using their mobile devices for access, but currently healthcare.gov (and most states) are not configured to allow for application via mobile device. People without internet access via a computer may be able to enroll through other more traditional avenues such as over the phone or in person at county offices or providers, but efforts may be needed to inform people about these other application routes, and some using them may experience a slower enrollment process than they would if they applied online.

Figure 26: Access to Tools Need to Enroll in and Pay for Coverage Among Uninsured Adults, by Income

Once people are enrolled in coverage, they will require a means to pay their premiums on a regular basis (if enrolled in Marketplace coverage). While plans must accept various forms of payment,23  direct withdrawal from a checking account is a simple and reliable way to ensure that premiums are paid on time. However, nearly a quarter (23%) of uninsured adults in the income range for Marketplace subsidies (139-400% FPL) and nearly one in five (18%) of uninsured adults who could gain unsubsidized coverage through the Marketplace report that they do not have a checking or savings account (Figure 26). These “unbanked” uninsured adults may face some logistical barriers to paying premiums that those who can use direct withdrawal do not.

Many uninsured adults could be reached through targeted outreach avenues.

Across states, a variety of outreach and enrollment efforts are underway to help connect eligible people to coverage, ranging from broad marketing and media campaigns to direct one-on-one assistance. Moreover, a wide array of groups and individuals are involved in outreach and enrollment, including community-based organizations, providers, health centers, and faith-based groups.24  Some states are also utilizing new “fast track enrollment” opportunities to efficiently enroll large numbers of eligible individuals in their Medicaid programs.25  Specifically, CMS offered states the opportunity to facilitate enrollment of eligible people into Medicaid by using data already available to states through the Supplemental Nutritional Assistance Program (SNAP) and children’s eligibility data for Medicaid and the Children’s Health Insurance Program (CHIP). Experiences in states that have already launched these strategies indicate they can be highly successful in connecting people to coverage, reaching a significant share of adults eligible for the Medicaid expansion while minimizing burdens for both individuals and eligibility staff.26 

Many uninsured adults report that they or their family already have a link to a social service program, making fast track enrollment efforts a promising avenue for outreach. Among uninsured adults with incomes in the range for Medicaid eligibility (<138% FPL), over six in ten (62%) report that they or someone in their immediate family receives either SNAP, cash assistance, disability payments, or Medicaid or CHIP (Figure 27). SNAP is the most common connection to social services programs among the low-income uninsured (46%). These programs already have much of the information needed to determine eligibility for Medicaid under the ACA, such as income, residence, and family structure, and could provide an efficient route to enrolling the uninsured in coverage. While lower shares of moderate-income uninsured adults report a connection to a social service program, outreach to this group of uninsured adults could also reach many eligible for coverage.

Figure 27: Connection to Other Social Service Programs Among Uninsured Adults, by Income

For those without a connection to social services agencies, outreach through providers may be a promising approach. Many community health centers or hospitals and health systems are very involved with outreach and enrollment efforts, sometimes having enrollment workers in-house to help patients with ACA enrollment. Clinics in particular are an important outreach location, as about one in five low- or moderate-income uninsured adults report that they use a clinic or health center as their usual source of care (Figure 28). Hospitals reach many uninsured adults through periodic visits: at least one in five uninsured low- or moderate-income adults report visiting a hospital in the past year for either emergency services or for inpatient or outpatient care. Patients who seek episodic care in emergency rooms or hospitals may be receptive to outreach efforts, as they have a demonstrated need for services and are likely to face high bills if they remain uninsured; however, outreach workers may be challenged to engage individuals in the application process at a time when they are seeking services for an urgent or acute problem.27 

Figure 28: Connection to Potential Provider-Based Outreach Among Uninsured Adults, by Income

Conclusion And Policy Implications

Conclusion & Policy Implications

The survey findings related to: i) patterns of insurance coverage, ii) the process of enrolling in and choosing health coverage, iii) interactions with the health care system, iv) financial security, and v) readiness for ACA coverage expansions have implications for early implementation of the ACA. Below, we summarize the implications how this pre-ACA baseline data can inform outreach and enrollment, plan selection and scope of coverage, providers and health systems.

Reaching Eligible Uninsured Adults

Outreach and enrollment will be an ongoing process. While there is much focus on the initial push to enroll people in coverage under the ACA, enrollment is not a “one shot” effort that will be completed in the first few months of implementation. The survey findings reveal that millions of people lose and gain coverage throughout the year, either due to job changes, income fluctuations, or problems at renewal. It also demonstrates that low-income individuals are particularly vulnerable to gaps in coverage that can result from such changes. Thus, implementing the ACA will require ongoing efforts to enroll and keep people in coverage.

Some eligible uninsured adults have little or no connection to pre-ACA health or social services systems and may be hard to reach. Many people targeted for coverage expansions are not currently connected to the health care system, have been outside the health insurance system for quite some time, or are not linked to social services programs. The survey shows that nearly half of uninsured adults have lacked coverage for five years or longer, most uninsured do not have a regular source of care, and many uninsured have no health care visits over the course of a year. Further, while many low-income (<138% FPL) uninsured adults have a family connection to a social services program, the majority of moderate-income (139-400% FPL) uninsured adults do not. Public outreach campaigns are likely important avenues for reaching these individuals. In addition, policymakers may pursue new outreach avenues to find and reach out to the “unconnected” uninsured.

Many eligible uninsured have experience with pre-ACA health care, health insurance, or social services systems, but there is great need for continued education of new coverage options. Others targeted for coverage expansions have experience with the health care system and health insurance but may be unaware that eligibility and costs have changed under the ACA. Notable shares reported in the survey that they were unaware of new coverage options at the start of open enrollment, and many report experiences of trying to get coverage and encountering cost or eligibility barriers.  It will be important to reach out to people who have tried to apply for coverage in the past to let them know coverage options for them may have changed. While awareness of coverage under the ACA has likely increased in recent months, given heavy media attention to the rollout of health reform, it is important to make sure the information they receive is accurate. In addition, with currently 25 states having not expanded their Medicaid programs, having left millions of low-income adults in a “coverage gap,”28  new coverage options will need to be state-specific. Efforts to reach people through “fast track” enrollment may be particularly fruitful for low-income uninsured in expansion states, as these approaches require limited paperwork and reach people with known eligibility.

Connecting People to Suitable Coverage

In addition to technical issues with websites, it will be important to monitor whether other challenges in enrolling in health coverage that existed prior to the ACA are addressed by ACA simplification provisions. Policymakers have made strides in addressing many of the website glitches that plagued early enrollment efforts under the ACA, and they continue to focus attention on addressing these technical issues. However, there are other challenges to enrolling in coverage and picking a plan that policymakers may need to address. Survey results indicate that, before the ACA, some insured people reported challenges in comparing plan information or in compiling required paperwork. While most Medicaid applicants reported that they found the process to be not difficult, Medicaid enrollees were more likely than adults with other types of coverage to report challenges in selecting a plan. The ACA includes provisions to ease the plan selection process for people purchasing coverage through the Marketplaces and to simplify the application process for Medicaid. It will be important to track implementation of these simplifications to ensure that challenges that some people faced in the past do not carry over to ACA enrollment.

Early assessments of plan choice under the ACA may account for the fact that cost is only one factor in people’s preferences for health coverage. Much focus in early coverage of ACA enrollment has been on the premiums and deductibles that people will face under their new coverage. These features provide concrete measures that people can examine, and certainly costs are a key concern for new enrollees. However, the survey shows that people also value other aspects of their coverage, such as benefits and networks, sometimes even more than low out-of-pocket costs. Evaluations of coverage therefore may consider how well new plans are meeting the full range of priorities and preferences for health coverage, and future changes to plan offerings under the law may consider people’s priorities for their coverage.

Even once people have insurance, they may face issues in scope of coverage for benefits they need. Survey findings reveal that the vast majority of enrollees in various types of coverage report being satisfied with their plan, but notable shares report a problem with their scope of coverage. Many adults on Medicaid report needing coverage for dental services that are not included in their plan, and people with private coverage also report gaps in ancillary services. Future assessments of the impact of the ACA should gauge whether the scope of coverage people have under the law, and early implementation can work to educate people about both what is and what is not included in their coverage.

While the ACA could ameliorate the financial burden of health care for many, affordability of health services may remain a challenge.  In addition to the goal of facilitating access to health care services, a goal of coverage expansions is to provide financial protection from medical expenses. As survey findings show, even once people gain insurance, health care costs can be a challenge. Though less likely than their uninsured counterparts to have difficulties with medical costs, low-income insured adults report challenges in paying premiums, copayments, out-of-pocket costs for uncovered services, and other health care expenses. In addition, all low-income families, regardless of insurance coverage, face financial hardship in making ends meet. While affordability provisions in the ACA may address some of the challenges that low-income insured individuals face in affording medical care, it will be important to track ongoing financial barriers and financial instability even among those who have coverage. Further, efforts to “bend the cost curve” in health care may be a promising approach to addressing not only costs to financing sources but also to individuals.

Adapting the Health System and Patterns of Care to Meet New Needs

Based on demonstrated need and barriers to care among the uninsured prior to the ACA, health care providers may see increases in adults seeking care. Ultimately, the goal of coverage expansions under the ACA is to help people access needed health care services. Thus, once people gain coverage, providers and health systems will need to be prepared to serve newly-insured people. Survey findings reinforce conclusions from prior research that gaining health coverage is likely to alter the way that people interact with the health system. Compared to their insured counterparts, uninsured adults face barriers to care, despite many having a demonstrated need. Some uninsured adults have ongoing health conditions yet still are not receiving regular care, and others have postponed preventive or other services, primarily due to cost. These findings indicate that there is likely to be some pent-up demand for health care services among the newly-covered. Outreach and education may be needed to link the newly-insured to a regular provider and help them establish a pattern of regular preventive care.

Changes in insurance coverage may lead people to use new or different providers, but safety net providers will continue to serve many vulnerable populations. Many are concerned about shifting patterns of care under the ACA, as changes where people receive care may alter revenue streams for providers. The effect of changing revenue streams for different types of providers is unclear at this point. Based on the survey findings, the uninsured are likely to have more options for where to receive their care once they obtain coverage under the ACA. Compared to their insured counterparts, prior to the ACA, they were more likely to seek care in clinics, hospitals, or urgent care centers and to report limited options for where to get medical care. As people gain coverage, they may shift their service locations to more closely resemble that of people with private or Medicaid coverage. However, clinics and hospitals may continue to see high levels of the uninsured, particularly in states that do not expand their Medicaid programs. As uncompensated care funds diminish over time, these safety net providers may be strained to meet demand in the face of shrinking resources.

As implementation unfolds, providers may continue to be on the front lines of not only service delivery but also outreach and enrollment. Providers are one avenue that policymakers are using to reach out to uninsured adults who may be eligible for coverage expansions under the ACA. Survey findings indicate that emergency rooms and hospitals may be promising avenues for reaching eligible individuals with episodic interactions with the health system, and community health centers can reach a share of the uninsured who use them for ongoing care.

Moving Forward in ACA Implementation

As enrollment in new coverage options grows and people begin to use their coverage, survey findings point to several issues that can inform ongoing efforts to implement the ACA. Future reports using the 2013 Kaiser Survey of Low-Income Americans and the ACA will continue to delve into these issues and provide state-specific findings, and future surveys can assess whether and how coverage, access, and family finances change under the law.

Methods

This report is based on findings from the 2013 Kaiser Survey of Low-Income Americans and the ACA. This survey, conducted by the Kaiser Family Foundation (KFF) in summer 2013, examines health insurance coverage, health care use and barriers to care, and financial security among insured and uninsured adults across the income spectrum, with a focus on populations targeted for coverage expansions under the Affordable Care Act (ACA). The survey provides a baseline against which future surveys can assess the impact of the ACA on low-and moderate-income adults. The survey includes a national sample as well as three state-specific samples in California (conducted with support from the Blue Shield of California Foundation (BSCF)), Missouri (conducted with support from the Missouri Foundation for Health (MFH)), and Texas.

The survey was designed and analyzed by researchers at KFF, with feedback on the California and Missouri state-specific components from BSCF and MFH, respectively. Social Science Research Solutions (SSRS) collaborated with KFF researchers on sample design and weighting; SSRS also supervised the fieldwork.

The survey was conducted by telephone from July 24 through September 29, 2013, from representative random samples of California, Missouri, and Texas residents between the ages of 19-64, along with respondents from the remaining 47 states and the District of Columbia. In total, 8,762 interviews were completed; of these, 2,558 were with respondents living in California, 1,872 with respondents in Missouri, 1,809 with respondents in Texas, and 2,523 with respondents from other states. Computer-assisted telephone interviews (CATI) conducted by landline (4,529) and cell phone (4,233) were carried out in English and Spanish by SSRS.

Because the study was designed to focus on the low-income population, the sample was designed to over-sample this group. To efficiently reach lower-income respondents, the sample was stratified based on the estimated income level of geographic areas within the nation and within each of the three states with state-specific samples. This process was done separately for the landline and cell phone sampling frames. For the landline sample, strata were defined based on the median income within telephone exchanges; for the cell phone sample, strata were defined based on the household income associated with the billing rate-center to which the cell phone number is linked. The exact criteria for distinguishing between the strata varied from state to state. In addition, 684 interviews (359 on landline and 325 on cell phone) were conducted with respondents who were previously interviewed by SSRS as part of omnibus surveys of the general public and indicated they were ages 19-64, resided in the appropriate geography for the sample (if part of one of the state samples), and reported annual income of less than $25,000. These previous surveys were conducted with nationally representative, random-digit-dial landline and cell phone samples.

Screening for the survey involved verifying that the respondent (or another member of the household for the landline sample) met the criteria of:  1) being 19-64 years old; and 2) providing income information that allowed them to be classified by family income. Respondents were classified by family income as a share of the federal poverty level (FPL) based on their family size and total annual gross income.[endnote 101777-2] Poverty level groups included income < 138% of FPL (the income range for the Medicaid expansion), income of 139-400% FPL (the income range for Marketplace tax credits), and income above 400% of FPL (eligible only for unsubsidized coverage). For the landline sample, if two or more people met the criteria, a respondent was randomly selected by the CATI program.  Selected respondents were asked to confirm their state of residence.

A multi-stage weighting approach was applied to ensure an accurate representation of the various income groups ages 19 to 64. The weighting process involved corrections for sample design as well as sample weighting to match known demographics of the target populations in order to correct for systematic non-response along these parameters.  The base weight accounted for the oversamples used in the sample design, as well as the likelihood of non-response for the re-contact sample, number of eligible household members for the landline sample, and a correction to account for the fact that respondents with both a landline and cell phone have a higher probability of selection. Demographic weighting parameters were based on population estimates for the 19-64 year old poverty-level population in each state based on the U.S. Census Bureau’s 2011 American Community Survey (ACS). The weighting parameters for each poverty-level group within the three state-specific samples and the remaining national sample were: age, education, race/ethnicity, presence of own child in the household, marital status, region, and phone-status. All statistical tests of significance account for the effect of weighting.

The margin of sampling error (including the design effect) for national estimates, state estimates and state-by-poverty-level estimates are shown in Table A. For the national sample, the margin of sampling error is plus or minus 3.5 percentage points for both the low- and moderate-income groups. For results based on other subgroups, the margin of sampling error may be higher. Sample sizes and margin of sampling errors for other subgroups are available by request. In reporting results, any estimate with a relative standard error (standard error divided by the point estimate) greater than 30 percent or based on a cell size less than 50 is considered unreliable and not reported. Note that sampling error is only one of many potential sources of error in this or any other survey.

Table A: Number of Respondents and Margin of Sampling Error for National and State-Specific Samples
NMargin of Sampling Error
U.S. Total 8,762+/- 2%
U.S. < 138% FPL3,536+/- 4%
U.S. 139%-400% FPL3,570+/- 4%
U.S. >400%1,656+/- 5%
California Total2,558+/- 3%
CA < 138% FPL1,020+/- 5%
CA 139% – 400% FPL1,007+/- 5%
CA >400%531+/- 6%
Missouri Total 1,872+/- 4%
MO < 138% FPL760+/- 5%
MO 139% – 400% FPL791+/- 5%
MO >400%321+/- 8%
Texas Total1,809+/- 4%
TX <138% FPL754+/- 6%
TX 139% – 400% FPL753+/- 5%
TX >400%302+/- 8%

In analyzing results, we group respondents into mutually exclusive insurance categories of: Uninsured (report that they are not covered by health insurance), Employer Coverage (report that they have a plan through their own employer, a spouse’s employer, or a parent’s employer), Nongroup Coverage (report that they purchase their coverage themselves, and Medicaid (including people who are dually eligible for Medicare coverage). In capturing Medicaid coverage, state-specific program names were used. A small number of people report that they are covered by other sources, including Medicare (<3%), a government program besides Medicaid or Medicare (<3%), or some other source such as the VA, school-based coverage, or an unnamed source (<1%). We do not report results for people covered by these other coverage categories, as cell sizes were generally too small for reliable estimates.

Because eligibility for two of the law’s main coverage provisions– the Medicaid expansion and tax credits to purchase insurance on the Marketplaces– is based on an individual’s family income relative to the federal poverty level (FPL), in most cases we report survey results by FPL categories that match eligibility levels under the ACA. These categories are 1) those with incomes 138% FPL or less (roughly $32,000 a year for a family of 4), the income range for the Medicaid expansion; 2) those with incomes of 139 to 400% FPL (roughly $32,000-$94,000 for a family of 4), the income range for tax credits in the Marketplace; and 3) those with incomes above 400% FPL, who are not be eligible for financial assistance in gaining coverage. This classification is not intended to fully capture eligibility, as not everyone in these income ranges will be eligible for coverage under the ACA. For example, as of January 2014, 23 states were not planning to expand their Medicaid programs, and 2 states were planning on implementing their Medicaid expansion after January 2014.29  Further, undocumented immigrants are ineligible for coverage under the ACA, and recent legal immigrants cannot receive Medicaid coverage (though they can purchase subsidized coverage in the Marketplace). Last, some people may be ineligible for Marketplaces subsidies because they have access to affordable employer coverage. However, the income categories provide a picture of the population targeted by various expansions, rather than a picture of the specific population eligible under the law.

For results that examine the uninsured population’s readiness for the ACA (Section V), we exclude individuals who are undocumented immigrants, as this group is ineligible for any coverage under the ACA. In other sections, which aim to describe the experience of the entire uninsured population, we include undocumented immigrants in the results. We define undocumented immigrants as those who reported 1) they were born outside the United States, 2) are not a citizen, 3) did not have a green card when they arrived in the United States, and 4) have not received a green card or become a permanent resident since arriving.  This measure may be subject to error in several ways. First, it relies on self-reporting, and respondents have an incentive not to reveal unlawful immigration status. Second, those that did not answer all questions in the series of immigration status items (75 respondents) were not able to be categorized as undocumented and were therefore included; if they are in fact undocumented, then the results may differ slightly. Third, a small number of people may have a legal status besides permanent residency or green card (such as refugees, asylees or other humanitarian immigrants). Unfortunately, due to time constraints, the survey was not able to fully explore all of these immigration pathways.

This report includes analysis of findings from the survey that may inform early challenges in implementing health reform. It does not include a full reporting of all the findings from the survey. Future reports will provide additional analysis of other survey findings. Survey toplines with overall frequencies for all items in the questionnaire are available upon request.

Appendix: Additional Tables

Additional Tables

Table A1: Demographics of Adults, by Insurance Coverage
UninsuredInsured
EmployerNongroupMedicaid
Income
< 138% FPL53%11%*14%*78%*
139-399% FPL39%36%44%20%*
>400% FPL8%53%*42%*
Family Work Status
Working Family66%91%*79%*30%*
Non-Working Family34%9%*21%*70%*
Age
19-2517%14%14%
26-3427%19%*18%26%
35-4424%23%13%*16%*
45-6433%44%*58%*44%*
Health Status
Ongoing Health Condition30%32%32%60%*
No Ongoing Health Condition69%67%67%39%*
Fair or Poor Health Status
Excellent/Very Good/Good68%88%*86%*54%*
Fair or Poor32%12%*14%*45%*
Race
White, Non Hispanic49%70%*75%*52%
Hispanic30%11%*9%*18%*
Black, Non-Hispanic12%10%20%*
Asian/Pacific Islander2%4%
American Indian Alaska Native1%
Other/DK, Non-Hispanic6%5%5%
Citizenship
Citizen81%96%*97%*93%*
Non-Citizen19%4%*7%*
Notes: Don’t Know and Refused responses not shown. Excludes people covered by other sources, such as Medicare, VA/CHAMPUS, or other state programs. NA: Not applicable”–“: Estimates with relative standard errors greater than 30% or cell sizes below 50 are not provided.* Estimate statistically significantly different from uninsured estimate at the 95% confidence level.Source: 2013 Kaiser Survey of Low-Income Americans and the ACA.
Table A2: History of Uninsurance and Attempts to Gain Coverage Among Currently Uninsured Adults, by Income
AllBy Income
<138% FPL139-400% FPL>400% FPL
Length of Time Uninsured
< 3 months9%7%9%
3 Months to Less than a Year10%9%13%
1 Year to 5 years34%33%35%
5 Years or More29%31%27%
Have Never Had Coverage18%20%16%
Attempts to Gain Coverage
Applied for Medicaid in past 5 years31%38%27%^
Applied for Medicaid but did not enroll22%27%18%^
Applied for Medicaid but told ineligible19%25%15%^
Tried to purchase nongroup coverage in past 5 years22%20%22%
Tried to purchase nongroup coverage but did not purchase policy17%15%17%
Tried to purchase nongroup coverage but too expensive13%14%13%
Notes: Don’t Know and Refused responses not shown. Excludes people covered by other sources, such as Medicare, VA/CHAMPUS, or other state programs. NA: Not applicable”–“: Estimates with relative standard errors greater than 30% or cell sizes below 50 are not provided.^ Estimate statistically significantly different from <138% FPL estimate at the 95% confidence level.Source: 2013 Kaiser Survey of Low-Income Americans and the ACA.
Table A3: Ease of Applying for Medicaid, Among Adults who Have Applied, by Income
AllBy Income
<138% FPL139-400% FPL>400% FPL
Share reporting step was somewhat or very easy: 
Finding out how to apply75%76%74%
Filling in requested information74%74%74%
Assembling the required paperwork62%63%59%
Submitting the application78%78%78%
Share reporting all steps were somewhat or very easy50%49%51%
Note: Includes adults who either are currently covered by Medicaid or report that they have applied for the program within the past 5 years.”–“: Estimates with relative standard errors greater than 30% or cell sizes below 50 are not provided.Source: 2013 Kaiser Survey of Low-Income Americans and the ACA.
Table A4: Reasons for and Problems with Choosing Health Plan, Among Adults who Had and Made a Choice, by Income
AllBy Income
<138% FPL139-400% FPL>400% FPL
Share who chose plan primarily because:
Your costs under the plan were low29%21%30%^31%^
The selection of health care providers was broad or included your doctor22%27%20%21%
The plan covered a wide range of benefits or a specific benefit that you need32%31%30%34%
Friends or family recommended the plan6%7%8%
Other members of your family were already enrolled in this plan4%5%3%
Some other reason6%7%8%5%
Share of Insured Adults Reporting:
Difficulty comparing services covered under each plan24%29%28%19%^
Difficulty comparing what costs would be under each plan17%17%20%16%
Difficulty comparing the doctors, hospitals, and other health care providers you could see under each plan24%25%24%24%
At least one aspect of plan choice to be difficult36%41%40%32%
Note: Includes insured adults who had a choice of plans and reported that they made the choice themselves. Excludes those who responded Don’t Know or Refused.”–“: Estimates with relative standard errors greater than 30% or cell sizes below 50 are not provided.^ Estimate statistically significantly different from <138% FPL estimate at the 95% confidence level.Source: 2013 Kaiser Survey of Low-Income Americans and the ACA.
Table A5: Problems with Health Coverage among Insured Adults, by Income and Coverage
Insured
EmployerNongroupMedicaid
Rate Health Coverage as “Not so good” or “Poor”
All11%26%*16%*
By Income
<138% FPL16%16%
139-400% FPL11%18%
>400% FPL9%
Needed Service Not Covered by Plan
All13%27%*26%*
By Income
<138% FPL18%26%
139-400% FPL16%27%25%
>400% FPL11%
Plan Would Not Pay for Service You Thought Was Covered
All21%34%*34%*
By Income
<138% FPL29%32%
139-400% FPL24%32%39%
>400% FPL18%
Costs You Had to Pay for a Service Were Higher Than Expected
All38%48%*22%*
By Income
<138% FPL36%21%*
139-400% FPL38%48%
>400% FPL38%54%*
Notes: Excludes people covered by other sources, such as Medicare, VA/CHAMPUS, or other state programs.”–“: Estimates with relative standard errors greater than 30% or cell sizes below 50 are not provided.* Estimate statistically significantly different from employer estimate at the 95% confidence level.Source: 2013 Kaiser Survey of Low-Income Americans and the ACA.
Table A6: Knowledge of Coverage Pathways available under the ACA, by Income and Coverage
Uninsured^Insured
EmployerNongroupMedicaid
Know “only a little” or “nothing at all” about their state’s Medicaid program
All70%69%73%*46%*
By Income
<138% FPL70%64%65%46%*
139-400% FPL67%71%75%47%*
>400% FPL84%68%*73%
Know “only a little” or “nothing at all” about the new Marketplaces
All82%63%*70%*79%
By Income
<138% FPL86%77%*69%*78%
139-400% FPL80%71%*78%84%
>400% FPL73%55%62%
Notes: Excludes people covered by other sources, such as Medicare, VA/CHAMPUS, or other state programs.^ Uninsured excludes undocumented immigrants.”–“: Estimates with relative standard errors greater than 30% or cell sizes below 50 are not provided.* Estimate statistically significantly different from uninsured estimate at the 95% confidence level. Source: 2013 Kaiser Survey of Low-Income Americans and the ACA.


Endnotes

  1. Kaiser Commission on Medicaid and the Uninsured. The Uninsured:  A Primer- Key Facts about Health Insurance on the Eve of Coverage Expansions (Washington, DC:  Kaiser Family Foundation), October 23, 2013.  Available at: https://modern.kff.org/uninsured/report/the-uninsured-a-primer-key-facts-about-health-insurance-on-the-eve-of-coverage-expansions/ ↩︎
  2. Ibid. ↩︎
  3. Care without Coverage: Too Little, Too Late, Committee on the Consequences of Uninsurance, Board on Health Care Services, Institute of Medicine, National Academy Press, 2002 ↩︎
  4. J. Hadley, J. Holahan, T. Coughlin, and D. Miller, 2008 “Covering The Uninsured In 2008: Current Costs, Sources Of Payment, And Incremental Costs” Health Affairs 27 (5) w399 (published online 25 August 2008). ↩︎
  5. G. Anderson, 2007, “From ‘Soak The Rich’ To ‘Soak The Poor’: Recent Trends In Hospital Pricing.” Health Affairs 26(4): 780-789. ↩︎
  6. D. Himmelstein et al., 2009. “Medical bankruptcy in the United States, 2007: results of a national study.” Am J Med. 122(8): 741-6. Available at: http://www.pnhp.org/new_bankruptcy_study/Bankruptcy-2009.pdf ↩︎
  7. Some states had expanded coverage to parents at higher income levels or provided coverage to adults without children. See http://modern.kff.org/medicaid/fact-sheet/medicaid-eligibility-for-adults-as-of-january-1-2014/ for more detail on pre- and post-ACA Medicaid eligibility for adults. ↩︎
  8. Samantha Artiga and Jessica Stephens, Kaiser Commission on Medicaid and the Uninsured, Martha Heberlein, Tricia Brooks, and Joan Alker, Georgetown Center for Children and Families, Getting into Gear for 2014:  Findings from a 50-State Survey of Eligibility, Enrollment, Renewal, and Cost-Sharing Policies in Medicaid and CHIP, 2012-2013, (Washington, DC:  Kaiser Family Foundation), January 2013.  Available at: http://modern.kff.org/medicaid/report/getting-into-gear-for-2014-findings-from-a-50-state-survey-of-eligibility-enrollment-renewal-and-cost-sharing-policies-in-medicaid-and-chip-2012-2013/ ↩︎
  9. Collins S, et al. 2012. “Gaps in Health Insurance: Why So Many Americans Experience Breaks in Coverage and How the Affordable Care Act Will Help.” The Commonwealth Fund. Available at: http://www.commonwealthfund.org/~/media/Files/Publications/Issue%20Brief/2012/Apr/1594_collins_gaps_in_hlt_ins_tracking_brief_v2.pdf;  Cassedy A, Fairbrother G, and Newacheck PW. 2008. “The Impact of Insurance Instability on Children’s Access, Utilization, and Satisfaction with Health Care. Ambulatory Pediatrics. 8(5):321-8. ↩︎
  10. Artiga and Stephens, Getting into Gear. ↩︎
  11. Ibid. See http://modern.kff.org/medicaid/report/getting-into-gear-for-2014-shifting-new-medicaid-eligibility-and-enrollment-policies-into-drive/ for more detail. ↩︎
  12. Zhou, C. and Zhang, Y. (2012). The vast majority of Medicare Part D beneficiaries still don’t choose the cheapest plans that meet their medication needs.  Health Affairs, 31: 2259-2264; McLaughlin, C.G., Chernew, M., & Taylor, E.F. (2002).  Medigap premiums and Medicare HMO enrollment.  Health Services Research 37: 1445-1468. ↩︎
  13. Kaiser Commission on Medicaid and the Uninsured. Oral Health and Low-Income Nonelderly Adults:  A Review of Coverage and Access (Washington, DC:  Kaiser Family Foundation), June 2012.  Available at: http://modern.kff.org/medicaid/issue-brief/access-to-affordable-dental-care-gaps-for/ ↩︎
  14. Care without Coverage: Too Little, Too Late, Committee on the Consequences of Uninsurance, Board on Health Care Services, Institute of Medicine, National Academy Press, 2002. ↩︎
  15. Coverage Matters: Insurance and Health Care, Committee on the Consequences of Uninsurance, Board on Health Care Services, Institute of Medicine, National Academy Press, 2001. ↩︎
  16. Julia Paradise and Rachel Garfield, What is Medicaid’s Impact on Access to Care, Health Outcomes, and Quality of Care? Setting the Record Straight on Evidence (Washington, DC:  Kaiser Commission on Medicaid and the Uninsured), August 2, 2013. Available at:  https://modern.kff.org/medicaid/issue-brief/what-is-medicaids-impact-on-access-to-care-health-outcomes-and-quality-of-care-setting-the-record-straight-on-the-evidence.   ↩︎
  17. Wilper AP, Woolhandler S, Lasser KE, McComick D, Bor DH, Himmelstein DU. Hypertension, diabetes, and elevated cholesterol among insured and uninsured US adults. Health Affairs. 2009;28(6):w1151-9. ↩︎
  18. Kaiser Commission on Medicaid and the Uninsured. Community Health Centers in an Era of Health Reform:  An Overview and Key Challenges to Health Center Growth (Washington, DC:  Kaiser Family Foundation), March 1, 2013. Available at:  https://modern.kff.org/health-reform/issue-brief/community-health-centers-in-an-era-of-health-reform-overview/ ↩︎
  19. Kaiser Commission on Medicaid and the Uninsured. The Medicaid Medically Needy Program:  Spending and Enrollment Update (Washington, DC:  Kaiser Family Foundation), December 30, 2012. Available at:  http://modern.kff.org/medicaid/issue-brief/the-medicaid-medically-needy-program-spending-and/ ↩︎
  20. Kaiser Commission on Medicaid and the Uninsured. Key Lessons from Medicaid and CHIP Outreach and Enrollment Under the Affordable Care Act (Washington, DC:  Kaiser Family Foundation), June 2013. Available at: https://modern.kff.org/medicaid/issue-brief/key-lessons-from-medicaid-and-chip-for-outreach-and-enrollment-under-the-affordable-care-act/ ↩︎
  21. In this section, we exclude uninsured adults who are undocumented immigrants, as this group is ineligible for coverage under the law. See Methods for more detail on determining immigration status based on survey responses.  ↩︎
  22. Kaiser Family Foundation Health Tracking Poll (conducted January 14-21, 2014); available at https://modern.kff.org/health-reform/poll-finding/kaiser-health-tracking-poll-january-2014/ ↩︎
  23. 45 C.F.R. § 156.1240 ↩︎
  24. “Health Centers to Help Uninsured Americans Gain Affordable Health Coverage,” Health and Human Services, July 10, 2013. Available at: http://www.hhs.gov/news/press/2013pres/07/20130710a.html ↩︎
  25. Kaiser Commission on Medicaid and the Uninsured. Fast Track to Coverage:  Facilitating Enrollment of Eligible People into the Medicaid Expansion (Washington, DC:  Kaiser Family Foundation), November 19, 2013. Available at: http://modern.kff.org/medicaid/issue-brief/fast-track-to-coverage-facilitating-enrollment-of-eligible-people-into-the-medicaid-expansion/ ↩︎
  26. Ibid. ↩︎
  27. Varney, Sarah. “Emergency Rooms Are Front Line For Enrolling New Obamacare Customers.” Kaiser Health News/NPR, January 14, 2014; available at: http://www.kffhealthnews.org/stories/2014/january/14/signing-up-for-obamacare-in-the-er.aspx. ↩︎
  28. Kaiser Commission on Medicaid and the Uninsured, The Coverage Gap:  Uninsured Poor Adults in States that Do not Expand Medicaid (Washington, DC:  Kaiser Family Foundation), October 23, 2013. Available at:  https://modern.kff.org/health-reform/issue-brief/the-coverage-gap-uninsured-poor-adults-in-states-that-do-not-expand-medicaid/ ↩︎
  29. “Status of State Action on Medicaid Expansion Decision, 2014,” Kaiser Family Foundation State Health Facts. Retrieved January 29, 2014:  http://modern.kff.org/health-reform/state-indicator/state-activity-around-expanding-medicaid-under-the-affordable-care-act/ ↩︎

The U.S. Global Health Budget: Analysis of Appropriations for Fiscal Year 2014

Published: Jan 31, 2014

Overview

The FY14 Omnibus Appropriations bill was signed into law by the President on January 17, 2014, with approximately $9.1 billion1  in U.S. funding for global health programs, its highest historical level, though global health funding represents less than 1% of the overall federal budget. Global health funding in FY14 increased by more than $400 million (5%) above FY13 post-sequestration levels (sequestration mandated an approximate 5% decrease from enacted levels to most discretionary programs, projects, and activities in FY13). Most of this funding ($8.4 billion) is provided through the Global Health Programs (GHP) account at USAID and the State Department (see Table 1).

Within the GHP account, all programs received funding increases, with the exception of Family Planning and Reproductive Health (FP/RH), which declined slightly. Bilateral HIV funding, as part of PEPFAR, received the largest dollar increase ($146 million), followed by the Global Fund to Fight AIDS, Tuberculosis and Malaria ($81 million), and Maternal and Child Health (MCH) programs ($78 million).

Figure 1: Global Health Programs (GHP) Account, FY 2001-FY 2014

Looking more broadly at funding trends over time (focusing on the GHP account), increased funding for global health has been relative modest in recent years (rising 3% between 2012 and 2014, for example), after the substantial increases of the prior decade (see Figure 1). This was similar to the rate of growth in federal funding for other non-defense, discretionary spending over the same recent period (2%).2 

The summary below provides an overview of global health funding levels by program area as specified in the FY14 Omnibus Appropriations bill.3 

PEPFAR/Bilateral HIV

Figure 2: Global Health Programs (GHP) Account, Funding Change by Sector, FY 2013–FY 2014

PEPFAR’s bilateral HIV funding through the GHP account totaled $4,350 million ($330 million at USAID and $4,020 at the State Department), an increase of $146 million (3%) above FY13, demonstrating the largest increase among all areas (Figure 2). Bilateral HIV accounts for the largest share (52%) of the global health portfolio under the GHP account (Figure 3). The Omnibus bill also provided $114 million in HIV funding through the Centers for Disease Control and Prevention (CDC), a $3 million (3%) increase above FY13, and $8 million in funding for HIV programs at the Department of Defense (DoD), which matches the FY13 level. Additional funding for HIV research activities at the National Institutes of Health (NIH) is not yet known.

Global Fund to Fight AIDS, Tuberculosis and Malaria (Global Fund)

Figure 3: Global Health Programs (GHP) Account By Sector, FY 2014

The Omnibus bill included $1,650 million for the U.S. contribution to the Global Fund, an $81 million (5.2%) increase above FY13 and the second largest increase among all areas. The Global Fund accounts for the second largest share (20%) of global health funding (in the GHP account).

Tuberculosis

Tuberculosis funding through the GHP account totaled $236 million, a $12 million (5%) increase above FY13. Additional tuberculosis funding provided through the Economic Support Fund (ESF) account is not yet known.

Malaria

Malaria funding through the GHP account totaled $665 million, a $9 million (1%) increase above FY13. Additional malaria funding through the CDC and for research activities at the NIH are not yet known.

Family Planning & Reproductive Health (FP/RH)

FP/RH funding through the GHP account totaled $524 million and was the only program area under the GHP account that declined from FY13 levels (-$4.0 million or -1%). However, Congress stated in the Omnibus bill that total bilateral funding for FP/RH programs should be “not less than $575 million” ($524 million through the GHP account and $51 million through the ESF account) and included an additional $35 million for the U.S. contribution to the United Nations Population Fund (UNFPA), essentially matching final FY13 funding levels ($610 million). While the Omnibus bill maintains existing policy requirements prohibiting the use of foreign assistance to pay for the performance of abortion as a method of family planning or to motivate or coerce any person to practice abortion, it does not include a reinstatement of the “Global Gag Rule”, which required foreign NGOs to certify that they would not perform or promote abortion as a method of family planning using funds from any source as a condition for receiving U.S. funding, nor does it prohibit funding for needle exchange programs – provisions that had been included in the House SFOPs appropriations bill.

Maternal & Child Health (MCH)

In FY14, MCH funding through the GHP account totaled $705, an increase of $78 million (12%) above FY13 and the third largest increase among all areas. Some additional MCH funding provided through other accounts is not yet known. Specific components of MCH funding include:

  • GAVI: The U.S. contribution to GAVI, which is included under MCH funding in the GHP account, totaled $175 million, a $37 million (27%) increase above FY13.
  • Polio: U.S. funding for polio programs is provided through USAID (via the GHP and ESF accounts) and CDC. Polio funding through USAID totaled $59 million ($51 million from GHP and $8 million from ESF), an increase of $15 million (34%) above FY13. Polio funding through the CDC totaled $146 million, an increase of $41 million (38%) above FY13 (polio accounted for more than 75% of the entire increase in CDC global health funding).4 
  • United Nations Children’s Fund (UNICEF): The U.S. contribution to UNICEF totaled $132 million in FY14, a $7 million (5%) increase above FY13.5  The House SFOPs appropriations bill had eliminated funding for several United Nations entities including UNICEF.

Nutrition

Nutrition funding through the GHP account totaled $115 million, a $20 million (21%) increase above FY13. Additional nutrition funding provided through other accounts, such as the ESF account, is not yet known.

Vulnerable Children

Funding for vulnerable children, which is provided via the Displaced Children and Orphans Fund (DCOF), totaled $22 million in the GHP account, a $5 million (32%) increase above FY13. The increase in funding for vulnerable children was the largest percentage increase among all areas under the GHP account.

Pandemic Preparedness

Pandemic Preparedness funding through the GHP account totaled $73 million, an increase of $17 million (31%) above FY13. The increase in pandemic preparedness funding was the second largest percentage increase among all areas under the GHP account. Additional funding provided through other accounts, such as the ESF account, is not yet known.

Other Non-Global Health Funding

The Omnibus bill also provided funding for areas and agencies that are not directly involved in U.S. global health, but are related and may impact these efforts including the Millennium Challenge Corporation (MCC), Feed the Future (FtF), which is the U.S. Government’s Global Hunger and Food Security Initiative, broader food assistance through Food for Peace and McGovern-Dole International Food for Education and Child Nutrition, and other funding through the State & Foreign Operations Development Assistance (DA) and Economic Support Fund (ESF) accounts. Within the Omnibus bill, funding for all of these areas increased above FY13 levels with the exception of the overall DA and ESF accounts; the DA account declined by more than $200 million (-8%) and the ESF account declined by almost $1 billion (see Table 2). The ESF decrease, however, is entirely attributed to decreases in funding for Overseas Contingency Operations (OCO), which provides funding for programs in Iraq, Afghanistan, and Pakistan; non-OCO funding in the ESF account actually increased.

Table 1: U.S. Funding for Global Health Programs, FY 2013 – FY 2014
Department / Agency / AreaFY13 Final(millions)*FY14 Omnibus(millions)Difference(millions, %)
USAID – Global Health Programs (GHP)
HIV/AIDS$333$330$-2.9 (-0.9%)
Tuberculosis$225$236$11.5 (5.1%)
Malaria$656$665$8.6 (1.3%)
Neglected Tropical Diseases (NTDS)$86$100$14.4 (16.8%)
Pandemic Preparedness$55$73$17.3 (31.4%)
Maternal & Child Health (MCH)$627$705$77.7 (12.4%)
of which GAVI$138$175$37 (26.8%)
of which Polio$39$51$11.6 (29.5%)
Nutrition$95$115$19.9 (20.9%)
Vulnerable Children$17$22$5.4 (32.2%)
Family Planning & Reproductive Health (FP/RH)$528$524$-4 (-0.8%)
Total USAID:$2,622$2,769$147.8 (5.6%)
State Department – Global Health Programs (GHP)
HIV/AIDS Bilateral$3,871$4,020$149.2 (3.9%)
Global Fund$1,569$1,650$81 (5.2%)
Total State:$5,440$5,670$230.2 (4.2%)
Total GHP – State & USAID
Total USAID & State GHP:$8,061$8,439$378 (4.7%)
Economic Support Fund (ESF)
Family Planning & Reproductive Health (FP/RH)$49$51$1.8 (3.8%)
Polio$4$8$4 (100%)
International Organizations & Programs (IO&P)
United Nations Population Fund (UNFPA)$33$35$1.8 (5.3%)
United Nations Children’s Fund (UNICEF)$125$132$6.8 (5.5%)
Centers for Disease Control and Prevention (CDC)**
Global AIDS$111.0$114$3.3 (2.9%)
Global Immunization$151.9$193$41.3 (27.2%)
of which Polio Eradication$105.5$146$40.5 (38.4%)
of which Other Global/Measles$46.5$47$0.8 (1.7%)
Global Disease Detection & Emergency Response$39.4$40$0.6 (1.4%)
Parasitic Diseases & Malaria$18.4$19$0.6 (3.5%)
Global Public Health Capacity$8.7$17$7.8 (88.7%)
Total CDC:$329.5$383$53.5 (16.2%)
Department of Defense (DoD)
HIV/AIDS$8$8$0 (0%)
Total Global Health Funding
Total Global Health Funding$8,611$9,057$445.9 (5.2%)
NOTES:*FY 2013 Final includes the effects of sequestration.**The President’s FY 2014 Budget Request for CDC included a realignment of funding for business services. This realignment of funds was not taken into account in the FY 2014 Omnibus bill and has not been included in the FY 2013 Final amounts presented in this table.

Back to top

Table 2: Other Related Non-Global Health Funding, FY 2013 – FY 2014
Department / Agency / AreaFY13 Final(millions)*FY14 Omnibus(millions)Difference(millions, %)
Development Assistance (DA) account (SFOPs)$2,718$2,507$-210.7 (-7.8%)
Economic Support Fund (ESF) account$5,569$4,639$-929.8 (-16.7%)
of which Overseas Contingency Operations$3,009$1,656$-1352.8 (-45%)
Feed the Future (FtF) Initiative$951$1,100$149.1 (15.7%)
of which Development Assistance (DA) account$833Not Yet Known
of which Economic Support Fund (ESF) Account$118Not Yet Known
Global Agriculture and Food Security Program (GAFSP)$128$133$4.8 (3.8%)
McGovern-Dole International Food for Education and Child Nutrition Program$175$185$10 (5.7%)
Food for Peace (FFP-Title II)$1,359$1,466$107 (7.9%)
Millennium Challenge Corporation (MCC)$853$898$45.5 (5.3%)
NOTE: *FY 2013 Final includes the effects of sequestration.

Back to top

  1. This total represents funding amounts identified in the bill.  Additional funding for some global health programs at USAID and the National Institutes of Health (NIH) is determined at the agency level and is therefore not yet available. ↩︎
  2. Note: Does not include funding for Overseas Contingency Operations (OCO) or other emergency funding. Analysis of data from: the House of Representatives Committee on Appropriations, January 13, 2014, http://appropriations.house.gov/uploadedfiles/fy14_omnibus_-_informational_graphs.pdf; CBO, Estimate of Discretionary Appropriations for Fiscal Year 2014, Including H.R. 3547, the ConsolidatedAppropriations  Act, 2014, as Posted on the Website of the House Committee on Rules on January 13, 2014, http://www.cbo.gov/sites/default/files/cbofiles/attachments/hr3547.pdf; CRS, Defense: FY2014 Authorization and Appropriations, January 8, 2014, http://www.fas.org/sgp/crs/natsec/R43323.pdf; DoD, National Defense Budget Estimates for FY 2014, May 2013, http://comptroller.defense.gov/defbudget/fy2014/FY14_Green_Book.pdf ↩︎
  3. Unless otherwise specified, all totals refer to funding amounts under the GHP account. All comparisons are to FY13 post-sequestration levels. ↩︎
  4. A realignment of CDC funding for business services that was included in the President’s FY 2014 Budget Request is not included in these totals. ↩︎
  5. U.S. funding for UNICEF is provided through the International Organizations and Programs (IO&P) account. ↩︎
Poll Finding

Kaiser Health Policy News Index: January 2014

Published: Jan 31, 2014

The Kaiser Health Policy News Index is a new feature of Kaiser’s public opinion research program launched in January 2014. It is designed to help journalists and policymakers understand which health policy-related news stories Americans are paying attention to, and what the public understands about health policy issues covered in the news.

Continuing news coverage of the rollout of the Affordable Care Act (ACA) captured the public’s attention this month, with over half (55 percent) saying they followed this story “very” or “fairly” closely, a level of attention that has been fairly steady since October. Other stories related to the health care law were followed by somewhat smaller shares of the public, including coverage of legal action involving the ACA’s birth control requirement (46 percent say they followed “very” or “fairly” closely, including roughly equal shares of women and men), discussions of the ACA in the 2014 elections (43 percent), and coverage of states’ decisions about whether to expand Medicaid (38 percent). A similar share reports closely following the release of a federal government report about U.S. health care spending (36 percent), while fewer followed the release of a study about Medicaid and emergency room visits in Oregon (16 percent). By comparison, about seven in ten (69 percent) say they closely followed news about the condition of the U.S economy, and four in ten (39 percent) say they followed coverage of the Supreme Court case involving same-sex marriage in Utah, slightly smaller than the share who report following the Supreme Court case about the health care law’s requirement that most health plans cover birth control.

Figure 1

As mentioned above, over a third of the public (36 percent) say they closely followed news about the release of a federal government report on U.S. health care spending. The report, released on January 6, found that growth in U.S. health care spending remained low for the fourth consecutive year, increasing by 3.7 percent in 2012. Despite this, when asked their perceptions of the cost of health care in the nation, half of the public says that over the past few years, costs have been going up faster than usual (50 percent), and only 8 percent say costs have been going up slower than usual. Perhaps surprisingly, those who report closely following the release of the government report are not substantially more likely to be aware of the cost slowdown: only 11 percent of those who say they followed the story “very” or “fairly” closely believe that costs are going up slower than usual, and nearly half believe costs have been going up faster than usual (49 percent).

Figure 2

NOTE: These questions were asked as part of the January 2014 Kaiser Health Tracking Poll. For more results from that survey, including methods, see: Kaiser Health Tracking Poll: January 2014