Trend in Overall Opinion on the ACA

The independent source for health policy research, polling, and news.
The typical Medicare beneficiary this year has 18 private Medicare Advantage plans and 35 stand-alone Part D drug plan options to consider, in addition to traditional Medicare. Medicare encourages seniors to make informed decisions with respect to their health coverage options when they first become eligible for Medicare, and to review these options annually so they select coverage that best meet their needs. Yet research suggests only a small share of Medicare beneficiaries voluntarily switch plans during Medicare’s open enrollment periods. This raises questions about the role of choice in Medicare: How do Medicare beneficiaries choose among coverage options? Are Medicare beneficiaries happy with their coverage or just “sticky” when it comes to plan choice? What motivates some to switch plans and why don’t others do so? What are the implications for Medicare beneficiaries, private plans, health care providers and Medicare’s future?
At 9:30 a.m. ET Tuesday, May 13, the Kaiser Family Foundation will hold a policy briefing to examine how seniors and younger Medicare beneficiaries are negotiating their Medicare Advantage and Part D coverage options and consider the implications for them and for Medicare in the future. Swarthmore College Professor Barry Schwartz, author of The Paradox of Choice and a TED conference speaker, will provide opening remarks on why Americans value choice and the effects of abundant choice for individuals and their decision-making. His remarks will be followed by perspectives from an expert panel that will focus on Medicare, comprising Joe Antos, scholar at the American Enterprise Institute; Gretchen Jacobson, associate director for Medicare policy at the Foundation; Joshua Raskin, managing director at Barclays Capital; and Judith Stein, executive director of the Center for Medicare Advocacy. Foundation Senior Vice President Tricia Neuman will moderate.
WHEN: Tuesday, May 13, 9:30 a.m. to 11:00 a.m. (Registration and breakfast at 9 a.m.)
WHERE: Barbara Jordan Conference Center, Kaiser Family Foundation Offices 1330 G Street, NW, Washington, D.C. (one block west of Metro Center)
View the archived webcast of this briefing.
KFF: for trusted information on the health issues facing the nation and its people. The Kaiser Family Foundation is a nonprofit organization based in Menlo Park, California.
New data released by the Centers for Medicare and Medicaid Services (CMS) shows that as of the end of March 2014, Medicaid and CHIP enrollment had increased by over 4.8 million people since open enrollment began for the new Health Insurance Marketplaces in October 2013. These data help provide a better understanding of how the Affordable Care Act (ACA) is impacting Medicaid enrollment, which has been a keen focus and subject of debate among the press, policymakers, and analysts. However, understanding the ACA’s impact on Medicaid enrollment remains complex given that the ACA promotes increased Medicaid enrollment in varied ways, including changes in eligibility, modernization and simplification of enrollment processes, and increased outreach and enrollment efforts. To interpret the data, it is important to understand what they represent, what they show about the impact of the ACA on Medicaid enrollment, and what questions still remain. This brief discusses the data and its interpretation to assess the influence of the ACA on Medicaid enrollment and finds:
Even though most observers remain focused on the ACA’s Medicaid expansion, the ACA strengthens and improves Medicaid in other key ways that will increase Medicaid enrollment. Overall, there are three main changes the ACA makes to eligibility and enrollment that are expected to contribute to Medicaid enrollment gains (Figure 1):
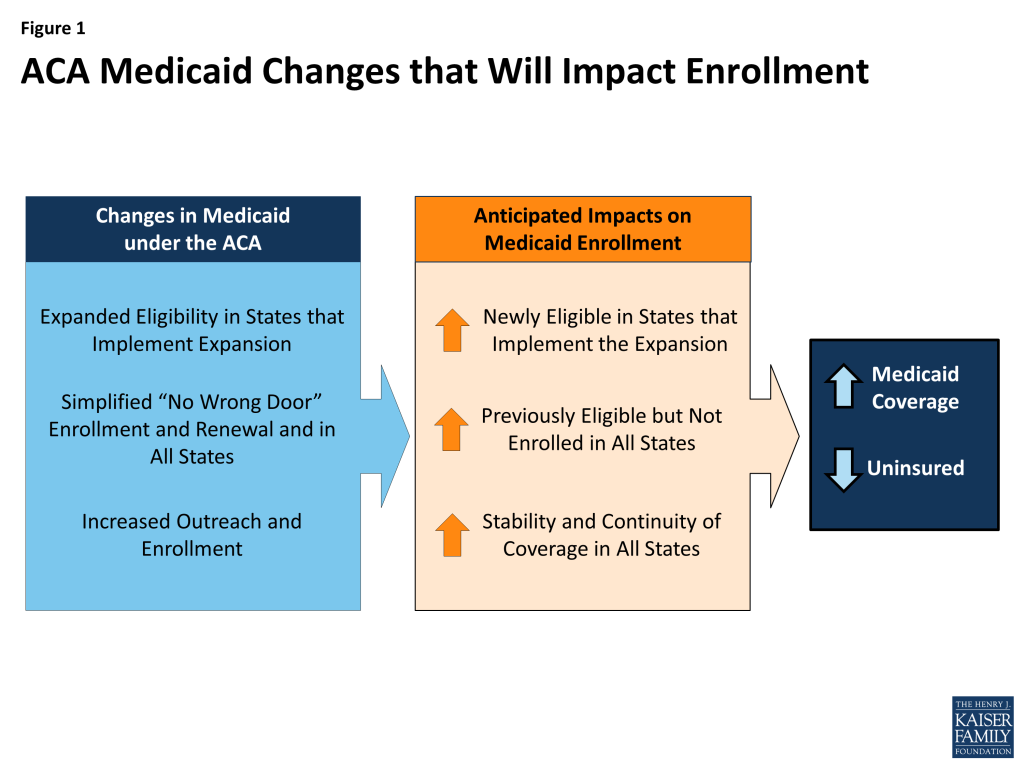
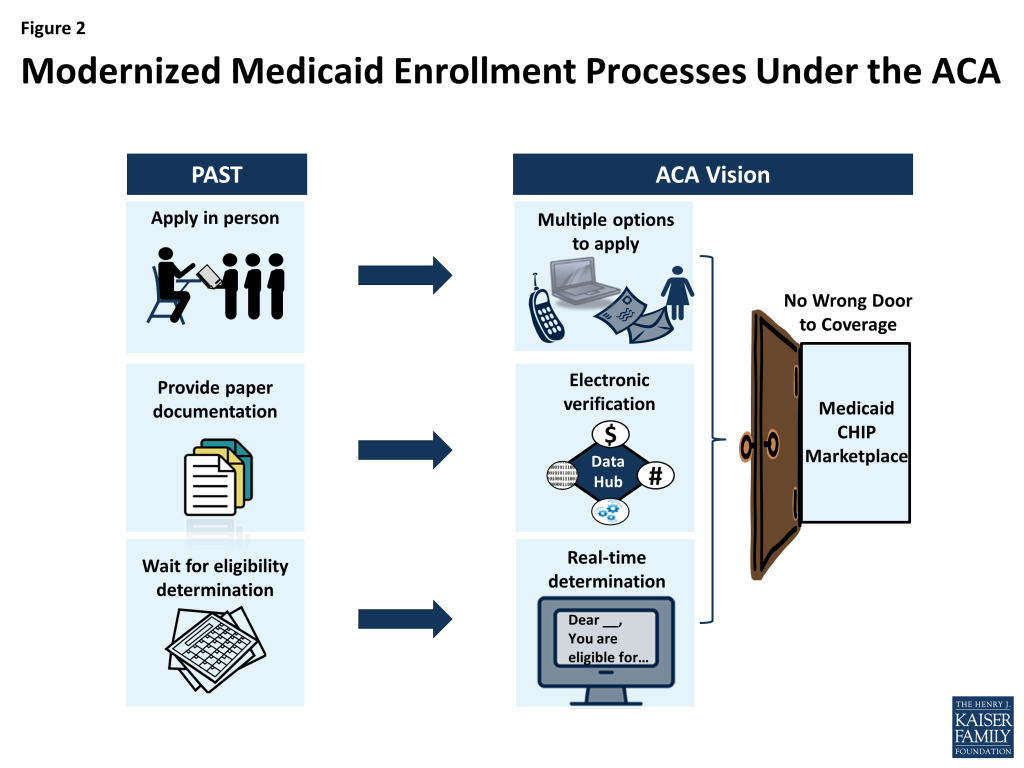
Together, these three key changes are expected to lead to increased Medicaid coverage and a reduction in the number of uninsured. In states that expand Medicaid, there will be enrollment gains among adults made newly eligible by the expansion. But, in all states, the simpler enrollment processes and broad outreach and enrollment efforts will promote increased enrollment among individuals who were already eligible for Medicaid before the ACA, but not enrolled, many of whom are children. Prior to the ACA, these individuals may not have known that coverage was available, did not think they would be eligible, or may have encountered difficulties enrolling.
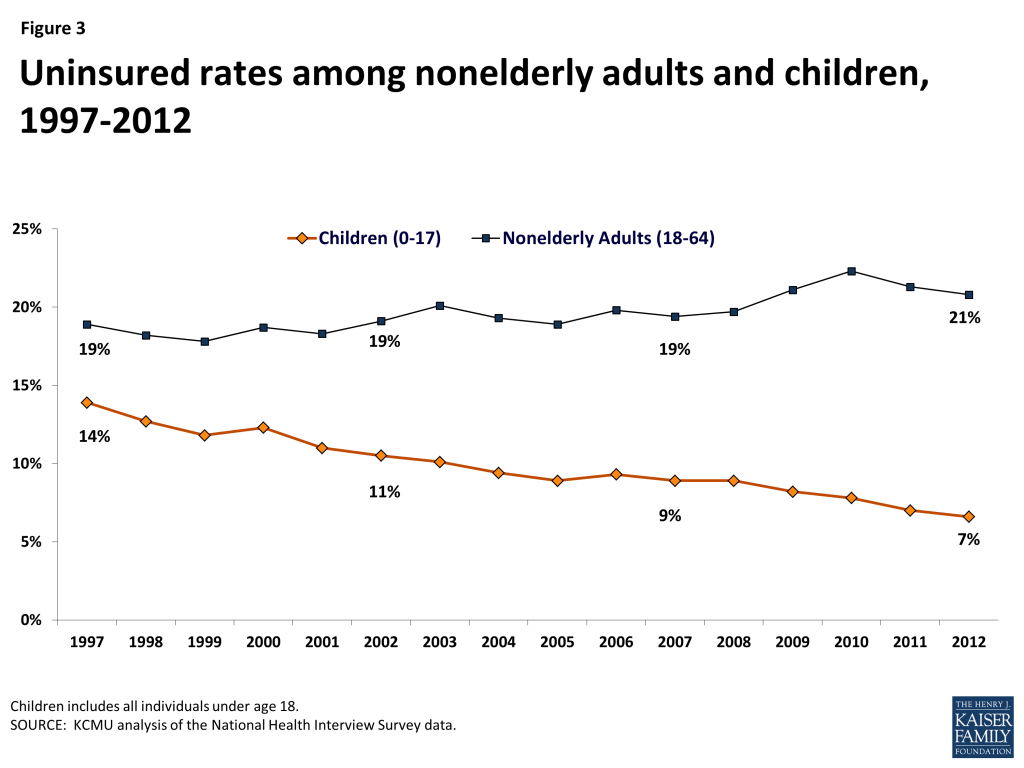
Previous experience with CHIP shows that the combined effects of increased eligibility, simplified enrollment, and enhanced outreach and enrollment efforts lead to decreases in the uninsured rate for children. CHIP was created in 1997 as a complement to Medicaid. It expanded eligibility to uninsured children who were not eligible for Medicaid, led states to simplify enrollment and renewal processes for children, and spurred broad outreach and enrollment efforts. Together, the combined effects of these changes not only increased enrollment of children in both Medicaid and CHIP, but resulted in a steady decline in the uninsured rate for children. Between 1997 and 2012 the uninsured rate for children was cut in half from 14% to a record low of 7%, even as uninsured rates for adults climbed during the recent economic downturn (Figure 3).
CMS recently began publishing monthly reports as part of an initiative to provide data on a broad set of Medicaid and CHIP eligibility and enrollment performance indicators to inform program management and oversight.2 This type of timely data had never before been reported and is providing some of the fastest insights on national Medicaid enrollment in the program’s history. The initial monthly reports provided data on the number of applications submitted and eligibility determinations made for Medicaid and CHIP. The press and assorted experts focused on trying to tease out what share of these determinations were attributable to the ACA and, in particular, the Medicaid expansion. However, it was difficult to disentangle the impacts of the ACA given the limitations of the data. Beginning in its April 2014 report, CMS also began reporting data on total Medicaid and CHIP enrollment. The addition of this data represents progress toward the agency’s goal of reporting a broader set of performance indicators and allows for greater insight into the ACA’s impact on enrollment. To date, CMS has reported point-in-time total Medicaid enrollment as of February 2014 and March 2014, as well as average monthly enrollment data for a comparison period prior to open enrollment (July through September 2013). However, the data are new and remain subject to gaps, inconsistencies and limitations.
The CMS data show that between the comparison period prior to open enrollment (July to September 2013) and March 2014, total Medicaid and CHIP enrollment grew by over 4.8 million people (from 58.9 to 63.7 million) among the 47 states reporting data for both periods. Nearly all of this growth occurred among the reporting states implementing the Medicaid expansion. In the states expanding Medicaid that reported data for both periods, enrollment grew by 4.2 million (from 34.1 to 38.3 million). In states that are not expanding Medicaid and that reported data for both periods enrollment grew by just over 643,000 people (from 24.7 to 25.4 million).3 This growth reflects a combination of increased enrollment among newly eligible adults in states that have implemented the Medicaid expansion and increased enrollment among previously eligible individuals in all states due to changes in enrollment processes and stronger outreach and enrollment efforts. In the non-expansion states, it is likely that most enrollment gains have been among children, given that children make up most of the eligible but not enrolled uninsured population due to the higher income eligibility levels for children and limited eligibility for adults in these states. The 4.8 million enrollment increase does not reflect the 950,000 individuals enrolled under early expansions in seven states, since most individuals enrolled in these expansions were already enrolled in Medicaid by the July-September 2013 comparison period before the ACA.4
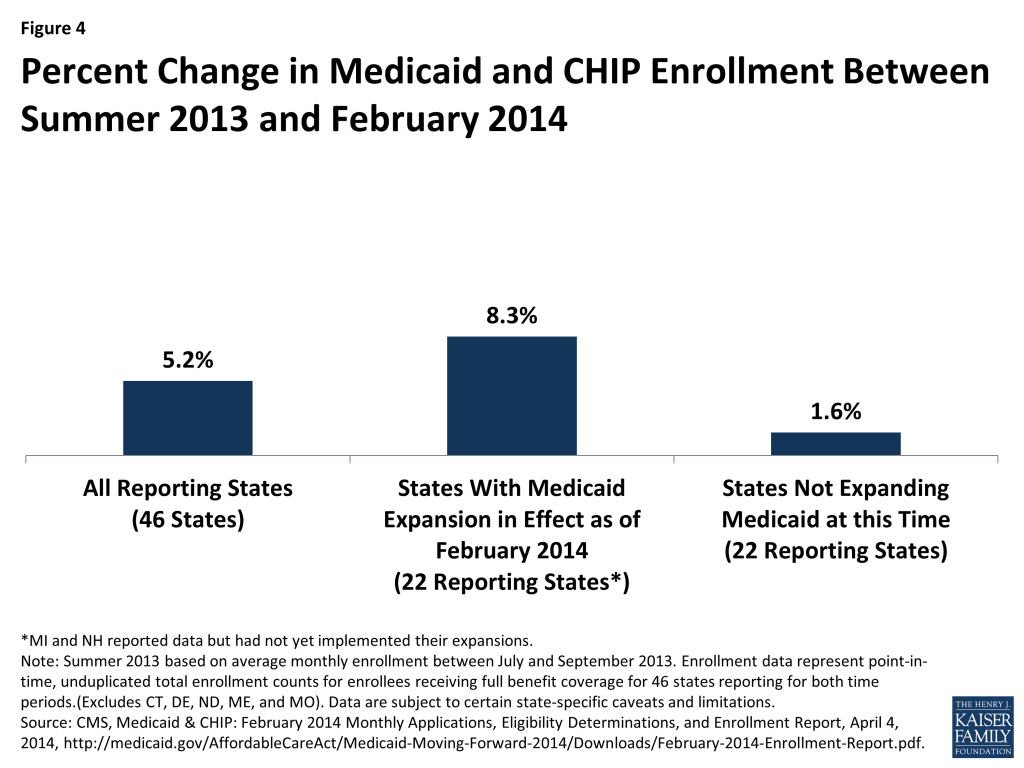
There are wide disparities in enrollment growth between states that have already expanded Medicaid and those that have not expanded. Across the 47 states that reported data for both the period prior to open enrollment and March 2014, enrollment grew by an average of 8.2% between summer 2013 and March 2014 (Figure 4). The 22 states that had their Medicaid expansions in effect as of March 2014 and reported data for both periods experienced significantly greater enrollment growth compared to reporting states that are not expanding at this time (12.9% vs. 2.6%). Overall, 16 of the 22 reporting states that had already expanded Medicaid reported enrollment growth that exceeded 10%, including 5 that experienced growth exceeding 30%. Among expansion states, the variation in enrollment changes in part reflects differences in the size of the coverage expansion that is occurring in 2014. For example, states that previously covered many adults may see a smaller increase. Nearly all (22 of 23) states that are not expanding Medicaid and reported data for both periods had enrollment growth of less than 10%, with 7 reporting negative enrollment growth or net declines in enrollment over the period (Appendix Table 1).5
It is expected that Medicaid and CHIP enrollment will continue to grow. As noted, not all states reported enrollment data for the period and the data that were reported are preliminary and expected to increase as states finalize their data and incorporate retroactive enrollments into their enrollment counts. These enrollment adjustments will likely include some individuals determined eligible for Medicaid or CHIP by the Federally Facilitated Marketplace (FFM) who may not have had their enrollment completed due to delays in the transfers of accounts between the FFM and Medicaid and CHIP agencies. Moreover, because Medicaid and CHIP enrollment is not limited to the open enrollment period for the Marketplaces, new enrollments will continue year-round.
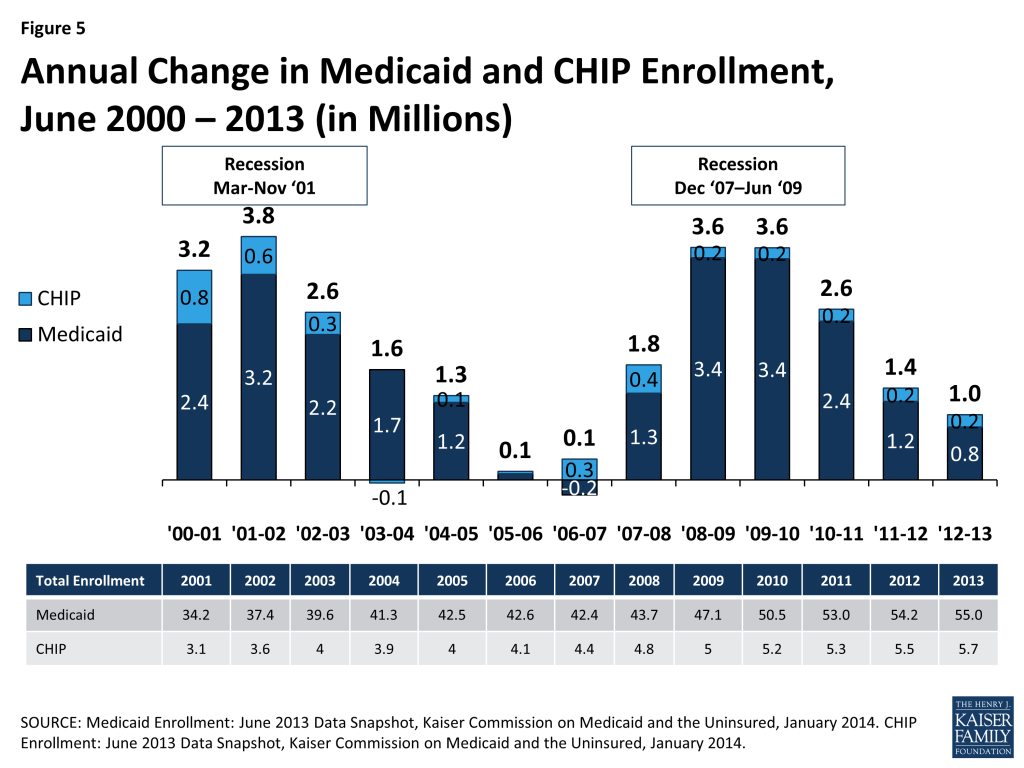
The recent enrollment data from CMS show strong growth relative to previous enrollment trends. Earlier Medicaid and CHIP enrollment data collected and analyzed by the Kaiser Commission on Medicaid and the Uninsured for multiple years show that enrollment growth was slowing prior to the beginning of open enrollment as economic conditions continued to improve, at 1.4 million between June 2011 and 2012 and 1.0 million between June 2012 and 2013 (Figure 5).6 The CMS-reported enrollment gain of 4.8 million between summer 2013 and March 2014 is greater than enrollment trends at the height of the most recent economic downturn, which peaked at 3.6 million between June 2008 to 2009 and June 2009 to 2010. Although these earlier data are not directly comparable to the new CMS data because not all states reported to CMS and there are differences in data adjustments, they both similarly report monthly point-in-time enrollment. Comparing the recent enrollment change reported by CMS to earlier trends suggests that the ACA policy changes are having a positive impact on enrollment. However, it is important to recognize that additional factors may also be influencing enrollment, including seasonal fluctuations, changing economic conditions, and overall population growth.
Even with the new enrollment data, it remains challenging to quantify and separately identify the impacts of the specific ACA policies on enrollment. Although, in principle, it should be relatively easy to calculate the number of adults enrolled in the Medicaid expansion in the states that have expanded, the reality has proven challenging. Many state systems are not yet able to track enrollment in this group separately and report in real-time. Only a few states (such as Washington) have reported data on the number of people enrolling in the expansion group, and it is not possible to extrapolate from a few states to estimate the entire expansion population accurately. In addition, the CMS enrollment data are for overall enrollment and do not separately identify expansion enrollees. In the future, data on expansion enrollees will become available when states begin requesting payments for the higher federal matching rate provided for adults made newly eligible by the Medicaid expansion. It also is difficult to identify how many people are enrolling in Medicaid as a result of the new, simpler processes or as a result of the ACA’s broad outreach and enrollment efforts. Unlike the Marketplaces, Medicaid was an existing program with ongoing enrollment at the time the ACA was implemented, so separating usual enrollment changes from ACA-driven changes is complex. In contrast, the Marketplaces are entirely new entities created by the ACA, so any enrollee in the Marketplace is, by definition, new and growth in enrollment over time can be more easily measured and compared across states.
The new enrollment data reported by CMS suggest that the ACA is having a strong positive impact on Medicaid enrollment, particularly in states that have implemented the Medicaid expansion. However, ultimately the key measure of the ACA’s success will changes in the number of uninsured. Early survey findings show promising reductions in the uninsured rate to date. However, fully assessing the impact of the ACA will require monitoring changes in coverage over longer periods of time to determine changing patterns in health insurance coverage and access to care and the extent to which individuals are able to maintain continuous coverage. While waiting for these measures is challenging, they ultimately will provide the most meaningful measures of the ACA’s progress in achieving its broader coverage goals. In the meantime, the data released by CMS is expected to continue to improve and expand over time, allowing for greater analysis, and surveys like the Kaiser Survey of Low-income Americans will provide insight into low-income consumers’ experiences to provide greater understanding about the impact of the ACA on the low-income uninsured.7
| Appendix Table 1: Total Medicaid and CHIP Enrollment, February and March 2014 | |||||
| State | Medicaid Expansion Status | Monthly AverageJuly-Sept 2013 | February 2014 | March 2014 | Percent ChangeJuly-Sept 2013 to March 2014 |
| Arizona | Expanded | 1,201,770 | 1,234,401 | 1,301,010 | 8.3% |
| Arkansas | Expanded | 680,920 | 763,356 | 805,785 | 18.3% |
| California | Expanded | 9,157,000 | 9,999,000 | 10,334,000 | 12.9% |
| Colorado | Expanded | 783,420 | 962,210 | 1,012,944 | 29.3% |
| Connecticut | Expanded | – | – | 704,387 | |
| Delaware | Expanded | – | 230,165 | 233,786 | – |
| District of Columbia | Expanded | 235,786 | 238,000 | 241,243 | 2.3% |
| Hawaii | Expanded | 288,358 | 313,669 | 320,567 | 11.2% |
| Illinois | Expanded | 2,753,227 | 2,735,224 | 2,791,737 | 1.4% |
| Iowa | Expanded | 493,515 | 557,501 | 572,375 | 16.0% |
| Kentucky | Expanded | 840,926 | 966,365 | 1,125,964 | 33.9% |
| Maryland | Expanded | 856,297 | 1,053,589 | 1,092,409 | 27.6% |
| Massachusetts | Expanded | 1,296,359 | 1,453,213 | 1,455,069 | 12.2% |
| Michigan | Expansion effective 4/1/14 | 1,912,009 | 1,845,112 | 1,942,437 | 1.6% |
| Minnesota | Expanded | 873,040 | 976,350 | 972,683 | 11.4% |
| Nevada | Expanded | 332,559 | 404,825 | 437,218 | 31.5% |
| New Hampshire | Expansion effective 7/1/14 | 127,082 | 133,110 | 134,699 | 6.0% |
| New Jersey | Expanded | 1,283,851 | 1,361,513 | 1,382,091 | 7.7% |
| New Mexico | Expanded | 572,111 | 602,014 | 632,489 | 10.6% |
| New York | Expanded | 5,678,418 | 5,823,995 | 6,022,253 | 6.1% |
| North Dakota | Expanded | – | – | – | |
| Ohio | Expanded | 2,341,482 | 2,361,103 | 2,549,762 | 8.9% |
| Oregon | Expanded | 626,357 | 900,933 | 900,038 | 43.7% |
| Rhode Island | Expanded | 190,833 | 227,095 | 244,162 | 27.9% |
| Vermont | Expanded | 127,162 | 168,233 | 173,609 | 36.5% |
| Washington | Expanded | 1,117,576 | 1,369,179 | 1,369,825 | 22.6% |
| West Virginia | Expanded | 354,544 | 473,401 | 490,962 | 38.5% |
| Percent Change in States with Expansion in Effect as of March 2014* | 12.9% | ||||
| Alaska | Not Currently Expanding | 799,176 | 116,720 | 119,767 | -1.0% |
| Alabama | Not Currently Expanding | 120,946 | 769,295 | 774,293 | -3.1% |
| Florida | Not Currently Expanding | 3,086,445 | 3,233,195 | 3,309,501 | 7.2% |
| Georgia | Not Currently Expanding | 1,702,650 | 1,773,327 | 1,801,484 | 5.8% |
| Idaho | Not Currently Expanding | 251,926 | 270,594 | 270,943 | 7.5% |
| Indiana | Not Currently Expanding | 1,120,674 | 1,120,847 | 1,165,718 | 4.0% |
| Kansas | Not Currently Expanding | 397,989 | 415,284 | 420,487 | 5.7% |
| Louisiana | Not Currently Expanding | 1,019,787 | 1,008,176 | 1,011,883 | -0.8% |
| Maine | Not Currently Expanding | – | – | – | |
| Missouri | Not Currently Expanding | 714,055 | 828,478 | 829,585 | -3.9% |
| Mississippi | Not Currently Expanding | 863,417 | 720,292 | 731,876 | 2.5% |
| Montana | Not Currently Expanding | 139,604 | 149,245 | 153,736 | 10.1% |
| North Carolina | Not Currently Expanding | 244,600 | 1,786,369 | 1,802,167 | 3.3% |
| Nebraska | Not Currently Expanding | 1,744,160 | 238,121 | 235,054 | -3.9% |
| Oklahoma | Not Currently Expanding | 790,051 | 814,881 | 828,329 | 4.8% |
| Pennsylvania | Not Currently Expanding | 2,386,046 | 2,398,718 | 2,427,034 | 1.7% |
| South Carolina | Not Currently Expanding | 988,349 | 1,017,333 | 1,041,993 | 5.4% |
| South Dakota | Not Currently Expanding | 115,501 | 115,013 | 115,711 | 0.2% |
| Tennessee | Not Currently Expanding | 1,244,516 | 1,279,336 | 1,298,181 | 4.3% |
| Texas | Not Currently Expanding | 4,441,605 | 4,425,316 | 4,444,819 | 0.1% |
| Utah | Not Currently Expanding | 322,442 | 330,306 | 332,826 | 3.2% |
| Virginia | Not Currently Expanding | 1,003,266 | 1,058,839 | 1,039,822 | 3.6% |
| Wisconsin | Not Currently Expanding | 1,161,876 | 1,162,614 | 1,151,225 | -0.9% |
| Wyoming | Not Currently Expanding | 71,962 | 72,378 | 119,767 | -5.6% |
| Percent Change in States Not Expanding* | 2.6% | ||||
| Percent Change in All States* | 8.2% | ||||
| * Percent change based on states reporting for both the July-September 2013 and March 2014 periods.Sources: CMS March 2014 and Updated February 2014 Medicaid and CHIP Application and Eligibility Report. See CMS reports for data definitions and state-specific data notes and caveats. | |||||
This insight was prepared by Vikki Wachino from NORC at the University of Chicago and Samantha Artiga and Robin Rudowitz from the Kaiser Family Foundation.
Despite concerns that payment changes enacted in the Affordable Care Act of 2010 (ACA) would lead to reductions in Medicare Advantage enrollment, the number and share of Medicare beneficiaries enrolling in Medicare Advantage plans has continued to climb. Since the enactment of the ACA, Medicare Advantage enrollment has increased by 4.6 million, or by 41 percent. Reductions in payments enacted in the ACA aimed to reduce historical overpayments to Medicare Advantage plans and to create more equity between Medicare payments made for beneficiaries in the traditional Medicare program and those joining Medicare Advantage plans. As of March of 2014, almost one in three (30 percent) people on Medicare (15.7 million beneficiaries) were enrolled in a Medicare Advantage plan, a 10 percent increase since March 2013. During the past year, Medicare Advantage enrollment has increased in virtually all states. Most of the enrollment growth since 2013 has been in the individual market, but group enrollment in Medicare Advantage plans accounted for almost one-third (32%) of the enrollment growth in 2014 and has been a major factor in the experience of some firms.
Average monthly premiums (weighted by enrollment) have remained relatively stable since 2012 ($35 per month in 2014). During this same period, however, average out-of-pocket spending limits have been on the rise, which could expose a subset of enrollees to higher costs – mainly those who have significant medical needs. Medicare Advantage plans, unlike traditional Medicare, are required to limit out-of-pocket costs for services covered under Parts A and B ($3,400 is recommended; $6,700 is the maximum). Between 2013 and 2014, the share of Medicare Advantage enrollees in plans with limits above $5,000 almost doubled, from 24 percent in 2013 to 44 percent in 2014. This Data Spotlight reviews national and state-level enrollment trends as of March 2014 and examines variation in enrollment by plan type and firm. It also analyzes the most recent data on premiums, out-of-pocket limits and prescription drug coverage in the Part D “donut hole” for Medicare Advantage enrollees.
Despite concerns that payment changes enacted in the Affordable Care Act of 2010 (ACA) would lead to reductions in Medicare Advantage enrollment, the number and share of Medicare beneficiaries enrolling in Medicare Advantage plans has continued to climb.1 Since the enactment of the ACA, Medicare Advantage enrollment has increased by 4.6 million, or by 41 percent.[endnote 111939-2] Reductions in payments enacted in the ACA aimed to reduce historical overpayments to Medicare Advantage plans and to create more equity between Medicare payments made for beneficiaries in the traditional Medicare program and those joining Medicare Advantage plans. As of March of 2014, almost one in three (30 percent) people on Medicare (15.7 million beneficiaries) were enrolled in a Medicare Advantage plan, a 10 percent increase since March 2013.During the past year, Medicare Advantage enrollment has increased in virtually all states. Most of the enrollment growth since 2013 has been in the individual market, but group enrollment in Medicare Advantage plans accounted for almost one-third (32%) of the enrollment growth in 2014 and has been a major factor in the experience of some firms.
Average monthly premiums (weighted by enrollment) have remained relatively stable since 2012 ($35 per month in 2014). During this same period, however, average out-of-pocket spending limits have been on the rise, which could expose a subset of enrollees to higher costs – mainly those who have significant medical needs. Medicare Advantage plans, unlike traditional Medicare, are required to limit out-of-pocket costs for services covered under Parts A and B ($3,400 is recommended; $6,700 is the maximum). Between 2013 and 2014, the share of Medicare Advantage enrollees in plans with limits above $5,000 almost doubled, from 24 percent in 2013 to 44 percent in 2014. This Data Spotlight reviews national and state-level enrollment trends as of March 2014 and examines variation in enrollment by plan type and firm. It also analyzes the most recent data on premiums, out-of-pocket limits and prescription drug coverage in the Part D “donut hole” for Medicare Advantage enrollees.
Nationwide Enrollment. There are 15.7 million beneficiaries – 30 percent of the Medicare population – enrolled in a Medicare Advantage plan in 2014 (Exhibit 1).2 Between 2013 and 2014, total Medicare Advantage enrollment grew by almost 1.4 million, or 9 percent; since 2010, Medicare Advantage enrollment has increased by 4.6 million beneficiaries or 41 percent from 2010 to 2014. This pattern continues the rapid growth in enrollment that occurred concurrently with the introduction of Part D (prescription drug coverage) in 2006 and other changes in the Medicare Advantage program authorized by the Medicare Prescription Drug, Improvement and Modernization Act (MMA) of 2003. Medicare enrollment has continued to grow despite the fact that the average number of plans available to enrollees nationwide declined from a high of 48 plans in 2009 to 20 plans in 2012 and to 18 in 2014, as firms made changes to plans offered under their Medicare Advantage contracts.3


Enrollment by State. Medicare Advantage enrollment continues to vary geographically (Table 1). In 2014, as in at least the prior two years, 6 states (AK, DE, MD, NH, VT and WY) had less than 10 percent of Medicare beneficiaries in Medicare Advantage plans (Exhibit 2). In contrast 18 states (versus 15 in 2013) have 30 percent or more of their beneficiaries enrolled in Medicare Advantage plans, including 3 (MN, OR, and HI) with 40 percent or more enrolled in Medicare Advantage plans. This variation reflects the urban origins of health maintenance organizations (HMOs) in Medicare Advantage and other factors, such as the history of managed care in the state and the prevalence of employer sponsored insurance for retirees.
Despite such variation, enrollment increased in virtually all states in 2014, with the exception of New Jersey where enrollment declined 2 percent. Among other states, 13 states experienced a growth in enrollment of 5 percent or less In 19 states, enrollment grew by 6-10 percent, in 9 states enrollment grew by 11-15 percent and in 7 states enrollment grew by 16 percent or more between 2013 and 2014. Very high rates of growth (such as 56 percent in Illinois and 45 percent in North Carolina) reflect the influence of the group market, and illustrate how a single change in coverage for an employment-based retiree group can move relatively large numbers of people within a state. Each of these states added over 100,000 group enrollees to Medicare Advantage between March 2013 and 2014. In most other states, enrollment in group plans had a far more modest effect on the growth in Medicare Advantage enrollment.
| Table 1. Medicare Advantage Enrollment and Penetration Rate, by State, 2013-2014 | ||||||
| State | 2013 Total Enrollment | 2014 Total Enrollment | Change in Total Enrollment, 2013-2014 | Percent Change in Enrollment, 2013-2014 | 2013 Penetration Rate | 2014 Penetration Rate |
| Total U.S. | 14,361,615 | 15,732,081 | 1,370,466 | 10% | 28% | 30% |
| Alabama | 203,951 | 220,640 | 16,689 | 8% | 22% | 24% |
| Alaska | N/A | N/A | N/A | N/A | N/A | N/A |
| Arizona | 384,851 | 401,626 | 16,775 | 4% | 38% | 38% |
| Arkansas | 98,322 | 107,713 | 9,391 | 10% | 17% | 19% |
| California | 1,937,350 | 2,061,617 | 124,267 | 6% | 37% | 38% |
| Colorado | 244,356 | 263,788 | 19,432 | 8% | 35% | 36% |
| Connecticut | 137,253 | 146,372 | 9,119 | 7% | 23% | 24% |
| Delaware | 10,941 | 12,623 | 1,682 | 15% | 7% | 7% |
| District of Columbia | 8,654 | 9,714 | 1,060 | 12% | 10% | 11% |
| Florida | 1,318,740 | 1,438,325 | 119,585 | 9% | 36% | 38% |
| Georgia | 350,142 | 404,628 | 54,486 | 16% | 25% | 28% |
| Hawaii | 103,346 | 108,143 | 4,797 | 5% | 46% | 46% |
| Idaho | 74,871 | 81,440 | 6,569 | 9% | 30% | 33% |
| Illinois | 209,200 | 326,678 | 117,478 | 56% | 11% | 16% |
| Indiana | 224,875 | 244,970 | 20,095 | 9% | 21% | 22% |
| Iowa | 74,520 | 77,032 | 2,512 | 3% | 14% | 14% |
| Kansas | 54,329 | 59,018 | 4,689 | 9% | 12% | 13% |
| Kentucky | 178,945 | 198,052 | 19,107 | 11% | 22% | 24% |
| Louisiana | 193,638 | 213,280 | 19,642 | 10% | 26% | 28% |
| Maine | 49,347 | 58,234 | 8,887 | 18% | 17% | 20% |
| Maryland | 73,239 | 76,464 | 3,225 | 4% | 8% | 9% |
| Massachusetts | 209,147 | 229,400 | 20,253 | 10% | 18% | 20% |
| Michigan | 478,923 | 547,372 | 68,449 | 14% | 27% | 30% |
| Minnesota | 415,638 | 448,301 | 32,663 | 8% | 49% | 51% |
| Mississippi | 64,000 | 69,962 | 5,962 | 9% | 12% | 13% |
| Missouri | 257,164 | 285,066 | 27,902 | 11% | 24% | 26% |
| Montana | 27,229 | 31,125 | 3,896 | 14% | 15% | 17% |
| Nebraska | 33,228 | 33,507 | 279 | 1% | 12% | 13% |
| Nevada | 126,441 | 135,599 | 9,158 | 7% | 32% | 33% |
| New Hampshire | 12,554 | 15,905 | 3,351 | 27% | 5% | 6% |
| New Jersey | 223,161 | 219,494 | -3,667 | -2% | 16% | 15% |
| New Mexico | 98,198 | 107,064 | 8,866 | 9% | 29% | 30% |
| New York | 1,062,329 | 1,151,620 | 89,291 | 8% | 33% | 35% |
| North Carolina | 328,020 | 475,432 | 147,412 | 45% | 20% | 28% |
| North Dakota | 13,716 | 15,202 | 1,486 | 11% | 12% | 14% |
| Ohio | 755,580 | 794,226 | 38,646 | 5% | 37% | 38% |
| Oklahoma | 102,224 | 106,706 | 4,482 | 4% | 16% | 16% |
| Oregon | 286,306 | 305,794 | 19,488 | 7% | 42% | 43% |
| Pennsylvania | 939,496 | 971,144 | 31,648 | 3% | 39% | 39% |
| Rhode Island | 68,306 | 70,627 | 2,321 | 3% | 35% | 36% |
| South Carolina | 167,292 | 193,641 | 26,349 | 16% | 20% | 22% |
| South Dakota | 18,781 | 22,242 | 3,461 | 18% | 13% | 15% |
| Tennessee | 338,124 | 376,577 | 38,453 | 11% | 29% | 32% |
| Texas | 889,551 | 990,399 | 100,848 | 11% | 27% | 29% |
| Utah | 101,751 | 107,139 | 5,388 | 5% | 33% | 34% |
| Vermont | 8,199 | 8,368 | 169 | 2% | 7% | 7% |
| Virginia | 181,455 | 196,993 | 15,538 | 9% | 15% | 15% |
| Washington | 305,289 | 329,087 | 23,798 | 8% | 28% | 29% |
| West Virginia | 83,922 | 96,604 | 12,682 | 15% | 21% | 24% |
| Wisconsin | 324,912 | 352,842 | 27,930 | 9% | 33% | 35% |
| Wyoming | 1,940 | 1,997 | 57 | 3% | 3% | 3% |
| NOTE: Includes employer-sponsored plans, special needs plans, and other private plans. N/A indicates too few (less than 50) enrollees to report. Total U.S. includes Puerto Rico.SOURCE: MPR/Kaiser Family Foundation analysis of CMS Medicare Advantage enrollment and Landscape files, 2013-2014. | ||||||
Nationwide Trends. HMOs, which were the original form of Medicare Advantage plan, account for almost two-thirds (64 percent) of Medicare Advantage enrollment in 2014, with 23 percent in local PPOs, 8 percent in regional PPOs, 2 percent in Private fee-for-service (PFFS) plans, and 3 percent in other types of plans (Exhibit 3). While the HMO market share has remained relatively stable in recent years, PPOs (especially local PPOs) have replaced the PFFS product as the dominant alternative plan attracting enrollees.


Geographic Variation in Trends by Plan Type. The distribution of Medicare Advantage enrollees, by plan type, varies across states (Table A1). HMOs account for 90 percent or more of Medicare Advantage enrollment in three states (AZ, CA, and NV), but less than one-third of total enrollment in 14 states (AK, GA, IN, KY, MN, MT, ND, NH, SC, SD, VT, WV, and WY) plus the District of Columbia. In states where HMOs are less dominant, local PPOs are most common, but in some states, beneficiaries tend to gravitate toward regional PPOs (SC, SD, VT), PFFS plans (WY,ND, SD) or cost plans (MN, DC). In Florida, most enrollees are in HMOs, but the state also has the largest number of regional PPO enrollees in the nation (almost 340,000). In Minnesota, more than 60 percent of private plan enrollees are in what is called a cost plan; Minnesota’s cost plan enrollees accounts for 58 percent of all cost plan enrollees nationwide. Policies that affect specific plan types will therefore have a differential effect from market to market, and across states.
Group Enrollment. Most Medicare beneficiaries who enroll in Medicare Advantage plans do so as individuals, but a small share is enrolled through groups. The group market consists largely of employment-sponsored Medicare Advantage plans for retirees. Employers that offer health benefits to Medicare-eligible retirees have the option to contract with Medicare Advantage plans to provide supplemental benefits. Under these arrangements, the employer contracts with the Medicare Advantage insurer to provide its retirees supplemental benefits, and Medicare pays the plan a fixed payment per enrollee to provide Medicare benefits , which is supplemented by an employer plan premium for the additional benefits.7
In 2014, 3.0 million of the 15.7 million Medicare Advantage enrollees were in a group plan (Exhibit 5 and Table A2). Of this total, 59 percent were enrolled in local PPOs and 37 percent were enrolled in HMOs. In contrast to the individual market, PPOs account for a larger share of the group market than HMOs. The share of Medicare Advantage enrollees in group plans has never been very large, but the numbers are growing, consistent with trends in the overall Medicare Advantage market. In the recent past, group enrollment in Medicare Advantage has grown proportionately to the growth in the market overall; between 2008 and 2013, the number of group enrollees grew from 1.7 million to 2.5 million, but the relative share in the group market changed little over the time period (17.5% in 2008 versus 17.3% % in 2013). In the past year, group enrollment increased by 17 percent (0.4 million additional enrollees), rising at a faster rate than the 7.9 percent growth rate in the individual market (0.9million additional enrollees). Today, group enrollees account for 19 percent of the total Medicare Advantage population.

According to the Medicare Payment Advisory Commission (MedPAC), group Medicare Advantage plans typically receive higher Medicare payments and have higher bids, on average, than plans offered in the individual Medicare Advantage market.8 Their analysis shows that the average payment to group Medicare Advantage plans was 109 percent of traditional Medicare spending whereas the average payment to all Medicare Advantage plans was 106 percent of traditional Medicare spending. MedPAC attributes the differences to incentives for firms in the group market to maximize Medicare revenue to offset employer costs by bidding at the benchmark, whereas firms in the individual Medicare Advantage market have an incentive to bid below the benchmark, in order to receive a rebate (a percent of the difference between the bid and the benchmark) with which they can provide extra benefits to individual plan enrollees. MedPAC has recommended changes in the way payments are made for group plans so that there is greater parity with the individual market.
The influence of employer groups on Medicare Advantage enrollment differs across the country depending on the prevalence of employers offering retiree health benefits, including public and unionized industries.9 States where a substantially larger share of Medicare Advantage enrollees are in group plans include West Virginia (57%), Michigan (49%), Kentucky (42%), Illinois (40%), Ohio (38%), District of Columbia (33%), and New Hampshire (33%). In other states, group enrollment tends to account for less than one-third of total Medicare Advantage enrollment.
Special Needs Plans. Special Needs Plans (SNPs) restrict enrollment to specific types of beneficiaries with significant or relatively specialized care needs, including beneficiaries: (1) dually eligible for Medicare and Medicaid (D-SNPs); (2) requiring a nursing home or institutional level of care (I-SNPs); or (3) with severe chronic or disabling conditions (C-SNPs.)
The most SNP enrollees are in HMOs (87%), with 10 percent enrolled regional PPOs and 3 percent in local PPOs. As a share of the total Medicare Advantage population (Exhibit 6 and Table A3), enrollment in SNPs is relatively low. The 1.9 million enrollees in such plans in 2014 account for about 12 percent of total Medicare Advantage enrollment.
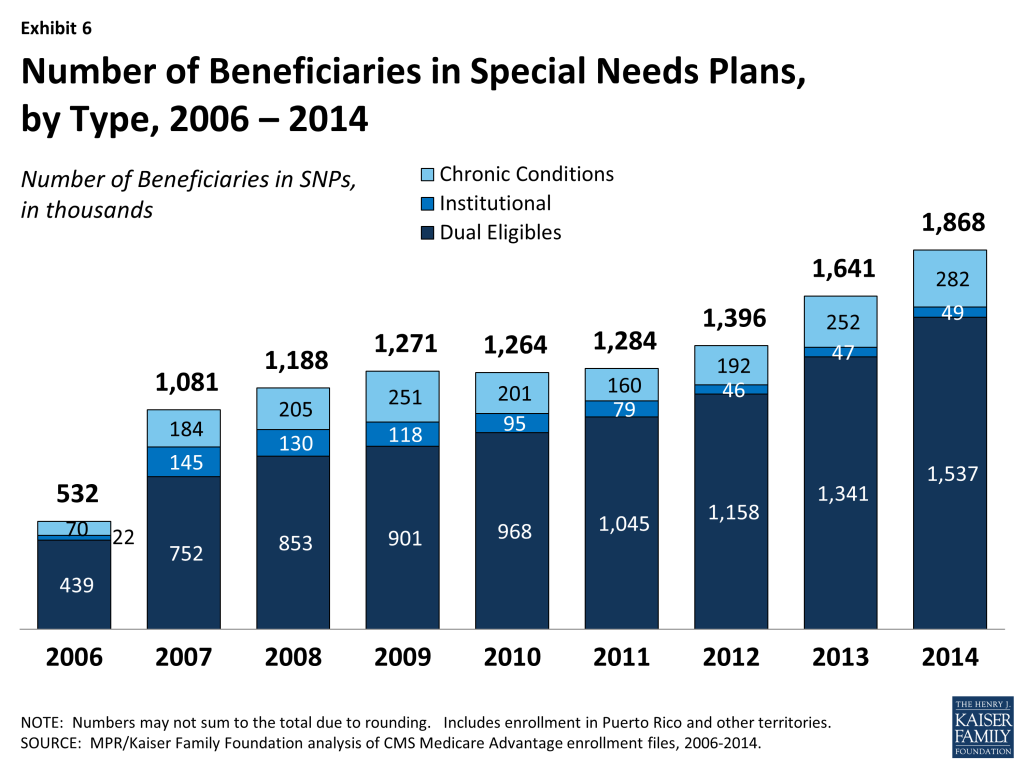
Most SNP enrollees (1.5 million or 82%) are in plans serving those dually eligible for Medicare and Medicaid. Such enrollment varies greatly by state, and enrollment of dually eligible beneficiaries in SNPs is particularly prevalent in four states: Hawaii (62%), Arizona (44%), Utah (35%), and Minnesota (30%).
Separately, several states (including CA, MA, MN, NY, IL, OH, SC, VA, and WA) are undertaking demonstrations with CMS to improve the financial alignment of Medicare and Medicaid for dually eligible beneficiaries. In many states, SNPs may continue to operate separately from the demonstration, and dually eligible beneficiaries enrolled in these SNPs can remain in them. It is not clear how the demonstration will affect the growth in D-SNP enrollment over time in these states.
Medicare Advantage enrollees are responsible for paying the Part B premium, in addition to any premium charged by the plan. The Medicare Advantage premium paid by enrollees reflects the difference between the plan’s costs of providing Part A and B benefits and any supplemental benefits offered, and the federal payment to the plan for the benefits. Plans receive a percentage of the difference between their bid and the maximum federal payment (known as a rebate) and are required to use this amount to offset any extra benefits not offered by traditional Medicare, any reduced cost sharing, or the Part B premium. If Part D is part of the plan, as it is for most enrollees, the plan may also use the rebate to reduce the Part D premium.
In this brief, we analyze premiums for Medicare Advantage plans that offer prescription drug benefits (MA-PDs) because the vast majority (88%) of Medicare Advantage enrollees in individual plans is in an MA-PD.
Average Premium Trends. The average enrollee in an MA-PD paid a monthly premium of about $35 in 2014, reflecting little change since 2012, and a reduction in average premiums since 2011 ($38) and 2010 ($43) (Exhibit 7). It is important to note, however, that the actual premium an enrollee pays varies by plan type and locale, as well as by decisions and preferences of enrollees, such as whether they are willing to pay more for a broader network or more generous benefits. Average premiums and trends in premiums paid by enrollees vary across plan types. Enrollee premiums in 2014 averaged $27 per month for HMOs, $32 per month for regional PPOs, $59 per month for local PPOs, and $63 per month for PFFS plans. Compared to 2013, the average HMO premium was unchanged whereas average premiums for local PPOs, regional PPOs, and PFFS plans increased by an average by $1, $3, and $11 per month, respectively. In 2014, enrollees are generally paying lower premiums in 2014 than in 2010, mainly due to the reduction in average HMO and local PPO premiums over that period and most enrollees are in HMOs and local PPOs in 2014.

In the fall of 2013, we calculated that beneficiaries who were enrolled in Medicare Advantage plans at that time would pay a premium of $39 per month in 2014, compared to $35 per month in 2013, which assumed they remained in the same plan.10 Among Medicare Advantage enrollees in 2014, the average premium actually paid by enrollees ($35 per month) is similar to that in 2014. The difference in estimates reflects both changes in beneficiaries enrolled in Medicare Advantage from 2013 to 2014 and shifts by enrollees among plans and plan types.
Zero Premium Plans. As in prior years, most Medicare beneficiaries (84%) had a choice of at least one MA-PD that charged no additional premium for coverage, other than the monthly Part B premium, also known as “zero premium plans”. Many plans view such products as good ways of attracting enrollees into Medicare Advantage since they often provide more benefits than traditional Medicare and “one stop shopping” that avoids separate decisions about Part D and supplemental coverage through various Medigap options.
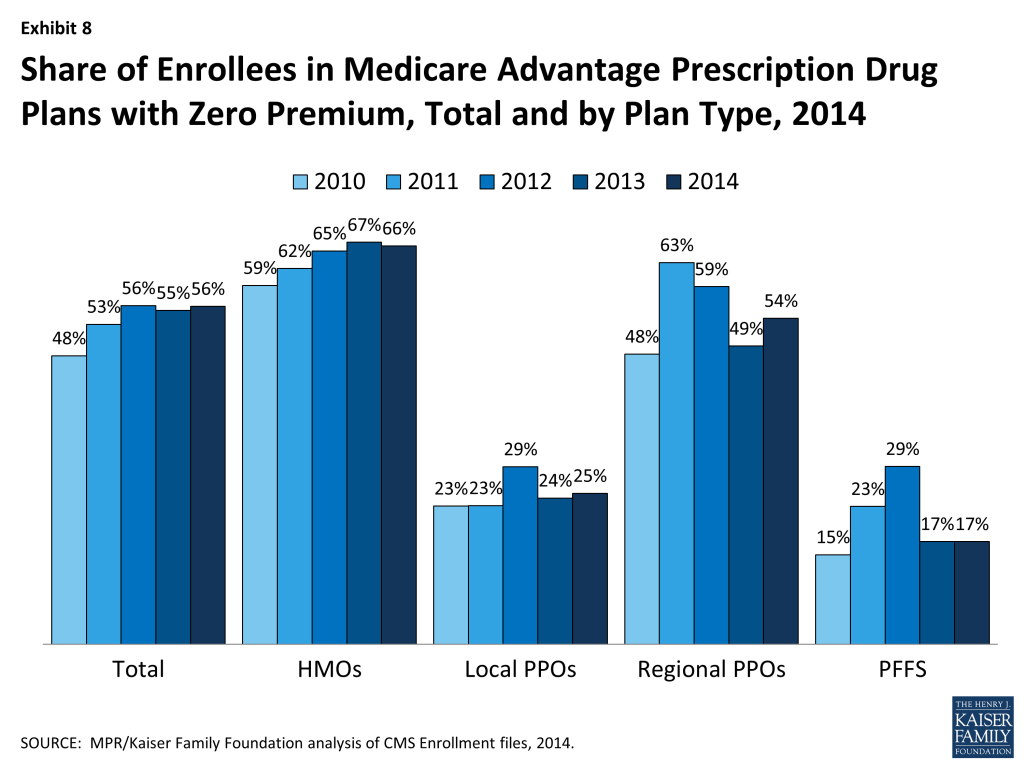
In 2014, 56 percent of all Medicare Advantage plan enrollees were in zero premium MA-PDs (Exhibit 8). A larger than average share of enrollees in HMOs were enrolled in zero-premium plans (66%) while a much smaller than average share of PFFS enrollees were enrolled in such plans (17%). A substantially smaller share of local PPO enrollees than regional PPO enrollees were covered by a zero-premium plan (25% versus 54%). Further analysis is needed to assess the relationship between zero-premium plans and benefit design, and factors that motivate employers to offer zero premium products in some situations and not others.11
In addition to analyzing premiums, we examined variations across plans and trends with respect to two types of benefits: the limit on out-of-pocket costs set by the plan and the availability of expanded Part D benefits relating to the coverage gap or “donut” hole.
Out-0f-Pocket Limits. Although traditional Medicare does not include an annual out of pocket limit on cost sharing for Medicare A and B benefits, CMS began requiring in 2011 that all Medicare Advantage plans have a limit below $6,700 annually and recommended a limit of $3,400 or lower. Since 2011, the share of beneficiaries in plans with limits below $3,400 has declined from 51 percent in 2011 to 33 percent in 2014 (Exhibit 9). During this time period, the share of enrollees in plans with limits above $5,000 almost doubled, from 24 percent in 2011 to 44 percent in 2014.

Historically, HMOs have had the lowest average out of pocket limit and regional PPOs have had the highest average out of pocket limit (Exhibit 10). While this remains the case in 2014, limits have risen considerably across plans of all types. Virtually all regional PPO enrollees (98%), 43 percent of local PPO enrollees, and 38 percent of HMO enrollees are in a plan with a limit over $5,000 annually. While limits define ultimate financial liability rather than the amount an enrollee pays, limits are important and also valuable in communicating to beneficiaries their potential maximum liability, at least for in-network Medicare-covered benefits, in the plan.

Coverage in the Part D Donut Hole. The standard Medicare Part D benefit in 2013 has a $310 deductible and 25 percent coinsurance up to an initial coverage limit of $2,850 in total drug costs, followed by a coverage gap (the so-called “donut hole”), until their total out of pocket Part D spending reaches $4,550 when the catastrophic limit kicks in and beneficiaries pay 5 percent of specified limits for drugs. The ACA gradually reduces the coverage gap until it is eliminated in 2020. In 2014, enrollees in plans with no additional gap coverage will pay 47.5 percent of the total costs of brands and 72 percent of the total cost of generics in the gap until they reach the catastrophic limit.
Covering a larger share of beneficiaries’ out-of-pocket costs in the “coverage gap” is one way Medicare Advantage plans can enhance benefits. In 2014, about half (49%) of all Medicare Advantage enrollees were in plans that offered no additional coverage in the gap (Exhibit 11). Twenty two percent were in plans with some additional coverage for generics and 27 percent with some additional coverage for both some generics and brand name drugs. A relatively small share of enrollees in regional PPOs had any additional gap coverage (30%) compared to enrollees in HMOs (57%). Most stand-alone Part D plans provide little or no gap coverage in 2014 beyond what is required under the standard benefit.12

Enrollment by Firm. As in prior years, Medicare Advantage enrollment in 2014 tends to be highly concentrated among a small number of firms (Exhibit 12 and Table A4). In 2014, six firms or affiliates accounted for 72 percent of the market: United Healthcare (20%), Humana (17%), Blue Cross Blue Shield (BCBS) affiliated plans (17%), Kaiser Permanente (8%), Aetna (7%), and Cigna (3%). Another 6 national firms account for 5 percent of the market, including Wellcare, HealthNet, Universal American, Munich American Holding Corporation, and Wellpoint not affiliated with BCBS. The remaining enrollees are in plans offered by more locally or regionally focused firms.

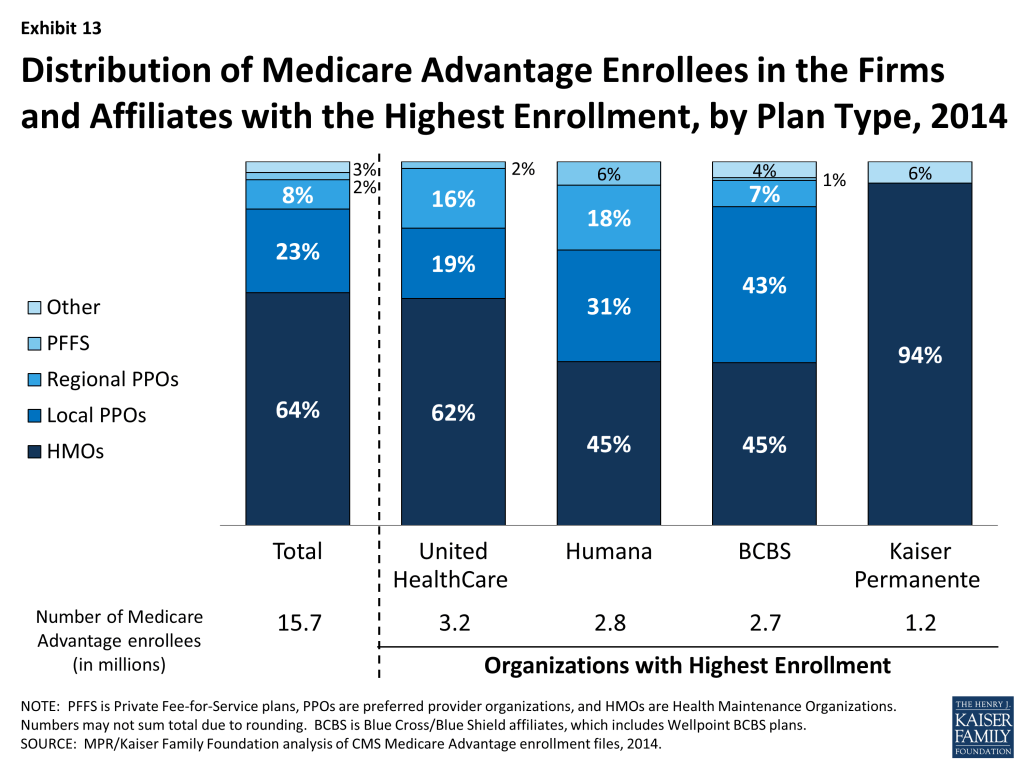
Firms differ in how they position themselves in the market, including the plan types they offer. As has been the case historically, almost all of Kaiser Permanente’s enrollees (94%) are in HMOs and the remainder are in similarly structured cost plans (Exhibit 13). In contrast, United Healthcare’s enrollment is in HMOs, local PPOs, regional PPOs, and PFFS plans, in proportions that are similar with the nationwide enrollment distribution. Compared to United Healthcare, Humana and BCBS affiliated plans have a smaller share of their enrollment in HMOs (45% for each versus 62% for United Healthcare). Humana’s distribution of enrollment across plan types continues the shift from earlier years when a much larger share of Humana’s enrollees were in PFFS plans.
Each of the large national firms in the Medicare Advantage market now has a sizeable share of enrollees from group accounts. Enrollment in group plans now represents 47 percent of enrollment in Aetna, 39 percent of enrollment in Kaiser Permanente, 23 percent of enrollment in BCBS affiliated plans, 17 percent of enrollment in Humana, and 14 percent of enrollment in United Healthcare (Table A4).
Between 2013 and 2014, some firms appear to have grown their group enrollment particularly rapidly, suggesting that they had a change in employers contracting with them. Growth in the group market accounts for all of the net growth in United Healthcare’s enrollment over the past year. Wellpoint BCBS’s total Medicare Advantage enrollment would have declined in the absence of a large increase in group enrollment (from roughly 28,000 to 120,000). In contrast, enrollment in Kaiser Permanente’s individual plans grew more rapidly than its group enrollment.13 Most of the growth in Medicare Advantage enrollment is in the individual market, but enrollment through group plans increased particularly rapidly in 2014 and has been a major factor in the experience of some firms.
Market Concentration by State. As is the case nationally, a small number of firms also dominate Medicare Advantage enrollment in most states (Exhibit 14). In all but one state (NY), the three largest firms or affiliates account for 50 percent or more of enrollment. In 20 states and the District of Columbia, 90 percent of enrollment or more is in the three largest plans and in 18 states, 75 percent of enrollment is in the three largest plans. Some states with highly concentrated markets (three firms accounting for at least 90 percent of enrollment) have relatively low Medicare Advantage penetration rates (AK, DE, KS, MS, MT, ND, NE, SD, VT, WY), but several other such states do not (LA, NC, NV, RI).
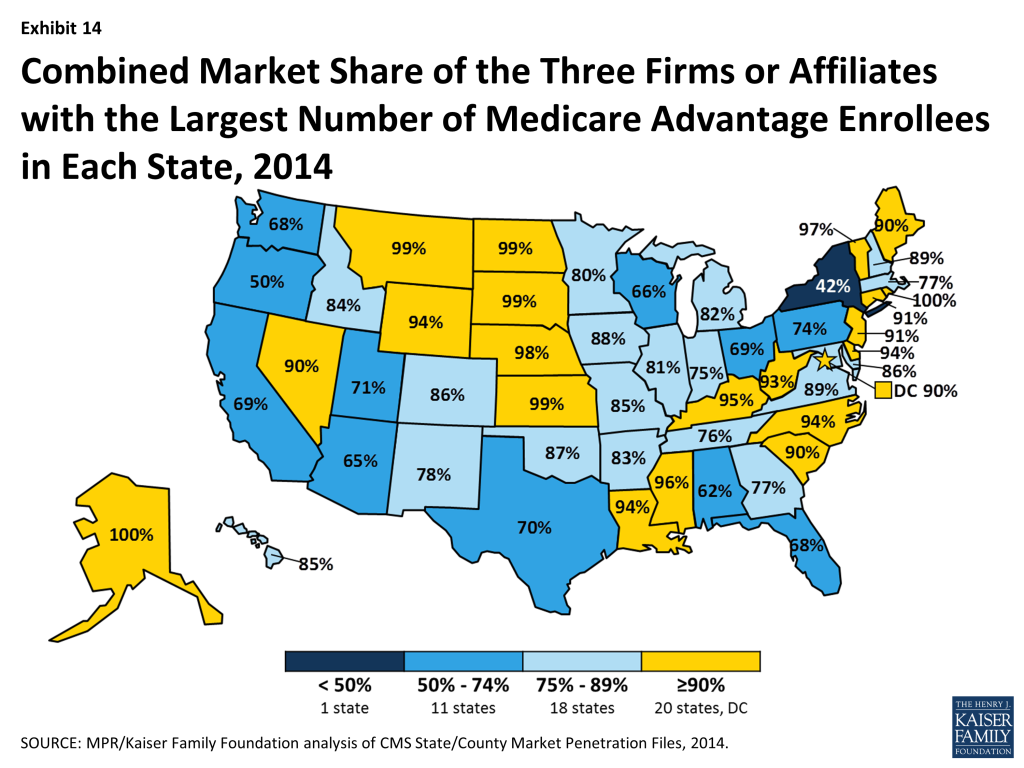
In 15 states and the District of Columbia, one company has more than half of total Medicare Advantage enrollment (Table A5). United Healthcare has the largest share in 19 states and is among the top three firms in an additional 19 states and the District of Columbia. Humana has the largest enrollment in 11 states and is among the top 3 in another 18 states. Plans offered by BCBS affiliates have the most enrollees in 8 states and are among the top firms in another 16 states. Kaiser Permanente’s presence is more geographically focused than other major national firms, with a heavy concentration in California, Colorado, the District of Columbia and Maryland. Kaiser Permanente has more enrollees than any other firm in California, the District of Columbia and Maryland. Locally dominant plans, that is, those with the most Medicare Advantage enrollees in their state include EmblemHealth (CT), Martin’s Point Health are (ME), Tufts Associated HMO (MA), New West (MT), Presbyterian Healthcare Services (NM), and Medica Holding Company (ND and SD).
Enrollment Across Counties with High and Low Traditional Medicare Spending. Over the years, Congress and various Administrations have made a number of changes to payment and participation rules for private risk-bearing plans that provide Medicare benefits under contract with the federal government, now called Medicare Advantage plans. Many of these changes have revolved around plan payment levels, seeking to balance having more plans participate with parity in payments between traditional Medicare and Medicare Advantage. The latest of these changes, which is included in the ACA, varies payment policy with the level of traditional Medicare spending in counties, grouped evenly into four quartiles by cost. Payments to plans now depend on the relationship between their bids and the counties’ traditional Medicare spending and also are increased by any quality based bonus payments the plan may receive. After being frozen in 2011 at 2010 levels, benchmarks (the maximum Medicare will pay a plan) are being adjusted down so that once payments are fully phased in they will range from 95 percent of traditional Medicare spending for counties in the top quartile of spending (e.g., Miami-Dade, FL) to 115 percent of traditional Medicare spending in the bottom quartile of such spending (e.g., Boise, ID).
Despite the payment changes, enrollment continues to grow across counties in each of the four quartiles of traditional Medicare spending (Table A6). Between 2013 and 2014, enrollment grew at a relatively similar rate in aggregate across in highest quartile counties (8.3%) as in the lowest quartile counties (8.7%), and higher, but not very much differently, in the two quartiles in between (10.7% and 12.3%, respectively). In 2014, overall penetration also was not very different across quartiles (ranging from 27% to 34%). Thus, enrollment continues to grow across counties that differ in traditional Medicare spending, which is not surprising given that Medicare Advantage penetration rates have historically been high in several low cost counties (e.g., Multnomah, OR and Boise, ID) as well as high cost counties (Miami-Dade, FL and Los Angeles, CA).
Medicare Advantage enrollment continues to grow despite concerns that payment rate changes incorporated in the ACA will lead to a drop in enrollment, and a significant reduction in benefits. Enrollment trends suggest that Medicare Advantage remains an attractive option for a growing number of beneficiaries. Despite some turnover in the composition of available plans, beneficiaries continue to have many choices and the share of beneficiaries enrolled in Medicare Advantage continues to grow in virtually all states, suggesting that the market currently has sufficient choice to attract enrollees. Our analysis also shows that premiums paid by enrollees have remained fairly flat, with the average premium ($35 per month) the same as it was in 2012 and 2013.
Looking to the future, it is not clear if or how plans will modify their offerings, nor what the effect will be for beneficiaries. Thus far, there hasn’t been much of a change in the Medicare Advantage market, other than the increase in out-of-pocket limits and reports in the media that some insurers have scaled back provider networks. As payment reductions continue to be phased in, insurers may reduce the extra benefits they now offer, though they will still be required to provide benefits that are at least equivalent to those that are offered under traditional Medicare, in conjunction with a limit on out-of-pocket spending. Insurers will need to balance their interest in maintaining market share (and remain attractive to beneficiaries) against their ongoing interest in operating as profitably as possible.
Ultimately the form of both the overall Medicare program and Medicare Advantage will be shaped by the policy and fiscal climate. There are very different perspectives on the kinds of protections Medicare needs to provide for seniors and younger enrollees with disabilities, the appropriate level of Medicare spending and how to finance it, and how Medicare benefits should be provided. This larger context, and its relevance to the long term stability of the Medicare program, warrants explicit consideration as part of the debate on Medicare Advantage payment.
Marsha Gold is a Senior Fellow Emeritus with Mathematica Policy Research;Gretchen Jacobson and Tricia Neuman are with the Kaiser Family Foundation;Anthony Damico is an independent consultant.
A new brief from the Kaiser Family Foundation documents the continuing climb in Medicare Advantage plan enrollment, even at a time when payments to such plans are being reduced under the Affordable Care Act. Despite spending reductions enacted in the ACA to reduce historical overpayments to Medicare Advantage plans, from March 2013 to March 2014 enrollment in Medicare Advantage plans grew by 9 percent, or 1.4 million people, to reach a total of 15.7 million Medicare beneficiaries. The Medicare Advantage 2014 Spotlight: Enrollment Market Update highlights that 30 percent of the Medicare population is now enrolled in such plans, up from 24 percent in 2010, and analyzes trends in Medicare Advantage enrollment, premiums, out of pocket limits, prescription drug coverage and related topics. Other key findings include:
The full analysis is available online, as are the Foundation’s updated Medicare Advantage fact sheet and our latest spotlight on Medicare Advantage plan availability and premiums.
Also available is the Foundation’s newly updated interactive Medicare Health and Prescription Drug Plan Tracker, where users can monitor trends in enrollment, market penetration and other topics for Medicare Advantage plans since 1999 and stand-alone Medicare drug plans since 2006 by state, county and other sub-state geographies.
# # #
KFF: for trusted information on the health issues facing the nation and its people. The Kaiser Family Foundation is a nonprofit organization based in Menlo Park, California.
MENLO PARK, CA, May 1, 2014 – Fifteen time Grammy Award-winning artist and HIV advocate Alicia Keys will join with Greater Than AIDS and ESSENCE to headline a special ESSENCE Empowerment Experience panel on Friday, July 4th (specific time to be announced) in New Orleans on “Through Love of Self, Family and Community, Empowering Black Women to End AIDS.”
The hour-long program will open with a one-on-one with Ms. Keys about her passion for ending AIDS to be followed by an engaging and inspiring conversation with women whose lives have been touched by HIV and how they responded. Among those joining Ms. Keys on the stage in conversation: Kym, a young professional who found out she was positive when her new husband became sick and died as a result of HIV/AIDS, and Teresa, a mother whose unconditional love of her HIV positive son has helped him to maintain his treatment and thrive in the face of this disease. At the close of the program the panel will respond to questions from the audience.
The ESSENCE Empowerment Experience is part of the hugely popular ESSENCE Festival, one of the largest and most powerful gatherings in the nation. Prominent cultural icons, celebrities and community leaders convene for thought provoking conversations on health, education, politics, love and relationships, to offer solutions for the audience’s day-to-day lives. The Empowerment Experience is free to Festival attendees and the New Orleans community.
Of the more than 1.1 million people living with HIV in the United States today, one in four is a woman. Women of color have been especially hard hit, accounting for the majority of new infections occurring among women in this country. If current trends continue, it is estimated that one in 32 Black women will contract HIV in her lifetime.
The program is presented as part the Empowered campaign, launched in 2013 by Greater Than AIDS and featuring Ms. Keys to reach women about HIV/AIDS and the role we all play in helping to end the epidemic. Through targeted media messages, community outreach and special promotions, the campaign promotes specific ways women are empowered in the face of HIV/AIDS, including:
The program is organized by ESSENCE together with Greater Than AIDS co-founders, the Kaiser Family Foundation and Black AIDS Institute, and Alicia Keys Worldwide. Gilead Sciences, Inc. contributed financial resources to support the program.
Over the three days of the ESSENCE Festival, July 4-6, in the Convention Center, Greater Than AIDS together with the Louisiana Office of Public Health and the Black AIDS Institute will provide free daily on-site HIV testing as well as a photo / video booth and other activations to bring attention to the impact of HIV. (Greater Than AIDS Booth #1800 in Hall D.)
For more information about Greater Than AIDS and the Empowered campaign, including for more details about Alicia Keys’ appearance at the 2014 ESSENCE Empowerment Experience, visit: www.greaterthan.org/empowered.

About the ESSENCE Festival and ESSENCE Empowerment Experience
The ESSENCE Festival has become one of the most powerful African-American gatherings as it represents not only our brightest stars but provides inspiration, purpose and enlightenment through its empowerment programming. The ESSENCE Empowerment Experience features engaging content that brings “the pages of ESSENCE to the stage” with our most prominent cultural icons, celebrities and community leaders who provide various modes of thought and solutions for our audience within our daily, themed discussion. The free Experience has become the daytime destination of the ESSENCE Festival that has made history by having Bill Cosby, Iyanla Vanzant, Tyler Perry, Steve Harvey, Bishop TD Jakes, Soledad O’Brien, Jada Pinkett Smith, Hill Harper, Valerie Jarret, former Secretary of State Hillary Rodham Clinton, Marc Morial, and many others share the stage.
Last year, with a record-breaking audience of more than 545,000 Festival-goers, attendance at thedaily Empowerment series reached maximum capacity for thought-provoking conversations on love and relationships, health, education, politics and our all-star inspirational Sunday Gospel tribute. Our media partner MSNBC engaged many of our Empowerment speakers in interviews as they broadcast live from the ESSENCE Festival convention center floor throughout the weekend.
About Greater Than AIDS
Greater Than AIDS is a leading national public information response focused on the U.S. domestic epidemic. Launched in 2009 by the Kaiser Family Foundation and Black AIDS Institute, Greater Than AIDS is supported by a broad coalition of public and private sector partners. Through targeted media messages and community outreach, Greater Than AIDS and its partners work to increase knowledge, reduce stigma and promote actions to stem the spread of the disease. While national in scope, Greater Than AIDS focuses on communities most affected. www.greaterthanaids.org
About Alicia Keys
Alicia Keys is a 15 time Grammy Award® winning singer/songwriter/producer, actress, New York Times best-selling author, entrepreneur and humanitarian. Since releasing her debut album, songs in A minor, Keys has built an unparalleled repertoire of hits with over 30 million albums sold worldwide. As a philanthropist, Keys co-founded Keep a Child Alive (KCA) which provides AIDS treatment, support, nutrition and love to children and families affected by HIV/AIDS in Africa and India.

The first open enrollment period under the Affordable Care Act (ACA) has come to an end, and many are looking for ways to assess the law and its implementation thus far. Of particular interest is how many people who were previously uninsured took up new coverage options, but questions about whether people with insurance changed their type of coverage also are receiving attention. Changes in employer-based insurance are particularly important because so many people get their coverage in this way.
The ACA provides significant new coverage options for people, particularly for those with lower incomes or problems with their health. The scope of the reforms, and the intense political controversy surrounding their approach and implementation, has fueled an intense demand for data about their effectiveness. Unfortunately, the information needed to adequately understand enrollment changes across private and public coverage sources will not be available for many months.
Most of what we know about who has health insurance and what type of coverage they have comes from large federal surveys, which provide estimates of the number of people enrolled in different types of coverage, including those with no coverage, along with information about their household demographics and incomes. These surveys can be used to track changes in coverage for different types of people over time. The main advantages of these surveys are their large size and their sophisticated sampling and interviewing techniques, which allow detailed analysis of coverage and coverage changes for people in different demographic and income groups. Further, many federal surveys enable analysis at the state level for at least some states, which is important because ACA implementation (e.g., the availability of expanded Medicaid coverage or the existence of a state-operated Marketplace) will vary greatly across states. Their main disadvantage is that they do not provide rapid turnaround. The data needed to evaluate the coverage changes between 2013 and 2014 will not become available until 2015.
In the interim, people will need to look to other sources of information. One is administrative data, such as the number of people who have enrolled through new health insurance marketplaces or the number of people who have enrolled in Medicaid. A problem with this type of information is that we do not know the enrollees’ coverage status prior to enrollment: did they have insurance before and, if so, what type? It also is difficult to distinguish new enrollment from coverage changes that would have occurred in the absence of the law, since people’s job status and income change throughout the year. Also, there is currently no administrative data that covers the individual market outside of the marketplaces or any data that captures the entire employer market, so there is no information to help us understand how things are changing in the market that covers the majority of nonelderly people. And most importantly, because people without insurance are not enrolled in anything, they cannot be counted in administrative data. Administrative data can provide clues about where to look for changes, but we do not have administrative systems that provide information about changes across types of coverage or changes in the number of people without insurance.
The second interim source of information about health coverage is surveys by private entities, which ask about health insurance by type of coverage and track changes over time (or at least between a few points in time). This means that they provide some opportunity to look at changes across type of coverage as well as changes in the number of people who have any coverage. The main advantage of these surveys is their rapid turn around: indeed, several private surveys already have released findings and show that the number of people without health insurance has fallen between late 2013 and early 2014. Differences in approach and sampling mean that these surveys have different strengths and weaknesses and that their results may not be consistent or comparable.
Below we discuss the details and timing of some of the private and federal surveys that will be used to look at how coverage has changed due to the ACA. Different surveys offer different information and insight into coverage under the ACA, and we discuss the contribution and challenges in each type of effort (see Textbox 1).
Textbox 1: When Interpreting Survey Results, Pay Close Attention to the Time Frame
When looking at survey results about health insurance coverage, one important factor is for what time period the survey is trying to determine coverage (or lack of coverage).
One approach that surveys take is to ask about coverage at the time of the interview. For these surveys, it is then necessary to look at the period over which interviews were conducted. If the interviews were all collected within a short time period (e.g., a week or a month), then the survey is providing an estimate of coverage for that period. Some of the private surveys described in this data note compare coverage between different months or quarters. Other surveys, such as the National Health Interview Survey (NHIS), are conducted throughout the year. In this case, the survey is providing an estimate of the average number of people who had a particular type of coverage (or were not covered) at any point during the year.
Another approach taken in surveys is to ask about coverage for a particular period in the past. For example, the Survey of Income and Program Participation (SIPP) asks respondents about their coverage for the current month and for specific prior months, and survey results report coverage for each month. This approach allows us to see how coverage changes for people over the course of a long period, although there may be issues with the ability of respondents to recall past events. In previous years, the Current Population Survey Annual Social and Economic Supplement (CPS ASEC) asked respondents if they had various types of coverage during the preceding calendar year. Despite asking about the previous year, the Census Bureau concluded that respondents were more likely reporting coverage at the time of the interview than coverage in the previous year, which means that the results were not responsive to the question being asked and that the findings were ambiguous as to the period over which coverage was being measured.1 As part of its redesign, the CPS ASEC is moving to an approach that asks respondents about their current coverage and about their coverage for each month back to January of the preceding year.2
These different approaches provide different insights into coverage and coverage dynamics. For example, we are used to thinking about how many people are uninsured at any point in time, which is about 50 million people in 2011 according the SIPP. But looking over the course of the year, about 71 million people reported being uninsured for at least one month during the year, while only 29 million reported being uninsured for the entire year. Similar variability can be seen for people with nongroup insurance.3
In addition, the timing and extension of the 2014 open enrollment period (which ended on March 31, 2014 but was extended for some applicants) produces some challenges for surveys asking about health coverage during the first quarter of 2014. For some people, the enrollment process was extended over several weeks or months because they needed to provide more information or had difficulty completing their applications. For all new enrollees, coverage took effect at some period after they enrolled. It is not known how people who were in the process of enrollment but whose coverage was not yet effective responded to survey questions about their insurance status. Thus, questions fielded between January and March or April of 2014 may produce ambiguous results about people’s coverage status at the time of the interview.
Surveys conducted by private organizations have provided the first look at coverage changes under the ACA. Private surveys have been used to analyze a number of aspects of the early implementation, including public knowledge and attitudes, changes in the share of people with insurance, and the prior insurance status of early Marketplace enrollees. Many of these surveys are fielded at regular intervals with the goal of understanding how things change over time. In some cases, such as the Gallup-Healthways Well-Being Index (“Gallup”), these are broad public opinion surveys that contain a few questions related to health insurance. In other cases, such as Urban Institute’s Health Reform Monitoring Survey (“HRMS”), the Rand Health Reform Opinion Survey (“RAND”) and our Kaiser California Uninsured Panel Survey, surveys were developed specifically to track ACA implementation. Others, like our Kaiser Health Tracking Poll, focus mainly on opinions, knowledge and early experiences rather than on measuring changes in the share of people with health insurance or non-group coverage.
The main advantage of these private, population-based surveys is their rapidly available results. As opposed to the large federal surveys that will release initial indications many months following the close of open enrollment, we already have some estimates of coverage changes from private surveys, with updates likely in the near future. Several of these surveys had established baseline coverage estimates prior to the beginning of the 2014 open enrollment, making comparisons before and after implementation possible with mostly consistent questions and approaches.
There are, however, several potential limitations to many of the private surveys that need to be kept in mind when interpreting their results.4 One is that the populations that we most want to know about account for a very small share of the overall population and therefore a small share of the sample in any population-based survey. These populations include, for example: the uninsured in states that expand Medicaid compared to states that do not, those with nongroup coverage before ACA implementation who switch to coverage through the Marketplace, and those uninsured who are now newly eligible for Medicaid or for subsidies in exchanges. Most private surveys have relatively small samples for these specific populations, which means that the estimates for these groups are imprecise (that is, estimates have large confidence intervals) and subject to meaningful volatility. Limited precision makes it hard to detect and compare statistically significant changes, particularly for subgroups (e.g., by race, former insurance status, or location).
A second challenge is that asking the questions to determine individuals’ prior and current insurance status in a way the respondents can answer accurately is very complicated and time consuming in a survey. Compared to the large federal surveys, which generally devote a number of questions to identifying type of coverage, private surveys often make due with simpler approaches. People are often confused about the type of coverage they have and may answer wrongly or inconsistently when just asked to pick from a list of coverage sources. Several of the more prominent private surveys also have changed their coverage questions recently, which make interpreting changes over time more difficult.
As a result of these limitations, these private surveys are more likely to shed light on broader questions, such as changes in the overall number of people who have health insurance, than on narrower issues, such as changes by race, income, state, or type of coverage. And even though some of the private surveys manage to obtain a fairly large number of respondents, they still may have a relatively large uncertainty around their estimates, which means that they may be more reliable for pointing to trends in the direction of change rather than providing precise measures of the actual coverage rates overall or by type of coverage.
The recent releases of estimates of coverage changes from several private surveys illustrate some of these issues. Results from Gallup, HRMS, and RAND all find that the number of people without health insurance fell during the initial months of 2014 as new coverage options under the ACA took effect.5 (Our own monthly tracking poll has shown a similar reduction in the number of adults uninsured at the beginning of 2014, though the survey was not designed to detect such changes, which are generally within the poll’s margin of error in any given month.)
The three surveys agree that the number of uninsured people has gone down, despite using very different sampling approaches: Gallup accumulates response from their daily tracking poll, which uses telephone interviews of a random sample of adults each day6 ; HRMS is based on interviews from successive samples of an internet panel, which was randomly selected7 ; and RAND is based on repeated interviewing of the same group of adults in an internet panel, a portion of which were randomly selected and a portion of which are from a convenience sample.8
The agreement among the surveys on the direction of change reinforces the overall result, although a closer look at their actual coverage estimates shows that some differences make interpreting the specific results somewhat difficult (see Table 1).
To take one example, both HRMS and Gallup showed a comparable (roughly 2 percentage point) reduction in the percentage of nonelderly adults without health insurance over the first several months of 2014, but their estimates of percentage of nonelderly adults who were or are uninsured are quite different.9 Focusing on the fourth quarter of 2013, Gallup reported that 17.1 percent of adults, including the elderly, were uninsured in the fourth quarter of 2013, which translates into about 20.5 percent of nonelderly adults.10 In contrast, HRMS’ fourth quarter 2013 estimate of uninsured adults is 17.5 percent of nonelderly adults.11 So while both show that the share of uninsured adults fell, they are starting from fairly different places in their estimates of the share of nonelderly adults without health insurance. (We should note that the Gallup estimate is for 2014 is an average over a period, but that the point estimate continued to fall throughout the period, so that the estimate of percent of adults without health insurance in the second half of March was 14.5 percent).12
Another example is the difference between RAND and Gallup relating to changes in employer-based coverage. Again, both surveys found that more people had health insurance in the early part of 2014 compared to the fall of 2013. RAND, however, found a significant increase in the number of nonelderly adults covered by employer-based coverage while Gallup found little change.13 The differences between the two surveys may result from differences in approach, sampling, questions or just random variation. This issue will be worth watching as more survey findings are released.
| Table 1: Early Results from Surveys of Coverage Under the ACA Conducted by Private Entities | ||||||
| September 2013 | March 2014 | Change In Share of Uninsured, Adults Age 18-64 | Gains In Coverage | |||
| Survey | Interview Dates | Percent Uninsured | Interview Dates | Percent Uninsured | ||
| Gallup-Healthways Well-Being Index | July 1 – Sept 30, 2013 | 18.0% adults age 18 and older | Jan 2- Mar 31, 2014 | 15.6% adults age 18 and older | -2.5 percentage points | N/A |
| Urban Institute’s Health Reform Monitoring Survey (HRMS) | Sept 1- Sept 30, 2013 | 17.9% adults age 18-64 | Mar 1 – Mar 31, 2014 | 15.2% adults age 18-64 | -2.7 percentage points | Gain in coverage for about 5.4M |
| RAND Health Reform Opinion Survey | Sept 1- Sept 30, 2013 | 20.5% adults age 18-64 | Mar 1 – Mar 31, 2014 | 15.8% adults age 18-64 | -4.7 percentage points | Gain in coverage for about 9.3M |
Most of what we know about who has health insurance and the type of coverage they have comes from large, federal population surveys, such as the National Health Interview Survey (NHIS), the Annual Social and Economic Supplement (ASEC) of the Current Population Survey, and the Survey of Income and Program Participation (SIPP). These surveys collect demographic, economic, health coverage and other information from large samples of the population, which can be used to provide fairly complete pictures of how people are distributed into different types of coverage and how this distribution changes over time. Their main advantages are their large size, sophisticated sampling, and interviewing techniques (often in person). While health insurance coverage estimates differ somewhat across the different federal surveys, in part because they each have different questions and approaches, their results are generally consistent. When available, the information from these surveys will provide the most complete and reliable descriptions of how health insurance has changed as the ACA has been implemented.
The main disadvantage of the federal surveys is that they will not have results reflecting coverage after ACA implementation for many months. An additional challenge is that several of the main surveys are using new questions or approaches to understanding health insurance coverage in order to accommodate the new coverage options under the ACA. These changes will in general improve the ability to compare insurance coverage before and after full implementation of the ACA, but methodological changes may in some cases make it challenging to discern trends across the period leading up to full ACA implementation, from 2012 to 2013.
Following are descriptions of the major federal surveys that will provide information about how coverage has changed under the ACA.
| Table 2: Availability of Post-ACA Health Insurance Coverage Data from Major Federal Surveys | ||||
| Survey | Supports State-Level Analysis? | Post-ACA Data Availability | ||
| Date Released: | Type of Data Available: | Reflects Coverage for Period: | ||
| National Health Interview Survey | Only through restricted data center and limited to 40 largest states | September 2014 | Preliminary Q1 Data | At date of interview (Jan-March 2014)* |
| December 2014 | Preliminary Q2 Data | At date of interview (Jan-June 2014)* | ||
| March 2015 | Preliminary Q3 Data | At date of interview (Jan-Sept. 2014)* | ||
| June 2015 | Main 2014 Public Use File** | At date of interview (Jan-Dec. 2014)* | ||
| Behavioral Risk Factor Surveillance System | Yes | July 2015 | Main 2014 Public Use File | At date of survey (Jan-Dec. 2014) |
| Annual Social and Economic Supplement | Yes, but for some analyses (such as insurance coverage rates) two years of data must be pooled | Spring-Summer 2015 | New coverage questions from 2014 CPS ASEC | Monthly for all of 2013 up to date of interview (Feb-April 2014) |
| September 2015 | 2015 CPS ASEC | Monthly for all of 2014 up to date of interview(Feb.-April 2015) | ||
| Survey of Income and Program Participation | Limited to 20 largest states | Spring 2016 | 2014 Panel Wave 2 | Monthly for all of 2013 and all of 2014 |
| American Community Survey | Yes | December 2015 | Main 2014 Public Use File | At date of survey (Jan-Dec. 2014) |
| * Includes some information about prior coverage.** Imputed income file may not be available for several months. | ||||
The first-available federal survey that will have health insurance information covering at least some of the ACA’s 2014 open enrollment period is the National Health Interview Survey (NHIS). The NHIS is a national household survey of civilians living outside of institutions conducted by the National Center for Health Statistics, with contractual assistance from the US Census Bureau.14 The survey collects information throughout the year on a range of health topics (including health insurance status at the time of the interview) and on the income, employment, and other personal characteristics of respondents.
While full NHIS survey results for 2014 are not expected until June 2015 (see Table 2), preliminary data and reports are made available earlier through an early release program. In recent years, early release information for interviews conducted for the first quarter (January through March) of a year have been released in September of that year, with information for the first two quarters (January through June) released in December and information from the first three quarters (January through September) released the following March. The early release data has included estimates of the percent of people in different age groups who were uninsured at the time of the interview, the percent of each group uninsured for at least part of the year prior to the interview, and the percent of each group who have been uninsured for more than a year at the time of the interview. Estimates of the percent of each age group with public or private coverage also are typically made available, along with a limited set of demographic variables that can be used to look at coverage statistics for some subpopulations. Household income information deserves caution: approximately one-quarter of respondents’ family incomes are affected by an income imputation procedure that will not be implemented until a few months after the full file release in 2015. Additionally, poverty classification is limited to six categories: Under 100% of the federal poverty level (FPL), 100 to 138% FPL, greater than 138% up to 250% FPL, greater than 250% up to 400% FPL, above 400% FPL, and unknown.15
The first quarter early release data may provide some insight into the impact of the ACA open enrollment period, but the information will understate the full effect because most of the interviews were conducted in January, February, and early March, before the surge in enrollment at the end of March (see Textbox 1). The second quarter release will be more valuable because roughly half of the interviews will have occurred after the formal close of the open enrollment periods in the federal and state Marketplaces. Although enrollment opportunities in Medicaid (and even in Marketplaces in some circumstances) continue beyond March, interviews conducted in the second quarter are more likely to reflect the substantial enrollment activity that occurred at the end of March (with some ambiguity for people whose coverage had not yet become effective at the time of their interviews). Estimates from the early release data should be comparable to estimates from prior years, allowing for analysis of the change in the percentage of people uninsured as of the end of open enrollment. This will be the first available federal survey allowing for assessment of overall growth in the non-group market and also changes in employer coverage. Although the preliminary quarterly files cannot be used to distinguish Medicare and military coverage from other government insurance sources, if restricted to the non-elderly, changes in public coverage should largely reflect changes in Medicaid and CHIP.
If the release schedule follows that of the past, the full data release for the 2014 NHIS should occur mid-summer in 2015, but full income information may not be available for several more months. The survey will provide estimates of coverage for both major public programs and private sources at the time of their interview. New questions ask whether coverage was obtained through healthcare.gov or a state exchange and whether the premium for that coverage is based on family income. People without health insurance are asked how long it has been since they last had coverage and why they lost their previous coverage. The main 2014 NHIS release will provide the first reasonably complete look at the first-year coverage effects of the ACA, although all of the first-quarter interviews will have been completed prior to the end of the open enrollment period. Since “month of interview” is included in the public release, earlier interviews can be examined separately or discarded, depending on the analysis aim. This survey is large enough to support analysis of subgroups, although analyses involving income will need to wait until the full income information is released later in 2015. The survey’s sample size is sufficient to support analysis of some of the larger states, but accessing these variables requires application to a Research Data Center. While insurance coverage is estimated at the point of the interview in the NHIS, a series of insurance transition questions will allow an assessment of whether people who report coverage through healthcare.gov or a state exchange were previously uninsured. Insurance coverage question wording remained consistent enough that annual trends across the 2013-2014 period, and to previous years, should be valid.
The Behavioral Risk Factor Surveillance System (BRFSS) is a nationwide telephone survey conducted by state health departments with assistance from the Centers for Disease Control and Prevention (CDC) to monitor health behavior and identify emerging health problems.16 Data are collected monthly in all states and some territories; over 400,000 interviews were conducted in 2012. While the survey focuses on health behavior, it also collects limited information on whether or not respondents have health insurance at the time of the interview. The survey does not collect information on the type of insurance that respondents have, so it is not a source of data for changes across types of coverage.17
While BRFSS has not historically been viewed as an authoritative source of information about coverage, its recent national estimates of people without coverage have tracked reasonably well to Census data. In 2011 and 2012, the BRFSS found that 21.3 and 20.4 of 18-64 year olds lacked insurance coverage compared to rates of 21.2 and 21.0 from the CPS ASEC over the same period.18 Data from BRFSS for 2014 are expected to be released in mid-2015 and should be a source of information about whether the number of people without coverage declined. BRFSS is designed to support state estimates, and with its large sample size, will be the first available information about changes in the number of adults with coverage at the state level.
Another large survey that is often a source of health coverage estimates is Annual Social and Economic Supplement (ASEC) to the Current Population Survey (often referred to as the “CPS”), which provides socioeconomic and demographic information, including health coverage status, for the non-institutionalized U.S. population. The CPS ASEC interviews over 85,000 households each year during the months of February, March or April, with findings and data released in September of the same year. The CPS ASEC is the most widely-used source for counts of the uninsured because it is timely, supports both national and state-level estimates, and provides detailed information on insurance coverage, income, employment, and other personal characteristics. The health coverage questions on the CPS ASEC have historically asked respondents whether they had coverage in the previous year, the source of that coverage (e.g., through an employer, a public program, or purchased directly), and whether individuals are covered in their own name or as a dependent on someone else’s policy. Although widely used, the Census Bureau acknowledges that health coverage is underreported in the survey. Technically, the CPS ASEC asks about coverage in the previous calendar year from the date of the interview, and the number of uninsured reported through the CPS ASEC represents those who were uninsured for all of the previous year. However, researchers believe that many people may instead report their coverage status at the time of the interview rather than for the previous year.19
Changes to the 2014 CPS ASEC survey (which will reflect data for 2013) should greatly reduce this confusion and provide much better information about health coverage. However, this improvement will both cause a one-time delay of the release of the full survey results and create a break in the trend of health insurance questions from the 2013 CPS ASEC (which reflects data for calendar year 2012). Previously, respondents were asked, for each major type of health insurance, whether or not they were covered at any time during the previous year by that type of coverage. Respondents who said no for each coverage type were subsequently asked to verify that they were not covered by any type of insurance. Starting with the 2014 survey, the survey asks respondents about their coverage at the time of the interview (February, March or April of 2014) and then asks additional questions about coverage in each month from the date of the interview back to January of 2013. This approach should provide clearer information about the type of coverage people have at each point in time and new information about how people’s coverage changes over the course of a year. In addition, the survey asks specifically about enrollment through Marketplaces and whether the premium for the coverage is subsidized based on family income. Other new questions ask respondents who are working but do not report having employment-based coverage whether their employer offers health insurance, whether they are eligible, and why they did not enroll.
Because of these and other changes to the survey20 , the 2014 CPS ASEC results will be released in three stages. The Fall 2014 release will report on coverage in 2013 and provide information similar to prior releases, looking at whether or not respondents had a type of coverage in 2013 or had no coverage. Information from the new questions, including coverage at the time of the interview and information about coverage in each month in 2013, will be released sometime in 2015, after the Census Bureau has time to analyze the results but before the complete 2015 CPS ASEC release in September of 2015. When available, the information from these new questions will allow analysis of how coverage during the first few months of 2014 compared to coverage by month in 2013, including providing estimates of those newly insured and those changing the type of coverage that they have. The survey is large enough to support some analyses at the state-level and by other subgroups like income category.
There will be some reasons for caution, however. Because many of the interviews will have been conducted before the formal open enrollment period ended on March 31, the survey will not capture the full effect of open enrollment. Further, it is unclear how people who were in the process of signing up for coverage at the time of the interview will answer the coverage question. For example, will people who have picked a plan but where coverage is effective the following month say that they were covered by the plan or say that they were uninsured at the time of the interview? Also, given the new question format, reported enrollment patterns may differ from those that we have previously seen from this survey. It is also unclear how consistent respondents will be in reporting coverage at the time of the interview versus recalling how they were covered in each month of the previous year.
The 2015 CPS ASEC should be released in the Fall of 2015 and will have coverage information at the point of the interview (February, March and April) in 2015 and for each month of 2013 and 2014. This release will provide a current insurance estimate following the close of the 2015 open enrollment period (November 15, 2014 through February 15, 2015) as well as monthly coverage estimates for the entire 2014 calendar year. If the Census Bureau does not make additional changes to the questionnaire, the health insurance categories should trend cleanly across the 2014 and 2015 CPS ASEC data sets, providing information on how people were covered before and after implementation of the ACA.
One aspect that will be missing from the CPS ASEC (and which will be supplied by SIPP, discussed below), will be the ability to fully tie coverage in 2014 to coverage status in the previous year for a given individual. While the 2015 CPS ASEC will have information about coverage changes throughout 2014, information on respondents’ coverage status in 2013 will not be available. Thus, for many who gained coverage in 2014, we will be unable to ascertain whether they are newly-insured or whether they switched their coverage type. While the 2014 CPS ASEC will allow us to connect coverage in 2013 to the first few months of 2014, many people in the survey will have been interviewed prior to the close of open enrollment (March 31, 2014); thus, it will be difficult to measure the immediate effect of the availability of coverage in January 2014.
In general, the change in the health insurance questions in the CPS ASEC will allow for fuller and more precise estimates of the effect of the ACA. At the same time, because of the timing of the changes to the CPS ASEC, there will be no way to compare coverage at the time of interviews in 2014 to any previous year and no way to look at trends leading up to the first year of new coverage options under the ACA.
The Survey of Income and Program Participation (SIPP) is another federal survey often used for coverage estimates. SIPP is a panel survey that follows a sample of households over a period of years. For previous panels, respondents were interviewed three times each year for several years (the panels vary in duration). SIPP collects detailed health coverage, income, employment and demographic information, including health coverage, on a monthly basis, which can be used to analyze changes in circumstances for people and families with different types of coverage. The SIPP 2008 Panel started with more than 40,000 eligible households and ended in 2013.
The approach for the SIPP 2014 Panel has been revised so that households are contacted just once annually to collect information about the previous year and the current year up to the time of the interview. Specifically, respondents are being contacted between February and May of 2014 to collect monthly information, including health coverage, for the interview month and for the previous months all the way back to January of 2013. The initial release (the first wave) of the 2014 SIPP Panel will have monthly information for entire 2013 calendar year and will be released in the Spring of 2015. This release is not expected to include any information about coverage in 2014. Interviews for the SIPP 2014 Panel’s second wave should begin early in 2015 and collect monthly information from the same panel of households for each month during the 2014 calendar year. Data for this second wave should be released by the Spring of 2016, and with this release, it will be possible to analyze monthly coverage information for panel households from January of 2013 through December of 2014, which is the year prior to the first open enrollment period and the first year under the new coverage provisions. These data should provide a comprehensive picture of how coverage changed during the first full year of implementation. SIPP is large enough to support analysis of about half of all states and many other subgroups. The Census Bureau expects to release the third wave of this panel by early 2017 – about one year after the second wave – allowing for detailed exploration of coverage dynamics over the period of January of 2013 through December 2015.
Although there is high demand to know the immediate coverage impacts of the ACA, it is likely that the ultimate coverage changes will play out over a longer period of time as people become more familiar with new options for coverage and as employers revise their plans to accommodate new responsibilities and coverage alternatives. Over time, SIPP will likely be the best source of information to analyze those dynamics nationally, though its limited ability to permit analysis at the state level may restrict its usefulness given how much of the ACA is implemented as the state level.
Another federal survey that has information on health insurance is the American Community Survey (ACS). This survey originated as a replacement for the long-form of the US Decennial Census and is distributed to one percent of the entire United States population every year. It’s very large sample size allows for coverage estimates for very small geographic areas. However, because it has fewer health insurance questions and collects less information than other survey on family income and structure, it has limited usefulness for national estimates of health insurance coverage. Comparing the 2012 ACS to the 2012 CPS, the two surveys find the nationwide uninsured rate to be about half a percentage point apart (14.8 and 15.4, respectively).
Though it has been in existence since as far back as 1996, the modern ACS only began asking a series of health insurance questions in 2008. While the Census Bureau expects to test new questions collecting ACA Marketplace-related information in the future, there is not currently any timeframe for making changes to the instrument; the health insurance questions currently in the field for the 2014 survey have the exact same structure as they’ve had since 2008. The Census Bureau generally releases the single-year file about two years after the completion of data collection, so the single-year 2013 ACS should be released in December of 2014 and the single-year 2014 ACS should be released in December of 2015.
The ACA includes provisions to address cost, quality, and access of health insurance coverage, and the expansion of health coverage to more Americans is a core goal of the law. Thus, a key measure of success of the ACA is whether the number of uninsured Americans drops. While that outcome seems like a relatively straightforward metric, it will in fact be surprisingly difficult to evaluate.
Early results from polls and surveys by private organizations – Gallup, the Urban Institute, and RAND – show clearly that the number of people uninsured nationally is falling as the ACA goes fully into effect. However, these polls are limited in their ability to precisely estimate the magnitude of the change and discern shifts among different types of coverage. They generally lack the sample size of large, federal surveys and therefore have substantial margins of error and generally do not support state-level analysis. And they are not able to collect as much detailed information on health insurance coverage of demographic groups as the significantly more resource-intensive surveys that often use in-person interviews.
Federal surveys also have their limitations, and in many cases these data sources will not be available for quite some time. For example, the CPS ASEC survey – the most widely-cited source for tabulations of the uninsured – is in the field February, March, and April and has historically asked respondents if they were uninsured for all of the entire previous year. However, researchers have long believed that many people respond to the CPS ASEC based on their insurance status at a point in time instead. The 2014 survey was changed to make the questions more precise, asking about insurance in the previous year as well as at the time of the interview. This will allow for a much better assessment of the effects of the ACA – permitting a comparison of the number of uninsured in 2013 vs. 2014 – but the initial release of this data will not be available until Spring of 2015. And because many of the interviews were completed while open enrollment was still in process, the 2014 survey will not reflect the surge of enrollment in late March.
Other federal survey data that can be used to evaluate the effects of the ACA will be available earlier. First quarter early release results from the NHIS should be available by September of 2014, though it too will not fully reflect the open enrollment period. NHIS results from the first half of 2014 (expected in December) will allow for a fuller assessment of coverage obtained during open enrollment, but even that will not account for Medicaid signups that can occur throughout the year.
A more complete picture of coverage under the ACA will start to emerge in June 2015, when NHIS insurance coverage data for all of 2013 and 2014 will be available. In September 2015 CPS ASEC coverage data for 2013, 2014, and early 2015 will be released (including information by state). By the end of 2015, ACS data will be released, allowing for coverage comparisons with larger sample sizes at the state level. And, by Spring of 2016, SIPP data for 2013 and 2014 will become available, which will permit tracking of coverage changes for the same individuals over time.
A complete understanding of the first year of full ACA implementation will require triangulating across many data sources. Private polls will provide the earliest look at overall coverage changes, but data from larger and more comprehensive federal surveys – which in many cases will not be available until well into 2015 — will be needed to precisely estimate the change in the number of uninsured, shifts across different types of coverage, the demographics of those who have signed up and those who remain uninsured, and trends by state. Even then, it will be difficult to sort out which changes in insurance coverage are due to the ACA and which would have occurred regardless amidst an improving economy. Just as the coverage changes under the ACA will take several years to fully roll out, it will also take time to capture the full effect of the law. In the meantime, efforts to quantify the impact of coverage expansions on individuals will be key to gauging the law’s success.
On Thursday, May 15 at 9:30 a.m. ET, the Kaiser Family Foundation will host a public briefing to release a new report based on the Foundation’s most recent comprehensive survey on women’s health. This report provides new findings that will be critical to understanding women’s early experiences with the coverage changes that are part of the Affordable Care Act, including the latest information on:
The key findings from the new survey will be presented by Usha Ranji, the Foundation’s Associate Director for Women’s Health Policy, which will be followed by a panel discussion on the ACA and challenges in improving women’s health and access to care that will be moderated by Alina Salganicoff, Ph.D, Kaiser Family Foundation Vice President and Director of Women’s Health Policy.
Discussants include:
Amy Allina, Deputy Director, National Women’s Health Network and Co-Founder, Raising Women’s VoicesVanessa Cullins, MD, MPH, MBA, Vice President, External Medical Affairs, Planned Parenthood Federation of AmericaFrancisco Garcia, MD, MPH, Director and Chief Medical Officer, Pima County Health Department, Arizona.Cara James, Ph.D, Director, Office of Minority Health, Centers for Medicare and Medicaid Services
When:
Thursday, May 15, 20149:30 a.m. -11:00 a.m. ET
(Registration and breakfast begins at 9 a.m. ET)
Where:
Barbara Jordan Conference CenterKaiser Family Foundation Offices1330 G Street, NWWashington, D.C.(one block west of Metro Center)
View the archived webcast of this briefing
KFF: for trusted information on the health issues facing the nation and its people. The Kaiser Family Foundation is a nonprofit organization based in Menlo Park, California.
Most Common Reason for Remaining Uninsured is Not Being Able to Find an Affordable Plan; Just 7 Percent Would Rather Pay a Fine than Pay for Coverage
As the Supreme Court Considers Challenge, a Majority Supports the Law’s Requirements for Contraceptive Coverage, Including for Employers with Religious Objections
Despite the news that 8 million people have signed up for health insurance through the ACAâs new marketplace, the April Kaiser Health Tracking Poll finds no change over the past month in the public’s view of the law, with 46 percent of the public saying they have an unfavorable view and 38 percent a favorable view.
At the same time, nearly six in ten (58%) say they want their representative in Congress to work to improve the law, compared to just over a third (35%) who want them to work on repealing it and replacing it with something else. While there are clear partisan divisions on this question, about three in ten Republicans agree with the majority, preferring that Congress work to improve the law.
In spite of the late surge that pushed marketplace enrollment above the Congressional Budget Office’s initial projections, nearly six in ten people (57%) say that the number of people signing up for coverage fell short of the governmentâs expectations. The same share (57%) also says âthere have been so many problems since the lawâs rollout that itâs clear the law is not working as planned.â As expected, Republicans are far more likely to say the law is still not working than Democrats, with independents in the middle. Among Democrats, though, about a third believes the law is still not working.
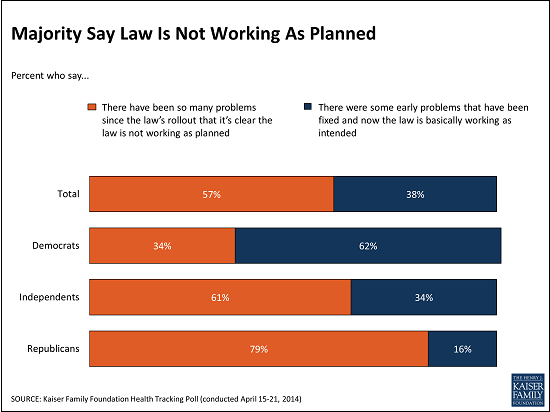
The poll also asked people who remain uninsured to choose the main reason they havenât gotten coverage this year after being told or reminded of the lawâs requirement for individuals to get coverage or pay a fine. More than a third (36%) say they tried to get coverage but it was too expensive. Smaller shares say they donât think the requirement applies to them personally (14%), they didnât know about the lawâs requirement to get coverage (13%), and they tried to get coverage but were unable (12%). Few (7%) say they would rather pay the fine than buy insurance.
With the Supreme Court weighing challenges to the ACAâs requirement that private health plans cover prescription birth control without cost-sharing, the latest Kaiser Health Tracking Poll finds that, in general, the public supports the requirement by a nearly 2-to-1 margin (61% support, 32% oppose). Women, younger adults, Democrats and independents are the groups most likely to support the requirement, while seniors are split and a majority of Republicans are opposed.
Asked more specifically about for-profit companies whose owners have religious objections to birth control, a majority (55%) feels these companies should still be required to cover birth control. This includes nearly three quarters of Democrats, a majority of independents and a third of Republicans.
This monthâs Kaiser Health Policy News Index finds that just over half the public (53%) says they closely followed news coverage of the ACA enrollment numbers, and more than four in ten (44%) report closely following the Supreme Court contraceptive coverage case.
The survey was designed and analyzed by public opinion researchers at the Kaiser Family Foundation and was conducted from April 15-21 among a nationally representative random digit dial telephone sample of 1,504 adults ages 18 and older. Telephone interviews conducted by landline (750) and cell phone (754) were carried out in English and Spanish. The margin of sampling error for the full sample is plus or minus 3 percentage points. For results based on subgroups, the margin of sampling error may be higher.
A new Kaiser Family Foundation brief explores the U.S. government’s efforts to address the health and human rights of lesbian, gay, bisexual and transgender (LGBT) individuals around the world. LGBT individuals continue to face stigma, discrimination, and violence, both within and outside of the health sector, and in many countries â” including those in which the U.S. provides global health assistance â” these barriers include discriminatory laws and policies. Recent actions by several countries to further criminalize LGBT individuals have raised the stakes in the conversation and introduced a greater sense of urgency, yet many questions and challenges remain about the best way forward.
The U.S. Government and Global LGBT Health: Opportunities and Challenges in the Current Era summarizes two roundtable discussions convened by the Foundation, which identified opportunities, challenges, and potential next steps for the U.S. government to consider on LGBT health. It also provides an overview of global LGBT health issues, and reviews U.S. government efforts to address global LGBT health to date.
Filling the need for trusted information on national health issues, the Kaiser Family Foundation is a nonprofit organization based in Menlo Park, California.