Data Note: Balancing on Shaky Ground: Women, Work and Family Health

Published: Oct 20, 2014

Women now comprise nearly half of the nation’s workers, and 70% of mothers with children under age 18 are in the labor force.1  In September 2014, the U.S. Census Bureau released national statistics on poverty and income, reporting that 16% of women live below the poverty line and that median earnings for women are only 78% of men’s earnings, a gap that has persisted for several years.2  Policy makers across the political spectrum have forwarded proposals to shore up economic security for “working families.”3 ,4 ,5  Much of the national discussion has focused on policies related to income, such as minimum wage, tax credits, salary transparency, job training, and the wage gap, all of which are important issues for women. For many working women, economic security also encompasses health issues, including workplace benefits such as insurance coverage, paid sick leave, and paid family leave.

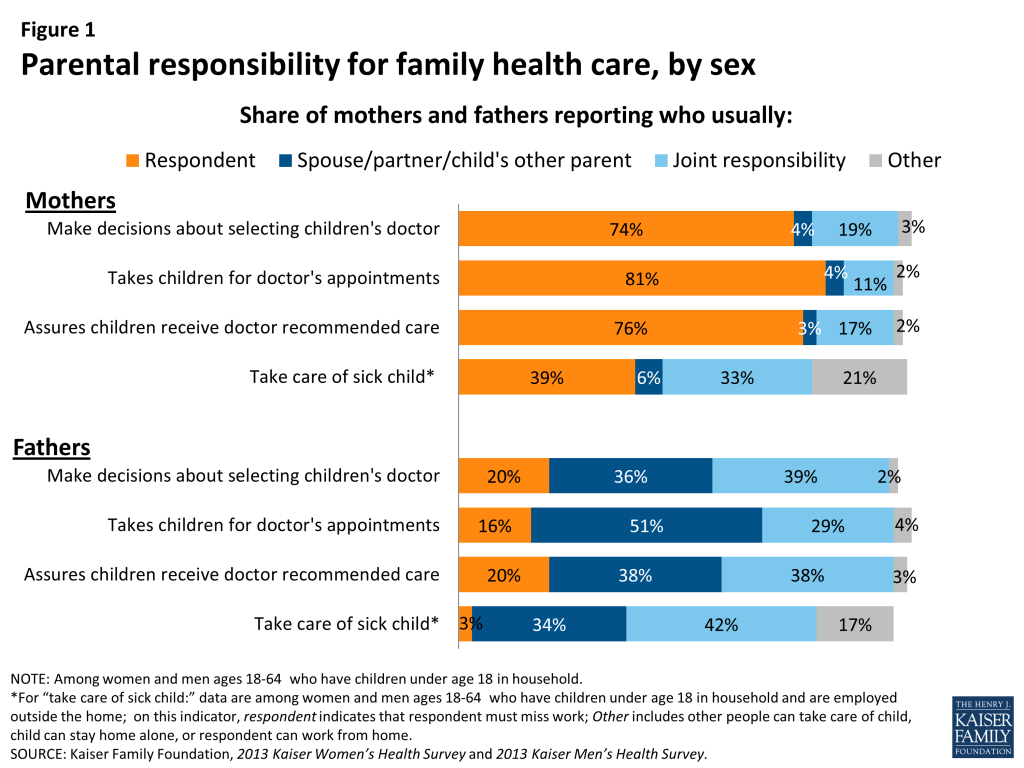
In most households, women are the managers of their families’ health, as illustrated clearly in Figure 1, which is based on data from a recent national Kaiser survey of women and men about their health care experiences. Among mothers, about three-quarters report that they are the ones who take charge of health care responsibilities such as choosing their children’s provider, taking them to appointments, and following through with recommended care, compared to approximately a fifth of fathers.

Figure 1: Parental responsibility for family health care, by sex

This gender difference extends to working parents as well. Four in ten working mothers (39%) must take time off and stay home when their children are sick, over ten times the share of men (3%). Fathers also agree that moms are the leaders of children’s health care needs, though a substantial share of both mothers and fathers say they share responsibility for these tasks.

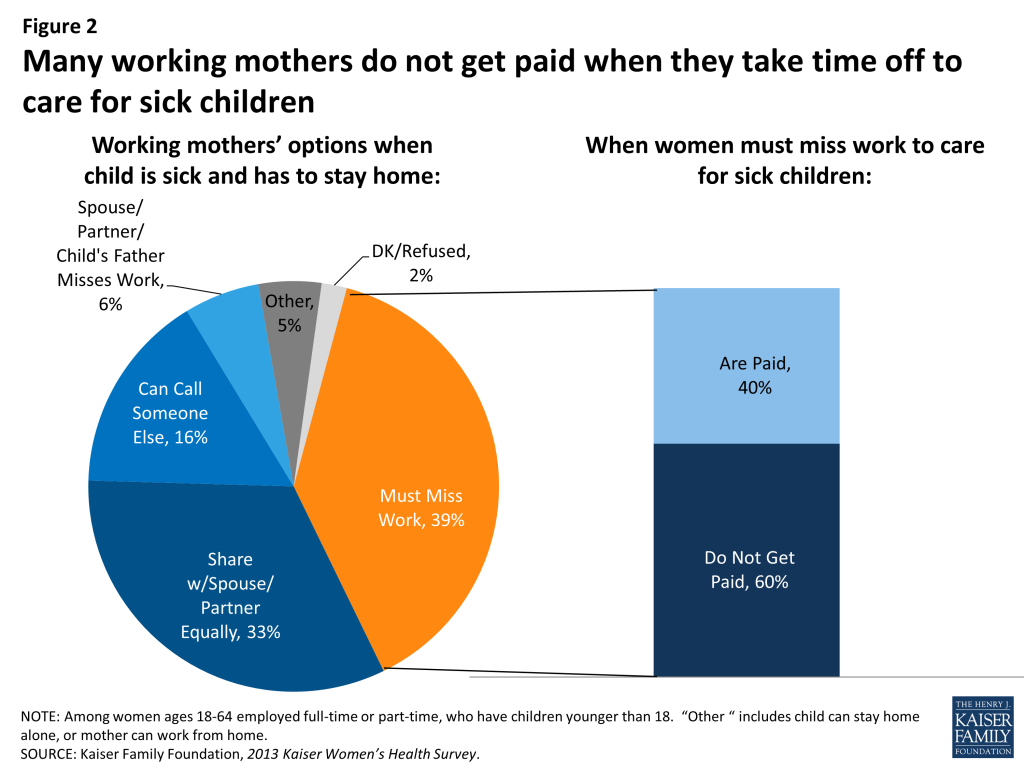
Caring for children’s health has tangible economic consequences, especially for women. Among the mothers who do not have other child care options and must miss work when their children are sick, 60% are not paid for that time off (Figure 2), up significantly from 45% in 2004.6  When two-thirds of school aged children nationally miss at least one school day during the year because of illness or injury, and nearly one-fifth miss more than a week, this is a common occurrence.7 

Figure 2: Many working mothers do not get paid when they take time off to care for sick children

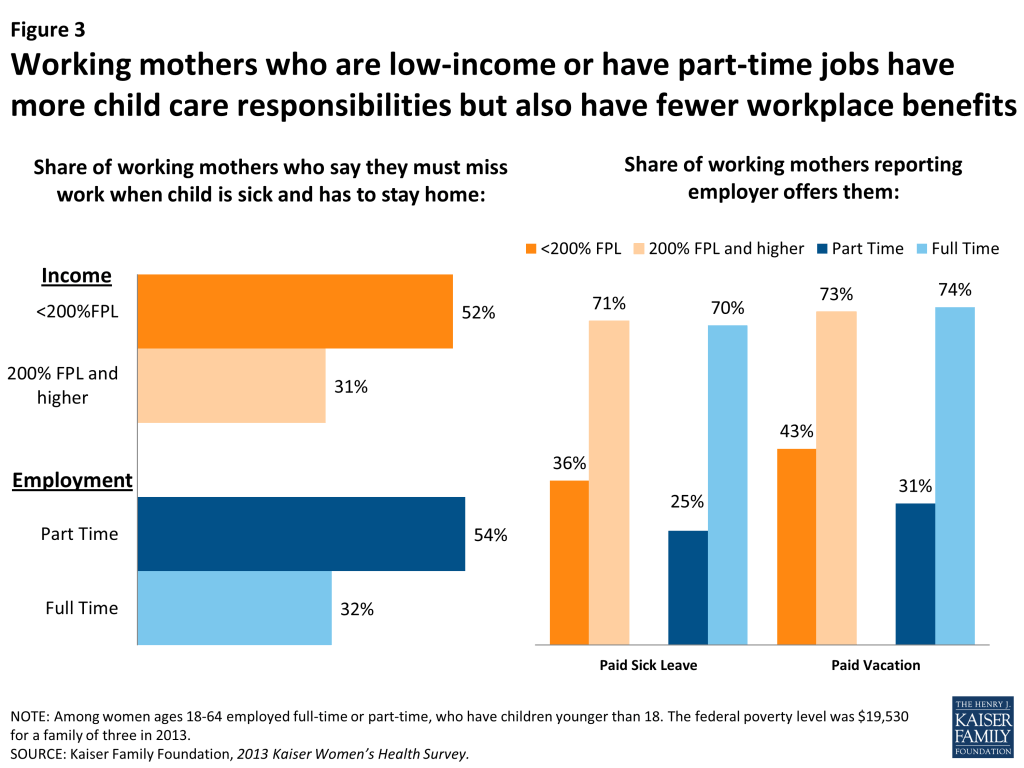
Workplace benefits are an important part of the story. So called “fringe benefits” such as paid leave and health insurance can help employees meet their personal and family health care needs while also fulfilling their work responsibilities. About six in ten working moms report that they are offered paid sick leave (56%) and paid vacation (61%).8  For mothers on the lower end of the economic scale and those in part-time jobs, the need for these supports is even greater. More than half must take time off when their children are sick, compared to about a third of their higher income and full-time counterparts, who are more likely to have others to help with childcare (as well as have money to pay for sitter services). Yet, there is a large disparity in workplace benefits, with offer rates of paid sick leave and paid vacation significantly lower among mothers who are low-income or part-time employees (Figure 3).

Figure 3: Working mothers who are low-income or have part-time jobs have more child care responsibilities but also have fewer workplace benefits

A public policy response that addresses women’s economic security and “balance” with health, family, and work issues has been elusive. Nationally, the landmark Family and Medical Leave Act (FMLA) that gives eligible employees up to 12 weeks of unpaid leave to care for seriously ill family members, the arrival of a child, and job protection when an employee returns from family or medical leave has been in place for more than 20 years. As a result of the law’s protections, millions of workers have benefited from job security while caring for loved ones. Despite the important safeguards the law provides, many working women simply cannot afford to take extended leave without pay.

There have been a number of efforts to build upon the FMLA and enact national paid leave policy; however, they have largely stalled in a polarized Congress. Proponents urge that paid leave would provide employees with greater financial security when they must take an extended leave for medical reasons or to care for an ailing family member or new child.9  Opponents cite concerns about the impact of new federal requirements on local government and employers as well as the financial implications a new benefit would have on wages and employment.10  Most of the policy action has been at the state and local levels. Three states (California, New Jersey, and Rhode Island)11  have enacted laws offering eligible employees partial paid family leave.12  In addition to paid family leave, the last few years have seen some momentum at the local level for paid sick days. Since it was first passed by voter initiative in 2006 in San Francisco, several more cities across the nation as well as two states (Connecticut and California), have enacted some form of paid sick days, which enables women to get paid time off when they or their children get a minor illness and need to stay home for short periods. Paid sick days allow workers to take time off for medical appointments or to address a health condition for themselves or a family member without losing pay. Several of these laws also specifically allow workers to use paid sick days for reasons related to sexual assault or domestic violence.

Women have always been the primary caregivers for their family’s health needs, be it for their children, parents, or other family members. Despite the consistent rise in the share of women participating in the workforce, there has been relatively little policy response to the often dueling responsibilities that women have to their families and to their jobs. For many women, missing work when their children have a cold or upset stomach has a cost. The price is especially high for low-income working mothers, who have fewer childcare and financial resources, and often limited workplace benefits. For these women, who must balance workplace and family health responsibilities with the fewest supports, the current system leaves them on shaky ground.

  1. U.S. Department of Labor, Bureau of Labor Statistics, Women of Working Age, 2013. ↩︎
  2. U.S. Census Bureau, Income and Poverty in the U.S., 2013. Wage gap data represents the dollar earnings ratio between women and men who are full time, year round workers. ↩︎
  3. Office of U.S. Senator Mike Lee, Family Fairness and Opportunity Tax Reform, accessed October 5, 2014; Lee M. and M. Rubio, A Pro-Family, Pro-Growth Tax Reform, Wall Street Journal, September 22, 2014. ↩︎
  4. White House Summit on Working Families, 2014. ↩︎
  5. Office of U.S. Senator Deb Fischer, Fischer, Collins, Ayotte, Murkowski Offer Amendment to Help Address Gender Pay Discrimination, 2014. ↩︎
  6. Kaiser Family Foundation, Women and Health Care: A National Profile, 2005. ↩︎
  7. Agency for Healthcare Research and Quality (AHRQ), National Quality Measures Clearinghouse, Missed School Days, 2013. ↩︎
  8. Kaiser Family Foundation, 2013 Kaiser Women’s Health Survey. ↩︎
  9. National Partnership for Women and Families, The Family and Medical Insurance Leave Act, February 2014. ↩︎
  10. The National Coalition to Protect Family Leave, Paid Leave, accessed October 13, 2014. ↩︎
  11. The state of Washington has also passed a law providing paid leave to care for the arrival of a child, but it has not yet been implemented and there is no projected date for implementation. ↩︎
  12. National Partnership for Women and Families, State Paid Family Leave Insurance Laws, October 2013.       ↩︎
News Release

Few Americans Expect a Widespread Ebola Outbreak Here, But Some Are Worried They or a Family Member May Become Infected, New Poll Finds

Published: Oct 16, 2014

Democrats, Republicans and Independents All Support Major U.S. Role Fighting Ebola in West Africa, About Equally, to Protect Americans and to Save Lives

As the nation grapples with its first cases of Ebola transmitted in the U.S., a new Kaiser Family Foundation Tracking Poll finds that personal worry about Ebola is reasonably high, with 45% of the public saying they are worried that they or a family member will contract the disease. But most Americans (73%) say it is more likely that Ebola will be contained to a small number of cases in the U.S., compared to two in ten (22%) who say it is more likely there will be a widespread outbreak.

The survey, which was fielded after a Liberian man was diagnosed with Ebola in Dallas, and remained in the field after a nurse who helped care for him contracted the disease, finds most Americans say they trust local, state, and federal health authorities to contain the disease.

About three-quarters (73%) of the public say that if there were an Ebola case in their area, they would have “a great deal” or “a fair amount” of confidence in the U.S. Centers for Disease Control and Prevention (CDC) to contain Ebola and prevent its spread.  Somewhat smaller shares say they have at least a fair amount of confidence in their local hospitals (64%) and in their state or local health department (62%).

Surveys usually find differences between Democrats and Republicans on measures of confidence in government, but these differences are less pronounced in this case. Democrats are somewhat more likely than Republicans and independents to express at least “a fair amount” of confidence in the CDC to prevent Ebola from spreading, although roughly seven in ten Republicans and independents report confidence as well. Confidence in local hospitals and health departments is similar across Republicans, Democrats, and independents.

The public is divided about whether the U.S. government is doing enough to fight Ebola in the U.S, with almost half (48%) saying the government IS doing enough, and a similar share (44%) saying the government is NOT doing enough. Republicans (56%), women (49%), and those with less than a college degree (47%) are more likely to say that the U.S. government is NOT doing enough.

U.S. Role Fighting the Epidemic in West Africa

When asked about the Ebola epidemic in West Africa, nearly two thirds of the public (65%) say the U.S. should play at least a major role in addressing it.  This includes some (16%) who says the U.S. should play the leading role. The share who says the U.S. should take at least a major role in Africa is similar among Republicans (67%), independents (63%), and Democrats (71 %).

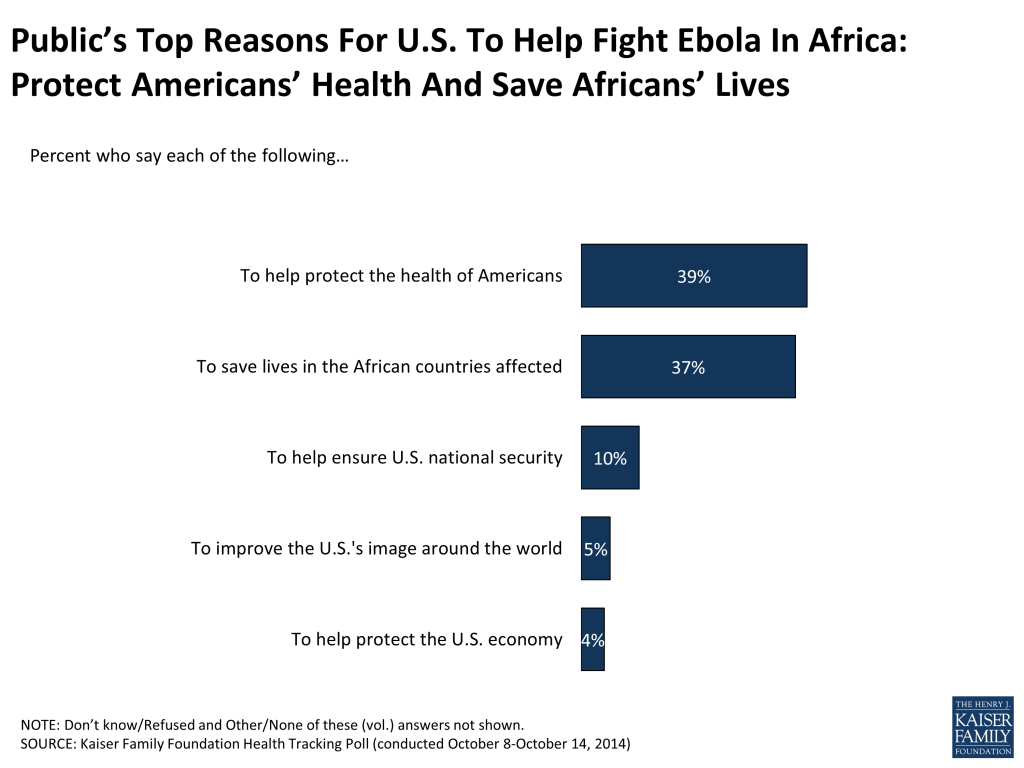
When asked the MOST important reason for the U.S. to contribute to these efforts, the top two are to protect the health of Americans (39%) and to save lives in the African countries affected (37%). Much smaller shares say the most important reason is to help ensure U.S. national security (10%), to improve the U.S. image around the world (5%), or to help protect the U.S. economy (4%).

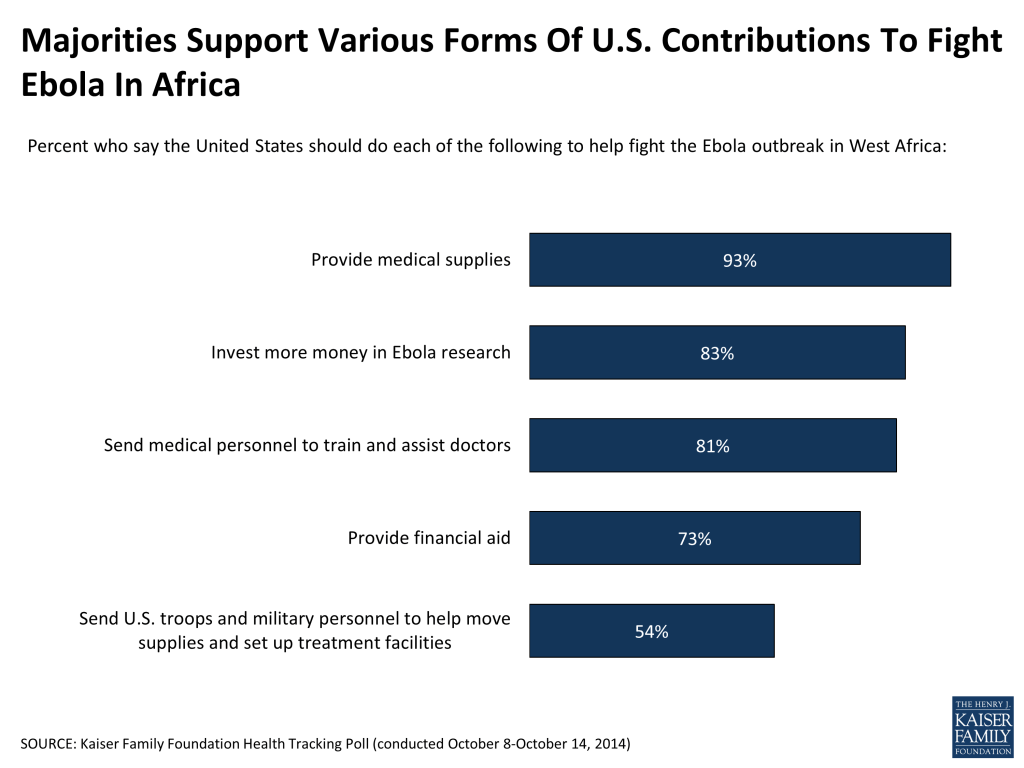
The main way the public thinks the U.S. should help in West Africa is by providing medical supplies (93%), followed by investing more money in Ebola research (83%), sending medical personnel to train and assist doctors (81%), and providing financial aid (73%). Fewer, but still a majority, think that the United States should send troops and military personnel to help move supplies and set up treatment facilities (54%), which the U.S is already doing.

Public’s Knowledge about Ebola Transmission

Overall, about seven in ten (69%) say they followed news about the diagnosis of the first Ebola case in the U.S. “very” or “fairly” closely, according to the Kaiser Health News Index, a monthly look at the health policy issues the public is following in news, as well as their knowledge and views about those issues. Nearly as many report closely following the outbreak in West Africa (63%, similar to 62% last month). This makes the Ebola outbreak one of the most closely followed news stories of the year, comparable to the initial interest in the missing Malaysian airline flight and the protests in Ferguson, Missouri following the fatal police shooting of an unarmed black teenager.

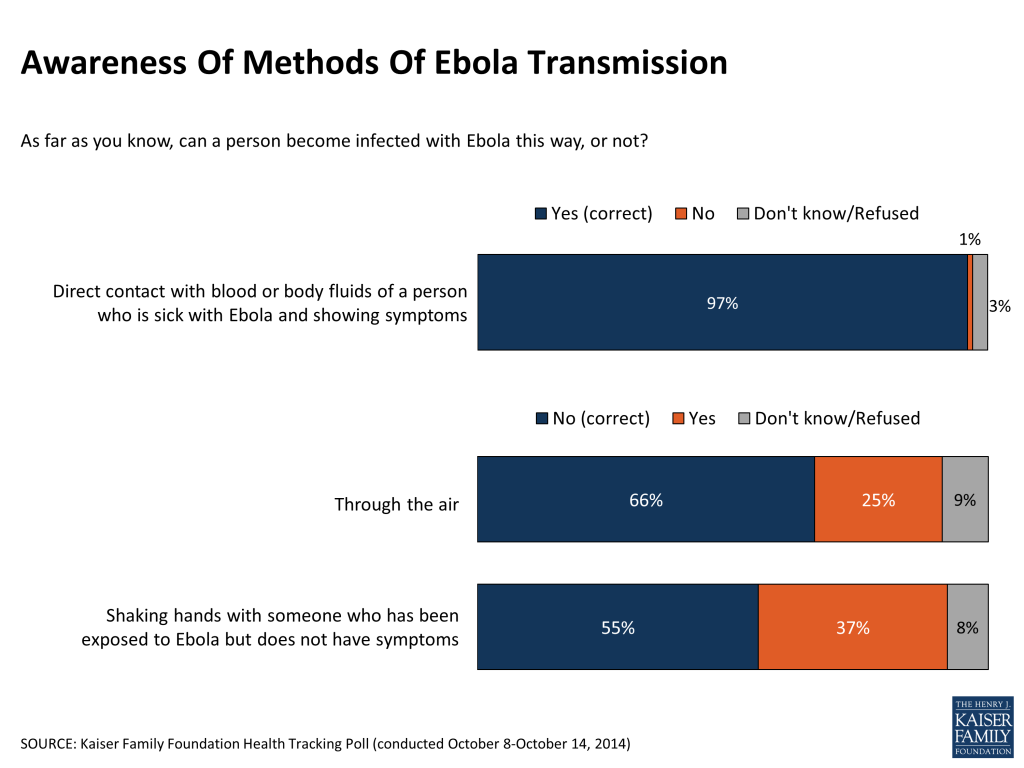
The survey finds almost all adults (97%) know that a person can become infected with Ebola through direct contact with the blood or body fluids of a person who is sick with Ebola and showing symptoms. Majorities are also aware that a person cannot become infected through the air (66%) or by shaking hands with someone who has been exposed to Ebola but does not have symptoms (55%), although substantial shares either mistakenly believe Ebola can be transmitted in these ways or say they do not know.

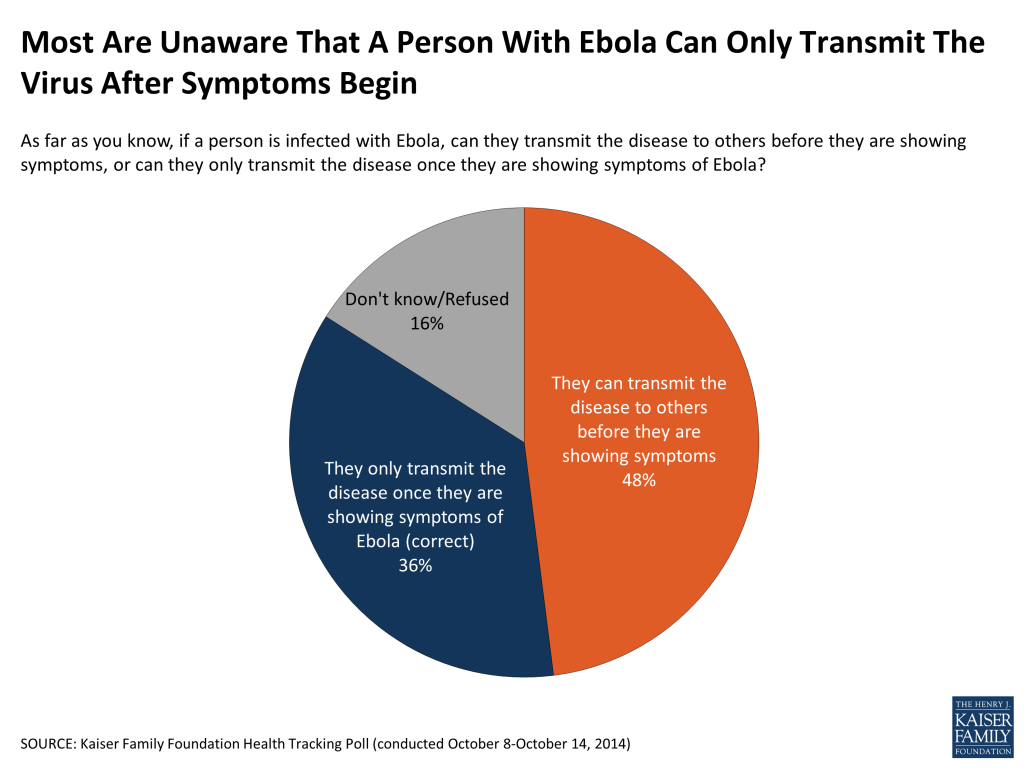
However, fewer than four in ten (36%) know that a person must be showing Ebola symptoms to transmit the infection, while nearly half (48%) incorrectly believe that a person can transmit the disease before they are showing symptoms.

Methodology

The latest tracking poll was designed and analyzed by public opinion researchers at the Kaiser Family Foundation and was conducted from October 8-14, 2014 among a nationally representative random digit dial telephone sample of 1,503 adults ages 18 and older. Interviews were conducted in English and Spanish by landline (751) and cell phone (752). The margin of sampling error is plus or minus 3 percentage points for the full sample. For results based on subgroups, the margin of sampling error may be higher.

Poll Finding

Kaiser Health Policy News Index: Special Focus On Ebola

Authors: Liz Hamel, Jamie Firth, and Mollyann Brodie
Published: Oct 16, 2014

With the Ebola outbreak in West Africa and individual cases in the U.S. and Europe making international headlines, the latest Kaiser Health Policy News Index examines Americans’ attention to the Ebola crisis, awareness of key facts about the disease, and views of the U.S. role in addressing Ebola in Africa and at home. Fielded October 8-14, during which time a nurse in Dallas became the second patient diagnosed with Ebola in the U.S.1 , the survey finds that Ebola tops the list of news stories followed by the public this month, with U.S. airstrikes against Islamic militants the only other story garnering similar levels of attention. While the vast majority of the public knows the basics of how the virus is transmitted –  through direct contact with the bodily fluids of someone who is sick with Ebola – fewer are aware that a person with Ebola must be showing symptoms in order to be contagious. Nearly two-thirds say they are at least somewhat worried the U.S. will see a large number of Ebola cases, and about four in ten are worried that they or a family member will contract the disease. Still, a majority believes the most likely scenario is that Ebola will be contained to a small number of cases in the U.S., and most trust their local, state, and federal health authorities to prevent Ebola’s spread. Most Americans – including majorities of Republicans, Democrats, and Independents – think the U.S. should play a major role in addressing the Ebola outbreak in Africa. Majorities support the U.S. providing financial aid, medical supplies and personnel, and fewer but still a majority support sending troops and military personnel to fight Ebola in Africa, with the public’s top two reasons for providing such support being to protect the health of Americans and to save lives in the African countries affected. The public is divided about whether the U.S. government is doing enough to fight Ebola abroad and at home.

Attention To News

News coverage of Ebola in Africa and the U.S. topped the list of closely-followed news stories this month. Seven in ten (69 percent) say they followed news about the diagnosis of the first Ebola case in the U.S. “very” or “fairly” closely, and nearly as many report closely following the Ebola outbreak in West Africa (63 percent, similar to 62 percent last month). Close attention is somewhat heightened on the home front, with a larger share saying they followed the first U.S. Ebola case “very” closely (32 percent) compared with the outbreak in West Africa (24 percent).

Figure 1

Attention to Ebola at home and abroad was similar to the share who report following the U.S. airstrikes on Islamic militants in Iraq and Syria (68 percent report following “very” or “somewhat” closely). Other non-health news stories captured the attention of large shares of the public this month, including cases of alleged domestic violence by NFL football players (57 percent), an intruder who jumped the fence and entered the White House (53 percent), and the Supreme Court’s decision not to review same-sex marriage cases from 5 states, effectively legalizing such marriages in those states (48 percent).

Besides Ebola, other domestic health policy news stories were followed by much smaller shares of the public this month, including an appeals court decision upholding a Texas abortion law (29 percent), news that some people who failed to verify their immigration status will lose health insurance coverage under the health care law (28 percent), and the release of a database detailing drug company payments to doctors and hospitals (20 percent).

Awareness Of U.S. Ebola Cases And Facts About Transmission

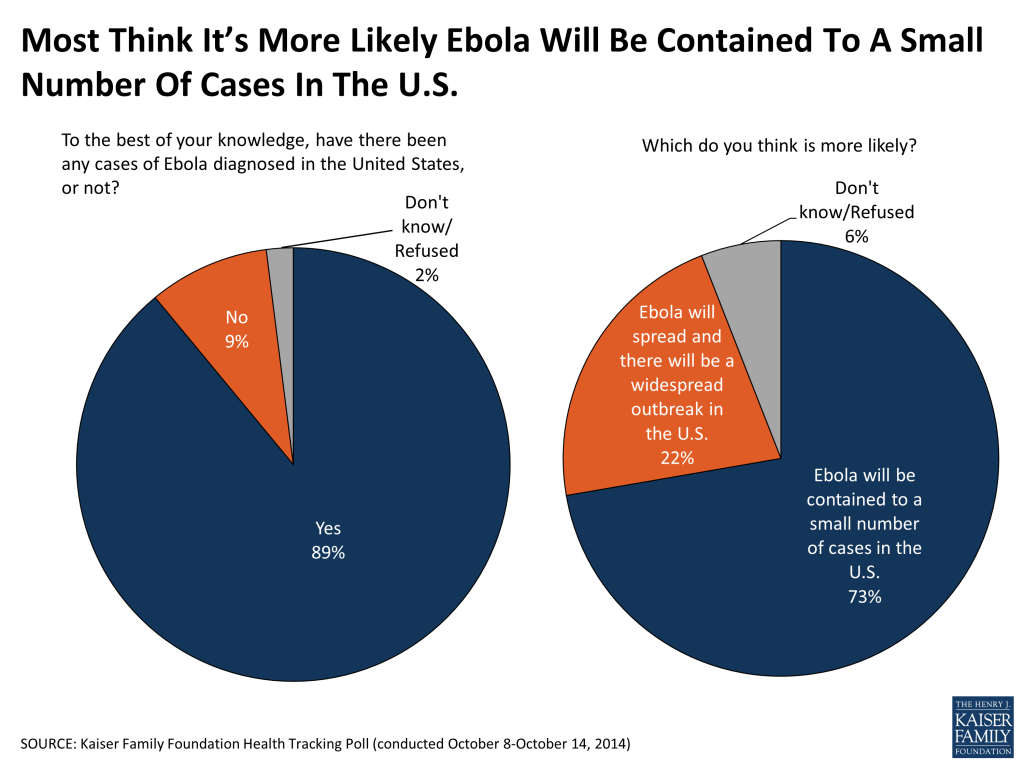
Perhaps not surprisingly given high levels of reported attention to the news, most Americans (89 percent) are aware that there has been at least one case of Ebola diagnosed in the United States.2 

While the survey finds that basic information about Ebola transmission is registering with the public, full understanding of the nuances transmission is incomplete. When presented with specific scenarios, the public tends to correctly identify how Ebola is transmitted. Almost all (97 percent) know that a person can become infected with Ebola through direct contact with the blood or body fluids of a person who is sick with Ebola and showing symptoms. Majorities are also aware that a person cannot become infected through the air (66 percent) or by shaking hands with someone who has been exposed to Ebola but does not have symptoms (55 percent). Still, substantial shares are unaware of these facts; 25 percent say Ebola can be transmitted through the air and 9 percent say they don’t know. And 37 percent say it is possible to get Ebola by shaking hands with someone who has been exposed to Ebola but is asymptomatic and another 8 percent are not sure.

Figure 2

When asked more generally whether a person infected with Ebola can transmit the disease to others before they are showing symptoms or only once they are showing symptoms, public awareness is somewhat lower. Fewer than four in ten (36 percent) accurately answer that a person must by showing symptoms to be infectious, while nearly half (48 percent) incorrectly believe that a person can transmit the disease before they are showing symptoms and another 16 percent say they do not know.

Figure 3

Across subgroups, large majorities are aware that a person can become infected with Ebola through direct contact with blood or body fluids of a person who is sick and showing symptoms. However those with lower levels of education are less likely to know that a person cannot become infected with Ebola by shaking hands with someone who has been exposed to Ebola but is not showing symptoms or through the air. Those with lower levels of education are also less likely to correctly respond that a person with Ebola can only transmit the disease to others once they are showing symptoms.

Table 1: Awareness Of How Ebola Is Transmitted By Education
Percent who CORRECTLY answer that…By Education
HS GRAD OR LESSSOME COLLEGECOLLEGE GRAD OR MORE
… a person CAN become infected with Ebola through direct contact with blood or body fluids of a person who is sick with Ebola and showing symptoms95%97%99%
… a person CANNOT become infected with Ebola by shaking hands with someone who has been exposed to Ebola but does not have symptoms425771
…a person CANNOT become infected with Ebola through the air586779
… a person with Ebola can only transmit the disease to others once they are showing symptoms313248

Personal Concern And Trust In Health Authorities

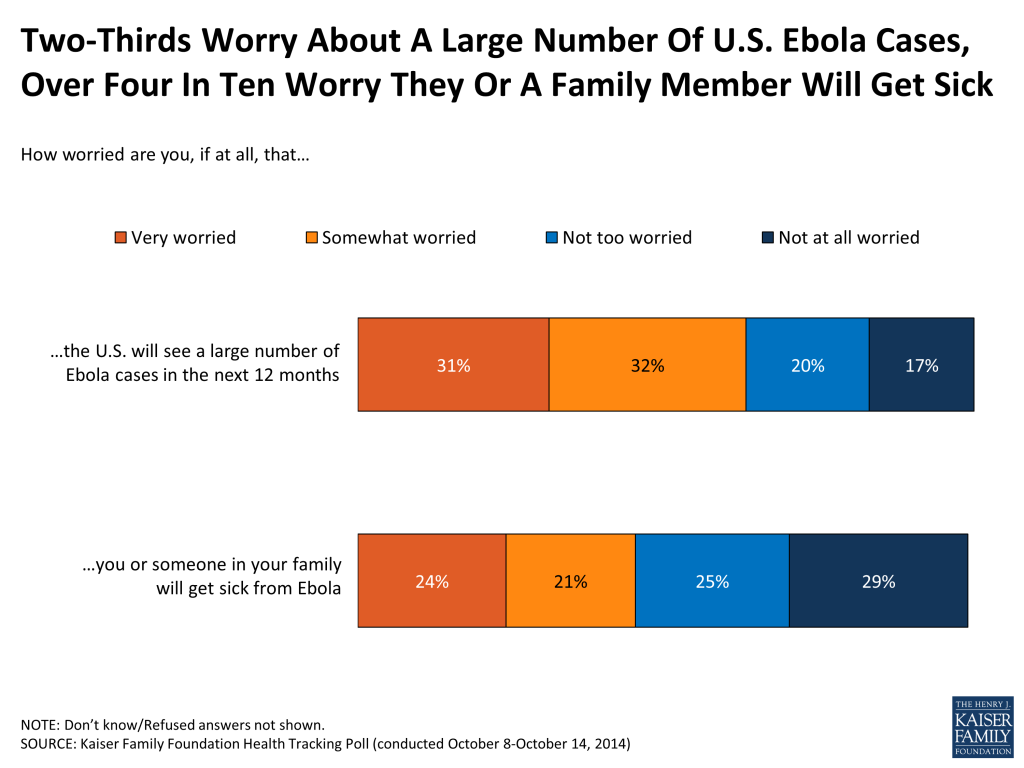
A majority of the public says they are at least “somewhat” worried that the U.S. will see a large number of Ebola cases in the next 12 months (63 percent), and a robust, albeit smaller, share is worried that they or someone in their family will get sick from Ebola (45 percent). Personal worry about oneself or a family member becoming infected is higher among women (50 percent), African Americans (56 percent), Hispanics (65 percent), and those with a high school education or less (57 percent).

Figure 4

Despite this general level of reported concern about Ebola in the U.S., when asked which is the more likely scenario, about three quarters of the public (73 percent) say it is more likely that Ebola will be contained to a small number of cases in the U.S., compared to two in ten (22 percent) who say it is more likely there will be a widespread outbreak in the U.S.

Figure 5

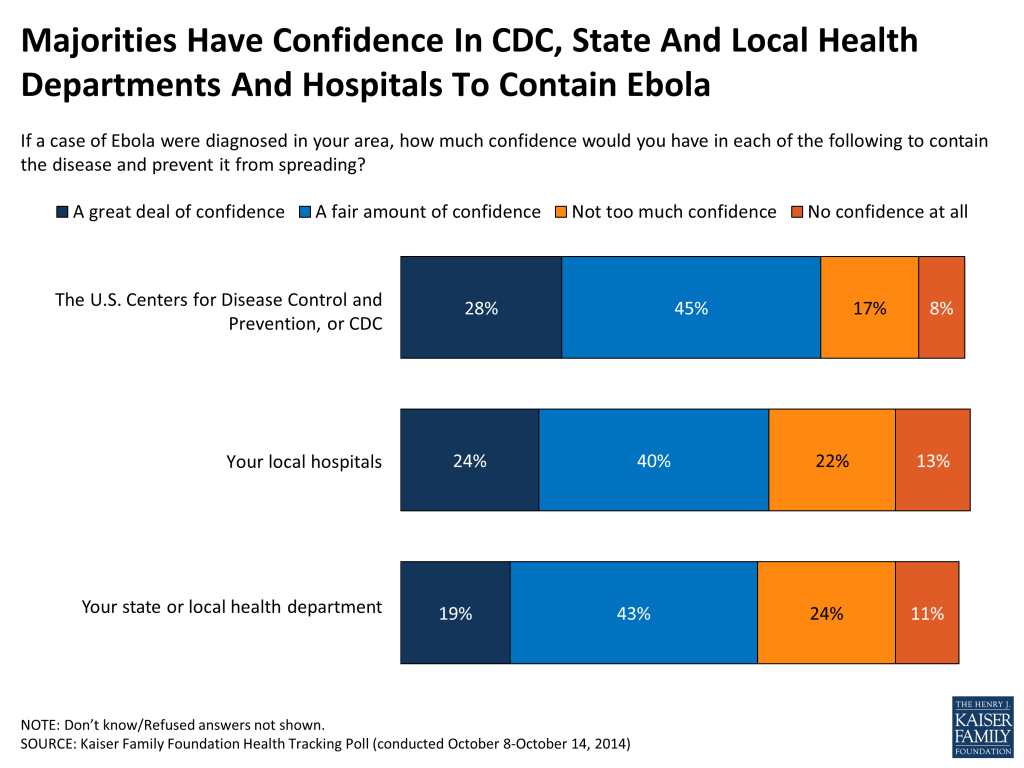
Overall, a large majority of the American public trusts local, state, and federal health authorities to contain any potential Ebola cases. About three-quarters (73 percent) say that if there were an Ebola case in their area, they would have “a great deal” or “a fair amount” of confidence in the U.S. Centers for Disease Control and Prevention (CDC), to contain Ebola and prevent it from spreading. Somewhat smaller shares – but still over six in ten  – say they have at least a fair amount of confidence in their local hospitals (64 percent) and in their state or local health department (62 percent) to prevent the spread of Ebola.

Figure 6

Surveys usually find differences between Democrats and Republicans on measures of confidence in government, but these differences are less pronounced when it comes to trust in health authorities to deal with Ebola. Democrats are somewhat more likely than Republicans and independents to express at least “a fair amount” of confidence in the CDC to prevent Ebola from spreading, although roughly seven in ten Republicans and independents report confidence as well. Confidence in local hospitals and health departments is similar across Republicans, Democrats, and independents.

TABLE 2: Confidence In Health Authorities To Prevent Spread Of Ebola By Party ID
If a case of Ebola were diagnosed in your area, how much confidence would you have in each of the following to contain the disease and prevent it from spreading?TOTALREPUBLICANSINDEPENDENTSDEMOCRATS
The U.S. Centers for Disease Control, or CDCA great deal/ A fair amount of confidence73%70%72%79%
Not too much/ No confidence25302519
Your local hospitalsA great deal/ A fair amount of confidence64646069
Not too much/ No confidence35353829
Your state or local health departmentA great deal/ A fair amount of confidence62616167
Not too much/ No confidence35373730
NOTE: Don’t know/ Refused responses not shown

 Views On The U.S. Role In Addressing The Outbreak In Africa

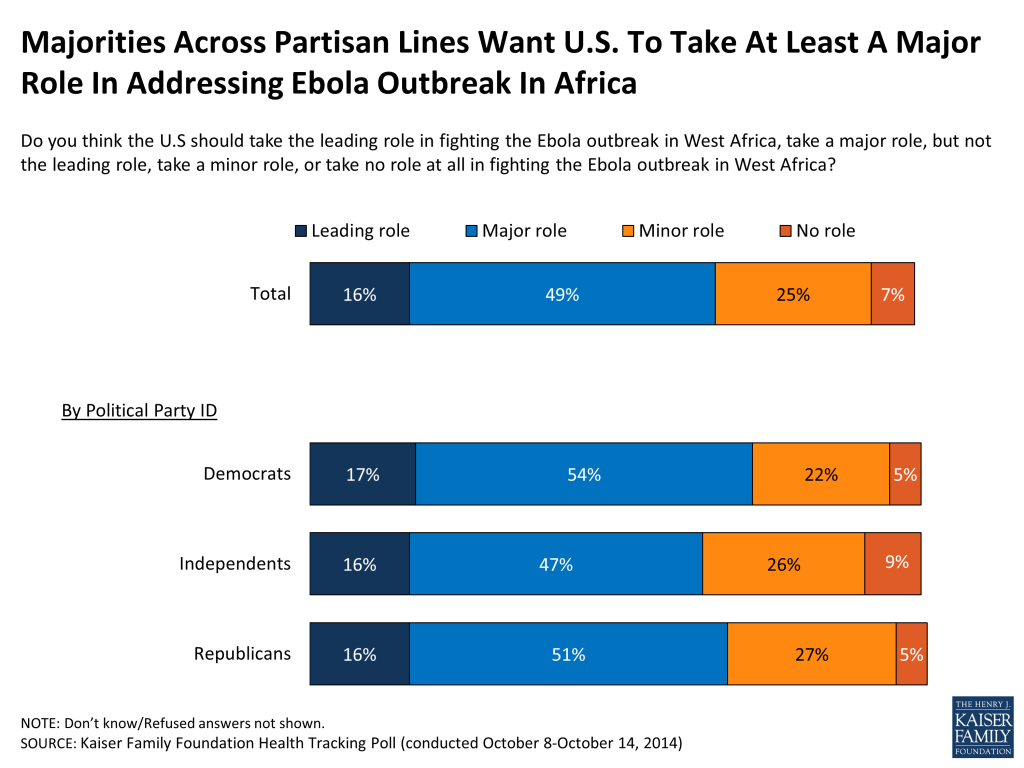
Almost nine in ten Americans (86 percent) think that the Ebola outbreak is NOT under control in West Africa. Most (65 percent) say the U.S. should take at least a major role in addressing it, though just 16 percent say the U.S. should take the leading role. A quarter of Americans say the U.S. should take a minor role (25 percent), and 7 percent say the U.S. should take no role at all. Opinion that the U.S. should take a leading or  major role in addressing the outbreak in Africa is similar across Republicans (67 percent), independents (63 percent), and Democrats (71 percent) alike.

Figure 7

The public is divided on whether the U.S. government is doing enough to fight Ebola abroad and at home. When it comes to fighting the outbreak in West Africa, about four in ten (45 percent) say the U.S. is doing enough and a similar share (40 percent) think the U.S. is NOT doing enough. Opinion of whether the U.S. government is doing enough to protect Americans from Ebola is similar; about half (48 percent) say the government IS doing enough and 44 percent say the government is not doing enough. Republicans (56 percent), women (49 percent), and those with less than a college degree (47 percent) are more likely to say that the U.S. government is NOT doing enough to protect Americans from Ebola.

Figure 8

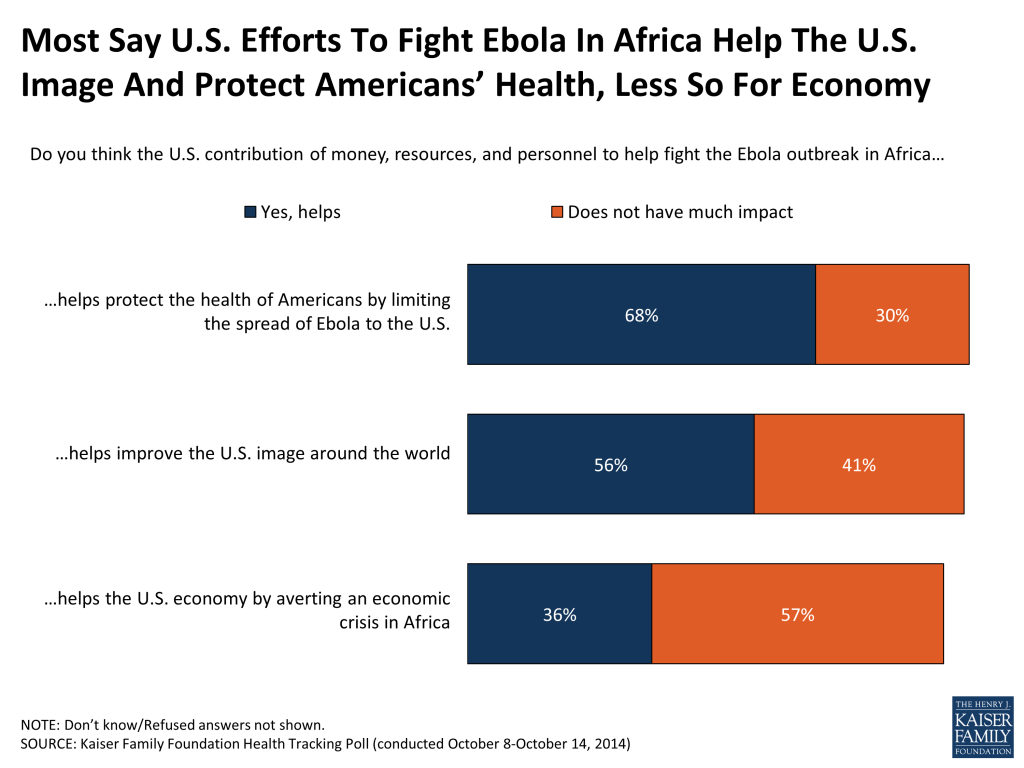
Most Americans think that U.S. contributions of money, resources, and personnel to fight Ebola in Africa help protect the health of Americans by limiting the spread of Ebola to the U.S. (68 percent) and a somewhat smaller share think these contributions help improve the U.S. image around the world (56 percent). However, when asked if these efforts help the U.S. economy by averting economic crisis in Africa, most (57 percent) said they do not have much impact.

Figure 9

When asked the MOST important reason for the U.S. to contribute to these efforts, the top two are to help protect the health of Americans (39 percent) and to save lives in the African countries affected (37 percent). Much smaller shares say the most important reason for the U.S. to contribute is to help ensure U.S. national security (10 percent), to improve the U.S. image around the world (5 percent), or to help protect the U.S. economy (4 percent).

Figure 10

The main way the public thinks the United States should help to fight the Ebola outbreak in West Africa is by providing medical supplies (93 percent), followed by investing more money in Ebola research (83 percent), sending medical personnel to train and assist doctors (81 percent), and providing financial aid (73 percent). Fewer, but still a majority, think that the United States should send troops and military personnel to help move supplies and set up treatment facilities (54 percent).

Figure 11

Rating The Amount Of Media Coverage

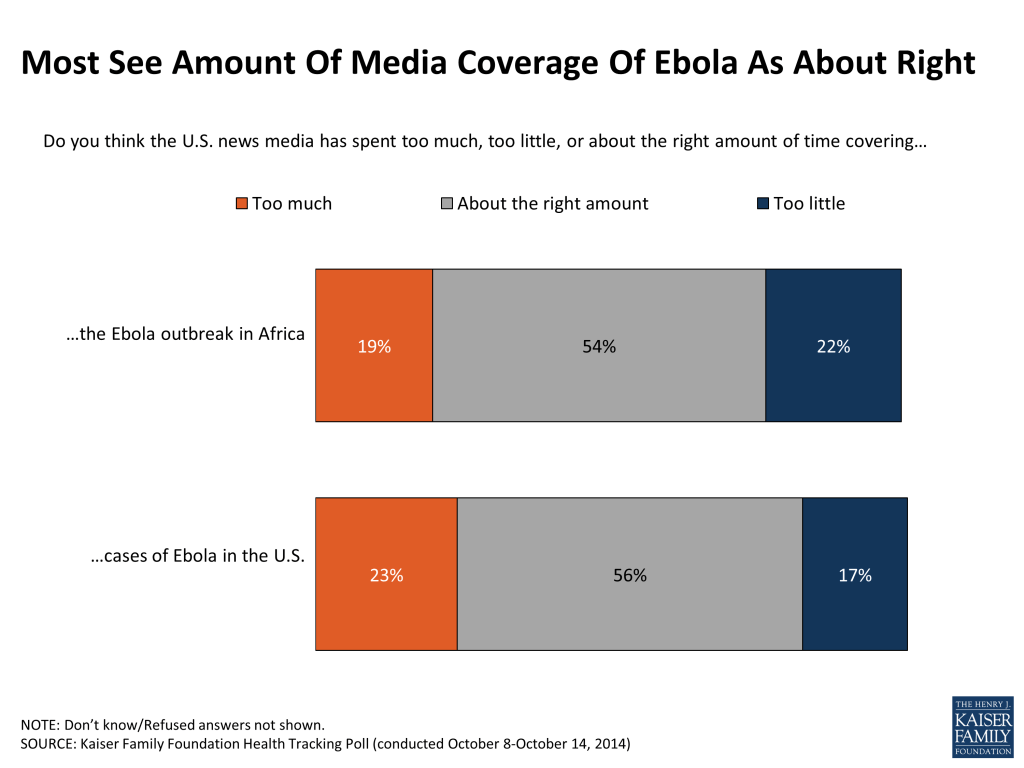
Most Americans think the amount of time the U.S. news media has spent covering the Ebola outbreak is appropriate. Over half (54 percent) say the media has spent about the right amount of time covering the Ebola outbreak in Africa, while about two in ten (19 percent) say the media has spent too much time covering the outbreak and a similar share say say too little (22 percent). Similarly, over half (56 percent) say the media has spent the right amount of time covering the cases of Ebola in the U.S., while 23 percent say the media has spent too much time and 17 percent say it has spent too little.

Figure 12

NOTE: These questions were asked as part of the October 2014 Kaiser Health Tracking Poll. For more results from that survey, including methods, see: Kaiser Health Tracking Poll: October 2014.

  1. A second nurse tested positive for Ebola on October 15, after the survey came out of the field. ↩︎
  2. The survey was in the field October 8-14, after the announcement on September 30 that the first U.S. case of Ebola had been diagnosed in Dallas. The second U.S. case, a nurse who became infected while treating the Dallas patient, was announced on October 12, midway through the survey field period. A second nurse tested positive for Ebola on October 15, after the survey came out of the field. ↩︎

Benefits and Cost-Sharing for Working People with Disabilities in Medicaid and the Marketplace

Authors: MaryBeth Musumeci, Julia Paradise, Erica L. Reaves, and Henry Claypool
Published: Oct 15, 2014

Executive Summary

Access to affordable health insurance with adequate coverage of key benefits is essential to the ability of people with disabilities to seek and maintain employment. As their income fluctuates, people may migrate between Medicaid and Marketplace coverage, and because different rules apply in these two programs, they may face changes in their benefits and out-of-pocket responsibilities as a consequence. This issue brief uses hypothetical examples of working people with disabilities to illustrate the experiences they might have with Medicaid and Marketplace coverage in four states (California, Kentucky, New Jersey, and Ohio), with a focus on benefits that are typically important to people with disabilities.

The profiles include:

  • Susan, a 21 year old woman, with mild cerebral palsy (CP) who is working part-time while completing her Bachelor’s degree;
  • John, a 35 year old construction worker, with clinical depression; and
  • Mary, a 40 year old woman who works at a fast food restaurant and recently was diagnosed with multiple sclerosis.

Key themes emerging from this analysis include the following:

  • Due to mental health parity requirements, Medicaid benefits for newly eligible adults may include more extensive mental health and substance use treatment services, unless states also modify their Medicaid state plan benefits to reflect the full extent of required coverage for new adults. These differences are likely to affect John as he seeks treatment for clinical depression. For example, while outpatient mental health, clinic, and case management services are available under both New Jersey’s Medicaid state plan and its new adult alternative benefit plan (ABP), New Jersey’s ABP also has more extensive mental health and substance use treatment services and includes more intensive care coordination and treatment services, such behavioral health homes and program of assertive community treatment services, which might be appropriate for John, depending on his needs.
  • Prescription drug coverage is likely to vary between Medicaid and Marketplace Qualified Health Plans (QHPs) as well as among QHPs within a state. Because Susan takes prescription drugs to control the muscle spasticity resulting from CP, she will want to carefully evaluate the different Marketplace QHP formularies to see if the drugs that she currently is prescribed are covered when she takes a higher paying job and transitions from Medicaid to Marketplace coverage.
  • Within a benefit category, Marketplace QHP coverage of specific services, such as rehabilitative and habilitative services, may differ from Medicaid coverage and may be subject to different utilization limits than apply in Medicaid in some states. Coverage of specific services also may vary among QHPs within a state. For example, if Mary seeks physical therapy services to address the effects of MS, she would have similar coverage under Ohio’s new adult ABP and state plan benefits, which both cover 30 physical therapy visits per year, with additional visits approved through prior authorization. After Mary transitions to Marketplace coverage when her earnings increase, she would have somewhat less generous coverage under the Ohio benchmark QHP, which covers 20 physical therapy visits per year.
  • Coverage of long-term services and supports may be more extensive in Medicaid than in Marketplace QHPs. For example, while personal care services are optional in Medicaid, New Jersey includes them in its Medicaid state plan and new adult ABP. Once Susan transitions to Marketplace coverage, personal care services are not included in New Jersey’s benchmark QHP.
  • Provider networks may differ between Medicaid and Marketplace QHPs.  If it is important for John to remain with the same psychiatrist who has been treating him, then he will want to choose a QHP in which that physician participates when he moves from Medicaid to Marketplace coverage.
  • Beneficiaries are likely to experience higher out-of-pocket costs in Marketplace QHPs than in Medicaid. While Medicaid premiums and cost-sharing are imposed at state option and limited to certain populations, Marketplace QHPs have premiums that are limited based on income, ranging from 2% of income for those with incomes up to 133% FPL to 9.5% of income for those with incomes from 300-400% FPL in 2014. California has standardized cost-sharing amounts for all its Marketplace plans in the same metal tier, while cost-sharing varies among QHPs in the other states in this analysis.

Looking ahead, Medicaid is likely to remain an important source of coverage for working people with disabilities, and the ACA’s Medicaid expansion and new Marketplace QHPs will provide greater access to affordable coverage for this population as their incomes increase. Understanding experiences that working people with various disabilities are likely to encounter can help inform policymakers’ choices in designing Medicaid and Marketplace benefit packages and cost-sharing rules.

Issue Brief: Introduction

Nearly 27% of working-age people with disabilities were employed in 2013, and an additional almost 15% were unemployed but actively seeking work.1  Programs such as the Social Security Administration’s Ticket to Work2  for people who receive Social Security Disability Insurance or Supplemental Security Income benefits, as well as state vocational rehabilitation agencies,3  offer job search, training, and other services to support the employment of people with disabilities. However, access to affordable health insurance that meets their needs for medical and long-term services and supports (LTSS) remains essential to the ability of people with disabilities to seek and maintain employment.

Medicaid has long been an important source of health insurance for people with disabilities. The Affordable Care Act (ACA) created new coverage options, effective January 1, 2014, that benefit people with and without disabilities.4  The health reform law expanded Medicaid to adults with incomes up to 138% of the federal poverty level (FPL, $16,105 per year for an individual in 2014), many of whom previously were ineligible for coverage. (Due to the Supreme Court’s ruling on the ACA, the Medicaid expansion is effectively a state option.5 ) The Medicaid expansion establishes a uniform level of financial eligibility, which promotes continuity of coverage when workers change jobs or move interstate, to the extent that states have expanded coverage. In addition, there are several optional coverage groups that allow working people with disabilities to buy in to Medicaid coverage by paying a premium.

The ACA also provides for qualified health plans (QHPs) that people without access to employer-sponsored or other coverage that meets federal minimum standards can purchase through new health insurance Marketplaces. QHP benefit packages are based on a benchmark commercial insurance plan and therefore are similar to employer-sponsored insurance. To make Marketplace coverage more affordable, the ACA provides for premium tax credits for people with incomes from 100% to 400% FPL ($11,670 to $46,680 per year for an individual in 2014) and cost-sharing reductions for people with incomes from 100% to 250% FPL ($11,670 to $29,175 per year for an individual in 2014). In addition, the ACA includes private insurance market reforms that improve access to coverage for people with disabilities. These include a provision for guaranteed issue, which prevents health insurers from denying coverage to people for any reason, including pre-existing conditions, and a provision requiring community rating, which allows health plans to vary premiums based only on age, geographic area, tobacco use, and number of family members, and thereby prohibits plans from charging higher premiums based on health status or gender.

As people’s incomes fluctuate, they may move between Medicaid and Marketplace coverage and, because different rules apply to the two programs, face changes in their benefits and out-of-pocket costs as a consequence. This issue brief uses hypothetical examples of working people with disabilities to illustrate the kinds of experiences they are likely to have with Medicaid and Marketplace coverage in four states – California, Kentucky, New Jersey, and Ohio – with a focus on benefits typically important to people with disabilities, including mental health and substance use treatment services, prescription drugs, rehabilitative and habilitative services and devices, and LTSS. All four states have implemented the ACA’s Medicaid expansion. However, they have made different decisions about how to design their Medicaid benefit packages for newly eligible adults, and how to set up and administer the Marketplace that serves their state. Key themes identified from this analysis reveal the potential impact of various state and plan decisions on working people with disabilities and can help inform policymakers’ future choices in designing Medicaid and Marketplace benefit packages and cost-sharing rules.

Issue Brief: Background

Medicaid and Marketplace Benefits

Federal law requires all states that participate in the Medicaid program to cover certain benefits and also allows states to cover additional optional benefits.6  Examples of mandatory state plan benefits include inpatient hospitalization and outpatient physician services; examples of optional state plan benefits include prescription drugs (which all states currently cover) and many LTSS important to people with disabilities, such as personal care services. As a result of the broad state flexibility to define Medicaid benefits under federal law, the specific services that states cover (outside the federally required services) vary widely.

Under federal law, states also have the flexibility to offer different Medicaid benefit packages to different populations, provided that certain minimum benefits are covered. This is accomplished by designing an alternative benefit plan (ABP, previously called “benchmark coverage”) based on one of several commercial insurance plans or on a benefit package approved by the Health and Human Services Secretary.7  Prior to the ACA, only a few states took up the ABP option. However, the ACA requires that adults newly eligible through the Medicaid expansion receive an ABP. An exception to this rule is that beneficiaries who are considered medically frail must have access to all the benefits contained in the Medicaid state plan package, to the extent that it differs from the new adult ABP. Unlike Medicaid state plan benefits, ABPs must cover the 10 categories of essential health benefits (EHBs) set out in the ACA. ABPs also must provide parity in coverage of physical and mental health benefits and include certain traditional Medicaid services, such as non-emergency medical transportation and federally qualified health center services.

Beyond these minimum requirements, states can choose the underlying benchmark plan on which an ABP is based and decide whether to align the contents of their new adult ABP with their Medicaid state plan benefit package. If the state plan and new adult ABP benefits are fully aligned, all Medicaid beneficiaries in the state have access to the same set of benefits. If states do not align the two benefit packages, then beneficiaries may have access to different sets of services if they shift from the new adult group to a pre-ACA coverage group or vice versa when their income changes. For example, certain LTSS may be available through the Medicaid state plan benefit package but not included in the new adult ABP, depending on the state’s choices. At the same time, even if states base their new adult ABP on their state plan benefit package, the new adult ABP may include more benefits, such as additional behavioral health and preventive services, unless states also add these services to their state plan benefit packages. This result could arise because the ACA’s EHB and mental health parity requirements apply to ABPs but not to Medicaid state plan benefits. (However, if a state opts to deliver Medicaid state plan benefits through managed care organizations (MCOs), mental health parity is required for Medicaid MCOs, to the extent that the MCO’s benefit package includes both physical and mental health services.)

Marketplace QHP and Medicaid new adult ABP benefit packages both must include the 10 categories of EHBs. However, the specific services that QHPs cover within an EHB category may differ from those covered under the new adult ABP because the ACA allows states to base their QHPs and new adult ABP on different underlying benchmark plans. The ACA also allows for benefit substitution within an EHB category as long as the substitute benefits are actuarially equivalent to those they replaced. Thus, there are likely to be differences in the coverage of specific services among different QHPs, and also between QHPs and Medicaid. Key differences between Medicaid state plans, ABPs, and Marketplace QHPs in coverage of benefits that are important to people with disabilities are summarized in Table 1 below.

Table 1: Key Differences in Required Benefits in Medicaid State Plans, ABPs, and Marketplace QHPs
Benefit TypeMedicaid State PlanMedicaid New Adult ABPMarketplace QHP
Mental health and substance use treatment servicesAvailable through some required categories (e.g., physician services); also provided through optional categories (e.g., other rehabilitative services); Medicaid only covers inpatient mental health services in an IMD up to age 21 or over age 65Required as part of EHB; Medicaid only covers inpatient mental health services in an IMD up to age 21 or over age 65Required as part of EHB
Mental health parityOptional (states may cover mental health benefits in a different amount, duration and scope than physical health benefits); however, if state delivers benefits through a managed care organization (MCO), mental health parity is required for MCOs (to the extent that both physical and mental health services are included in the MCO’s benefit package)Required (however, Medicaid IMD payment exclusion still applies)Required
Prescription drugsOptional (all states presently cover; must cover all FDA-approved drugs whose manufacturers have entered into rebate agreement)Required as part of EHB (must cover at least 1 drug per class)Required as part of EHB (must cover at least 1 drug per class)
Rehabilitative services and devicesMedical equipment, supplies, and appliances are part of the required home health services for people who qualify for nursing facility services; otherwise optional (e.g., physical therapy and related services, prosthetic devices)Required as part of EHBRequired as part of EHB
Habilitative servicesOptional (e.g., § 1915(i) state plan HCBS)Required as part of EHB (may be defined by state if not included in EHB benchmark)Required as part of EHB (may be defined by health plan or state if not included in EHB benchmark)
Long-term services and supportsNursing facility services and home health services for people who qualify for nursing facility services are required; other LTSS are optional (e.g., personal care, case management, etc.)Optional (unless included in ABP or EHB benchmark plan coverage)Optional (unless included in EHB benchmark plan coverage)

Medicaid and Marketplace Cost-Sharing

Federal law permits states to impose premiums and cost-sharing on certain Medicaid beneficiaries subject to specified limits and exemptions.8  Medicaid premiums and cost-sharing are limited to 5% of family income, calculated on a quarterly or monthly basis, at state option. Premiums generally are not permitted for Medicaid beneficiaries with incomes below 150% FPL ($17,505 for an individual in 2014), but can be imposed at state option on some populations with incomes above that level. There also are several optional Medicaid eligibility groups for working people with disabilities that enable such individuals to “buy in” to Medicaid coverage by paying a sliding-scale premium based on income.

Medicaid co-payments also are permitted for some populations at state option. Co-payments must be “nominal” for beneficiaries with incomes below the federal poverty level and are subject to federal maximums for beneficiaries with higher incomes. For example, in 2014, the maximum co-payment for an outpatient service for people with income at or below poverty is $4, and co-payments for outpatient services are limited to 10% of the agency’s cost for those with incomes between 101-150% FPL, and to 20% of the agency’s cost for those with more income. The maximum co-payment for preferred prescription drugs for all beneficiaries in 2014 is $4; for non-preferred drugs, the maximum co-payment is $8 for people with incomes at or below 150% FPL, and 20% of the agency’s cost for those with more income. State Medicaid programs must cover preventive services without cost-sharing, and providers cannot deny services for Medicaid beneficiaries’ failure to pay a co-payment for people with incomes below poverty.

In the Marketplace, the ACA limits QHP premium costs, ranging from 2% of enrollee income for those up to 133% FPL to 9.5% of income for those from 300-400% FPL in 2014. Marketplace enrollees with incomes between 100% and 400% FPL qualify for advance payment of tax credits to subsidize premium costs that exceed this limit. In addition to premiums, QHPs can charge deductibles and co-payments. Enrollees with incomes between 100% and 250% FPL qualify for cost-sharing reductions to limit their out-of-pocket costs. As in Medicaid, Marketplace QHPs must cover preventive services without cost-sharing. Key differences in cost-sharing between Medicaid state plans, ABPs, and Marketplace QHPs are summarized in Table 2 below.

Table 2: Key Differences in Cost-Sharing in Medicaid State Plan, ABPs, and Marketplace QHPs
Medicaid State PlanMedicaid New Adult ABPMarketplace QHP
PremiumsNot permitted for people with incomes below 150% FPL; permitted for certain coverage groups above 150% FPL; total premiums and cost-sharing limited to 5% beneficiary incomeSame as state planLimited based on enrollee income: ranging from 2% of income for those up to 133% FPL to 9.5% of income for those from 300-400% FPL in 2014; advance payment of premium tax credits available for people between 100-400% FPL
Cost-SharingPermitted for certain coverage groups and services; must be nominal for people with incomes below poverty and subject to federal maximums for people above povertySame as state planEnrollee cost-sharing is limited to 6% of allowable costs of benefits for people with incomes between 100-150% FPL, 13% for people between 150-200% FPL, and 27% for people between 200-250% FPL

Marketplace Structure and Administration

The ACA gives states the option to establish their own Marketplace. State-based Marketplaces can be active purchasers of QHPs, regulating which plans can be offered for purchase. Alternatively, state-based Marketplaces can act simply as clearinghouses, allowing any issuer that wishes to offer a plan on the Marketplace to do so.

The ACA provides for a federally facilitated Marketplace (FFM) as a default in states that elect not to establish their own Marketplace. States also may choose to administer a Marketplace in partnership with the federal government by assuming control over the QHP administration and/or consumer assistance functions.


Issue Brief: Hypothetical Experiences Of Working People With Disabilities

Project Overview

In light of the varied requirements and flexibilities pertaining to the design of benefit packages and to cost-sharing amounts in Medicaid and the Marketplace, and to illustrate the impact of different state policy choices on working people with disabilities, this issue brief considers the rules as they might affect representative individuals in different situations. The rest of this paper presents three profiles of hypothetical working people with disabilities and examines how their benefits and cost-sharing obligations may differ as they move between Medicaid state plan and new adult ABP coverage and between Medicaid and Marketplace QHPs. The analysis focuses on selected categories of benefits that are important to many people with disabilities, including mental health and substance use treatment services, prescription drugs, rehabilitative and habilitative services and devices, and LTSS.

The analysis considers the benefits and cost-sharing rules that apply to newly eligible adults in Medicaid programs in four selected states. It is important to note that if an individual who is eligible under the ACA’s expansion meets the definition of “medically frail” or also qualifies for Medicaid through a disability-related (non-MAGI) eligibility pathway, that individual must have access to all Medicaid state plan benefits, to the extent that state plan benefits may differ from those in the state’s new adult ABP. The analysis also considers the benefits and cost-sharing rules in representative QHPs in the four states’ Marketplaces.

The states included in this analysis are California, Kentucky, New Jersey, and Ohio. These states, all of which are implementing the ACA’s Medicaid expansion in 2014, were selected to illustrate different state policy choices about aligning Medicaid state plan benefits and new adult ABPs and about whether to operate a state-based or partnership Marketplace or to default to the FFM. This brief relies on Medicaid benefit and cost-sharing information from current state plans or applicable § 1115 demonstration waivers, and on states’ new adult ABP state plan amendments as approved by CMS. Benefit information for Marketplace QHPs is based on the summary of benefits for the Marketplace benchmark plan selected by the state. All QHPs must have benefit packages that are actuarially equivalent to the benchmark plan, so the benchmark plan coverage can be considered representative of what a person would find in a Marketplace QHP. Cost-sharing information for Marketplace QHPs is based on an actual 2014 silver-level plan considered to be representative in each state, with premium tax credits determined using the Kaiser Family Foundation’s subsidy calculator.9 

It also is important to note that the actual coverage of specific services depends on an individual’s health condition, the recommendation(s) of a treating provider, and the state’s Medicaid medical necessity criteria or the applicable QHP coverage criteria. Also, this analysis is based on general language about covered categories of benefits in the sources described above; often, it is not possible to determine whether a specific service or item is covered by a plan until an actual claim is submitted. While the QHP benchmark plan used in this analysis is representative of what Marketplace QHPs cover, as noted above, plans may substitute actuarially equivalent benefits within the same EHB category. Therefore, the QHP coverage described in this brief is illustrative and not necessarily exactly what is available in all Marketplace QHPs in that state.

Table 3 summarizes the key Medicaid state plan and ABP benefits and Marketplace design choices among the states selected for this analysis. More detailed information about benefits and cost-sharing in each state’s Medicaid state plan and new adult ABP and representative Marketplace QHP is included in Appendix 1 and the methodology used to select the QHPs for the cost-sharing comparisons is included in Appendix 2.

Table 3: Key Characteristics of Selected States’ Medicaid Benefits and Marketplaces
State

Alignment of New Adult ABP with Medicaid State Plan Benefits(do new adult ABP and Medicaid state plan cover same benefits?)

Type of Marketplace
CaliforniaAligned, but beneficiaries must meet medically frail criteria to access LTSSState-based, active purchaser model; standardized deductibles, out-of-pocket maximums, and co-payments for all QHPs within same metal tier
KentuckyAlignedState-based, clearinghouse model
New JerseyNot aligned – ABP offers additional behavioral health benefits and does not include certain LTSSFFM
OhioAligned except that ABP eliminates state plan utilization limits for certain behavioral health servicesFFM

Profile Summaries

Summaries of the three hypothetical profiles of working people with disabilities used in this analysis are presented below. The full profiles are included in Appendix 3.

Hypothetical 1: Susan, age 21, Diagnosed with mild cerebral palsy (CP)

Susan recently completed community college and transferred to a four-year college to complete her Bachelor’s degree. She lives on her own and works 25 hours per week as a cashier, earning $8.25 per hour. Her state has implemented the ACA’s Medicaid expansion, and her annual earnings of $10,725, or about 92% of the federal poverty level for a single adult in 2014, make her eligible for Medicaid in 2014. Susan is subsequently offered a job as a bookkeeper during her senior year of college. When she changes jobs, she continues working 25 hours per week, but earns $13 per hour. Her new annual earnings of $16,900, or approximately 145% FPL in 2014, make her eligible for Marketplace coverage with premium tax credits and cost-sharing reductions.

Susan’s needs for acute physical health and preventive services are the same as those of other, healthy young adults. She also has some additional medical needs associated with her CP diagnosis. Susan is able to walk but uses crutches or a power scooter when she travels significant distances, including getting around campus. Because Susan’s fine motor skills are mildly impaired, her family sometimes helped her button or tie clothing, prepare meals and do laundry when she was living at home. Susan had no plan for seeking assistance with her personal care needs when she went away to college, so they will likely be unmet, or performed to the best of her ability, without formal personal care services in place. She receives physical therapy twice a month to manage contractures stemming from muscle spasticity, and her physician believes she would benefit from weekly physical therapy and monthly occupational therapy to improve her fine motor skills. She takes prescription medication to control muscle spasticity, which is a common condition secondary to CP. While she is not currently in treatment for mental health issues, Susan was bullied in school because of her gait and use of crutches. She may have undiagnosed mild depression and/or anxiety as a result and might benefit from mental health diagnostic services, and if warranted, treatment.

Hypothetical 2: John, age 35, Diagnosed with clinical depression

John is a high school graduate with a limited work history as a seasonal day laborer for a local construction company. In three of the last five years, he earned approximately $15,000 per year, or about 129% FPL for a single adult in 2014. John’s state has implemented the ACA’s Medicaid expansion, and he is eligible for Medicaid in 2014. John was recently offered a year-round job as an assistant to an auto mechanic, earning $8.15/hour for a 40-hour work week. If he takes this job, John would make $16,952 a year, or about 145% FPL in 2014 and will become eligible for Marketplace coverage with premium tax credits and cost-sharing reductions.

John was first diagnosed with depression after a failed suicide attempt at age 32 when he was taken to the emergency department and involuntarily committed to inpatient treatment. John needs regular doctor appointments and takes a prescription anti-depressant medication.   John’s doctor has encouraged him to seek individual and group therapy, but he has been unable to follow up on this recommendation because he previously was uninsured and unable to pay out-of-pocket. He also could benefit from regular preventive health care services.

Hypothetical 3: Mary, age 40, Diagnosed with multiple sclerosis

Mary finished high school but never went to college and currently works at a fast food restaurant. Mary works 30 hours a week at $8.25 per hour, with annual earnings of approximately $12,870, or about 110% FPL for a single adult in 2014. Her state has implemented the ACA’s Medicaid expansion, and she is eligible for Medicaid in 2014. Mary then decides to take a job selling tickets at a movie theater on the weekends, where she will earn $8.50 per hour. She will work 9 hours per week, earning$3,978 per year and bringing her total annual income to $16,848, or nearly 145% FPL in 2014. Once Mary takes her second job, she will become eligible for Marketplace coverage with tax credits and cost-sharing reductions.

Mary’s lack of health insurance and limited income have made it difficult for her to afford basic preventive health care, such as annual physical examinations. In January 2014, she visited the emergency department after experiencing an extended bout of blurred vision and muscle weakness and subsequently was diagnosed with multiple sclerosis. Mary now sees a neurologist, who recommended that she begin receiving regular doses of an injectable drug to slow the progression of the disease. He also referred her to a physical therapist for regular treatment of her muscular weakness and ordered some additional tests to assess the extent of impairment in her vision and fine motor functioning.

Issue Brief: Key Themes

Some common themes emerge from the analysis of Susan, John, and Mary’s potential experiences as working people with disabilities seeking coverage under Medicaid and the Marketplace in selected states. As background, when analyzing the scope of benefits available through Medicaid in various states, it is important to remember that differences between Medicaid state plan and new adult ABP benefits reflect state choices about which optional Medicaid benefits to cover in their state plans and about whether to fully align their new adult ABP and their state plan benefits. In addition, determining the specifics about coverage of particular services in Marketplace QHPs is difficult without actually submitting a claim to the plan, as little detailed information is readily available from public sources. The key themes in this analysis include the following:

Mental Health and Substance Use Disorder Treatment Services

  • Because mental health parity requirements apply to Medicaid new adult ABPs, these plans may offer more extensive coverage of mental health and substance use treatment services than Medicaid state plan benefits do, unless states also modify their Medicaid state plan benefits to reflect the full extent of new adult ABP coverage (and unless state plan benefits are delivered through Medicaid MCOs, which must provide parity if both physical and mental health benefits are covered).

Example: Susan’s Potential Experience in California and New Jersey

Susan might seek mental health diagnostic and treatment services for possible depression and/or anxiety stemming from the bullying she experienced as a result of her physical disabilities. If Susan lives in California, she has access to the same package of Medicaid mental health services regardless of whether she receives state plan benefits as a previously eligible adult or the ABP as a newly eligible adult. This is because California has elected to align its new adult ABP with its state plan benefits, both of which include outpatient mental health services, such as evaluation, therapy, and psychological testing. (Table 4)

Even though New Jersey has chosen not to align its Medicaid state plan benefits and its new adult ABP, Susan should be able to access the outpatient mental health services or mental health clinic services she might need through both the Medicaid state plan benefits package and the new adult ABP. Due to the mental health parity rules that apply to ABPs, New Jersey’s new adult ABP has more extensive mental health and substance use treatment services than are covered in the Medicaid state plan. However, the additional services included in New Jersey’s new adult ABP, such as behavioral health homes, mental health adult rehabilitation services (group homes), and program of assertive community treatment services, appear to be beyond what Susan might need at this time. (Table 8)

Once Susan accepts the position as a bookkeeper and her income increases, she would have access to outpatient mental health services through a Marketplace QHP. Based on the available information about QHP benefits, it is difficult to determine whether, in California and New Jersey, Marketplace coverage of mental health services would be more or less generous than, or comparable to, Medicaid coverage. California requires QHPs to cover outpatient mental health services for “severe mental illness” (Table 4), and a New Jersey state mandate requires insurers to cover services for “biologically based mental illness.” (Table 8)

Example: John’s Potential Experience in New Jersey and Ohio

Given John’s primary diagnosis of clinical depression, mental health treatment services will be important to support his ability to work. In contrast to Susan, John will likely be affected by the benefit differences between New Jersey’s Medicaid state plan and its new adult ABP, because his mental health treatment needs are more intensive. As noted earlier, New Jersey has chosen not to align its Medicaid state plan benefits with its new adult ABP, with the result that the new adult ABP has more extensive mental health and substance use treatment services (due to the mental health parity requirements). Outpatient mental health, clinic, and case management services are available under both New Jersey’s Medicaid state plan and the new adult ABP. In addition, New Jersey’s ABP includes more intensive care coordination and treatment services, such behavioral health homes and program of assertive community treatment services, which might be appropriate for John, depending on his needs. (Table 8)

If John lived in Ohio, he would have access to the same categories of mental health treatment services regardless of his Medicaid coverage group because the state has chosen to include all of its Medicaid state plan services in its new adult ABP. The mental health benefits in both packages include psychologist services, psychiatric clinical nurse specialists, behavioral health clinic services (including counseling, therapy, mental health assessment, pharmacologic management, partial hospitalization, crisis intervention, community psychiatric supportive treatment), and case management services. Ohio also has opted to include behavioral health home services for people with serious mental illness in both Medicaid packages. However, due to the mental health parity rules that apply to ABPs, Ohio has removed the Medicaid state plan utilization limits on mental health services from the ABP. Examples of utilization limits under Ohio’s state plan Medicaid benefits that do not apply to the ABP include a maximum of 52 hours per year of behavioral health counseling and therapy and a maximum of 30 cumulative hours per week of group and individual counseling and medical/somatic services. (Table 10)

Like Susan, when John moves from the new adult ABP to Marketplace coverage, he would continue to have access to mental health outpatient services through a QHP in Ohio. However, he would be subject to different utilization limits, as the benchmark plan for Ohio’s QHPs limits outpatient mental health services to 30 visits per year. (Table 10)

Prescription Drugs

  • Prescription drug coverage is likely to differ between Medicaid and Marketplace plans. State Medicaid programs must cover must cover all FDA-approved drugs whose manufacturers have entered into a rebate agreement with the state. By contrast, the EHB provisions of the ACA only require Marketplace QHPs’ formularies to include at least one drug per class. All four states included in this analysis chose to use the same prescription drug formulary for their Medicaid state plan and new adult ABP. It is likely that QHPs will cover fewer drugs than Medicaid because of the different rules for QHPs. In addition, QHPs may have different preferred drug lists than state Medicaid programs do. Finally, prescription drug coverage is likely to vary among QHPs.

Example: Susan, John and Mary’s Potential Experiences

Prescription drug coverage is important to all three representative people with disabilities, as Susan takes medication to help control the muscle spasticity that results from her cerebral palsy, John takes medication to treat his depression, and Mary relies on medication to address the effects of MS. California, Kentucky, New Jersey, and Ohio all have chosen to cover the same prescription drugs in their Medicaid state plan and new adult ABP, so if beneficiaries transition between Medicaid coverage groups in these states, their prescription drug coverage should not change. Kentucky and Ohio’s Medicaid programs use a preferred drug list, and some drugs may require prior authorization. (Tables 4, 6, 8, 10)

When Susan, John, or Mary transitions to a Marketplace QHP, they will want to carefully evaluate the different plan formularies to see if the drugs that they are currently prescribed are covered. Prescription drug coverage is likely to be an area of difference between Medicaid and the Marketplace because state Medicaid programs must cover must cover all FDA-approved drugs whose manufacturers have entered into a rebate agreement, while Marketplace QHPs must cover at least one drug per class. In addition, coverage of specific drugs may vary among QHPs. As long as one drug per class is covered, not all drugs may be covered by a particular QHP. In addition, QHPs may assign drugs to different formulary tiers (e.g., preferred vs. non-preferred brand), which could affect out-of-pocket cost-sharing. (Tables 4, 6, 8, 10)

Rehabilitative and Habilitative Services and Devices

  • Marketplace QHP coverage of specific benefits within an EHB category, such as rehabilitative and habilitative services, may differ from Medicaid coverage of these services and may be subject to different utilization limits than under Medicaid in some states. Coverage of specific services also may vary among QHPs in the same state.

Example: Susan’s Potential Experience in California and New Jersey

Durable Medical Equipment

Because Susan relies on crutches to ambulate short distances and a power scooter for longer distances as a result of cerebral palsy, her plan’s coverage of durable medical equipment will be important. As noted above, California has chosen to align its Medicaid state plan benefits with its new adult ABP, and durable medical equipment is covered under both, subject to prior authorization. Susan would need to look into whether the specific equipment that she needs would be covered, likely by submitting a claim. (Table 4)

By contrast, New Jersey’s Medicaid state plan benefits include durable medical equipment, but New Jersey’s new adult ABP does not, so this would be an area of difference in coverage for Susan, if she was eligible for Medicaid as a new adult, unless she meets the definition of “medically frail” in which case she could access the state plan benefits as a newly eligible adult. (Table 8)

Marketplace QHPs in both California and New Jersey cover durable medical equipment, subject to prior authorization (durable medical equipment also is a state mandated benefit for insurers in New Jersey). Again, Susan would need to submit a claim to determine whether the specific equipment she needs would be covered by her particular QHP. (Tables 4 and 8)

Physical and occupational therapy

If Susan decides to continue or increase the physical and/or occupational therapy recommended by her doctor to address the effects of cerebral palsy, it appears that she would have access to these services in Medicaid and the Marketplace in both California and New Jersey, although perhaps subject to different utilization limits. Again, California’s Medicaid state plan and new adult ABP services are aligned, and both include physical and occupational therapy services. In New Jersey, the Medicaid state plan benefit package includes physical and occupational therapy as rehabilitative services, while the new adult ABP covers these services for both rehabilitative and habilitative purposes. (Tables 4 and 8)

California Marketplace QHPs cover physical and occupational therapy as outpatient rehabilitative services, and they also cover habilitative services (which also are a state-mandated benefit in California). The New Jersey Marketplace benchmark QHP used in this analysis covers physical and occupational therapy for both rehabilitative and habilitative purposes but also includes a utilization limit of 30 visits per year. The coverage of physical and occupational therapy for habilitative purposes, as distinct from rehabilitative purposes, may be significant for Susan as rehabilitative services generally are provided to help people regain lost skills, while habilitative services focus on the acquisition of skills which are missing due to a disabling condition. (Tables 4 and 8)

Example: Mary’s Potential Experience in Kentucky and Ohio

Mary may seek physical therapy services to address the effects of MS. Kentucky has opted to align its new adult ABP with its Medicaid state plan benefits. Physical therapy is covered under both, limited to 20 visits per year, with prior authorization. In Ohio, Mary would have similar physical therapy coverage under that state’s Medicaid program under the state plan or new adult ABP, although with different utilization limits as compared to Kentucky. Ohio’s Medicaid state plan and new adult ABP both cover physical therapy at 30 visits per year, with additional visits approved through prior authorization. (Tables 6 and 10)

After Mary transitions to the Marketplace, Kentucky’s QHP benchmark coverage for physical therapy is the same as under its Medicaid program, limited to 20 outpatient visits per year. The benchmark QHP plan for Ohio covers 20 physical therapy visits per year, so under that plan in the Marketplace, Mary would have somewhat less generous coverage than under Ohio Medicaid. (Tables 6 and 10)

Long-term Services and Supports

  • Coverage of LTSS may be more extensive in Medicaid than in Marketplace QHPs.

Example: Susan’s Potential Experience in California and New Jersey

If Susan decides to pursue personal care services for assistance with dressing and household activities once she is living alone, she might encounter coverage differences when she moves from Medicaid to the Marketplace. Personal care services are optional in Medicaid, but both California and New Jersey have chosen to include them in their Medicaid state plans and their new adult ABPs, along with the option for beneficiaries to self-direct these services. As with any other Medicaid service, Susan will have to meet each state’s medical necessity criteria to qualify for personal care services. In addition, in California, Susan also will have to meet the medically frail criteria to qualify for personal care services in the new adult ABP. California’s Medicaid program also covers attendant care services and supports through the ACA’s new Community First Choice state plan option. Once Susan transitions to Marketplace coverage, personal care services are not included in either state’s benchmark QHP, although both cover home health care services. (Tables 4 and 8)

Provider Networks

  • Provider networks may differ between Medicaid and Marketplace coverage. Medicaid beneficiaries are limited to the providers who choose to participate in a state’s Medicaid program, while QHP enrollees are limited to the providers included in the plan’s network.

Example: Susan, John, and Mary’s experiences

Susan, John, and Mary all will need to see a primary care doctor for preventive care as well as specialists (an orthopedist for Susan, a psychiatrist for John, and a neurologist for Mary). In Medicaid, they will be limited to the providers who choose to participate in each state’s program, and in the Marketplace, they will be limited to the network of physicians covered by the QHP that they select. If it is important for Susan to remain with the same orthopedist who has cared for her throughout her life, then she will want to choose a QHP in which that physician participates. John and Mary also will want to consider which providers participate in each QHP’s network when selecting a plan.

Cost-sharing

  • Beneficiaries are likely to experience higher out-of-pocket costs in Marketplace QHPs than in Medicaid. Premiums are generally not permitted in Medicaid for people with incomes below 150% FPL. None of the states used in this analysis included premiums for people above 150% FPL or deductibles, and some included limited co-payments in their Medicaid programs. By contrast, Marketplace QHP enrollees with incomes between 100-133% FPL will have premium costs of 2% of income in 2014, as well as deductibles, co-insurance, and/or co-payments; those from 133-150% FPL will have premium costs of 3% of income in 2014. While Marketplace cost-sharing reductions contribute to making coverage more affordable, as illustrated in Kentucky, the deductibles and co-payments in QHPs still exceed the limits in Medicaid. In addition, Marketplace premium and cost-sharing amounts vary among states, as the ACA allows variation based on geographic region.

Example: Susan’s Potential Experience in California and New Jersey

Medicaid premiums and cost-sharing are imposed at state option, and it does not appear that Susan will be subject to any out-of-pocket costs when she is covered by the Medicaid state plan or the new adult ABP in California or New Jersey. (Tables 5 and 9)

When Susan transitions to Marketplace coverage, her income will have increased, but her out-of-pocket health care costs will increase as well. Marketplace plans have premiums that are limited to 2% of enrollee income for those from 100-133% FPL and 3% of income for those from 133-150% FPL in 2014. Pursuant to the ACA’s community rating provision, plans can vary premiums based only on age, geographic area, tobacco use, and number of family members. In the QHP selected for this analysis, Susan will pay $108 per month in premiums and receive a premium subsidy of $137 per month if she is earning 145% FPL. California has chosen to standardize cost-sharing amounts for all Marketplace plans in the same metal tier. For the representative California silver level plan used in this analysis, Susan will have an annual deductible of $1,500 for medical services and $250 for prescription drugs, and her out-of-pocket costs will be capped at $5,200. She also will have co-payments, such as $40 for a primary care visit, $50 for a specialist visit, and $19 for a generic drug. These amounts include the ACA’s cost-sharing reductions. (Table 5)

Premiums and cost-sharing vary among QHPs in New Jersey’s FFM. In the representative QHP selected for this analysis, with earnings of 145% FPL, Susan will have monthly premiums of $48 and qualify for a premium subsidy of $256 per month. She also would have a $100 annual deductible, with out-of-pocket costs limited to $750. And, she would have co-payments, such as $15 for a primary care visit and $30 for a specialist visit after her deductible is met, and $7 for a generic drug. These amounts include the ACA’s cost-sharing reductions. (Table 9)

Example: John’s Potential Experience in Ohio

Like Susan, John’s out-of-pocket costs will vary depending on his coverage source. Ohio’s Medicaid program has co-payments for prescription drugs ($3 for non-preferred drugs and $2 for selected single-source drugs) that apply in its Medicaid state plan and new adult ABP.

When John transitions to Marketplace coverage in Ohio, he will have additional out-of-pocket costs. The representative QHP in Ohio has an annual deductible of $100, with an out-of-pocket maximum of $2,250. After the plan deductible is met, primary care and specialists visits are subject to 5% coinsurance, and there are $5 co-payments for generic drugs. At 145% FPL, John would have monthly QHP premiums of $49, with a premium subsidy of $186 in Ohio. These amounts include the ACA’s cost-sharing reductions. (Table 11)

Example: Mary’s Potential Experience in Kentucky

As in other states, Mary’s out-of-pocket costs will differ as she moves between Medicaid and Marketplace coverage in Kentucky. Kentucky’s Medicaid program does not charge premiums, but it does include co-payments for certain services under both its state plan and the new adult ABP. For example, Mary would have to pay $3 for a doctor’s office visit or a physical therapy session, $1 for generic drugs, $4 for preferred brand-name drugs, and $8 for non-preferred brand name drugs.

Once Mary transitions to a Marketplace QHP in Kentucky, she would qualify for cost-sharing reductions wither her income of 145% FPL. The information available about Kentucky’s representative QHP illustrates the significant role that the ACA’s cost-sharing reductions play in helping make Marketplace coverage more affordable for people with incomes between 100-250% FPL. For example, Mary’s annual deductible in the representative Kentucky QHP in 2014 is $200 with cost-sharing reductions but $2,500 without cost-sharing reductions. Similarly, her out-of-pocket maximum is $600 with cost-sharing reductions but $6,350 without cost-sharing reductions. Mary’s co-payments for certain services also would vary in the representative Kentucky QHP with and without cost-sharing reductions. For example, with cost-sharing reductions, a primary care doctor’s visit has a $10 co-payment for the first three visits, which are not subject to the deductible. After the deductible is met, Mary’s co-insurance is 10% for additional visits. Without cost-sharing reductions, the co-payment for the first three doctor’s visits is $40. Generic drug co-payments are $10 with cost-sharing reductions and $15 without cost-sharing reductions. (Table 7)
Issue Brief: Looking Ahead

Medicaid is likely to remain an important source of coverage for working people with disabilities, and the ACA’s Medicaid expansion and new Marketplace QHPs will provide greater access to affordable coverage for this population across the income spectrum. Given the state flexibilities provided in federal law, there is wide variation in Medicaid benefits and cost-sharing across states. Because of the additional flexibility that states have in designing their new adult ABPs, working people with disabilities who are covered as newly eligible adults may experience some changes in their benefits and cost-sharing if they move between different Medicaid coverage groups due to changes in their income and/or their health status (i.e., medical frailty). Most states have chosen to minimize any differences, but where they exist, newly eligible adults might have broader mental health and substance use treatment coverage and more limited LTSS coverage than other Medicaid adults in their state. Differences in benefits and cost-sharing are likely to be more significant when working people with disabilities move between Medicaid and Marketplace coverage, given the different rules that apply to each program. Understanding how these differences may affect working people with diverse disabilities can help inform future policy-making related to benefits and cost-sharing under the ACA’s new coverage options.

Appendices: Appendix 1

Table 4: Selected Benefits Covered Through Medicaid and the Marketplace in California
Benefit TypeMedicaid State PlanMedicaid New Adult ABPMarketplace QHP
Mental health and substance use treatment services-Outpatient mental health, including individual and group evaluation and therapy, psychological testing, outpatient monitoring of drug therapy, labs, drugs, supplies, supplements, screening and brief intervention, psychiatric consultation for medication management-Outpatient heroin detox services-Other licensed practitioners (psychologists)-Rehab services, including mental health services, medication support, day treatment intensive, day rehab, crisis intervention, crisis stabilization, adult residential treatment, crisis residential, and psychiatric health facility servicesSame as state plan-Inpatient psychiatric hospitalization and intensive psychiatric treatment programs-Substance abuse disorder inpatient detox-Mental/behavioral health outpatient services* for diagnosis and treatment-Substance abuse disorder outpatient services, including day treatment, intensive outpatient, individual and group counseling, and medical treatment for withdrawal symptoms
Prescription drugsCoveredSame as state planGeneric, preferred brand, non-preferred brand, and specialty drugs
Rehabilitative and habilitative services and devices-Durable medical equipment (prior authorized)-Medical supplies-Prosthetic and orthotic appliances-Physical, occupational and speech therapy and audiology-Outpatient rehab center services-Specialized rehab services in skilled nursing and intermediate care facilities-Skilled nursing facility (90 days)Same as state plan -Skilled nursing facility (100 days/year)-Outpatient rehab services, including physical, occupational and speech therapy-Habilitation services*-Durable medical equipment (prior authorized)
Long-term services and supports-Community Based Adult Services-Case management/targeted case management-Home health services – skilled nursing, home health aide, physical, occupational and speech therapy and audiology, and medical social work services-ICF/DD-Multipurpose Senior Services Program-Personal care services, including self-direction-Skilled nursing facility (over 90 days)-Private duty nursing-Community First Choice attendant care services and supportsSame as state plan (beneficiary must meet medically frail criteria to access LTSS)-Home health care services (100 visits/year, up to 2 hours/visit, 3 visits/day; nurse, master’s level social worker, physical/occupational/speech therapist)
NOTES: *State required benefits (outpatient mental health coverage for severe mental illness, hab services for behavioral health treatment of autism and related disorders).SOURCES: CA state Medicaid plan benefits information from CA § 1115 Bridge to Reform Demonstration Special Terms and Conditions, available at http://www.dhcs.ca.gov/provgovpart/pages/waiverrenewal.aspx; CA New Adult ABP, SPA#CA- 13-035, available at www.medicaid.gov; QHP coverage based on Marketplace EHB benchmark plan, Kaiser Foundation Health Plan Small Group HMO 30 ID, and state required benefits, available at www.cms.gov/CCIIO/Resources/ehb.html.

Back to top

Table 5: Cost-Sharing in Medicaid and the Marketplace in California
Cost-Sharing TypeMedicaid State PlanMedicaid New Adult ABPMarketplace QHP
Monthly premiums0Same as state plan$108 with APTC($245 without APTC;APTC = $137)
Annual DeductibleN/ASame as state plan$1,500 medical; $250 brand Rx
Out-of-pocket maximumPer federal law, cost-sharing shall not exceed 5% of total family income ($201/quarter, or $804/year, for an individual based on quarterly earnings of 138% FPL)Same as state plan$5,200
Co-pays for selected servicesN/ASame as state plan-$40 primary care physician visit-$50 specialist visit-$19 generic Rx-$250 ER
NOTES: CA QHP information based on single, non-smoker, age 35, 145% FPL ($1,388/month), L.A. County, www.healthcare.gov.SOURCES: State Medicaid Plan information available at http://www.dhcs.ca.gov/formsandpubs/laws/Pages/CaliforniStatePlan.aspx; APTC based on KFF subsidy calculator, https://www.kff.org/interactive/subsidy-calculator/; CSR for Health Net Enhanced Silver 73 HMO available at www.healthcare.gov.

Back to top

Table 6: Selected Benefits Covered Through Medicaid and the Marketplace in Kentucky
Benefit TypeMedicaid State Plan*Medicaid New Adult ABPMarketplace QHP**
Mental health and substance use treatment services-Inpatient mental health services (prior authorization; no IMD services for 21-64)-Outpatient psychiatric services (4/year unless rendered by board-eligible or board-certified psychiatrist)-Mental health center services-Preventive chronic disease services for depression-Screening, assessment, and psychological testing-Crisis intervention, mobile crisis and residential crisis stabilization-Peer and parent/family support-Individual and group outpatient therapy (3 hours/day each, exceed if medically necessary)-Family outpatient therapy-Intensive outpatient services and partial hospitalization-Substance use disorder screening, brief intervention, referral, residential services, medication assisted treatment-Mental health assertive community treatment, comprehensive community support services, and therapeutic rehabilitative program-Service planning and case management-For those under age 21, collateral outpatient therapy and day treatmentSame as state plan-Mental/behavioral health and substance abuse disorder inpatient services (30 days/ for mental health and substance use combined; 2 inpatient and outpatient substance abuse rehab programs per lifetime)-Mental/behavioral health and substance abuse disorder outpatient services (30 visits/year for mental health and substance use combined)The above services include partial day mental health and substance abuse services, intensive outpatient programs, and residential treatment services.
Prescription drugsProvided (subject to preferred drug list, may require prior authorization)Same as state planGeneric, preferred brand, non-preferred brand, and specialty drugs
Rehabilitative and habilitative services and devices-Durable medical equipment, medical supplies, prosthetics and orthotics (some exclusions, some items subject to prior authorization)-Nursing facility (90 day rehab stay)-Physical, occupational, and speech therapy (prior authorization, combined 20 inpatient and outpatient visits per type of therapy per year including both rehab and hab, prior authorization for medically necessary additional visits)Same as state plan -Durable medical equipment, devices, supplies, prosthetics and appliances (some exclusions)-Skilled nursing facility services (90 days/year)-Rehab facilities (60 days/year)-Outpatient rehab and hab services, including physical, occupational, speech, pulmonary, and cardiac rehab therapy (20 visits per type of therapy per year, including both rehab and hab*** for physical, occupational and speech therapy, except 36 visits/year for cardiac rehab)
Long-term services and supports-Long-term care nursing facility services (must meet criteria for “high intensity,” “low intensity” or ICF/IDD, prior authorization, re-evaluated every 6 months)-Home health services, including intermittent or part-time nursing (prior authorization, includes disposable medical supplies) and home health aide services (prior authorization)-Private duty nursing (up to 2,000 hours per year with prior authorization, exceed if medically necessary)Same as state plan-Home health care services*** (100 visits/year, including nurse, therapist, home health aide, and physical, occupational, and speech therapy)-Private duty nursing (2,000 hours/year)
NOTES and SOURCES: *KY uses an ABP for currently eligible beneficiaries (SPA#KY-13-021); KY State Medicaid Plan, available at http://chfs.ky.gov/dms/State+Plan+Amendments.htm; KY New Adult ABP, SPA#KY-13-020, available at www.medicaid.gov. **QHP coverage based on Marketplace EHB benchmark plan, Anthem BCBS Blue 6 Blue Access PPO Medical Option D4 Rx Option G and state required benefits, available at www.cms.gov/CCIIO/Resources/ehb.html; ***KY state required benefit. (Hab services required for autism spectrum disorders).

Back to top

Table 7: Cost-Sharing in Medicaid and the Marketplace in Kentucky
Cost-Sharing TypeMedicaid State PlanMedicaid New Adult ABPMarketplace QHP
Monthly premiums0Same as state plan$117 with APTC($262 without APTC;APTC = $145)
Annual DeductibleN/ASame as state plan$200 with CSR($2,500 without CSR)
Out-of-pocket maximumCost-sharing shall not exceed 5% of total family income for a quarter ($201/quarter, or $804/year, for an individual based on quarterly earnings of 138% FPL)Same as state plan$600/year including deductible with CSR($6,350 without CSR)
Co-pays for selected services-$50.00 per inpatient hospital admission-$4.00 for outpatient hospital services-$3.00 for physician services/office visits with physical and behavioral health providers-$1.00 for preferred and non-preferred generic drugs and atypical anti-psychotics without generic equivalent-$4.00 for preferred brand name drugs without generic equivalent and available under supplemental rebate program-$8.00 for non-preferred brand name drugs-$3.00 per visit for physical, occupational and speech therapy-$4.00 per date of service for durable medical equipmentPreventive services are not subject to co-paysCertain populations are exempt from Medicaid cost-sharing under federal lawSame as state plan-$10 primary care physician visit with CSR, not subject to deductible for 1st 3 visits, 10% after deductible for additional visits($40 without CSR, 1st 3 visits subject to co-pay, additional visits subject to deductible and 10% coinsurance after deductible)-10% after deductible for specialist visit with CSR(same without CSR)-$10 not subject to deductible for generic drugs with CSR($15 without CSR)-$75, then deductible and 10% for emergency room visit with CSR ($200 copay before deductible without CSR)
NOTES: KY QHP information based on single, non-smoker, age 35, 145% FPL ($1,388/month), Jefferson County, Kynect, https://kyenroll.ky.gov/PreScreening/PreScreeningOverView.SOURCES: KY State Medicaid Plan, available at http://chfs.ky.gov/dms/State+Plan+Amendments.htm; APTC based on KFF subsidy calculator, https://www.kff.org/interactive/subsidy-calculator/; CSR for Anthem BCBS Silver DirectAccess PPO – dbds, available at https://www.anthem.com/health-insurance/kentucky/health-plans/.

Back to top

Table 8: Selected Benefits Covered Through Medicaid and the Marketplace in New Jersey
Benefit TypeMedicaid State PlanMedicaid New Adult ABPMarketplace QHP
Mental health and substance use treatment services-Mental health rehab, inpatient, and outpatient services-Inpatient and outpatient substance use services-Mental health clinic services-Methadone maintenance-Partial care-Partial hospitalization-Inpatient psych under 21/over 65-Residential treatment center-Case management-Personal care services for mental health (25 hours/week)-Inpatient mental health and psychiatric services-Inpatient hospital medical detox-Non-hospital based detox (including individual and group counseling)-Outpatient substance use disorder services (including intake, assessment, physician services, individual, group and family counseling)-Substance use partial care (including physician services, lab, individual, group and family counseling),-Substance use intensive outpatient (including physician services, individual, group, and family counseling)-Substance use short-term residential (including individual, group, and family therapy)-Partial hospitalization-Outpatient hospital and clinic mental health services-Community support services-Program of assertive community treatment services-Case management-Community mental health rehab services, including psychiatric emergency rehab-Behavioral health home services-Opioid treatment/maintenance-Mental health adult rehab (group homes)-Mental/behavioral health and substance abuse disorder inpatient services (prior authorized)-Mental/behavioral health and substance abuse disorder outpatient servicesSubstance abuse disorder inpatient and outpatient treatment of alcoholism and coverage of biologically based mental illness are state required benefits
Prescription drugsCoveredSame as state planGeneric, preferred brand, non-preferred brand, and specialty drugs
Rehabilitative and habilitative services and devices-Durable medical equipment-Rehab services (60 consecutive days/year)-Rehab hospital services-Medical suppliesOrthoticsProsthetics-Outpatient rehab, including physical, occupational and speech therapy-Physical, occupational, and speech therapy – rehab and hab (prior authorization)-Home-based habilitative services (§ 1915(i))-Prosthetics (prior authorization above certain dollar amounts)-Outpatient rehab (30 visits/year, prior authorized)-Speech and cognitive therapy (30 visits/year – rehab and hab)-Physical and occupational therapy (30 visits/year – rehab and hab)-Durable medical equipment* (prior authorized)-Autism/DD hab and rehab services* – physical, occupational, and speech therapy (30 visits/year) and applied behavioral analysis (under age 21)
Long-term services and supports-Home health services-ICF/DD-Medical day care-Nursing facility services-Personal care services-Private duty nursing (prior authorization)-Respite care-Skilled nursing facility-Home health services, including nursing, home health aide, medical supplies, equipment, and appliances for home and physical, occupational, and speech therapy-Clinic services – medical day care (12 hours/day, prior authorized)-Adult day health services (§ 1915(i))-Personal care services, including self-direction (40 hours/week)-Nursing facility/skilled nursing facility services (prior authorized)-Home health care services* (60 visits/year, prior authorized, includes private duty nursing and supplies)-Skilled nursing facility (prior authorized)
NOTES/SOURCES: * = state required benefit. State plan benefits information: CMS Special Terms and Conditions, NJ Comprehensive Waiver Demonstration, Attachment B, Demonstration Benefits, Plan A (Oct. 1, 2012-June 30, 2017) (http://www.state.nj.us/humanservices/dmahs/home/CMW_STCs.pdf). NJ New Adult ABP (SPA#13-0028), (www.medicaid.gov).QHP coverage based on Marketplace EHB benchmark plan, Horizon HMO Access HSA Compatible and state required benefits (www.cms.gov/CCIIO/Resources/ehb.html).

Back to top

Table 9: Cost-Sharing in Medicaid and the Marketplace in New Jersey
Cost-Sharing TypeMedicaid State PlanMedicaid New Adult ABPMarketplace QHP
Monthly premiumsNoneSame as state plan$48 with APTC($304 without APTC;APTC = $256)
Annual DeductibleN/ASame as state plan$100
Out-of-pocket maximumN/ASame as state plan$750
Co-pays for selected servicesNoneSame as state plan-$15 primary care physician visit after deductible-$30 specialist visit after deductible-$7 generic drug-$65 ER visit after deductible
NOTES: NJ QHP information based on single, non-smoker, age 35, 145% FPL ($1,388/month), Bergen County, www.healthcare.gov.SOURCES: NJ State Medicaid Plan A information available at http://www.njfamilycare.org/income.aspx; APTC based on KFF subsidy calculator, https://www.kff.org/interactive/subsidy-calculator/; CSR for AmeriHealth NJ Tier 1 Advantage Silver EPO H.S.A., available at www.healthcare.gov.

Back to top

Table 10: Selected Benefits Covered Through Medicaid and the Marketplace in Ohio
Benefit TypeMedicaid State PlanMedicaid New Adult ABPMarketplace QHP
Mental health and substance use treatment services-Inpatient hospital services (including by psychologists; no IMD services for 21-64)-Licensed psychologist services (specified procedures; in non-hospital setting, psychological testing limited to 8 hours/year and therapeutic visits and diagnostic interviews limited to combined 25 service dates/year; diagnostic interview limited to 1 per beneficiary/ year)-Advanced practice nurses’ services (includes psychiatric clinical nurse specialists)-Clinic services, including FFS ambulatory health care clinics for behavioral health-Rehabilitative services provided by community mental health facilities, including:–behavioral health counseling and therapy (52 hours/year)–mental health assessment services (4 hours/year if by non-physician and 2 hours/year if by physician)–pharmacologic management services (24 hours/year)–partial hospitalization (minimum 2 hours and up to maximum 16 hours/day)–crisis intervention mental health services–community psychiatric supportive treatment (104 hours/year; additional hours if medically necessary and prior authorized)-Rehabilitative services provided by alcohol and other drug treatment programs, including:–ambulatory detoxification–assessment–crisis intervention–group counseling*–individual counseling*–intensive outpatient services–laboratory urinalysis–medical/somatic services* (such as physical examinations, health assessments, vital signs, reviewing lab findings, medication administration services, medication assisted treatment and dispensing of medications in an alcohol or other drug treatment program)– opioid agonist administration* Group counseling, individual counseling and medical/somatic services limited to 30 cumulative hours/person/week-Health home services for beneficiaries with a serious mental health condition (available in certain counties, provided by community behavioral health centers), including comprehensive care management, care coordination, health promotion services, comprehensive transitional care services (from inpatient to other settings), individual and family support services, referral to community and social support services-Case management services for people with chronic mental illness and beneficiaries receiving alcohol or substance use disorder treatment program servicesSame as state plan, except that quantitative limits on mental health outpatient services, alcohol and drug intensive outpatient services, and psychologist services do not apply-Mental/behavioral health and substance abuse disorder inpatient services (30 days/year combined for non-biologically based mental illness*)-Mental/behavioral health and substance use disorder outpatient services (30 visits/year combined for non-biologically based mental illness*)These services include partial day and intensive outpatient programs, 2 days of which are equivalent to 1 day inpatient.Substance abuse disorder services limited to 2 inpatient and outpatient rehab programs/year for non-biologically based mental illness.*Biologically based mental illness is covered the same as any other medical service.
Prescription drugsProvided (subject to preferred drug list, may require prior authorization)Same as state planGeneric, preferred brand, non-preferred brand, and specialty drugs
Rehabilitative and habilitative services and devices-Clinic services, including outpatient rehab and speech-language/audiology clinics-Prosthetic devices (require authorization)-Medical supplies, equipment, and appliances suitable for us in the home (some items require prior authorization)-Physical, occupational, and speech therapy/ audiology services (30 visits/year per service type in a non-institutional setting, additional visits prior authorized);-Mechanotherapy services (massage therapy; includes treatment services but not maintenance services)Same as state plan -Skilled nursing facility (90 days/year)-Rehab facilities (60 days/year)-Outpatient rehab (physical, occupational, speech, pulmonary and cardiac rehab; 20 visits/year for each type, except 36 visits for cardiac)-Durable medical equipment, devices, supplies, prosthetics, and appliances (some exclusions)
Long-term services and supports-Nursing facility services (requires level of care)-ICF/IDD services (requires level of care)-Home health services, including intermittent or part-time nursing and home health aide services (limited to combined 8 hours/day together with physical, occupational, and speech therapy and audiology; each service type shall not exceed 4 hours/visit; intermittent or part-time nursing and home health aide services limited to combined 14 hours/week; additional services authorized if medically necessary)-Private duty nursing,* including–skilled care post-hospital services up to 56 hours/week during 60 days after discharge from a 3 day or more inpatient stay (excludes maintenance care)–services for beneficiaries up to age 21 with authorization–services for beneficiaries age 21 and older with authorization who require continuous nursing, including ongoing maintenance care and where beneficiary requires level of care comparable to an institution* PDN visits are typically more than 4 but less than or equal to 12 hours; must be 2 or more hour lapse between home health intermittent or part-time nursing services and PDN, except for unusual occasional circumstance requiring up to 16 hour visit, or if less than 2 hour lapse and the length of PDN services requires the agency to provide a change in staff, or where the PDN service is provided by more than one non-agency provider, or if PDN visits are authorized for 4 hours or less-Case management services for people with developmental disabilitiesSame as state plan-Home health care services, including nurse, therapist, home health aide, physical, occupational, and speech therapy (100 visits/year)-Private duty nursing ($50,000/year; $100,000/lifetime)
SOURCES: OH State Medicaid Plan, available at http://medicaid.ohio.gov/MEDICAID101/MedicaidStatePlan.aspx; APTC; OH New Adult ABP (SPA#13-0032), available at www.medicaid.gov; QHP coverage based on Marketplace EHB benchmark plan, Blue 6 Blue Access PPO Medical Option D4 Rx Option G, and state required benefits summary, available at www.cms.gov/CCIIO/Resources/ehb.html.

Back to top

Table 11: Cost-Sharing in Medicaid and the Marketplace in Ohio
Cost-Sharing TypeMedicaid State PlanMedicaid New Adult ABPMarketplace QHP
Monthly premiums0Same as state plan$49 with APTC($235 w/o APTC; APTC = $186)
Annual DeductibleN/ASame as state plan$100
Out-of-pocket maximumPer federal law, cost-sharing shall not exceed 5% of total family income($201/quarter, or $804/year, for an individual based on quarterly earnings of 138% FPL)Same as state plan$2,250
Co-pays for selected services-$3.00 for prescription drugs not on preferred list-$2.00 for selected single-source prescription drugsSame as state plan-Primary care doctor, specialists, and ER visits: 5% coinsurance after deductible-Generic prescription drugs: $5 copay after deductible
NOTES: OH QHP information based on single, non-smoker, age 35, 145% FPL ($1,388/month), Cuyahoga County, www.healthcare.gov. QHP cost-sharing reflects cost-sharing reduction subsidies.SOURCES: OH State Medicaid Plan, available at http://medicaid.ohio.gov/MEDICAID101/MedicaidStatePlan.aspx; APTC based on KFF subsidy calculator, https://www.kff.org/interactive/subsidy-calculator/; CSR for Kaiser Foundation Health Plan Silver 1750/25%/H.S.A., available at www.healthcare.gov.

Back to top

Appendices: Appendix 2

Methodology for Selecting Representative QHPs for Cost-Sharing Analysis

Differences among states in terms of both Marketplace design choices and readily available public sources of information about Marketplace coverage led to slight differences in the methodology used to select the QHP in each state for purposes of the cost-sharing analysis. A silver level plan offered in 2014, in the county with the largest population in each state was selected, as that is the metal tier to which premium subsidies are tied. Specifically, the representative QHP was selected from the plans available for a single, 40 year old, non-smoker, with income at 145% FPL.

California has chosen to be an active purchaser in its state-based Marketplace and has standardized deductibles, out-of-pocket maximums, and co-payments for all QHPs in each metal tier. As a result, the silver level plan with the least expensive premium was selected for California. New Jersey and Ohio are both FFM states, and the silver plan with the least expensive premium was selected in each of these states.

Kentucky has a state-based Marketplace and as of spring 2014, did not provide information about premium tax credit or cost-sharing reduction amounts when presenting QHP information on its website. The Kaiser Family Foundation’s subsidy calculator was used to determine premium tax credit amounts for this analysis in Kentucky. Among the three insurers offering silver level plans in the county with the largest population in Kentucky in 2014, only one provided cost-sharing reduction information on the insurer’s own website. While there were plans with less expensive premiums for purchase in Kentucky, no cost-sharing reduction information for these plans was readily available. Among the five silver plans (offered by the same issuer) with cost-sharing information available, the plan with the second least expensive premium was selected as representative. This was due to differences in how cost-sharing is structured in the selected plan as compared to the plan with the least expensive premium. Specifically, the selected plan covers some services, such as three doctor’s visits and prescription drugs, with just a co-payment, without the need to first meet a deductible, while the plan with the least expensive premium for which cost-sharing reduction information was available applies the deductible to all covered services.

Appendices: Appendix 3

Hypothetical 1: Susan, age 21, Diagnosed with mild cerebral palsy (CP)

Education and Work History: After graduating from high school, Susan enrolled in a local community college.   She received her Associate’s degree and then transferred to a four-year college to complete her Bachelor’s degree. At that point, she moved out of her parents’ house to attend school and live on her own.

While attending community college, Susan worked as a cashier at a retail clothing store in a local mall. She worked 25 hours per week, earning $8.25 per hour, with annual earnings of $10,725, or about 92% of the federal poverty level for a single adult in 2014. She continued this job during her junior year of college to cover her living expenses and tuition costs that were not covered by grants and student loans.

In her senior year of college, Susan was offered a job as a bookkeeper. She continued working 25 hours per week, but earned $13 per hour in her new job, with annual earnings of $16,900, or approximately 145% FPL in 2014.

Health Insurance Coverage: While living with her parents, Susan was covered under a family health insurance policy that her parents purchased in the individual market, and her parents paid out-of-pocket for all of her disability-related expenses that were not covered by the policy. Susan’s parents now receive employer-sponsored health insurance through their respective jobs. Neither of their policies offers coverage for dependent family members, so Susan was unable to maintain coverage through her parents’ insurance.

Susan’s state expanded Medicaid as of January 2014. While working as a cashier, Susan qualified for Medicaid as a newly eligible adult with earnings below 138% FPL. When she changed jobs and started working as a bookkeeper, Susan became eligible for Marketplace coverage with premium tax credits and cost-sharing reductions.

Health History: Susan’s needs for acute physical health and preventive services are the same as those of other, healthy young adults. She also has some additional medical needs associated with her CP diagnosis. A common symptom of CP is paralysis, which varies significantly across individuals. Susan is able to walk but uses crutches or a power scooter when she travels significant distances, including getting around campus. She takes prescription medication to control muscle spasticity, which is a common condition secondary to CP. The muscle spasticity results in lack of fine motor control, which makes brushing her teeth difficult, and she also has dental issues related to tooth grinding, another complication of muscle spasticity. Because her vision is affected by her CP, she wears prescription eyeglasses.

Susan receives physical therapy twice a month to manage contractures stemming from muscle spasticity. Her physician believes she would benefit from weekly physical therapy and monthly occupational therapy to improve her fine motor skills. However, her coverage for these services was limited to 20 visits per year under her family’s health insurance policy, so she has not received more frequent visits. Since she is relatively young, she has not yet experienced additional complications from her abnormal gait, but she is at risk for developing chronic joint pain and degeneration from the additional strain on her legs due to her gait and on her shoulders due to long-term use of crutches, which could require additional physical therapy.

Because Susan’s fine motor skills are mildly impaired, her family sometimes helped her button or tie clothing, prepare meals and do laundry. Susan had no plan for seeking assistance with these needs when she went away to college, so they will likely be unmet, or performed to the best of her ability, without formal personal care services in place.

While she is not currently in treatment for mental health issues, Susan was bullied in school because of her gait and use of crutches. She may have undiagnosed mild depression and/or anxiety as a result and might benefit from mental health diagnostic services, and if warranted, treatment.

Hypothetical 2: John, age 35, Diagnosed with clinical depression

Education and Work History: John is a high school graduate with a limited work history as a day laborer for a local construction company. The company has employed John seasonally, and in three of the last five years, he earned approximately $15,000 per year, or about 129% FPL for a single adult in 2014. In two of the last five years, due to the economic downturn and bad weather, John’s earnings have been as low as $9,000 per year, or about 77% FPL in 2014.

John was recently offered a year-round job as an assistant to an auto mechanic. The position pays $8.15/hour for a 40-hour work week.. If he takes this job, John would make $16,952 a year, or about 145% FPL in 2014. John prefers working outdoors and feels better when he is not inside all day, but the consistent schedule and regular pay offered by the auto mechanic job is appealing to him.

Health Insurance Coverage: None of John’s past jobs have offered health insurance, and as a single adult without dependent children, he did not qualify for Medicaid before his state implemented the ACA’s Medicaid expansion in January 2014. Based on his current earnings of 129% FPL, he is eligible for Medicaid in 2014. If he accepts the auto mechanic job, John will become eligible for Marketplace coverage with premium tax credits and cost-sharing reductions.

Health History: John was first diagnosed with depression after a failed suicide attempt at age 32 when he was taken to the emergency department and involuntarily committed to inpatient treatment. The hospital released him after 72 hours of observation when the psychiatric staff determined that he was no longer a danger to himself.

John needs regular doctor appointments and takes a prescription anti-depressant medication.   When he was uninsured (prior to becoming eligible for Medicaid through the expansion), John was unable to take his medication consistently, because it is expensive for him to afford out-of-pocket. John’s doctor has encouraged him to seek individual and group therapy, but he has been unable to follow up on this recommendation because he was uninsured and unable to pay out-of-pocket. .

While uninsured, John visited the doctor when he is physically ill and paid out-of-pocket when he had the resources. Otherwise, his health care-related expenses went unmet. He also could benefit from regular preventive health care services.

Hypothetical 3: Mary, age 40, Diagnosed with multiple sclerosis (MS)

Education and Work History: Mary finished high school but never went to college. She recently divorced and has no children. She currently rents a two-bedroom apartment with a friend. Most of her jobs have been in food preparation, and she currently works at a fast-food restaurant. Mary works 30 hours a week at $8.25 per hour, with annual earnings of approximately $12,870, or about 110% FPL for a single adult in 2014. She has not been able to find full-time work.

Mary recently began looking for a second job since her current employer is unable to give her any additional hours. She decided to take a job selling tickets at a movie theater on the weekends, where she will earn $8.50 per hour. She will work 9 hours per week, earning$3,978 per year and bringing her total annual income to $16,848, or nearly 145% FPL in 2014.

Health Insurance Coverage: Mary has been uninsured all of her adult life. When she recently was admitted to the hospital, a social worker helped her apply for health insurance. Because her state implemented the ACA’s expansion, she is eligible for Medicaid while she is working at the fast-food restaurant. However, once Mary takes her second job, she will become eligible for Marketplace coverage with tax credits and cost-sharing reductions.

Health History: Mary’s lack of health insurance and limited income have made it difficult for her to afford basic preventive health care, such as annual physical examinations. She only seeks medical care when the need is critical, and she does not have a regular primary care provider.

In January 2014, she visited the emergency department after experiencing an extended bout of blurred vision and muscle weakness. She previously noticed these symptoms, but they typically lasted less than a day. With recurring symptoms and a marked reduction in her ability to lift her left arm, Mary decided to seek medical care. She was admitted to the hospital for additional evaluation, including a visit from a neurologist. During the hospital stay, the neurologist conducted a battery of tests, including an MRI. Although her symptoms resolved by the time she was released from the hospital, the tests revealed that she had multiple sclerosis, and the neurologist gave her the formal diagnosis.

After her discharge, she followed up with the neurologist as an outpatient. The neurologist recommended that she begin receiving regular doses of an injectable drug to slow the progression of the disease. He also referred her to a physical therapist for regular treatment of her muscular weakness and ordered some additional tests to assess the extent of impairment in her vision and fine motor functioning.

Mary does not currently need assistance with activities of daily living as her symptoms of muscle weakness and blurred vision typically do not interfere with her ability to work and take care of herself at home. However, if her symptoms worsen, they are likely to interfere with her ability to continue to work.


Endnotes

  1. U.S. Dep’t of Labor, Bureau of Labor Statistics, Persons with a Disability: Labor Force Characteristics Summary, Table A (June 11, 2014) (includes non-institutionalized people ages 16-64), available at http://www.bls.gov/news.release/disabl.nr0.htm. ↩︎
  2. Social Security Administration, The Work Site, Ticket Program Information, available at http://www.ssa.gov/work/home.html. ↩︎
  3. U.S. Dep’t of Labor, Office of Disability Employment Policy, Job Accommodation Network, Vocational Rehabilitation Agencies, available at http://askjan.org/cgi-win/TypeQuery.exe?902. ↩︎
  4. Kaiser Commission on Medicaid and the Uninsured, The Affordable Care Act’s Impact on Medicaid Eligibility, Enrollment, and Benefits for People with Disabilities (April 2014), available at https://modern.kff.org/health-reform/issue-brief/the-affordable-care-acts-impact-on-medicaid-eligibility-enrollment-and-benefits-for-people-with-disabilities/. ↩︎
  5. Kaiser Commission on Medicaid and the Uninsured, A Guide to the Supreme Court’s Decision on the ACA’s Medicaid Expansion (Aug. 2012), available at https://modern.kff.org/health-reform/issue-brief/a-guide-to-the-supreme-courts-decision/. ↩︎
  6. Kaiser Commission on Medicaid and the Uninsured, Medicaid Enrollment and Expenditures by Federal Core Requirements and State Options (Jan. 2012), available at https://modern.kff.org/medicaid/issue-brief/medicaid-enrollment-and-expenditures-by-federal-core/. ↩︎
  7. 42 U.S.C. § 1396a(k)(1); 42 C.F.R. § § 440.300-440.390. ↩︎
  8. Kaiser Commission on Medicaid and the Uninsured, Premiums and Cost-Sharing in Medicaid (Feb. 2013), available at https://modern.kff.org/medicaid/issue-brief/premiums-and-cost-sharing-in-medicaid/; see also 42 C.F.R. § § 447.50-447.88. ↩︎
  9. Kaiser Family Foundation Subsidy Calculator, available at https://modern.kff.org/interactive/subsidy-calculator/. ↩︎
News Release

Shifting Views on Same-Sex Marriage, Marijuana and End-of-Life Issues 

Published: Oct 15, 2014

In his latest column for The Wall Street Journal’s Think Tank, Drew Altman examines three areas of American life where public attitudes have been steadily changing – same sex marriage, marijuana, and end of life issues – and discusses the implications for policy and law.

All previous columns by Drew Altman are available online.

News Release

States Expanding Medicaid Under the Affordable Care Act Expect 18% Enrollment Growth in Fiscal Year 2015, With Federal Funds Picking Up Most of the Cost

Published: Oct 14, 2014

Without the Expansion and Resulting Infusion of Federal Funds, Non-Expansion States Expect Much Smaller Enrollment Increases and Spending Growth

50-State Survey Finds ACA and Delivery System Reforms are Primary Focus for State Medicaid Programs in FY 2014 and FY 2015

MENLO PARK, Calif. – States expect the number of people enrolled in Medicaid will increase an average of 13.2 percent across the country in state fiscal year 2015 (which runs through June in most states), showing the early effects of the first full year of Affordable Care Act implementation, according to the 14th annual 50-State Medicaid budget survey by the Kaiser Family Foundation’s Commission on Medicaid and the Uninsured (KCMU).

The 28 states (including the District of Columbia) implementing the Medicaid expansion for FY 2015 expect to see the largest enrollment and spending growth — an 18 percent increase in enrollment and an 18.3 percent increase in total Medicaid spending in FY 2015, on average. The spending growth is mostly driven by the boost in new enrollment that is financed by 100 percent federal funds. With the additional federal dollars, state spending in expansion states is projected to increase at a slower rate of 4.4 percent in FY 2015.

Without the coverage expansion and federal funding, the 23 states not implementing the ACA Medicaid expansion project an average 5.2 percent enrollment growth for fiscal year 2015, and project state spending to increase at a similar rate as their total Medicaid spending (6.8% and 6.5%, respectively).

10.08.14_-_Medicaid_-_Event_and_Reports_-_Expansion_states_expect_to_see_higher_enrollment_growth_-_resized_for_the_email

Based on the survey of state Medicaid directors, the Medicaid enrollment and spending report also provides estimates for Medicaid enrollment and spending growth in fiscal year 2014.

A second report drawn from the 50-state survey, jointly released with the National Association of Medicaid Directors (NAMD), examines major policy actions implemented or planned for state Medicaid programs.  It shows that the implementation of the ACA and delivery system reforms are the main focus for state Medicaid directors in fiscal years 2014 and 2015.

“Whether a state elected to expand or not, Medicaid programs across the nation are being transformed with new enrollment procedures and outreach efforts combined with increased emphasis on delivery systems reforms,” said Diane Rowland, Executive Vice President of the Foundation and Executive Director of the KCMU.

All states are implementing a host of ACA-related changes that require states to streamline Medicaid enrollment and renewal processes, transition to a uniform income eligibility standard and coordinate with new ACA insurance Marketplaces. State Medicaid officials reported continued growth in managed care initiatives and other delivery system reforms, including the implementation or expansion of Medicaid health homes, patient-centered medical homes, and initiatives to integrate care and financing for the dual eligible beneficiaries. The majority of states also reported expanding services in a home or community-based setting for persons needing long term care. With improvements in the economy, more states were implementing provider rate and benefit enhancements.

10.08.14_-_Medicaid_-_Event_and_Reports_-_Focus_on_delivery_system_reforms_in_Medicaid_-_resized_for_email

Findings, reports released at a public briefing today

The 50-state survey of state Medicaid directors was conducted by KCMU and Health Management Associates (HMA), with the cooperation of NAMD. These and other findings from the survey were discussed today at a public briefing held jointly by Kaiser and the NAMD. The following new reports based on the survey are available:

An archived webcast of the briefing, as well as copies of presentation slides and other materials, will be available online later today.

Medicaid spending and enrollment are affected by changes in economic conditions and policy.

Published: Oct 14, 2014

Source

SOURCE: Medicaid Enrollment June 2013 Data Snapshot, KCMU, January 2014. Spending Data from KCMU Analysis of CMS Form 64 Data for Historic Medicaid Growth Rates.  FY 2014 and 2015 data based on KCMU survey of Medicaid officials in 50 states and DC conducted by Health Management Associates, October 2014.

Implementing the ACA: Medicaid Spending & Enrollment Growth for FY 2014 and FY 2015

Authors: Robin Rudowitz, Laura Snyder, and Vernon K. Smith, Kathleen Gifford, and Eileen Ellis
Published: Oct 14, 2014

Executive Summary

Medicaid spending and enrollment growth are affected by both the economy and policy decisions determining who is covered under the program, the services provided and payments for care. For more than a decade, economic conditions, including two major recessions, were the primary driver of changes in Medicaid spending and enrollment. In FY 2014 and in budgets adopted for FY 2015, enrollment and spending have grown with implementation of the major coverage provisions in the Affordable Care Act (ACA), including the federally financed Medicaid expansion. This report provides an overview of Medicaid spending and enrollment growth with a focus on state fiscal years 2014 and 2015 (FY 2014 and FY 2015) and an overview of Medicaid financing. Findings are based on interviews and data provided by state Medicaid directors as part of the 14th annual survey of Medicaid directors in all 50 states and the District of Columbia conducted by the Kaiser Commission on Medicaid and the Uninsured (KCMU) with Health Management Associates (HMA). Findings examine changes in overall enrollment and spending growth and compare expansion and non-expansion states.

All States

Implementation of the coverage expansions in the ACA are resulting in higher enrollment and total overall spending growth in Medicaid in FY 2014 and FY 2015. However, with full federal government financing of the Medicaid expansion population, state Medicaid spending is growing more slowly than total spending. In FY 2014, enrollment increased on average by 8.3 percent, faster than FY 2012 and FY 2013. Enrollment growth is due to the ACA expansions of coverage in states implementing the Medicaid expansion and increases in participation among individuals eligible under rules in place before the ACA across all states. Medicaid is jointly financed by states and the federal government. Based on a formula set in statute, the federal share ranges from a floor of 50 percent to a high of 73.6 percent in FFY 2015, with the federal government paying a higher share in poorer states. For states that implement the ACA Medicaid expansion up to 138 percent of poverty (a requirement that was effectively made optional by the Supreme Court decision) the federal government will pay 100 percent of the costs of those newly eligible from 2014-2016; that rate phases down to 90 percent in 2020 and beyond. In FY 2014, new coverage and spending at the enhanced match rate contributed to overall Medicaid spending growth of 10.2 percent, but resulted in slower state Medicaid spending across all states (6.4 percent). Total and state spending for Medicaid generally grow at similar rates when there are no changes in the federal match.  The coverage provisions of the ACA went into effect in January 2014, mid-way through the state fiscal year which begins on July 1 in most states.  The effect of the ACA is more pronounced in FY 2015 when the law is in effect for the entire state fiscal year. (Figure 1)

Figure 1: ACA related enrollment and spending drive overall Medicaid growth.

Expansion States

As anticipated, states implementing the Medicaid expansion are experiencing higher rates of enrollment growth and total spending growth in FY 2014 and FY 2015 due to higher coverage levels and access to enhanced federal matching funds. Across all states implementing the ACA Medicaid expansion in FY 2014 and FY 2015, enrollment growth averaged 12.2 percent and 18.0 percent, respectively, well above national averages. Expansion states also reported higher total spending growth relative to the national average in both years. The enhanced federal funds available to states implementing the Medicaid expansion results in large differences between total spending and state spending growth. The effects on enrollment and spending are more pronounced in FY 2015 when the ACA is in effect for the entire state fiscal year. In addition, the number of states implementing the Medicaid expansion increases from 26 to 28 as New Hampshire and Pennsylvania implement in FY 2015. (Figure 2)

Figure 2: Expansion states report higher enrollment and total spending tied to the ACA, but lower rates of state spending.

Non-Expansion States

States not implementing the Medicaid expansion report lower enrollment growth compared to expansion states with total and state spending growing at similar rates. In FY 2014, across all states not implementing the ACA Medicaid expansion, enrollment growth averaged 2.8 percent. States reported that this relatively low rate of enrollment growth reflected an improving economy as well as processing backlogs due to problems with enrollment systems and account transfers. For FY 2015, enrollment growth is projected to average 5.2 percent across non-expansion states, as system issues are resolved and these states (like expansion states) experience increased participation among individuals eligible under pre-ACA rules. Without the effect of the enhanced ACA match rate, total and state spending on Medicaid are growing at similar rates in FY 2014 and FY 2015. (Figure 3)

Figure 3: Non expansion states report more consistent growth rates across enrollment, total spending and state spending.

Looking ahead beyond 2015. The economy, ACA implementation and other Medicaid policy changes (such as major payment and delivery system reform efforts) are expected to have a significant effect on Medicaid spending and enrollment trends across all states.

Issue Brief

Medicaid Enrollment and Spending Growth

Economic Conditions

Over the past 15 years, Medicaid enrollment increased substantially during two major recessions, with annual growth peaking in FY 2001 at over 9 percent, and again at nearly 8 percent in FY 2009. During economic downturns, individuals lose jobs, incomes decline and more people qualify and enroll in Medicaid which increases program spending. At the same time, economic downturns negatively affect state tax revenues. This places additional pressure on state budgets as demand for other forms of assistance (i.e. food stamps and unemployment benefits) also increases. During economic downturns, states face difficulty balancing these pressures and affording their share of Medicaid spending increases.

In response, Congress has twice passed temporary increases to the FMAP rates to help support states during economic downturns, most recently in 2009 as part of the American Recovery and Reinvestment Act (ARRA.)  The most significant source of fiscal relief to states in ARRA was a temporary increase in the federal share of Medicaid costs. To be eligible for ARRA funds, states could not restrict eligibility or tighten enrollment procedures in Medicaid or CHIP. The ARRA-enhanced match rates provided states with over $100 billion in additional federal funds over 11 quarters, ending in June 2011, as states were on the threshold of FY 2012.

State economies have demonstrated slow but sustained improvement following the worst recession since the Great Depression. Gross State Product (GSP,) a measure of state economic activity, grew by 1.8 percent from 2012 to 2013 at the national level, slightly slower than the previous year, but the fourth year of consecutive growth at the national level. All but two states (Alaska and DC) experienced positive GSP growth from 2012 to 2013, ranging up to 9.7 percent.

At the same time, the national unemployment rate has continued to decline, falling to 5.9 percent in September 2014, the lowest rate since July 2008.1  The declining rate of unemployment was related both to a reduction in the labor force participation rate and to continued job growth.2  After 55 months of private-sector job growth, there were 1.6 million more private sector jobs in August 2014 than before the recession.3  From February 2010 to August 2014, private sector job growth increased by an average pace of 188,000 jobs a month, with the pace picking up during the last seven months (227,000 jobs a month). Despite the improving economy, an estimated 9.3 million people remain unemployed, over 30 percent of whom are long-term unemployed (those actively looking for work for 27+ weeks.4 ) While unemployment has declined, 11 states (including DC) had rates at or above seven percent in August 2014. (Figure 4)

Figure 4: Unemployment rates have declined in most states, though remain high in a few.

On the whole, state revenue collections have also improved. After experiencing the sharpest decline in state tax revenues on record during the Great Recession, states had seen sixteen consecutive quarters of tax revenue growth before declining slightly in the first and second quarters of 2014 (-0.3 percent and -0.5 percent.) (Figure 5) These declines in 2014 were primarily driven by federal tax policy changes that went into effect in 2013 as well as changes in tax policy in some states largely affecting personal income tax collections. Other sources of tax revenues, such as sales taxes, showed continued growth.5 

Figure 5: State tax revenues had grown for 16 consecutive quarters before declining slightly in the first quarters of 2014.

With the economy continuing to improve, Medicaid enrollment growth across the country slowed considerably in FY 2012 and FY 2013. Over those two years, average spending also slowed, but the end of the ARRA enhanced match rates at the end of SFY 2011 shifted state spending patterns as states tried to mitigate the loss of federal dollars in SFY 2012 resulting in a dip in spending in SFY 2012. With economic conditions improving, the largest driver of Medicaid enrollment and spending growth during fiscal years 2014 and 2015 has been related to the implementation of the ACA. (Figure 6)

Figure 6: Medicaid spending and enrollment are affected by changes in economic conditions and policy.
The Affordable Care Act (ACA)

As enacted, the ACA broadened Medicaid’s role, making it the foundation of coverage for nearly all low-income Americans with incomes up to 138 percent of the federal poverty level (FPL) ($16,105 per year for an individual in 2014). However, the Supreme Court ruling on the ACA effectively made the decision to implement the Medicaid expansion an option for states. For states that expand Medicaid, the federal government will pay 100 percent of Medicaid costs of those newly eligible for Medicaid for up to three calendar years from 2014 to 2016. The federal share phases down to 95 percent in 2017, 94 percent in 2018, 93 percent in 2019 and 90 percent in 2020 and remains at 90 percent thereafter, well above traditional FMAP rates in every state. (See Appendix for more information on Medicaid financing).

While nearly all states saw enrollment increases due to changes in enrollment systems and increased outreach, much of the enrollment growth (and related spending growth) nationally was driven by states adopting the Medicaid expansion, which states could implement starting January 1, 2014, halfway through FY 2014 for most states.

During FY 2014, 26 states (including DC) implemented the ACA Medicaid expansion. In FY 2015, two additional states are implementing the Medicaid expansion – New Hampshire in July 2014 and Pennsylvania in January 2015 – bringing the total to 28 states. Other states continue to discuss the opportunity to extend Medicaid under the financial terms spelled out in the ACA, including state-specific approaches. Indiana has submitted a waiver proposal to expand Medicaid through the “Healthy Indiana 2.0” plan in 2015 and Utah is in active negotiations with CMS to use an alternative approach for the Medicaid expansion. Other states expect to consider the issue in legislative sessions in 2015. (Figure 7)

Figure 7: More than half of states are implementing the Medicaid expansion while debate continues in other states.

Medicaid Enrollment Growth FY 2014-FY 2015

Medicaid enrollment increased on average by 8.3 percent in FY 2014 across all states, slightly less than the 8.8 percent growth states had projected on average at the beginning of the fiscal year.6  These slightly slower rates could be partially due to enrollment system problems, particularly with Healthcare.gov in the earlier months of open enrollment for coverage in the Marketplace. Enrollment growth in FY 2014 was faster than FY 2012 and FY 2013 due to the implementation of the ACA mid-way through state fiscal year 2014. All states, regardless of their decisions to implement the Medicaid expansion, attributed enrollment growth to higher take up among those already eligible, due to referrals from the health insurance Marketplaces and greater awareness of Medicaid due to outreach and publicity surrounding the ACA coverage expansions. The ACA Medicaid expansion was a driver of significant enrollment growth in states that implemented it, driving up the national average as well. Already, higher enrollment in Medicaid in 2014 has contributed to recent declines in the number of non-elderly adults who are uninsured.7 ,8 

States with the largest increases in Medicaid coverage in FY 2014 were those that implemented the ACA Medicaid expansion. States expanding Medicaid averaged enrollment growth of 12.2 percent in FY 2014, compared to growth among states not expanding that averaged 2.8 percent. (Figure 11) A total of seven expansion states experienced annual Medicaid enrollment growth in FY 2014 exceeding 20 percent (Arkansas, Colorado, Kentucky, Maryland, Nevada, Oregon and West Virginia.) Only four states (all non-expansion states) reported declines in Medicaid enrollment in FY 2014 (Louisiana, Missouri, Nebraska and Oklahoma).

In FY 2015, Medicaid enrollment is projected to increase across all states at a higher rate (12.2%) than in FY 2014 (8.3%), reflecting the first full year’s impact of the eligibility and enrollment changes in the ACA. This rate of growth is driven by continued increases in enrollment primarily in states adopting the ACA Medicaid expansion. Across the 28 states implementing the Medicaid expansion in FY 2015, the number of persons enrolled in Medicaid is expected to increase on average by 18.0 percent while enrollment growth across the 23 non-expansion states is projected to average 5.2 percent. (Figure 8)

Figure 8: Medicaid enrollment growth was substantially higher in states that expanded.

States that implemented the Medicaid expansion estimated the portion of their total enrollment growth that was attributable to newly eligible individuals. The median estimate was that approximately 80 percent of the observed growth in enrollment was attributable to newly eligible enrollees, and 20 percent was attributable to those already eligible but not previously enrolled. A few states that had expanded coverage to adults before the ACA (e.g. Massachusetts, Minnesota, and New York) noted a much smaller share of enrollment growth attributable to the Medicaid expansion. Both expansion and non-expansion states noted higher take-up rates among persons who were eligible under pre-ACA eligibility rules, as individuals were referred to Medicaid from the new health insurance marketplaces, or responded to widespread publicity about the implementation of the ACA coverage options. A small number of states noted that without the ACA Medicaid expansion, enrollment might have declined due to the improving economy.

TOTAL SPENDING GROWTH FY 2014-FY 2015

Total Medicaid spending growth in FY 2014 increased across all states on average by 10.2 percent, virtually identical to the 10.3 percent originally appropriated by state legislatures. The primary factor listed by state officials as contributing to this growth in spending was enrollment growth driven by the ACA-related eligibility changes. While total spending growth increased at higher rates than previous years across all states due to increased enrollment, states that implemented the ACA Medicaid expansion reported significantly higher rates of growth in total spending (13.1%) than states that did not implement the Medicaid expansion (5.6%). (Figure 9) Total spending growth was right on target with state projections in the states that expanded in FY 2014; total spending growth for states that did not expand was substantially lower than original projections (5.6% growth reported compared to 6.8% projected).9   The coverage provisions of the ACA went into effect in January 2014, mid-way through the state fiscal year which begins on July 1 in most states.

In FY 2015 across all states, total Medicaid spending is projected to grow on average by 14.3 percent based on adopted budgets for FY 2015. Looking specifically at the 28 states that are implementing the ACA Medicaid expansion, total Medicaid spending was appropriated to increase on average by 18.3 percent. In comparison, across the 23 states not implementing the ACA Medicaid expansion at this time, spending growth was appropriated to increase on average by 6.5 percent. (Figure 9) The larger differential between growth rates for expanding and non-expanding states in FY 2015 was expected as it reflects the first full year of the Medicaid expansion.

Figure 9: Medicaid total spending growth was higher among states that expanded, due to the increase in federal funds.

Medicaid officials in the majority of states believed that the amount of funding legislatively appropriated for their Medicaid program for FY 2015 would be adequate. In only about one-quarter of states did officials believe that a Medicaid shortfall was likely. This is the second consecutive year in which the majority of Medicaid officials expressed confidence in the adequacy of the original legislative authorization for the upcoming year, which is a turnaround from the Medicaid experience during the recent recession when a majority of Medicaid officials expected a Medicaid budget shortfall at the start of each fiscal year.

State Spending for Medicaid

Historically, state and federal Medicaid spending have increased at similar rates. Differences between total and state spending growth are usually related to factors such as annual changes in the state-specific FMAPs, changes in contributions from local governments, special financing arrangements, or provider taxes. During the last two recessions, Congress enacted temporary enhancements to the FMAP to provide fiscal relief to states by reducing the state share of Medicaid spending. Due to this relief, there was a historic decline in state spending for Medicaid in FY 2009 and FY 2010 followed by substantial increases in FYs 2011 and 2012 due to the expiration of the enhanced-match rate. For FY 2014, state fund spending for Medicaid increased on average by 6.4 percent across all states compared to total spending growth of 10.2 percent. For FY 2015, state fund spending is projected to grow on average across all states by 5.2 percent, compared to total spending growth of 14.3 percent. The large gap between total and state spending growth is attributable to the higher FMAP available in states implementing the ACA Medicaid expansion. (Figure 10)

Figure 10: Total and state funds for Medicaid generally grow at similar rates, except when there are statutory changes in the FMAP.

For expanding states, total Medicaid spending generally will grow at a rate similar to enrollment growth; state spending for Medicaid will grow more slowly due to the higher federal match for newly eligible individuals. In FY 2014, across states implementing the Medicaid expansion, total Medicaid spending increased on average by 13.1 percent, nearly double the rate of state spending growth of 6.6 percent. This pattern continues into FY 2015, but is more dramatic with the enhanced 100 percent federal match rate in effect for the entire fiscal year in most of the expansion states. States expanding Medicaid are expecting total Medicaid spending growth of 18.3 percent on average in FY 2015 –more than four times the rate of growth of state Medicaid spending in these states (4.4%). (Figure 11) Some states implementing the Medicaid expansion also noted they will see savings of state dollars in their Medicaid budget when individuals previously enrolled in limited-benefit, regular FMAP state Medicaid programs now gain full Medicaid coverage and thereby qualify for the “newly-eligible 100 percent match rate.”

Figure 11: Expansion states report higher enrollment and total spending tied to the ACA, but lower rates of state spending.

States not implementing the expansion saw total Medicaid spending in FY 2014 increase by 5.6 percent and state spending increase on average by 6.1 percent – somewhat similar rates of growth, particularly in comparison to the rates of spending growth seen in expansion states. Both total and state spending growth rates for non-expanding states exceeded enrollment growth of 2.8 percent. Total and state spending for non-expanding states are expected to continue growth in FY 2015, again at similar rates (6.5 percent for total spending and 6.8 percent for state spending) as enrollment growth is expected to increase on average by 5.2 percent. (Figure 12)  Beyond the ACA changes such as the MAGI eligibility rules, increased publicity and the interface with the new Marketplaces, another important factor affecting state spending in FY 2014 and FY 2015 were changes in state FMAP rates due to annual updates to the formula.10  These factors contribute to differences between total and state spending growth across all states, but are primarily evident across states not adopting the ACA Medicaid expansion in FY 2014 and FY 2015.

Figure 12: Non expansion states report more consistent growth rates across enrollment, total spending and state spending.

In addition to increases in health coverage and reductions in the number of uninsured, state decisions about the Medicaid expansions have important fiscal implications due in part to the increase in federal funds to the state that support health care providers including hospitals, health centers, and nursing facilities, and other businesses, and have positive effects on jobs, household spending, and state and local tax collections.11 

In this year’s survey, states expanding Medicaid also typically cited net state budget savings beyond Medicaid. States reported that expanded coverage through Medicaid could allow for reductions in state spending for services such as mental health, correctional health, state-funded programs for the uninsured and uncompensated care. These savings are outside the Medicaid program and Medicaid spending and enrollment data included in this report. States also referenced studies that projected drops in the number of uninsured and increases in state economic activity.12  (Figure 13)

Figure 13: The Medicaid expansion has coverage and fiscal implications for states.

Looking Ahead

Medicaid enrollment and spending trends have been largely driven by economic conditions, including two major recessions since 2000. In FYs 2012 and 2013, as economic conditions increasingly showed signs of improvement, states saw Medicaid enrollment growth slow. As anticipated, in FY 2014 and in budgets adopted for FY 2015, spending and enrollment have increased at a faster pace largely due to the implementation of the ACA’s major coverage provisions. Widespread outreach efforts and simplified enrollment procedures contributed to enrollment growth across all states. However, states that implemented the Medicaid expansion experienced substantially higher growth in enrollment compared to states that did not implement the ACA expansion in 2014. Total Medicaid spending also increased substantially, driven by increases in states implementing the Medicaid expansion, although the growth in these states was primarily driven by enrollment of the fully-federally-funded, newly eligible population. Medicaid spending from state funds increased at far lower rates than total Medicaid spending in states that implemented the Medicaid expansion. Looking ahead, the economy, ACA implementation and other Medicaid policy changes (such as major payment and delivery system reform efforts) are expected to continue to have a significant effect on future Medicaid spending and enrollment trends.

This Kaiser Commission on Medicaid and the Uninsured brief was prepared by Robin Rudowitz and Laura Snyder from the Kaiser Family Foundation, and Vernon K. Smith, Ph.D., Kathleen Gifford and Eileen Ellis with Health Management Associates.The authors express their appreciation to Dennis Roberts, who managed the database. We also thank the Medicaid directors and staff in all 50 states and the District of Columbia who completed the survey on which this brief is based.

Methodology

Definition of Medicaid Spending. Total Medicaid spending includes all payments to Medicaid providers for Medicaid covered services provided to enrolled Medicaid beneficiaries. In addition, total Medicaid spending includes special payments to “disproportionate share hospitals” (“DSH payments”) that subsidize uncompensated care for persons who are uninsured and unreimbursed costs related to care for persons on Medicaid. Not included in total Medicaid spending are Medicaid administrative costs, costs for the Children’s Health Insurance Program (CHIP), and federally mandated state “Clawback” payments to Medicare (to help finance the Medicare Part D prescription drug benefit for beneficiaries who are dually enrolled in both Medicare and Medicaid.) Total Medicaid spending includes payments financed from all sources, including state funds, local contributions and federal match funds.

Methdology. The Kaiser Commission on Medicaid and the Uninsured (KCMU) commissioned Health Management Associates (HMA) to survey Medicaid directors in all 50 states and the District of Columbia to identify and track trends in Medicaid spending, enrollment and policy making. This was the fourteenth annual survey, conducted at the beginning of each state fiscal year from FY 2002 through FY 2015.

The KCMU/HMA Medicaid survey on which this report is based was conducted from June through August 2014. Medicaid directors and staff provided data for this report in response to a written survey and a follow-up telephone interview. The survey was sent to each Medicaid director in June 2014. All 50 states and DC completed surveys and participated in telephone interview discussions in June, July and August 2014. The telephone discussions are an integral part of the survey to ensure complete and accurate responses and to record the complexities of state actions.

Annual rates of growth for Medicaid spending and enrollment were calculated as weighted averages across all states, and for states based on state decisions to implement the ACA Medicaid expansion in 2014 or 2015. For FYs 2014 and 2015, average annual Medicaid spending growth was calculated using weights derived from the most recent state Medicaid expenditure data for fiscal year 2013, based on estimates prepared for KCMU by the Urban Institute using CMS Form 64 reports, adjusted for state fiscal years. These data were also used for historic Medicaid spending. Medicaid enrollment average annual growth rates were calculated using weights based on state enrollment data for June 2013.13 

Because the data reported here for FYs 2014 and 2015 are weighted averages derived from Medicaid spending and enrollment, data reported for states with larger spending and enrollment have a larger effect on the national average. These effects are further amplified when looking at smaller groups of states, such as states implementing the Medicaid expansion and those that have not.

Additional information collected in the survey on policy actions taken during FY 2014 and FY 2015 can be found in the following report: https://www.kff.org/medicaid/report/medicaid-in-an-era-of-health-delivery-system-reform-results-from-a-50-state-medicaid-budget-survey-for-state-fiscal-years-2014-and-2015


Appendix

Appendix:  Background on Medicaid Financing

Medicaid Financing Structure

The Medicaid program is jointly funded by states and the federal government. The federal government guarantees match funds to states for qualifying Medicaid expenditures (payments states make for covered Medicaid services provided by qualified providers to eligible Medicaid enrollees.) The federal match rate (Federal Medical Assistance Percentage or FMAP) is calculated annually for each state using a formula set in the Social Security Act which is based on a state’s average personal income relative to the national average; poorer states have higher FMAPs. Personal income data are lagged, so data used for FFY 2015 FMAPs are from the three years of 2010 to 2012. According to the formula, the FMAP in FFY 2015 varies across states from a floor of 50 percent to a high of 73.6 percent. (Figure 14)  This means every $1 of state spending on Medicaid is matched with at least $1 of federal funds.14 

Figure 14: Medicaid costs are shared by the states and the federal government.

Medicaid’s Role in State Budgets

Medicaid has a unique role in state budgets because it is both an expenditure item and a source of federal revenue for states. In FY 2012, Medicaid accounted for 23.7 percent of total spending, but only 18.1 percent of all state general fund spending, a far second to spending on K-12 education (35.3 percent of state general fund spending.)15  Due to the federal match structure for Medicaid, the program is the largest source of federal funds for states, accounting 44.2 percent of all federal funds for states in FY 2012. Over the last decade, shares of general fund spending for Medicaid and K-12 education have remained fairly constant with an uptick in the share of general fund spending on Medicaid since 2010 in part due to the June 2011 expiration of the enhanced FMAP provided by under the American Recovery and Reinvestment Act (ARRA). (Figures 15 and 16)

Figure 15: Medicaid is a budget item and a revenue item in state budgets.
Figure 16: Shares of state general funds spent for Medicaid and K-12 Education have remained fairly stable over time.

Endnotes

  1. Bureau of Labor Statistics, The Employment Situation – September 2014. (Washington, DC: Bureau of Labor Statistics,) October 3, 2014. http://www.bls.gov/cps/. ↩︎
  2. While the share of the population over 16 participating in the labor force (labor force participation rate) did not decline over the past year, it is at a level (62.7 percent in September 2014) last seen in 1978. A portion of this decline in the labor force participation rate is due to increasing numbers of baby-boomers retiring. Chad Stone, Statement by Chad Stone, Chief Economist, on the August Employment Report, (Washington, DC: Center on Budget and Policy Priorities,) September 5, 2014. http://www.cbpp.org/cms/index.cfm?fa=view&id=4195. ↩︎
  3. Bureau of Labor Statistics, The Employment Situation – September 2014. (Washington, DC: Bureau of Labor Statistics,) October 3, 2014. http://www.bls.gov/cps/. ↩︎
  4. Ibid. ↩︎
  5. The first two quarters of tax revenue growth were driven by significant increases in personal income tax revenue growth; experts noted that this significant growth appeared to be artificially driven by changes in federal tax policy. While personal income tax growth slowed in the third and fourth quarters of 2013, sales tax revenue growth has remained fairly constant (over 5% each quarter) during the 2013 calendar year. Lucy Dadayan and Donald J. Boyd, State Tax Revenues Slip Back to Slower Growth, (Albany, NY: The Nelson A. Rockefeller Institute of Government,) March 11, 2014. http://www.rockinst.org/pdf/government_finance/state_revenue_report/2014-03-11_Data_Alertv3.pdf. Lucy Dadayan and Donald J. Boyd, “April Surprises” Left Many States with Bad News, (Albany, NY: The Nelson A. Rockefeller Institute of Government,) September 17, 2014.http://www.rockinst.org/pdf/government_finance/state_revenue_report/2014-09-17_Data_Alert.pdf. ↩︎
  6. Kaiser Commission on Medicaid and the Uninsured, Medicaid in a Historic Time of Transformation: Results from a 50-State Medicaid Budget Survey for State Fiscal Years 2013 and 2014, (Washington, DC: Kaiser Commission on Medicaid and the Uninsured), October 2013. https://modern.kff.org/medicaid/report/medicaid-in-a-historic-time-of-transformation-results-from-a-50-state-medicaid-budget-survey-for-state-fiscal-years-2013-and-2014/. ↩︎
  7. National Health Interview Survey Early Release Program. “Health Insurance Coverage:  Early Relase of Estimates from the National Health Interview Survey, January – March 2014. Released September 16, 2014. http://www.cdc.gov/nchs/data/nhis/earlyrelease/insur201409.pdf ↩︎
  8. Kaiser Family Foundation, Measuring Changes in Insurance Coverage Under the Affordable Care Act, (Washington, DC: Kaiser Commission on Medicaid and the Uninsured), October 2013. https://modern.kff.org/health-reform/issue-brief/measuring-changes-in-insurance-coverage-under-the-affordable-care-act/. ↩︎
  9. Figures for expansion state spending and enrollment growth from last year’s survey included 25 states; after the survey data was collected for last year’s report, Ohio decided to move forward and implement the Medicaid expansion as of January 1, 2014. When collecting data for this year’s report, Ohio included spending and enrollment figures that reflected expanding as of January 1, 2014 and therefore were included in the expansion group. ↩︎
  10. Because the data reported here are a weighted average across all non-expansion states, the FMAP declines in larger states, such as Texas, have a larger effect on the state and total spending averages for this group. ↩︎
  11. Kaiser Family Foundation, The Role of Medicaid in State Economies and the ACA, (Washington, DC: Kaiser Commission on Medicaid and the Uninsured), November 2013. https://modern.kff.org/medicaid/issue-brief/the-role-of-medicaid-in-state-economies-and-the-aca/. Sherry Glied and Stephanie Ma, How States Stand to Gain or Lose Federal Funds by Opting In or Out of the Medicaid Expansion. (New York City, NY: The Commonwealth Fund,) December 2013. http://www.commonwealthfund.org/Publications/Issue-Briefs/2013/Dec/Federal-Funds-Medicaid-Expansion.aspx. ↩︎
  12. National Health Interview Survey Early Release Program. “Health Insurance Coverage:  Early Release of Estimates from the National Health Interview Survey, January – March 2014. Released September 16, 2014. http://www.cdc.gov/nchs/data/nhis/earlyrelease/insur201409.pdf Kaiser Family Foundation, Measuring Changes in Insurance Coverage Under the Affordable Care Act, (Washington, DC: Kaiser Commission on Medicaid and the Uninsured), October 2013. https://modern.kff.org/health-reform/issue-brief/measuring-changes-in-insurance-coverage-under-the-affordable-care-act/. ↩︎
  13. Kaiser Commission on Medicaid and the Uninsured, Medicaid Enrollment: June 2013 Data Snapshot, (Washington, DC: Kaiser Commission on Medicaid and the Uninsured), January 29, 2014. https://modern.kff.org/medicaid/issue-brief/medicaid-enrollment-june-2013-data-snapshot/. ↩︎
  14. State Health Facts, Federal Medical Assistance percentage (FMAP) for Medicaid and Multiplier, (Washington, DC: Kaiser Family Foundation,) downloaded March 2014. https://modern.kff.org/medicaid/state-indicator/federal-matching-rate-and-multiplier/. ↩︎
  15. Kaiser Commission on Medicaid and the Uninsured estimates based on the NASBO’s November 2013 State Expenditure Report (data for Actual FY 2012.) ↩︎

Putting Medicaid in the Larger Budget Context: An In-Depth Look at Four States in FY 2014 and 2015

Authors: Laura Snyder and Kathleen Gifford, Eileen Ellis and Jenna Walls
Published: Oct 14, 2014

Introduction

Medicaid has long-played an important role in the US healthcare system, accounting for one in every six dollars of all US health care spending while providing health and long-term services and supports coverage to over 66 million low-income Americans. Medicaid also plays an important role in states budgets as both an expenditure item and the largest source of federal revenue for states.

The years 2014 and 2015 will stand out as a time of significant change and transformation for Medicaid programs. With the economy improving from the lingering effects of the Great Recession, Medicaid programs across the country were focused primarily on implementing a myriad of changes included in the Affordable Care Act (ACA), pursuing innovative delivery and payment system reforms to help assure access, improve quality and achieve budget certainty, and continuing to administer this increasingly complex program.

However, these changes to Medicaid policy, spending and enrollment take place in the larger context of states budgets. Unlike the Federal government, states generally have balanced budget requirements, taking into account the amount of revenue coming in from a state’s own resources as well as federal revenues. State lawmakers must balance competing priorities across budget expenditure categories. Even in years of economic growth, state lawmakers face this pressure of balancing priorities.

This report provides an in-depth examination of Medicaid program changes in the larger context of state budgets in four states:

These case studies build on findings from the 14th annual budget survey of Medicaid officials in all 50 states and the District of Columbia conducted by the Kaiser Commission on Medicaid and the Uninsured (KCMU) and Health Management Associates (HMA.) Additional research on budget activity, economic conditions, and other relevant health policy activity was conducted by KCMU and HMA staff members; each case study was submitted to states for their review and comment.

Issue Brief: Michigan

Economic and Budget Outlook

Economy

Michigan endured a dramatic shift in its economic strength between 2001 and 2010, largely attributed to declines in manufacturing employment that hit the state particularly hard. For over a century Michigan’s economy has been heavily dependent on manufacturing employment, primarily manufacturing associated with motor vehicle and parts production. In the past decade the “Big Three” US auto manufacturers (Ford, General Motors and Chrysler), headquartered in Michigan, shed manufacturing capacity as US automotive sales declined and their share of the automotive market dropped. Since 2010, increases in motor vehicle sales have driven a moderate recovery in Michigan employment and a significant drop in the unemployment rate, which has fallen from 13.2% in April of 2009 to 7.7% in July of 2014, still one of the highest state unemployment rates in the country.1  After hitting bottom in 2009, employment and state revenues began slow improvement in 2010. State revenues did not regain actual 2008 levels until 20132 , and in 2014 total employment has not yet regained 2008 levels.3 

State Budget

The economic downturns that began in March 2001 and in December 2007 affected all states, but hit Michigan’s state budget especially hard, as state revenues dropped and spending for Medicaid increased, leading to a period of persistent budget deficits. Addressing these deficits since 2001 largely focused upon reduced support for the state’s higher education system, diminished and delayed investment in the state’s transportation infrastructure and less support for local governments through revenue sharing payments and tax and fee increases4 .

Like most states, Medicaid spending accounts for a significant and growing percentage of Michigan’s state budget. While the appropriation process in Michigan devoted a great deal of energy to identifying General Fund savings in the Medicaid program, Michigan largely avoided significant structural reductions in Medicaid coverage, services and reimbursement since 2000. This was possible in significant part due to the enhanced federal Medicaid matching during these periods and also due to increased use of provider taxes as a source of the non-federal revenue for the Medicaid program. Michigan began with a tax on nursing facilities in FY 2002 and expanded the program to other provider groups in FY 2003. Provider taxes represented nearly $900 million in Medicaid revenues by FY 20075  and exceeded $1 billion by the end of the decade.

For the past four years, Michigan has enacted annual budgets without significant General Fund program reductions and has allocated some surplus revenues to program enhancements and to restoring the state’s Budget Stabilization Fund.6 

For FY 2015, which begins on October 1st, the Michigan Medicaid budget is largely a continuation of the FY 2014 budget, with two major adjustments. The most significant adjustment was the full-year 100 percent federal funding of the Healthy Michigan Plan (Michigan’s Medicaid expansion implemented April 1, 2014.) The second adjustment provided additional funding ($111.6 million total / $25.0 million General Fund) to support partial retention of enhanced physician primary care reimbursement rates. (Increases in primary care rates to Medicare levels were fully federally funded through the Affordable Care Act in calendar years 2013 and 2014.)7 

ACA Implementation

The 2010 Affordable Care Act (ACA) has the potential to extend coverage to many of the 47 million nonelderly uninsured people nationwide, including the 1.1 million uninsured Michigan residents. The ACA establishes coverage provisions across the income spectrum, with the expansion of Medicaid eligibility for adults serving as the vehicle for covering low-income individuals and premium tax credits to help people purchase insurance directly through new Health Insurance Marketplaces serving as the vehicle for covering people with moderate incomes (100-400% FPL).8  Many of these provisions became effective during SFY 2014 with significant implications for state budgets and Medicaid programs across the country, including Michigan.

Marketplace Coverage

As written under the law, states have the option of establishing their own Marketplaces or relying on the federally-facilitated Marketplace, www.healthcare.gov. Michigan was one of seven states that opted for a partnership model, where the state would perform plan management functions and defer other Marketplace management, including consumer assistance, to the federal government.9  The state’s Department of Insurance and Financial Services (DIFS) performs plan management functions for health insurance products offered both inside and outside the Marketplace. Ten insurance providers are offering 106 Qualified Health Plans in Michigan’s Marketplace.10  As of April 19, 2014, over 272,500 Michigan residents had selected a Marketplace plan (approximately 38% of the estimated 725,000 individuals eligible for Marketplace coverage11 ) over 87 percent of whom qualified for financial assistance.12 

All funding for outreach and enrollment efforts for the Marketplace has come from the federal government and private organizations. Entities providing outreach and enrollment for Michigan’s Marketplace include 31 of Michigan’s Federally Qualified Health Centers as well as four organizations that received federal Navigator grants to provide consumer assistance for the federal Marketplace; additional consumer information about Marketplace coverage can be obtained from volunteer certified application counselors as well as licensed agents and brokers who sell coverage in the Marketplace. The DIFS website details the consumer assistance available.

Healthy Michigan Plan – Michigan’s Alternative Medicaid Expansion

The Medicaid expansion, as written in the ACA, was designed to fill in existing gaps in Medicaid coverage, largely for adults. Under the Medicaid expansion, nearly all individuals with incomes under 138% FPL would be covered. However, the June 2012 Supreme Court decision effectively made the Medicaid expansion optional for states to implement. Michigan is one of the 28 states (including DC) that have adopted the Medicaid expansion as of September 2014. However, the path the state took to implementing the Medicaid expansion differs from those of other states.

In February of 2013, Michigan Governor Rick Snyder made public his support for implementing the Medicaid expansion authorized through the Affordable Care Act in his FY 2013-2014 Executive Budget Recommendation. The initial concept proposed by the Governor would be an expansion of the Medicaid program through a state plan amendment. Those newly eligible for Medicaid would be enrolled in the state’s contracted Medicaid managed care organizations.13  The proposed expansion was considered by the Michigan Legislature, controlled in both houses by Republican majorities. The House agreed to the Medicaid expansion,

but the Senate did not concur, notwithstanding strong support and advocacy from the Governor (also a Republican), and the Medicaid expansion was not included in the final FY 2013-2014 enacted budget.14 

Following the FY 2013-14 budget process, representatives from the Executive branch along with legislative leadership began to discuss an alternative Medicaid expansion plan. If a Medicaid expansion were to be approved, legislative leadership was interested in achieving policy goals over and above improved access to coverage. The result of this process was the Healthy Michigan Plan (HMP). The HMP makes Medicaid eligibility available to uninsured adults with income below 138 percent of the FPL. Additional policy goals articulated by legislative leaders and included in the HMP proposal included:

  • Recipient Cost-Sharing: The HMP includes provisions that require beneficiaries to make monthly payments to a managed “healthy behavior incentive account.” The monthly payment requirements for all enrollees will be generated using incurred co-payment cost over the first six months of HMP enrollment. Persons with income over 100 percent of the FPL are required to additionally pay a premium equivalent to two percent of their income.
  • Healthy Behavior Incentives: Cost sharing requirements, detailed above, are to be reduced if enrollees demonstrate positive healthy behaviors. Enforcement of the healthy behavior requirements is the responsibility of the MCOs, with MCO incentive funding tied to enrollee health outcomes and a new requirement that all HMP enrollees have an initial appointment with their primary care provider scheduled within 60 days of initial enrollment.15  Enrollees can also reduce their recipient cost-sharing amounts when they complete an annual health risk assessment.
  • Delivery System Structure: HMP, like Michigan’s base Medicaid program, relies on contracted Medicaid managed care organizations (MCO.) Nearly all HMP enrollees are required to be enrolled in an MCO.16  Additionally, services not typically provided through MCOs (like dental) are the responsibility of MCOs for HMP enrollees.17 

After lengthy and contentious debate, legislation authorizing HMP was passed by the Legislature and signed by the Governor in September of 2013.18  HMP was implemented in April 2014. In addition to the provisions noted above, the HMP statute included provisions that will require a future waiver, which are described below.

Federal Authority for HMP

A Medicaid expansion program with the policy elements detailed above could not be approved by CMS through an amendment to Michigan’s Medicaid state plan. The authorizing language for implementing HMP requires Federal approval of two separate 1115 waivers, one of which has been submitted and approved while the other is to be submitted in the future. The changes under these waivers are discussed below:

  • The State of Michigan submitted an amendment to an existing 1115 waiver that authorized the operation of the state’s Adult Benefit Waiver (ABW) program. The ABW used Medicaid funding to support a limited benefit physical and mental health program for uninsured adults with income below 35 percent of the FPL. Enrollment in ABW was capped. Michigan shifted individuals enrolled in ABW to the more comprehensive HMP and expanded coverage for adults up to 138% FPL. The waiver was restructured to provide Michigan the authority to administer healthy behavior savings accounts, impose cost-sharing requirements on HMP enrollees over the “nominal” levels in Medicaid programs and to create financial healthy behavior incentives for HMP enrollees. The waiver amendment was approved by CMS on December 30, 2013.19 
  • The legislature also included a provision that calls for enrollees with income above 100 percent of the FPL who have been enrolled in HMP for greater than 48 months to either purchase subsidized coverage through Michigan’s Marketplace or remain in HMP with an increase in cost-sharing. Premiums would increase to 3.5 percent of income, with a limit on total cost-sharing (premiums and copayments) to a maximum of 7 percent of income. An additional 1115 waiver will be necessary to allow the state to implement this provision. Language in the legislation authorizing HMP requires approval of this waiver by December 31, 2015.20 
HMP Enrollment

The State projected enrollment in HMP over the first year of the program of 370,000, with enrollment ultimately stabilizing at around 500,000 individuals. Enrollment in HMP, since the program’s launch in April of 2014, experienced a much more dramatic ramp up of program participation. As of October 6, 2014, enrollment in HMP is 405,743.21 

Delivery System Reforms

Patient Centered Medical Home Initiative

Michigan is one of eight states (along with Maine, Minnesota, North Carolina, New York, Pennsylvania, Rhode Island and Vermont) that were selected to participate in the Multi-Payer Advanced Primary Care Practice Demonstration where states administer a three-year, multi-payer patient-centered medical home (PCMH) initiative across Medicaid, private payers and Medicare (which began participating in Michigan’s demonstration in October 2011.) The goal of this initiative is to evaluate whether advanced primary care practices reduce “unjustified utilization and expenditures, improve the safety, effectiveness, timeliness, and efficiency of health care, increase patient decision-making and increase the availability and delivery of care in underserved areas.”22 

Michigan’s initiative, called the Michigan Primary Care Transformation Program (MiPCT), is the largest PCMH project in the United States with over 400 participating primary care practices. Enrollees through Blue Cross Blue Shield of Michigan, the Blue Cross HMO (Blue Care Network), west-Michigan based HMO Priority Health, Medicare and Medicaid are included in the demonstration. MiPCT requires participating primary care practices to achieve designation as a PCMH, either through BCBSM or the National Committee for Quality Assurance (NCQA).23 

State Innovation Grant

The Innovation Center was created by the Affordable Care Act to test innovative payment and service delivery models. One of the opportunities for states offered by the Innovation Center is the State Innovation Models initiative (SIM). The SIM initiative provides “financial and technical support to states to design or test innovative payment and service delivery models that will improve health, improve care and lower cost for Medicare, Medicaid, and Children’s Health Insurance Program (CHIP) beneficiaries.”24  In February of 2013 Michigan, along with 15 other states (California, Connecticut, Delaware, Hawaii, Idaho, Illinois, Iowa, Kentucky, Maryland, New Hampshire, Ohio, Pennsylvania, Rhode Island, Tennessee, and Texas), was awarded a Model Design Grant through CMS to support the development of the state’s health care innovation plan. In January 2014, the State submitted their “blueprint” for changes in the state’s health delivery system. The blueprint includes the following components:

  • Patient-Centered Medical Homes (PCMH): The State would expand the Michigan Primary Care Transformation Project to additional medical practices, payers and patients. This will include new requirements for contracted Medicaid MCOs to participate in the PCMH initiative and new rules to permit safety net providers to participate in the pilot project.
  • Accountable Systems of Care: Michigan intends to support the creation of a new healthcare service delivery system by developing new organizations, described as Accountable Systems of Care. Accountable Systems of Care are legal entities built to support a network of providers who are accountable to collectively coordinate the medical, behavioral and social services provided to their patients. The entity would be financially accountable for the performance outcomes of this population but would not be fully at risk like a licensed insurer.
  • Development of Community Health Innovation Regions: Michigan intends to support the development of local consortiums of community organizations, state and local agencies, business entities, providers and citizens with the goal of increasing local capacity for improving population health.
  • Value-Based Payment Reforms: Michigan detailed a number of payment reforms that would allow the state to move closer to a “payment for value” structure across payers. Initial payment reforms detailed in the blueprint document include expansion of the PCMH infrastructure in the state, pay-for-performance and shared savings strategies. Michigan established a longer-term goal of making care management payments through the state’s new Accountable Systems of Care. These payments would be structured to account for continuity of care and a shared savings component with provider upside and downside risk.25 

The blueprint identified infrastructure cost associated with implementing the reforms detailed above at $13.0 million with full dissemination of the model in 2019. Based on this blueprint, Michigan submitted an application to CMS for additional funding to test this model. CMS anticipates awarding up to $700 million to fund up to 12 Model Test grants across the country, which will provide financial and technical support four years for states to test and evaluate their models. Round two of the Model Test grants will be awarded sometime in the Fall of 2014.26 

Health Homes

As part of the state’s budget, Michigan committed to pilot Medicaid Health Homes, a new ACA state plan option that provides enhanced matching funds (90 percent for the first 8 quarters) for Medicaid programs to establish person-centered systems of care that facilitate access to and coordination of the full array of primary and acute physical health services, behavioral health care, and community-based long-term services and supports, for beneficiaries who have at least two chronic conditions, or one and at risk of a second or a serious and persistent mental health condition. Michigan implemented health homes in three regions for individuals with a serious and persistent mental health condition beginning July 1, 2014.27  Community mental health service providers (CMHSP) are designated as health homes.28 

Integrated Care for Dual Eligible Beneficiaries

In 2011 the State of Michigan was successful in accessing funding through CMS for a Design Contract for the Integrate Care for Dual Eligibles (ICDE) program. Michigan will pilot a new care and supports coordination program for residents enrolled in both Medicare and Medicaid in four markets throughout the state (Michigan’s Upper Peninsula, eight counties in Southwest Michigan, Wayne County, and Macomb County.) Dual eligible beneficiaries who participate in the pilot project will be enrolled in an Integrated Care Organization (ICO). ICOs are responsible for all Medicaid and Medicare funded physical health services and supports necessary to meet the needs of the enrollee, including both acute care and long term care. In addition, the ICOs must coordinate care with the Prepaid Inpatient Health Plans (PIHPs) which are the entities responsible for behavioral health care for all Medicaid enrollees, including the dual eligible beneficiaries.29 

Michigan issued a Request for Proposals in August of 2013 for the state’s ICO network; in November of 2013 the State of Michigan identified the organizations that will serve as ICOs during the pilot project period. In April 2014, the State signed a Memorandum of Understanding (MOU) with the Federal Centers for Medicare and Medicaid Services outlining the structure of the state’s ICDE. Contracted ICOs are now undergoing a state readiness review process and services will be provided through the ICDE program beginning in January of 2015. The demonstration is estimated to include 100,000 dual eligible beneficiaries.30  The first phase includes two regions (the Upper Peninsula and Southwest Michigan.) Services for voluntary enrollees in those regions will begin January 1, 2015. Services for passive enrollees in these two regions will begin April 1, 2015. For phase 2 (which includes Wayne and Macomb Counties) services for voluntary enrollees are set to begin May 1, 2015 followed by services for passive enrollees on July 1, 2015.31 

Additional policy actions the state either implemented in FY 2014 or planned to implement in FY 2015 are detailed in the table that follows:

Michigan Medicaid Policy Changes in SFY 2014 and 2015
Eligibility, Application and Renewal Policies
  • The Healthy Michigan Plan was implemented April 1, 2014. The Adult Benefits Waiver (with limited benefits and capped enrollment) for childless adults ended on 4/1/14. On that date current enrollees (about 50,000) were converted to the Healthy Michigan Plan.
  • Eliminated Family Planning Waiver. (However due to litigation, FP waiver cases are not closed until eligibility for other Medicaid programs has been explored.)
Premium and Cost-Sharing Changes
FY 2015 for Healthy Michigan Plan:
  • A two percent premium will be charged to Healthy Michigan enrollees with incomes between 100% and 138% FPL when they have been enrolled in the plan for six months. The state estimated that during the last half of FY 2014 (the period ending September 31, 2014), a total of 320,000 individuals will be enrolled in Medicaid (beyond the ABW conversions).
  • After six months in the plan, all members will pay a monthly cost-sharing amount based on their historical copayments from the prior six month period.
  • Enrollees can reduce their annual cost-sharing by participating in healthy behaviors, including completion of an annual health risk assessment.
Provider Rates and Provider Fees/Taxes
  • In both FY 2014 & FY 2015: Michigan increased MCO and nursing facility rates.   All other rates were flat.
  • Effective January 1, 2015, when the ACA primary care rate enhancement to 100% of Medicare rates ends, Michigan will fund half of the value of the enhancement.
  • Hospitals and nursing facilities have small provider tax increases in both FY 2014 and FY 2015.
Benefits and Pharmacy
  • No changes in FY 2014 or FY 2015.
Managed Care and Care Coordination
  • In FY 2014:
    • Enrolled the Healthy Michigan population in Medicaid HMOs in FY 2014.
    • Continued existing Patient Centered Medical Homes initiative.
    • Implemented the new Health Homes (ACA Section 2703) initiative for individuals with both severe mental illness and a chronic physical health condition in FY 2014.
  • Dual eligible beneficiaries financial alignment demonstration (MI Health Link) in four regions of the state. Phased enrollment begins in December 2014, with initial enrollments effective on January 1, 2015.


Issue Brief: Utah

Economic and Budget Outlook

Economy

As in nearly all of the states, Utah struggled through the recession. The State’s unemployment rate peaked in December 2009 at 8.4 percent, somewhat below the national average which peaked at 10.0 percent in October of that year, but still high.32  Revenues from sales, income and corporate income taxes dropped precipitously – 15.5 percent – between FY 2008 and FY 2010.33  And like other states, Utah made adjustments by cutting program funding and staff, and utilizing transfers in fund balances and state reserves to bridge the budget shortfalls. Through attrition and early retirement incentives, State Government reduced its workforce by over 9 percent between FY 2009 and FY 2012.34  The State’s Rainy Day Fund fell from $419 million in FY 2009 (8.7% of expenditures)35  to $210 million in FY 2010 (4.7% of expenditures).36 

Utah’s turnaround, however, began quickly and progressed steadily. By December 2012, Utah was one of only 11 states with employment at or above pre-recession levels.37  Utah has also enjoyed recent recognition for its business climate, economic growth, and overall state performance. An annual analysis of pro-business metrics ranked Utah as the number one state for three consecutive years from 2012 to 2014.38  The State ranked 5th in the nation in a 2013 survey as one of the “best managed states” based on financial data, services and residents’ standards of living.39  With a stable economy and one of the lowest unemployment rates in the nation – 4.4 percent in 2013, which had fallen to 3.5 percent by June 201440  – Utah anticipates $338 million in new revenue in FY 2015, and now maintains approximately $400 million in its reserve fund balances, representing about seven percent of General Fund/Education Fund appropriations.41 

State Budget

Utah enacts a state budget annually and finances operations through its General Fund and Education Fund. As required by Utah’s constitution, all personal and corporate income tax revenue is used to fund K-12 and higher education42  while other state operations and programs, including Medicaid, are funded primarily from sales tax revenue deposited in the State General Fund. Governor Gary Herbert signed the FY 2015 budget into law April 2014. The total (federal and state) $13.5 billion capital and operating budget represents a modest 1.2 percent increase over the revised FY 2014 budget.43  The General Fund/Education Fund appropriations for FY 2015, however, totaled $5.8 billion, an increase of 7.2 percent over FY 2014 appropriations (FY 2014 appropriations had declined by $64 million from FY 2013 due primarily to lower than estimated Medicaid costs.) Governor Herbert has challenged state agencies to achieve a 25 percent increase in efficiency by 2017 through implementing tools and concepts (SUCCESS Framework), to continue to improve government performance.44 

The Governor’s proposed budget included $2.1 billion for total spending on Medicaid in FY 2015. This includes $550 million in General Fund appropriations and $1.62 billion in federal funds.45   In his budget recommendations, the Governor noted that Medicaid General Fund appropriations were not fully expended in FY 2012 and FY 2013 due to lower than projected enrollment. Additional FY 2013 savings were achieved through a managed care expansion and through recovery of erroneous Medicaid reimbursements.46  In addition, Utah’s Federal Medical Assistance Percentage (FMAP) – the federal share of Medicaid expenses, increased from 69.6 percent in 2013 to 70.6 percent in 2015.47 

ACA Implementation

The 2010 Affordable Care Act (ACA) was designed to expand coverage to most of the 47 million nonelderly uninsured people nationwide, including a portion of the estimated 407,000 uninsured Utah residents.48  The ACA enhances coverage across the income spectrum by expanding Medicaid eligibility for adults earning up to 138 percent of the FPL, including non-custodial and childless adults not previously covered by Medicaid, and by providing premium tax credits to help people with moderate incomes (100-400% FPL) purchase insurance directly through new Health Insurance Marketplaces. While these coverage provisions took effect January 1, 2014, the U.S. Supreme Court’s 2012 ruling49  establishing the constitutionality of the ACA individual mandate to obtain coverage, also held that states could not be forced to expand Medicaid coverage, essentially making the ACA Medicaid expansion optional for states. By the end of August 2014, 27 states and the District of Columbia had opted to implement a Medicaid expansion.50  Utah is one of two states that has not expanded Medicaid but was in open negotiation with CMS as of September 2014.

The Health Insurance Marketplace

Utah took on health insurance reform prior to passage of the ACA. In 2009, state legislation created the Office of Consumer Health Services, which was tasked, in partnership with the Utah Insurance Department, Department of Health and Workforce Services, with creating an internet portal that could:

  • Serve as a single access point for private and government health insurance websites, application forms and submission procedures;
  • Facilitate private sector collection of premium payments for a single policy by multiple payers; and
  • Assist employers to establish mechanisms allowing employees to purchase health insurance with pre-tax dollars.51 

The resulting Insurance Exchange, called Avenue H, became the basis for a state Marketplace under the ACA. The State received conditional approval from HHS in January 2013 to run a state Marketplace, but eventually Utah adopted Avenue H as its small business SHOP exchange, and elected to use the Federally Facilitated Marketplace for its individual coverage health exchange.52 

In 2014, six insurance providers are offering 99 Qualified Health Plans in Utah’s Individual Marketplace.53  Utah is also one of 23 states offering consumer operated and oriented plans (CO-OPs), a new type of non-profit, member-governed health insurance intended to offer more affordable, consumer friendly, and high quality health insurance options to compete with existing health insurers. As of April 19, 2014, over 84,600 Utahns had selected a Marketplace plan (approximately 26% of the estimated 331,000 individuals eligible for Marketplace coverage54 ) nearly 90 percent of whom qualified for financial assistance.55 

Healthy Utah Plan – Utah’s Alternative Medicaid Expansion Proposal

After agreeing to study its options regarding the Medicaid expansion decision, Utah’s Governor Gary Herbert announced in January 2014 that “doing nothing is no longer an option.”56  Governor Herbert outlined the concepts of the “Healthy Utah Plan” in a February 2014 press release.57  The Healthy Utah Plan calls for a three-year pilot program that would cover those under 138 percent FPL. The plan builds on the principles and strategies of: 58 

  • Promoting individual responsibility through charging premiums and copays, offering incentives for healthy behaviors, and requiring a work effort or participation in employment training
  • Supporting private markets through the use of employer-sponsored insurance and premium assistance to purchase private market plans
  • Maximizing flexibility by allowing Utah to use federal savings from Utah’s current waiver to support new quality improvement efforts
  • Respecting the taxpayer by terminating the plan if federal funding does not come as promised.

The legislative session came to a close on March 13, 2014, without passing Medicaid expansion legislation. Governor Herbert has continued negotiations with CMS over the Healthy Utah Plan, which have for several months largely centered around the work effort requirements and participation in employment training. After meeting with HHS Secretary Sylvia Mathews Burwell on September 9, 2014, Governor Herbert announced that they had reached a “conceptual agreement” on the plan. Details and a formal waiver submission are still forthcoming.59  The Governor stated that a special session is his “preferred path to finalize the Healthy Utah plan.”60 

Utah’s Primary Care Network Waiver

Utah extended health care benefits to non-custodial and childless adults through a Section 1115 waiver in 2002 – long before the passage of the Affordable Care Act. The waiver allowed the State to slightly reduce state plan Medicaid benefits for certain Medicaid eligible parents to fund a limited benefit package – primary and preventive care – for parents/caretakers and non-custodial or childless adults with family income up to 150 percent of the FPL, previously not eligible for Medicaid. The Primary Care Network (PCN) waiver program also provided working adults and their spouses earning up to 200 percent of the FPL with premium assistance to purchase employer sponsored insurance, or continuation of coverage under COBRA, and covered high-risk pregnant women whose resources exceeded Medicaid eligibility thresholds.

The PCN waiver program was scheduled to sunset in June 2013, but the State requested and received two extensions allowing the program to continue through calendar year 2014 and giving the State time to consider and finalize a plan to expand Medicaid. With the extensions, CMS required certain changes; the State could no longer collect an enrollment fee it had previously imposed; cost-sharing for certain State Plan eligible adults61  was reduced to comply with Medicaid nominal cost-sharing limits; and on January 1, 2014, individuals earning at or above 100 percent of the FPL would no longer be eligible for Medicaid coverage. In the CMS approval letter for the extension, the State was instructed that for individuals earning income at or above 100 percent of the FPL the State was to provide temporary continued coverage through April 30, 2014 and make every effort to assist this population to obtain coverage through the Marketplace by March 31, 2014.

Utah’s Primary Care Network Waiver
PCN PopulationsBenefitsEnrollment LimitsCost-Sharing
Non-Traditional Medicaid Adults eligible through 1925 and 1931; Medically needy non-ABDSlightly reduced Medicaid benefitsNoneMay not exceed Medicaid nominal limits
Parent/Caretaker adults with income up to 100% FPLLimited benefits of primary and preventive care16,000May not exceed Medicaid nominal limits
Non-custodial parents and childless adults with income up to 100% FPLLimited benefits of primary and preventive care9,000May not exceed Medicaid nominal limits
High Risk Pregnant women ineligible for MedicaidAll Medicaid state plan benefits related to pregnancyNoneMay not exceed Medicaid nominal limits
Working adults and spouses with family income up to 200% of FPLPremium assistance for ESI or COBRANoneSet by qualified health plan/COBRA
Eligible CHIP children with family income up to 200% of FPLPremium assistance for ESI or COBRA plus dental wrap aroundNoneSet by qualified health plan/COBRA. Not subject to 5% out of pocket maximum

The waiver allows the State to limit enrollment for some populations as shown in the Table above. Although the limits exist, the transition of higher income individuals to coverage in the Marketplace has freed up waiver slots to cover additional lower income individuals. State officials noted that open enrollment, which typically closes after two weeks, remained open for several months. The State may request an additional PCN extension to accommodate a transitional year allowing the state to get a Medicaid expansion in place in 2015 prior to terminating waiver coverage.

Delivery System Reforms

Utah Transitions to Accountable Care Model of Managed Care

In 2011, Utah passed Medicaid reform legislation directing the administration to implement one or more risk-based delivery models that would, among other goals, “[r]estructure the program’s provider payment provisions to reward health care providers for delivering the most appropriate service at the lowest cost.”62  In January 2013, the State transitioned from traditional managed care to its Accountable Care Organization (ACO) delivery system in the four most populous counties, engaging four ACOs to provide services through a risk-based system. The program covers approximately 70 percent of all Medicaid enrollees. ACOs have flexibility to decide how to reimburse providers, and whether to share savings achieved through improved quality. The State’s focus is on controlling costs but also on improving quality and has incentives within the ACO contracts to achieve these goals. Historically, the State has used HEDIS and CAHPS metrics to monitor quality, but is actively developing Utah Medicaid specific performance measures for ACOs. The State expects to increase the number of ACOs in four additional counties in FY 2015 in order to provide consumer choice and allow for mandatory enrollment.

Long-Term Services and Supports

While behavioral health and long-term services and support benefits are carved out of managed care, all Medicaid participants, except those residing in long-term care facilities, receive their physical medical care through an ACO in service areas with multiple ACOs; individuals in areas with only one ACO may choose to use an ACO for these services. Utah uses a 1915(b) waiver to provide outpatient behavioral health services through pre-paid mental health plans. The State has several ongoing efforts in place to encourage coordination between behavioral health and physical health service providers. The State also administers seven Home and Community- Based Service waivers (including the state’s Medicaid Autism waiver) serving approximately 6,500 individuals. In both 2014 and 2015 the legislature increased funding to expand the number of waiver slots for the State’s ID/DD and Physical Disabilities waivers in part to address a waiting list.

Additional policy actions the state either implemented in FY 2014 or planned to implement in FY 2015 are detailed in the table that follows:

Utah Medicaid Policy Changes FY 2014 and FY 201563 
Eligibility, Application and Renewal Changes
  • Reduced eligibility for the state’s existing 1115 waiver (PCN) from 150% to 100% FPL. Enrollment cap remains in place in FY 2014.
  • Implemented Hospital Presumptive Eligibility with nearly all hospitals participating.
Cost Sharing
  • Eliminated a $50 enrollment fee for Primary Care Network (PCN) waiver participants.
  • Reduced cost-sharing for PCN TANF-related waiver participants (1925 and 1931 adults.)
Provider Rates and Provider Taxes/Assessments
  • Increased rates for outpatient hospitals (0.85%), MCOs (2.0%) and 340B pharmacy dispensing fee in FY 2014.
  • Plan to increase rates for dentists (6.0%), MCOs (2%) and nursing homes (3.64%) for FY 2015.
  • Plan to discontinue ACA payment rate increases for primary care physician services beyond 12/31/2014.
  • Plan to increase ICF/ID Provider Tax in FY 2015.
Long-Term Care
  • Expanded the number of intellectual/developmental disability (IDD) and physical disability waivers slots to address a waiting list in FY 2014. Plan to do so again in FY 2015.
Delivery System and Payment Reforms
  • Revised state quality strategy to incorporate Utah specific measures in FY 2014; incorporated new performance measures in ACO contracts in FY 2014.
Other
  • Implemented state plan amendment to allow wider application of 340B policy to pharmacy program in FY 2014.
  • Enhanced use of COGNOS to improve surveillance to identify high utilizers and drug seeking behavior to enroll these individuals in state’s “lock in” program in FY 2014.

Issue Brief: Virginia

Economic and Budget Outlook

When Governor Terry McAuliffe took office in January 2014, Virginia’s economy had largely recovered from the effects of the Great Recession. Virginia’s Gross Domestic Product grew annually throughout the Great Recession,64  the state’s personal income grew for 15 straight quarters through September 2013,65  and by February 2014, unemployment had fallen to 4.9 percent from a high of 7.4 percent in December 2009.66  However, state economic growth began to slow in FYs 2013 and 2014, driven in part by federal spending reductions from the federal sequester and by other federal spending reductions related to deficit negotiations at the national level.67  By November 2013, state revenue forecasters predicted that state economic growth would continue, although at a slower rate than the US economy.68  In December 2013, the state projected a FY 2014 year-end balance of $478.6 million.69 

In the last half of FY 2014, however, Virginia’s economy had “stalled,” largely due to federal budget cuts.70  By the fiscal year-end, total general fund revenues fell 1.6 percent (falling short of the official forecast by $438.5 million), marking the first time outside of a national recession that revenues had declined in the state.71  After planned withdrawals from reserves and stabilization funds, an updated revenue forecast released on August 15, 2014 projected a $881.5 million budget shortfall for the current biennium (FYs 2015 and 2016).72 

Having already passed the state budget for FYs 2015-2016 at the end of June, the Governor and legislative leaders began discussions to address the newly-realized budget gap. In September 2014, Governor McAuliffe and legislative leaders announced an agreement to address the shortfall by reducing spending across nearly all state agencies by as much as 5 percent in FY 2015 and 7 percent in FY 2016; elementary and secondary education are exempted and reductions for higher education will be lower at 3.3 percent. The agreement also includes $272 million in budget savings in FY 2016 that will be achieved through measures that the Governor will address through budget amendments in December.73  The agreement also allows “flexibility in capturing savings from available unexpected balances” to maintain priority items in health care and economic development.74 

The Affordable Care Act

The 2010 Affordable Care Act (ACA) was designed to expand coverage to many of the 47 million nonelderly uninsured people nationwide, including 1 million uninsured Virginians. The ACA enhances coverage across the income spectrum by expanding Medicaid eligibility to low-income adults with incomes up to 138 percent of the FPL and by providing premium tax credits to help people with moderate incomes (100-400% FPL) purchase insurance directly through new Health Insurance Marketplaces.75  While these provisions took effect January 1, 2014, the U.S. Supreme Court’s 2012 ruling establishing the constitutionality of the ACA individual mandate to obtain coverage, also held that states could not be forced to expand Medicaid coverage effectively making the ACA Medicaid expansion optional for states. 76  Virginia is one of the 23 states that have not adopted the Medicaid expansion as of September 2014. In Virginia, childless adults regardless of income and parents with incomes above 41 percent of the FPL ($660 for a family of 3) are ineligible for Medicaid.77  As eligibility for Marketplace subsidies starts at 100 percent of the FPL, the state estimates that approximately 195,000 uninsured Virginians remain without an affordable coverage option.78 

Marketplace Coverage

The ACA provided states the option of establishing their own Marketplaces or relying on the federally-facilitated Marketplace (FFM), www.healthcare.gov. Virginia was one of 27 states that opted to rely on the FFM,79  but retained responsibility for managing and reviewing rates for health plans sold on the Marketplace. In 2014, eight insurance providers are offering 106 Qualified Health Plans in Virginia’s Marketplace.80  As of April 19, 2014, over 216,300 Virginians had selected a Marketplace plan (approximately 26% of the estimated 823,000 individuals eligible for Marketplace coverage)81  over 80 percent of whom qualified for financial assistance.82  All funding for outreach and enrollment efforts for the Marketplace has come from the federal government and private organizations, including 22 of Virginia’s Federally Qualified Health Centers and the Virginia Poverty Law Center and Advanced Patient Advocacy.

The Medicaid Expansion Debate in Virginia

Expanding Medicaid was a central policy debate during the 2013 Governor’s race. During the campaign, Republican candidate Ken Cuccinelli said that a vote for him was a vote against the Medicaid expansion while Democratic candidate Terry McAuliffe said that he would not sign a budget unless the Medicaid expansion was included.83  In January 2014, newly elected Governor McAuliffe proposed amendments to the FY 2014 budget in place and to the previous Administration’s budget proposal for FYs 2015 and 2016 that reflected his budget priorities including education, mental health system reform, transportation and job growth, and the Medicaid expansion. One amendment authorized the Governor to act on the Medicaid expansion if the existing Medicaid Innovation and Reform Commission (MIRC) failed to act by the end of the legislative session.84  Established in 2013, the MIRC was comprised of House Appropriations and Senate Finance committee members as well as the state Secretaries of Finance and Health and Human Resources; it was charged with monitoring the development of Medicaid reform proposals, such as the expansion of managed care and the implementation of the Commonwealth Coordinated Care Initiative, among others. If the MIRC determined that specific Medicaid cost-reduction benchmarks had been met, it could then vote to implement the Medicaid expansion.85 

In mid-February, the Republican-controlled House proposed a budget that did not include the Medicaid expansion while the Democrat-controlled Senate proposed at budget that included the “Marketplace Virginia” plan, an alternative Medicaid expansion that would utilize premium assistance and require individuals to pay 5 percent of their income in cost-sharing or premiums.86  Federal funding for the plan would be “recaptured” in the Virginia Taxpayer Recovery Fund, estimated to be $1.7 billion a year.87  House leaders opposed the plan, citing concerns over the sustainability of the federal government’s financial commitment.88  After the House and Senate failed to reach a compromise in conference, the session ended March 8 without a budget agreement.

At the start of the special session two weeks later, the Governor issued a new budget proposal containing a number of spending reductions, totaling $204 million, and a two-year Medicaid expansion pilot program that would result in $225 million in net savings, primarily from savings in indigent care and other public health programs; the need for state funding of these programs would be reduced due to expanded Medicaid coverage.89  While the House leadership suggested at the end of the regular session and throughout the special session that the Medicaid expansion be separated from the budget,90  the Governor and Senate leadership insisted that the budget include the Medicaid expansion, noting its importance for the state’s budget and economy.91  The two bodies remained gridlocked, neither side making moves toward reconciliation. The state faced a government shutdown if a budget was not passed before July 1.

In early June, the political dynamics changed when Democratic State Senator Phil Puckett resigned his seat resulting in Republican control of the Senate. Shortly after, the House and Senate reached a budget agreement that did not include the Medicaid expansion. The budget bill also included an amendment, proposed by Senator Stanley, to prevent the governor from implementing the expansion on his own authority without legislative approval.92  Governor McAuliffe signed the budget legislation, but used his line-item veto authority to remove the Stanley amendment along with funding for the MIRC and other line-item vetoes stating:

“We have already lost $852 million as of this morning…. And [the budget] contained reductions in spending that were much deeper than necessary because the General Assembly refused to accept Medicaid funding. Frankly, if it were not June 20th – with only 10 days left in this fiscal year, I may well have vetoed the entire budget. But given the severe difficulties the General Assembly had in getting even this weak budget to me, I seriously doubt that they could have prepared a budget in the next week without disrupting or imperiling critical services or jeopardizing our AAA Bond Rating.”93  – Governor McAuliffe, June 20, 2014

The Speaker of the House later ruled that the line-item veto of the Stanley amendment was outside the Governor’s authority as it did not delete the entire line item but only a portion; the line item in question related to the appropriation for the state’s entire Medicaid program.94  After the General Assembly voted and approved 6 of the 8 line-items vetoes, including the line-item veto that eliminated the MIRC completely, the budget became law with the Stanley amendment intact.

Recent Proposals to Help Close the Coverage Gap

After the passage of the FY 2015 budget without the Medicaid expansion, Governor McAuliffe announced his intent to move forward with his goal of “expanding access to health care for Virginia residents.”95  At his direction, on September 8, 2014, Secretary Hazel of the Virginia Department of Health and Human Resources released “A Healthy Virginia” plan which recommends a number of steps to address the coverage gap. In presenting the plan, Secretary Hazel made clear that “[t]his plan is not a comprehensive cure, nor is it a substitute for a full expansion in Medicaid in accordance with the Affordable Care Act,” but rather “a bridge to true reform.”96  The key features of the plan include:

  • Developing of a Section 1115 waiver proposal that would extend limited benefits focused on behavioral health services to adults with incomes below 100 percent of the FPL with severe mental illness.
  • Investing in outreach for coverage options through Medicaid, FAMIS (Virginia’s CHIP program), and the Marketplace. Outreach will:
    • Target parents of children currently eligible for Medicaid and FAMIS but not enrolled in coverage, particularly parents for whom English is not their primary language.
    • Leverage an existing federal grant to partner with the Virginia Poverty Law Center, one the state’s two navigator organizations, to enhance the existing network of consumer assistance. The state will also develop an outreach campaign about the Federal Marketplace.
    • Include the re-launch of the coverva.org website to provide information on coverage options through the Marketplace, Department of Veterans Affairs, the Virginia Chamber of Commerce’s Virginia Benefits Market and CommonHelp (Medicaid, FAMIS, and other public benefits).
  • Implementing the ACA Health Home option for adults with severe mental illness and children with serious emotional disturbances starting in July 2015.
  • Providing comprehensive dental coverage for pregnant women in Medicaid and FAMIS starting March 2015.
  • Allowing children of lower-income state employees to qualify for FAMIS.
  • Applying for a State Innovation Model grant that, if approved, will bring in $2.6 million in federal funding along with technical support to help transform the health care delivery system in the state. The focus will be on primary care transformation and delivering integrated care models that integrate behavioral health and oral health with primary care
  • Hosting a summit with leaders from the Veterans Health Administration in Virginia and hospital and health system leaders to explore ways to improve timely access to quality care for veterans.97 
  • Creating a Task Force to combat prescription drug and heroin abuse, using a number of strategies such as leveraging the state’s prescription monitoring program to identify emerging trends among others.

In response to the Governor’s plan, House Speaker William Howell stated, “I am reviewing Governor McAuliffe’s proposed changes to Virginia’s Medicaid system. The proposal will require General Assembly approval to be made permanent and will, of course, be given due consideration during the 2015 General Assembly session.”98  The General Assembly returned to special session September 18 and quickly recessed.99 

Managed Care

While the Medicaid expansion debate has garnered much public attention, the state has been heavily focused on delivery system reform and improved care coordination for Medicaid beneficiaries. Recent efforts have focused on continued expansion of managed care and implementation of the Commonwealth Coordinated Care Initiative for those dually eligible for Medicare and Medicaid.

Managed Care Expansion

Virginia has a long history with Medicaid managed care, both capitated and primary care case management (PCCM) models. In July 2012, the state phased out its PCCM as it completed the statewide rollout of its capitated managed care program, now called “Medallion 3.0.” Over two-thirds of Medicaid beneficiaries in Virginia are now enrolled with managed care organizations (MCOs) including children, parents, pregnant women, those with disabilities, elderly enrollees, children with special health needs and some HCBS waiver enrollees for acute care services. Foster care and adoptive assistance children were added to MCOs in SFY 2014. In December 2014, the state plans to enroll other eligible Elderly and Disabled Consumer Direction HCBS waiver enrollees into managed care (for acute care services only).

In SFY 2014, the state implemented a Behavioral Health Services Administrator (BHSA) to manage the behavioral health services for the fee-for-service (FFS) population as well as certain components of behavioral health for those in managed care. MCOs are required to coordinate with the BHSA. Opioid drugs obtained through a pharmacy are the responsibility of the MCO, but all other substance abuse related treatment services are handled by the BHSA. Traditional behavioral health services, including inpatient and outpatient services, are generally covered through the MCO while non-traditional services are handled by the BHSA. Magellan, which was awarded the BHSA contract, provides enhanced care coordination for eligible members.

Six100  different MCOs – Anthem, Coventry, INTotal (Inova), Kaiser Permanente, Optima (Sentara), and Virginia Premier (VCUHS) currently operate in the state. Five of these plans are NCQA accredited as required under the state’s managed care contracts; the sixth (Kaiser Permanente) was currently under review for accreditation at the time of this report.101  Virginia continues to enhance the quality requirements and service coordination under managed care contracts through the Quality Improvement program activities, Quality Collaborative and three new initiatives:

  • Value Based Purchasing through Pay-for-Performance Initiative: The state has begun to implement a pay-for-performance program with incentive awards for their MCOs based on HEDIS measures which are designed to increase members’ use of preventive services and increase administrative efficiency. Performance incentive scores, based on HEDIS 2015, will be finalized by March 2016.
  • Medallion Care System Partnership: In FY 2014, the state modified existing managed care contract requirements to require the plans to develop two provider partnership projects that allow the MCOs to expand and test different methodologies of provider payment and incentives and support and develop patient centered medial homes (PCMHs).
  • Expedited Enrollment: In August 2014, the state went live with an expedited enrollment process to get MCO-eligible beneficiaries into MCOs more quickly with a special focus on pregnant women to improve birth outcomes as well as reducing churn.102 

Commonwealth Coordinated Care Initiative

Virginia began implementation of its Commonwealth Coordinated Care initiative in March 2014; the initiative is one of the ACA-authorized Financial Alignment Demonstrations designed to better coordinate care across Medicare and Medicaid services for those dually eligible for both programs. Commonwealth Coordinated Care will use a capitated managed care model to provide all services (Medicare and Medicaid) through one Medicare-Medicaid Plan, or MMP. The state is rolling out the initiative regionally; each region began with passive enrollment for a period followed by auto-enrollment into managed care plans if one has not been selected. As of August 1, 2014, the state had enrolled 11,176 individuals into the program across the five regions; approximately 13,000 more individuals were auto-enrolled into an MMMP in September. Phased implementation is set to be completed in November 2014.103  An estimated 75,000 beneficiaries are eligible to participate in the program.104 

Virginia Medicaid Policy Changes in SFY 2014 and 2015105 
Eligibility, Application and Renewal Policies106 
  • Income eligibility for the Family Planning waiver was reduced down to 100% FPL effective January 1, 2014. The state plans to restore the income limit for family planning waiver to 200% FPL in SFY 2015.
  • Plan to implement 1115 waiver with limited benefits to extend coverage to adults with incomes below 100% FPL with severe mental illness.


Provider Rates and Provider Fees/Taxes
  • Increased payment rates for inpatient and outpatient hospitals, MCOs and nursing homes in SFY 2014. Other rates were held flat.
  • Plan to increase payment rates for outpatient hospitals, MCOs and nursing homes while holding other rates flat in SFY 2015.


Benefits and Pharmacy
  • Added nutritional counseling, inpatient substance abuse services in Medicaid Works program (Jan 2014).
  • Modified the allowable dental deductions for dental expenses in long-term care settings (restriction).
  • Plan to add mental health drugs to the state’s Preferred Drug List in SFY 2015.
  • Plan to expand comprehensive dental benefits to pregnant women (both in Medicaid and FAMIS).


Managed Care and Care Coordination
  • Implemented the Commonwealth Coordinated Care Initiative, Virginia’s Financial Alignment Demonstration to coordinate care for those dually eligible for Medicare and Medicaid in SFY 2014.
  • Enrolled foster care and adoption assistance children into MCOs in SFY 2014. Plan to enroll some qualifying Elderly and Disabled Consumer Direction waiver members into MCOs (for acute care only) in Dec 2014.
  • Implemented a Behavioral Health Services Administrator to manage the behavioral health services for the FFS population as well as certain components of behavioral health for those in managed care in SFY 2014.
  • Starting process to adopt performance incentive awards for MCOs.
  • Modified managed care contract requirements on provider partnerships and incentives to allow MCOs to expand and test different methodologies of payment and incentives and support PCMHs.
  • Enhanced program contact language to support program integrity efforts and collaboration; created new technical manual and reporting requirements to enhance compliance efforts.
  • Created new expedited MCO enrollment process to improve health outcomes, reduce churn and improve provider relations.
  • Developed a capitation adjustment process to handle specialty drugs and reinsurance product for the MCOs.
  • Plan to implement Health Homes for adults with severe mental illness and children with serious emotional disturbances.


Long Term Care
  • Expanded the number of people served in the community by expanding those served in HCBS waivers, PACE programs, and closing/down-sizing state institutions (transitioning residents to the community) in both SFYs.


Issue Brief: West Virginia

Economic and Budget Outlook

Economy

After decreasing by 1.4 percent in 2012, the West Virginia economy grew by 5.1 percent in 2013, the third highest rate in the nation behind only North Dakota and Wyoming.107  Growth in the state’s real Gross Domestic Product (GDP) was almost entirely driven by the mining sector, comprised primarily by the coal and natural gas industries. Without this growth, the state’s economy would have contracted as growth in other sectors was relatively flat or decreased including notable decreases in the government employment and construction sectors (-.15 and -.34 percentage points, respectively). As a result, the mining sector grew to 17.8 percent of GDP (compared to only 6.5 percent in 2002), reflecting the boom in shale gas extraction even as coal production has declined over the last several years.108  Positive GDP growth did not translate into employment gains, however, as resident based employment fell by 3,500.109  The size of the West Virginia workforce also shrank, but by a larger amount – 10,400 – resulting in a net decrease in the state’s unemployment rate from 7.2 percent in 2012 to 6.5 percent in 2013, the lowest unemployment rate since 2008. In 2013, government made up the largest share of nonfarm payroll employment accounting for one in five jobs in the state.110 

State Revenues

With the exception of a one-year state revenue rebound of 8.1 percent in FY 2011, West Virginia state revenue growth has remained low since the onset of the Great Recession with an average annual growth rate of only 0.7% between FY 2008 and FY 2013.111  Also for the first time in modern history, the state experienced two consecutive years of negative growth in state revenues for FY 2013 and FY 2014.112  In addition to the impact of the economic downturn, revenue collections have been negatively affected by a temporary motor vehicle tax credit program, the phasing out of a sales tax on groceries for home consumption between January 2012 and July 2013 and the phasing in of a coal severance tax revenue sharing program benefiting local county governments between FY 2013 and FY 2017. Looking ahead, state revenue collections are expected to increase by roughly 3.4 percent per year between FY 2013 and FY 2019.113 

Budget for FY 2014 and FY 2015

At the start of CY 2014, Governor Earl Ray Tomblin faced both a current year budget shortfall for FY 2014 of $81.5 million and a projected budget gap for FY 2015 of $216 million. To close the FY 2014 shortfall, the Governor implemented a hiring freeze in December 2013 and in January 2014 called on state agencies to make mid-year budget cuts totaling $33 million.114  In January, he offered an Executive Budget proposal for FY 2015 that closed the projected budget gap which was driven largely by projected Medicaid expenditure increases.115 

The Governor’s FY 2015 budget proposal cut agency spending by $70 million, made $14.5 million in one-time reductions, used $50.4 million from FY 2014 supplemental appropriations and Medicaid surplus, and relied on $83.8 million from the state’s Rainy Day Fund.116  Despite dipping into the Rainy Day Fund, the Governor’s budget was designed to ensure the fund’s balance would remain above the 15 percent threshold recommended by Wall Street rating agencies thereby assuring the state would retain its favorable bond ratings.117  His FY 2015 budget also included funding for a 2 percent pay raise for teachers and school service personnel, a $504 million across the board pay raise for state employees, and an $87 million increase for Medicaid.

On March 14, 2014, the West Virginia legislature passed a FY 2015 state budget with higher spending levels that the Governor determined would increase the budget gap in future years. To avoid further depleting the state’s Rainy Day Fund, Governor Tomblin exercised his line-item veto authority to approve the FY 2015 budget after cutting nearly $67 million. Most of the cuts ($47.5 million) were to a transfer appropriation from the Rainy Day Fund to the Medical Services Trust Fund to help fund a portion of the Medicaid budget. The Governor planned to restore the Medicaid funding in part from revenues generated by separate legislation passed during a one-day legislative special session (the so-called “haircut bill”) designed to funnel lottery revenues into the state’s reserve fund.118 

The second largest reduction was to the much debated appropriation for Medicaid in-home care for seniors. The House of Delegate’s original budget included a $12 million increase intended to cover the nearly 2,300 person waiting list. The budget as passed cut that funding in half.119  The Governor cut an additional $3.5 million; the remaining funding would allow the state to cover 335 additional waiver slots compared to the year before but substantially lower than the 2,300 proposed by the House of Delegates.120  Other cuts included reductions to local economic development assistance, family resource networks, legal services for domestic violence victims, cars and equipment for the State Police, in-home family education, child advocacy centers, libraries and senior centers.

2014 ACA Coverage Expansions

The 2010 Affordable Care Act (ACA) is designed to extend coverage to many of the 47 million nonelderly uninsured people nationwide, including the 267,000 uninsured West Virginians. The ACA enhances coverage across the income spectrum by expanding Medicaid eligibility for low-income adults and by providing premium tax credits to help people with moderate incomes (100-400% FPL) to purchase insurance directly through new Health Insurance Marketplaces.121  These provisions became effective during SFY 2014 with significant implications for state budgets and Medicaid programs across the country, including West Virginia.

Marketplace Coverage

The ACA provided states the option of establishing their own Marketplaces or relying on the federally-facilitated Marketplace (FFM), www.healthcare.gov. West Virginia was one of seven states that chose a “State Partnership Marketplace” model allowing the state to rely on the FFM but retain control over plan management and some consumer assistance activities.122  For 2014, one health insurance company (Highmark Blue Cross Blue Shield) offers 13 Qualified Health Plans in the individual Marketplace.123  The state received over $20.8 million in federal funding – including an Exchange Planning and two Level One Establishment grants – to develop its In-Person Assisters (IPAs) program and plan management activities.124  CMS also awarded and funded Navigator grants to three West Virginia organizations and 27 health centers were awarded outreach and enrollment assistance grants from HRSA to assist eligible consumers to enroll in coverage.125  As of April 19, 2014, over 19,800 West Virginians had selected a Marketplace plan (approximately 17% of the estimated 117,000 individuals eligible for Marketplace coverage126 ), 86 percent of whom qualified for financial assistance.127 

Medicaid Expansion

On May 7, 2013, Governor Tomblin approved the ACA Medicaid expansion for West Virginia increasing the income standard in 2014 for previously eligible low-income adults from 16 percent and 31 percent of the FPL128  for jobless parents of dependent children and working parents of dependent children, respectively, to 138 percent and extending coverage to non-disabled childless adults for the first time. While the state’s actuaries had predicted new enrollments in the first year of about 63,000, actual enrollment through the end of June 2014 increased by over 130,000 – more than twice the projected first year increase.129  According to CMS, West Virginia had the fourth highest enrollment increase among all expansion states through June – a 45 percent increase compared to enrollment prior to the beginning of Marketplace open enrollment in October 2013.130 

West Virginia was one of only a handful of states taking advantage of an optional enrollment strategy offered by CMS that allows states to use income information from the Supplemental Nutritional Assistance Program (SNAP) to conduct “administrative transfers.” Using this strategy, West Virginia identified 118,000 people who were eligible for SNAP as well parents of children receiving Medicaid and sent them letters indicating that they would automatically be enrolled in the Medicaid expansion if they signed and returned the letter. State staff also made follow-up phone calls. After receiving a positive response, the state sent out a second round of letters and made more phone calls. An estimated 71,000 individuals responded to the letters and calls.131 

Delivery System Reforms

Managed Care

West Virginia has operated a risk-based Medicaid managed care program – Mountain Health Trust – since September 1996. Under this program, the state currently contracts with four managed care organizations (“MCOs” – Coventry Health Care of West Virginia, The Health Plan of the Upper Ohio, Unicare, and West Virginia Family Health) to provide medically necessary Medicaid services to low-income families, children and pregnant women in a 55 county area; behavioral health, long term care, and non-emergency medical transportation services are “carved out” of the MCO contracts.132  Children’s dental services were added to the state’s MCO contracts in FY 2014, and the state plans to add behavioral health services in 2015. Also, the state plans to enroll the ACA Medicaid expansion population into MCOs in FY 2015 or early FY 2016.133  As of September 2014, there were approximately 200,000 members enrolled in Mountain Health Trust.134  West Virginia also operates a small primary care case management program (Physician Assured Access System” (PAAS) program.)135  As of July 1, 2014, the state estimates that approximately 41 percent of its members were enrolled in MCOs, 1 percent were enrolled in the PAAS program and 58 percent remained in fee-for-service.136 

Health Homes

On July 1, 2014, the West Virginia Department of Health and Human Resources, Bureau for Medical Services launched a Health Homes initiative (authorized under ACA Section 2703) focused on members in a six county region who suffer from bipolar disorder and who may have Hepatitis B or C.137  The Health Home consists of a multi-disciplinary team that helps members manage medical conditions and medications, remember doctor appointments and understand medical tests and results. Teams will also work with doctors, counselors and specialists to support recovery and prevent other complications. As of July 2014, eight providers are approved to serve as Health Homes: Cabin Creek Health Systems, FMRS Health Systems, Marshall Health, Prestera Center for Mental Health, Process Strategies, Southern Highlands, WV Health Right, and WomenCare, Inc.138 

West Virginia Medicaid Policy Changes FY 2014 and FY 2015139 
Provider Rates and Provider Taxes/ Assessments
  • Increased inpatient hospital rates, MCO rates and nursing facility rates; all other rates were held flat in FY 2014.
  • Plan to increase rates for inpatient hospitals, MCOs and nursing facilities; plan to hold all other rates flat in FY 2015.
  • Plan to increase the hospital provider tax in FY 2015.
Eligibility, Application and Renewal Changes
  • Implemented Medicaid expansion, increasing eligibility for adults up to 138% FPL in FY 2014.
  • Adopted options to enroll people based on SNAP eligibility and parents based on children’s income eligibility in 2014.
Benefit Changes
  • Eliminated the Mountain Health Choices Basic and Enhanced benchmark benefit plans resulting in the elimination of coverage for weight management services for children and TANF-related adults. (December 31, 2013)
Copayment Changes
  • In FY 2014, imposed new copayment requirements on all non-exempt MAGI based eligibility groups including:
    • 0-50%FPL: $0.50 – $3 for prescription drugs (tiered by drug price); and $8 for non-emergency use of the ER
    • 50-100% FPL: $0.50 – $3 for prescription drugs (tiered by drug price); $8 for non-emergency use of the ER, $2 on outpatient services and $35 for inpatient hospital
    • Over 100% FPL: $0.50 – $3 for prescription drugs (tiered by drug price); $8 for non-emergency use of the ER, $4 on outpatient services and $75 for inpatient hospital.
Pharmacy Changes
  • Began receiving rebates for diabetic testing supplies in FY 2014.
  • Eliminated the Mountain Health Choices Basic and Enhanced benchmark benefit plans resulting in the elimination of the limit on monthly prescriptions in FY 2014.
  • Plan to add oncology, HIV drugs to manage them more effectively and obtain supplemental rebates in FY 2015.
Managed Care and Delivery System and Payment Reforms
  • Dental benefits for children added to managed care benefit package in FY 2014.
  • Plan to enroll the ACA Medicaid expansion population into risk-based managed care plans in FY 2015.
  • Plan to add behavioral health services to the managed care benefit package in FY 2015.
  • Included withhold provisions related to quality standards in the FY 2015 MCO contracts.
  • Implemented Health Homes (under ACA Section 2703) effective July 1, 2014.
Long Term Services and Supports Rebalancing
  • Expanded the number of persons served in home and community-based settings by adding slots to the Aged and Disabled waiver in FY 2014.
  • Expanded the number of persons served in home and community-based settings by adding slots to the Aged and Disabled, the Individuals with Developmental Disabilities and the Traumatic Brain Injury Waivers in FY 2015.
Program Integrity
  • On October 1, 2013, began full implementation of a new case management tool, I-Sight that will assist with reporting and fraud referrals as well as tracking recoveries and actions on ongoing and historical audits.
  • Began structured collaboration with the state’s MCOs by hosting quarterly meetings with the MCOs, Medicaid Fraud Control Unit and the Office of Program Integrity in FY 2014.
  • Full implementation of the Data Warehouse/Decision Support System by late summer 2014, will provide the state with detailed data of the full range of managed care services which historically had not been easily accessible as well as enhancing the existing data mining tool, JSURS for fee-for-service audits.
  • Plan to hold an annual meeting with the Office of Program Integrity to identify common provider issues and new fraud/abuse schemes.

This brief was prepared by Laura Snyder from the Kaiser Family Foundation, and Kathleen Gifford, Eileen Ellis and Jenna Walls of Health Management Associates (HMA.)

The authors express their appreciation the Medicaid directors and staff in each of these four states who reviewed these case studies.

Endnotes

  1. “Regional and State Employment and Unemployment Archived News Releases”, United States Department of Labor, Bureau of Labor Statistics website, Accessed September 16, 2014. http://www.bls.gov/schedule/archives/laus_nr.htm#2014 ↩︎
  2. “Monthly Revenue Report” Michigan Senate Fiscal Agency website, Accessed September 16, 2014. http://www.senate.michigan.gov/sfa/Publications/MonthRev/monthrev.html. ↩︎
  3. “ Regional and State Employment and Unemployment Archived News Releases”, United States Department of Labor, Bureau of Labor Statistics website, Accessed September 16, 2014. http://www.bls.gov/schedule/archives/laus_nr.htm#2014 ↩︎
  4. Michigan Senate Fiscal Agency, Annual Appropriations Report, FY 1999-2000 through FY 2014-15, http://www.senate.michigan.gov/sfa/Publications/Approps/appropsreports.html ↩︎
  5. Michigan Senate Fiscal Agency, A Summary of Quality Assurance Assessment Programs, http://www.senate.michigan.gov/sfa/Publications/Notes/2007Notes/NotesJulAug07df.pdf. ↩︎
  6. Michigan Senate Fiscal Agency, Annual Appropriations Report, FY 1999-2000 through FY 2014-15, http://www.senate.michigan.gov/sfa/Publications/Approps/appropsreports.html ↩︎
  7. “Michigan Department of Community Health: Senate Bill 763 Decision Document”, Michigan Senate Fiscal Agency website, September 16, 2014. http://www.senate.michigan.gov/sfa/Departments/DecisionDoc/DDdch_web.pdf. ↩︎
  8. Kaiser Commission on Medicaid and the Uninsured, How Will the Uninsured in Michigan Fare Under the Affordable Care Act? (Kaiser Family Foundation, January 2014.) https://modern.kff.org/health-reform/fact-sheet/state-profiles-uninsured-under-aca-michigan/. ↩︎
  9. State Health Facts, State Decisions for Creating Health Insurance Marketplaces. (Kaiser Family Foundation), https://modern.kff.org/health-reform/state-indicator/state-decisions-for-creating-health-insurance-marketplaces/. State Marketplace Profiles: Michigan. (Kaiser Family Foundation, November 2013.) https://modern.kff.org/health-reform/state-profile/state-exchange-profiles-michigan/. ↩︎
  10. State Health Facts, Total Number of Insurers Participating in the Individual Health Insurance Marketplace. (Kaiser Family Foundation), https://modern.kff.org/health-reform/state-indicator/total-number-of-insurers-participating-in-the-individual-health-insurance-marketplace/. ↩︎
  11. State Health Facts, Marketplace Enrollment as a Share of the Potential Marketplace Population. (Kaiser Family Foundation), https://modern.kff.org/health-reform/state-indicator/marketplace-enrollment-as-a-share-of-the-potential-marketplace-population/. ↩︎
  12. State Health Facts, Marketplace Enrollees by Financial Assistance Status. (Kaiser Family Foundation), https://modern.kff.org/other/state-indicator/marketplace-enrollees-by-financial-assistance-status/. ↩︎
  13. “Executive Budget Fiscal Years 2014 and 2015”, Michigan Department of Management and Budget website, Accessed September 16, 2014. http://www.michigan.gov/documents/budget/1_410735_7.pdf?20140916114722. ↩︎
  14. “FY 2013-14 Appropriation Report Department of Community Health, Public Act 59 of 2013, FY 2012-13 and FY 2013-14 Supplemental Actions to Date”, ,Michigan House Fiscal Agency website, Accessed September 16, 2014 http://house.mi.gov/hfa/PDF/CommunityHealth/DCH_Intent_Document_fy13-14.pdf. ↩︎
  15. Per an October 2014 interview with officials of the Medical Services Administration, the Healthy Behaviors Protocol includes a goal that the appointment is completed within 150 days of enrollment. ↩︎
  16. MCO enrollment is optional for Native Americans and others that meet the state’s Medicaid health plan exemption criteria. ↩︎
  17. “House Bill 4714 (2013)”, Michigan Legislative Website, Accessed September 16, 2014. http://www.legislature.mi.gov/(S(wz0uga55dk5zbu55itnhm155))/mileg.aspx?page=getObject&objectName=2013-HB-4714. ↩︎
  18. Ibid. ↩︎
  19. “Healthy Michigan Plan, A Waiver Amendment Request Submitted Under Authority of Section 1115 of the Social Security Act”, Michigan Department of Community Health website, Accessed September 16, 2014. http://www.michigan.gov/documents/mdch/Healthy_Michigan_Waiver_Amendment_for_Web_439514_7.pdf ↩︎
  20. “House Bill 4714 (2013)”, Michigan Legislature website, Accessed September 16, 2014. http://www.legislature.mi.gov/documents/2013-2014/billanalysis/Senate/pdf/2013-SFA-4714-F.pdf. ↩︎
  21. “Healthy Michigan Plan Applicant Information”, Michigan Department of Community Health website, Accessed September 8, 2014. http://www.michigan.gov/mdch/0,4612,7-132-2943_66797—,00.html. ↩︎
  22. “Multi-Payer Advanced Primary Care Practice.” Centers for Medicare and Medicaid Services – Innovation Center website. Accessed September 2014. http://innovation.cms.gov/initiatives/Multi-Payer-Advanced-Primary-Care-Practice/. ↩︎
  23. “About MiPCT”, Michigan Primary Care Transformation Project website, Accessed September 16, 2014. http://mipct.org/about-us/. ↩︎
  24. “State Innovation Models Initiative Round 2 Fact Sheet.” Centers for Medicare and Medicaid Services – Innovation Center, May 22, 2014.) http://www.cms.gov/Newsroom/MediaReleaseDatabase/Fact-sheets/2014-Fact-sheets-items/2014-05-22.html. ↩︎
  25. “Reinventing Michigan’s Health Care System, Blueprint for Health Innovation”, Michigan Department of Community Health website, Accessed September 16, 2014. http://www.michigan.gov/documents/mdch/Michigan_Blueprint_APPENDICES_REMOVED_454499_7.pdf. ↩︎
  26. “State Innovation Models Initiative Round 2 Fact Sheet.” Centers for Medicare and Medicaid Services – Innovation Center, May 22, 2014.) http://www.cms.gov/Newsroom/MediaReleaseDatabase/Fact-sheets/2014-Fact-sheets-items/2014-05-22.html ↩︎
  27. As of June 2014, CMS had not yet approved this state plan amendment, but the state had state legislation calling for implementation to begin July 2014. ↩︎
  28. “Health Homes”, Michigan Department of Community Health website, Accessed September 16, 2014. http://www.michigan.gov/mdch/0,4612,7-132-2941_58005-251825–,00.html. ↩︎
  29. “Integrated Care for People Eligible for Medicare and Medicaid”, Michigan Department of Community Health website, Accessed September 14, 2014. http://www.michigan.gov/mdch/0,4612,7-132-2939__2939__2939-259203–,00.html. ↩︎
  30. Populations included in the demonstration are: full benefit dual eligible beneficiaries age 21 and older are eligible to enroll; those enrolled in the MI Choice § 1915(c) HCBS wavier, Money Follows the Person, PACE, or an employer-sponsored Medicare Advantage plan may participate if they disenroll from their existing program. The demonstration excludes the following populations: dual eligible beneficiaries previously disenrolled from Medicaid managed care due to uncooperative or disruptive behavior, those who are eligible as Additional Low Income Medicare Beneficiaries/Qualified Individuals or through a Medicaid spend down, state psychiatric hospital residents, those with commercial HMO coverage, and those who elect hospice services. MaryBeth Musumeci, Financial and Administrative Alignment Demonstrations for Dual Eligible Beneficiaries Compared: States with Memoranda of Understanding Approved by CMS, (Kaiser Family Foundation, July 24, 2014.) https://modern.kff.org/report-section/financial-and-administrative-alignment-demonstrations-for-dual-eligible-beneficiaries-compared-appendix-michigan/. ↩︎
  31. Beneficiaries subject to Medicare reassignment effective January 1, 2015 will not be passively enrolled in the demonstration in 2015 but will be eligible for passive enrollment in 2016. MaryBeth Musumeci, Financial and Administrative Alignment Demonstrations for Dual Eligible Beneficiaries Compared: States with Memoranda of Understanding Approved by CMS, (Kaiser Family Foundation, July 24, 2014.) https://modern.kff.org/report-section/financial-and-administrative-alignment-demonstrations-for-dual-eligible-beneficiaries-compared-appendix-michigan/. ↩︎
  32. U.S Bureau of Labor Statistics; Labor Force Statistics from the Current Population Survey; Accessed at: http://www.bls.gov/cps/. ↩︎
  33. Census Bureau; State Government Tax Collections SFY 2008-2013; Access September 22, 2014 at: http://www.census.gov/govs/statetax/index.html. ↩︎
  34. National Association of State Budget Officers; The Fiscal Survey of the States: Fall 2008; December 2008. The Fiscal Survey of the Sates: Fall 2013; Accessed at: http://www.nasbo.org/publications-data/fiscal-survey-of-the-states/archives. ↩︎
  35. National Association of State Budget Officers; The Fiscal Survey of the States: Fall 2010; Table 26; Accessed at: http://www.nasbo.org/publications-data/fiscal-survey-of-the-states/archives. ↩︎
  36. National Association of State Budget Officers; The Fiscal Survey of the States: Fall 2011; Table 30; Accessed at: http://www.nasbo.org/publications-data/fiscal-survey-of-the-states/archives. ↩︎
  37. U.S Bureau of Labor Statistics; Labor Force Statistics from the Current Population Survey; Accessed at: http://www.bls.gov/cps/. ↩︎
  38. Salt Lake Chamber; Utah ranked top pro-business state three years running; Report on Pollina Top 10 Pro-Business Study; July 17, 2014; Accessed at: http://slchamber.com/blog/category/chamber-news/utah-rankings. ↩︎
  39. Michael B. Sauter, Thomas C. Frohlich et.al; Best and Worst Run States: A 50 State Survey; 24/7 Wall Street; November 23, 2013; Accessed at: http://www.usatoday.com/story/money/business/2013/11/22/best-worst-run-states/3671359/. ↩︎
  40. U.S Bureau of Labor Statistics; Unemployment Rates for States Average Annual Rankings Year 2013 ↩︎
  41. Governor Gary R. Herbert; Budget Recommendations: Fiscal Year 2015 Fiscal Year 2014 Supplementals; Accessed at: http://www.utah.gov/governor/docs/budget/FY2014_2015_Recommendations.pdf. ↩︎
  42. Utah Constitution, Article XIII Section 5; http://le.utah.gov/code/CONST/htm/00I13_000500.htm. ↩︎
  43. http://le.utah.gov/interim/2014/pdf/00003542.pdf. ↩︎
  44. Governor’s Office of Management and Budget; Overview of SUCCESS; Accessed at: http://gomb.utah.gov/operational-excellence/overview-of-success/. ↩︎
  45. Governor Gary R. Herbert; Budget Recommendations: Fiscal Year 2015 Fiscal Year 2014 Supplementals; Accessed at: http://www.utah.gov/governor/docs/budget/FY2014_2015_Recommendations.pdf. ↩︎
  46. Ibid. ↩︎
  47. Henry J. Kaiser Family Foundation; State Health Facts; Federal Medical Assistance Percentage (FMAP) and Multiplier; 2013 and 2015; Accessed at: https://modern.kff.org/state-category/medicaid-chip/. ↩︎
  48. Kaiser Commission on Medicaid and the Uninsured; The Utah Health Care Landscape; Fact Sheet; September 2014. https://modern.kff.org/health-reform/fact-sheet/the-utah-health-care-landscape/. ↩︎
  49. National Federation of Independent Business v. Sebilius; June 28, 2012. ↩︎
  50. Kaiser Commission on Medicaid and the Uninsured; Status of State Action on the Medicaid Expansion Decision; As of August 28, 2014. ↩︎
  51. Utah Governor’s Office of Economic Development: Office of Consumer Health Services website: http://business.utah.gov/programs/ochs/. ↩︎
  52. Gary Cohn, Director, CMS Center for Consumer Information and Insurance Oversight; Letter to Governor Gary Herbert; May 10, 2013; Accessed at: https://www.cms.gov/CCIIO/Resources/Fact-Sheets-and-FAQs/Downloads/utah-marketplace-letter-5-10-2013-508.pdf. ↩︎
  53. State Health Facts, Total Number of Insurers Participating in the Individual Health Insurance Marketplace. (Kaiser Family Foundation), https://modern.kff.org/health-reform/state-indicator/total-number-of-insurers-participating-in-the-individual-health-insurance-marketplace/. ↩︎
  54. State Health Facts, Marketplace Enrollment as a Share of the Potential Marketplace Population. (Kaiser Family Foundation), https://modern.kff.org/health-reform/state-indicator/marketplace-enrollment-as-a-share-of-the-potential-marketplace-population/. ↩︎
  55. State Health Facts, Marketplace Enrollees by Financial Assistance Status. (Kaiser Family Foundation), https://modern.kff.org/other/state-indicator/marketplace-enrollees-by-financial-assistance-status/. ↩︎
  56. Governor’s Monthly News Conference, (KUED7, January 24, 2014) http://www.kued.org/video/governors-monthly-news-conference-january-2014. ↩︎
  57. Utah Governor Gary Herbert, “Governor unveiled an alternative plan to Medicaid expansion – The ‘Healthy Utah Plan’ fixes the hole without expanding Medicaid” (February 27, 2014), http://www.utah.gov/governor/news_media/article.html?article=9747. ↩︎
  58. Utah Department of Health, Healthy Utah Principles and Strategies: Update on CMS Discussions, (Presentation to Utah Health Reform Taskforce, August 28, 2014.) http://le.utah.gov/interim/2014/pdf/00004059.pdf. ↩︎
  59. Lisa Riley Roche, “Herbert reaches understanding ‘conceptually’ on Medicaid expansion” (Deseret News, September 9, 2014), http://www.deseretnews.com/article/865610609/Herbert-reaches-understanding-conceptually-on-Medicaid-expansion.html. Kristen Moultan, The Salt Lake Tribune; Utah Gov. Gary Herbert: We have a “conceptual” deal on Medicaid; September 10, 2014; Accessed at: http://www.sltrib.com/sltrib/news/58395005-78/utah-health-herbert-medicaid.html.csp?. ↩︎
  60. “Healthy Utah Negotiations Moving Forward.” Utah Governor Gary Herbert (September 17, 2014.) http://blog.governor.utah.gov/2014/09/healthy-utah-negotiations-moving-forward/. ↩︎
  61. “Non-traditional” Medicaid adults eligible through 1925 and 1931 TANF-related pathways, and medically needy non-ABD recipients. ↩︎
  62. Utah Department of Health, Medicaid Managed Care website: accessed at: https://medicaid.utah.gov/managed-care. ↩︎
  63. Utah response to the 2014 Medicaid Budget Survey for State Fiscal Years 2014 and 2015, Kaiser Commission on Medicaid and the Uninsured. ↩︎
  64. Bureau of Economic Analysis, Quarterly Gross Domestic Product by State, (Department of Commerce.) Accessed August 2014. http://www.bea.gov/regional/index.htm. ↩︎
  65. Bureau of Economic Analysis, State Personal Income, (Department of Commerce.) Accessed August 2014. http://www.bea.gov/regional/index.htm. ↩︎
  66. Bureau of Labor Statistics, Local Area Unemployment Statistics, (Department of Commerce.) Accessed August 2014. http://data.bls.gov/timeseries/LASST510000000000003. ↩︎
  67. Virginia Department of Taxation, The Economic Outlook and Revenue Forecast through Fiscal Year 2016, (for review by the Governor’s Advisory Council on Revenue Estimates, November 25, 2013.) http://finance.virginia.gov/media/1791/2013NovemberGACRE.pdf. ↩︎
  68. Virginia Department of Taxation, The Economic Outlook and Revenue Forecast through Fiscal Year 2016, (for review by the Governor’s Advisory Council on Revenue Estimates, November 25, 2013.) http://finance.virginia.gov/media/1791/2013NovemberGACRE.pdf. ↩︎
  69. Timberlake, Daniel S. Governor McAuliffe’s Proposed Biennial Budget for the 2014-2016 Biennium HB/SB 5003, (Virginia Department of Planning and Budget, March 2014.) http://www.dpb.virginia.gov/forms/20140324-1/BudgetDirectorsPresentationHB-SB5003.pdf. ↩︎
  70. Office of the Governor, Governor McAuliffe’s Address to the Joint Money Committees of the General Assembly, (State of Virginia, August 15, 2014.) https://governor.virginia.gov/news/newsarticle?articleId=5800. ↩︎
  71. Virginia Department of Taxation, The Economic Outlook and Revenue Forecast through Fiscal Year 2018, (for review by the Governor’s Advisory Council on Revenue Estimates, August 1, 2014.) http://finance.virginia.gov/media/3045/aug-2014-gacre-book.pdf. ↩︎
  72. Brown, Richard D. Review of General Fund Revenues and the Virginia Economy for Fiscal Year 2014 The Interim Economic Outlook and Revenue Forecast for Fiscal Years 2015 through 2016: A Presentation to the Senate Finance, House Appropriations, and House Finance Committees, (Virginia Department of Finance, August 15, 2014.) http://finance.virginia.gov/media/3044/rdb-jmc-presentation-w-appendix-8-15-14.pdf. ↩︎
  73. Office of the Governor, Virginia Leaders Announce Comprehensive Budget Deal, (State of Virginia, September 15, 2014.) https://governor.virginia.gov/newsroom/newsarticle?articleId=6472. ↩︎
  74. Ibid. ↩︎
  75. Kaiser Commission on Medicaid and the Uninsured, How Will the Uninsured in Virginia Fare Under the Affordable Care Act? (Kaiser Family Foundation, January 2014.) https://modern.kff.org/health-reform/fact-sheet/state-profiles-uninsured-under-aca-virginia/. ↩︎
  76. National Federation of Independent Business v. Sebilius; June 28, 2012. ↩︎
  77. Virginia’s eligibility level for 1931 parents varies by region, the 41% FPL reflects a weighted average of these three eligibility levels. ↩︎
  78. DMAS staff analysis using Urban Institute and Kaiser Commission on Medicaid and the Uninsured estimates based on the Census Bureau’s March 2011 and 2012 Current Population Survey (CPS: Annual Social and Economic Supplements). An additional 123,000 Virginians with incomes between 100 and 138%FPL who may currently have Marketplace coverage would also qualify for Medicaid coverage if the state were to expand. These estimates differ slightly from estimates put forward by the state of Virginia for its Marketplace Virginia plan, which estimated up to 400,000 individuals that the state would be able to provide subsidies using federal Medicaid funds to purchase private health insurance. The main difference is that the state estimates include some individuals who are currently covered through other programs, such as pregnant women covered through the state’s CHIP program. Kaiser Commission on Medicaid and the Uninsured, The Virginia Health Care Landscape. (Kaiser Family Foundation, May 2014.) https://modern.kff.org/medicaid/fact-sheet/the-virginia-health-care-landscape/#endnote_link_112148-70. ↩︎
  79. State Health Facts, State Decisions for Creating Health Insurance Marketplaces. (Kaiser Family Foundation), https://modern.kff.org/health-reform/state-indicator/state-decisions-for-creating-health-insurance-marketplaces/ ↩︎
  80. State Health Facts, Total Number of Insurers Participating in the Individual Health Insurance Marketplace. (Kaiser Family Foundation), https://modern.kff.org/health-reform/state-indicator/total-number-of-insurers-participating-in-the-individual-health-insurance-marketplace/. ↩︎
  81. State Health Facts, Marketplace Enrollment as a Share of the Potential Marketplace Population. (Kaiser Family Foundation), https://modern.kff.org/health-reform/state-indicator/marketplace-enrollment-as-a-share-of-the-potential-marketplace-population/. ↩︎
  82. State Health Facts, Marketplace Enrollees by Financial Assistance Status. (Kaiser Family Foundation), https://modern.kff.org/other/state-indicator/marketplace-enrollees-by-financial-assistance-status/. ↩︎
  83. Luke Johnson, Virginia Medicaid Expansion Got a Boost with Terry McAuliffe’s Win, But Republicans are Still Against It,” Huffington Post, November 6, 2013, accessed at http://www.huffingtonpost.com/2013/11/06/virginia-medicaid-expansion_n_4227921.html. ↩︎
  84. Office of the Governor, Governor McAuliffe Announces Proposed Budget Amendments, (State of Virginia, January 20, 2014.) https://governor.virginia.gov/news/newsarticle?articleId=2694. ↩︎
  85. Medicaid Innovation and Reform Commission, About the Commission, (Virginia General Assembly.) Accessed August 2014. http://mirc.virginia.gov/about.html. ↩︎
  86. In addition, the original plan included a provision for incentives related to work and job search activity, though the detail of this provision was not further defined as part of the proposal. ↩︎
  87. Senate Finance Committee, Marketplace Virginia Presentation, (Virginia Senate, February 2014.) http://sfc.virginia.gov/pdf/committee_meeting_presentations/2014/020614_Marketplace_Virginia_Briefing.pdf . ↩︎
  88. Speaker Bill Howell, Leadership Statement on Medicaid Expansion Proposal, (General Assembly, February 2014.) http://www.williamjhowell.org/house-leadership-statement-on-medicaid-expansion-proposal/. ↩︎
  89. Office of the Governor, Governor McAuliffe’s Letter to the General Assembly Following Adjournment, (State of Virginia, March 8, 2014.) https://governor.virginia.gov/news/newsarticle?articleId=3583. Timberlake, Daniel S. Governor McAuliffe’s Proposed Biennial Budget for the 2014-2016 Biennium HB/SB 5003, (Virginia Department of Planning and Budget, March 2014.) http://www.dpb.virginia.gov/forms/20140324-1/BudgetDirectorsPresentationHB-SB5003.pdf Office of the Governor, Governor McAuliffe Releases FY2015-16 Budget as Special Session Begins, (State of Virginia, March 24, 2014.) https://governor.virginia.gov/news/newsarticle?articleId=3650. ↩︎
  90. Speaker Bill Howell, Speaker Howell Letter to McAuliffe, (General Assembly, March 5, 2014.) http://www.williamjhowell.org/speaker-howell-letter-to-mcauliffe/. ↩︎
  91. Office of the Governor, Governor McAuliffe’s Statement on the Budget Impasse, (State of Virginia, April 11, 2014.) https://governor.virginia.gov/news/newsarticle?articleId=3854. ↩︎
  92. Around this same time, concerns were raised by some that the Governor may attempt to implement the Medicaid expansion without legislative approval. Republican leadership in the House of Delegates released a legal analysis prepared by Paul D. Clement, who represented plaintiffs in the ACA Supreme Court case, NFIB vs. Secretary Sebelius, and others which argued that the Governor did not have the authority to implement the Medicaid expansion without legislative action. Vozzella, Laura, “McAuliffe explores whether he can expand Medicaid coverage without legislature’s okay.” (Washington Post, May 1, 2014.) http://www.washingtonpost.com/local/virginia-politics/mcauliffe-explores-whether-he-can-expand-medicaid-coverage-without-legislatures-okay/2014/05/01/8ff591f2-d090-11e3-b812-0c92213941f4_story.html. Vozzella, Laura. “Virginia’s McAuliffe has begun planning for Medicaid expansion.” (Washington Post, June 4, 2014.) http://www.washingtonpost.com/blogs/govbeat/wp/2014/06/04/virginias-mcauliffe-has-begun-planning-for-medicaid-expansion/ Speaker Bill Howell, Speaker Howell rules McAuliffe Vetoes Out of Order, (General Assembly, June 23, 2014.) http://www.williamjhowell.org/speaker-howell-rules-mcauliffe-vetoes-out-of-order/. ↩︎
  93. Office of the Governor, Statement of Governor Terence McAuliffe on 2015-2016 Budget Actions, (State of Virginia, June 20, 2014.) https://governor.virginia.gov/news/newsarticle?articleId=5216. ↩︎
  94. Speaker Bill Howell, Speaker Howell rules McAuliffe Vetoes Out of Order, (General Assembly, June 23, 2014.) http://www.williamjhowell.org/speaker-howell-rules-mcauliffe-vetoes-out-of-order/. ↩︎
  95. Office of the Governor, Governor McAuliffe Statement on General Assembly Actions on His Vetoes, (State of Virginia, June 23, 2014.) https://governor.virginia.gov/news/newsarticle?articleId=5242. ↩︎
  96. A Healthy Virginia Health Care Report. (Commonwealth of Virginia, September 8, 2014.) https://governor.virginia.gov/media/3096/a-healthy-virginia-report-final.pdf. ↩︎
  97. This comes after legislation was passed in August 2014 that provides new federal funding for the VA system including emergency spending to pay private providers to help address access issues in the VA system. ↩︎
  98. “Lawmakers Divided on McAuliffe’s “Healthy VA” Plan,” (WVIR-TV NBC News, September 9, 2014. http://www.nbc29.com/story/26489641/lawmakers-divided-on-mcauliffes-healthy-va-plan. ↩︎
  99. Speaker Bill Howell, House and Senate to debate Medicaid expansion in September, (General Assembly, July 9, 2014.) http://www.williamjhowell.org/house-and-senate-to-debate-medicaid-expansion-in-september/. ↩︎
  100. On December 1, 2014, Majestacare (Carillion) will suspend participation as a Medicaid MCO. This will leave six participating plans. ↩︎
  101. Department of Medical Assistance Services, Ten Things You Need To Know About Virginia Medicaid Managed Care Program, (State of Virginia.) http://www.dmas.virginia.gov/Content_atchs/mc/10ThingsMEDALLION3.pdf. ↩︎
  102. Department of Medical Assistance Services, Expedited Enrollment Fact Sheet, (State of Virginia.) http://www.dmas.virginia.gov/Content_atchs/mc/EE%20Fact%20Sheet%20080114.pdf. ↩︎
  103. Department of Medical Assistance Services, Commonwealth Coordinated Care Update – August 2014. (State of Virginia, August 2014.) http://dmasva.dmas.virginia.gov/Content_atchs/altc/August%20Update%20to%20CCC%20Stakeholders.pdf. ↩︎
  104. Musumeci, MaryBeth, Financial and Administrative Alignment Demonstrations for Dual Eligible Beneficiaries Compared: States with Memoranda of Understanding Approved by CMS, (Kaiser Family Foundation, July 2014.) https://modern.kff.org/medicaid/issue-brief/financial-alignment-demonstrations-for-dual-eligible-beneficiaries-compared/. ↩︎
  105. Includes Virginia’s responses to the 2014 Medicaid Budget Survey for State Fiscal Years 2014 and 2015, Kaiser Commission on Medicaid and the Uninsured. ↩︎
  106. In addition, income eligibility for FAMIS MOMS (coverage for pregnant women through CHIP) was terminated effective January 1, 2014. The state plans to reverse this change, reinstating the program to 200% FPL and is seeking approval from CMS to amend the waiver. This is a CHIP-related change and is therefore not included in this report, which is focused on Medicaid. ↩︎
  107. U.S. Bureau of Economic Analysis, Widespread But Slower Growth in 2013, June 11, 2014, accessed at http://www.bea.gov/newsreleases/regional/gdp_state/gsp_newsrelease.htm. ↩︎
  108. Ted Boettner, Why is West Virginia GDP Up and Employment is Down? Fracking?, West Virginia Center on Budget and Policy Blog, July 1, 2014 post, accessed at http://www.wvpolicy.org/why-is-west-virginia-gdp-up-and-employment-down-fracking. ↩︎
  109. WorkForce West Virginia, Review of Economic Activity in 2013, June 2104, accessed at http://www.workforcewv.org/lmi/datarel/AnnualAverages.html. ↩︎
  110. Ibid. ↩︎
  111. West Virginia Executive Budget, Fiscal Year 2015, Volume I Budget Report, p. 8, accessed at http://www.budget.wv.gov/executivebudget/Documents/VIBR2015.pdf . ↩︎
  112. Chris Lawrence, Mid-Year moves allow state to finish in the black, MetroNews, July 2, 2014, accessed at http://wvmetronews.com/2014/07/02/mid-year-moves-allow-state-to-finish-in-the-black/. ↩︎
  113. West Virginia Executive Budget, Fiscal Year 2015, pp. 8-9. http://www.budget.wv.gov/executivebudget/Documents/VIBR2015.pdf . ↩︎
  114. Dave Boucher, Governor Tomblin calls for $33 Million in budget cuts, Charleston Daily Mail, January 8, 2014, accessed at http://www.budget.wv.gov/executivebudget/Documents/VIBR2015.pdf. ↩︎
  115. West Virginia Executive Budget, Fiscal Year 2015, p. 11. http://www.budget.wv.gov/executivebudget/Documents/VIBR2015.pdf . ↩︎
  116. Ted Boettner and Sean O’Leary, The Governor’s FY 2015 Budget: Doing Less With Less, West Virginia Center on Budget & Policy Issue Brief, February 2014, accessed at http://www.wvpolicy.org/wp-content/uploads/2014/02/2014-Budget-Brief-2.25.141.pdf . ↩︎
  117. Governor Tomblin line-item veto letter to The Honorable Natalie E. Tennant, March 19, 2014, accessed at http://www.budget.wv.gov/approvedbudget/Documents/govvetoletter2015.pdf. ↩︎
  118. Associated Press, “Haircut bill among those passed during special session,” March 15, 2014, accessed at http://www.timeswv.com/news/article_23109fca-2975-57e9-8b44-d624a2f3c166.html; Sean O’Leary, The Legislature Gave, and the Governor Hath Taken Away, West Virginia Center on Budget and Policy Blog, March 21, 2014 post,   accessed at   http://www.wvpolicy.org/the-legislature-gave-and-the-governor-hath-taken-away. ↩︎
  119. Dave Boucher, Tomblin Cuts $67 Million from Budget, Charleston Daily Mail, March 20, 2014 accessed at http://www.charlestondailymail.com/News/statehouse/201403200249. ↩︎
  120. Tomblin line-item veto letter. http://www.budget.wv.gov/approvedbudget/Documents/govvetoletter2015.pdf. ↩︎
  121. Kaiser Commission on Medicaid and the Uninsured, How Will the Uninsured in West Virginia Fare Under the Affordable Care Act? (Kaiser Family Foundation, January 2014.) https://modern.kff.org/health-reform/fact-sheet/state-profiles-uninsured-under-aca-west-virginia/. ↩︎
  122. State Health Facts, State Decisions for Creating Health Insurance Marketplaces. (Kaiser Family Foundation), https://modern.kff.org/health-reform/state-indicator/state-decisions-for-creating-health-insurance-marketplaces/ ↩︎
  123. Office of the Assistant Secretary for Planning and Evaluation, U.S. Department of Health & Human Services, Health Insurance Marketplace Premiums for 2014Databook, September 25, 2013, accessed at http://aspe.hhs.gov/health/reports/2013/MarketplacePremiums/datasheet_home.cfm . ↩︎
  124. Center for Consumer Information & Insurance Oversight, Centers for Medicare & Medicaid Services, U.S. Department of Health & Human Services, West Virginia Health Insurance Marketplace Grants Awards List, accessed at http://www.cms.gov/CCIIO/Resources/Marketplace-Grants/wv.html . ↩︎
  125. State Marketplace Profiles: West Virginia, October 24, 2013, Kaiser Family Foundation, accessed at https://modern.kff.org/health-reform/state-profile/state-exchange-profiles-west-virginia/#endnote_link_89347-11 . ↩︎
  126. State Health Facts, Marketplace Enrollment as a Share of the Potential Marketplace Population. (Kaiser Family Foundation), https://modern.kff.org/health-reform/state-indicator/marketplace-enrollment-as-a-share-of-the-potential-marketplace-population/. ↩︎
  127. State Health Facts, Marketplace Enrollees by Financial Assistance Status. (Kaiser Family Foundation), https://modern.kff.org/other/state-indicator/marketplace-enrollees-by-financial-assistance-status/. ↩︎
  128. State Health Facts: Adult Income Eligibility Limits at Application as a Percent of the Federal Poverty Level (FPL), January 2013, Kaiser Family Foundation, accessed at https://modern.kff.org/medicaid/state-indicator/income-eligibility-low-income-adults/. ↩︎
  129. Lisa Diehl, W.V. in Top Tier of Medicaid Expansion, The Daily Yonder, August 12, 2014, accessed at http://www.dailyyonder.com/print/7491. ↩︎
  130. Medicaid & CHIP: June 2014 Monthly Applications, Eligibility Determinations and Enrollment Report, Centers for Medicare & Medicaid Services, August 8, 2014, accessed at http://www.medicaid.gov/AffordableCareAct/Medicaid-Moving-Forward-2014/Downloads/June-2014-Enrollment-Report.pdf. ↩︎
  131. Lisa Diehl, August 12, 2014. ↩︎
  132. West Virginia Department of Health and Human Resources, Bureau for Medical Services website accessed at http://www.dhhr.wv.gov/bms/mco/Pages/default.aspx . ↩︎
  133. West Virginia response to the 2014 Medicaid Budget Survey for State Fiscal Years 2014 and 2015, Kaiser Commission on Medicaid and the Uninsured. ↩︎
  134. West Virginia Department of Health and Human Resources, Bureau for Medical Services website accessed at http://www.dhhr.wv.gov/bms/mco/Pages/default.aspx . ↩︎
  135. West Virginia Department of Health and Human Resources, Bureau for Medical Services website accessed at http://www.dhhr.wv.gov/bms/mco/pages/officeofmanagedcare.aspx . ↩︎
  136. West Virginia response to the 2014 Medicaid Budget Survey for State Fiscal Years 2014 and 2015, Kaiser Commission on Medicaid and the Uninsured. ↩︎
  137. The six counties include Wayne, Cabell, Putnam, Kanawha, Raleigh, and Mercer Counties. West Virginia Department of Health and Human Resources, Bureau for Medical Services website accessed at http://www.dhhr.wv.gov/bms/Pages/GB.aspx . ↩︎
  138. DHHR Bureau for Medical Services Announces Launch of Health Homes Initiative, West Virginia Department of Health and Human Resources, July 11, 2014, accessed at http://www.dhhr.wv.gov/News/2014/Pages/DHHR-Bureau-for-Medical-Services-Announces-Launch-of-Health-Homes-Initiative.aspx . ↩︎
  139. West Virginia response to the 2014 Medicaid Budget Survey for State Fiscal Years 2014 and 2015, Kaiser Commission on Medicaid and the Uninsured. ↩︎