KFF designs, conducts and analyzes original public opinion and survey research on Americans’ attitudes, knowledge, and experiences with the health care system to help amplify the public’s voice in major national debates.
The individual (or “non-group”) insurance market has changed substantially under the Affordable Care Act (ACA). Starting in 2014, the health law put in place new rules for what types of plans can be sold, required insurance companies to guarantee access to everyone regardless of health status, and limited the factors insurers could use in setting premiums. The law also created new Health Insurance Marketplaces, where low- and moderate- income consumers without access to other affordable coverage could obtain federal tax credits to help them pay their premiums.
As of the end of open enrollment in 2014, 8 million people had signed up for coverage through the Marketplaces. Accounting for the fact that some of those people did not pay their premiums or subsequently dropped coverage – and for signups through special enrollment periods throughout the year – 6.7 million people were insured through marketplace plans as of October 15, 2014. However, it has been unclear precisely how many of these Marketplace enrollees were previously uninsured or how many would have purchased individual coverage directly from an insurer in the absence of the ACA.
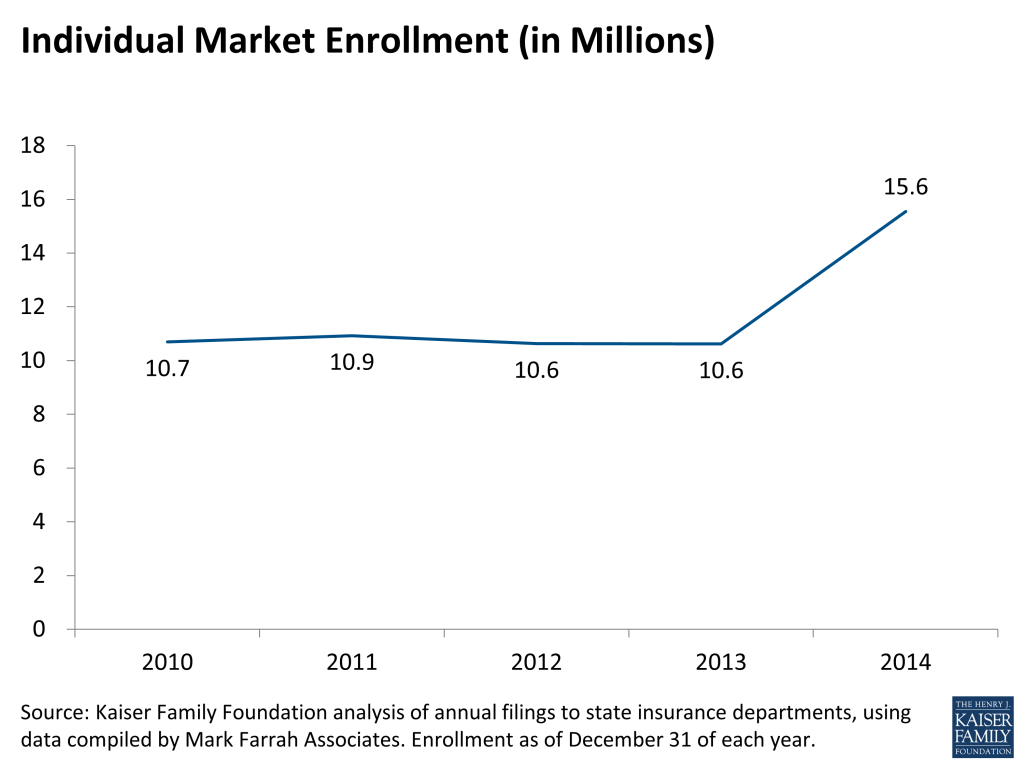
Kaiser Family Foundation analysis of recently-submitted 2014 filings by insurers to state insurance departments (using data compiled by Mark Farrah Associates) shows that 15.6 million people had major medical coverage in the individual insurance market – both inside and outside of the Marketplaces – as of December 31, 2014. Enrollment was up 4.9 million over the end of 2013, a 46% increase.
Individual Market Enrollment (in Millions)
The insurance company filings do not break down whether coverage was purchased through a Marketplace or in the outside market, nor whether coverage was first purchased after January 1, 2014 and therefore subject to the new ACA insurance market rules. However, juxtaposing these enrollment figures with the federal government’s estimate of 6.7 Marketplace enrollees as of October 15, 2014 suggests that about 43% of all individual market coverage was purchased through the marketplaces in 2014. It also means that new enrollment in the individual market among those who would have otherwise been uninsured likely took place inside the Marketplaces, driven by the availability of premium subsidies. Among those signing up for Marketplace plans in 2014, 85% qualified for premium subsidies.
Looking by state (shown in Table 1), almost half of the individual market enrollment growth nationwide from 2013 to 2014 was in four states: California (843,607), Florida (653,997), Texas (505,931), and Georgia (330,520). The individual insurance markets in six states grew by more than 75%: Arkansas (168%), New York (141%), Rhode Island (104%), Maine (93%), Georgia (79%), and Florida (77%). (Note that Arkansas figures may include some people eligible for Medicaid who enrolled in marketplace plans through that state’s “private option” approach to the ACA’s Medicaid expansion.)
Two states – Colorado and Massachusetts – saw decreases in individual market enrollment. Both states had below average enrollment in their marketplaces as a share of the potential market, and in Colorado some people previously purchasing coverage on their own may have switched to Medicaid as eligibility expanded. Massachusetts had implemented an earlier health reform plan and experienced significant transitions in coverage as the ACA took effect. (Note that the data for Nebraska also show a decrease in enrollment, but a sizable plan has not yet filed).
As of the end of open enrollment for 2015, 11.7 million people had signed up for Marketplace coverage, an increase of 3.7 million over 2014. Not all of those new enrollees will pay their premiums and begin coverage, but it is likely that the individual market has continued to grow in 2015, though at a slower pace than in the first year of full ACA implementation. Over time, reaching new enrollees – particularly those who are uninsured – will be key to the long-term success of the law.
Table 1: Change In Individual Market Enrollment From 2013-2014, by State
2014 Individual Enrollment
2013 Individual Enrollment
Change
% Change
National
15,553,564
10,620,872
4,932,392
46%
Alaska
23,641
14,127
9,514
67%
Alabama
205,772
168,787
36,985
22%
Arkansas*
303,258
113,288
189,970
168%
Arizona
327,549
266,381
61,168
23%
California
2,171,525
1,327,918
843,607
64%
Colorado
271,835
282,628
(10,793)
-4%
Connecticut
160,253
121,004
39,249
32%
District of Columbia
20,090
19,205
885
5%
Delaware
32,463
21,562
10,901
51%
Florida
1,499,569
845,572
653,997
77%
Georgia
750,256
419,736
330,520
79%
Hawaii
33,013
27,336
5,677
21%
Iowa*
189,264
181,159
8,105
4%
Idaho
150,065
90,810
59,255
65%
Illinois
599,188
442,703
156,485
35%
Indiana
231,276
171,525
59,751
35%
Kansas
163,952
124,619
39,333
32%
Kentucky
162,920
131,770
31,150
24%
Louisiana
224,989
175,218
49,771
28%
Massachusetts
72,208
79,233
(7,025)
-9%
Maryland
279,898
190,291
89,607
47%
Maine
61,807
31,965
29,842
93%
Michigan
473,091
344,173
128,918
37%
Minnesota
293,349
248,066
45,283
18%
Missouri
344,020
260,303
83,717
32%
Mississippi
128,189
85,190
42,999
50%
Montana
70,078
45,488
24,590
54%
North Carolina
633,480
467,868
165,612
35%
North Dakota
49,031
44,480
4,551
10%
Nebraska*
110,243
124,753
(14,510)
-12%
New Hampshire
55,611
35,856
19,755
55%
New Jersey
261,176
154,823
106,353
69%
New Mexico
70,525
57,508
13,017
23%
Nevada
118,296
96,694
21,602
22%
New York
410,924
170,680
240,244
141%
Ohio
380,508
330,617
49,891
15%
Oklahoma
171,673
121,897
49,776
41%
Oregon
210,211
160,047
50,164
31%
Pennsylvania
640,486
461,811
178,675
39%
Rhode Island
37,571
18,392
19,179
104%
South Carolina
201,111
134,210
66,901
50%
South Dakota
73,124
65,728
7,396
11%
Tennessee
340,904
243,143
97,761
40%
Texas
1,251,270
745,339
505,931
68%
Utah
213,830
140,084
73,746
53%
Virginia
416,010
317,414
98,596
31%
Vermont
32,163
21,115
11,048
52%
Washington
303,784
254,881
48,903
19%
Wisconsin
258,986
177,607
81,379
46%
West Virginia
42,225
24,665
17,560
71%
Wyoming
26,904
21,203
5,701
27%
Source: Kaiser Family Foundation analysis of annual filings to state insurance departments, using data compiled by Mark Farrah Associates. Enrollment as of December 31 of each year.Notes: Arkansas enrollment may include some people who enrolled in Medicaid through the state’s “private option” approach to Medicaid Expansion. Some known exchange participants have not filed enrollment data (Cooportunity Health in NE and IA, and Prominence Health Plan in NV). Data are still preliminary and other insurers may not have filed.
Methods
This analysis is based on filings that insurers submit to state regulators. The source of the data was the Health Coverage Portal TM, a market database maintained by Mark Farrah Associates, which includes information from the National Association of Insurance Commissioners and California’s Department of Managed Health Care. The underlying data sources are the Supplemental Health Care Exhibit (SHCE) and the California Department of Managed Care.
Plans showing enrollment, but no premium income were excluded from the analysis. In 2014, this primarily affected three states (Georgia, Kentucky, and Missouri), where Wellcare was excluded (this insurer primarily services Medicaid enrollees and appears to have erroneously filed as major medical). Parkland Community Health Plan was also excluded from Texas enrollment figures for this reason.
Some insurers have not yet filed certain data elements, or may revise their filings. Because some known exchange participants (in AR, CO, NM, NY, MA, OR, RI, UT, and WA) appear to have not filed the SHCE, these plans’ enrollment data as reported on the Exhibit of Premiums, Enrollment, and Utilization (EPEU) were used instead. Data for Affinity, HealthFirst, MetroPlus, and Fidelis Care in NY were provided by state regulators and are included in the updated version of this analysis. Exchange participants in other states did not have annual enrollment data available from either of the two exhibits (Cooportunity Health in NE and IA, and Prominence Health Plan in NV) and are therefore not included in this analysis.
Two sizable insurers (Blue Cross of Idaho and Security Health Plan of Wisconsin) did not file 2014 enrollment on the SHCE, so annual enrollment figures from the EPEU were used instead. In some cases, the number of individual market enrollees reported by individual insurers on the exhibits used for this analysis does not match figures reported on other exhibits.
Data were accessed on April 23, 2015. The analysis is limited to the 50 states and the District of Columbia, and does not include the territories. Enrollment is measured by the number of covered lives in major medical coverage on December 31, 2014, and does not include specialty coverage.
New HHS clarification on ACA contraceptive coverage requirement specifies that insurance plans must cover at no cost to women all of the 18 contraceptive methods approved by the FDA. If a provider recommends a specific option or product, plans must cover it at no cost as well.
Minimum Contraceptive Coverage Requirements Clarified by HHS Guidance
Contraceptive Method
Products/Options
Must Cover
Surgical sterilization
Also called tubal ligation
√
Implant sterilization
Only Essure available
√
Implantable Rod
Multiple
√ at least 1
IUD – Copper
Only ParaGard available
√
IUD – Progestin
Multiple
√ at least 1
Injection
Multiple
√ at least 1 (may be generic)
Oral contraceptives – combined
Multiple
√ at least 1 (may be generic)
Oral Contraceptives – progestin only
Multiple
√ at least 1 (may be generic)
Oral Contraceptives – extended/continuous use
Multiple
√ at least 1 (may be generic)
Patch
Multiple**
√ at least 1 (may be generic)
Vaginal Ring
Only NuvaRing available
√
Diaphragm with Spermicide
Only Milex Omniflex available
√
Sponge with Spermicide
Only Today Sponge available
√*
Cervical Cap with Spermicide
Only FemCap available
√
Female Condom
Multiple
√*
Spermicide alone
Multiple
√ at least 1 (may be generic)*
Emergency Contraception-Progestin
Multiple
√ at least 1 (may be generic)*
Emergency Contraception- Ulipristal Acetate
Only ella available
√
*Approved for sale over-the-counter but only covered at no cost with a prescription.**The manufacturer of the brand name (OrthoEvra) patch has discontinued production and the generic alternative will be the only patch available.SOURCES: FDA, Birth Control Guide and Depts of Labor, Health and Human Services, and Treasury, FAQs about Affordable Care Act Implementation (Part XXVI).
Non-governmental organizations (NGOs) are key partners in U.S. global health efforts. A recent Kaiser report shed light on the role of U.S.-based NGOs in these efforts, finding that a significant share of U.S. government (USG) funding for global health is channeled to these NGOs, who often act as program implementers and conduct research and development efforts.1 To date, however, little information has been available about the extent of foreign NGOs’ role in carrying out U.S. global health programs. To help fill this gap, this report provides an analysis of foreign (non-U.S.-based) NGOs that received global health funding from the USG during FY 2013. The report focuses on funding provided to NGOs by the U.S. Agency for International Development (USAID), the largest implementer of global health activities among USG agencies and departments. The focus on USAID spending is due both to the availability of data from this agency and the fact that USAID spending represents the majority of bilateral U.S. global health spending.2 Key findings include (also see Table 1 below):
Total Number of NGOs: In FY 2013, 157 foreign NGOs received USG global health funding through USAID to implement global health activities. They include NGOs working on a single global health issue, those working on multiple health issues, and those working on global health within a broader development scope. About 15% (24 NGOs) are faith-based organizations.
Total Funding: Collectively, these NGOs received approximately $355 million (more than 5%) of USAID global health disbursements in FY 2013. The majority of this funding (75%) was concentrated among 20 NGOs. Funding amounts ranged from more than $10 million per NGO (6 NGOs) to less than $1 million (104 NGOs).
Program Areas: NGOs carried out activities in nearly all major U.S. global health program areas. The greatest number of foreign NGOs worked on HIV. Additionally, the highest amount of funding was for HIV-related activities. Tuberculosis received the second highest amount of funding, followed by family planning/reproductive health.
Geographic Presence: Foreign NGOs received USG global health funding through USAID for efforts carried out in 42 countries and across multiple regions, including Africa, Asia, Latin America and the Caribbean, and the Middle East. Some NGOs (15) implement efforts that are “worldwide” in scope, but most (146) are engaged in regional and/or country-specific programs. Nearly all funding to NGOs ($329.3 million) supports regional and country-specific efforts, while the remainder ($25.7 million) is directed to “worldwide” efforts. Among the 141 NGOs engaged in country-specific efforts, nearly all (136) received funding for efforts in a single country, while the remainder (5) received funding for efforts in two or more countries. Most countries (30 of 42) host activities by more than one NGO. Overall, more NGOs operate in Africa than in all other regions combined.
Table 1: Summary of Foreign NGO Engagement in USG Global Health Efforts, FY 20133
NOTES: Reflects foreign (non-U.S.-based) NGOs that received funding disbursed by USAID in FY 2013 for USG global health activities. + NTDs are neglected tropical diseases. * Other countries may have been reached through regional programs or “worldwide” efforts.
Report
Introduction
Non-governmental organizations (NGOs) are key partners in U.S. global health efforts. The recent Kaiser report NGO Engagement in U.S. Global Health Efforts: Analysis of U.S.-Based NGOs Receiving USG Support Through USAID shed light on the role played by U.S.-based NGOs. It found that in FY 2013, the U.S. government (USG) channeled a significant share of funding for global health to U.S.-based NGOs, who often act as program implementers and conduct research and development efforts.6 To date, however, little information has been available about the extent of the role of foreign NGOs in carrying out U.S. global health programs.
To fill this gap in information, this report provides an analysis of foreign (non-U.S.-based) NGOs that received global health funding from the USG during FY 2013. Due to the parameters of the analysis as well as data limitations, this report focuses on USG funding that the U.S. Agency for International Development (USAID) received through direct appropriations and through interagency transfers (e.g., from the Department of State7 ), which together account for the majority of U.S. bilateral global health spending.8 Specifically, its findings are based on a Kaiser analysis of data on funding disbursed by USAID in FY 2013 to foreign NGOs implementing USG global health activities, which was downloaded from the USG’s Foreign Assistance Dashboard.9 Other sources of data included organizations’ websites, which were used to confirm organizations’ non-profit statuses and the locations of their headquarters/main offices implementing specific global health activities. (See Box 1 for the definition of foreign NGOs utilized in the analysis and Appendix A for a detailed methodology.) In addition to identifying these NGOs, this report examines their funding levels, program areas, and geographic focus.
Box 1: Definition of Non-Governmental Organizations (NGOs)
For the purposes of this analysis, to be eligible for inclusion, an organization had to meet the following definition of a foreign NGO: a non-profit that is independent of any government, not based in the United States, and not a university/college, a hospital, or a foundation that solely supports a government department/agency, hospital, or university. This definition was informed by the USAID definition of private voluntary organizations (PVOs),10 which guides a USAID registration process for NGOs.
Findings
Overview
In FY 2013, nearly 160 foreign NGOs received USG funding through USAID for carrying out global health activities. In FY 2013, 157 foreign NGOs received USG funding from USAID for implementing global health efforts (see Appendix B). They included NGOs that are focused mainly on a single global health issue, those working in multiple global health areas, and those addressing global health within a broader development scope. For example, The AIDS Support Organization (TASO), located in Uganda, provides services and support to people living with HIV; the Reproductive and Child Health Alliance (RACHA), located in Cambodia, provides a range of services, including those focused on family planning and reproductive health and tuberculosis, with an emphasis on capacity building; and Caritas Rwanda provides health services and supports rural development and food security programs.11 Among the 157 NGOs, there were also 24 faith-based NGOs,12 such as Lembaga Kesehatan Nahdlatul Ulama (LKNU), an Islamic organization in Indonesia, and the Church Alliance for Orphans (CAFO), an interfaith organization located in Namibia.13
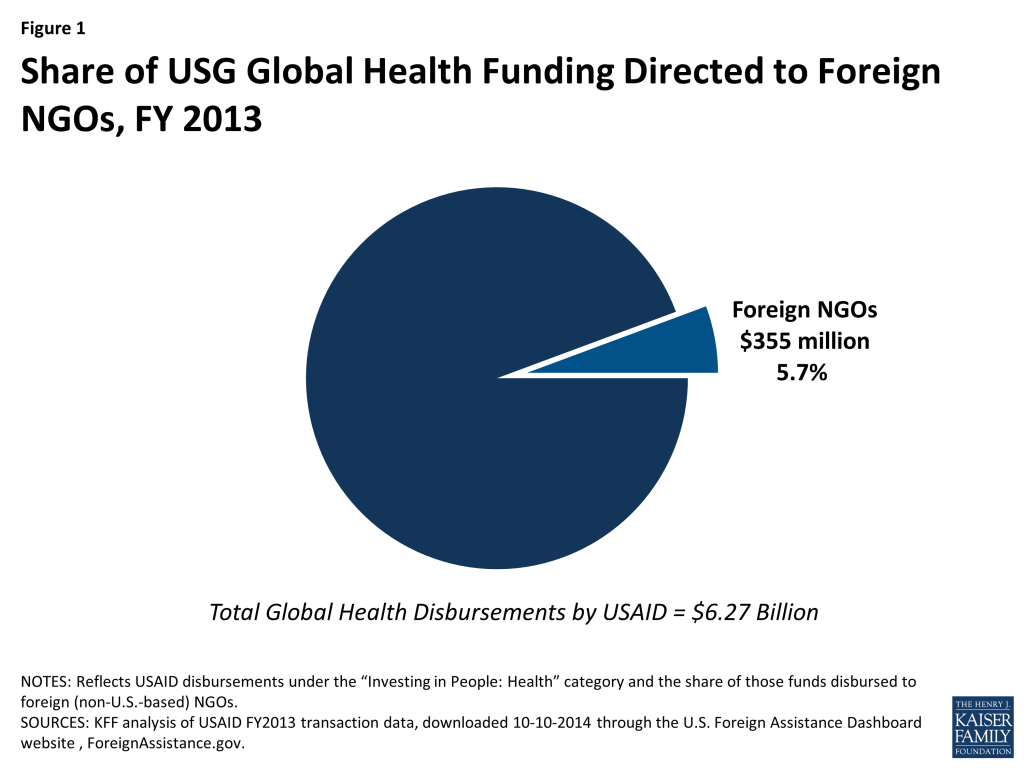
Approximately $355 million – or more than 5% of USAID global health disbursements – was disbursed to foreign NGOs in FY 2013. Foreign NGOs received $355,004,250 in FY 2013 for USG global health efforts, which was about 5.7% of total global health funding disbursed by USAID that year (see Figure 1).14 This funding was provided to foreign NGOs through many of the functional and geographic bureaus at USAID, including the Bureau for Africa, Bureau for Asia, and the Bureau for Global Health.15
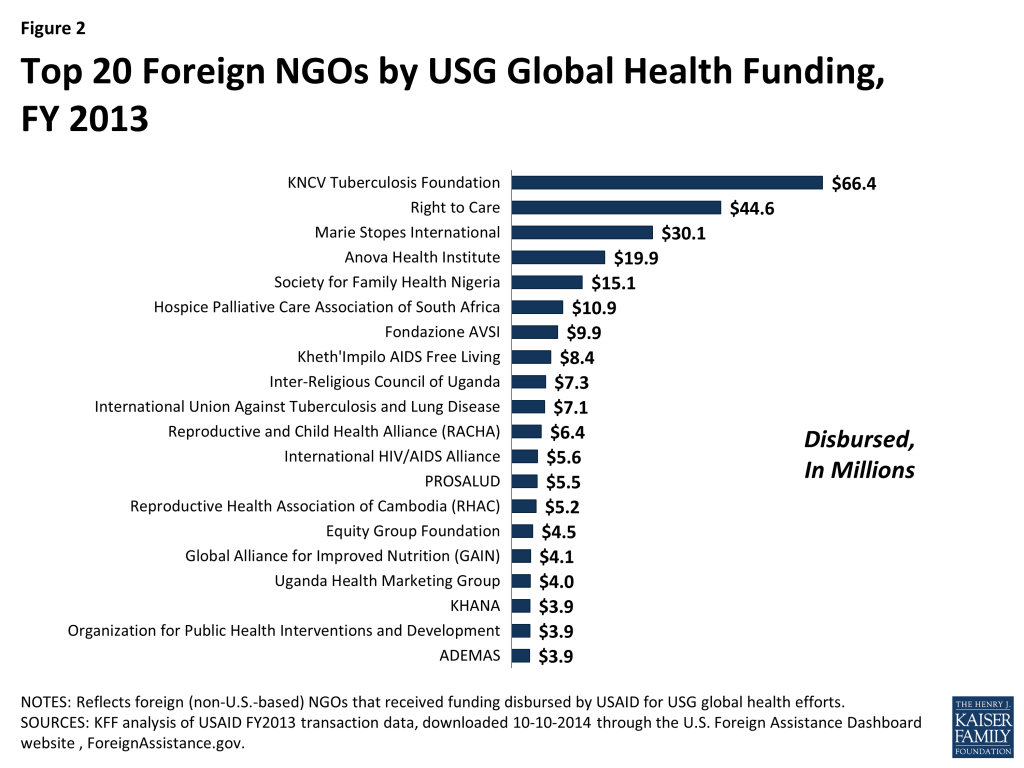
Most funding provided to NGOs was directed to a small number of organizations. Twenty NGOs accounted for the majority of funding (75% or $266.6 million) (see Figure 2). Among these, 6 received more than more than $10 million in disbursements each, collectively accounting for more than half of all funding (53% or $187.0 million). These were the KNCV Tuberculosis Foundation, Right to Care, Marie Stopes International, Anova Health Institute, Society for Family Health Nigeria, and Hospice Palliative Care Association of South Africa. On the other end of the funding range, 104 NGOs received less than $1 million each.
Figure 1: Share of USG Global Health Funding Directed to Foreign NGOs, FY 2013Figure 2: Top 20 Foreign NGOs by USG Global Health Funding, FY 2013
Program Areas
NGOs carried out USG global health efforts in nearly all of the major U.S. program areas. NGOs worked in eight of the nine global health program areas of the USG, including: HIV/AIDS; tuberculosis (TB); malaria; family planning/reproductive health (FP/RH); maternal and child health (MCH); nutrition; water supply and sanitation; and pandemic influenza and other emerging threats (PIOET).16 None received disbursements from USAID to work in the program area of other public health threats, which includes neglected tropical diseases (NTDs).17
Most NGOs received funding in a single global health program area. In FY 2013, 132 NGOs (84%) received support for efforts related to a single program area, while 25 (16%) received support for efforts related to more than one program area, including 7 that received funding for efforts related to four or more areas.
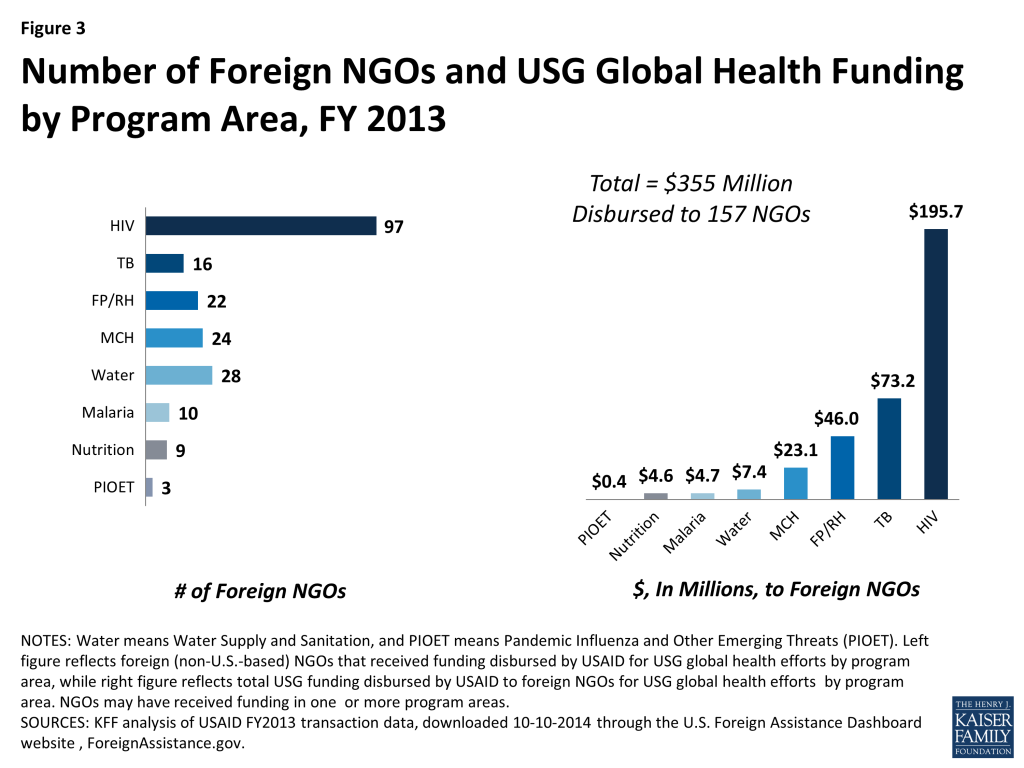
The program area involving the greatest numbers of NGOs was HIV, followed by water supply and sanitation. As Figure 3 shows, 97 NGOs worked on HIV and 28 on water supply and sanitation, followed by MCH (24), FP/RH (22), TB (16), and malaria (10). The fewest number of NGOs were involved in carrying out nutrition (9) and PIOET (3). The greatest amount of funding to foreign NGOs was for HIV efforts, followed by TB and FP/RH. (See Appendix C for a listing of NGOs by program area.)
Figure 3: Number of Foreign NGOs and USG Global Health Funding by Program Area, FY 2013
Geographic Presence
Foreign NGO Headquarters
The headquarters of foreign NGOs were located most often in Africa, Asia, and Europe. The headquarters/main offices of foreign NGOs were in 47 countries. The greatest number were based in South Africa (22), followed by Uganda (11), the United Kingdom (10), Tanzania (7), and Indonesia, Kenya, Namibia, and Nigeria (6 each). Some NGOs may be based/have their headquarters in one country but conduct global health activities supported by USG funding in others.
Worldwide Efforts
More than a dozen NGOs provided “worldwide” support or focused on activities with global purposes.18 In FY 2013, 15 NGOs received funding for “worldwide” USG global health efforts; 11 received only “worldwide” funding, with the rest also receiving funding for country-and region-specific efforts. A small proportion of funding provided to foreign NGOs (7% or $25.7 million) was directed to such efforts. “Worldwide” activities may include providing technical assistance to field missions as part of certain project awards and carrying out globally-focused activities. For example, in FY 2013, funds considered to be for “worldwide” efforts were disbursed for field support activities related to nutrition and HIV led by the Global Alliance for Improved Nutrition (GAIN) and for operational research and other TB-related activities carried out by the International Union Against Tuberculosis and Lung Disease.
Regional and Country-Specific Efforts
More than 140 NGOs carried out regional and country-specific programs. In FY 2013, 146 NGOs received funding for regional and country-specific efforts, accounting for the vast majority of funding provided to NGOs (93% or $329.3 million).
Regional efforts: 10 NGOs received funding for activities that spanned portions and/or the entirety of one or more of the following regions: Africa, Asia, Latin American and the Caribbean, and the Middle East.19 Two of these NGOs also received funding for “worldwide” efforts, and five also received funding for country-specific efforts.
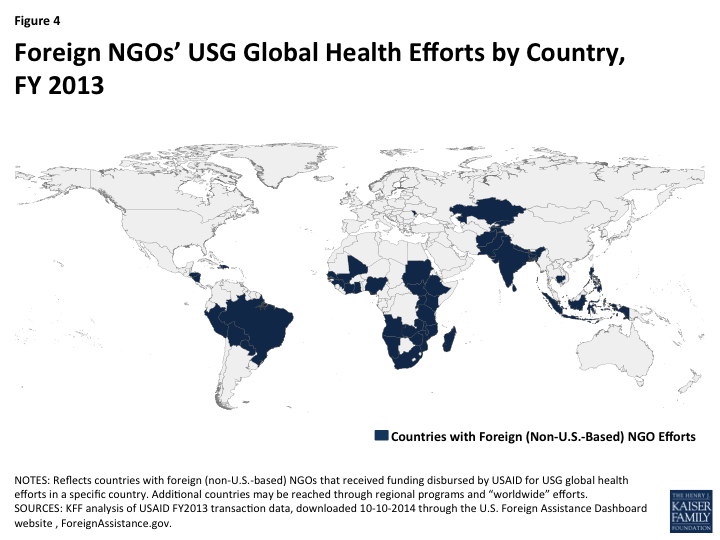
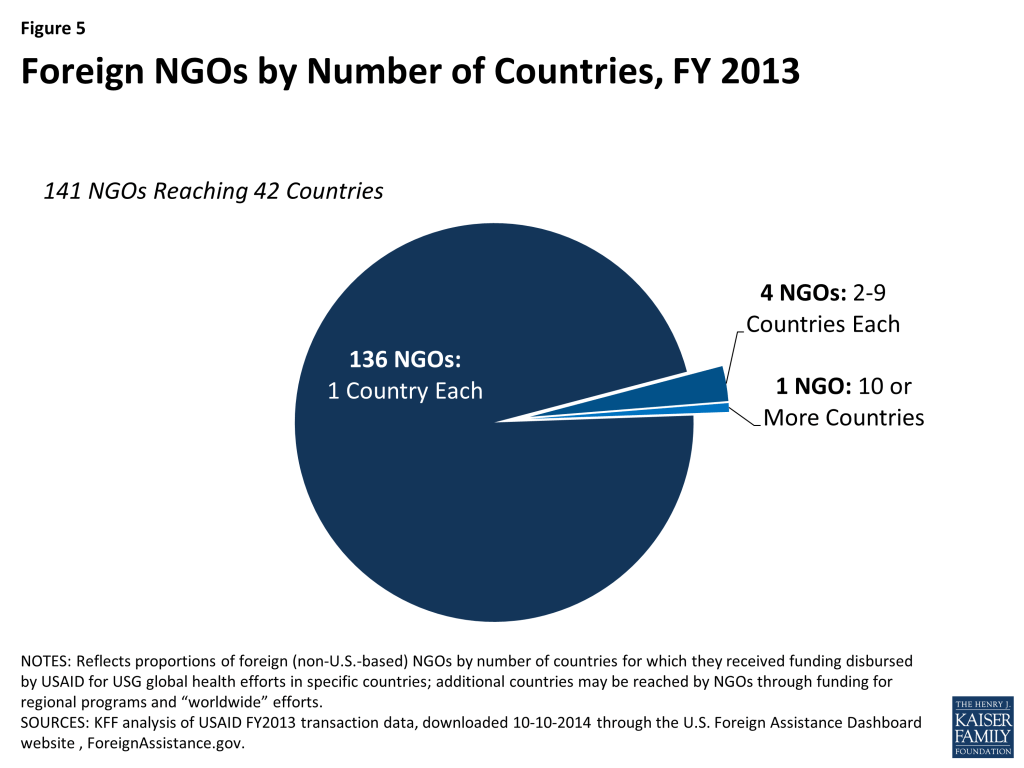
Country-specific efforts: More than three-quarters of NGOs (141) received funding for activities in specific countries. These activities spanned 42 countries (see Figure 4).20 Nearly all of these NGOs (136) received funding for efforts in one country (see Figure 5). Five received funding for efforts in two or more countries: KNCV Tuberculosis Foundation (14 countries), Marie Stopes International (9), the African Palliative Care Association (3), Fondazione AVSI (2), and the International Union Against Tuberculosis and Lung Disease (2).
Figure 4: Foreign NGOs’ USG Global Health Efforts by Country, FY 2013Figure 5: Foreign NGOs by Number of Countries, FY 2013
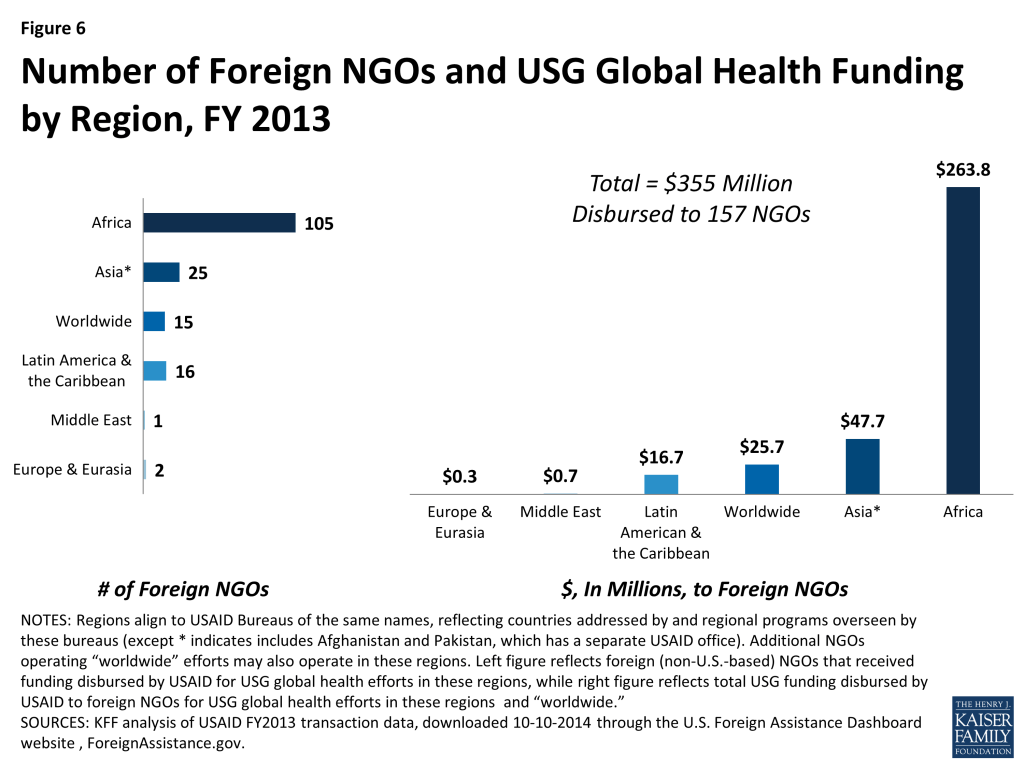
Overall, more NGOs carried out regional and country-specific efforts in Africa than in all the other regions combined. As Figure 6 shows, 105 foreign NGOs received funding for region- and country-specific projects in Africa. About a quarter as many (25) received funding for projects in Asia, and fewer received funding for projects in other regions. Most regional/country funding was also directed to efforts in Africa, followed by Asia.
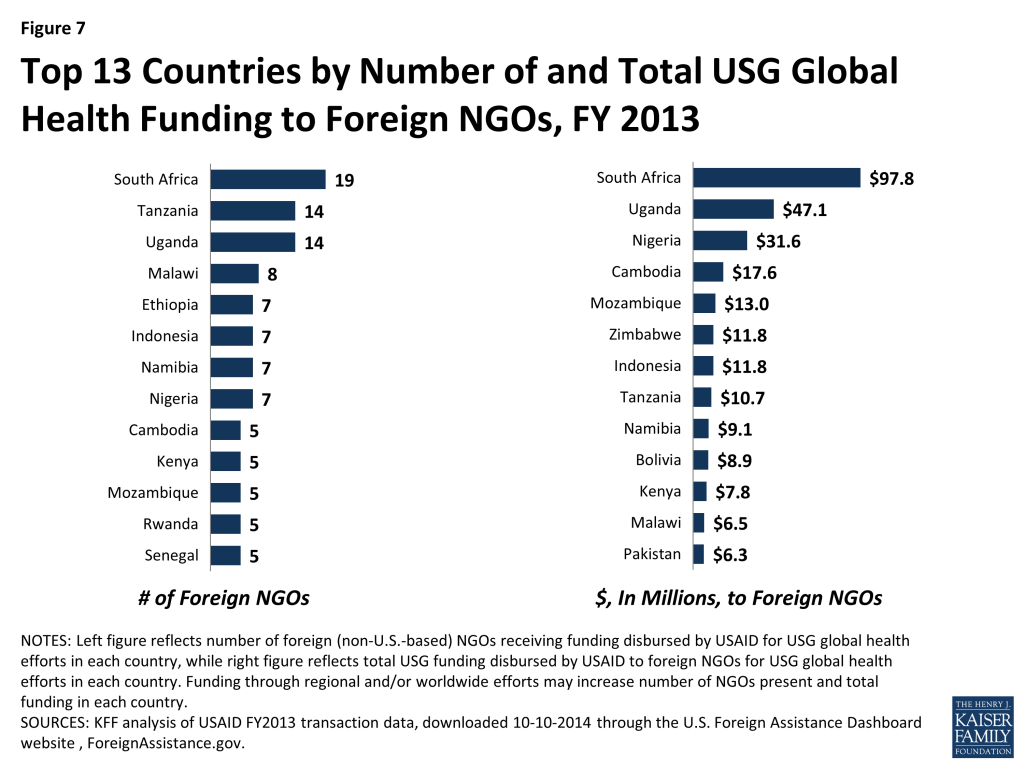
Most countries hosted more than one NGO, with a few hosting 10 or more NGOs. In FY 2013, the 42 countries reached by NGOs’ country-specific efforts hosted activities by varying numbers of NGOs. Twelve countries hosted activities by one NGO, and 30 countries hosted activities by more than one NGO. The numbers of NGOs implementing USG global health efforts were often highest among countries in sub-Saharan Africa (see Figure 7). Three of these countries hosted activities by 10 or more NGOs: South Africa (19), Tanzania (14), and Uganda (14).
Most of the countries with the highest levels of NGO funding are in sub-Saharan Africa. In FY 2013, among the 13 countries with the highest country-specific USG funding to foreign NGOs (see Figure 7), 9 are in sub-Saharan Africa. Funding to NGOs exceeded $10 million in each of 8 countries and was highest in South Africa ($97.8 million), followed by Uganda ($47.1 million) and Nigeria ($31.6 million). On the other end of the funding range, USG funding to foreign NGOs was less than $1 million in each of 16 countries.
Figure 6: Number of Foreign NGOs and USG Global Health Funding by Region, FY 2013Figure 7: Top 13 Countries by Number of and Total USG Global Health Funding to Foreign NGOs, FY 2013
Conclusion
As the findings of this report have shown, foreign NGOs play an important role in carrying out USG global health efforts. Greater understanding of the extent of foreign NGO engagement in these efforts can be elucidated by further analysis, as data on USG global health funding for such NGOs become increasingly available publicly and as the quality and clarity of these data improve. The USG has taken important steps in recent years to make funding and project data more available and easily accessible, but further attention is still required to fill in gaps in data – particularly with regard to USG funding sources beyond USAID – and to ensure the quality and completeness of existing USG data resources. Such data are critical to evaluating whether investments in these NGOs further achievement of USG global health goals. The findings of this report suggest that the role of foreign NGOs will be important to consider in understanding USG global health efforts going forward, particularly given the growing USG emphasis on country ownership and transitioning USG global health efforts to country and local control.
Appendices
Appendix A: Detailed Methodology
This report is based on Kaiser Family Foundation analysis of USAID global health funding data for FY 2013, which were downloaded from the U.S. Foreign Assistance Dashboard website.21
The analysis uses transaction-level data on funding disbursed by USAID to foreign NGOs for global health activities. Data include funding that was appropriated by Congress to USAID for global health activities and then disbursed to NGOs, as well as funding that was appropriated to other agencies for global health efforts, transferred to USAID, and then disbursed to NGOs.22 Due to data limitations on the Dashboard and the parameters of this analysis, the data does not include funding disbursed by other USG departments/agencies (such as the Department of State or the Centers for Disease Control and Prevention) to NGOs. Still, this analysis captures the majority of bilateral U.S. global health funding disbursements.23
Additionally, note:
To be eligible for inclusion in this analysis, an organization had to meet the following definition of a foreign NGO: a non-profit that is independent of any government, not based in the United States and not a university/college, a hospital, or a foundation that solely supports a government department/agency, hospital, or university. Each organization’s non-profit status as well as headquarters location was confirmed using data found on organizations’ websites.
Funding totals shown in this report represent net disbursements, which include positive and negative disbursed funding amounts as well as zero-dollar disbursed funding amounts. For zero-dollar transactions, we included only transactions we could verify as no-cost extensions.24
Data on health funding provided under the American Schools and Hospitals Abroad (ASHA) program were not included in NGO funding totals but were included in the overall global health funding total ($6.27 billion).
Appendix B: Foreign NGOs, FY 2013
Table B: Foreign NGOs Implementing USG Global Health Efforts, FY 201325
ACTED (Agence d’Aide a la Cooperation Technique Et au Developpement)
ADEMAS (Agence pour le Developpement du Marketing Social)
ADPP (Ajuda de Desenvolvimento de Povo para Povo) Angola
Africa Health Placements
African Enterprise International
African Palliative Care Association
African Water Association
AgriAids SA
Agribusiness in Sustainable Natural African Plant Products (ASNAPP)
AIDS Support Organization, The (TASO)
Anova Health Institute
ARCAD-SIDA (Association de Recherche de Communication et d’Accompagnement a Domicile des Personnes Vivant avec le VIH et le SIDA)
Areopagus
Ariel Glaser Pediatric AIDS Healthcare Initiative (AGPAHI)
Asociacion Benefica PRISMA
Asociacion de Desarrollo Comunitario del Departamento de Carazo (ADECA)
Asociacion Hondurena de Planificacion de Familia (Ashonplafa)
Asociacion Los Andes de Cajamarca (ALAC)
Associacao Espaco de Prevencao e Atencao Humanizada (EPAH)
Association de Soutien au Developpement des Activites de Population (ASDAP)
Association of Private Health Facilities in Tanzania
Aurum Institute, The
Avocats San Frontieres
Banja La Mtsogolo
Botswana Retired Nurses Society (BORNUS)
Caribbean HIV & AIDS Alliance
Caritas Rwanda
Caritas Senegal
Catholic AIDS Action
CCAP Nkhoma Synod Relief and Development
Centre International de Developpement et de Recherche (CIDR)
Centro de Información y Recursos para el Desarrollo (CIRD)
Centro de Investigacion, Educacion y Servicios Salud Sexual–Salud Reproductiva (CIES)
CHAMP
Child Welfare Bloemfontein & Childline Free State
Childline Mpumalanga
Children in Distress (CINDI) Network
Christian Health Association (Nigeria)
Christian Health Association of Malawi
Christian Social Service Commission
Church Alliance for Orphans
Concern Universal
Congress of Local Authorities from Moldova (CALM)
Cellule de Coordination sur les Pratiques Traditionnelles Affectant la Santé des Femmes et des Enfants (CPTAFE)
Dasra (Impact Foundation (India))
Development Aid from People to People (DAPP) Zambia
Development Workshop
Dignitas International
Environment and Public Health Organization (ENPHO)
Equity Group Foundation
European Cooperative for Rural Development (EUCORD)
Fayyaa Integrated Development Organization
Federacion Red Nicasalud
Federation of Indian Chambers of Commerce and Industry (FICCI)
Fondazione AVSI (Associazione Voluntari per Servici Internationale, AVSI)
Fundacao para o Desenvolvimento da Comunidade (FDC)
Fundacion PRODEIN (Promotora del Desarrollo Integral) (ABC PRODEIN)
Fundacion REDDOM (Rural Economic Development Dominica)
Future Families
GECHAAN (The Gembu Center for HIV/AIDS Advocacy Nigeria)
Ghana – West Africa Project to Combat AIDS and STI (WAPCAS)
GHESKIO (The Haitian Group for the Study of Kaposi’s Sarcoma and Opportunistic Infections) Centers
Global Alliance for Improved Nutrition, The (GAIN)
Grassroot Soccer South Africa
Groupe d’Action pour le Developpement Communautaire
Health Insurance Fund
HIVSA
Hospice Africa Uganda
Hospice Palliative Care Association of South Africa
Icebreakers Uganda
Ifakara Health Institute
Indonesian International Education Foundation
Institute of Natural Resources
Instituto Dominicano de Desarrollo Integral (IDDI)
Integrated Midwives’ Association of the Philippines
International Center for Biosaline Agriculture
International Centre for Reproductive Health (ICRH)
International HIV/AIDS Alliance
International Union Against Tuberculosis and Lung Disease
Inter-Religious Council of Uganda
Jaringan Kesejahteraan/Kesehatan Masyarakat (JKM)
Joint Medical Store (JMS)
KAYEC (Katutura Youth and Enterprise Centre) Trust
Kazakhstan Association on Sexual and Reproductive Health
Kenan Institute Asia (Kenan Foundation Asia)
Kenya Community Development Foundation
Kenya Rural Enterprise Program (K-REP)
KHANA
Kheth’Impilo AIDS Free Living
Kigezi Diocese Water and Sanitation Programme
KNCV Tuberculosis Foundation
Lanka Rain Water Harvesting Forum
Lembaga Kesehatan Nahdlatul Ulama (LKNU)
Life in Abundance
Lifeline/Childline Namibia
Lifeskills Promoters
Lilongwe Medical Relief Fund Trust
Malaria Consortium
Marie Stopes International (MSI)
Maritime Life Precious Foundation
Merlin (Medical Emergency Relief International)
Mildmay
N’weti – Health Communication
National Association of Child Care Workers (NACCW)
NawaLife Trust – Namibian Centre for Communication Programmes
Nepal CRS Company
Network on Ethics/Human Rights, Law, HIV/AIDS – Prevention, Support & Care (NELA)
Networking HIV/AIDS Community of South Africa (NACOSA)
Nyumbani (Children of God Relief Institute)
Operation ASHA
Organization for Public Health Interventions and Development (OPHID)
Organization for Social Services for AIDS
Otse Community Home Based Care Trust
Participatory Action & Learning Methodologies (PALM) Foundation
Partners in Hope
PASADA (Pastoral Activities and Services for People with AIDS in Dar es Salaam Archdiocese)
Penabulu Alliance (Penabulu Foundation)
PharmAccess Foundation
Philippine Business for Social Progress
Population Foundation of India
Population Services Zimbabwe
Profamilia (Asociacion Dominicana Pro-Bienestar de la Familia)
PROSALUD
Regional Centre for Quality of Healthcare (RCQHC)
Reproductive and Child Health Alliance (RACHA)
Reproductive Health Association of Cambodia (RHAC)
Reproductive Health Uganda
REPSSI (Regional Psychosocial Support Initiative)
Reseau Africain pour le Developpement Integre (RADI)
Retrak
Right to Care
Roman Catholic Diocese of Timika
Save the Children UK
Sexual Minorities Uganda
Social Empowerment and Building Accessibility Center (SEBAC) Nepal
Social Marketing Company
Society for Family Health Namibia
Society for Family Health Nigeria
Society for Family Health Rwanda
Solutions for Innovative Policies, Programs and Technologies (formerly Population Council South Africa)
Soutoura Association
Tanzania Chamber of Minerals and Energy
Thembalethu Development (formerly TEBA Development)
T-MARC Tanzania
Tshwane Leadership Foundation
Tubeho Association
Uganda Health and Science Press Association
Uganda Health Marketing Group
University Research South Africa
Water & Sanitation for the Urban Poor (WSUP)
West African Association for Marine Environment (WAAME)
Witkoppen Health and Welfare Centre
Women Farmers Advancement Network (WOFAN)
Women in Law and Development in Africa (WILDAF)
Women’s League of Creative Initiative
Yayasan Cipta Cara Padu (YCCP, CCP-I Foundation)
Young Women’s Christian Association (YWCA) of Nigeria
NOTES: Includes foreign (non-U.S.-based) NGOs to which USAID disbursed USG global health funding in FY 2013.
Appendix C: Foreign NGOs by Program Area, FY 2013
Table C: Foreign NGOs Implementing USG Global Health Efforts by Program Area, FY 201326
Malaria10
HIV97
TB16
ADEMAS
Christian Social Service Commission
Concern Universal
Fayyaa Integrated Development Organization
Ifakara Health Institute
Kenan Institute Asia
KNCV Tuberculosis Foundation
Malaria Consortium
Merlin
Society for Family Health Nigeria
ADEMAS
Africa Health Placements
African Enterprise International
African Palliative Care Association
AgriAids SA
Agribusiness in Sustainable Natural African Plant Products
AIDS Support Organization, The (TASO)
Anova Health Institute
ARCAD-SIDA
Associacao Espaco de Prevencao e Atencao Humanizada (EPAH)
Association of Private Health Facilities in Tanzania
Aurum Institute, The
Fondazione AVSI
Avocats San Frontieres
Banja La Mtsogolo
Botswana Retired Nurses Society
Caribbean HIV/AIDS Alliance
Caritas Rwanda
Catholic AIDS Action
Centre International de Developpement et de Recherche (CIDR)
CHAMP
Child Welfare Bloemfontein & Childline Free State
Childline Mpumalanga
Children in Distress (CINDI) Network
Christian Health Association (Nigeria)
Church Alliance for Orphans
Dasra
Dignitas International
Equity Group Foundation
European Cooperative for Rural Development (EUCORD)
Fundacao para o Desenvolvimento da Comunidade (FDC)
Future Families
GECHAAN (The Gembu Center for HIV/AIDS Advocacy Nigeria)
Ghana – West Africa Project to Combat AIDS and STI (WAPCAS)
GHESKIO Centers
Global Alliance for Improved Nutrition, The (GAIN)
Grassroot Soccer South Africa
Health Insurance Fund
HIVSA
Hospice Africa Uganda
Hospice Palliative Care Association of South Africa
Icebreakers Uganda
Indonesian International Education Foundation
Instituto Dominicano de Desarrollo Integral (IDDI)
International Centre for Reproductive Health (ICRH)
International HIV/AIDS Alliance
Inter-Religious Council of Uganda
Joint Medical Store
KAYEC Trust
Kenya Community Development Foundation
Kenya Rural Enterprise Program (K-REP)
KHANA
Kheth’Impilo AIDS Free Living
KNCV Tuberculosis Foundation
Lifeline/Childline Namibia
Lifeskills Promoters
Lilongwe Medical Relief Fund Trust
Marie Stopes International
Maritime Life Precious Foundation
Mildmay
National Association of Child Care Workers
NawaLife Trust – Namibian Centre for Communication Programmes
Nepal CRS Company
Network on Ethics/Human Rights, Law, HIV/AIDS – Prevention, Support & Care (NELA)
Networking HIV/AIDS Community of South Africa (NACOSA
Nyumbani
Organization for Public Health Interventions and Development (OPHID)
Organization for Social Services for AIDS
Otse Community Home Based Care Trust
Partners In Hope
PASADA
PharmAccess Foundation
Profamilia
Regional Centre for Quality of Health Care
Reproductive and Child Health Alliance (RACHA)
Reproductive Health Association of Cambodia (RHAC)
Reproductive Health Uganda
REPSSI (Regional Psychosocial Support Initiative)
Retrak
Right to Care
Save the Children UK
Sexual Minorities Uganda
Society for Family Health Namibia
Society for Family Health Nigeria
Society for Family Health Rwanda
Solutions for Innovative Policies, Programs and Technologies
Soutoura Association
Tanzania Chamber of Minerals and Energy
Thembalethu Development
Tshwane Leadership Foundation
Tubeho Association
Uganda Health and Science Press Association
Uganda Health Marketing Group
University Research South Africa
Witkoppen Health and Welfare Centre
Women in Law and Development in Africa (WILDAF)
YWCA of Nigeria
Hospice Palliative Care Association of South Africa
Indonesian International Education Foundation
International Union Against Tuberculosis and Lung Disease
Jaringan Kesejahteraan/ Kesehatan Masyarakat
KHANA
KNCV Tuberculosis Foundation
Lembaga Kesehatan Nahdlatul Ulama (LKNU)
Operation ASHA
Penabulu Alliance
Philippine Business for Social Progress
PROSALUD
Regional Center for Quality of Health Care
Reproductive and Child Health Alliance (RACHA)
Reproductive Health Association of Cambodia (RHAC)
Roman Catholic Diocese of Timika
Social Marketing Company
FP/RH22
MCH24
Nutrition9
ADEMAS
Ariel Glaser Pediatric AIDS Healthcare Initiative
Asociacion Hondurena de Planificacion de Familia (Ashonplafa)
Centro de Investigacion, Educacion y Servicios Salud Sexual–Salud Reproductiva (CIES)
Federacion Red NicaSalud
Federation of Indian Chambers of Commerce and Industry
Health Insurance Fund
Ifakara Health Institute
Integrated Midwives’ Association of the Philippines
Kazakhstan Association on Sexual and Reproductive Health
KHANA
Marie Stopes International
N’weti – Health Communication
Nepal CRS Company
Population Services Zimbabwe
PROSALUD
Regional Center for Quality of Health Care
Reproductive and Child Health Alliance (RACHA)
Reproductive Health Association of Cambodia (RHAC)
Social Marketing Company
Society for Family Health Nigeria
T-MARC Tanzania
ADEMAS
Asociacion Benefica PRISMA
Asociacion Los Andes Cajamarca (ALAC)
Association de Soutien au Developpement des Activites de Population (ASDAP)
Caritas Rwanda
Christian Health Association of Malawi
Centro de Investigacion, Educacion y Servicios Salud Sexual-Salud Reproductiva (CIES)
Centro de Información y Recursos para el Desarrollo (CIRD)
Cellule de Coordination sur les Pratiques Traditionnelles Affectant la Santé des Femmes et des Enfants (CPTAFE)
Federacion Red NicaSalud
Federation of Indian Chambers of Commerce and Industry
Fundacion PRODEIN
Indonesian International Education Foundation
Joint Medical Store
Marie Stopes International
Nepal CRS Company
Population Foundation of India
PROSALUD
Regional Center for Quality of Health Care
Reproductive and Child Health Alliance (RACHA)
Reproductive Health Association of Cambodia (RHAC)
Social Marketing Company
Society for Family Health Nigeria
Women’s League of Creative Initiative
ADEMAS
Asociacion Los Andes Cajamarca (ALAC)
Association de Soutien au Developpement des Activites de Population (ASDAP)
Caritas Rwanda
Global Alliance for Improved Nutrition, The (GAIN)
Nepal CRS Company
Regional Center for Quality of Health Care
Reproductive and Child Health Alliance (RACHA)
Society for Family Health Nigeria
OtherPublic Health Threats, Including NTDs0
Water Supply and Sanitation28
Pandemic Influenza and Other Emerging Threats3
ACTED
ADPP Angola
African Water Association
Areopagus
Asociacion de Desarrollo Comunitario del Departamento de Carazo (ADECA)
Association de Soutien au Developpement des Activites de Population
Caritas Senegal
CCAP Nkhoma Synod Relief and Development
Congress of Local Authorities from Moldova
Development Aid from People to People (DAPP) Zambia
Development Workshop
Environment and Public Health Organization
Federation of Indian Chambers of Commerce and Industry
Fundacion REDDOM
Groupe d’Action pour le Developpement Communautaire
Indonesian International Education Foundation
Institute of Natural Resources
International Center for Biosaline Agriculture
Kigezi Diocese Water and Sanitation Programme
Lanka Rain Water Harvesting Forum
Life in Abundance
PALM Foundation
Reseau Africain pour le Developpement Integre (RADI)
Social Empowerment and Building Accessibility Center Nepal (SEBAC)
Water & Sanitation for the Urban Poor (WSUP)
West African Association for the Marine Environment (WAAME)
Women Farmers Advancement Network (WOFAN)
Yayasan Cipta Cara Padu
Indonesian International Education Foundation
Kenan Institute Asia
Philippine Business for Social Progress
NOTES: Includes foreign (non-U.S.-based) NGOs to which USAID disbursed USG global health funding, by program area, in FY 2013.
Based on KFF analysis of data from the U.S. Foreign Assistance Dashboard website, ForeignAssistance.gov. ↩︎
KFF analysis of USAID FY2013 transaction data, downloaded 10-10-2014 through the U.S. Foreign Assistance Dashboard website, ForeignAssistance.gov, as well as information from NGO websites. ↩︎
Pandemic Influenza and Other Emerging Threats includes efforts to mitigate the possibility that a highly virulent virus could develop into a pandemic by strengthening targeted countries’ ability to detect cases early and to apply appropriate control measures quickly. According to USAID congressional budget justifications, http://www.usaid.gov/results-and-data/budget-spending/congressional-budget-justification. ↩︎
Other Public Health Threats also addresses dangers posed by infectious diseases not included elsewhere, such as cholera, dengue, and meningitis; significant non-communicable health threats of major public health importance; the containment of antimicrobial resistance; and the crosscutting work on surveillance that builds capacity for outbreak preparedness and response. According to USAID congressional budget justifications, http://www.usaid.gov/results-and-data/budget-spending/congressional-budget-justification. ↩︎
For example, USAID transaction data analyzed for this report include funds transferred from the Department of State to USAID for HIV efforts, which were then obligated and eventually disbursed to foreign NGOs. ↩︎
Based on KFF analysis of data from the U.S. Foreign Assistance Dashboard website, ForeignAssistance.gov. This analysis does not include funding directly disbursed to foreign NGOs by other USG agencies. ↩︎
Downloaded 10-10-2014 through the U.S. Foreign Assistance Dashboard website, ForeignAssistance.gov. ↩︎
PVOs are a subset of the wider NGO community and “are tax-exempt nonprofits that leverage their expertise and private funding to address development challenges abroad [outside the U.S.].” USAID, “PVO Registration,” webpage, http://www.usaid.gov/pvo. ↩︎
The 24 faith-based NGOs are: African Enterprise International, Caritas Rwanda, Caritas Senegal, Catholic AIDS Action, CCAP Nkhoma Synod Relief and Development, Christian Health Association of Nigeria, Christian Health Association of Malawi, Christian Social Social Service Commission, Church Alliance for Orphans, Fondazione AVSI, Fundacion PRODEIN, GECHAAN, Inter-Religious Council of Uganda, Kigezi Diocese Water and Sanitation Project, LKNU, Life in Abundance, Mildmay, Partners in Hope, PASADA, Lifeskills Promoters, Retrak, Roman Catholic Diocese of Timika, Tshwane Leadership Foundation, and YWCA of Nigeria. It is important to note, however, that other organizations may identify as secular but have religious principles undergirding their work. For example, the work of the Joint Medical Store, which was established as a joint venture between the Uganda Catholic Medical Bureau and the Uganda Protestant Medical Bureau; see http://www.jms.co.urg. ↩︎
LKNU website, http://www.lknu.org/; MSH, “Commitment to and passion for early childhood development in Namibia: three remarkable ECD centers,” short story, April 2014. ↩︎
The other relevant bureaus are: Bureau for Latin America and the Caribbean; Office of Afghanistan and Pakistan Affairs; Bureau for the Middle East; Bureau for Economic Growth, Education and Environment (previously known as the Bureau for Economic Growth, Agriculture, and Trade (EGAT)); and U.S. Global Development Lab (incorporates the former Office of Innovation and Development Alliances (IDEA) and Office of Development Partners (ODP)); and Bureau for Europe and Eurasia. Additionally, a very small amount of funding was designated for the “Recovery” organizational unit. ↩︎
Pandemic Influenza and Other Emerging Threats includes efforts to mitigate the possibility that a highly virulent virus could develop into a pandemic by strengthening targeted countries’ ability to detect cases early and to apply appropriate control measures quickly. According to USAID congressional budget justifications,http://www.usaid.gov/results-and-data/budget-spending/congressional-budget-justification. ↩︎
Other Public Health Threats also addresses dangers posed by infectious diseases not included elsewhere, such as cholera, dengue, and meningitis; significant non-communicable health threats of major public health importance; the containment of antimicrobial resistance; and the crosscutting work on surveillance that builds capacity for outbreak preparedness and response. According to USAID congressional budget justifications, http://www.usaid.gov/results-and-data/budget-spending/congressional-budget-justification. ↩︎
In the transaction data, the USG designated the “benefitting location” for this funding as “worldwide.” ↩︎
In addition to “worldwide” support, regions/sub-regions mentioned in the data included: Africa, East Africa, South Africa, Caribbean, East Asia, and the Middle East. ↩︎
In addition to the countries listed below, other countries may have been reached through regional efforts. Afghanistan, Angola, Bangladesh, Bolivia, Brazil, Cambodia, Cote d’Ivoire, Dominican Republic, Ethiopia, Ghana, Guinea, Haiti, Honduras, India, Indonesia, Kazakhstan, Kenya, Kyrgyzstan, Madagascar, Malawi, Mali, Moldova, Mozambique, Namibia, Nepal, Nicaragua, Nigeria, Pakistan, Paraguay, Peru, Philippines, Rwanda, Senegal, South Africa, South Sudan, Sri Lanka, Sudan, Tajikistan, Tanzania, Uganda, Zambia, and Zimbabwe. ↩︎
Downloaded 10-10-2014 through the U.S. Foreign Assistance Dashboard website, ForeignAssistance.gov. ↩︎
For example, USAID transaction data analyzed for this report include funds transferred from the Department of State to USAID for HIV efforts, which were then obligated and eventually disbursed to foreign NGOs. ↩︎
Based on KFF analysis of data from the U.S. Foreign Assistance Dashboard website, ForeignAssistance.gov. ↩︎
Positive and negative disbursements along with zero-dollar disbursements that are no-cost extensions are each closely linked to the recent completion or ongoing execution of global health activities, providing the best approximation available for showing where work is being done. ↩︎
KFF analysis of USAID FY2013 transaction data, downloaded 10-10-2014 through the U.S. Foreign Assistance Dashboard website, ForeignAssistance.gov, as well as information from NGO websites. ↩︎
KFF analysis of USAID FY2013 transaction data, downloaded 10-10-2014 through the U.S. Foreign Assistance Dashboard website, ForeignAssistance.gov. ↩︎
In this Women’s Health Issues journal article, Alina Salganicoff, Usha Ranji, and Laurie Sobel explore Medicaid’s role in providing health coverage for women over the past 50 years, and outline key issues going forward.
Global health efforts, like all development programs, are vulnerable to corruption. Corrupt acts, where and when they occur, can divert global health funding from its intended purpose and dilute the impact of programs aimed at preventing disease, treating illness, and saving lives. Corruption, though, has been hard to define and even harder to comprehensively track and understand. While most recognize that corruption exists and can negatively impact development programs, including those of the U.S. government (USG), there are ongoing debates about the scope and impact of corruption and whether and how global health programs should address it.
On one hand, some view corruption as a very important – if not the most important – issue in many countries today, and leaders and the public alike often point to corruption as a major barrier for development and global health programs. World Bank President Jim Kim has called corruption “public enemy number one,”1 and U.K. Prime Minister David Cameron stated that corruption is the “archenemy of democracy and development.”2 Members of the U.S. Congress have also expressed concerns about corruption and its effects on U.S. global health and foreign aid programs.3,4 The public in developing countries often place corruption at the top of their list of concerns,5,6 and the public in donor countries such as the U.S. and U.K. express worry about corruption and its ability to undermine global health and foreign assistance.7 For example, in a recent Kaiser Family Foundation Survey of Americans on the U.S. Role in Global Health, 83% of the U.S. public considered corruption to be a major barrier to effective global health programs, and 47% considered it the single-most important barrier.8
In contrast, others consider corruption to be worrisome, but do not believe it rises to the level of a central policy concern for global health and development efforts. Harvard Professor and Partners in Health co-founder Paul Farmer has written that even though some people believe poor countries are too corrupt for foreign assistance programs to work effectively, “the numbers regarding aid… tell a reassuring story.”9 The Bill & Melinda Gates Foundation also views corruption as something donors and others need to be vigilant about, but warns against placing too much emphasis on it. Writing in his Foundation’s 2013Annual Letter, Bill Gates stated “we need to root out fraud and squeeze more out of every dollar… but we should also remember the relative size of the problem.”10
These differing points of view hint at the spectrum of opinions that exist regarding the extent of corruption and the implications it has for global health and development programs, including those of the USG. In light of these ongoing uncertainties and debates about corruption and global health, the Kaiser Family Foundation convened a roundtable of experts from the U.S. government, academia, multilateral institutions, NGOs, think tanks, and other organizations for a policy discussion on this topic.
The roundtable discussion focused on the following questions:
What is the magnitude of the problem corruption represents for global health? What is corruption and how does it manifest in global health? What research methods, tools, and approaches can help us understand the problem better?
Arecurrentanti-corruption policies and programs adequate? How do U.S. government global health programs monitor and address corruption? Should more be done? What are current best practices?
How can we communicate more effectively about corruption to policymakers and the public? What is the right balance between transparency about corruption and risking unnecessary and damaging backlash?
This document summarizes the key themes that emerged from the roundtable discussion. Discussion points are supplemented with examples and information drawn from background materials and published literature that were referenced by participants. A list of related materials and resources is provided in the Appendix.
Issue Brief
Roundtable Summary
Question 1: What is the Magnitude of the Problem Corruption Represents for Global Health?
A key question for roundtable participants was: what is the best estimate for how much loss is incurred through corruption in the health sector? Participants felt this question is exceedingly difficult to answer, primarily because measuring losses to corruption is a challenge. First, there is no standard definition of corruption. Corrupt activities are also hard to identify, track, and verify in many cases. In addition, current measurement tools and approaches are often applied in only a limited way, and no single tool or approach can give a comprehensive assessment of monetary losses from corruption or the ultimate impact that corruption has on population health. Therefore, participants agreed it is a nearly impossible task to accurately estimate losses from corruption in the global health sector overall.
Difficulties in Defining and Identifying Corruption
According to participants, there is no widely accepted standard definition of corruption, but many found Transparency International’s description helpful, albeit very general: “the abuse of entrusted power for private gain.”11 The United Nations Convention against Corruption (UNCAC), the most prominent international treaty and policy statement on corruption and combatting it, does not define corruption per se, but instead describes various types of corruption including: bribery, embezzlement, theft, fraud, and others.12 Box 1 provides a list and short definitions for commonly used categories of corruption.
Box 1: Types of Corruption
Bribery: offering, promising, giving, accepting or soliciting of an advantage as an inducement for action that is illegal, unethical or a breach of trust.Collusion: A secret agreement between parties to conspire to commit actions aimed to deceive or commit fraud with the objective of illicit financial gain.
Extortion: utilizing, directly or indirectly, one’s access to a position of power to demand unmerited cooperation or compensation as a result of coercive threats.
Embezzlement: Act of dishonestly and illegally appropriating, using or trafficking the funds and goods that office holders have been entrusted with, for personal enrichment or gain.
Fraud: Act of an office holder intentionally deceiving someone in order to gain an unfair or illegal advantage (financial, political, or otherwise).
Favoritism/nepotism: favorable treatment of friends and associates in the distribution of resources and positions, regardless of their objective qualifications and merit.
“Petty”/administrative: lower-level corruption often involving bureaucrats who control access to public services, who demand bribes before performing public duties.
“Grand”/political: major embezzlement or exchange of resources such as bribes for advantages among elites at high levels of government and private industry, often associated with budgeting, position buying, investments, and large infrastructure/construction projects.
State capture: when laws, policies or state institutions meant to benefit the public good have been “captured” through bribes or other means by individuals in order to foster political or personal economic interests.
Participants stated that corrupt acts are often hidden from view, making them difficult to track, study, and verify. They pointed out that the line between corruption and inefficiency is often blurry and it can sometimes be difficult to tell the difference between corrupt acts and poor management. Another difficulty is that there are cultural and sociological differences regarding what is corrupt vs. acceptable practice. What is considered “corruption” can vary from country to country and sector to sector. While some acts – such as outright fraudulent misdirection of funds intended for health services – are likely to be almost universally considered corrupt, in other cases – such as when gifts and money are given to health providers – it can be difficult to agree on whether a specific act constitutes corruption or not.
Therefore, participants agreed that because it is often so difficult to find and prove corruption, it remains a serious challenge to measure and quantify it. In fact, many felt it would not be worth the effort, and might not even be possible, to comprehensively evaluate the overall impact of corruption on global health due to these limitations.
Measurement and Evaluation Tools Can Shed Light in Specific Areas
While recognizing the difficulty of estimating the total impact of corruption on the health sector as a whole, participants did state that measurement and evaluation of corruption within specific components of health systems or focused on specific health programs or activities can be helpful to understand where and how corruption occurs. In this context, participants mentioned a number of tools and approaches.
Participants stated that some of the most commonly referenced corruption measures are based on surveys asking people about their opinions and experiences with corruption, such as Transparency International’s Corruption Perception Index or AfroBarometer polls.13,14 For example, opinion surveys of the public in 7 countries performed between 2001 and 2006 found the percent of the public who believed the health system in their country was “corrupt” or “very corrupt” ranged from 20% in Indonesia to 56% in Sierra Leone.15 While estimates such as these can point to general levels of concern about corruption in the health sector, participants agreed that such measures are problematic because perceptions and opinions about corruption can differ from the true prevalence of corrupt practices.
Other approaches to identifying and measuring corruption referenced by participants included: studies of personal experiences with corruption by individuals, households, health workers, and government officials (e.g. how much/how often have they have been party to paying or requesting bribes or other corrupt acts), and public expenditure tracking survey (PETS) for health, which can be used to follow how public funding flows from the point of central disbursement to how it is used to pay for health services in states, counties, and other localities. One approach used by donors is the portfolio review, in which a sample of grants is investigated by an Inspector General or other neutral office. The World Bank, the Global Fund to Fight AIDS, TB and Malaria, and USAID have all used portfolio reviews as a way to identify fraud and other instances of waste and/or corruption, and measure losses.16
While each of these approaches can shed some light on specific areas and instances of corruption, participants felt that none in isolation can fully determine the extent of and losses due to corruption.
Need for Continued, and in Some Cases, Expanded Measurement by Donors
Though participants felt pursuing a broad, overall estimate of losses to corruption in global health presented many difficulties they did agree that corruption in the health sector can be a serious problem, and that global health programs could do more to try to measure and understand it. Participants stated that just because corruption cannot be accurately measured at a global level does not mean such acts do not occur or that they have little impact on global health programs. To give some indication of how corruption manifests itself in health systems, participants pointed to a number of published studies that highlight the kinds of corrupt activities that can take place. Table 1 (next page) provides a selection of data points from published studies on corruption in different components of the health systems of low- and middle-income countries.
Participants felt current donor approaches to assessing the risks and impacts of corruption are often inadequate. Typically, donors such as the U.S. will audit programs in reaction to a complaint or some prior evidence of fraud or abuse. They said it is much rarer to see donors engage in proactive, preventative investigations focusing on a randomly selected sample of grants even though this approach could provide a more robust estimate of corruption and waste. Such a randomized approach has been used for some U.S. domestic health programs such as Medicare to track so-called “improper payments” (includes fraud and abuse as well as other categories of misuse of funds),* but has not been widely utilized for assessing foreign assistance or global health portfolios.
Table 1: Selected Estimates of Corruption in Health from Published Studies
Year(s)
Corruption Estimate
1999
68-77% of health system user fees misappropriated or pocketed in Uganda17
2000
21% of hospital procurements estimated diverted due to corruption in Ghana18
2000-2006
In a study of 6 countries, the percent of patients surveyed reporting having to make informal payments for service ranged from 4% in Benin to 35% in Sierra Leone19
2001-2006
Opinion surveys of the public in 7 countries found the percent of the public who believed the health system was “corrupt” or “very corrupt” ranged from 20% in Indonesia to 56% in Sierra Leone20
2001-2006
Surveys in 6 countries found the percent of health worker absenteeism ranged from 6% in Cameroon to 25% in Peru to 40% in India21
2003
In Thailand, a reported 8.5% of medicines were considered sub-standard22
2005
20% of public officials in Guinea reported job purchasing in the health system is “common” or “very common”23
2011
After reviewing grant portfolios in 25 of 145 recipient countries, the Global Fund’s Office of the Inspector General reports 0.8% of disbursed grants to those countries ($39m of $4.8b total) was lost to fraud24
2012
Across seven countries in Asia, 36% of antimalarial drugs being sold were falsified; in 21 countries in sub-Saharan Africa, 20% were falsified25
2013
An internal review conducted by Gavi, the Vaccine Alliance (a multilateral financing mechanism for immunizations in developing countries) found that 31% of one grant ($523m out of $1.685B) to Sierra Leone had been misappropriated26
2013
The percent of patients who reported paying a bribe to obtain health services in 8 countries in central and eastern Europe ranged from 4% in Croatia to 32% in Bosnia-Herzegovina27
Further, participants felt that more studies linking corruption in the health sector and the resulting negative impacts on population health would be helpful. A few studies on this topic have been published,28 but participants felt that more evidence linking corrupt practices with real human health impacts could be an important way to understand and highlight the human costs of corrupt acts.
Question 2: Are Current Anti-Corruption Efforts Adequate?
According to participants, anti-corruption efforts can take many forms that can range from broad governance and rule of law programs to more sector-specific approaches. Global health-specific anti-corruption programs are not common, especially within the U.S. government’s global health portfolio, but participants stated that successful examples of such efforts do exist and can be instructive. Overall, participants felt more could be done by donors on health sector-specific anti-corruption policies and programs, especially in light of a number of factors that could potentially contribute to greater corruption risks within global health, such as an increasing emphasis on “local ownership” of health programs and the growing need for health programs to work in fragile, conflict and post-conflict states where disease burden is concentrated but governance can be weak.
Approaches to Anti-Corruption in Health
Participants discussed a variety of anti-corruption efforts. Some are broad-based programs that focus on improving the judicial system and supporting the rule of law or building general governance and leadership capacity of a country. Other efforts target certain areas or sectors, such as programs that address specific components of the health system. Some of the types of policies and programs in the health sector participants discussed are listed in Box 2. Participants reported that the two types of efforts – broad and sector-specific – remain isolated for the most part. They recommended fostering a combined approach that utilizes both broad and targeted anti-corruption efforts together in a coordinated fashion.
Box 2: Examples of Anti-Corruption Policies and Programs
Robust internal audit /portfolio review
Collecting baseline data (absenteeism rates, informal payments, stockouts) to show that policy changes and interventions work
Designing and implementing complaint mechanisms
Supporting administrative law
Civil society watchdog organizations & social audit; health boards
Insurance fraud control (data mining for detection, transparency on entitlements, sanctions)
Innovative financing approaches such as results-based aid and performance-based financing
Quality improvement/clinical audit
Health management systems strengthening & supervision
Coordination with efforts to promote better governance in other sectors
SOURCES: adapted from Vian T, Savedoff W, and Mathisen H. (2010). Anticorruption in the Health Sector: Strategies for Transparency and Accountability. Kumarian Press; and Hussmann K (2011). Addressing corruption in the health sector: Securing equitable access to health care for everyone. U4 Anti-corruption Resource Centre Issue Brief, January.
Participants also discussed ways donors could do more to reduce the risks of corruption through changes in their practices. For example, donors can diagnose and track potential waste and corruption through more regular use of portfolio reviews (described above) to examine recipients of global health grants and the trail of funding. Findings from such reviews in the past have led to further investigations and prosecution of corruption. Losses could be recouped and these efforts could have a preventative effect against further infractions. Participants also discussed utilizing innovative financing approaches such as results-based aid and/or performance-based financing.29 Participants felt that by using such innovative approaches – delivering aid according to outcomes rather than inputs – donors can reduce the risk for abuse and fraud.
Other approaches discussed by participants involve working with country partners to reduce corruption risks in country health systems. For instance, donors could support targeted anti-corruption efforts to improve governance and oversight of health programs and better identify and minimize loss from corruption. Examples of such approaches include: collecting and sharing baseline data on corruption, instituting quality improvement, automated monitoring and complaint mechanisms, and involving civil society through watchdog groups or community health boards to promote better oversight and accountability. Participants pointed to several examples of successful health system anti-corruption efforts, some which are listed in Table 2 (next page).
Participants identified some common characteristics of successful anti-corruption programs for health. For example, programs can be more successful if they consist of more than one intervention because singular approaches may only shift risk; a complementary set of policy changes is typically a more effective approach.30 Participants also stated that it is often invaluable for anti-corruption efforts to take place where there is committed leadership among the implementers and partners because it is difficult to impose successful anti-corruption interventions externally. Participants felt that successful programs reflect input and participation from patients, clients, and other affected members of the health system and communities, as this increases the transparency of health programs and generates more accountability among leaders and policymakers.
Table 2: Selected Examples of Successful Anti-Corruption Interventions in the Health Sector
Description of Anti-Corruption Program and Impact
User fee revenue theft in provincial referral hospitals in Kenya was virtually eliminated through installation of networked electronic cash registers31
A multi-pronged strategy including overhauling the government drug regulator, stepped up enforcement and a public information campaign led to an 80% reduction in fake drugs in the Nigerian market in 200432
Health Public Expenditure Tracking Surveys (PETS) in Chad and Ghana identified funding flows from central to regional/district level represented the largest risk of leakages, allowing for stricter oversight in areas of weakness and subsequent reduced losses33
Citizen participation in health boards in Bolivia led to significant decreases in illegal overpayment for drugs and supplies, for example a 40% reduction in price for intravenous solution34
Pay for performance mechanisms linking health worker bonuses to facility performance increased quality, boosted utilization, and reduced the incidence of informal payments in Cambodia35
Revised rules and transparency about hospital fees, sharing earned revenue with staff, and other rewards discouraged informal payments in Georgia36
Overall, participants felt anti-corruption efforts such as these could be effective for global health programs given additional, sustained support from donors.
U.S. Government Anti-corruption Efforts and Global Health
Participants indicated that U.S. anti-corruption efforts through foreign assistance tend to concentrate on broader, cross-sectoral approaches to combating corruption. For example, most USAID assistance for anti-corruption is targeted at rule of law, democratization, and governance programs rather than sector-specific programs in health or other areas.37
Participants did note that U.S. global health assistance is reviewed on a regular basis for fraud, waste, and abuse, typically through audits led by the Office of the Inspector General (OIG) in each of the departments and agencies responsible. For example, the legislation for PEPFAR (the President’s Emergency Plan for AIDS Relief), requires that the departments overseeing the HIV/AIDS, TB, and malaria programs authorized through that legislation submit a coordinated audit plan, and share with Congress the results of those audits. These audits are meant to determine whether funded projects meet stated goals and objectives, though in the course of performing them, auditors may encounter instances of waste, fraud, and abuse. Additional investigations of specific acts of corruption can be triggered by complaints or whistleblowers, though results from such investigations are typically not made public.
Even though participants felt audit and oversight of this kind can be helpful, some expressed concern that the current U.S. approach is ad-hoc and does not allow for a robust assessment of U.S. funding lost to corruption, waste, and/or fraud. A more informative approach, according to participants, would be to perform audits of a randomly selected subset of all grants/projects. This would provide for a more comprehensive picture of losses and point to areas of concern more effectively.38
Participants felt there are other changes in approach and practice that the U.S. could implement to reduce corruption risks. For one, the U.S., with its annual appropriation process, can try to avoid the situation in which there is pressure to get funds “out the door” at the end of the fiscal year, a practice that can lead to less oversight and, therefore, higher risk of misappropriation or abuse by the recipients of these funds. In addition, donors can ensure country strategic and operational plans explicitly address anti-corruption goals, as they relate to the health sector specifically.39 Currently, such plans only rarely incorporate or even mention anti-corruption objectives. Further, participants felt the U.S. should consider adopting results-based and performance-based approaches wherever possible, which can help reduce corruption by spending on outcomes as opposed to inputs.40
Participants discussed key trends in global health assistance that could have implications for anti-corruption efforts of the U.S. and other donors. The first was the growing emphasis toward shifting USG global health financing away from U.S.-based non-governmental organizations (NGOs) and toward “local ownership” and local organizations.41 Some participants argued that making such a shift increases the risk of corruption because there is potentially less accountability and fewer controls in local organizations as compared to U.S.-based NGOs. Others saw shifting resources in this manner as a way to foster sustainable capacity in countries to combat corruption because, by supporting local organizations, donors can help community stakeholders organize and hold governments accountable.42 Overall, participants felt that as the emphasis on local partnerships grows, U.S. programs must ensure that sufficient safeguards are in place to minimize any risks to losses from corruption.
Another tension discussed by the roundtable participants was balancing burden of disease and governance considerations. Many of the countries where corruption risks are highest – those with weak institutions and those facing conflict and post-conflict situations – often face the greatest burdens of disease. Participants debated whether the U.S. should focus assistance where the need is greatest but governance may be weakest, or whether it was better to direct investments to countries with a track record of good governance. No simple solutions to the conundrum were identified, but participants felt it was important for the U.S. and other donors to consider this tension when developing policy. Participants also stated the U.S. needs to be sensitive to “backsliding” in governance standards as a result of governmental or societal change, which highlights the need for sustained anti-corruption efforts over time.
Question 3: How Can We Communicate About Corruption More Effectively?
Participants agreed that communicating about corruption to the public and policymakers presents a number of challenges. For one, some level of corruption is likely a part of any large-scale global health program, but can be difficult to discuss openly because the public and policymakers have proved to be extremely sensitive about the topic. Many in the public already have a strong belief that corruption represents an enormous drain on foreign assistance programs even though available evidence indicates that losses from corruption do not match perceptions, according to participants. For example, in a 2013 KFF survey, Americans reported on average they thought about half of every dollar the U.S. spends on global health was lost to corruption, and that only 23 cents of every dollar spent actually reaches the people who really need it.43 Roundtable participants felt such estimates represent a tendency of the public to believe the problem is worse than it really is, and can lead to misplaced doubts about the effectiveness of global health assistance and foreign aid in general.
Participants were concerned that entrenched public beliefs about the prevalence and impact of corruption can lead to donors to being overly sensitive about perceptions of corruption occurring in their programs. As was asked during the discussion: how much is the fear of a corruption-fueled headline limiting agencies’ willingness to confront corruption? Participants did recognize that donors sometimes find themselves in difficult situations after corrupt acts are identified, especially when the media sensationalize a story. Participants noted a well-known example of this from 2011, when an Associated Press article on corruption within some Global Fund grants led several Global Fund donors to threaten withholding support even though the corrupt acts were discovered and reported by the Global Fund itself, and the actual amount lost to corruption was much less than was insinuated in the article. As was evidenced by the Global Fund experience, there can be a disproportionate backlash for agencies and organizations when corruption is identified and publicized. Participants worried that this interplay between public perceptions and transparency about corruption has fostered an environment where leaders and program managers commit to “zero tolerance for corruption” policies even though such goals are probably unrealistic. In the current environment, participants worried that donors often wish to avoid even talking about the corruption that is an inevitable part of any health system, or even worse, may turn a blind eye or ignore the problem for fear of potential repercussions.
According to participants, shifting the pervasive negative public opinions in the U.S. and other donor countries about the extent and impact of corruption in global health assistance is a difficult and long-term task. Barring a sea change in public opinion, participants felt that a more proactive, preventative approach to communication about corruption is a better option than not discussing or ignoring it. Participants discussed preliminary research on public messaging about corruption and its impact on public opinion, which indicates that the stigma associated with discussing corruption can be ameliorated by focusing on more active, positive messages about what is being done to combat it rather than waiting until corruption is reported before acting. As an early step, participants said donors can do more to emphasize and highlight successful anti-corruption interventions, as these can lead the public and political leadership to understand that steps are being taken to address the issue.
Still, there was recognition among participants that global health programs may face a “catch-22” situation with complicated and sometimes perverse incentives. If donors and country governments do a better job at identifying corruption, the result may actually be a decline in willingness to finance global health programs in those areas or with those partners, even though the risk of loss to corruption may have been reduced. Ultimately, more needs to be understood about the relationship between implementing greater transparency and accountability interventions and the impact on corruption and public perception. Pilot studies have begun to look at such issues but results are not yet available.44 Participants felt this is an area of study that donors could do more to support given the potential lessons that could be drawn.
Conclusions and Next Steps
The roundtable discussion was wide-ranging, covering many aspects of corruption and global health. Participants were in agreement that it is not really possible to know what percentage of financing for global health is lost to corruption, given data limitations and the challenge of measuring corrupt activities. Even so, participants felt corruption does occur and can dilute the impact of global health financing, and current donor approaches to assessing risks and impacts of corruption are often inadequate. Current anti-corruption programs, particularly those funded by U.S. government agencies, tend to focus on broader reform of the justice system, rule of law and governance. Expanding health sector specific anti-corruption efforts could complement these important efforts especially given that there have been some examples of successful anti-corruption programs in health. On the question about communicating about corruption, participants recognized the potential difficulties in being more transparent and direct about corruption risks and efforts to reduce them in the context of global health programs, but also felt that a more proactive approach may be a better strategy than trying to avoid talking about the problem for fear of backlash.
Although participants felt that solutions will differ by location and circumstances, and no “one-size fits all” approach can work everywhere, there are a number of concrete steps that donors, such as the U.S., could take to better address corruption in global health. Some of these steps include:
Invest in research on further measuring and understanding corruption in the health sector;
Dedicate more resources to investigate and understand the true risks of corruption through such tools as portfolio review applied to a broader, random sample of grants and sector-specific studies in coordination with in-country partners;
Incorporate explicit anti-corruption policies and interventions into U.S. and partners’ global health strategic and operational plans;
Link global health programs with broader rule of law and governance reform efforts whenever possible;
Implement and expand anti-corruption interventions in health, building upon already proven models, which should be adapted to local circumstances;
Promote anti-corruption efforts and highlight successes.
Ultimately, participants felt that it is important for the U.S. and other donors to dedicate more funding and time to understanding and combatting corruption in global health. While they felt the problem of corruption in health may not rise to the level of concern expressed by some policymakers and by the public at large, it is still an issue that needs to be confronted more effectively going forward.
* According to estimates from U.S. Government Accountability Office, $60 billion in “improper payments” were made through Medicare in 2014, representing over 10% of the $492 billion spent on Medicare that year. An unknown portion of the $50 billion represents actual fraud. Source: http://www.gao.gov/highrisk/medicare_program/why_did_study#t=0.
Appendix
Resource List
General Background/Overview/Theory
Campos, J. E., and Pradhan, S. (2007). The many faces of corruption: tracking vulnerabilities at the sector level. World Bank.
Savedoff, W. and Hussmann, K. (2006). Why are health systems prone to corruption? Transparency International Global Corruption Report 2006.
Vian, T. (2005). The Sectoral Dimensions of Corruption: Health Care. Fighting Corruption in Developing Countries: Strategies and Analysis. Edited by Bertram I. Spector. 43-63. Bloomfield, CT: Kumarian Press.
Vian, T. (2006). Corruption in Hospital Administration. Global Corruption Report 2006. Edited by Transparency International. 48-61. London: Pluto Press.
Vian, T. (2008). Corruption and the Consequences for Public Health. International Encyclopedia of Public Health. Vol 2. 26-33. San Diego, CA: Academic Press.
Vian, T. (2008). Review of corruption in the health sector: theory, methods, and interventions. Health Policy and Planning 23 (2): 83-94. doi: 10.1093/heapol/czm048
Estimates of corruption in the health sector and links to health impacts
Azfar, O. and Gurgur, T. (2008). Does corruption affect health outcomes in the Philippines? Economics of Governance July 2008, Volume 9, Issue 3, pp 197-244.
Hanf M, et al. (2011). Corruption Kills: Estimating the Global Impact of Corruption on Children Deaths. PLoS ONE 6(11): e26990. doi:10.1371/journal.pone.0026990
Kohler JC. (2011). Mapping of Good Practices of Anti-Corruption Interventions in the Health Sector. Prepared for the UNDP Democratic Governance Group, New York.
Lewis M. (2000). Who is paying for health care in Eastern Europe and Central Asia? World Bank Publications.
Lewis M. (2006). Governance and corruption in public health care systems. Center for Global Development working paper, (78).
Lin RT, et al. (2014). Governance matters: an ecological association between governance and child mortality. Int Health. 6(3):249-57. doi: 10.1093/inthealth/ihu018. Epub 2014.
Vian T, et al. (2013). Perceptions of per diems in the health sector: Evidence and implications. Health Policy & Planning. 28(3):237-246.
Witvliet MI, et al. (2013). Sick regimes and sick people: a multilevel investigation of the population health consequences of perceived national corruption. Tropical Medicine and International Health. 18(10):1240–1247.
Country/region specific studies
Avelino G, Barberia LG, Biderman C (2013). Governance in managing public health resources in Brazilian municipalities. Health policy and planning. 2014 Sep;29(6):694-702. doi: 10.1093/heapol/czt003. Epub 2013 Feb 14.
Burak LJ, Vian T (2007). Examining and predicting under-the-table payments for healthcare in Albania: An application of the theory of planned behavior. Journal of Applied Social Psychology. 37(5): 1060-1076.
Ghosh A, Ahmad S. (1996). Plague in Surat: Crisis in Urban Governance. New Delhi: Concept Publications.
Vian T (2014). Corruption risk assessment in the health sector in Kosovo. UNDP: Pristina, Kosovo.
Vian T, Bicknell WJ (2013). Good governance and budget reform in Lesotho Public Hospitals: performance, root causes and reality. Health Policy and Planning 2014 Sep;29(6):673-84. doi: 10.1093/heapol/czs121. Epub 2013 Jan 4.
Vian T, Burak LJ (2006). Beliefs about informal payments in Albania. Health Policy and Planning 21 (5): 392-401.
Vian T, et al (2006). Informal Payments in Government Health Facilities in Albania: Results of a Qualitative Study. Social Science and Medicine 62: 877-887.
Focus on the Pharmaceutical Sector
Attaran A, et al (2012). How to achieve international action on falsified and substandard medicines. BMJ, 345.
Baghdadi-Sabeti G, Serhan F (2010). WHO Good Governance for Medicines programme: an innovative approach to prevent corruption in the pharmaceutical sector. Compilation of country case studies and best practices. World Health Organization. http://apps.who.int/medicinedocs/en/d/Js17550en/.
Cohen JC, et al (2007). Corruption and pharmaceuticals: Strengthening good governance to improve access. The Many Faces of Corruption: Tracking Vulnerabilities at the Sector Level. Washington DC: World Bank.
Ciccone DK, et al. (2014). Linking governance mechanisms to health outcomes: a review of the literature in low- and middle-income countries. Social Science and Medicine 117:86-95.
Kohler JC, Makady A (2013). Harnessing global health diplomacy to curb corruption in health. J Health Dipl, 1(1), 1-14.
Mackey TK, Liang BA. (2012). Combating healthcare corruption and fraud with improved global health governance. BMC International Health and Human Rights 12(1):23.
Rashidian A, et al (2012). No Evidence of the Effect of Interventions to Combat Health Care Fraud and Abuse: A Systematic Review of Literature. PLoS ONE 7(8): e41988. doi:10.1371/journal.pone.0041988.
Soreide T et al (2014). Consequences of Corruption at the Sectoral Level and Implications for Economic Development (the G20 Paper on Corruption in Sectors). Prepared for the G20 Anti-Corruption Working Group in Rome 9-11 June 2014. Paris: OECD.
McPake et al. Informal Economic Activities of Public Health Workers in Uganda: Implications for Quality and Accessibility of Care. Social Science & Medicine 49 (1999):849-865. ↩︎
World Bank. 2000. The Ghana Governance and Corruption Survey, Evidence from Households, Enterprises and Public Officials. Referenced in Lewis M (2006). Governance and Corruption in Public Health Care Systems. Center for Global Development Working Paper 78. http://www1.worldbank.org/publicsector/anticorrupt/Corruption%20WP_78.pdf. ↩︎
Cross-country ecological studies have found correlations between high levels of perceived corruption at the national level and poorer health indicators such as child mortality, immunization rates, for example: Hanf, M. et al. (2011). Corruption Kills: Estimating the Global Impact of Corruption on Children Deaths. PLoS ONE 6(11): e26990. doi:10.1371/journal.pone.0026990; Witvliet M, et al. Sick regimes and sick people: a multilevel investigation of the population health consequences of perceived national corruption. Tropical Medicine & International Health 18(10):1240–1247, October 2013; and Lin, R.T. et al. (2014). Governance matters: an ecological association between governance and child mortality. Int Health. 6(3):249-57. doi: 10.1093/inthealth/ihu018. Epub 2014. Other studies have found relationships between corruption and poorer health outcomes, such as a study in the Philippines that found that corruption in that country “reduces the immunization rates, delays the vaccination of newborns, discourages the use of public health clinics, reduces satisfaction of households with public health services, and increases waiting time at health clinics”: Azfar O, Gurgur T. Does corruption affect health outcomes in the Philippines? Econ Gov (2008) 9:197-244, and a study that examined how corruption measures were related to declines in AIDS deaths in sub-Saharan Africa, which concluded: “Countries with higher levels of corruption experience a significantly smaller drop in AIDS deaths as a result of the same quantity of ARVs imported.” Friedman W (2015). Corruption and Averting AIDS Deaths. Center for Global Development Working Paper 395, February. http://www.cgdev.org/publication/corruption-and-averting-aids-deaths-working-paper-395. ↩︎
For example a policy to increase wages of health workers to curb absenteeism will likely work better if there are also systems in place that monitor absenteeism rates and impose sanctions. ↩︎
Vian T, et al (2011). Confronting Corruption in the Health Sector in Vietnam: Patterns and Prospects. Boston University Center for Global Health and Development Discussion Paper 14, October. ↩︎
Barber S, Bonnet F, Bekedam H. 2004. Formalizing under-the-table payments to control out-of-pocket hospital expenditures in Cambodia. Health Policy and Planning 19:199–208. ↩︎
A recent comprehensive review of USAID anti-corruption programs found, just five USAID grants between 2007-2013 focused on anti-corruption or good governance in the health sector – two in the Middle East, two in Eastern Europe, and one in Southeast Asia. The combined budget of these five programs was $137 million, which amounted to 1.7% of the agency’s overall spending on anti-corruption in all sectors over this period. Source: Management Sciences International (2014). Analysis of USAID anti-corruption programs (2007-2013). http://www.usaid.gov/sites/default/files/documents/1866/AnalysisUSAIDAnticorruptionProgrammingWorldwideFinalReport2007-2013.pdf. ↩︎
For example, the Transparency for Development Project will examining impact that transparency and accountability interventions have on public health service delivery is several countries. http://t4dproject.org/. ↩︎
A new Kaiser Family Foundation brief explores what’s known and understood about how corruption overseas affects U.S. global health programs, including the challenges in measuring and quantifying the problem. The brief summarizes a roundtable discussion of experts convened by the Foundation. Key themes of the discussion included how more could be done to reduce global health corruption through coordinated policies and programs, and how the U.S. government and other stakeholders could use a proactive, preventive approach when addressing corruption.
Corruption remains a major concern not only for policymakers, but also for the public at large. A Foundation poll found 83% of U.S. residents consider corruption to be a major barrier to improving health in developing countries, and nearly half consider it the single most important barrier.
The Medicaid program, signed into law by President Lyndon B. Johnson on July 30, 1965, will reach its 50th anniversary this year, a historic milestone. At the Kaiser Commission on Medicaid and the Uninsured, where we have closely studied and analyzed Medicaid for nearly 25 years, we are recognizing this important occasion by documenting Medicaid’s evolution and its role in our health care system today. This report reflects on Medicaid’s accomplishments and challenges and considers the issues on the horizon that will influence the course of this major health coverage and financing program moving forward.
Established along with Medicare by the Social Security Amendments of 1965, and authorized as Title XIX of the Social Security Act, Medicaid was initially designed as a federal-state program to cover medical expenses for aged, blind, and disabled individuals and parents and dependent children receiving public assistance. Medicaid’s hybrid structure, which involves a mix of federal and state financing and control, is, in many respects, the defining feature of the Medicaid program, and the contrast to Medicare, a national program governed by federal standards and rules and financed entirely by the federal government, is striking. The federal-state Medicaid partnership has served to advance a variety of both federal and state goals. However, it is also the root source of continual tensions over the balance between federal standards and state flexibility and over Medicaid costs and financing. Medicaid’s federal-state structure has also led to substantial state variation in nearly every domain of Medicaid program design and operation, with large implications for access to coverage and care for low-income Americans.
Medicaid is a voluntary program for states and not all states took it up initially. However, access to federal matching funds to provide health coverage for the uninsured proved to be a strong incentive for states, and, by 1982, all 50 states and the District of Columbia had Medicaid programs in place. Over the last five decades, both Congress and the states have expanded and reformed Medicaid significantly to more effectively cover the nation’s uninsured and underinsured citizens. The Medicaid program now provides health and long-term care coverage to nearly 70 million low-income Americans, including pregnant women, children and parents, people with a wide range of disabilities, poor seniors who are also covered by Medicare, and, in states implementing the Medicaid expansion established by the Affordable Care Act (ACA), low-income adults who were previously excluded from the program. Prior to the implementation of the ACA, Medicaid covered roughly half of nonelderly Americans living in poverty. However, because of restrictive eligibility for nonelderly adults and gaps in participation, about half of poor people went without Medicaid coverage.
Medicaid beneficiaries include many of the most disadvantaged individuals in the U.S. in terms of poverty, poor physical and mental health, disability, and lack of social supports. Between its large enrollment and the complex and costly needs of many of its beneficiaries, Medicaid represents a major commitment of federal and state spending. The Medicaid program is the second-largest item in state budgets, after elementary and secondary education, and the third-largest federal domestic program, after Social Security and Medicare. In FY 2013, combined state and federal Medicaid spending totaled $438 billion.
While Medicaid’s coverage role is its most visible aspect, Medicaid’s impact ramifies throughout our health care system. By filling gaps in coverage among people of color, the program plays a key role in advancing health equity. Its comprehensive benefits for prenatal and pediatric care provide a healthy start for millions of American children as well as access to services and supports that are essential to the well-being of children with special needs but not typically covered by commercial insurance. The Medicaid program fills holes left by the private health insurance market, covering people who are priced out of it or do not have access to job-based coverage, and providing broader coverage to many severely disabled and chronically ill individuals. Medicaid also supports poor Medicare beneficiaries and the Medicare program by bearing the high costs of long-term care. And Medicaid revenues provide core funding for our health and long-term care institutions and providers, including safety-net hospitals, emergency departments, health centers, the mental health system, and nursing homes.
Finally, the Medicaid program is a locus of innovation in the health care system. Many states are designing and implementing new models of coordinated and integrated care for people with complex needs that may provide a model for health care delivery beyond the Medicaid context. Medicaid is also the fulcrum of ongoing expansion in access to community-based long-term services and supports that enable individuals with disabilities and older adults who would otherwise require institutional care to live independently in the community.
In the pages that follow, we trace Medicaid’s evolution, discussing major legislative changes and other inflection points in the program’s history, both for the record and for perspective on Medicaid’s different roles in our health care system and how they developed. In doing so, we also show how Medicaid threads through our health care system today and take the measure of its impact. We begin by discussing Medicaid coverage for the main populations served by the program. We then discuss delivery systems and innovation in Medicaid and Medicaid spending and financing. We conclude by looking forward to consider the main issues that will concern the Medicaid program in the decades ahead and to assess how Medicaid is poised to meet the future needs of our nation.
Report: Low-income Pregnant Women, Children And Families, And Childless Adults
Coverage
Medicaid’s most well-recognized role in our health care system is as a health coverage program for low-income pregnant women, children, and families. Currently, more than half the states provide Medicaid eligibility for pregnant women with incomes up to at least 200% of the federal poverty level (FPL) (about $40,000 for a family of three in 2015), and the Medicaid program finances almost half of all births. Roughly 33 million children, or more than 1 in 3, are covered by Medicaid (Figure 1).1 Medicaid plays an especially large coverage role for children of color, whose families are more likely to have low income compared to whites, and, as such, the program has reduced racial and ethnic disparities in children’s coverage. Medicaid also serves a large share of children with special health care needs.
Figure 1: Medicaid covers a large share of certain populations.
Medicaid plays a major but much more limited coverage role for low-income nonelderly adults. In 2013, Medicaid covered over 75% of all children living below the poverty level but just 35% of adults in this income band. The reason for this disparity is two-fold. First, states have historically provided more restrictive eligibility for parents than for children. Second, until the ACA was enacted, nondisabled childless adults under age 65 were categorically excluded from Medicaid by federal law, no matter how poor they were. Prior to the ACA, some states pursued special federal waivers to cover some low-income childless adults under limited expansions of Medicaid. Demonstration waiver authority in section 1115 of the Social Security Act enables HHS to permit states to try approaches that are outside the statutory framework for Medicaid and still receive federal matching funds if the demonstration furthers the objectives of the Medicaid program.
Medicaid’s role in providing health coverage for low-income pregnant women, children and families, and childless adults developed incrementally over time as both federal and state lawmakers expanded the program to cover broader segments of the uninsured population. Under the original 1965 Medicaid law, states were required to provide Medicaid eligibility to poor single parents and children receiving welfare through the Aid to Families with Dependent Children (AFDC) program, for which states set the income eligibility thresholds – frequently, well below 50% FPL. States were also granted broad flexibility to provide Medicaid to “medically needy” parents and children with income above the state’s AFDC threshold but high medical expenses relative to their income. Some states used this flexibility to extend coverage to more low-income families. The law also gave states an option to cover children in two-parent families with income up to the state’s AFDC threshold, regardless of whether the family was receiving welfare – so-called “Ribicoff children” for the Senator who authored the provision. This option was used widely by states to expand children’s coverage, and it can be seen as the kernel of later federal reforms that formally decoupled Medicaid eligibility from welfare status and recast Medicaid (for children, families, and, finally, childless adults) as an income-based health coverage program.
Over time, Congress, through stronger federal minimum requirements, and states, through their requests for and often vigorous take-up of new program options, built on the narrow early Medicaid platform to further expand and improve coverage for children and pregnant women (Figure 2). The Social Security Amendments of 1967 established the Early and Periodic Screening, Diagnosis, and Treatment (EPSDT) program, Medicaid’s uniquely comprehensive benefit package for children up to age 21, which emphasizes early access to care and regular screenings to assess growth and development. The law required all states to cover EPSDT, overriding previous state-set limits on the amount, duration, and scope of services for children.2 In 1984, Congress moved to require rather than permit states to cover Ribicoff children under age 6 and, responding to concerns about rising infant mortality rates, required coverage of first-time pregnant women up to states’ AFDC thresholds as well.3 Subsequent legislation raised the federal minimum eligibility thresholds for both pregnant women and children, and many states chose to expand Medicaid eligibility beyond the federal minimum levels. In the late 1980s and early 1990s, in response to the still very low eligibility thresholds in place for pregnant women and children in some states, Congress required all states to cover pregnant women and children under age 6 with family income up to at least 133% FPL. Also, in 1989, EPSDT was significantly strengthened.4 In 1990, states were required to phase in Medicaid coverage for school-age children (age 6-18) with family income up to 100% FPL, an expansion that was completed in 2002, establishing Medicaid eligibility for all children in poverty nationwide.
Figure 2: Medicaid has evolved over time to meet changing needs.
In 1996, in a major federal overhaul of the welfare program, which is now known as Temporary Assistance for Needy Families (TANF), Congress de-linked Medicaid eligibility from welfare eligibility and gave states flexibility to expand income eligibility for Medicaid broadly to cover more working families. Severing Medicaid from its welfare roots fundamentally altered Medicaid, transforming it from a welfare program to a health coverage program for low-income children and families. In 1997, Congress built on Medicaid yet again, establishing the State Children’s Health Insurance Program (CHIP), which provides enhanced federal matching funds to states to cover low-income children above the cut-off for Medicaid through either an expansion of Medicaid or a separate CHIP program. Responding to the high federal match rate and interest in expanding coverage for children, states embraced CHIP and, for the first time, conducted vigorous outreach and enrollment campaigns. In many states, efforts to promote participation in CHIP carried over to Medicaid, marking a sea change in the program’s orientation, from gate-keeping to gate-opening, as far as children were concerned.
While the progression of Medicaid expansions resulted in broad coverage of low-income children, Medicaid coverage of their parents lagged far behind, and the categorical exclusion of most childless adults from Medicaid left even the poorest of these individuals without access to coverage. It was against this backdrop that the ACA ushered in the most recent era of Medicaid expansion. The health reform law expanded Medicaid eligibility to nonelderly adults with income up to a uniform federal threshold of 138% FPL (about $16,250 for an individual in 2015) and provided nearly full federal financing for the cost. This expansion established Medicaid as the health coverage program for nearly all low-income Americans under age 65 within the broader system the ACA created to cover the uninsured.
The ACA also raised the minimum Medicaid eligibility threshold for school-age children to the same level that applies for younger children, eliminating previous age-based differences in minimum eligibility standards, and extended Medicaid coverage for foster care children up to age 26 (paralleling the requirement that private insurers offering dependent coverage for children allow those up to age 26 to remain on their parent’s plan). In addition, the ACA required states to take far-reaching measures to modernize and streamline the Medicaid application, enrollment, and renewal processes to be coordinated with the new Marketplaces.
Unexpectedly, the Medicaid expansion to low-income adults hit a major hurdle in the Supreme Court’s landmark decision on the ACA in National Federation of Independent Business v. Sebelius.5 The Court ruled that the Medicaid expansion was unconstitutionally coercive and the decision limited the HHS Secretary’s enforcement authority, effectively making the expansion optional for states. As of this writing, 29 states and the District of Columbia have adopted the Medicaid expansion, including several recently, and other states are debating the issue, evidence that the picture may continue to evolve.
The federal and state expansions of Medicaid over the last five decades have had a dramatic impact on coverage of low-income children and adults in the U.S. In 2011, almost 33 million children and more than 18 million pregnant women, parents, and other nonelderly, nondisabled adults were enrolled in the program. The greatest impact of Medicaid and CHIP has been on children’s coverage. Between 1997 and 2012, the uninsured rate among children fell by half, from 14% to an historic low of 7%.6 Currently, more than half the states cover children with family income up to at least 250% FPL (about $50,000 for a family of three.)7 The ACA Medicaid expansion has brought coverage to millions of additional uninsured, nonelderly parents and childless adults in the states that have implemented it. Federal data show that, in September 2014, at least 4.6 million low-income adults were covered through the new adult expansion group in the 23 states for which data were available (of 27 states that had adopted the expansion by then).8 This figure does not include an estimated 1.2 million newly eligible adults in California or enrollment in three additional states that have adopted the expansion in the meantime.9
While Medicaid has been instrumental in reducing the number and share of low-income nonelderly Americans without health insurance, the ACA vision of Medicaid as a universal program for this population has yet to be fully realized. In 2013, over 7 million children remained uninsured, of whom an estimated 5.2 million would qualify for Medicaid or CHIP, pointing to needs for targeted outreach and enrollment efforts.10 A more substantial share of adults who would be eligible for Medicaid are not enrolled in the program, again a signal that more intensive and targeted efforts are needed to engage this hard-to-reach population.11 Also, Medicaid and CHIP income eligibility thresholds for children and nonelderly adults in the states not expanding Medicaid lag behind those in the states moving forward (Figure 3). Further, nearly 4 million poor adults in the non-expansion states fall into the “coverage gap” because their income is too high for Medicaid but too low to qualify for premium subsidies to purchase Marketplace coverage.12 Notably, Blacks, who reside in high numbers in many of the non-expansion states, disproportionately fall into the coverage gap.13
Figure 3: Median Medicaid/CHIP eligibility thresholds for children and nonelderly adults are higher in states expanding Medicaid.
Impact
The goal of Medicaid coverage is to facilitate access to care for low-income people and to provide financial protection against high out-of-pocket costs for health care. A large body of research shows that the program largely succeeds in this purpose. Still, there remain challenges for Medicaid in facilitating access to care. Many factors bear on access to care, including the scope of Medicaid benefits covered by states, limits on Medicaid premiums and cost-sharing, provider payment and participation in Medicaid, transportation and language barriers, and features of the larger health care ecosystem of which Medicaid is part.
Children
Medicaid’s EPSDT benefits for children up to age 21 are considered a model of pediatric coverage. EPSDT is unusually comprehensive and emphasizes early intervention, before preventable health problems become permanent. Its benefits include immunizations and other preventive and primary care services, prescription drugs, hospital care, vision, dental, and hearing services, diagnostic and treatment services, and all other services permitted under federal Medicaid law. Further, the medical necessity standard that governs EPSDT requires states to cover services to correct or ameliorate the effects of physical and mental illnesses and conditions for children. This expansive definition is designed to ensure robust access to care for low-income children, including access to services and supports such as medical equipment, speech, physical, and occupational therapy, and assistive technology for children with special needs.14 To ensure that financial barriers do not impede their access, premiums are prohibited in Medicaid for children below 150% FPL and cost-sharing is tightly restricted for all children. Although children make up nearly half of all Medicaid beneficiaries, they account for about 20% of Medicaid spending, a reflection of their relatively routine and low-cost health care needs and costs compared to others covered by the program, especially beneficiaries with disabilities and those over age 65.
Strong access to primary care among children covered by Medicaid is well-documented (Figure 4).1516 Nearly all children with Medicaid have a usual source of care, which research shows enhances access to and appropriate use of health care services.17 Compared to uninsured children, children with Medicaid are far more likely to have a usual source of care, visit physicians and dentists, and get recommended preventive care, and they are less likely to have unmet needs for medical, dental, and specialty care and prescription drugs. Furthermore, rates of access to preventive and primary care for children with Medicaid or CHIP are fairly comparable to those for children with employer-sponsored insurance (ESI) despite sharp differences between the health status and demographic and socioeconomic profiles of the two groups. When these differences are controlled, rates of access to specialist care are also similar between publicly insured children and those with ESI.18 Notably, children across the board, including those covered by Medicaid or other types of insurance, get preventive care at rates below recommended levels.
Figure 4: Medicaid and private insurance provide similar access to care – the uninsured fare far less well.
Children’s access to oral health services is a key concern in Medicaid. Since severe problems obtaining dental care for children enrolled in Medicaid came to light in the mid-2000s, CMS and the states have made targeted efforts and investments in this area. Although substantial improvements have resulted, in 2013, the share of Medicaid-enrolled children who received at least one preventive dental service a year exceeded 50% in only half the states.19 Children with private dental coverage are generally more likely to get preventive dental care, but, as with other preventive care, rates of preventive dental care are well below recommended levels for all children.20
While population-level findings on access to care in Medicaid indicate high performance overall, direct studies of access at a local level, using “secret shopper” techniques, show that children with Medicaid or CHIP are much more likely than privately insured children to be denied appointments with specialists and that they face longer waits when they do get appointments.21 These findings, which are consistent with lower rates of provider participation in Medicaid compared to private insurance, are informative about beneficiaries’ care-seeking experience and their more limited choice of providers, but it is important to consider them in the context of consistent evidence of high rates of realized access to care in the Medicaid program overall.22
A growing body of research provides evidence that Medicaid and CHIP coverage confer benefits on children beyond improved access to care. Studies show gains in children’s health and health behaviors, improved performance in school, fewer days of missed school due to illness or injury, and higher long-run educational attainment, including high-school completion, college attendance, and college graduation among children covered by Medicaid in their childhood and youth.232425
Nonelderly Adults
Medicaid law authorizes comprehensive benefits for adults, including physician and hospital care, lab and x-ray services, prescription drugs, and non-emergency medical transportation. Medicaid benefits for reproductive care, including both maternity care and family planning services, and breast and cervical cancer screening and treatment, are extremely important for low-income women, who make up two-thirds of nonelderly adult enrollees, and Medicaid expansions to pregnant women are credited with reductions in infant mortality and low birth weights as well as improved health outcomes for children.26 Whereas federal EPSDT requirements establish a uniformly comprehensive Medicaid benefit package for children nationwide, states have substantial flexibility in defining Medicaid benefits for adults and the range and scope of adult benefits vary widely by state as a result. Benefits for adults in the new Medicaid expansion group must include the 10 categories of “essential health benefits” defined by the ACA, but states retain considerable flexibility to design them. Similar to children, nonelderly adults without disabilities are a low-cost Medicaid population. In 2011, nonelderly, nondisabled adults made up about one-quarter of Medicaid beneficiaries but accounted for a fairly small share of Medicaid spending (15%), reflecting both low Medicaid spending per enrollee and limited Medicaid eligibility for this population.
The empirical findings on adults’ access to care in Medicaid are largely positive. Because of its rigorous design, the recent Oregon Health Insurance Experiment provides particularly strong evidence of Medicaid’s impact. Taking advantage of a 2008 lottery that randomly allocated a limited number of new Medicaid “slots” for low-income uninsured adults, investigators compared access to care and selected health outcomes between the adults who won Medicaid coverage and the adults who did not. Study findings one and two years out from the lottery showed higher use of preventive services and other care, improved self-reported health, and reduced clinical depression among the adults who gained Medicaid coverage compared to the others.2728 The risk of medical debt also declined significantly in the Medicaid group and catastrophic medical costs were virtually eliminated for them. On the other hand, the observed reductions in blood pressure, cholesterol levels, and blood glucose levels were not statistically significant. On this point, the researchers noted limitations in the study’s statistical power. A separate team of investigators, using cost-effectiveness analysis, found that the Oregon Medicaid expansion was a good public investment, providing a net financial return to society.29
The evidence from studies comparing Medicaid and privately insured adults’ access to care closely mirrors the evidence for children. The vast majority of adults in both insurance groups have a usual source of care. When health, demographic, and socioeconomic differences between the two groups are controlled, Medicaid adults are as likely as the privately insured to have received recommended preventive care, a general doctor visit, and a specialist visit in the past 12 months.30 Research shows that, compared to adults with similar characteristics who have ESI, adults covered by Medicaid have similar rates of delayed and unmet needs for medical care.3132 Medicaid also affords greater financial protection from medical expenses; it has been projected that adult Medicaid beneficiaries’ out-of-pocket spending would increase more than three-fold if they were covered by ESI instead, even though their expected health care use would not be much different. Again mirroring the findings for children, direct studies of access to care for adults show that physicians are more willing to serve those with private insurance than those with Medicaid coverage.3334 This pattern has led to concerns about provider availability in Medicaid as more adults gain coverage. Anticipating increased demand for services due to expanded coverage, the ACA temporarily raised Medicaid fees for many primary care services, which are typically very low, to Medicare fee levels to garner greater primary care physician participation in Medicaid. Findings that physician participation rates are higher in states with higher Medicaid payment rates relative to other payers suggest that provider payment rates may be an effective tool for leveraging increased access to care.35
Because major chronic illnesses are prevalent among Medicaid adults and securing access to care is arguably most challenging for those with the greatest needs, the experience of beneficiaries with chronic conditions is an important gauge of access in Medicaid. In this regard, a suite of studies has shown significant and clinically meaningful differences in access and care between nonelderly adults with Medicaid and those who are uninsured. One of the studies, which focused on diabetes, found that adults enrolled in Medicaid were less likely than their uninsured counterparts to report being unable to get needed care, had more office visits and filled more prescriptions, and were more likely to get key elements of recommended diabetes care. The companion analyses looking at cardiovascular disease, respiratory disease, and mental illness reached similar findings.3637383940
The vast majority of adults who have ever received Medicaid benefits say that their overall experiences have been positive.41 At the same time, there are some areas of serious concern for adult access to care in Medicaid. In particular, while needs for behavioral health care are great among adult Medicaid beneficiaries and demand for these services is likely to grow with the Medicaid expansion, psychiatrist participation in the program is very low and there is a growing workforce crisis in the field of addiction treatment.4243 Lack of access to dental care is also a major problem. Poor oral health is associated with chronic conditions including diabetes and heart disease and can also interfere with nutrition; poor or missing teeth adversely affect employability as well. Nonetheless, adult dental benefits are optional under federal Medicaid law and they are not included among the ACA’s essential health benefits for newly eligible adults. Most states cover limited or emergency-only dental services for adults, but dental care is very expensive and few Medicaid beneficiaries can afford to pay for it out-of-pocket. Many other benefits, such as eyeglasses and physical therapy, are also optional for adults, and states often drop or cut back on these benefits when they are facing tight budgets.
Report: People With Disabilities
Coverage
While the public is familiar with Medicaid as a health coverage program for low-income children and families, less well recognized is its coverage role for Americans with disabilities. The more than 10 million children and adults who qualify for Medicaid based on disability include individuals with physical impairments and conditions such as cerebral palsy, epilepsy, HIV/AIDS, and multiple sclerosis; spinal cord and traumatic brain injuries; severe mental health conditions, such as depression and schizophrenia; intellectual and developmental disabilities, including Down Syndrome and autism; and other functional limitations. Medicaid’s role for people with disabilities is large because poverty and disability are correlated. In addition, individuals with disabilities have limited access to commercial insurance, which, in any case, typically does not cover the full scope of services that many need. State Medicaid programs cover a wide range of long-term services and supports for people with disabilities in addition to comprehensive acute health care services.
Medicaid’s broad coverage of individuals with disabilities today is the result of federal legislative action going back to the early 1970s, state pursuit and wide use of waiver authority to implement limited expansions, and the convergence of developments in Medicaid, disability rights, and community integration efforts. Under the original Medicaid law, people with disabilities were covered by Medicaid only if they received cash assistance under the state-based welfare system then in place for extremely poor aged, blind, and disabled (ABD) individuals. Some states also used the optional authority to offer Medicaid to medically needy individuals in these groups. The Social Security Amendments of 1972 established the federal Supplemental Security Income (SSI) program, replacing state standards for cash assistance for the ABD population with national eligibility criteria and income standards equivalent to roughly 74% FPL, and the law required states to provide Medicaid for either all federally qualified SSI beneficiaries or all individuals who would qualify for SSI under the state’s eligibility standards in effect in 1972. (Most states elected to provide Medicaid for the entire federally qualified SSI population.) The national standards substantially raised eligibility levels in many states.
The 1972 Amendments also extended Medicare coverage to nonelderly individuals with disabilities but imposed a 29-month waiting period before Medicare benefits begin. Medicaid covers low-income individuals during this waiting period and, after their Medicare benefits begin, it continues as a Medicare supplement, assisting these “dually eligible” enrollees with their Medicare premiums and cost-sharing. For the majority of dual eligible beneficiaries, Medicaid also covers services that Medicare does not cover – most notably, long-term services and supports and, in some states, dental care, eyeglasses and vision care, and hearing aids and services. About 40% of all Medicaid beneficiaries with disabilities are dual eligible enrollees.44 These roughly 4 million individuals, who have involved needs for both acute and long-term care, are among the most vulnerable beneficiaries in both Medicare and Medicaid. Although Medicare is the primary payer for dual eligible beneficiaries, Medicaid finances all their long-term care and about 40% of combined Medicare and Medicaid spending for all the services they receive, not including Medicaid payments for Medicare premiums.45
In 1982, Congress expanded access to Medicaid coverage for children with significant disabilities, establishing the so-called “Katie Beckett” option, which makes it possible for children with disabilities who would otherwise be eligible for Medicaid only if they were receiving care in an institution to remain at home with their families. In states with Katie Beckett programs, and under waivers in other states that permit enrollment caps, parents’ income and assets are disregarded in determining Medicaid eligibility for disabled children living at home, exactly as they are for disabled children in institutional care. Because of this Medicaid coverage pathway, many disabled children in middle-income families are also able to access comprehensive services under EPSDT, which supplement any private health insurance they may have. All but a few states have opted to implement a Katie Beckett program or a waiver to accomplish a similar result.46
In 1986, Congress took action to provide employment support for adults with disabilities, passing legislation that required states to continue Medicaid coverage for working disabled individuals who lose their eligibility for SSI due to earnings. In the late 1990s, Congress established new options permitting states to provide Medicaid eligibility for working individuals with disabilities with higher earnings and resources up to state-defined limits and to charge income-related premiums and cost-sharing.4748 These new Medicaid “buy-in” options were a response to the limitations of job-based health insurance, which is designed for a generally healthy workforce, and also to the fact that employers have disincentives to add high-cost workers to their risk pools. The vast majority of states have adopted “buy-in” options or accomplished a similar purpose under broader section 1115 waivers.49
Over time, expansion in the scope of Medicaid benefits for people with disabilities has also increased the importance of the program for this population. While Medicaid benefits always included skilled nursing facility and home health services, in 1971, Congress established a new state option to cover the services of intermediate care facilities (ICFs) and intermediate care facilities for the intellectually and developmentally disabled (ICFs/IDD). This change enabled states to obtain federal matching funds to help finance services they previously funded with state-only dollars and, in the same stroke, moved the Medicaid program into financing nursing home care for people with disabilities.50
A decade later, in 1981, Medicaid’s role in long-term care entered a new phase when Congress created a new waiver authority in Medicaid (section 1915(c)) that allowed states to cover a wide range of long-term services and supports at home and in community settings for beneficiaries who would otherwise require care in an institution. Using this waiver authority, states can offer services that Medicaid does not cover in general and that may not be medical in nature, and they can target services to subpopulations, such as people with mental illness, cognitive disabilities, or physical disabilities. States can also cap enrollment in section 1915(c) waiver programs. (Under regular Medicaid rules, states generally cannot limit benefits to certain groups or cap participation.) Among the kinds of services that states provide under section 1915(c) waivers are case management, homemaker services, personal care, home modifications, transportation, respite care, and services to transition people from institutions to their homes and communities.51 All states now offer home and community-based services under section 1915(c) waivers or, in a limited number of cases, section 1115 waivers.
Another watershed in the evolution of Medicaid’s role for people with disabilities was the Supreme Court’s landmark decision in Olmstead v. L.C. in 1999. The Court ruled that unjustified institutionalization of individuals with disabilities is illegal discrimination under the Americans with Disabilities Act, a decision leading states to expand access to community-based services. Although Olmstead did not require any change in Medicaid law, the Medicaid program became a key vehicle for Olmstead’s implementation because of its large role in financing long-term services and states’ broad authority to define and design benefits. Indeed, it is fair to say that Medicaid has been the principal engine of expanded access to home and community-based services that make independent living and community integration possible for people with disabilities as well as elderly Americans.52
Impact
Medicaid’s broad eligibility and benefits for people with disabilities explain the program’s large impact on access to care for this population. Medicaid benefits span preventive services, primary and specialist care, and prescription drugs, as well as medical equipment, assistive technology, and long-term care services essential to the well-being of people with diverse disabilities and needs. Neither private insurance nor Medicare covers a similar range of services or provides comparable financial protection. Although Medicaid beneficiaries with disabilities make up only 15% of all enrollees, they account for more than 40% of total Medicaid spending (Figure 5). High Medicaid spending on their behalf reflects their intensive use of both acute and long-term services and the high cost of these services. On a per-enrollee basis, Medicaid spending for people with disabilities is more than five times the level for nonelderly, nondisabled adults and nearly seven times the level for children. Notably, long-term services and supports account for close to 40% of Medicaid spending for beneficiaries with disabilities.53
Figure 5: Most Medicaid enrollees are children, but most Medicaid spending is for the elderly and people with disabilities.
National data show that people with disabilities who are covered by Medicaid are as likely as their counterparts with Medicare or private insurance to have a regular doctor and that they are less likely to have unmet needs overall and unmet needs due to cost.54 Not surprisingly, however, rates of unmet need are higher among Medicaid enrollees with disabilities than among other Medicaid enrollees, and greater disability is associated with greater access difficulties.55 Obstacles like physical inaccessibility of facilities and equipment and lack of transportation are key impediments to access to care for people with disabilities.56
The impact of Medicaid on access to long-term care for low-income people with disabilities is hard to overestimate, as it is essentially the only public or private program that covers this care. Responding to Olmstead, beneficiary preferences, and a growing menu of state options and federal incentives, state Medicaid programs have significantly expanded access to community-based long-term services and have steadily shifted more of their long-term care spending to home and community-based settings, especially in the last 20 years. Nationally, roughly 80% of nonelderly Medicaid beneficiaries with disabilities who use long-term services and supports now receive services in the community rather than in institutions.57 At the same time, also as a consequence of states’ choices, not everyone who qualifies for Medicaid and needs home and community-based services can gain access to this care. The ACA sought to increase access to home and community-based care by expanding an existing state option to provide these services as a regular Medicaid benefit, rather than under waivers. The state option approach requires states to provide the services statewide for all income-eligible beneficiaries, subject to medical necessity, and it prohibits enrollment caps and waiting lists. Notably, relatively few states have taken up the state plan option, indicating that states may find the flexibility that waivers give them to control spending by using restrictive financial and functional eligibility standards, limiting enrollment, and capping services worth the process of obtaining and renewing their waivers. In 2013, more than half a million people were on waiting lists for section 1915(c) waiver programs and the average waiting time exceeded two years.5859
Beyond providing access to care and out-of-pocket protection for people with disabilities, Medicaid eligibility and benefits for this population have also advanced major societal purposes. Due to the Katie Beckett option, many children with significant disabilities can remain with their families and receive services at home or in community settings. Working adults with disabilities with modest earnings can retain their Medicaid coverage or buy it at low cost, an outcome that promotes independent living and more integrated workplaces and communities. More generally, the availability of home and community-based services in Medicaid prevents unnecessary and unwanted institutionalization of people with physical impairments, severe mental illnesses, developmental and intellectual disabilities, and other disabling conditions, and fosters community integration as required by law and desired by many Medicaid beneficiaries and the American public broadly.
Report: The Elderly
Coverage
The Medicaid program covers over 6 million low-income elderly Americans, nearly all of whom also have Medicare. This figure translates to more than 1 in every 7 elderly Medicare beneficiaries. Medicaid supplements Medicare for these dually eligible seniors just as it does for dual eligible beneficiaries with disabilities, covering their Medicare premiums and cost-sharing, and, for those with very low income, providing long-term care and, in some states, other benefits such as hearing aids and eyeglasses.
Before the mid-1980s, elderly Medicare beneficiaries could qualify for Medicaid only if they were receiving SSI benefits or met their state’s medically needy standard, but federal legislative action in the late 1980s and early 1990s extended Medicaid protection to more low-income seniors. Congress first gave states an option to provide Medicaid to Medicare beneficiaries with income exceeding SSI levels but below 100% FPL. A couple of years later, in the 1988 Medicare Catastrophic Coverage Act, Congress used the Medicaid program to cushion the impact of rising Medicare premiums and cost-sharing for low-income Medicare beneficiaries, requiring all state Medicaid programs to cover these costs for Medicare beneficiaries with income below the poverty level. Although this law was famously repealed a year later, the expansion of Medicaid assistance to provide financial relief for Medicare beneficiaries was preserved. Subsequent legislation provided for partial Medicaid coverage, including assistance with Medicare premiums and cost-sharing but not Medicaid benefits, for elderly Medicare beneficiaries at somewhat higher income levels, who are known as “partial dual eligibles.”60 Three-quarters of elderly dual eligible beneficiaries are entitled to both full Medicaid benefits and financial assistance. Many states also provide Medicaid eligibility for medically needy individuals, and they can use another Medicaid option to cover institutional care for elderly individuals up to a state-set income limit up to 300% of the SSI standard and an asset test.
The most significant way that Medicaid helps the elderly is by paying for long-term care. The program covers close to 2 million elderly beneficiaries who use long-term care services – about 1 million who mostly use institutional care and another 1 million who mostly use home and community-based services and supports.61 On average, nursing home care costs more than $90,000 a year, assisted living facility care costs over $42,000, and typical use of home health aide services and adult day care each cost in the neighborhood of $20,000 a year.6263 Such large and unpredictable expenses are difficult to save for and, in the absence of other assistance, virtually impossible to shoulder for elderly Americans living on Social Security and barely able to make ends meet.
A persistent myth about Medicaid is that large numbers of Americans with substantial means transfer their assets to get Medicaid to pay for their long-term care. Actually, people seeking Medicaid for nursing home or community-based long-term care are subject to a review of asset transfers going back five years, and Medicaid eligibility for long-term services and supports is limited to people who are impoverished, often by having spent down their own income and resources to pay for such care. In addition, Medicaid beneficiaries must contribute to the cost of care from their monthly income. The fact that long-term care remains unaffordable for most Americans and that there exists almost no assistance for long-term care other than Medicaid is a current and growing concern.
Impact
Medicaid provides crucial services and financial protection for millions of poor elderly Americans. As vital as Medicare is to the elderly, it is not comprehensive coverage and its large benefit gaps and premium and cost-sharing requirements can result in heavy financial burdens and deter Medicare beneficiaries from seeking needed care. For seniors with low or moderate income and limited resources, Medicaid lowers these barriers and provides benefits for nursing home care and community-based long-term services. Still, the goal of enrolling all elderly individuals who qualify for Medicaid has not been fully realized. Lack of awareness and understanding of the assistance Medicaid provides, complex enrollment processes, asset tests, limited federal and state outreach efforts, and beneficiary reluctance to apply for help from a program associated with welfare all contribute to low levels of participation. Navigating and coordinating coverage between Medicare and Medicaid is also a confusing and challenging task for many. Finally, it should be noted that, largely because of the restrictive asset test, Medicaid premium and cost-sharing assistance does not reach all elderly Medicare beneficiaries with very low income; under current eligibility rules, one-quarter of the elderly with income below $10,000 cannot qualify for this help.64
Major chronic conditions, including hypertension, heart disease, and diabetes, are prevalent among elderly dual eligible beneficiaries; nearly one-quarter have Alzheimer’s disease or another kind of dementia and 1 in 5 have depression.65 These conditions entail high and ongoing costs for care. Medicare finances the vast majority of acute care received by elderly dual eligible enrollees, but Medicaid finances 100% of their long-term care. In 2010, Medicaid financed 40% of combined Medicaid and Medicare spending for all services for elderly dual eligible enrollees, not including Medicaid payments for Medicare premiums.66
Largely because of their high use of long-term services and supports and the high cost of this care, the elderly, who make up just under 10% of all Medicaid beneficiaries, drive roughly 20% of Medicaid spending. Long-term care accounts for close to three-quarters of total Medicaid spending for the elderly. Half of all elderly Medicaid beneficiaries who use long-term care are receiving care in nursing homes or other institutions, but half are now receiving services and supports at home or in the community, evidence that Medicaid’s beneficial impact on independent living and community integration extends to older Americans as well as individuals with disabilities.67
Report: Service Delivery And Payment Systems And Health Care Innovation
Medicaid enrollees obtain care in an array of settings and systems. Most get their acute medical care from private office-based physicians, but 1 in 7 Medicaid beneficiaries obtain care in community health centers and clinics.68 Most health centers, in addition to providing preventive and primary care, offer a more complete array of services than office-based providers, including behavioral health care and dental services, as well as enabling services needed by many in the low-income population, such as translation, transportation, and referral to community-based social services. Health centers have been shown to perform as well as or better than private physician practices on ambulatory care quality measures.69 Public and other safety-net hospitals, including academic medical centers, are the backbone of emergency and tertiary care for Medicaid beneficiaries; at the same time, these institutions are also the hub of access to trauma, burn, and other highly specialized care for the wider community. Nursing homes and providers of home and community-based services and supports serve Medicaid beneficiaries with long-term care needs.
Also important to Medicaid because of the complex needs of many of its beneficiaries are providers of highly specialized services and supplies, including rehabilitation services, durable medical equipment, assistive technology, and other care. The Medicaid program is a major source of support for these specialized providers because Medicaid beneficiaries make up a large share of the populations they serve and because private insurance does not typically cover their services and supplies to the same extent, if at all.
Because of the high needs of the beneficiary population and the large public investment in Medicaid, the federal government and states have a major stake in the access, quality, and cost of the delivery systems that serve Medicaid enrollees. As large purchasers of services, Medicaid programs also have considerable leverage to shape these systems. Over time, states have used flexibility built into Medicaid as well as waivers to develop innovative approaches to organizing and delivering health and long-term care. Increasing sophistication in states’ and health care systems’ use of data analytics to manage risk and clinical care has aided their efforts. In addition, the ACA has fostered delivery system reform activity in Medicaid through the creation of the Innovation Center in CMS and new federal funding opportunities, demonstrations, and state options in Medicaid. CMS’ State Innovation Model (SIM) initiative to promote multi-payer reform strategies specifically leverages Medicaid, harnessing the program’s experience and innovation in serving high-risk populations and its clout as a large payer. CMS has also established the Medicaid Innovation Accelerator Program, which is providing technical assistance resources to states to further support innovation. States are adopting a multitude of models and targeting different populations in their initiatives, but there are common threads – expansion of managed care; a central role for primary care and medical homes, emphasizing care coordination for enrollees with complex needs; greater integration of services; expanded access to community-based long-term services; and a sharpening focus on quality measurement and high performance.
Managed care
The most prominent dynamic in the evolution of health care delivery and payment systems in Medicaid has been the expansion of risk-based managed care in place of the traditional fee-for-service system. States have pursued risk-based contracting with managed care plans for different purposes, seeking to constrain Medicaid spending, increase budget predictability, improve access to care, and meet other objectives. Medicaid managed care got off to a troubled start in the early 1970s with an initiative in California that demonstrated the perils of a poorly regulated program – capitation rates too low to attract mainstream plans, fraudulent marketing, inadequate access to care, and poor quality.7071 The scandal gave rise to federal legislative changes and a regulatory framework for Medicaid managed care that requires comprehensive beneficiary protections and avenues for recourse, sound payment rates, adequate provider networks and access to care, and data reporting by plans and states.
The late 1980s and early 1990s saw substantial growth in Medicaid managed care enrollment as states sought to accommodate growing Medicaid enrollment during a time of fiscal pressures. In this period, states were more concerned with managing costs than managing care. Over time, managed care has grown as states have expanded their programs to include wider geographic areas and additional beneficiary groups and shifted from voluntary to mandatory enrollment models.727374 As of 2015, 38 states and DC have risk-contracting programs, and more than half of all Medicaid beneficiaries nationally are enrolled in comprehensive managed care plans, many on a mandatory basis.
Historically, states largely limited managed care to pregnant women, children, and parents, but they are increasingly including Medicaid beneficiaries with complex needs, including persons with disabilities and elderly enrollees. People who use the most services can experience the most fragmentation, gaps, and redundancies in care and can potentially benefit most from managed care. However, they are also the most exposed to the risk of underservice inherent in capitated systems and may have difficulty navigating managed care and gaining access to needed providers and services. State experience covering higher-need populations through managed care is generally limited and most managed care plans have not typically served them. Thus, the adequacy of provider networks and plan capabilities to handle more complex care needs, and rigorous state and federal oversight of access and quality, are crucial issues as Medicaid programs move in this direction. Medicaid managed care programs and oversight vary widely from state to state, and evidence about the impact of managed care on access to care and costs is both limited and mixed.75767778 The continued expansion of managed care in Medicaid despite the absence of systematic evidence that it improves access or lowers costs is a serious concern, deepened by the lack of managed care data, analysis, and oversight at the federal level.79, 80 After more than a decade, CMS is developing new Medicaid managed care regulations.81 The new rules could strengthen current requirements on states and plans, but ultimately their traction will hinge on effective state and federal enforcement.
Medical homes, health homes, and integration of services
While risk-based managed care dominates the Medicaid delivery system reform landscape, not all states contract with plans, and other innovative and complementary strategies designed to improve care are prevalent in the program. At least half the states have implemented primary care medical homes and pay fee-for-service providers an extra monthly amount to coordinate and monitor primary care services (and sometimes provide additional services for their Medicaid patients). Primary care medical homes may also be implemented in the context of managed care plans.82 Other state approaches build on the medical home model but involve coordination across a broader spectrum of services. Medicaid “health homes” operating in more than a dozen states coordinate physical, behavioral, and long-term care, as well as family supports and social services, for beneficiaries with multiple chronic conditions or a serious mental illness.83 Improving the coordination and quality of care for these high-need, high-cost beneficiaries is a major focus of federal and state delivery system innovation efforts in Medicaid (as well as other public programs). These efforts aim to address the fragmentation of care as well as reduce Medicaid costs through lower rates of preventable hospital and nursing home care.
Many Medicaid beneficiaries have comorbid physical and behavioral health conditions and improving the management of their care has been a focal area of delivery system reform activity. In recent years, a majority of states have undertaken initiatives to integrate physical and behavioral health services.84 One innovative approach that several states have implemented is to designate community mental health centers and other mental health entities as Medicaid health homes for beneficiaries with mental illness, based on an assessment that these providers have the appropriate expertise and are in the best position to coordinate services and supports for this population. In the managed care environment, many states are now integrating behavioral health services previously “carved out” from plans into their comprehensive risk-based contracts to promote more holistic care and consolidate accountability.
Long-term services and supports
Medicaid’s contribution to delivery system transformation is nowhere more significant than in the long-term care arena. As the principal source of coverage and payment for long-term services for Americans, the Medicaid program has essentially shaped the delivery system. Medicaid financing is essential to the nation’s nursing homes. At the same time, the program has facilitated the dramatic expansion of access to home and community-based long-term services and supports as states have invested and shifted more long-term care spending to non-institutional settings.85 By 2013, 46% of all Medicaid long-term care spending was for home and community-based services, compared to 32% in 2002 (Figure 6). These services underpin independent living and community integration of individuals with disabilities and the elderly.
Figure 6: Over time, the share of Medicaid long-term care spending going to home and community-based settings has increased.
A developing branch of innovation is the delivery of long-term care benefits through managed care arrangements. Under CMS-approved waivers, about 20 states are now operating managed long-term services and supports programs, generally statewide, and nearly all of these states require nonelderly adults with physical disabilities and seniors to enroll in managed care to receive services.86 Most of the programs provide for comprehensive Medicaid benefits, including acute care and behavioral health services as well as nursing facility and home and community-based care, breaking new ground in efforts to more fully integrate care for individuals with long-term needs. But the extensive needs and special vulnerabilities of the beneficiaries involved, and the unfamiliar terrain of managed care for most, raise new concerns and call for strong beneficiary supports and protections, such as assistance choosing plans and measures to maximize continuity of care during the transition to managed care. Managed care plans new to providing long-term services and supports, and long-term providers new to managed care, have a challenging learning curve to climb.
Probably the most challenging and ambitious innovation projects in Medicaid are the state demonstrations proceeding under the ACA initiative to align Medicare and Medicaid financing and coordinate service delivery for dual eligible enrollees. All but two of the 11 states currently slated to move ahead with financial alignment demonstrations rely on capitated managed care plans to coordinate the full complement of Medicare and Medicaid services.87 These demonstrations hold potential to enhance the quality and cost-effectiveness of the care that dual eligible beneficiaries receive. However, uneven levels of state experience serving dual eligible enrollees through managed care, uneven levels of plan experience in the Medicaid and Medicare markets, especially with long-term services and supports, and variable plan quality highlight significant issues surrounding the implementation of these reforms for this very poor and uniquely frail population.88
Quality performance
Since its early years, Medicaid has evolved in many states from a passive claims payment program to a more active purchaser that uses its leverage to drive improvements in the quality of care provided to beneficiaries and to foster more accountable systems of care. This evolution has proceeded via diverse mechanisms, including managed care, the development and state use of quality metrics in Medicaid, and integrated delivery systems and innovative payment approaches that reward providers for high quality performance.89 Quality improvement in the nation’s public health coverage programs is also a major federal priority and focus of increased investment. However, the Medicaid quality enterprise is very much a work in progress. Not all states are engaged. State-level technical, analytic, and financial capacity and resources to pursue quality initiatives are limited and there are many competing priorities both within and outside Medicaid. It bears noting that the development of metrics to assess the quality of care received by people with disabilities is in its infancy. Measures to assess and monitor access and outcomes across settings in managed long-term care programs are needed as well.90
Report: Medicaid’s Role In Health Care Financing
As the health coverage program for more than 1 in 5 nonelderly Americans and the main payer for long-term care, Medicaid is a core source of financing in our health care system. It plays an especially large financing role in certain domains. The program provides substantial financing for the health care safety-net – Medicaid payments account for 35% of safety-net hospitals’ revenues and 40% of health center revenues.9192 Medicaid also finances one-quarter of all behavioral health care spending nationally.93 The program pays for nearly half of all births in the U.S. and plays a singular role in financing health care for women and children. Medicaid also pays half the national bill for long-term services and supports needed by people with disabilities and the elderly. Overall, Medicaid finances $1 of every $6 of personal health spending nationally.
The lion’s share of Medicaid spending – nearly two-thirds – is attributable to people with disabilities (42%) and elderly beneficiaries (21%), although they make up just one-quarter of all Medicaid enrollees. Dual eligible enrollees make up 14% of all beneficiaries, but these nearly 10 million seniors and people with disabilities drive 40% of all Medicaid spending. As these figures help to illustrate, Medicaid is an expensive program because it finances the high per-enrollee costs of care for many Americans with the most extensive needs for health care and long-term care services. For other populations, such as children and nondisabled adults, Medicaid provides coverage at a low per-enrollee cost relative to other payers.94 Growth in aggregate Medicaid spending over time is driven primarily by increasing enrollment in the program due to coverage expansions, demographic trends, and economic conditions. On a per-enrollee basis, however, Medicaid spending has been growing more slowly than private insurance premiums and national health spending per capita.95
Under the federal-state Medicaid partnership, the federal government matches state Medicaid spending. Thus, Medicaid is a source of both spending and revenue for states (Figure 7). Indeed, the program is the largest source of federal funds flowing to states. The federal match rate for state Medicaid spending associated with enrollees who are eligible under pre-ACA rules ranges from a floor of 50% to 74% in the poorest state, and the federal share of Medicaid spending overall is 57%.96 However, the federal government pays almost the full cost of the ACA Medicaid expansion to low-income nonelderly adults (100% through 2016 and phasing down to 90% thereafter). This and other enhanced matching rates for certain other populations under the ACA will increase the average federal share for Medicaid in the next 10 years to between 62% and 64%, depending on the year.97
Figure 7: Medicaid is both a spending item and a source of federal revenue in state budgets.
By federal law, the federal government also matches state spending for “DSH” payments, supplemental payments to hospitals known as disproportionate share hospitals because they serve large numbers of Medicaid and uninsured patients. Federal matching payments for DSH are capped and each state receives an allotment. Beyond minimum federal standards, states have considerable discretion to define hospitals that qualify for DSH payments and to allocate DSH dollars among them. For many safety-net hospitals, Medicaid DSH payments are a critical stream of operating revenues that help subsidize the substantial uncompensated care these institutions provide to uninsured and underinsured people. The ACA called for reduced federal DSH allotments beginning in 2014 corresponding with anticipated increases in coverage and reductions in uncompensated care costs under the new law, and the ACA also called for targeting of the reductions to better achieve the purposes of DSH payments. Due to concerns about potential funding issues for safety-net hospitals that have relied heavily on DSH funds, Congress has delayed implementation of the DSH cuts until FY 2018.
Access to federal Medicaid matching funds has helped to spur state expansions of health coverage for their uninsured residents. It has also provided support for state actions like raising provider payment rates and adding new benefits and helped states with higher Medicaid costs stemming from medical inflation. Federal matching funds have also enabled states to free up their own revenues by, for example, shifting mental health spending previously financed with state-only funds into Medicaid. In addition, because federal funding for Medicaid is available as needed, Medicaid can expand as a safety-net when economic downturns, epidemics, or disasters such as 9/11 or Hurricane Katrina create new needs for coverage. As responsive as this structure is, though, it does not accommodate heightened state fiscal pressures that occur when the local or national economy contracts, leading to increased Medicaid enrollment just when state revenues are declining. Struggling with recessionary budget pressures, states have frequently sought to constrain Medicaid spending by cutting benefits or provider payment rates. Many have made the case that the matching system needs an adjustment to deal with this countercyclical dynamic. Twice, in hard economic periods, Congress has raised the federal match rate to provide additional support to states.
Regardless of the prevailing budget environment, Medicaid spending and financing issues have always produced pressures and tension between the federal government and the states. Although state spending and cost-containment pressures are most acute during economic downturns, rising Medicaid spending is a standing issue for states because they pay a significant share of program costs and must balance their budgets every year. At times, states have sought to maximize federal Medicaid funds in ways not intended by Congress to artificially inflate the federal share of Medicaid spending, sometimes using legal financing mechanisms, including DSH payments, provider taxes as a source of state Medicaid funds, and intergovernmental transfers. Such state practices, which erode the integrity of the matching structure, have fueled concerns about open-ended federal matching funds and the impact on federal Medicaid spending, and led Congress to pass a series of laws clamping down on inappropriate state uses of federal funds.
More fundamental debate about the very structure of Medicaid financing has flared periodically, often within the larger frame of federal deficit reduction discussions. Some policy makers have proposed to convert Medicaid from an entitlement with guaranteed federal matching dollars to a block grant program with caps on federal funding and increased state flexibility to decide who and what to cover. Several analyses that have modeled the potential impact of these approaches indicate that they could shift substantial costs to states, beneficiaries, or providers, and/or lead to reductions in coverage or benefits, but the debate over federal versus state financing and how to contain costs for both the federal and state governments is ongoing.98,99
Report: Looking Forward
Over its 50-year history, the Medicaid program has evolved to fill extensive gaps in our health care system, demonstrating remarkable versatility and effectiveness. But its evolution, far from smooth, has been punctuated by controversy and debate regarding who and what Medicaid should cover, who should pay, how Medicaid services should be delivered, Medicaid’s size and impact on state and federal budgets, and even its basic structure. Federal-state tensions are part and parcel of the Medicaid partnership under which states have broad flexibility to design their programs subject to federal minimum requirements and the federal government guarantees matching funds for their Medicaid spending. This compact is at the heart of the Medicaid program’s adaptability to needs and preferences that vary from state to state, and it has catalyzed significant state coverage expansions and flourishing innovation in the design of Medicaid benefits, service delivery, and payment systems. At the same time, also because of this compact, low-income Americans’ access to coverage and care depends on the state they live in and millions remain uninsured, raising major concerns about equity and exposing important costs of federalism.
As this report illustrates, notwithstanding perennial debates about Medicaid’s role, the program has been the principal vehicle of both federal and state efforts to cover the uninsured, transforming gradually from its origins as a small health care safety-net limited to those receiving welfare, into a core provider of health coverage in the U.S. today. Because of Medicaid, low-income pregnant women have access to prenatal care and their babies get a healthy start. Low-income children get recommended immunizations and other preventive and primary care. New research shows that these early benefits also yield longer-run returns in the form of higher educational attainment, earnings, and tax revenues and lower use of other public assistance. Medicaid is also the main coverage program for a large share of Americans with disabilities, many of whom need long-term services and supports for which there is no adequate private insurance alternative. And without Medicaid, it is unclear what the fate of millions of seniors unable to afford Medicare premiums or the staggering costs of long-term care would be. Separate from these standing coverage roles, Medicaid also serves as an adaptable coverage safety net during recessionary periods and public health challenges like HIV/AIDS, mitigating their harmful human and economic consequences.
By covering many of the poorest and frailest people in our society and providing comprehensive benefits, Medicaid also buttresses the other key pillars of our health insurance system. It supports and fills in gaps in private insurance and provides billions of dollars of premium payments to private insurance companies with Medicaid managed care contracts. And it shores up the Medicare program by covering nursing home care and other long-term care for elderly low- and middle-income Americans. The program also provides significant financing for providers and the health care delivery system. In particular, Medicaid payments provide core support for safety-net hospitals and health centers, the nation’s children’s hospitals, and the mental health system, and Medicaid is the major source of revenue for nursing homes and providers of home and community-based services. Medicaid coverage and financing have also been the levers of far-reaching innovation in the delivery of both health and long-term care, as states have used their programmatic flexibility and purchasing power to pioneer new models of care and payment designed to improve quality and lower costs for populations whose complex and expensive needs are a major driver of health care spending in Medicaid and system-wide.
Finally, Medicaid has large impacts on state economies. Federal Medicaid matching payments represent a large infusion of federal revenues into states and over half of all Medicaid spending. A substantial body of studies shows that these Medicaid revenues can have a stimulative effect in states.100101102 Namely, as states spend on Medicaid and draw down federal matching funds, the spending filters through state economies, providing increased revenues to providers, including hospitals, private physicians, health plans, nursing homes, and vendors, and, in turn, generating increased employment and productivity both within and outside the health care sector, higher earnings and household spending, and additional state and local tax revenues. Nonetheless, the high cost of the Medicaid program is a lightning rod in the context of competing priorities and balanced-budget requirements at the state level, and in the context of deficit reduction debates and deeper ideological divides at the federal level.
In considering the future of the Medicaid program, five key issues that are likely to be formative and that could play out in different ways stand out. How the debates surrounding these issues are settled will have significant implications for the Medicaid program itself and also for its impact on low-income Americans and on our health care system.
Coverage
Inequities and gaps in Medicaid coverage due to state flexibility are woven into the fabric of the Medicaid program. However, Congress’ expansions of Medicaid over time to cover uninsured Americans nationally, beginning with children, reveal evolving views regarding the boundaries of acceptable variation in coverage under the program. The ACA represents the fullest expression of this evolution. While substantially preserving other domains of state flexibility in Medicaid, the law fundamentally recast Medicaid as a national program from a coverage standpoint both by establishing a uniform national eligibility floor for nonelderly Americans regardless of where they live and by providing for nearly full federal funding of the expansion. The June 2012 Supreme Court decision, which effectively permitted states to opt out of the Medicaid expansion, might be considered the latest manifestation of the federal-state push-and-pull that has always attended Medicaid. The ruling’s disproportionate impact on access to coverage for people of color and residents of the South vividly illustrates how state flexibility in Medicaid, which can be an instrument of innovation and progress, can also hold back efforts to eliminate health and social disparities.
At this writing, the ACA Medicaid expansion has been adopted by more than half the states and millions of low-income Americans have gained coverage as a result. However, the states that have so far not adopted the expansion have left almost 4 million poor uninsured parents and childless adults without access to affordable coverage. What these states ultimately decide about the Medicaid expansion will determine whether the ACA’s vision of Medicaid as the universal program for people with low income is fully realized or, instead, the very gaps in coverage targeted by the health reform law are allowed to persist. Between Summer 2013, just prior to the first ACA open enrollment period, and January 2015, there was a net increase in Medicaid and CHIP enrollment of nearly 11.2 million individuals.103 Numerous factors besides state Medicaid expansion decisions influence Medicaid enrollment growth, including demographics, economic conditions, and take-up rates. But it is notable that enrollment growth was over three times greater in states that implemented the Medicaid expansion than in states where the expansion was not in effect (26% vs. 8%).
Adequate Financing
States’ open-ended access to federal Medicaid matching dollars has undergirded the Medicaid program’s capacity to respond as needs change due to economic vicissitudes and demographic trends, as new technologies emerge and health care costs rise, and as states move in new policy directions. The matching arrangement also gives the federal government and states common stakes in the fiscal management of Medicaid and high program performance. Still, the lack of an automatic adjustment to deal with countercyclical pressures on states remains an important challenge in Medicaid. On two occasions, during the recessions in 2001 and the late 2000s, Congress temporarily increased the federal match rate to provide fiscal relief to the states. Building a permanent mechanism that responds to recessionary pressures into the funding formula to support states could strengthen the Medicaid program.
Proposals to convert Medicaid from an entitlement to states and individuals to a federal block grant program have emerged periodically over the last 20 years and continue to be part of ongoing discussions about financing Medicaid in the future. At the heart of this debate is controversy about the appropriate level of federal financial commitment to Medicaid and whether federal funding should be capped, and about how much discretion states should have over program design. Advocates of a Medicaid restructuring that would involve capped federal funds and reduced federal requirements on eligibility and benefits believe that this approach would help to control federal spending while giving states additional levers to manage within federal funding constraints. However, others raise concerns that limiting federal funding for states would constrain Medicaid’s ability to respond to changing needs and could lock in existing differentials among states. They also argue that, if federal support were diminished, states might scale back Medicaid eligibility, benefits, and provider payment rates, jeopardizing access to coverage and care.
As implementation of the ACA proceeds, continued analysis of the fiscal implications of states’ Medicaid expansion decisions will be important. In the coming years, substantial federal funds will flow into states that expand Medicaid, with relatively small state costs. Based on evidence from earlier studies, the new funds associated with the Medicaid expansion are anticipated to have a noticeable and sustained positive impact on state economic activity.104 The high federal match under the ACA increases the economic returns of Medicaid to state economies, and states that have not adopted the Medicaid expansion, in addition to leaving millions uninsured, are leaving billions of federal dollars on the table. There is also early evidence that state Medicaid expansion decisions have substantial impacts on providers, with a recent study showing that hospitals in Medicaid expansion states saw both greater increases in Medicaid patients and decreases in uninsured patients, and much larger reductions in charity care costs, compared to hospitals in non-expansion states.105
Flexibility
The ACA has triggered new debates about state flexibility, and the large infusion of additional federal financing for Medicaid coverage in the states that adopt the expansion arguably changes the conversation. Although most states that have expanded Medicaid have done so in accordance with the ACA, a small number have secured section 1115 demonstration waivers to implement the expansion in ways that the law does not permit, and more states are pursuing such waivers as a politically viable way to expand coverage and capture the available federal dollars.106 CMS has set some limits on how states can depart from the blueprint in the ACA and exceed normal flexibility, but the agency has so far permitted states to use Medicaid funds to purchase Marketplace plans for newly eligible adults (the so-called “private option”) and to impose Medicaid premiums, cut certain benefits, and charge higher cost-sharing. These approaches, which result in heavier out-of-pocket burdens for low-income beneficiaries, have implications for access to care. Evaluation will be important to guide sound future policy.
As the federal government and states both seek to expand coverage to uninsured adults, the balance that is negotiated between the flexibility requested by states and federal minimum standards will have important implications for how the program evolves in the coming years. While new federal funding for the Medicaid expansion gives the federal government strong leverage in this negotiation, states have key leverage, too. As the federal government assesses each state’s bid, it must weigh the terms of the proposal against the possibility of no Medicaid expansion at all in the state. If history is a guide, the precedents established through section 1115 waivers could set new standards for what defines adequate Medicaid coverage and reshape the program’s role for many beneficiaries in the future. Also, future Administrations could look differently on how to move Medicaid in new directions.
Long-Term Care
With no benefits for extended long-term care under the Medicare program and few affordable options in the private insurance market, Medicaid continues to be the main payer for institutional and community-based long-term services and supports. However, Medicaid provides assistance only for people who meet an income or disability test and have few assets, and individuals who obtain Medicaid assistance for nursing home care must contribute almost of all of their income toward the cost of their care. Although most middle-class Americans cannot afford the high costs of long-term care, under our current system, they cannot qualify for help from Medicaid until they are essentially impoverished, often as a result of spending all their savings to pay for their nursing home care. In addition, although millions of seniors and younger people with disabilities have gained access to home and community-based services because of Medicaid, hundreds of thousands of others who need these services remain on waiting lists due to state Medicaid budget constraints and enrollment caps.
The prohibitive cost of long-term care and strains on access to community-based services are increasingly salient national problems as the baby-boom generation ages into older adulthood. In the coming decades, with increased life expectancy and advances in technology and medical care, the demand for long-term services will burgeon and coverage and financing needs will grow. In the absence of broader systemic change, increased investment in Medicaid would be the best way to meet current long-term care needs and to prepare for future demand. However, establishing alternative sources of assistance and financing for those who need long-term services would help to strengthen Medicaid by reducing pressure on the program and enabling Medicaid resources to be targeted to those most in need.
Innovation
Medicaid coverage and financing have been the levers of ongoing Medicaid innovation in the delivery of care. On the health care front, Medicaid programs were early adopters of primary care medical homes, now widely seen as the cornerstone of person-centered and coordinated care. Adoption of risk-based managed care in Medicaid has served as a strategy for providing access to care for children and parents, but the impact of initiatives to expand managed care to higher-need populations and to contract with managed care plans for long-term services and supports remains to be seen. Many states are pioneering new models of more highly integrated care, especially for beneficiaries with complex needs, including those with long-term care needs and dual eligible enrollees. Such delivery system reform efforts are also leading to new provider collaborations and team approaches to coordinating care. Increasing federal and state use of quality metrics in Medicaid and performance-linked payment approaches in many states show rising federal and state expectations for accountable care.
Medicaid’s impact on the long-term care delivery system has been transformative. While remaining the anchor of coverage and financing for institutional care, the Medicaid program is also responsible for vastly expanding access to home and community-based services and supports over the last two decades, and states continue to shift more long-term care spending to community settings. As a result of the incremental expansion of home and community-based services over time, states now operate around 300 separate section 1915(c) waivers, generating considerable complexity.107 Finding a mechanism to streamline the provision of these services could produce a more rational and navigable delivery system for beneficiaries and ease administrative burdens on states.
Although there is more rebalancing work to be done, especially for elderly individuals, who may have less support in the community, Medicaid benefits and financing for home and community-based services have radically reshaped the long-term care environment, enabling children with disabilities to remain at home and go to school and working-age adults to live independently in the community. By providing community-based alternatives to institutional care, Medicaid has also enabled many older Americans to age in place and set a course to address the impending long-term needs of the baby-boomers, although financing remains a pressing challenge. The profound human and social benefits and economic potential that flow from this reorganization of long-term care are fundamentally gains from the Medicaid program.
Conclusion
It is unlikely that the authors of the original Medicaid law ever imagined that the Medicaid program would come to occupy the integral place in our health care system that it does today. They could not have predicted that federal and state policymakers would look to the program again and again to cover the growing number of uninsured and underinsured Americans, or that it would become the nation’s de facto long-term care program for people with disabilities and senior citizens, or that it would be a major source of health care financing and innovation. Medicaid’s evolution has involved significant challenges stemming from many causes – its roots in welfare; its federal-state structure; spending pressures generated by economic recessions, legislated expansions, and health care cost inflation; and deep-running ideological conflicts. But by virtue of its federal-state design and its financing structure, Medicaid has been able to respond to diverse and changing societal needs over the course of 50 years. In its expansion to fill widening gaps in health coverage, its positive impact on access to care and community integration, and its role in improving care for people with complex needs, Medicaid is largely a story of adaptability and resiliency. While uncertainties are inevitable given ongoing Medicaid policy debates, demographic pressures, and factors in the health care system overall, Medicaid’s service and record as our nation’s health care safety net bode well for future generations of Americans as the Medicaid program begins its next 50 years.
Understanding Participation Rates in Medicaid: Implications for the Affordable Care Act. Assistant Secretary for Planning and Evaluation (ASPE), U.S. Department of Health and Human Services, 2012. Available at: http://aspe.hhs.gov/health/reports/2012/medicaidtakeup/ib.shtml. ↩︎
Selden T and Hudson J. 2006. “Access to Care and Utilization among Children: Estimating the Effects of Public and Private Coverage.” Medical Care 44(5): I19-I26. Available at: http://www.ncbi.nlm.nih.gov/pubmed/16625060. ↩︎
Kenney G and Coyer C. 2012. National Findings on Access to Health Care and Service Use for Children Enrolled in Medicaid or CHIP. (MACPAC Contractor Report No. 1) Available at: http://www.urban.org/publications/1001629.html. ↩︎
Griffin S et al. 2014. “Use of Dental Care and Effective Preventive Services in Preventing Tooth Decay Among U.S. Children and Adolescents — Medical Expenditure Panel Survey, United States, 2003–2009 and National Health and Nutrition Examination Survey, United States, 2005–2010.” Centers for Disease Control and Prevention. Morbidity and Mortality Weekly (MMWR) 63(02): 54-60. Available at: http://www.cdc.gov/mmwr/preview/mmwrhtml/su6302a9.htm. ↩︎
Bisgaier J and Rhodes K. 2011. “Auditing Access to Specialty Care for Children with Public Insurance.” The New England Journal of Medicine 364(24): 2324-2333. Available at: http://www.nejm.org/doi/full/10.1056/NEJMsa1013285. ↩︎
The Healthy Families Program Health Status Assessment (PedsQLTM) Final Report. California Managed Risk Medical Insurance Board, 2004. Available at: http://www.mrmib.ca.gov/mrmib/HFP/PedsQL3.pdf. ↩︎
Cohodes S, Grossman D, Kleiner S, and Lovenheim M. 2014. The Effect of Child Health Insurance Access on Schooling: Evidence from Public Insurance Expansions. National Bureau of Economic Research. Available at: http://www.nber.org/papers/w20178. ↩︎
Salganicoff A, Ranji U, and Sobel L. “Medicaid at 50: Marking a Milestone for Women’s Health.” Women’s Health Issues, May/June 2015. ↩︎
Finkelstein A et al. 2011. The Oregon Health Insurance Experiment: Evidence from the First Year. National Bureau of Economic Research Working Paper No. 17190. Available at: http://www.nber.org/papers/w17190.pdf. ↩︎
Baicker K et al. 2013. “The Oregon Experiment — Effects of Medicaid on Clinical Outcomes.” The New England Journal of Medicine 368(18): 1713-1722. Available at: http://www.nejm.org/doi/full/10.1056/NEJMsa1212321. ↩︎
Muennig P, Quan R, Chiuzan C, and Glied S. 2015. “Considering whether medicaid is worth the cost: revisiting the Oregon health study.” Am J Public Health 105(5): 866-871. Available at: http://www.ncbi.nlm.nih.gov/pubmed/25790389. ↩︎
Cunningham P. 2005. “The Effects of Medicaid Reimbursement on the Access to Care of Medicaid Enrollees: A Community Perspective.” Medical Care Research and Review 62(6): 676-696. Available at: http://mcr.sagepub.com/content/62/6/676.abstract. ↩︎
Bishop T, Press M, Keyhani S, and Pincus H. 2014. “Acceptance of Insurance by Psychiatrists and the Implications for Access to Mental Health Care.” JAMA Psychiatry 71(2): 176-181. Available at: http://archpsyc.jamanetwork.com/article.aspx?articleid=1785174. ↩︎
Musumeci M. 2011. “Modernizing Medicaid Eligibility Criteria for Children with Significant Disabilities: Moving from a Disabling to an Enabling Paradigm.” American Journal of Law & Medicine 37(1): 81-127. Available at: http://www.ncbi.nlm.nih.gov/pubmed/21614996. ↩︎
Balanced Budget Act of 1997, P.L. 105-33, Title IV, §4733. ↩︎
Ticket to Work and Work Incentives Improvement Act of 1999, P.L. 106-170. ↩︎
Sommers A. 2006. “Access to Health Insurance, Barriers to Care, and Service Use among Adults with Disabilities.” Inquiry 43(4): 393-405. Available at: http://inq.sagepub.com/content/43/4/393.full.pdf. ↩︎
McDoom M, Koppelman E, and Drainoni M. 2014. “Barriers to Accessible Health Care for Medicaid Eligible People With Disabilities A Comparative Analysis.” Journal of Disability Policy Studies 25(3):154-163. Available at: http://dps.sagepub.com/content/25/3/154.abstract. ↩︎
Lewis V et al. 2014. “Innovation in the Safety Net: Integrating Community Health Centers through Accountable Care.” J Gen Intern Med 29(11): 1484-1490. Available at: http://www.ncbi.nlm.nih.gov/pubmed/25008217. ↩︎
Caswell K and Long S. 2015. “The Expanding Role of Managed Care in the Medicaid Program: Implications for Health Care Access, Use, and Expenditures for Nonelderly Adults.” Inquiry 52; 1-17. Available at: http://inq.sagepub.com/content/52/0046958015575524.full.pdf+html. ↩︎
Access to Care: Provider Availability in Medicaid Managed Care. Office of Inspector General, U.S. Department of Health and Human Services, 2014. Available at: http://oig.hhs.gov/oei/reports/oei-02-13-00670.pdf. ↩︎
State Standards for Access to Care in Medicaid Managed Care. Office of Inspector General, U.S. Department of Health and Human Services, 2014. Available at: http://oig.hhs.gov/oei/reports/oei-02-11-00320.pdf. ↩︎
Medicaid Program Integrity: Increased Oversight Needed to Ensure Integrity of Growing Managed Care Expenditures. U.S. Government Accountability Office (GAO), 2014. Available at: http://gao.gov/assets/670/663306.pdf. ↩︎
Medicaid Managed Care: CMS’s Oversight of States’ Rate Setting Needs Improvement. U.S. Government Accountability Office (GAO), 2010. Available at: http://www.gao.gov/new.items/d10810.pdf. ↩︎
In his latest column for The Wall Street Journal’s Think Tank, Drew Altman finds the public’s health-care priorities have more to do with drug costs and other real-world issues people deal with using the health-care system than the ongoing partisan wrangling over the Affordable Care Act.
All previous columns by Drew Altman are available online.
Expanded health insurance coverage through the Affordable Care Act (ACA) is having a major impact on many of the nation’s hospitals through increases in the demand for care, increased patient revenues, and lower uncompensated care costs for the uninsured. In anticipation of higher revenues from patient care, the ACA calls for reductions in Medicaid Disproportionate Share Hospital (DSH) payments that support hospitals that serve a large number of Medicaid and uninsured patients to help cover the costs of uncompensated care. DSH cuts were scheduled to begin in 2014 but were delayed to FY2018. While many people are focusing on how these changes affect public hospitals and large urban safety net systems, many not-for-profit hospitals that have a strong tradition and mission of caring for underserved populations also may be affected. The size of the impact on specific hospitals will depend, among other factors, on whether hospitals are located in states that expanded Medicaid coverage through the ACA.
This report examines the early experiences with the ACA by Ascension Health, the delivery subsidiary of the nation’s largest not-for-profit health system, Ascension, which includes 131 acute-care hospitals and more than 30 senior care facilities in 23 states and the District of Columbia. Ascension is a Catholic healthcare system with service to the poor as an explicit part of their mission, providing almost $1.8 billion in care to persons living in poverty and other community benefit programs that include $600 million in direct charity care assistance to poor and uninsured patients in their 2014 fiscal year. The analysis examines changes in discharge volumes, hospital finances, and other outcomes between the last three quarters of 2013 – just before implementation of the ACA coverage expansions – and the first three quarters of 2014 (through September 30, 2014). In addition, the analysis compares changes among hospitals in states that expanded Medicaid with hospitals in states that did not expand Medicaid. Key findings include:
Compared to hospitals in states that did not expand Medicaid, Ascension Health hospitals in states that expanded Medicaid experienced larger increases in Medicaid discharge volumes and decreases in uninsured/self-pay volume from 2013 to 2014 (see Figure ES-1). Specifically, hospitals in Medicaid expansion states saw a 7.4 percent increase in Medicaid discharge volumes from 2013 to 2014 (compared to 1.4 percent for hospitals in non-expansion states) and a 32.3 percent decrease in uninsured/self-pay discharge volumes (compared to a 4.4 percent decrease in non-expansion states). Correspondingly, Ascension hospitals in expansion states saw an increase in the share of total discharges billed to Medicaid and a decrease in the share of discharges that were uninsured/self-pay.
Looking at total revenue, Ascension hospitals in expansion states saw an increase (8.2 percent) in Medicaid revenue from 2013 to 2014 and a 63.2 percent decrease in revenue from self-pay (Figure ES-1). Hospitals in non-expansion states actually saw a 9.4 percent decline in Medicaid revenue over the same period and a slight increase (2.6 percent) in revenue from self-pay. Growth in Medicaid revenue from outpatient care outpaced increases in inpatient revenue in expansion states, suggesting that these hospitals experienced greater increases in demand for outpatient care from new Medicaid patients compared to inpatient care.
Figure ES-1: Change in Ascension Health Hospital Discharges and Revenue by Payer, 2013-2014
Despite somewhat smaller increases in patient revenue, hospitals in expansion states had larger relative increases in operating margins from 2013 to 2014 compared to hospitals in non-expansion states. Operating margins among hospitals in Medicaid expansion states increased from 2.1 percent in 2013 to 3.4 percent in 2014. Operating margins also increased among hospitals in non-expansion states, but the relative increase was smaller compared to hospitals in expansion states. The increase in operating margins in expansion states was due largely to almost zero growth in the costs of providing health care.
Looking at particular cost items, charity care costs decreased 40.1 percent among hospitals in Medicaid expansion states compared to 6.2 percent in non-expansion states. However, another component of cost of care to the poor, Medicaid shortfalls – the difference between what Medicaid pays and the costs of treating Medicaid patients – increased 31.9 percent between 2013 and 2014. Shortfalls increased for hospitals in expansion states but were more than offset by increases in Medicaid revenue. Shortfalls increased more among hospitals in non-expansion states than expansion states and were not offset by increases in Medicaid revenue, possibly due to state cuts in provider reimbursement. Combining the decrease in charity care costs with the increase in Medicaid shortfalls, the net cost of caring for low income patients decreased among hospitals in expansion states, while these costs increased among hospitals in non-expansion states.
Overall, hospitals in Medicaid expansion states saw increased Medicaid discharges, increased Medicaid revenue, and decreased cost of care for the poor, while hospitals in non-expansion states saw a very small increase in Medicaid discharges, a decline in Medicaid revenue, and growth in cost of care to the poor.
Issue Brief
INTRODUCTION
The expansions in Medicaid and private health insurance through the Affordable Care Act (ACA) will likely have a substantial impact on the nation’s hospitals. Increases in the number of people with health insurance coverage are expected to increase the demand for care at hospitals as well as patient revenue from insured patients and reduce the amount of uncompensated care that hospitals provide.1 Based on this assumption, the ACA will reduce Medicaid Disproportionate Share Hospital (DSH) payments to hospitals that serve a large number of Medicaid and uninsured patients to help cover the costs of uncompensated care. These reductions will amount to $43 billion between 2018 and 2025.2
While many are focusing on the effect of these changes on public hospitals and other large urban safety net systems, many private, not-for-profit hospitals that have a strong tradition and mission of caring for underserved populations also will likely be affected. Many of these hospitals are eligible to receive Medicaid DSH payments, provide substantial amounts of uncompensated care, and serve as a major safety net provider in their community.
The impact on specific hospitals will depend on many factors, but a crucial factor will be whether or not the hospital is located in a state that expanded Medicaid eligibility to adults with family incomes at 138% of poverty or less. As of April 2015, 21 states had chosen not to expand Medicaid through the ACA; although residents of these states with incomes between 100-400% of poverty can still purchase subsidized coverage through the health insurance marketplaces, many poor adults in non-expansion states will fall into a “coverage gap” and not have access to ACA coverage. Early research shows that the number of uninsured decreased by 36 percent in states that expanded Medicaid, compared to 24 percent in states that did not expand Medicaid.3
The objective of this report is to examine experiences with the Affordable Care Act through September 2014 among acute-care hospitals in Ascension Health, the nation’s largest not-for-profit hospital system with 131 hospitals and more than 30 senior care facilities in 23 states and the District of Columbia. Ascension Health is a Catholic healthcare system with service to the poor as an explicit part of their mission statement.4 In previous years, the system has undertaken a number of initiatives to improve access to care for uninsured persons in communities where they are located.5
Ascension Health Hospitals and Health Reform
Ascension Health acute care hospitals are located in 16 states and the District of Columbia. These include 7 states and D.C. that expanded Medicaid (Arizona, Connecticut, Illinois, Maryland, Michigan, New York, and Washington), and 9 states that did not expand Medicaid (Alabama, Florida, Idaho, Indiana, Kansas, Oklahoma, Tennessee, Texas, and Wisconsin) (see Figure 1). Indiana received approval to implement the Medicaid expansion through a waiver with coverage beginning in February 2015, so for purposes of this analysis and the dates under review, Indiana is considered a non-expansion state. Most hospitals are located in large urban areas (e.g. Washington, DC, Detroit, MI, Milwaukee WI, Jacksonville, FL, Chicago, IL, Indianapolis, IN, Nashville, TN), although some hospitals are located in small communities and rural areas (e.g. Pasco, WA, Lewiston, ID, Tawas City, MI). Overall, the system includes 131 hospitals, has almost 22,000 beds, had total operating revenue in 2014 of $20 billion, and paid $1.8 billion in community benefit, a third of which was charity care for uninsured and underinsured patients.6
Figure 1: Location of Ascension Acute Care Hospitals, by State Medicaid Expansion Status
Out of almost 600,000 inpatient discharges that occurred during the first nine months of 2014, almost two-thirds (64 percent) occurred in states that did not expand Medicaid, while one-third occurred in states that expanded Medicaid (see Supplementary Table 1). Among the states that did not expand Medicaid, discharges were fairly evenly distributed, with the highest numbers in Texas (16.9 percent of discharges), Indiana (15.8 percent), Florida (14.4 percent), and Wisconsin (13.1 percent). Among hospitals in states that expanded Medicaid, more than half (52.4 percent) occurred in the state of Michigan, which includes a number of large systems that are part of Ascension Health (St. John Providence Health System, Genesys Health System, St. Mary’s & St. Joseph Health System, and Borgess Health). Fourteen percent of discharges occurred among hospitals in Illinois (Alexian Brothers Health System), while 10.2 percent were in Arizona (Carondelet Health Network).
In general, Medicaid expansion states with Ascension hospitals had lower uninsured rates prior to ACA implementation compared to non-expansion states, due in part to relatively higher Medicaid eligibility levels in states such as Arizona, Connecticut, DC, and New York (see Supplementary Table 2). More substantial expansions – especially for childless adults – occurred in Michigan, Illinois, Maryland, and Washington states. Michigan’s Medicaid expansion was not implemented until April 1, 2014. Childless adults are not eligible for Medicaid in all of the non-expansion states except Wisconsin. For parents of dependent children, current income eligibility in non-expansion states range from 16 and 19 percent of the federal poverty level in Alabama and Texas, respectively, to 100 and 110 percent of poverty in Wisconsin and Tennessee.
OVERVIEW OF ANALYTIC APPROACH
Data on inpatient discharges and hospital finances (including charity care expenses, patient revenue and costs) for the last three quarters of 2013 (April through December) and the first three quarters of 2014 (January through September) was compiled by state and provided to the authors by Ascension Health. While not representative of all not-for-profit hospitals, the advantage of focusing on a single hospital system is that potential biases due to differences in accounting and reporting practices between hospitals in different states, as well as differences in policies regarding provision of care to low income and uninsured patients, are minimized. However, state variation in Medicaid policy or other factors may still affect results.
The analysis compares Ascension Health hospitals in Medicaid expansion states with those in non-expansion states on changes in hospital inpatient volume, payer mix of patients, uncompensated care, revenues and costs, and operating margins. To understand changes since the implementation of most of the ACA coverage expansions on January 1, 2014, the analysis examines changes between the last three quarters of 2013 and the first three quarters of 2014. Hospitals in Arizona that are part of the Ascension system are excluded from the estimates due to incomplete data on hospital finances. Arizona hospitals accounted for 3 percent of all patient revenue system-wide in 2014 and about 8 percent among hospitals in Medicaid expansion states.
Since open enrollment in the health insurance marketplaces was not completely closed until the end of April, 2014, it is possible that changes in utilization due to the coverage expansion accelerated over the course of 2014. Therefore, sensitivity analysis also examined changes in utilization between the first and third quarters of 2014.
FINDINGS
Inpatient Discharge Volume and Distribution
There were a total of 564,193 inpatient discharges in Ascension Health hospitals during the first three quarters of 2014 (excluding hospitals in Arizona), representing a slight decrease (-2.4 percent) from the last three quarters of 2013 (Table 1). However, trends in discharge volumes varied substantially by payer and whether the hospital was in a Medicaid expansion state (Figure 2). Medicaid discharges increased 7.4% among hospitals in expansion states during the first three quarters of 2014 but increased only 1.4 percent among hospitals in non-expansion states (Figure 2). Uninsured and self-pay discharges decreased 32.3 percent in expansion states but only 4.4 percent in non-expansion states. Medicare discharges decreased slightly across all states, as did discharges from commercial insurance (although somewhat less so in non-expansion states).
Figure 2: Percent Change in Ascension Health Hospital Discharge Volume by Payer, 2013-2014
Changes in discharge volumes for Medicaid and uninsured patients accelerated throughout the first three quarters of 2014, likely reflecting changes as the ACA was implemented throughout the year. However, virtually all of the increase in Medicaid volume in expansion states between the first and third quarters of 2014 was driven by hospitals in Michigan. This likely reflects the April 1 implementation of Medicaid expansion in Michigan instead of January 1 for the other states, and the fact that the increase in adult eligibility levels for Medicaid in Michigan was substantial.
The changes in discharges by payer led to changes in payer mix for hospital discharges in expansion states. Among hospitals in expansion states, the share of inpatient discharges that were uninsured/self-pay declined from 4.0 percent in the third quarter of 2013 to 2.1 percent during a similar period in 2014 (Table 2 and Figure 3). Almost all of this decrease is attributed to increases in Medicaid discharges, which increased from 17.4 percent of all discharges to 21.2 percent of discharges. The share of Medicare discharges decreased slightly during this period (from 48.3 percent to 46.7 percent), while the share of discharges from commercial insurance was virtually unchanged (about 27 percent).
The share of total discharges by uninsured/self-pay patients is higher in non-expansion states, which likely reflects the generally higher uninsured rates in states like Texas, Florida, Alabama, and Tennessee prior to the ACA. Nevertheless, the share of discharges by uninsured/self-pay patients decreased somewhat in those states, from 7.2 percent during the third quarter of 2013 to 6.0 percent during the third quarter of 2014, due largely to an increase in the share of discharges from commercial patients (from 27.4 percent to 28.8 percent). There was less than a one percentage point change in the share of Medicaid and Medicare discharges at hospitals in non-expansion states.
Figure 3: Distribution of Ascension Health Hospital Discharge Volume by Payer, 2013 versus 2014
Financial Outcomes
Patient revenue, expenses, operating margins
Total patient revenue (from inpatient and outpatient sources) increased 2.0 percent system-wide (excluding Arizona), from about $13.3 billion during the last three quarters of 2013 to $13.5 billion during the first three quarters of 2014 (Table 3 and Figure 4). Ascension Health hospitals in expansion states experienced somewhat slower growth in revenues (1.3 percent) compared to hospitals in non-expansion states (2.3 percent).
Figure 4: Percent Change in Ascension Health Patient Revenue by Payer, 2013-2014
Increases in Medicaid and Medicare patient revenue accounted for much of the increase in patient revenue for hospitals in expansion states. Medicaid revenue increased by $46 million, (or 8.2 percent). There were also increases in patient revenue for Medicare. Revenue from self-pay patients declined 63.2 percent among hospitals in expansion states, consistent with the decrease in discharge volumes from self-pay patients.
Increases in revenue from commercial insurance accounted for much of the increase in patient revenue among hospitals in non-expansion states (an increase of $105 million, or 3.5 percent). There were also increases in revenue from Medicare and self-pay patients, while patient revenue from Medicaid declined.
Corresponding to these changes in patient revenue by payer, hospitals in expansion states had a decrease in the share of their total revenue from self-pay and a slight increase in the share from Medicaid (Table 4 and Figure 5). For hospitals in non-expansion states, there was no change in the share of revenue from self-pay.
Changes in total revenue include both changes in payer mix for inpatient discharges, as described above, and changes in payer mix for other service lines and changes in patterns of care. Inpatient and outpatient service lines had different rates of increases in revenue by payer. In Medicaid expansion states, Medicaid outpatient revenue increased 13.0 percent between the last three quarters of 2013 and first three quarters of 2014, while Medicaid inpatient revenue increased by 4.9 percent (data not shown). As a result, the share of total Medicaid revenue received from outpatient versus inpatient care increased from 40.6 percent to 42.4 percent among Ascension Health hospitals in Medicaid expansion states. There was a decline in both inpatient and outpatient self-pay revenue.
Figure 5: Distribution of Ascension Health Hospital Revenue by Payer, 2013 versus 2014
In hospitals in non-expansion states, Medicaid inpatient revenue also dropped, and Medicaid outpatient revenue increased at a much lower rate (2.9 percent) compared to hospitals in expansion states. Outpatient revenue as a share of total Medicaid revenue increased from 38.7 percent during the last three quarters of 2013 to 44.0 percent during the first three quarters of 2014, perhaps indicating that the shift from inpatient to outpatient care is part of a broader trend rather than related to the ACA coverage expansions.
There was no change in the cost of providing health services among hospitals in expansion states, while costs increased 1.3 percent among hospitals in non-expansion states. As a result, operating margins for hospitals in expansion states increased from 2.1 percent during the last three quarters of 2013 to 3.4 percent during the first three quarters of 2014, a 62 percent increase (Figure 6). Operating margins were considerably higher among hospitals in non-expansion states prior to the coverage expansions (5.0 percent) and they increased somewhat more modestly after the expansions, from 5.0 percent to 6.2 percent.
Figure 6: Ascension Health Hospital Operating Margins, 2013 versus 2014
Other Financial Outcomes
Ascension hospitals have financial assistance programs for uninsured patients who have no access to public or private health insurance coverage. Uninsured patients with family incomes less than or equal to 200% of the federal poverty level are eligible for 100% charity care write-off of the charges, while uninsured patients between 200% and 300% of poverty are eligible for discounts based on a sliding scale. Uninsured people with family incomes greater than 300% are eligible for discounted charges based on their assessed ability to pay.
During the first three quarters of 2014, charity care costs for Ascension Health hospitals amounted to $395 million, a $58 million decrease (12.8 percent) from the last three quarters of 2013 (Table 5). Consistent with the decrease in uninsured/self-pay discharges, hospitals in Medicaid expansion states saw a decrease of almost 40 percent in charity care costs (down $35 million, from $85 million to $50 million). Hospitals in non-expansion states saw a smaller decrease in charity care costs during this period (6.2 percent), down $23 million from $368 million in the last three quarters of 2013 to $345 million during the first three quarters of 2014.
Another cost of caring for the poor is the difference between what Medicaid pays and the cost of care for Medicaid patients. System-wide, this differential increased by $122 million between 2013 and 2014, although the differential between costs and payments increased to a greater extent among hospitals in non-expansion states ($99 million, or a 35.5. percent increase) compared to expansion states ($23 million, or a 21.7 percent increase).
Combining the decrease in charity care costs with the increase in Medicaid shortfalls indicates the net change in the cost to hospitals of caring for low income patients. For hospitals in Medicaid expansion states, the decrease in charity care costs ($35 million) was greater than the increase in Medicaid shortfalls ($23 million), indicating a net decrease in costs of care to the poor. For hospitals in non-expansion states, the amount of the increase in Medicaid shortfalls ($99 million) exceeded the decrease in charity care ($23 million) by a considerable amount, resulting in a large increase in the cost of care to low income patients.
DISCUSSION
Consistent with expectations, Ascension Health hospitals in states that expanded Medicaid experienced greater increases in Medicaid inpatient discharge volumes and Medicaid total patient revenue, as well as greater decreases in uninsured volumes and charity care costs compared to hospitals in states that did not expand Medicaid. Hospitals in expansion states also experienced a greater improvement in overall financial performance (operating margins) between the last three quarters of 2013 and the first three quarters of 2014 relative to the financial performance of hospitals in non-expansion states, although this reflects almost no increases in the costs of providing services among hospitals in expansion states rather than greater increases in revenue. Still, these hospitals saw a shift in both discharges and revenue from self-pay/uninsured to Medicaid and, as a result, a decrease in their cost of care for the poor.
Ascension Health hospitals in states that did not expand Medicaid also experienced decreases in uninsured volumes and charity care costs, although these changes were not as large as those experienced by hospitals in states that expanded Medicaid. These hospitals also had an increase in revenue from commercial as well as Medicare patients that offset a decrease in revenue from Medicaid, and as a result hospitals in non-expansion states experienced overall increases in patient revenue that were somewhat larger than hospitals in expansion states.
Looking ahead, potential areas of concern for hospitals are Medicaid payment rates and Medicaid DSH cuts. Examination of other outcomes shows that there are potential areas of concern for hospitals under the ACA. One is the increase in costs due to Medicaid payments falling below costs (the so-called “shortfall”). For hospitals in Medicaid expansion states, this increase was mostly due to increased utilization from Medicaid beneficiaries, many of whom were likely newly insured through the Medicaid expansions. However, these hospitals also benefitted from increased patient revenue from Medicaid, which offset the shortfall, as well as reduced charity care costs, which led to an overall decrease in the cost of care to the poor.
Medicaid shortfalls increased for different reasons among hospitals in non-expansion states, which experienced a much smaller increase in utilization from Medicaid beneficiaries and a decrease in patient revenue from Medicaid. It is unclear what explains the increase in Medicaid shortfalls among these hospitals, but it is possible that they were affected by provider rate cuts or freezes for Medicaid inpatient and outpatient services paid by states. For example, most of the states with Ascension Health hospitals implemented rate cuts or freezes for inpatient care for FY2014 (which started in October, 2013).7 This may have had a greater effect on hospitals in non-expansion states, where average Medicaid revenue per inpatient day decreased from $1,297 in 2013 to $1,045 in 2014 (findings not shown). Medicaid inpatient revenue per inpatient day was unchanged for hospitals in expansion states.
Also, since charity care costs did not decrease as much among hospitals in non-expansion states as they did among hospitals in expansion states, the increase in Medicaid shortfalls among hospitals in non-expansion states resulted in a net increase in the costs of caring for low income patients, while hospitals in expansion states experienced a net decrease in these costs. Hospitals in non-expansion states were able to overcome these higher costs by increasing revenue from other patients, especially commercially insured and Medicare patients.
Hospitals are also concerned about pending reductions in Medicaid DSH payments. The logic of the Medicaid DSH payment reductions is that the decrease in hospitals’ charity care costs for the uninsured and increase in direct reimbursement for patient services will offset the loss of Medicaid DSH subsidies, which are also currently used in part to cover lower Medicaid reimbursement rates. Although the analysis did not examine the potential impact of the loss of Medicaid DSH subsidies on Ascension Health hospitals, and overall patient revenues increased despite the shortfall, these results exemplify the potential areas of concern that Ascension Health and other hospitals face through the loss of such subsidies as well as cuts in direct reimbursement for patient services from state Medicaid programs. When Massachusetts reduced the state’s hospital uncompensated care pool in order to fund the coverage expansions in the 2006 Massachusetts Health Reform, some hospitals were negatively impacted because the loss of subsidies for care for the uninsured was larger than the reduction in uncompensated care they provided.8 Financially weak hospitals are at even greater risk of being unable to absorb the Medicaid DSH reductions.9
Numerous factors influence changes in revenues and the financial performance of hospitals and health systems. While state Medicaid expansion decisions and corresponding changes in revenue mix by volume play a role, other factors such as changes in patient care patterns, changes in acuity of patients seeking inpatient care, the local health care and economic environment, state and local policies, and the extent of competition with other hospitals can affect hospitals’ financial performance. While it is beyond the scope of this analysis to examine all of these factors, analysis of financial information from Ascension hospitals in expansion and non-expansion states points to several forces driving overall financial performance. For example, changes to Medicaid payment rates, particularly in non-expansion states, may have contributed to hospitals in these states seeing drops in Medicaid revenue and rising Medicaid shortfalls.
Ascension Health hospitals are somewhat under-represented in states with Medicaid expansions, although the experiences with health reform of other not-for-profit systems in Medicaid expansion states appear to be similar. For example, Dignity Health — the nation’s fifth largest nonprofit health system and located primarily in California, Nevada, and Arizona (all Medicaid expansion states) — observed a 50 percent decrease in uncompensated care and an 11.5 percent increase in patient revenue between the third quarters of 2013 and 2014, which they attributed to shifts from self-pay and uninsured patients to insured patients.10 Providence Health System based in Seattle Washington – the 10th largest nonprofit system with most hospitals based in Washington, California, and Oregon (but also some in Alaska and Montana) – saw self-pay volumes decrease by 44 percent and Medicaid revenues increase 25 percent through September, 2014 compared to 2013.11 Unity-Point Health, the 13th largest nonprofit system and based in Iowa, observed a 33 percent increase in patient revenue from Medicaid between the first quarters of 2013 and 2014, a 25 percent increase in patient revenue from commercial insurance, and a 27 percent decrease in charity care.12
Nevertheless, it is important to note that the results of this analysis are not necessarily representative of all hospitals in the U.S. Analyses of the full impact of the ACA on hospitals won’t be possible until nationally representative data for 2014 and later years become available from sources such as the American Hospital Association, the Health Care Cost and Utilization Project, and Medicare Hospital Cost Reports. Until then, information on individual hospitals and hospital systems will be the best available evidence of the impact of the ACA on hospitals. As this analysis shows, overall, Ascension hospitals in Medicaid expansion states saw increased Medicaid discharges, increased Medicaid revenue, and decreased cost of care for the poor, while hospitals in non-expansion states saw a very small increase in Medicaid discharges, a decline in Medicaid revenue, and growth in cost of care to the poor. These data suggest that Medicaid expansion can offset the cost of care to the poor and serve as a growing source of revenue as hospitals face cuts in payment and DSH funds.
This Kaiser Commission on Medicaid and the Uninsured brief was prepared by Peter Cunningham, Professor, Department of Healthcare Policy and Research, Virginia Commonwealth University School of Medicine, and Rachel Garfield and Robin Rudowitz from the Kaiser Family Foundation. The authors thank Rhonda Anderson, Senior Vice President and Chief Financial Officer; Joseph Lubiewski, Manager, Financial Planning; Brian J. Wuelling, Senior Financial Planning Analyst; and Mary Ella Payne, Senior Vice President for Policy and System Legislative Leadership, Ascension Health, for their assistance in this project. Ali Bonakdar of the Department of Health Care Policy and Research, VCU School of Medicine assisted with the data analysis.
Appendix
Table 1: Change in Ascension Health Inpatient Discharge Volume, by Payer, 2013-2014
Q2-4,2013
Q1-3,2014
Δ,2013-2014
% Δ,2013-2014
Total discharges for Ascension system
Total
578,029
564,193
-13,836
-2.4
Medicaid
88,524
91,775
3,251
3.7
Medicare
269,982
262,839
-7.143
-2.6
Commercial
158,965
156,964
-2,001
-1.3
Uninsured/self-pay
33,383
29,798
-3,585
-10.7
Expansion States Discharges
Total
195,869
189,462
-6,407
-3.3
Medicaid
33,611
36,112
2,501
7.4
Medicare
95,409
91,770
-3,639
-3.8
Commercial
53,205
51,372
-1,833
-3.4
Uninsured
7,597
5,144
-2,453
-32.3
Non-Expansion States Discharges
Total
382,160
374,731
-7,429
-1.9
Medicaid
54,913
55,663
750
1.4
Medicare
174,573
171,069
-3,504
-2.0
Commercial
105,760
105,592
-168
-0.2
Uninsured
25,786
24,654
-1,132
-4.4
Note: Expansion states include CT, DC, IL, MD, MI, NY, WA.Hospitals in Arizona were excluded from the estimates for expansion states due to incomplete revenue data.Non-expansion states include AL, FL, ID, IN, KS, OK, TN, TX, WI.Source: Ascension Health
Table 2: Distribution of Ascension Health Inpatient Discharges, by Payer, 2013-2014
2013
2014
QuarterendingJune 30
QuarterendingSept. 30
QuarterendingDec. 31
QuarterendingMarch 31
QuarterendingJune 30
QuarterendingSept. 30
Total discharges for Ascension system
194,736
193,582
189,711
185,575
189,160
189,458
Percent distribution of discharges by payer
Medicaid
15.1
15.2
15.6
15.6
16.2
17.0
Medicare
47.5
46.3
46.3
47.4
46.8
45.6
Commercial
27.5
27.2
27.8
27.2
27.9
28.3
Uninsured/self-pay
5.6
6.2
5.6
6.1
5.1
4.7
Other
4.3
5.0
4.8
3.6
4.0
4.5
Total discharges in expansion states
65,805
65,245
64,819
62,227
63,535
63,700
Percent distribution of discharges by payer
Medicaid
16.8
17.4
17.4
17.4
18.6
21.2
Medicare
49.5
48.3
48.3
49.1
49.6
46.7
Commercial
27.1
27.0
27,4
26.8
27.1
27.4
Uninsured/self-pay
3.7
4.0
3.9
3.8
2.3
2.1
Other
3.0
3.3
3.0
2.9
2.4
2.7
Total discharges non-expansion states
128,931
128,337
124,892
123,348
125,625
125,758
Percent distribution of discharges by payer
Medicaid
14.3
14.2
14.7
14.7
15.0
14.9
Medicare
46.5
45.3
45.3
46.6
45.3
45.0
Commercial
27.7
27.4
28.0
27.4
28.3
28.8
Uninsured/self-pay
6.6
7.2
6.4
7.3
6.5
6.0
Other
4.9
5.9
5.7
4.0
4.9
5.3
Note: Expansion states include CT, DC, IL, MD, MI, NY, WA.Hospitals in Arizona were excluded from the estimates for expansion states due to incomplete revenue data.Non-expansion states include AL, FL, ID, IN, KS, OK, TN, TX, WI.Source: Ascension Health
Table 3: Changes in Ascension Health Total Patient Revenue, by Payer, 2013-2014
Q2-4,2013($ millions)
Q1-3,2014($ millions)
Δ,2013-2014
($ millions)
% Δ,2013-2014
Total for Ascension system
$13,278
$13,542
$264
2.0%
Medicaid
$1,500
$1,458
-$42
-2.8%
Commercial
$4,144
$4,251
$107
2.6%
Medicare
$4,763
$4,931
$168
3.5%
Self-pay
$1,611
$1,465
-$146
-9.1%
Other
$1,261
$1,438
177
14.0%
Total in expansion states
$4,209
$4,264
$55
1.3%
Medicaid
$560
$606
$46
8.2%
Commercial
$1,101
$1,103
$2
0.2%
Medicare
$1,732
$1,788
$56
3.2%
Self-pay
$287
$106
-$181
-63.2%
Other
$530
$661
$132
24.8%
Total in non-expansion states
$9,069
$9,278
$209
2.3%
Medicaid
$940
$852
-$88
-9.4%
Commercial
$3,043
$3,148
$105
3.5%
Medicare
$3,031
$3,143
$112
3.7%
Self-pay
$1,324
$1,359
$35
2.6%
Other
$731
$777
$46
6.3%
Note: Expansion states include CT, DC, IL, MD, MI, NY, WA.Hospitals in Arizona wereexcluded from the estimates for expansion states due to incomplete revenue data.Non-expansion states include AL, FL, ID, IN, KS, OK, TN, TX, WI.Source: Ascension Health
Table 4: Distribution of Ascension Health Hospital Revenue by Payer
Q2-4,2013
Q1-3, 2014
Total for Ascension system
$13,278
$13,542
Medicaid
11.3%
10.8%
Commercial
31.2%
31.4%
Medicare
35.9%
36.4%
Self-pay
12.1%
10.8%
Other
9.5%
10.6%
Total in expansion states
$4,209
$4,264
Medicaid
13.3%
14.2%
Commercial
26.2%
25.9%
Medicare
41.1%
41.9%
Self-pay
6.8%
2.5%
Other
12.6%
15.5%
Total in non-expansion states
$9,069
$9,278
Medicaid
10.4%
9.2%
Commercial
33.6%
33.9%
Medicare
33.4%
33.9%
Self-pay
14.6%
14.6%
Other
8.1%
8.4%
Note: Expansion states include CT, DC, IL, MD, MI, NY, WA.Hospitals in Arizona wereexcluded from the estimates for expansion states due to incomplete revenue data.Non-expansion states include AL, FL, ID, IN, KS, OK, TN, TX, WI.Source: Ascension Health
Table 5: Change in Ascension Health’s Cost of Care to the Poor, 2013-2014
Q2-4, 2013 ($ millions)
Q1-3, 2014 ($ millions)
Δ,2013-2014 ($ millions)
% Δ,2013-2014
Charity care costs
$453
$395
-$58
-12.8%
Expansion states
$85
$50
-$35
-40.1%
Non-expansion states
$368
$345
-$23
-6.2%
Medicaid shortfalls
$383
$505
$122
31.9%
Expansion states
$106
$129
$23
21.7%
Non-expansion states
$277
$376
$99
35.5%
Net cost of direct care provision to the poor1
$836
$900
$64
7.7%
Expansion states
$191
$179
-$12
-6.3%
Non-expansion states
$645
$721
$76
11.8%
1Includes the sum of charity care costs and Medicaid shortfallsNote: Expansion states include CT, DC, IL, MD, MI, NY, WA. Hospitals in Arizona wereexcluded from the estimates for expansion states due to incomplete revenue data.Non-expansion states include AL, FL, ID, IN, KS, OK, TN, TX, WI.Source: Ascension Health
Supplementary Table 1: Distribution of Ascension Health Inpatient Discharges by State, 2014
Share of Discharges
States with Ascension Health hospitals that expanded Medicaid
Total
211,092
Arizona
10.2
Connecticut
6.3
D.C.
3.9
Illinois
14.3
Maryland
6.0
Michigan
52.4
New York
6.1
Washington
0.8
States with Ascension Health hospitals that did not expand Medicaid
Total
374,731
Alabama
10.9
Florida
14.4
Idaho
1.0
Indiana
15.8
Kansas
8.9
Oklahoma
7.8
Tennessee
11.3
Texas
16.9
Wisconsin
13.1
Source: Ascension Health
Supplementary Table 2: Pre-ACA uninsured rates and 2013 and 2014 adult Medicaid income eligibility limits for states with Ascension Health hospitals
Uninsured rate in 2013(as a share of total state population)
Medicaid income eligibility limits for working parents(as a share of poverty)
Medicaid income eligibility limits for childless adults(as a share of poverty)
2013
2014
2013
2014
States with Ascension Health hospitals that expanded Medicaid
Total
Arizona
19%
106%
138%
100% (closed)
138%
Connecticuta
9%
191%
201%
70%
138%
D.C. a
8%
206%
221%
211%
215%
Illinois
11%
139%
138%
0
138%
Maryland
10%
122%
138%
0
138%
Michigan
11%
64%
138%
0
138%
New York
9%
150%
138%
100%
138%
Washington
11%
71%
138%
0
138%
States with Ascension Health hospitals that did not expand Medicaid
Total
Alabama
16%
23%
16%
0
0
Florida
19%
56%
35%
0
0
Idaho
14%
37%
27%
0
0
Indianab
12%
24%
24%
0
0
Kansas
10%
31%
38%
0
0
Oklahomab
14%
51%
48%
0
0
Tennessee
13%
122%
111%
0
0
Texas
20%
25%
19%
0
0
Wisconsinc
9%
200%
100%
0
100%
Notes: Income eligibility for parents based on a family of three; income eligibility for childless adults based on an individual.a. Connecticut and the District of Columbia had previously expanded Medicaid to parents with incomes above 138% FPL and are maintaining these higher limits.b. These states currently have additional coverage for parents or other adults above state plan limits through a section 1115 demonstration. The demonstrations include limits on eligibility and/or benefits, do not offer coverage to all residents of the state, and/or include an enrollment cap. Indiana received approval to implement the Medicaid expansion through a waiver with coverage beginning in February 2015, so for purposes of this analysis and the dates under review, Indiana is considered a non-expansion state.c. Wisconsin has a waiver to provide full Medicaid coverage to parents and childless adults up to 100% FPL as of January 1, 2014.Sources: Uninsured rate from: 2014 Current Population Survey, Annual Social Economic Supplement, as reported on Kaiser State Health Facts website. https://www.kff.org/other/state-indicator/total-population/Medicaid eligibility from: Kaiser Commission on Medicaid and the Uninsured. Medicaid Eligibility for Adults as of January 1, 2014. October 1, 2013. Available at: https://www.kff.org/medicaid/fact-sheet/medicaid-eligibility-for-adults-as-of-january-1-2014/
Felland LE, Ginsburg PB, Kishbauch G. Improving health care access for low-income people: Lessons from Ascension Health’s Community Collaboratives. Health Affairs, 30, no. 7 (2011): 1290-1298. ↩︎
Bazzoli GJ, Clement JP. The experiences of Massachusetts hospitals as statewide health insurance reform was implemented. Journal of Health Care for the Poor and Underserved, 25 (2014): 63-78. ↩︎
Cole ES, Walker D, Mora A, Diana ML. Identifying hospitals that may be at most financial risk from Medicaid Disproportionate-Share Hospital payment cuts, Health Affairs, 33, no. 11 (2014): 2025-2033. ↩︎