KFF designs, conducts and analyzes original public opinion and survey research on Americans’ attitudes, knowledge, and experiences with the health care system to help amplify the public’s voice in major national debates.
The Affordable Care Act (ACA) expands health insurance coverage by offering both penalties and incentives. Low and middle income households who earn too much to qualify for Medicaid can purchase subsidized coverage on the health insurance marketplaces using premium assistance tax credits. Individuals who do not obtain coverage, through any source, are subject to a tax penalty unless they meet certain exemptions. The penalties under the so-called individual mandate were phased in over a three-year period starting in 2014 and are scheduled to increase substantially in 2016. A key area of uncertainty for 2016 is how much the increased penalties will encourage uninsured people – particularly those who are healthy – to obtain coverage, boosting enrollment in the marketplaces and improving the insurance risk pool. This analysis provides estimates of the share of uninsured people eligible to enroll in the marketplaces who will be subject to the penalty, and how those penalties are increasing for 2016.
Some individuals are exempt from the penalty, including undocumented immigrants, those whose incomes are so low that they are not required to file taxes, people with incomes below 138% of poverty in the “Medicaid gap” in states that have not expanded eligibility for Medicaid under the ACA, people who have to pay more than 8.13% of household income for insurance (taking into account any employer contributions or subsidies) and certain individuals who have membership in certain groups or face a particular hardship.
For those who are uninsured and do not meet one of the exemptions, the penalty for 2016 is calculated as the greater of two amounts:
A flat dollar amount equal to $695 per adult plus $347.50 per child, up to a maximum of $2,085 for the family.
2.5% of family income in excess of the 2015 income tax filing thresholds ($10,300 for a single person and $20,600 for a family).
The penalty can be no more than the national average premium for a bronze plan (the minimum coverage available in the individual insurance market under the ACA), which was $2,484 in 2015 for single coverage and $12,420 for a family of three or more children. The penalty is pro-rated for people who are uninsured for a portion of the year and waived for people who have a period without insurance of less than three months.
As the table below shows, the penalty amounts have increased substantially since 2014.
Table 1: Penalties Under the Individual Mandate
Year
Percent of Income (%)
Per Adult Penalty ($)
Household Penalty ($)
Prior Tax Year Filing Threshold Individual under 65 ($)
Prior Tax Year Filing Threshold – Married filing jointly under 65 ($)
Affordability Standard (%)
2014
1
95
285
10,000
20,000
8
2015
2
325
975
10,150
20,300
8.05
2016
2.5
695
2,085
10,300
20,600
8.13
Estimates of the Actual Penalties People Will Face
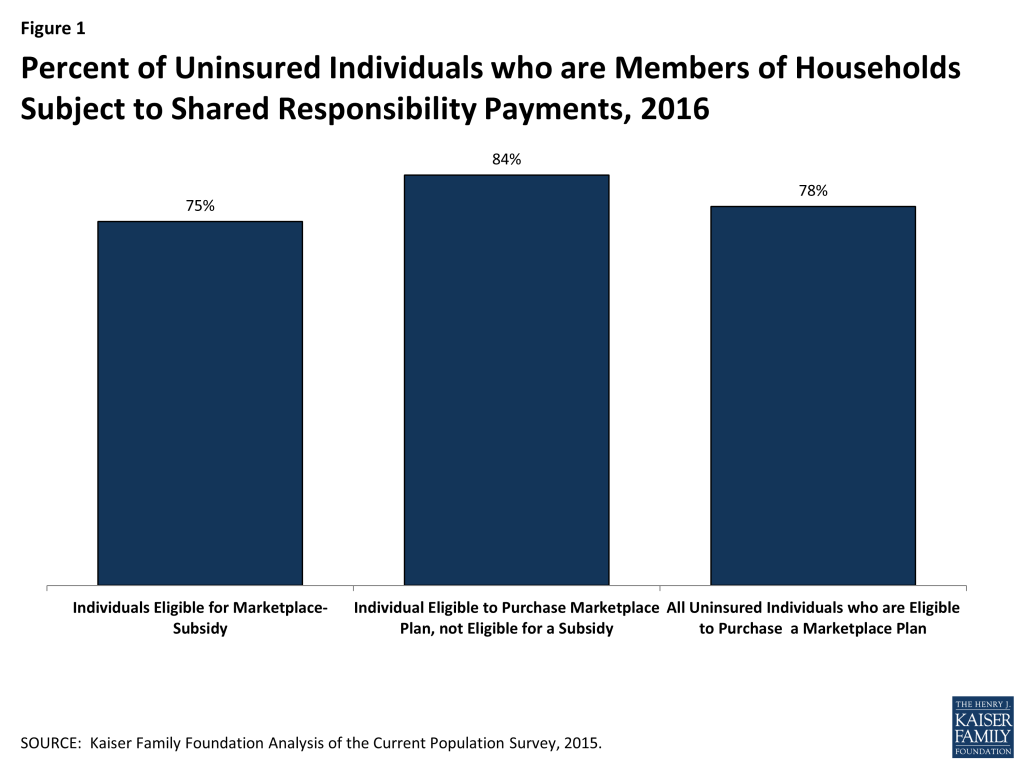
To assess how effective the individual mandate may be in increasing marketplace enrollment, we looked at how penalties are increasing for people who were uninsured in early 2015 and are “marketplace eligible.” This includes non-elderly people eligible for marketplace subsidies as well as those who are not because their incomes are too high, but excludes people who are Medicaid-eligible, in the “Medicaid gap,” or eligible for employer coverage. 1 We estimate that 78% of people who are uninsured and marketplace eligible would be subject to the individual mandate penalty if they remain uninsured in 2016, including 75% of people who are eligible for premium subsidies and 84% of people who are not.
Figure 1: Percent of Uninsured Individuals who are Members of Households Subject to Shared Responsibility Payments, 2016
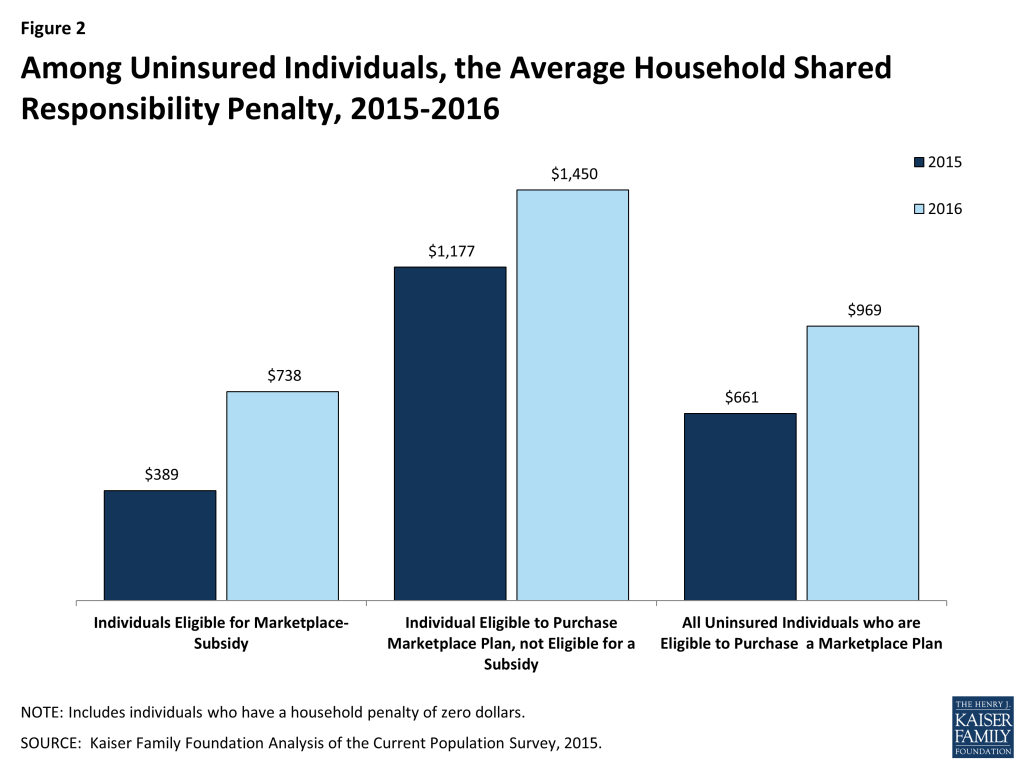
Among individuals who were uninsured in early 2015 and eligible to enroll in the marketplace, the average household penalty in 2016 is $969. This is up 47% from the average estimated penalty this year of $661. Those who are eligible for premium subsidies will face an average household penalty of $738 in 2016, while the average household penalty totals $1,450 for uninsured individuals not eligible for any financial assistance.
Figure 2: Among Uninsured Individuals, the Average Household Shared Responsibility Penalty, 2015-2016
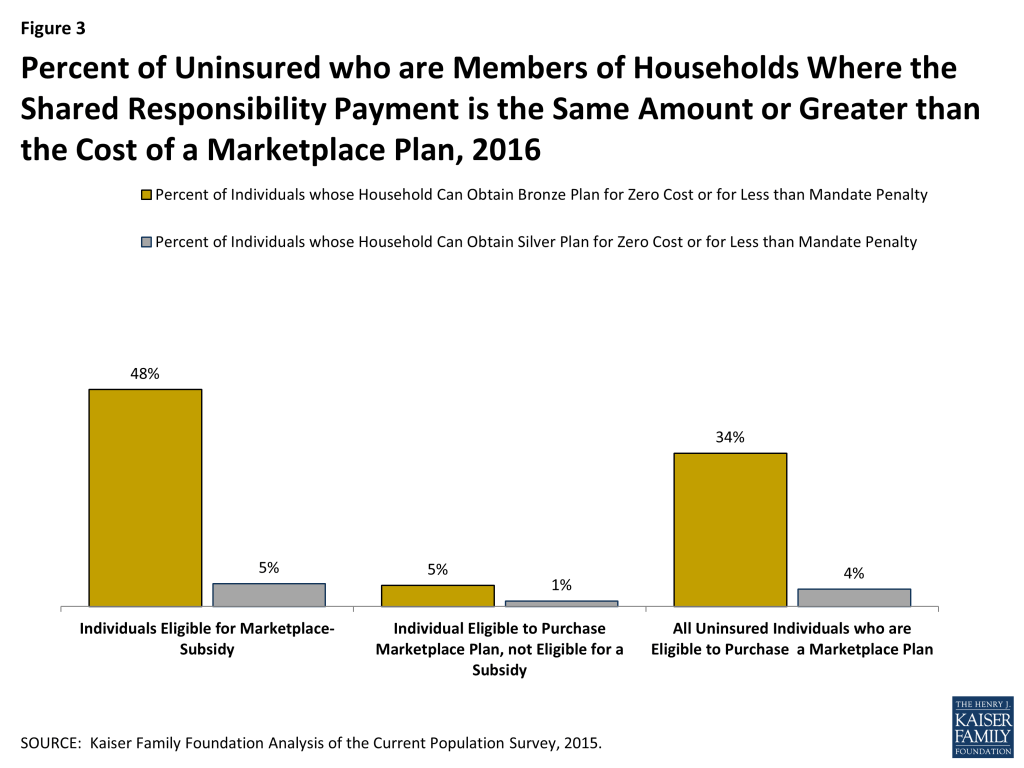
About 7 million uninsured people are eligible for marketplace premium subsidies and are a key target group for increasing marketplace enrollment. Almost half (48%) of them could, in fact, buy a bronze plan for a zero premium contribution or for less than the penalty they would owe for remaining uninsured, including 28% who could buy a bronze plan using their premium subsidy for a zero premium. In other words, 3.5 million subsidy-eligible uninsured people could either get coverage for free or end up paying less by enrolling in marketplace coverage than by remaining uninsured and paying the individual mandate penalty. However, bronze plans come with high deductibles and low-income enrollees may be better off financially enrolling in silver plans that have higher premiums but are eligible for cost-sharing subsidies.
Figure 3: Percent of Uninsured who are Members of Households Where the Shared Responsibility Payment is the Same Amount or Greater than the Cost of a Marketplace Plan, 2016
In total, out of almost 11 million uninsured people who are eligible to enroll in marketplace coverage either with or without financial assistance, 7.1 million would pay less for any penalty than they would to buy the least expensive insurance available to them.
Discussion
Increasing enrollment in the ACA’s health insurance marketplaces would help to reduce the number of people uninsured and keep premium increases down as more healthy people sign up. Premium subsidies are an important “carrot” to attract new enrollees. As penalties grow in 2016, the “stick” of the individual mandate may also become an increasingly significant factor in the household decisions about whether to buy insurance.
However, the effectiveness of the individual mandate as a tool to increase enrollment will depend on how prominent a place it occupies in outreach messaging. And, emphasizing the mandate to obtain coverage presents challenges for ACA advocates since it is the most unpopular part of the law. At the same time, lack of knowledge about the increasing penalties under the mandate could lead to unpleasant surprises when people file their 2016 taxes in early 2017.
Matthew Rae, Cynthia Cox, Gary Claxton, and Larry Levitt are with the Kaiser Family Foundation. Anthony Damico is an independent consultant to the Kaiser Family Foundation.
Methods:
This analysis uses data from the 2015 Current Population Survey (CPS) Annual Social and Economic Supplement (ASEC). The CPS ASEC provides socioeconomic and demographic information for the United Sates population and specific subpopulations. Importantly, the CPS ASEC provides detailed data on families and households, which we use to determine income for ACA eligibility purposes.
The CPS asks respondents about coverage at the time of the interview (for the 2015 CPS, February, March, or April 2015) as well as throughout the preceding calendar year. People who report any type of coverage throughout the preceding calendar year are counted as “insured.” Thus, the calendar year measure of the uninsured population captures people who lacked coverage for the entirety of 2014 (and thus were uninsured at the start of 2015). We use this measure of insurance coverage, rather than the measure of coverage at the time of interview, because the latter lacks detail about coverage type that is used in our model. Based on other survey data, as well as administrative data on ACA enrollment, it is likely that a small number of people included in this analysis gained coverage in 2015.
Medicaid and Marketplaces have different rules about household composition and income for eligibility. For this analysis, we calculate household membership and income for both Medicaid and Marketplace premium tax credits for each person individually, using the rules for each program. For more detail on how we construct Medicaid and Marketplace households and count income, see the detailed technical Appendix A available here.
Undocumented immigrants are ineligible for Medicaid and Marketplace coverage. Since CPS data do not directly indicate whether an immigrant is lawfully present, we draw on the methods underlying the 2013 analysis by the State Health Access Data Assistance Center (SHADAC) and the recommendations made by Van Hook et. al.2,3 This approach uses the Survey of Income and Program Participation (SIPP) to develop a model that predicts immigration status; it then applies the model to CPS, controlling to state-level estimates of total undocumented population from Department of Homeland Security. For more detail on the immigration imputation used in this analysis, see the technical Appendix B available here.
Individuals in tax-filing units with access to an affordable offer of Employer-Sponsored Insurance are still potentially MAGI-eligible for Medicaid coverage, but they are ineligible for advance premium tax credits in the Health Insurance Exchanges. Since CPS data do not directly indicate whether workers have access to ESI, we draw on the methods comparable to our imputation of authorization status and use SIPP to develop a model that predicts offer of ESI, then apply the model to CPS. For more detail on the offer imputation used in this analysis, see the technical Appendix C available here.
The household contribution for a marketplace plan includes the cost of covering all subsidy-eligible individuals in the tax filing unit, including those who might currently be purchasing non-group coverage outside of the exchange. Individuals who are eligible for a Basic Health Plan in New York or Minnesota are included as subsidy-eligibles in this analysis. The penalty for each uninsured non-elderly individual is based on the number of uninsured people in the household. The cost of the average bronze plans in 2016 is estimated by inflating the 2015 average by the growth between 2014 and 2015. In this analysis, households with incomes below the relevant tax filing threshold, in the Medicaid gap, or where the cost of the cheapest available (subsidized) bronze plan exceeds the affordability standard are considered to not have a penalty. Individuals ineligible to purchase marketplace coverage, such as undocumented immigrants, are excluded from the analysis. There may be additional exemptions which individuals are eligible for, including particular hardships such as medical debt or domestic violence and membership in groups such as a health care sharing ministry or a recognized Indian tribe. Individuals 65 or above are excluded from the analysis.
Individuals who are eligible for a Basic Health Plan in New York and Minnesota, and who would otherwise be eligible for subsidized coverage, are considered marketplace-subsidy eligible in this analysis. ↩︎
Van Hook, J., Bachmeier, J., Coffman, D., and Harel, O. 2015. “Can We Spin Straw into Gold? An Evaluation of Immigrant Legal Status Imputation Approaches” Demography. 52(1):329-54. ↩︎
Using authority in the Affordable Care Act, the Centers for Medicare and Medicaid Services (CMS) has launched demonstrations that seek to improve care and control costs for people who are dually eligible for Medicare and Medicaid. Nearly 379,000 beneficiaries in nine states are enrolled in capitated models in these demonstrations as of November, 2015. Implemented beginning in July 2013, the demonstrations are changing the care delivery systems through which beneficiaries receive medical and long-term care services and the financing arrangements among CMS, the states, and providers. The demonstrations initially were approved for three years, but in July, 2015, CMS announced that states may extend their demonstrations for an additional two years. (New York’s demonstration for people with developmental disabilities (DD) is approved for four years.)
As of December, 2015, CMS has finalized memoranda of understanding (MOUs) with 13 states to implement 14 demonstrations:
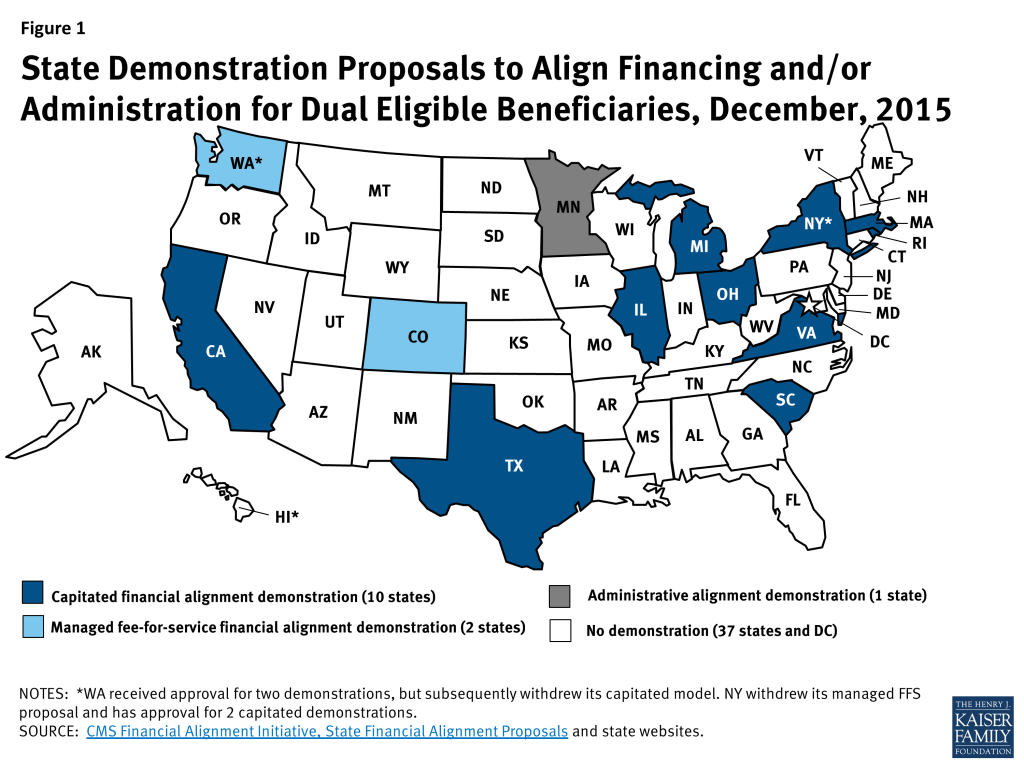
Ten states (California, Illinois, Massachusetts, Michigan, New York, Ohio, South Carolina, Rhode Island, Texas, and Virginia) are testing a capitated financial alignment model (New York is approved for two capitated demonstrations that target different populations and involve different health plans);
Two states (Colorado and Washington) are testing a managed fee-for-service (FFS) financial alignment model; and
One state (Minnesota) is testing the integration of administrative functions without financial alignment (Figure 1).
Figure 1: State Demonstration Proposals to Align Financing and/or Administration for Dual Eligible Beneficiaries, December, 2015
The status of past proposals from other states is detailed in the Appendix. This issue brief compares key provisions of the approved demonstrations, summarized in Table 1 on the next page.
Table 1:State Dual Eligible Financial/Administrative Alignment Demonstrations Approved by CMS, December 2015
State
Estimated Number of Eligible Beneficiaries
Target Population and Geographic Area
Financial Model
Earliest Effective Enrollment Date
Savings Percentage Applied to Medicare and Medicaid Contributions to Baseline Capitated Ratea
CA
424,000
Adult dual eligible beneficiaries in 7 counties
Capitated
April 2014
1% minimum,
1.5% maximum in year 1;
2% minimum,
3.5% maximum in year 2;
4% minimum,
5.5% maximum in year 3b
CO
48,000
Adult dual eligible beneficiaries statewide
Managed FFS
September 2014
N/A (state shares savings with CMS retrospectively if savings and quality criteria met)
IL
135,825
Adult dual eligible beneficiaries in 21 counties grouped into 2 regions
Capitated
March 2014
1% in year 1;
3% in year 2;
5% in year 3
MA
90,240
Non-elderly adult dual eligible beneficiaries in 1 partial and 8 full counties
Capitated
October 2013
0 in 2013;
1% in 2014 (remainder of year 1)c;
2% in year 2;
>4% in year 3d
MI
100,000
Adult dual eligible beneficiaries in 25 counties grouped into 4 regions
Capitated
April 2015
1% in year 1;
2% in year 2;
4% in year 3, except that year 3 savings will be 3% if at least 1/3 of plans have losses exceeding 3% of revenue in year 1
MN
36,000
Dual eligible beneficiaries age 65 and over enrolled in the Minnesota Senior Health Options program statewide
N/Ae
September 2013
N/A (Minnesota’s demonstration will test the integration of administrative functions without financial alignment)
NY (LTSS)
100,000
Adult dual eligible beneficiaries in 8 counties who require nursing facility or nursing facility diversion and transition home and community-based waiver services or more than 120 days of community-based LTSS
Capitated
January 2015
1% in year 1;
1.5% in year 2;
3% in year 3, except that year 3 savings will be 2.5% if at least 1/3 of plans have losses exceeding 3% of revenue in year 1f
NY (DD)
20,000
Adult dual eligible beneficiaries in 9 counties who are eligible for state DD services and an ICF/DD level of care (must be enrolled in DD waiver if receiving waiver services)
Capitated
April 2016
0.25% in year 1;
0.5% in year 2;
1% in year 3, except that year 3 savings will be 0.75% if the plan has losses exceeding 3% of revenue in year 1;
Year 4 savings will be the same as year 3
OH
115,000
Adult dual eligible beneficiaries in 29 counties grouped into 7 regions
Capitated
May 2014
1% in year 1;
2% in year 2;
4% in year 3
RI
30,000
Adult dual eligible beneficiaries statewide
Capitated
December 2015
1% in year 1;
1.25% in year 2;
3% in year 3, except that year 3 savings will be 1.5% if at least 1 plan has losses exceeding 3% of revenue in all regions in year 1
SC
53,600
Dual eligible beneficiaries age 65 and over statewide who live in the community at the time of enrollment
Capitated
February 2015
Same as Ohio
TX
168,000
Adult dual eligible beneficiaries with disabilities who qualify for SSI or Medicaid waiver HCBS in 6 counties
Capitated
March 2015
1.25% in year 1.a;g
2.75% in year 1.b;i
3.75% in year 2;
5.5% in year 3
VA
78,600
Adult dual eligible beneficiaries in 104 localities grouped into 5 regions
Capitated
April 2014
Same as Michiganh
WA
21,000
High cost/high risk adult dual eligible beneficiaries statewide except in 2 urban counties
Managed FFSi
July 2013
Same as Colorado
NOTES: a Demonstration savings in the capitated models will be derived upfront by reducing CMS’s and the state’s respective baseline contributions to the plans by a savings percentage for each year. b California’s maximum demonstration-wide savings percentages, along with county-specific interim savings percentages, will be used to determine the demonstration’s risk corridors. c Massachusetts reduced its 2013 savings from 1% to zero. Demonstration year 1 in Massachusetts begins in 2013 and runs through December 2014. d Massachusetts anticipates savings of greater than 4% (approximately 4.2%) in year 3 to make up for forgone savings in year 1. e Minnesota’s administrative alignment demonstration will take place in its existing capitated delivery system in which Medicaid MCOs also qualify as Medicare Advantage D-SNPs. f This determination will be based on at least 15 months of data (demonstration year 1 in New York encompasses July 2014 through December 2015). g Demonstration year 1.a in Texas is March to Dec. 2015. h Demonstration year 1.b in Texas is 2016. i This determination will be based on at least 20 months of data and in all regions in which plans participate (demonstration year 1 in Virginia encompasses February 2014 through December 2015). j Washington withdrew its capitated demonstration which was approved by CMS for 2 urban counties.
Dual eligible beneficiaries include seniors and non-elderly people with significant disabilities, some of whom are among the poorest and sickest beneficiaries covered by either Medicare or Medicaid. The predominant existing service delivery models for these beneficiaries typically involve little to no coordination between the two programs. Dual eligible beneficiaries account for a disproportionate share of spending in the Medicare and Medicaid programs. In the case of Medicare, this is mainly due to their relatively poorer health status, which requires higher use of medical services compared to other program beneficiaries. In the case of Medicaid, dual eligible beneficiaries’ relatively high spending is generally attributable to their greater need for LTSS.
Key Demonstration Provisions
Geographic Area and Target Population
Four states (Colorado, Minnesota, Rhode Island, and South Carolina) have statewide demonstrations, while the others are limited to certain regions.
The states’ target populations for their demonstrations vary, with ten states (California, Colorado, Illinois, Michigan, New York, Ohio, Rhode Island, Texas, Virginia, and Washington) including both elderly and non-elderly beneficiaries. Among the states targeting sub-populations:
Massachusetts targets non-elderly people with disabilities;
South Carolina targets elderly beneficiaries who live in community-based settings at enrollment;
One of New York’s demonstrations focuses on elderly and non-elderly beneficiaries who receive nursing facility services or nursing facility diversion and transition home and community-based waiver services or who require more than 120 days of community-based LTSS, while New York’s other demonstration focuses on beneficiaries with DD; and
Texas targets elderly and non-elderly beneficiaries with disabilities who qualify for Supplemental Security Income (SSI) benefits or certain Medicaid home and community-based waiver services for seniors and adults with physical disabilities.
Michigan and New York are the only states with capitated demonstrations to include both beneficiaries with DD and DD services.
Enrollment
Estimated Number of Eligible Beneficiaries
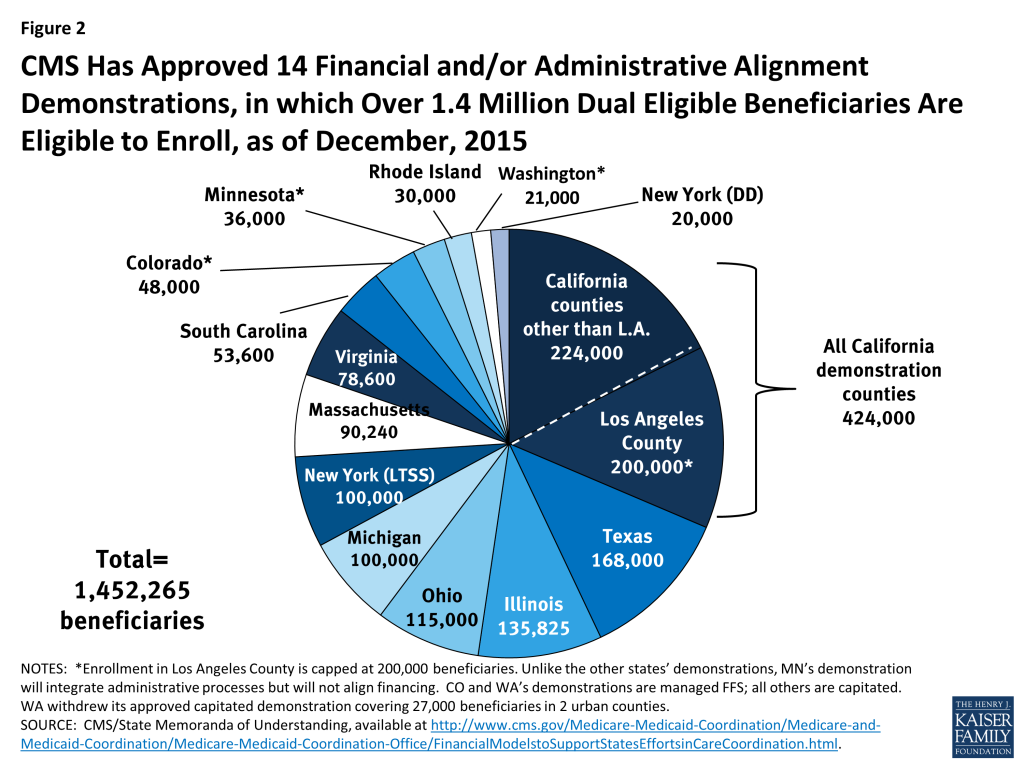
CMS has stated that it plans to limit enrollment in the demonstrations to no more than two million dual eligible beneficiaries nationally. As of December, 2015, CMS has approved 14 demonstrations in which an estimated over 1.4 million beneficiaries are eligible to enroll. (Not all beneficiaries who are eligible to participate in the demonstrations are expected to enroll.) The estimated number of beneficiaries eligible for California’s demonstration is just under 30 percent of the total number of beneficiaries eligible for all demonstrations approved to date and exceeds the number of eligible beneficiaries in each of the other states with approved demonstrations. Enrollment in Los Angeles County, capped at 200,000 beneficiaries, will be greater than the number of beneficiaries eligible to participate in any other state’s demonstration (Figure 2).
Figure 2: CMS Has Approved 14 Financial and/or Administrative Alignment Demonstrations, in which Over 1.4 Million Dual Eligible Beneficiaries Are Eligible to Enroll, as of December, 2015
Enrollment Timeline
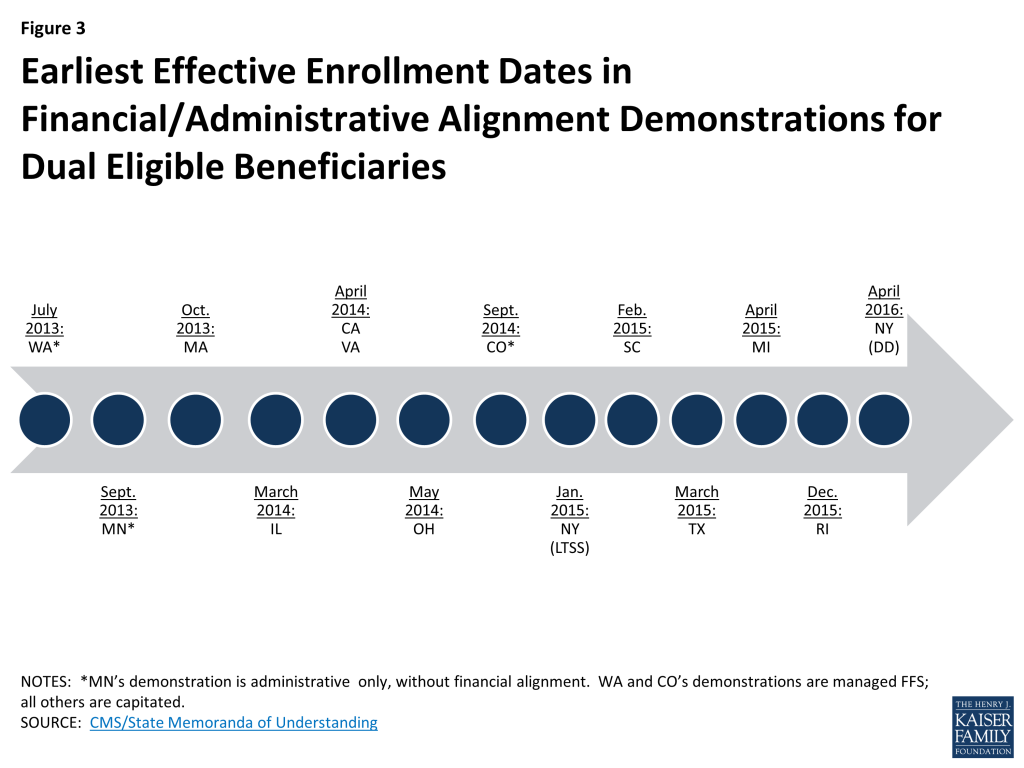
Enrollment has begun in all of the states with demonstrations approved to date except Rhode Island, which will begin its demonstration no sooner than December, 2015, and New York’s demonstration for beneficiaries with DD, which will begin no sooner than April, 2016. States vary in the amount of time that beneficiaries have been enrolled in their demonstrations: some states have enrolled beneficiaries for more than two years (Washington, Massachusetts), while other states began enrolling beneficiaries in early 2015 (New York, South Carolina, Texas, Michigan) (Figure 3).
Figure 3: Earliest Effective Enrollment Dates in Financial/Administrative Alignment Demonstrations for Dual Eligible Beneficiaries
Enrollment Process and Beneficiary Choices
Nearly all of the capitated demonstrations (except for some counties in California, in which beneficiaries are automatically enrolled in the demonstration without an initial voluntary enrollment period) began with a voluntary enrollment period in which beneficiaries could “opt in” to the demonstration and select a managed care plan (Rhode Island also plans to begin with a voluntary opt in period). The voluntary enrollment period in nearly all states is followed by passive enrollment periods in which the remaining beneficiaries will be automatically assigned to a managed care plan; however, enrollment in New York’s demonstration for beneficiaries with DD will remain voluntary only. To effectuate passive enrollment, states are developing “intelligent assignment” algorithms to preserve continuity of providers and services when assigning beneficiaries to plans.
Beneficiaries retain the right to opt out of the demonstration at any time but must take affirmative action to do so. In all states, beneficiaries can opt out of the demonstration and choose another delivery system (i.e., FFS, Medicare Advantage, Program of All-Inclusive Care for the Elderly) for their Medicare benefits. However, states may seek CMS approval to require beneficiaries to enroll in Medicaid managed care even if they opt out of the financial alignment demonstration for their Medicare benefits, and five states with capitated demonstrations (California, Illinois, New York’s LTSS demonstration, Ohio, and Texas) have indicated that they are doing so. By contrast, six states with capitated demonstrations (Massachusetts, Michigan, New York’s DD demonstration, Rhode Island, South Carolina, and Virginia) allow beneficiaries who opt out of the demonstration to remain in the FFS delivery system for both their Medicare and Medicaid benefits (Table 2).
Table 2:Beneficiary Enrollment Choices in the Capitated Financial Alignment Demonstrations
State
Managed Care Enrollment Required for:
Medicare
Medicaida
California
No
Yesb
Illinois
No
Yesc
Massachusetts
No
No
Michigan
No
No
New York – LTSS
No
Yesd
New York – DD
No
No
Ohio
No
Yese
Rhode Island
No
No
South Carolina
No
No
Texas
No
Yesf
Virginia
No
No
NOTES: a CMS approval is necessary for states to require beneficiaries to enroll in Medicaid managed care, even if beneficiaries opt out of the financial alignment demonstration for their Medicare benefits. b California’s § 1115 waiver was amended to require beneficiaries to enroll in managed care plans for their Medicaid benefits, including LTSS. c Illinois has a draft § 1115 waiver application seeking to require Medicaid managed care enrollment. d New York’s § 1115 waiver requires beneficiaries in the financial alignment demonstration geographic area who receive more than 120 days of LTSS to enroll in a Medicaid MLTSS plan. e Ohio’s MOU indicates that the state may seek additional § 1915(b)/(c) waiver authority to require beneficiaries to enroll in Medicaid managed care. f Texas’s existing § 1115 waiver requires adult dual eligible beneficiaries to enroll in Medicaid managed LTSS.
Given the complexities of the enrollment decision, beneficiaries are likely to need individual in-person options counseling to make their choice. Seven states (California, Illinois, Massachusetts, Michigan, New York, Virginia, and Washington) have received CMS funding to date to support beneficiary outreach, education, and options counseling in their demonstrations through their State Health Insurance Program and Aging and Disability Resource Centers.
In Washington’s managed FFS demonstration, beneficiaries are automatically enrolled in a health home network but retain the choice about whether to receive Medicaid health home services; other Medicare and Medicaid services will continue to be provided on a FFS basis. Similarly, in Colorado’s managed FFS demonstration, beneficiaries will be automatically assigned to the Regional Care Collaborative Organization in their geographic area to access care coordination services but may disenroll from the demonstration at any time.
Minnesota’s administrative alignment demonstration does not involve passive enrollment; instead enrollment in Senior Health Options plans remains voluntary, although the demonstration will test an integrated enrollment system.
Care Delivery Model
The ten states with capitated demonstrations are using managed care plans to coordinate services for beneficiaries through a person-centered planning process. Person-centered planning focuses on the strengths, needs, and preferences of the individual beneficiary instead of being driven by the care delivery system.
Some states require or allow their managed care plans to contract with other entities to provide services in their demonstrations (Table 3). Massachusetts requires its plans to contract with community-based organizations to provide Long-Term Supports coordinators as independent members of the beneficiary’s care team, Michigan requires its plans to contact with existing Medicaid Prepaid Inpatient Health Plans (PIHPs) to provide behavioral health services, and Ohio requires its plans to contract with Area Agencies on Aging to coordinate home and community-based waiver services for enrollees over age 60. (Illinois, New York, Rhode Island, South Carolina, Texas, and Virginia’s MOUs do not include any similar requirements). California requires its plans to establish MOUs with county behavioral health agencies to provide specialty mental health services and with county social services agencies to coordinate In Home Supportive Services. Demonstration health plans in Los Angeles County are subcontracting with other Medicare Advantage plans to offer a variety of benefit packages to enrollees in California’s demonstration.
Washington’s managed FFS demonstration is using Medicaid health home care coordination organizations to manage services among existing Medicare and Medicaid providers, and Colorado is using its existing Medicaid Accountable Care Collaborative program to coordinate Medicare and Medicaid services for beneficiaries in its demonstration.
Minnesota’s administrative alignment demonstration maintains the existing Senior Health Options program delivery system in which Medicaid managed care plans contract with the state and also are qualified as Medicare Advantage Special Needs Plans focused on dual eligible beneficiaries (D-SNPs) under contract with CMS.
Financing
Ten states (California, Illinois, Massachusetts, Michigan, New York, Ohio, Rhode Island, South Carolina, Texas, and Virginia) are testing CMS’s capitated financial alignment model, in which managed care plans will receive capitated payments from CMS for Medicare services and the state for Medicaid services.
Anticipated program savings in the capitated financial alignment demonstrations are deducted up-front from CMS’s and the state’s respective baseline contributions to health plans by a savings percentage for each year (Table 1). CMS will contribute the Medicare portion of the capitated rate and recently announced rate adjustments for 2016, to better align capitated payments with fee-for-service costs for full benefit dual eligible beneficiaries. The Medicaid portion of the capitated rate includes both the federal and state funding. None of the MOUs explicitly states the basis for the savings percentages, although Illinois’ MOU notes that it currently has one of the highest rates of potentially avoidable hospital admissions among dual eligible beneficiaries nationally and one of the highest proportions of spending on institutional services compared to HCBS. While California’s MOU specifies minimum savings percentages of 1% in year one, 2% in year two, and 4% in year three, it also includes maximum savings percentages of 1.5% in year one, 3.5% in year two, and 5.5% in year three, making the maximum savings percentages in California among the highest of the approved demonstrations to date. Texas’s MOU specifies savings percentages of 1.25% in year 1.a (March to December 2015), 2.75% in year 1.b (2016), 3.75% in year 2, and 5.5% in year 3.
All 10 states with capitated financial alignment demonstrations include provisions to withhold a portion of the capitated rate that plans can earn back if specified quality measures are met. California also requires its plans to provide incentive payments from the quality withhold funds to county behavioral health agencies based on achievement of service coordination measures, and Michigan requires its plans to reward the PIHPs that will provide behavioral health services when the plan earns the withheld payment. South Carolina plans must provide financial incentives to providers that achieve NCQA patient-centered medical home certification.
Two states (Colorado and Washington) are testing CMS’s managed FFS model in which providers will continue to receive FFS reimbursement for both Medicare and Medicaid-covered services. Any savings in these demonstrations will be determined retrospectively, with the state eligible to share in savings with CMS if savings targets and quality standards are met.
Minnesota’s administrative alignment demonstration will not test one of CMS’s financial alignment models. Instead, Minnesota’s Senior Health Options program will maintain its existing capitated integrated payment and delivery system arrangements involving Medicaid MCOs that also qualify as Medicare Advantage D-SNPs. Plans will be allowed to integrate Medicare and Medicaid primary care payments to promote care coordination through health care homes and improved coordination among primary, acute, and LTSS and among physical and behavioral health services.
Benefits
The 10 states with capitated financial alignment demonstrations include nearly all Medicare and Medicaid services in the plans’ benefits package and capitated payment. All states include nursing facility services in the plans’ capitated payment and benefits package. Eight of the 10 states testing the capitated model (Illinois, Michigan, New York (both demonstrations), Ohio, South Carolina, Rhode Island, Texas, and Virginia) include beneficiaries who receive certain Medicaid home and community-based waiver services, while two states (California and Massachusetts) exclude all HCBS waiver enrollees from their demonstrations. Plans are allowed to offer additional benefits, outside the traditional Medicare and Medicaid benefits packages, as appropriate to beneficiary needs. All states require their health plans to offer beneficiaries the option to self-direct their LTSS (Table 3).
Five of the capitated states require plans to offer additional benefits as part of the demonstration. Massachusetts plans must offer certain diversionary behavioral health and community support services that are not otherwise covered as well as expanded Medicaid state plan benefits. Ohio’s § 1915(b)/(c) Medicaid waiver, which operates concurrently with the demonstration, includes expanded Medicaid state plan benefits and additional HCBS. California’s demonstration includes vision and non-emergency medical transportation benefits, and its plans may offer additional HCBS. South Carolina’s demonstration includes a palliative care benefit for enrollees with a serious, chronic or life-threatening illness who may not meet hospice criteria. Michigan’s health plans must offer adaptive medical equipment and supplies, community transition services, fiscal intermediary services to support self-direction, personal emergency response systems, and respite services (Table 3).
Table 3:LTSS in the Capitated Financial Alignment Demonstrations
State
Nursing facility services included
Home and community-based waiver services included
DD population/ services included
Traditional Medicaid benefits package expanded
Plans can offer supplemental benefits
Self-direction option required
Required contracting/service coordination
CA
Yes
No
No
Yes – plans must provide vision and non-emergency medical transportation services
Yes
Yes
Yes – plans must have MOUs with county mental health and substance use agency for behavioral health services and county social service agency for IHSS
IL
Yes
Yes (except DD)
No
Not mentioned in MOU
Yes
Yes
Not mentioned in MOU
MA
Yes
No (may seek to include in future)
No
Yes – plans must provide diversionary behavioral health and community support services and (unspecified) expanded Medicaid state plan benefits
Yes
Yes
Yes – plans must provide Long-Term Supports coordinator form independent community-based organization as a member of the care team
MI
Yes
Yes
Yes
Yes – plans must provide adaptive medical equipment and supplies, community transition services, fiscal intermediary for self-direction, personal emergency response system, respite
Yes
Yes
Yes – plans must contract with PIHP for behavioral health services
NY – LTSS
Yes
Yes (NF diversion and transition waiver only)
No*
Not mentioned in MOU
Yes
Yes
Not mentioned in MOU
NY – DD
Yes (ICF/DD also included)
Yes (DD only)
Yes
No
Yes
Yes
Not mentioned in MOU
OH
Yes
Yes (except DD)
No
Yes – expects to require plans to provide (unspecified) expanded Medicaid state plan benefits and additional HCBS
Yes
Yes
Yes – plans must contract with AAA to coordinate HCBS for beneficiaries over age 60
RI
Yes
Yes (except DD)
DD population enrolled but LTSS excluded
Not mentioned in MOU
Yes
Yes
Not mentioned in MOU
SC
Yes
Yes (elderly/disabled, HIV/AIDS, and mechanical ventilation waivers only)
No
Yes – plans must provide palliative care benefit
Yes
Yes
Not mentioned in MOU
TX
Yes
Yes (seniors and people with physical disabilities who meet NF level of care only)
No
Not mentioned in MOU
Yes
Yes
Not mentioned in MOU
VA
Yes
Yes (elderly/disabled with consumer direction waiver only)
Washington’s managed FFS demonstration adds Medicaid health home services but does not otherwise change the existing Medicare and Medicaid benefits packages. Similarly, Colorado offers care coordination services but otherwise does not change the existing Medicare and Medicaid benefits packages.
Minnesota’s administrative alignment demonstration will continue to provide Medicare benefits at least equivalent to the basic benefit levels included in Medicare Parts A, B, and D and Medicaid benefits based on existing Medicaid MCO contracts.
Demonstration Ombudsman
CMS has announced a funding opportunity for states with approved MOUs to support the planning, development, and provision of independent ombudsman services in the demonstrations, with ten states (California, Colorado, Illinois, Massachusetts, Michigan, Ohio, Rhode Island, South Carolina, Virginia, and Washington) awarded funding to date. Seven states (Colorado, Illinois, Michigan, Ohio, South Carolina, Texas, and Washington) are using an ombuds office within state government, although independent of the state Medicaid agency, while four states (California, Massachusetts, New York, and Virginia) are using an ombuds entity outside of state government. Minnesota’s MOU provides that the state’s managed care ombudsman will provide input on plan and system-wide performance but does not provide further details.
Appeals
All of the capitated demonstrations provide beneficiaries with a single integrated notice of appeal rights, and the existing Medicare Part D appeals process for prescription drugs will continue to apply in all demonstrations. Minnesota’s administrative alignment demonstration is building on the integrated appeals system already established in its Senior Health Options program by adding a single integrated notice of appeal rights and standardizing the timeframes to request Medicare and Medicaid appeals. By contrast, Colorado and Washington’s managed FFS demonstrations do not make any changes to the existing Medicare and Medicaid appeals systems.
New York’s two capitated financial alignment demonstrations include a fully integrated four level appeals process for all services traditionally covered by Medicare Parts A and B and Medicaid. New York requires its demonstration health plans to continue providing benefits while appeals are pending for both prior-approved Medicare and Medicaid services if the beneficiary so requests within 10 days of the date of the notice. (Continued benefits pending appeal is currently available under federal law for Medicaid services but not for Medicare services.)
Five of the capitated demonstration states (Illinois, Massachusetts, Rhode Island, South Carolina, and Virginia) require beneficiaries to first exhaust an internal health plan appeal before proceeding to external appeals, while four of the capitated demonstration states (California, Michigan, Ohio, and Texas) allow beneficiaries to choose whether to first file an internal health plan appeal or instead to proceed directly to a fair hearing for Medicaid-covered services.
All of the capitated demonstrations require health plans to continue Medicare and Medicaid benefits while internal health plan appeals are pending; beneficiaries may request that Medicaid benefits continue while fair hearings are pending, but Medicare benefits will not continue during external appeals. (California’s aid pending appeal provision is contained in its three-way contract instead of its MOU.) California’s MOU provides that the existing Medicare and Medicaid appeals processes will continue at least through demonstration year one, and the state will work to create a more integrated appeals process in future years.
Looking Ahead
As the demonstrations are implemented, additional details about several features are emerging, including how beneficiaries are being notified, counseled, and enrolled; how the demonstrations are being monitored and overseen; how beneficiary ombuds programs are being implemented; and how the demonstrations are being evaluated. CMS has contracted with RTI International to conduct an overall evaluation of the demonstrations as well as state-specific evaluations. The MOUs provide that the evaluations will include site visits, analysis of program data, focus groups, key informant interviews, analysis of changes in quality, utilization, and cost measures, and calculation of savings attributable to the demonstrations. The evaluation findings are to be reported quarterly, although there is likely to be a lag in data availability.
The approved MOUs provide additional information about how CMS and the states envision the demonstrations working and insight into the framework and policy decisions that CMS may apply when developing MOUs with other states that submitted proposals. Additional details are specified in the three-way contracts between CMS, the state, and demonstration plans in the capitated model, in the states’ final demonstration agreement with CMS in the managed FFS model, and in policy guidance. Key areas to continue to consider as the demonstrations are implemented include:
how beneficiaries are making their enrollment choices;
what the actual sources of program savings will be;
how beneficiaries’ access to medically necessary services and supports is being ensured;
how the demonstrations are affecting beneficiary access to HCBS;
how beneficiaries are navigating the demonstrations’ grievance and appeals processes;
whether continuity of care and intelligent assignment provisions are sufficient to prevent care disruptions and the extent to which beneficiaries’ current providers are participating in demonstration health plan networks;
how plans and providers are accommodating the needs of beneficiaries with disabilities; and
what impact the demonstrations are having on care quality and health outcomes.
While the demonstrations offer the potential opportunity to improve care coordination, lower program costs, and achieve outcomes such as better health and the increased use of HCBS instead of institutional care, at the same time the high care needs of many dual eligible beneficiaries increases their vulnerability when care delivery systems are changed.
Appendix
Table 4:State Interest in Financial Alignment Demonstrations for Dual Eligible Beneficiaries as of December, 2015
State
Awarded Design Contract
Submitted Letter of Intent
Submitted Capitated Proposal to CMS
Submitted Managed FFS Proposal to CMS
MOU Signed with CMS
Alabama
Alaska
X
Arizona
X
X
Arkansas
California
X
X
X
Capitated
Colorado
X
X
X
Managed FFS
Connecticut
X
X
X
Delaware
X
DC
X
Florida
X
Georgia
Hawaii
X
X
Idaho
X
X
Illinois
X
X
Capitated
Indiana
X
Iowa
X
X
Kansas
X
Kentucky
X
Louisiana
Maine
X
Maryland
X
Massachusetts
X
X
X
Capitated
Michigan
X
X
X
Capitated
Minnesota*
X
X
X
Administrative
Mississippi
Missouri
X
X
Montana
X
Nebraska
Nevada
X
New Hampshire
New Jersey
New Mexico
X
X
New York*
X
X
X
X
2 Capitated
North Carolina
X
X
X
North Dakota
Ohio
X
X
Capitated
Oklahoma
X
X
X
X
Oregon
X
X
X
Pennsylvania
X
Rhode Island
X
X
Capitated
South Carolina
X
X
X
Capitated
South Dakota
Tennessee
X
X
X
Texas
X
X
Capitated
Utah
Vermont
X
X
X
Virginia
X
X
Capitated
Washington*
X
X
X
X
Capitated (withdrawn);
Managed FFS
West Virginia
Wisconsin
X
X
X
Wyoming
TOTAL:
15
38
21
8
13
NOTES: *MN received approval for administrative alignment only, without financial alignment. NY withdrew its managed FFS proposal and received approval for 2 capitated models. WA received approval for two demonstrations, but subsequently withdrew its capitated model.
With 17 million people newly-insured since 2014, Drew Altman’s latest column for The Wall Street Journal’s Think Tank takes a look at whether they will make an impact in the first presidential election since Affordable Care Act enrollment began.
In 2015, more than 17 million Medicare beneficiaries (31%) are enrolled in Medicare Advantage plans,1 such as health maintenance organizations (HMOs) or preferred provider organization (PPOs). Medicare Advantage plans are offered as an alternative to the traditional Medicare program. Medicare beneficiaries can enroll in a Medicare Advantage plan, change Medicare Advantage plans, or switch from Medicare Advantage to traditional Medicare during the annual open enrollment period. Changes in the Medicare Advantage marketplace have always been closely watched, and since 2010 when the Affordable Care Act (ACA) was enacted, many have been interested in the effects of the ACA phasing down federal payments to Medicare Advantage plans. More recently, proposed mergers between health insurance firms with large footprints in Medicare Advantage have raised questions about how the mergers could affect beneficiaries.
This spotlight analyzes publicly available data to review the Medicare Advantage plans offered in 2016. It provides updated information describing how Medicare Advantage plan choices are changing in 2016, includes new information on premiums, out-of-pocket limits and other plan features, and examines the role of large firms offering plans in the marketplace. Findings include:
The average Medicare beneficiary will be able to choose from 19 plans in 2016, a number which has been relatively stable since 2012. Relatively few plans are entering or exiting the Medicare Advantage market, and for the most part, the same plans that were available in 2015 will be available in 2016.
While the average Medicare beneficiary can choose from many plans, these plans will be offered by a handful of firms. The average beneficiary will be able to choose from plans offered by six firms; one-quarter of beneficiaries nationwide will have a choice of plans offered by three or fewer firms in 2016.
If enrollees in Medicare Advantage plans with prescription drug coverage (MA-PDs) stay in the same plan between 2015 and 2016, their premiums will increase by 8 percent, on average. Similar to past years, about four-fifths of beneficiaries (81%) will have access to an MA-PD with no premium in 2016.
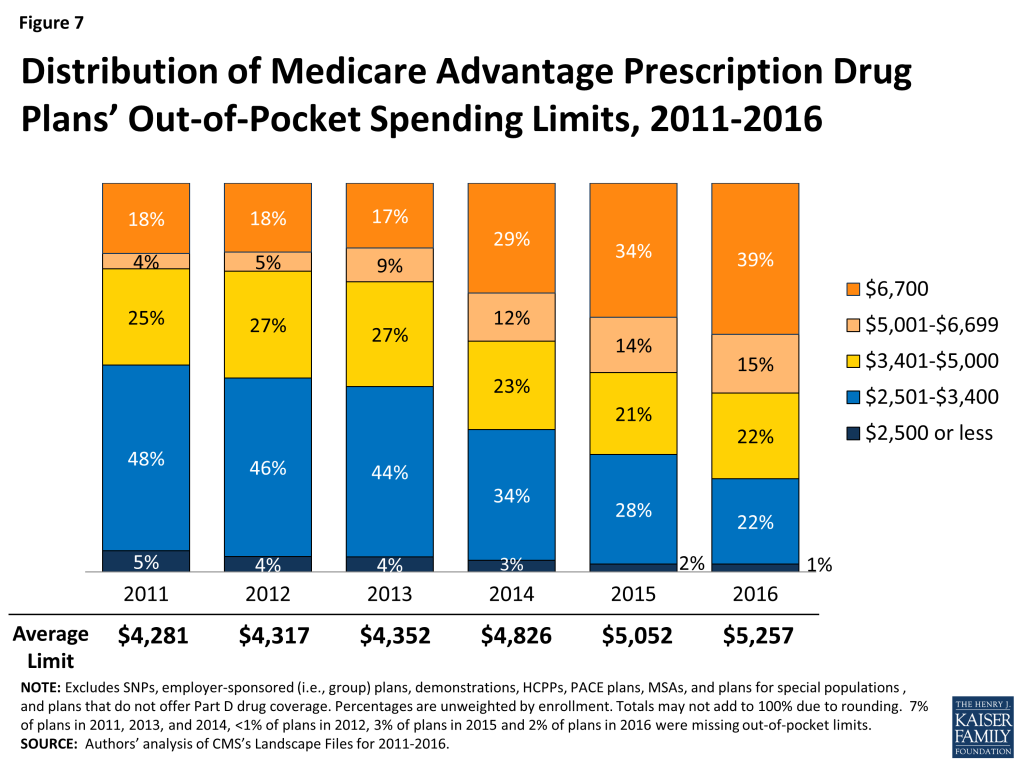
Plans’ limits on out-of-pocket costs for Part A and B benefits will rise in 2016, as they have in prior years. Almost two-fifths (39%) of plans will have limits equal to the maximum allowed ($6,700 per year) in 2016, up from 17 percent in 2013.
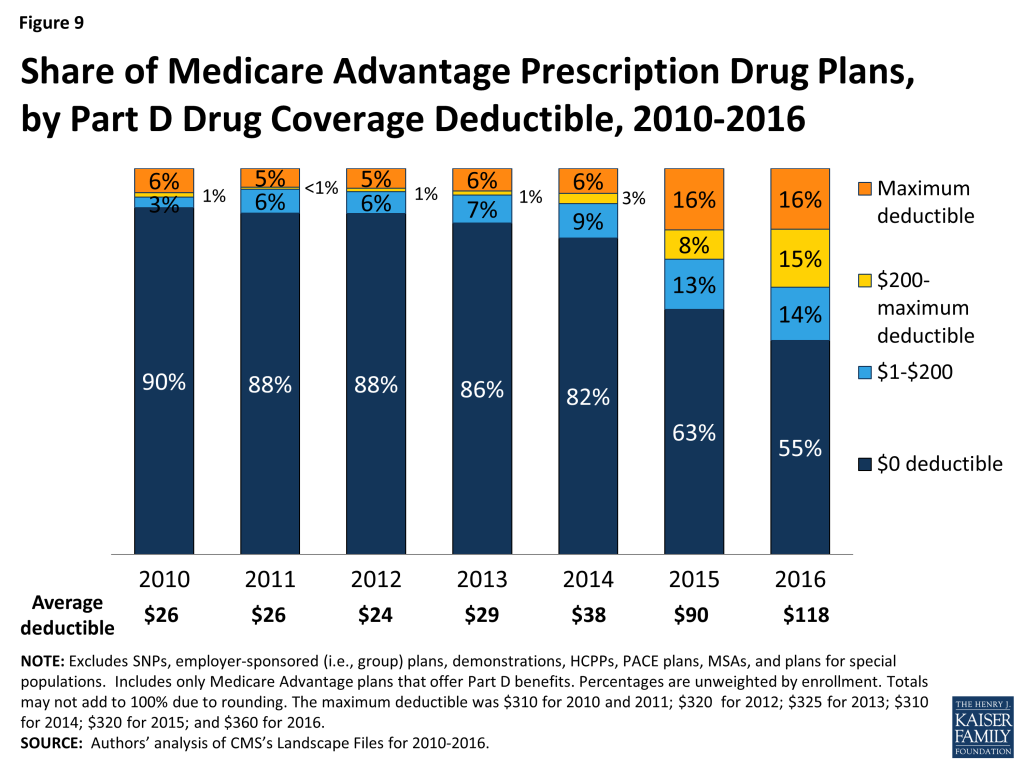
Nearly half (45%) of MA-PDs will impose a deductible for Part D prescription drugs in 2016, an increase from 2015, and the average Part D drug deductible will be higher in 2016 than 2015.
The average quality star rating for plans will be higher in 2016, with substantial growth in the number of contracts with 4 and 4.5 stars.
Issue Brief: Plan Offerings In 2016
Number of Plans Offered
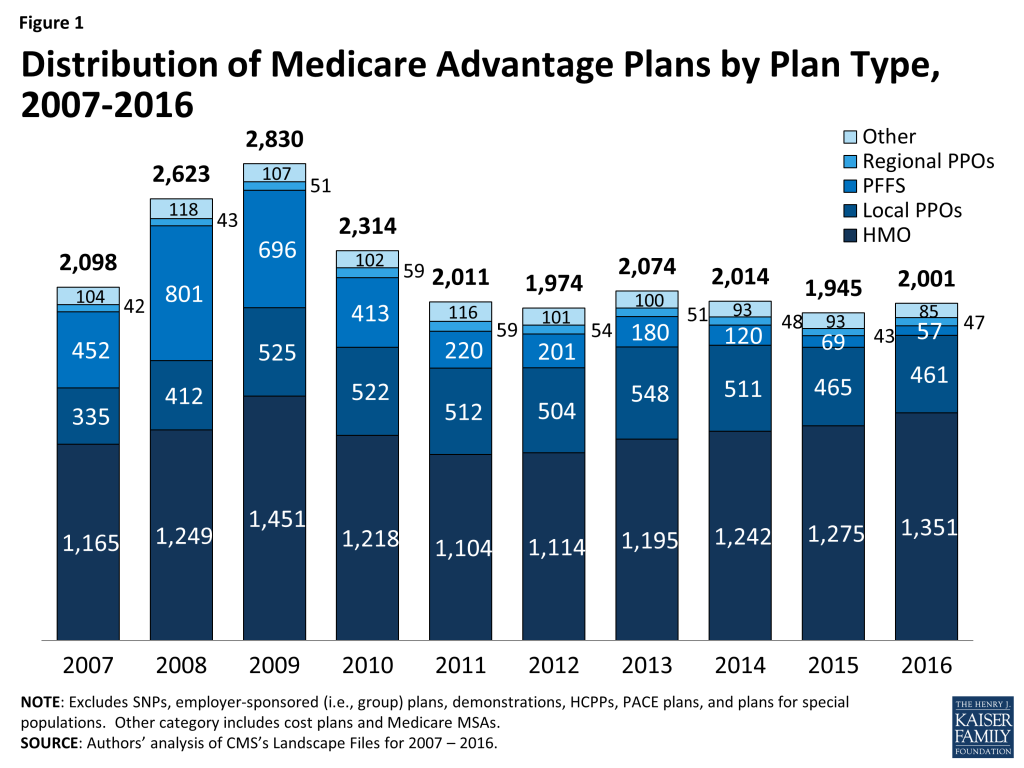
In total, 2,001 Medicare Advantage plans will be available nationwide for individual enrollment in 2016, 56 more than in 2015 (Figure 1). In 2016, 203 plans that were available in 2015 will be exiting the Medicare Advantage market, and 259 plans will be offered for the first time. An earlier analysis describes the nature of change at the national and state level as plans enter and exit the market in 2016.2 While virtually every state will see some change in the number of plan offerings, most of the plans exiting the market in 2016 attracted relatively few enrollees in 2015. Nationwide, the number of plans offered has been relatively stable since 2011.
Figure 1: Distribution of Medicare Advantage Plans by Plan Type, 2007-2016
HMOs continue to account for the majority of plans available, and will account for two-thirds of all plans offered in 2016 (Table A1). Since 2013, the number of HMOs has increased each year, with 76 more HMOs in 2016, while the availability of other plan types has either remained similar or decline. In 2016, there will be limited changes in the number of local PPOs, regional PPOs, and private fee-for-service (PFFS) plans.
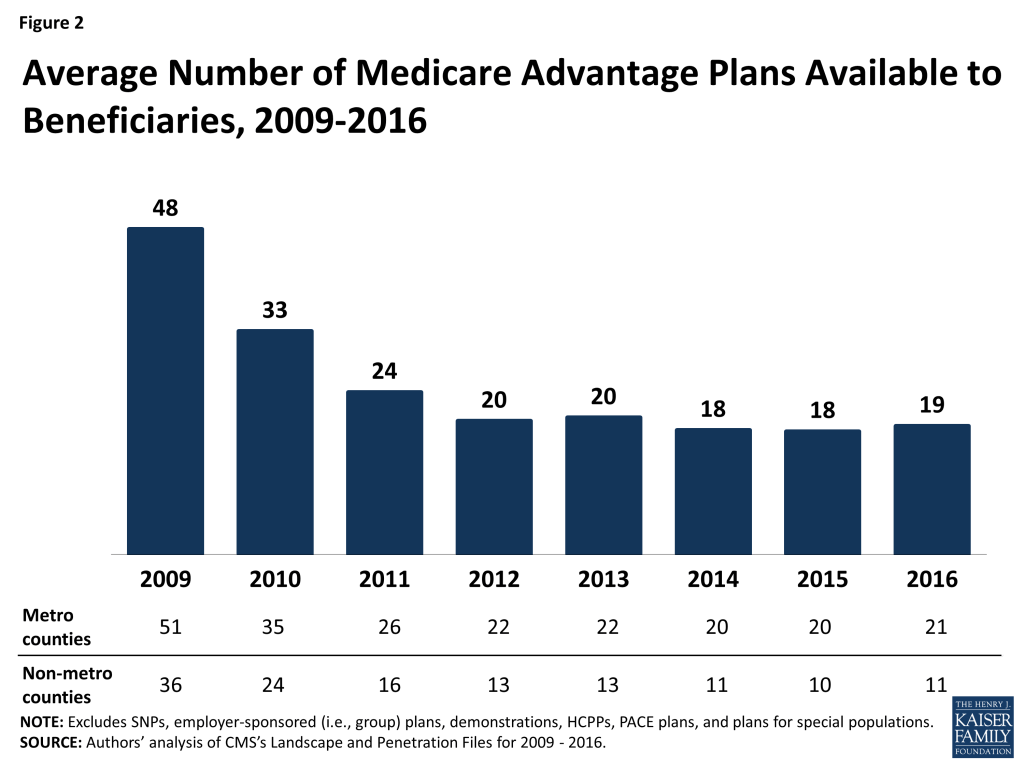
Locally, the number of plans available to Medicare beneficiaries in 2016 will not be very different from in 2015. The average beneficiary will be able to choose from among 19 plans, on average, in 2016 – as compared with 18 plans in 2015 (Figure 2). Beneficiaries in metropolitan areas will be able to choose from 21 plans, on average, and beneficiaries in non-metropolitan areas will be able to choose from 11 plans, on average, an increase of 1 plan from 2015. The average number of plans available in the lowest cost counties (i.e., lowest quartile of counties) will remain the same (15 plans) while the average number of plans available in other counties will increase by 1 plan (from 22 plans to 23 plans in the highest cost counties; Table A2).
Figure 2: Average Number of Medicare Advantage Plans Available to Beneficiaries, 2009-2016
Number of Firms Offering Medicare Advantage Plans
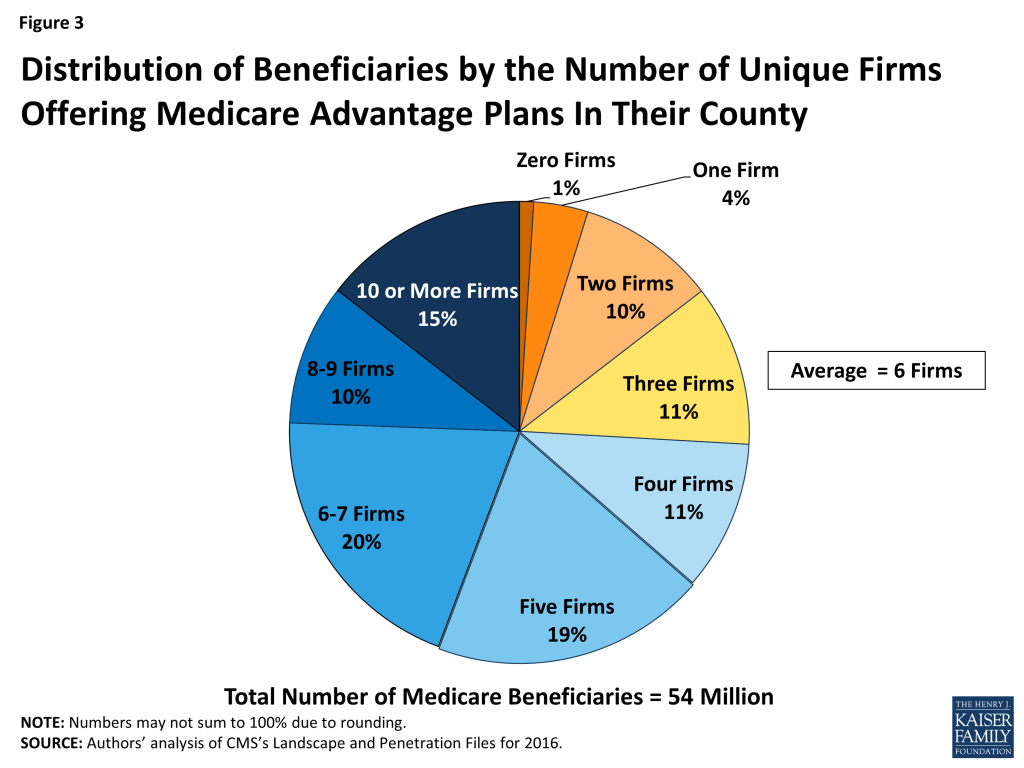
The average Medicare beneficiary will be able to choose from many plans, but in some areas, these plans will be offered by a handful of firms. The average Medicare beneficiary will be able to choose from plans offered by 6 firms, on average, in 2016, with sizeable variation across counties (Figure 3). One-quarter of beneficiaries will be able to choose from plans offered by three or fewer firms, while another quarter of beneficiaries will be able to choose from plans offered by 8 or more firms. The number of firms offering Medicare Advantage plans will be highest in the New York City area, with at least 19 firms offering plans in Bronx County, Kings County, New York County, and Queens County. In contrast, in 445 counties in 28 states accounting for 4 percent of Medicare beneficiaries, only one firm will offer Medicare Advantage plans in 2016.
Figure 3: Distribution of Beneficiaries by the Number of Unique Firms Offering Medicare Advantage Plans In Their County
Access to Medicare Advantage Plans
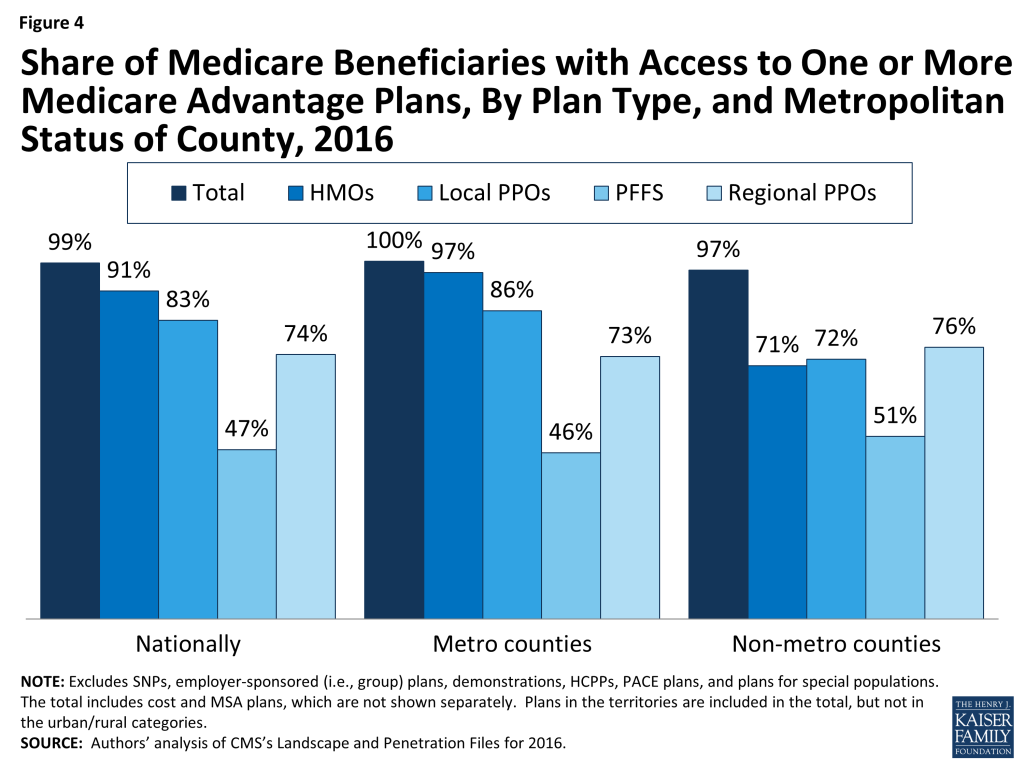
As in recent years, virtually all Medicare beneficiaries (99%) will continue to have access to a Medicare Advantage plan as an alternative to traditional Medicare (Figure 4). All beneficiaries in metropolitan areas (100%) and the vast majority of beneficiaries in non-metropolitan areas (97%) will continue to have access to at least one Medicare Advantage plan – the same percentages as in 2015. Consistent with prior years, a smaller share of beneficiaries in non-metropolitan counties than in metropolitan counties will have access to HMOs or local PPOs, although these plans will be available to at least 70 percent of beneficiaries in non-metropolitan counties.
Figure 4: Share of Medicare Beneficiaries with Access to One or More Medicare Advantage Plans, By Plan Type, and Metropolitan Status of County, 2016
Issue Brief: Plan Premiums
Premiums are the most visible and the easiest factor for beneficiaries to compare across plans. While other factors, such as limits on out-of-pocket spending, cost-sharing, prescription drugs, extra benefits, and provider networks, can have an even larger impact on beneficiaries’ out-of-pocket spending on health care and access to providers, information on them is less readily accessible and often more difficult to interpret. For cost-sharing and provider networks in particular, it is nearly impossible from publicly available data to construct an apples-to-apples comparison across plans that appropriately weights all factors. As a result, many people use the plan premiums to choose among plans.
Medicare beneficiaries enrolled in Medicare Advantage plans pay the Part B premium like other beneficiaries (less any rebate provided by the Medicare Advantage plan), and may also pay an additional monthly premium charged by the Medicare Advantage plan for benefits and prescription drug coverage. This analysis of premiums includes only Medicare Advantage plans that offer prescription drug coverage (MA-PDs). The minority of Medicare Advantage plans (13%) that do not cover prescription drugs are not included in the analysis, in order to better compare premiums across plan types and years.
Monthly Premiums (Unweighted by Enrollment)
To examine how premiums for all plans available to beneficiaries will change between 2015 and 2016, this spotlight first examines the change in premiums for all MA-PDs, without weighting them by the number of enrollees in each plan. The analysis includes plans with no premiums as well as plans with monthly premiums. In 2016, the average premium for MA-PDs (unweighted by plan enrollment) will be $53 per month – similar to 2015 (Table A3). Premiums for HMOs will average $39 per month, up $1 from 2015. Similar to prior years, HMOs will continue to have lower premiums than regional PPOs ($75 per month), local PPOs ($79 per month) and PFFS plans ($91 per month). Similar to 2015, regional PPOs will have the largest change in premiums, on average, and average premiums will increase $7, on average, from $68 per month in 2015. In contrast, premiums for local PPOs will decrease by $2, on average, from $81 per month in 2015.
Monthly Premiums (Weighted by Enrollment), Assuming Enrollees Remain in the Same Plan
To examine how premiums will change for Medicare Advantage enrollees, assuming they remain in the same plan between 2015 and 2016, this spotlight examines the premiums among MA-PDs offered in both years and weight the premiums by plan enrollment in 2015. These enrollee “weighted average” premiums are a clearer indication than unweighted premiums of the amount paid by the average Medicare Advantage enrollee because enrollment across plans is uneven. Similar to the prior analysis, this analysis includes plans with no premiums as well as plans with monthly premiums. Enrollees may be able to prevent or reduce increases in premiums by switching to another plan. After the open enrollment period, we will analyze the premiums for plans selected by all Medicare Advantage enrollees in 2016.3 In recent years, average premiums, weighted by actual enrollment, have tended to be lower than estimates of weighted premiums based on prior year enrollment. The difference reflects the net impact of beneficiaries making enrollment changes between one year and the next, and plan choices among new Medicare Advantage enrollees.
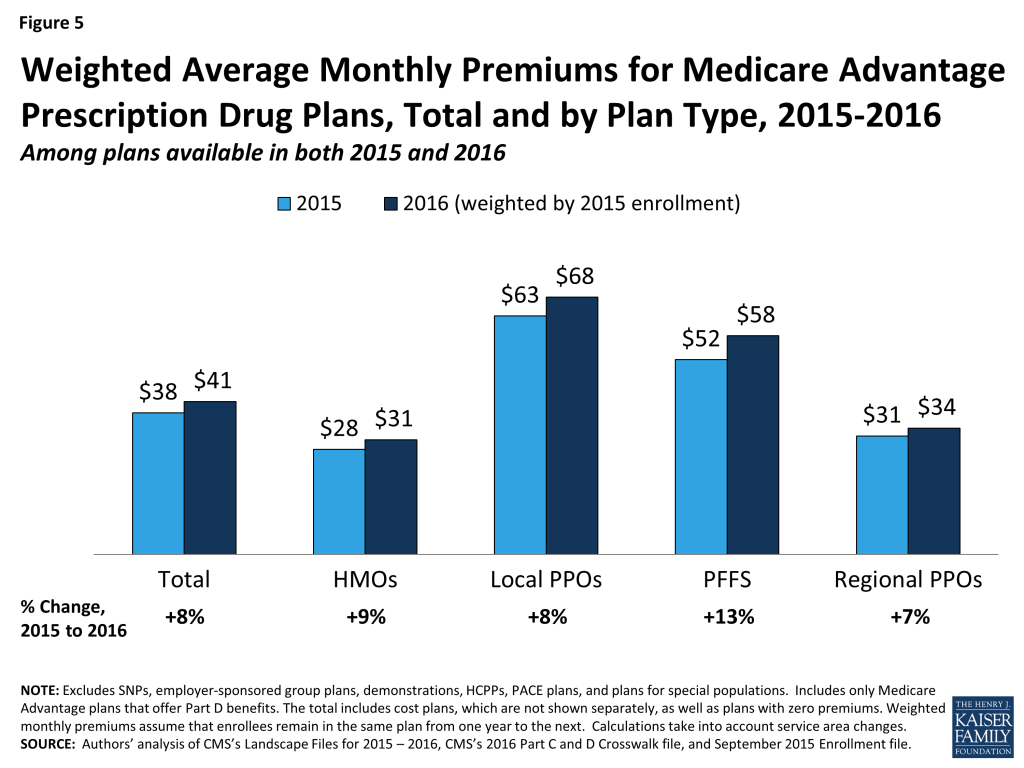
Based on plan enrollment in the Fall of 2015, the average Medicare Advantage enrollee in a plan that will continue to be offered in 2016 will pay about $41 per month, an increase of $3 per month (or 8%) compared to 2015, if they stay in the same plan (Figure 5). In percentage terms, enrollees in PFFS plans will experience a larger increase in premiums (13% on average) than enrollees in other types of Medicare Advantage plans, and average premiums for PFFS plan enrollees will rise from $52 per month to $58 per month, assuming no change in enrollment. The average increase in enrollment weighted premiums is lower than it has been since 2012 when there was a 3 percent increase. Premiums could be rising at a somewhat slower pace for many reasons including the fact that the changes in payments to plans as a result of the ACA are fully implemented in most counties. Monthly premiums, weighted for 2015 enrollment will be lower for enrollees in HMOs ($31 per month) than for enrollees in other types of Medicare Advantage plans, and higher for enrollees in local PPOs ($68 per month), on average.
Figure 5: Weighted Average Monthly Premiums for Medicare Advantage Prescription Drug Plans, Total and by Plan Type, 2015-2016
In general, enrollees in MA-PDs that will continue to be offered in 2016 had somewhat lower premiums in 2015, on average, than enrollees in plans that will be exiting the Medicare Advantage market in 2016 (Table A1). The 2015 premiums for plans remaining in the market in 2016 averaged $38 per month as compared to $41 per month for those exiting the market. However, the difference varies across plan types and these changes are difficult to interpret because plan premiums are a function of many plan-specific factors (e.g., benefits, cost-sharing, provider networks), as well regional-specific factors (e.g., local practice patterns, payments from the Medicare program).
Access to Plans with No Premium
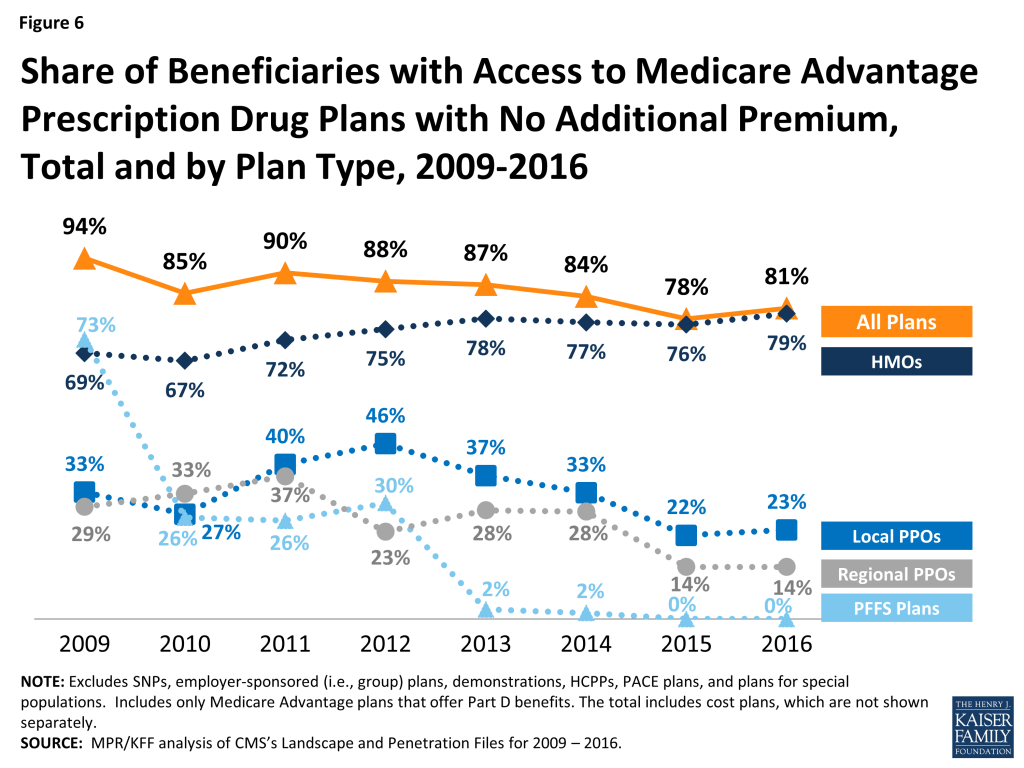
Medicare Advantage plans with no additional premium (other than the Medicare Part B premium) – so called “zero premium plans” – have been a feature of the Medicare Advantage landscape for many years. About four-fifths (81%) of all beneficiaries will have access to a zero-premium MA-PD in 2016, an increase from 78 percent in 2015 (Figure 6). The continued availability of zero-premium plans mainly reflects offerings among HMOs since zero-premium plans are less common among other plan types.
Figure 6: Share of Beneficiaries with Access to Medicare Advantage Prescription Drug Plans with No Additional Premium, Total and by Plan Type, 2009-2016
Issue Brief: Limits On Out-of-pocket Spending
People on Medicare have said that out-of-pocket spending is important to them when selecting their plan.4 Yet, it is challenging for beneficiaries to estimate their future out-of-pocket costs for all plans available in their area because it is difficult to predict their health care needs and virtually impossible to compare cost-sharing for specific services. One alternative for beneficiaries is to use the plans’ limits on out-of-pocket spending to gauge the maximum amount they could pay out-of-pocket in a plan for services covered under Medicare Part A and Part B, assuming they use only in-network providers.
The traditional Medicare program does not include a limit on out-of-pocket spending for services covered under Parts A and B, leaving beneficiaries in traditional Medicare with unlimited financial liability – an impetus for many beneficiaries to acquire supplemental coverage. In contrast, Medicare Advantage plans are required to limit enrollees’ out-of-pocket expenses for services covered under Parts A and B to no more than $6,700, with higher limits allowed for services received from out-of-network providers. Even before the 2011 implementation of this requirement, most Medicare Advantage plans (79% in 2010) voluntarily included a limit on enrollees’ out-of-pocket spending.5 CMS encourages plans to limit enrollees’ out-of-pocket expenses to no more than $3,400 per year, by allowing these plans to charge higher cost-sharing for some services. These out-of-pocket limits do not include expenses for prescription drugs covered under MA-PDs (which have separate Part D catastrophic threshold), nor do they include expenses for extra benefits or for services not covered by the plan.
Out-of-pocket limits for MA-PDs will be higher in 2016 than in 2015, on average. In 2016, two-fifths of plans (39%) will have limits equal to the maximum ($6,700), an increase from 17 percent of plans in 2013 (Figure 7). One-quarter (24%) of plans will have a limit of $3,400 or less in 2016, a sharp decline since 2013. In 2016, the average plan’s limit will be $5,257, up from $4,352 in 2013. When weighted by 2015 enrollment, out-of-pocket limits will increase by $193 between 2015 and 2016, on average (Table A1).
Figure 7: Distribution of Medicare Advantage Prescription Drug Plans’ Out-of-Pocket Spending Limits, 2011-2016
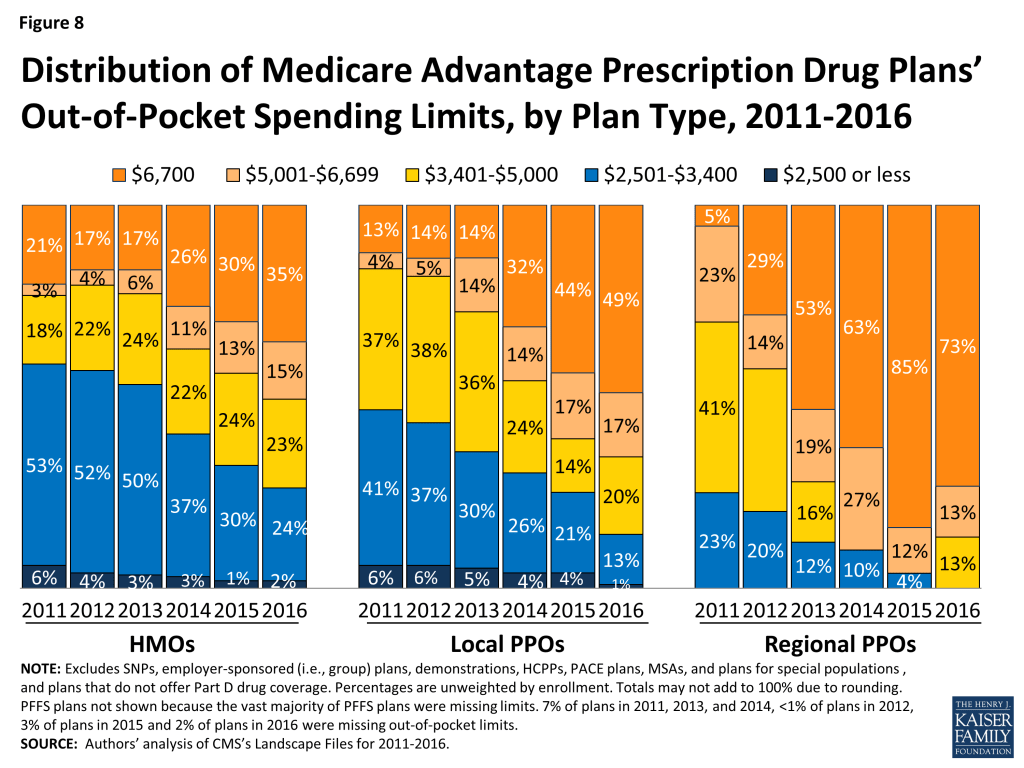
Average out-of-pocket limits are increasing across all plan types but a smaller share of HMOs than local PPOs or regional PPOs will have the maximum out-of-pocket limit allowed in 2016 (Figure 8). About three-quarters (73%) of regional PPOs, half (49%) of local PPOs, and one-third (35%) of HMOs have out of pocket limits equal to the maximum limit of $6,700. Limits at or below $3,400 now are rare in across all plan types.
Figure 8: Distribution of Medicare Advantage Prescription Drug Plans’ Out-of-Pocket Spending Limits, by Plan Type, 2011-2016
Issue Brief: Prescription Drug Coverage
In 2016, the vast majority (87%) of Medicare Advantage plans will offer prescription drug coverage. Historically, Medicare Advantage plans without a drug benefit were developed to meet the needs of beneficiaries who may have access to other sources of prescription drug coverage, such as retiree health coverage from former employers or the Veterans Health Administration, as well as those who for any other reason do not want to purchase such coverage.
Coverage of the Part D Deductible
The standard design of the drug benefit includes an initial coverage deductible which is updated each year, and is $360 in 2016. Plans can vary the benefit design as long as they provide cost-sharing that is at least actuarially equivalent to the standard benefit.
In 2016, nearly half (45%) of MA-PDs will impose a deductible for prescription drug coverage. Since 2013, the share of MA-PDs imposing a Part D deductible has increased three-fold from 14 percent to 45 percent while average MA-PD deductibles have quadrupled from $29 in 2013 to $118 in 2015 (Figure 9). Similar to 2015, 16 percent of MA-PDs will charge the maximum deductible in 2016 ($360 in 2016 compared to $320 in 2015).
Figure 9: Share of Medicare Advantage Prescription Drug Plans, by Part D Drug Coverage Deductible, 2010-2016
MA-PDs are better situated than stand-alone prescription drug plans (PDPs) to offset the costs of drugs with other benefits because they combine Part D with other Medicare-covered benefits. The use of Part D deductibles is increasing among MA-PDs, although they still are used more commonly by stand-alone PDPs. In 2016, two-thirds of PDPs will charge a deductible, and a larger share of PDPs than MA-PDs will charge the maximum amount allowed.6 Further research is needed to assess how cost sharing between MA-PDs and PDPs varies and whether the two types of plans generally include the same drugs on the same formulary tier, as this has cost implications for beneficiaries.
Coverage within the “Doughnut Hole”
The initial design of the Medicare drug benefit in 2006 included a coverage gap, or “doughnut hole,” which required beneficiaries with relatively high drug costs to pay 100 percent of their expenses in the coverage gap until they qualified for catastrophic protection. The ACA gradually closes the doughnut hole and eliminates the gap by 2020. In 2016, beneficiaries will be responsible for no more than 45 percent of the cost of brand-name drugs and 58 percent of the cost of generic drugs in the gap.
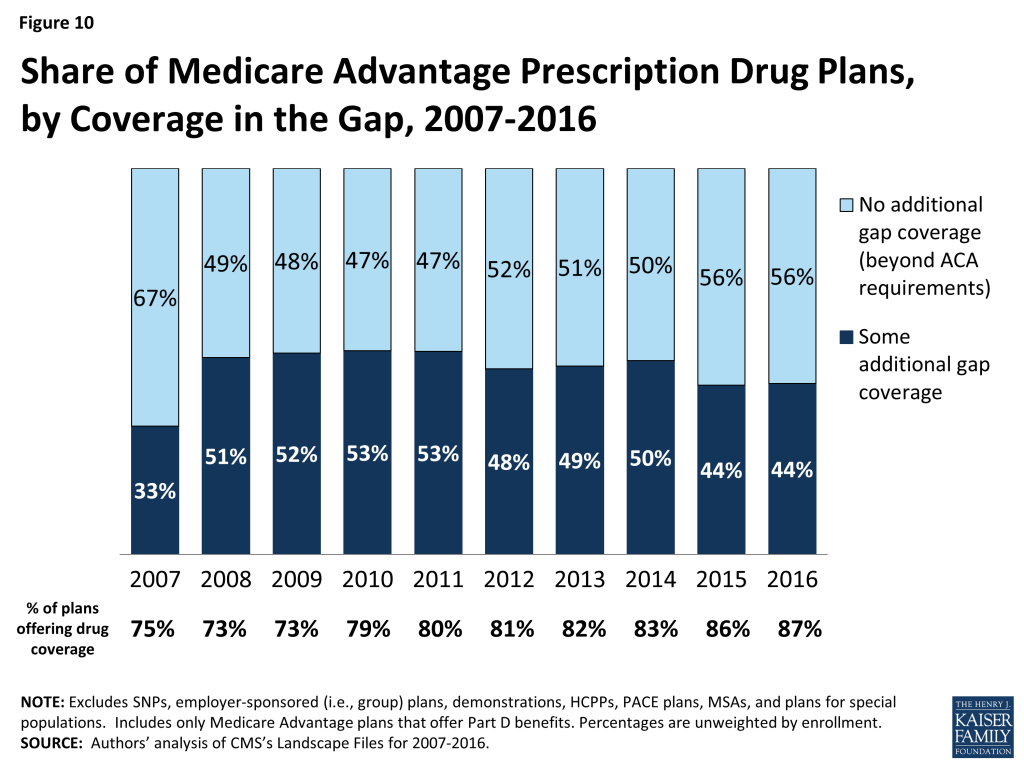
Less than half (44%) of MA-PDs will provide additional coverage in the Part D coverage gap in 2016, beyond that which is required by the ACA, similar to 2015 and down from 50 percent in 2014 (Figure 10). In contrast, less than one-quarter of PDPs offer any additional coverage in the gap.7 Little is known about the extent of additional coverage MA-PDs provide in the gap, or whether the additional coverage is for only a handful of drugs or is more extensive.
Figure 10: Share of Medicare Advantage Prescription Drug Plans, by Coverage in the Gap, 2007-2016
Issue Brief: Quality Ratings
For many years, the CMS has posted quality ratings of Medicare Advantage plans to provide Medicare beneficiaries with additional information about plans offered in their area. All Medicare Advantage plans are rated on a 1 to 5 star scale, with 1 star representing poor performance, 3 stars representing average performance, and 5 stars representing excellent performance. CMS assigns quality ratings at the contract level, rather than for each individual plan. This means that every Medicare Advantage plan covered under the same contract receives the same quality rating, and most contracts cover multiple plans.
Since 2012, Medicare Advantage plans have received bonus payments based on the quality ratings, and plans with higher ratings also receive higher rebate amounts. In 2016, plans with 4 or more stars will receive bonuses of 5 percent, and new plans and plans with low enrollment will receive bonuses of 3.5 percent; these bonus percentages are doubled in some counties.8 Additionally, beneficiaries can enroll in a plan with 5 stars at any time during the year, not just during the annual open enrollment period.
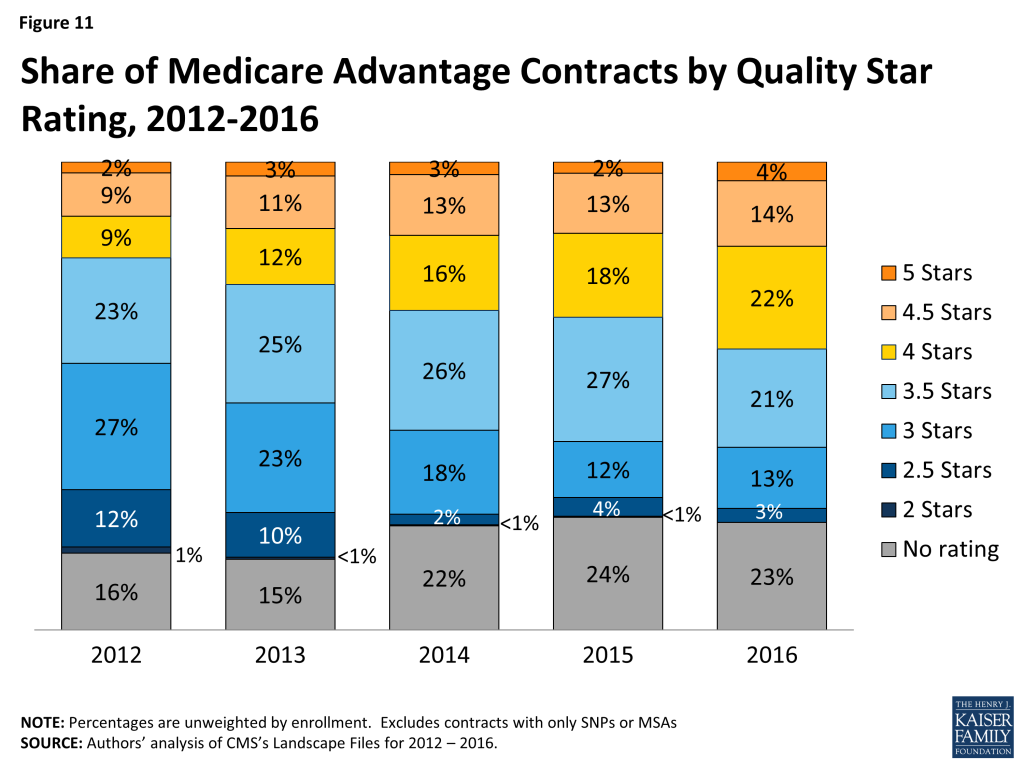
In 2016, the majority (40%) of Medicare Advantage contracts will have ratings of four or more stars – an increase from 33 percent in 2015 (Figure 11). In 2016, as in prior years, few contracts (4%) receive the top star rating (5 stars), a slight increase from 2 percent of contracts in 2015. The vast majority of Medicare beneficiaries (94%) will have access to at least one plan with four or more stars in 2016, including one-quarter (24%) of beneficiaries who will have access to a plan with five stars (data not shown).
Figure 11: Share of Medicare Advantage Contracts by Quality Star Rating, 2012-2016
Slightly more than one-third (35%) of contracts will have average ratings (3 or 3.5 stars), and 3 percent of contracts will have below average ratings (2 or 2.5 stars) in 2015; 23 percent of contracts will be too new or have too few enrollees to be rated.
Issue Brief: Market Structure: Plan Availability And Characteristics Of Plans Offered By Major Firms
While many organizations offer Medicare Advantage plans, a handful of firms and affiliates have historically accounted for the majority of all Medicare Advantage enrollment nationally. This spotlight examines trends among and across these firms and affiliates that account for large shares of Medicare Advantage enrollment nationally: UnitedHealthcare, Humana, Blue Cross and Blue Shield (BCBS) affiliated companies (including Anthem BCBS plans), Kaiser Permanente, Aetna, Cigna, and Wellcare. Together, these seven firms and affiliates accounted for almost three-quarters of all Medicare Advantage enrollment in 2015.9 The potential impact of proposed mergers between some of these large firms (Aetna’s proposed acquisition of Humana and Anthem’s proposed acquisition of Cigna) is not yet clear.
Change in Number and Availability of Plans Offered by Firm
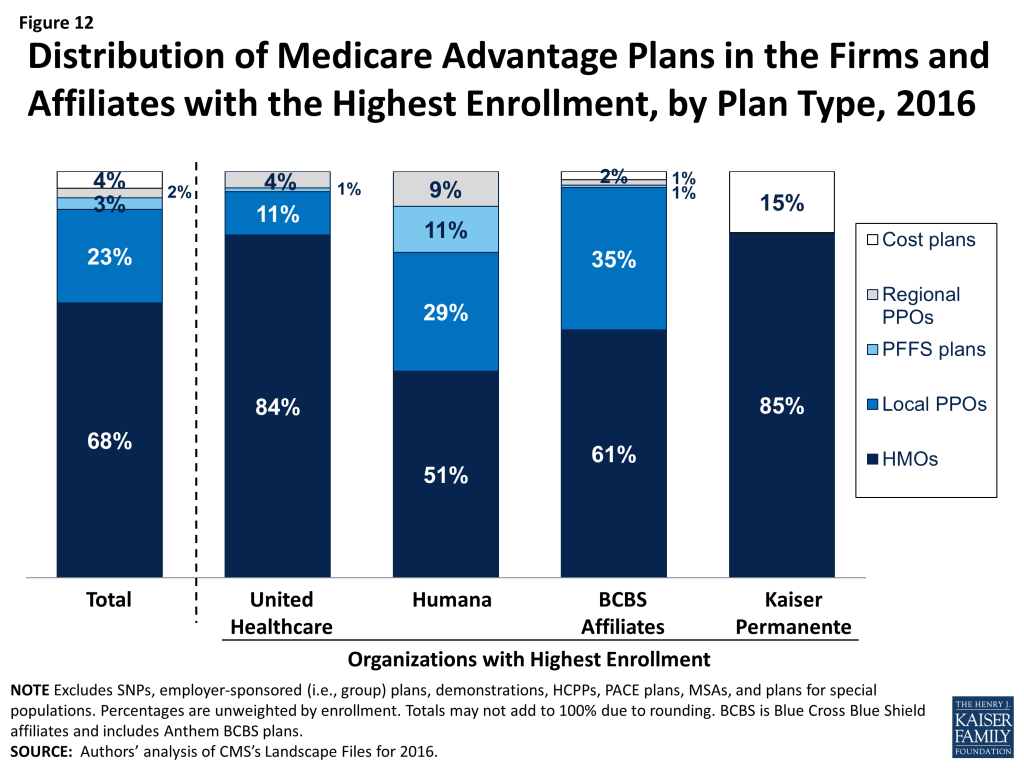
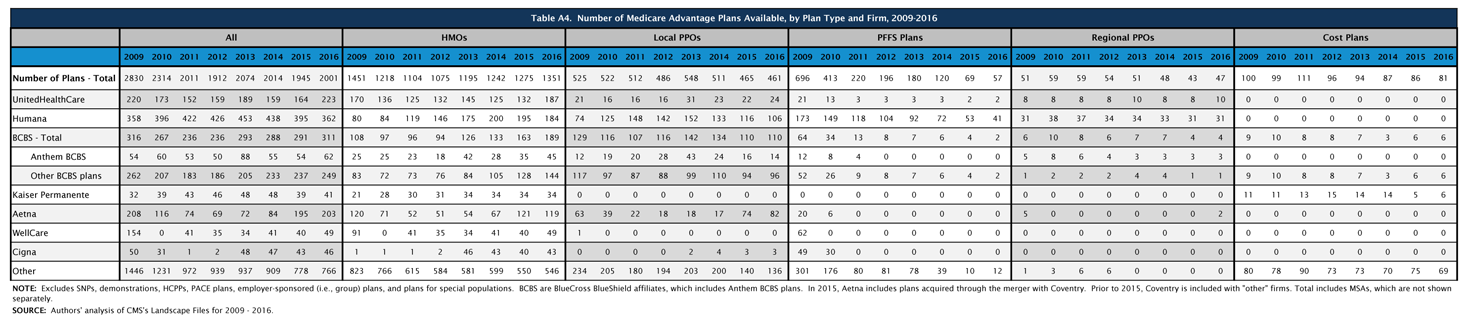
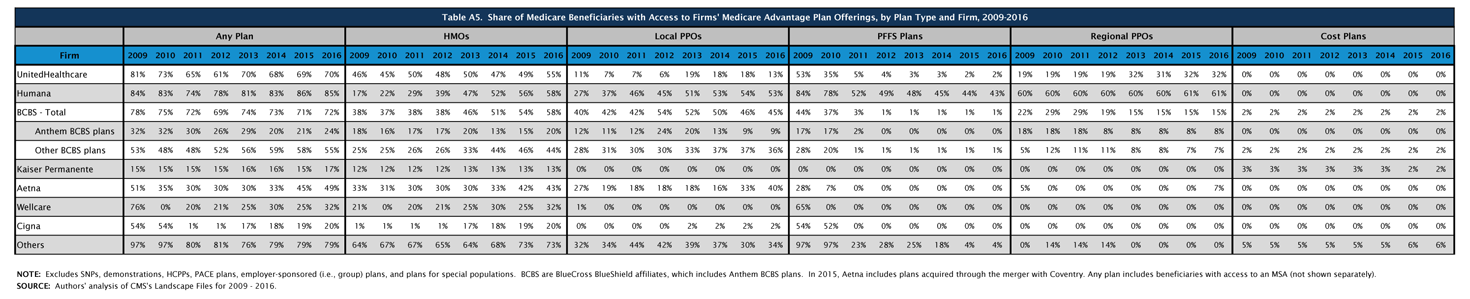
The firms and affiliates profiled in Table A4 account for 61 percent of available plans being offered in 2016 (Table A4). The types of plans offered vary across these firms and affiliates. Firm strategies are reflected both in the types of plans they offer and the share of beneficiaries to whom they are available (Figure 12; Table A5). This analysis focuses only on plans offered for broad based individual enrollment, and excludes special needs plans, employer-sponsored group plans for retirees and other types of plans only available to certain beneficiaries.
Figure 12: Distribution of Medicare Advantage Plans in the Firms and Affiliates with the Highest Enrollment, by Plan Type, 2016
UnitedHealthcare. UnitedHealthcare has historically had a large Medicare Advantage footprint and it will continue to do so in 2016. Seven in ten Medicare beneficiaries (70%) will have access to a UnitedHealthcare plan in 2016. UnitedHealthcare has historically offered a mix of plan types, but HMOs comprise the vast majority (84%) of its plan offerings, with a smaller share local PPOs (11%), regional PPOs (5%) and PFFS plans (1%). More than half of beneficiaries (55%) will have access to a UnitedHealthcare HMO in 2016, up from 50 percent of beneficiaries in 2015. Average premiums (not weighted by enrollment) in HMOs offered by UnitedHealthcare will decline between 2015 and 2016, while premiums for the firm’s local PPOs, PFFS plans, and regional PPOs will increase (Table A6). This is a slight reversal of the firm’s strategy in 2015 when it introduced premiums across most of its plans that previously had zero-premiums. In early 2015, 20 percent of Medicare Advantage enrollees were in a UnitedHealthcare plan.10
Humana. Humana also has had a large footprint in Medicare Advantage for over a decade, and Medicare Advantage likewise comprises a large share of Humana’s business. Humana will continue to offer a broader mix of plan types than any other large firm or affiliate in 2016, but the total number of plans the firm offers will decline from 395 plans to 362 plans, continuing the firm’s trend of offering fewer plans each year since 2013. Similar to prior years, about half (51%) of Humana’s plans will be HMOs, about three in ten will be local PPOs (29%), and about one in ten will be PFFS plans (11%) or regional PPOs (9%). The vast majority of Medicare beneficiaries (85%) will have access to a plan offered by Humana in 2016, similar to 2015. HMOs, local PPOs, and regional PPOs offered by Humana will be available to more than half of beneficiaries (58%, 53%, and 61%, respectively) and Humana PFFS plans will be available to more than four in ten beneficiaries (43%). Average premiums (not weighted by enrollment) for local PPOs offered by Humana will decline between 2015 and 2016, while average premiums for other plan types offered by Humana will increase, with the largest average increases in premiums among PFFS plans. In early 2015, 19 percent of Medicare Advantage enrollees were in a Humana plan.
Blue Cross and Blue Shield Affiliates (BCBS). BCBS affiliates are separate companies that do not directly compete with each other and are affiliated nationally.11 Some have converted from non-profit to for-profit status in recent years, most notably Anthem BCBS. We analyze the BCBS affiliates together because the affiliation results in some similarities in approach. In 2016, more than six in ten of BCBS affiliates’ Medicare Advantage offerings will be HMOs (61%) while 35 percent will be local PPOs. Nearly three out of four beneficiaries nationwide (72%) will have access to a BCBS affiliated plan, including almost one-quarter (24%) who will have with access to an Anthem BCBS plan and 55 percent who will have access to plans offered by other companies under the BCBS trademark. In early 2015, 3 percent of Medicare Advantage enrollees were in an Anthem plan, including Anthem BCBS plans, and another 13 percent were in plans offered by other BCBS affiliates.
Kaiser Permanente. Similar to prior years, fewer beneficiaries (17%) will have access to a Kaiser Permanente plan than other firms included in this analysis. Kaiser Permanente has historically been geographically concentrated in California, Colorado, Georgia, Hawaii, Oregon, Washington, and the metropolitan area surrounding the District of Columbia, but its plans tend to have many enrollees in the places in which it operates. In contrast to other firms, Kaiser Permanente only offers HMOs (83%) and cost plans, which are somewhat similarly structured. Only 13 percent of beneficiaries will have access to a Kaiser Permanente HMO and only 2 percent of beneficiaries will have access to a Kaiser Permanente cost plan in 2016. In early 2015, 8 percent of Medicare Advantage enrollees were in a plan offered by Kaiser Permanente.
Aetna. Aetna’s footprint in the Medicare Advantage market has expanded since its acquisition of Coventry, and will become even larger if its proposed acquisition of Humana is approved by the Department of Justice. In 2016, Aetna plans will be available to almost half (49%) of all beneficiaries, up slightly from 45 percent in 2015 and 33 percent in 2014 prior to the acquisition of Coventry. Between 2015 and 2016, Aetna will increase the number of local PPOs it offers, rising from 74 plans in 2015 to 82 plans in 2016. Accordingly, a larger share of beneficiaries will have access to an Aetna local PPO (40%) in 2016, up from one-third (33%) of beneficiaries in 2015. Beginning in 2016, Aetna will begin offering regional PPOs in New Jersey and Ohio, and 7 percent of beneficiaries nationwide will have access to these new regional PPOs in 2016. In prior years, the only firms and affiliates that offered regional PPOs were UnitedHealthcare, Humana, and BCBS affiliates. In early 2015, 7 percent of Medicare Advantage enrollees were in a plan offered by Aetna.
Other Firms. About one-third (32%) and one-fifth (20%) of beneficiaries will have access to a plan offered by Wellcare and Cigna, respectively. Both firms heavily emphasize HMOs, with Wellcare exclusively offering HMOs and Cigna offering predominantly HMOs. Wellcare will increase the number of HMOs it offers from 40 plans in 2015 to 49 plans in 2016; Cigna will slightly increase the number of HMOs it offers by 3 plans, increasing from 40 plans in 2015 to 43 plans in 2016.
Beyond these firms, many other firms and organizations sponsor Medicare Advantage plans, usually in limited geographical markets. Taken together, these firms provide plan options to 79 percent of beneficiaries.
Issue Brief: Discussion
Plan choices for beneficiaries will be relatively stable between 2015 and 2016, with very little change in the number or type of plans available to beneficiaries or the firms offering those plans. In 2016, there will be relatively few plan exits that could cause disruption in coverage. Firms continue to offer diverse products and most beneficiaries have a choice of HMOs and PPOs, while fewer beneficiaries have access to PFFS plans. Medicare Advantage plans’ low premiums (relative to Medigap) and their ability to package traditional Part A and B benefits, prescription drugs, and some aspects of supplemental coverage into a single offering have proven popular both with insurers and a sizeable subgroup of Medicare beneficiaries.
Medicare beneficiaries enrolling in a Medicare Advantage plan will find that the plans available to them, on average, have somewhat higher quality ratings in 2016 than in 2015 but provide less financial protection with higher out-of-pocket costs. While premiums are rising at a somewhat slow rate, a higher share of plans will set their out-of-pocket limit for Part A and B benefits at the maximum amount allowed ($6,700), with few plans setting the limit at the lower standard encouraged by CMS ($3,400). Additionally, more plans are requiring enrollees to pay a deductible for Part D drugs, exposing Medicare beneficiaries with relatively high health care costs to greater financial risk. The reality is that both traditional Medicare and Medicare Advantage plans face challenges in providing financial protection to beneficiaries, in that traditional Medicare does not have an out-of-pocket limit for Part A and Part B covered services.
The Department of Justice is considering proposed mergers among some of the leading national firms in the Medicare Advantage market—Aetna’s proposed acquisition of Humana and Anthem’s proposed acquisition of Cigna. While the four firms’ products differ from one another, their combined share of the Medicare Advantage market means that the acquisitions could have important implications for the Medicare Advantage program. Aetna and Humana together account for about one-quarter (26%) of all Medicare Advantage enrollees, while Anthem and Cigna together account for about six percent of all enrollees in 2015.12
The potential effect of the proposed acquisitions on Medicare beneficiaries is not yet clear. For the individual Medicare Advantage market which we focus on here, mergers may affect the number of plan choices available to beneficiaries if the merging firms decide to consolidate plans, but divestiture requirements could offset some of this reduction. Mergers could also reduce the number of different firms offering plans and competing for enrollees, and this effect is likely to vary across the country. While the average beneficiary in 2016 will have plan choices offered by six firms, one-quarter of all beneficiaries in 2016 will have only three firms competing for their business. While mergers will affect the national marketplace, they also have very specific effects on individual markets that require analysis that anticipates the potential short and long term consequences, as well as any related effects on the characteristics of plans that are offered, and implications for beneficiaries’ costs and access.13
Gretchen Jacobson, Tricia Neuman, and Giselle Casillas are with the Kaiser Family Foundation; Anthony Damico is an independent consultant; and Marsha Gold is a Senior Fellow Emeritus with Mathematica Policy Research and independent consultant.
Appendix
Box 1: Availability of Special Needs Plans in 2016
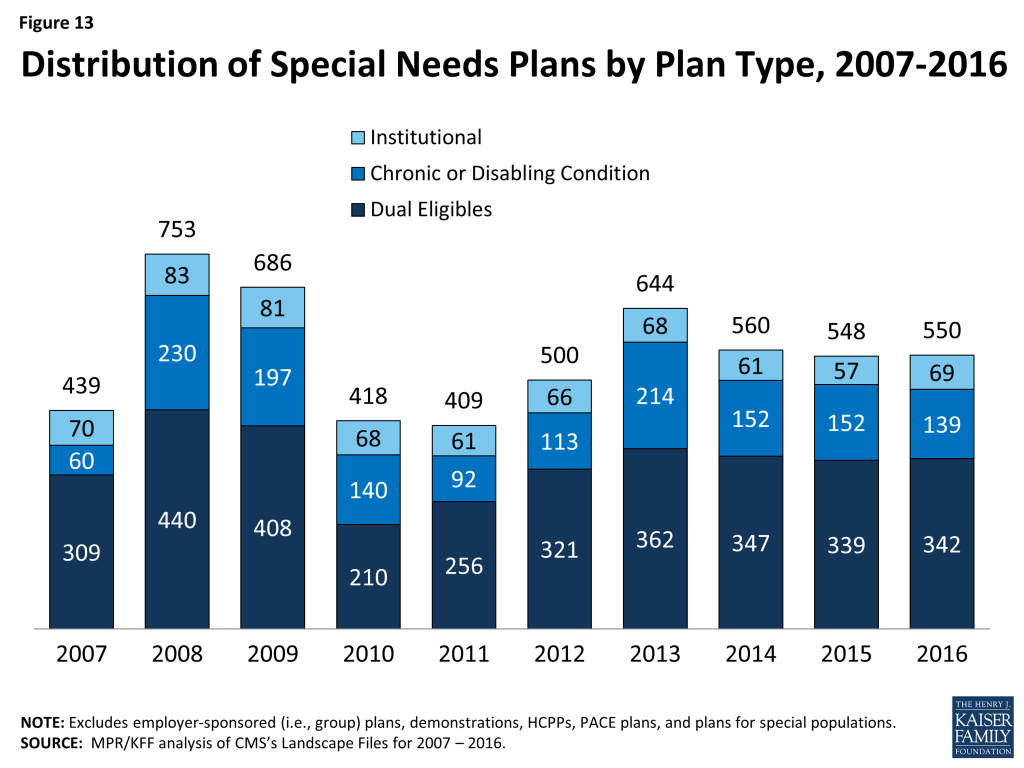
Special Needs Plans (SNPs) are a type of Medicare Advantage plan that was authorized in 2003 as part of the Medicare Prescription Drug, Improvement and Modernization Act (MMA) to provide a managed care option for beneficiaries with significant or relatively specialized health care needs. Medicare beneficiaries can enroll in a SNP if they are dually eligible for Medicare and Medicaid (D-SNPs), require an institutional-level of care (I-SNPs), or have a severe or chronic condition (C-SNP). Most SNPs are HMOs, but they can also be PPOs.
When SNPs were authorized, there were few requirements beyond those otherwise required of other Medicare Advantage plans. The Medicare Improvements for Patients and Providers Act (MIPPA) of 2008 established additional requirements for SNPs, including requiring all SNPs to provide a care management plan to document how care would be provided for enrollees and requiring C-SNPs to limit enrollment to beneficiaries with specific diagnoses or conditions. As a result of the MIPPA requirements, the number of SNPs declined in 2010. The ACA required D-SNPs to have a contract with the Medicaid agency for every state in which the plan operates, beginning in 2013. Additionally, in 2013, joint federal-state financial alignment demonstrations to improve the coordination of Medicare and Medicaid for dually eligible beneficiaries began to enroll beneficiaries. Today, financial alignment demonstrations are underway in 12 states: California, Colorado, Illinois, Massachusetts, Michigan, Minnesota, New York, Ohio, South Carolina, Texas, Virginia, and Washington. The financial alignment demonstrations could influence the availability of D-SNPs in these states, either increasing or decreasing the availability of SNPs, depending on the design of the demonstration.
In 2016, 550 SNPs will be available, similar to 548 plans available in 2015 (Figure 13; Table A7). The availability of SNPs will continue to vary across states in 2016, as it has in prior years. In 2016, at least one SNP of any type will be available in all states but eight (AK, IA, NE, ND, RI, SD, VT, and WY). While Montana did not have SNPs available in 2015, 1 new D-SNP will be available in Montana in 2016, and similarly while New Hampshire did not have SNPs available in 2015, 1 new I-SNP will be available in the state in 2016. In Iowa, Nebraska, and Rhode Island, SNPs were available in 2015 but will not be available in these states in 2016. As in past years, SNPs will be most numerous in selected high population states, notably Florida (94 plans), California (72 plans), and New York (53 plans).
The total number of D-SNPs will slightly increase from 339 plans to 342 plans between 2015 and 2016, with some variation across states. In Florida, the number of D-SNPs increased from 49 plans in 2015 to 58 plans in 2016. Other states will experience smaller changes in the availability of D-SNPs. Notably, states with ongoing financial alignment demonstrations to improve the coordination of Medicare and Medicaid for dual eligibles will not see large changes, if any, in the number of available D-SNPs between 2015 and 2016. The total number of C-SNPs will decline from 152 plans in 2015 to 139 plans in 2016, and the total number of I-SNPs will increase from 57 plans in 2015 to 69 plans in 2016. With the exception of Florida where the number of C-SNPs will decrease from 39 plans to 30 plans, no states will experience large changes in the availability of C-SNPs and I-SNPs between 2015 and 2016. Similar to prior years, most C-SNPs (66%) will focus on diabetes, chronic heart failure, or cardiovascular disorders.
Figure 13: Distribution of Special Needs Plans by Plan Type, 2007-2016
Table A1. Medicare Advantage Plan Market Entries and Exits, Average Monthly Premiums and Average Out-of-Pocket Spending Limits for Medicare Advantage Prescription Drug plans (MA-PDs), Weighted by 2015 Enrollment, 2015-2016
All Medicare Advantage Plans (MA-PD and MA-only plans)
All plans
HMO
Local PPO
PFFS
Regional PPO
Cost
MSA
2015 Plan Total
1,945
1,275
465
69
43
86
7
Total number of staying plans
1,742
1,151
413
55
43
79
1
Number of staying plans with no service area reductions
1,565
983
365
33
43
76
1
Number of staying plans with reduced service areas
111
64
33
14
–
–
–
Number of consolidating plans, post consolidation
66
40
15
8
–
3
–
Total number of departing plans
203
124
52
14
–
7
6
Number of plans departing due to consolidation
78
46
19
10
–
3
–
Number of terminating plans
125
78
33
4
–
4
6
Number of new plans
259
200
48
2
4
2
3
2016 Plan Total
2,001
1,351
461
57
47
81
4
Total Medicare Advantage enrollees, as of September 2015
11,637,572
7,988,548
1,991,109
249,694
995,330
400,924
11,967
Number of staying plans’ enrollees
11,309,785
7,809,203
1,865,672
239,000
995,330
399,643
937
Number of enrollees losing access to their plan
327,787
179,345
125,437
10,694
–
1,281
11,030
Average premiums of MA-PDs, weighted by 2015 enrollment
Premiums for all plans, 2015
$37.63
$27.94
$63.38
$51.75
$31.49
$110.23
N/A
Terminating plans, 2015
$40.57
$26.19
$63.41
$53.66
N/A
$58.26
N/A
Staying plans, 2015
$37.54
$27.98
$63.37
$51.67
$31.49
$110.39
N/A
2016 Premiums for remaining 2015 plans
$40.63
$30.51
$68.36
$58.14
$33.59
$116.26
N/A
Change in premiums for plans available in both 2015 and 2016
$3.09
$2.52
$4.98
$6.47
$2.10
$5.86
N/A
Share of enrollees in MA-PDs with no premiums, among plans available in both 2015 and 2016
2015
48%
59%
19%
8%
45%
1%
N/A
2016
46%
56%
19%
6%
45%
1%
N/A
Change in share of plans with no premiums
-2%
-3%
0%
-1%
0%
0%
N/A
Average premiums paid per enrollee, among MA-PDs with premiums (excluding zero premium plans) and available in both 2015 and 2016
2015
$72.25
$68.30
$77.96
$55.96
$57.47
$111.76
N/A
2016
$75.39
$69.75
$84.13
$62.02
$61.30
$117.69
N/A
Average out-of-pocket spending limits per year among MA-PDs, weighted by 2015 enrollment, among plans available in both 2015 and 2016
2015
$5,043
$4,850
$5,257
N/A
$6,651
$3,280
N/A
2016
$5,235
$5,010
$5,688
N/A
$6,619
$3,531
N/A
Change in average out-of-pocket spending limits
$193
$160
$431
N/A
-$32
$251
N/A
Total MA-PD enrollees, as of September 2015
11,038,587
7,819,071
1,956,315
173,839
889,195
200,167
–
Number of staying MA-PDs’ enrollees
10,729,142
7,644,846
1,831,671
164,544
889,195
198,886
–
Number of enrollees losing access to their MA-PD
309,445
174,225
124,644
9,295
–
1,281
–
NOTE: Excludes Special Needs Plans (SNPs), demonstrations, Health Care Prepayment Plans (HCPPs), Program of All Inclusive Care for the Elderly (PACE) plans, employer-sponsored (i.e., group) plans, and plans for special populations.SOURCE: Authors’ analysis of CMS’s Landscape Files for 2015 and 2016 and CMS’s 2015 and 2016 Part C and D Crosswalk file and September 2015 enrollment.
Table A2. Average Number of Plans Available to Beneficiaries by County of Residence, 2009-2016
2009
2010
2011
2012
2013
2014
2015
2016
National Average
48
33
24
20
20
18
18
19
Metro counties
51
35
26
22
22
20
20
21
Non-metro counties
36
24
16
13
13
11
10
11
Fee-for-Service Costs, by Quartile
Lowest cost quartile
45
28
18
17
17
17
15
15
Second quartile
46
31
20
17
16
15
14
15
Third quartile
44
30
20
17
18
16
16
17
Highest cost counties
53
37
30
24
24
21
22
23
NOTE: Excludes SNPs, employer-sponsored (i.e., group) plans, demonstrations, HCPPs, PACE plans, and plans for special populations.SOURCE: Authors’ analysis of CMS’s Landscape and Penetration Files for 2009 – 2016.
Table A3. Unweighted Average Monthly Premiums for Medicare Advantage Prescription Drug Plans, by Plan Type, 2009-2016
2009
2010
2011
2012
2013
2014
2015
2016
Change, 2015-2016
All Plans
$51.81
$55.86
$50.61
$49.80
$51.43
$51.47
$53.42
$52.57
-$0.85
HMOs
$34.52
$40.11
$36.24
$33.20
$34.11
$35.37
$38.28
$39.14
$0.86
Local PPOs
$65.12
$70.17
$65.72
$69.14
$72.57
$74.92
$81.02
$78.61
-$2.41
PFFS plans
$74.46
$75.09
$65.79
$70.96
$83.29
$90.93
$87.86
$91.40
$3.54
Regional PPOs
$55.68
$59.29
$53.38
$55.64
$56.89
$59.30
$67.85
$74.93
$7.08
NOTE: Excludes SNPs, demonstrations, HCPPs, PACE plans, employer-sponsored (i.e., group) plans, and plans for special populations. Premiums include plans with premiums as well as plans with no premiums. Cost plans are included in the total but are not shown separately.SOURCE: Authors’ analysis of CMS’s Landscape Files for 2009-2016.
Table A4.Number of Medicare Advantage Plans Available, by Plan Type and Firm, 2009-2016
click on table to enlarge
Table A5.Share of Medicare Beneficiaries with Access to Firms’ Medicare Advantage Plan Offerings, by Plan Type and Firm, 2009-2016
click on table to enlarge
Table A6. Unweighted Average Monthly Premiums for Medicare Advantage Prescription Drug Plans, by Plan Type and Firm, 2015 and 2016
2015
2016
All
HMOs
Local PPOs
PFFS Plans
Regional PPOs
Cost Plans
All
HMOs
Local PPOs
PFFS Plans
Regional PPOs
Cost Plans
All Plans Combined
$53.42
$38.28
$81.02
$87.86
$67.85
$141.09
$52.57
$39.14
$78.61
$91.40
$74.93
$146.14
UnitedHealthCare
$26.59
$26.23
$29.62
$43.00
$20.17
N/A
$26.37
$24.68
$35.91
$50.00
$32.25
N/A
Humana
$47.42
$18.73
$73.09
$93.90
$87.29
N/A
$46.90
$19.99
$71.44
$99.58
$88.88
N/A
BCBS – Total
$76.14
$50.34
$108.93
$41.95
$53.03
$108.40
$70.64
$49.55
$103.87
$56.48
$56.97
$102.27
Anthem BCBS
$37.94
$12.14
$80.75
N/A
$61.50
N/A
$37.48
$19.45
$78.44
N/A
$65.50
N/A
Other BCBS plans
$85.57
$61.39
$114.35
$41.95
$36.10
$108.40
$79.41
$59.21
$108.59
$56.48
$39.90
$102.27
Kaiser Permanente
$48.86
$47.50
N/A
N/A
N/A
$72.00
$52.92
$52.50
N/A
N/A
N/A
$57.67
Aetna
$37.68
$31.34
$47.46
N/A
N/A
N/A
$43.01
$33.86
$52.90
N/A
$154.00
N/A
WellCare
$7.10
$7.10
N/A
N/A
N/A
N/A
$5.60
$5.60
N/A
N/A
N/A
N/A
CIGNA
$23.89
$23.34
$33.75
N/A
N/A
N/A
$28.24
$27.96
$33.75
N/A
N/A
N/A
Other
$61.72
$49.11
$90.15
$64.40
N/A
$148.04
$62.90
$51.58
$87.25
$76.94
N/A
$160.33
NOTE: Excludes SNPs, demonstrations, HCPPs, PACE plans, employer-sponsored (i.e., group) plans, and plans for special populations. BCBS are BlueCross BlueShield affiliates, which includes Anthem BCBS plans. In 2015, Aetna includes plans acquired through the merger with Coventry. Premiums include plans with premiums as well as plans with no premiums. N/A indicates plan not available.SOURCE: Authors’ analysis of CMS’s Landscape Files for 2015 and 2016.
Table A7. Number and Type of Special Needs Plans, by State, 2015 and 2016
2015
2016
State
Overall
Dual eligibles
Institutional
Chronic conditions
Overall
Dual eligibles
Institutional
Chronic conditions
Alabama
5
4
1
0
6
4
2
0
Alaska
0
0
0
0
0
0
0
0
Arizona
34
22
2
10
33
21
4
8
Arkansas
8
5
0
3
7
4
0
3
California
69
29
2
38
72
31
4
37
Colorado
8
4
3
1
9
4
3
2
Connecticut
3
2
1
0
4
2
2
0
Delaware
4
1
2
1
3
1
1
1
District of Columbia
7
3
2
2
5
2
1
2
Florida
92
49
4
39
94
58
6
30
Georgia
16
10
2
4
14
8
2
4
Hawaii
4
4
0
0
5
5
0
0
Idaho
1
1
0
0
1
1
0
0
Illinois
10
6
1
3
10
5
2
3
Indiana
8
3
1
4
8
4
2
2
Iowa
3
1
0
2
0
0
0
0
Kansas
2
0
1
1
2
0
1
1
Kentucky
10
6
0
4
13
8
1
4
Louisiana
14
10
0
4
13
9
0
4
Maine
3
3
0
0
4
2
1
1
Maryland
9
2
3
4
10
3
3
4
Massachusetts
10
6
3
1
9
7
1
1
Michigan
12
8
3
1
6
4
1
1
Minnesota
9
9
0
0
9
9
0
0
Mississippi
8
6
0
2
6
4
0
2
Missouri
10
4
2
4
12
3
5
4
Montana
0
0
0
0
1
1
0
0
Nebraska
1
0
0
1
0
0
0
0
Nevada
6
0
0
6
7
0
1
6
New Hampshire
0
0
0
0
1
0
1
0
New Jersey
8
3
4
1
9
4
3
2
New Mexico
7
4
2
1
3
2
1
0
New York
56
40
10
6
53
37
11
5
North Carolina
11
6
1
4
14
7
2
5
North Dakota
0
0
0
0
0
0
0
0
Ohio
18
11
3
4
18
11
4
3
Oklahoma
1
0
1
0
1
0
1
0
Oregon
12
7
4
1
11
7
3
1
Pennsylvania
21
10
6
5
21
11
6
4
Puerto Rico
16
12
0
4
15
13
0
2
Rhode Island
1
0
1
0
0
0
0
0
South Carolina
8
3
1
4
8
3
1
4
South Dakota
0
0
0
0
0
0
0
0
Tennessee
7
6
1
0
8
7
1
0
Texas
31
21
3
7
31
22
2
7
Utah
2
2
0
0
2
2
0
0
Vermont
0
0
0
0
0
0
0
0
Virginia
11
2
4
5
9
2
3
4
Washington
6
5
1
0
8
6
2
0
West Virginia
1
1
0
0
1
1
0
0
Wisconsin
19
15
3
1
18
13
4
1
Wyoming
0
0
0
0
0
0
0
0
Total, U.S.
548
339
57
152
550
342
69
139
NOTE: Columns do not sum to U.S. total because some SNPs overlap state boundaries.SOURCE: Authors’ analysis of CMS’s Landscape Files for 2015-2016.
Blue Cross and Blue Shield Association. 2015 Medicare Advantage and Prescription Drug Plans Offered by Blue Cross and Blue Shield Affiliated Companies, Updated January 2015. http://www.bcbs.com/about-the-companies/↩︎
In thousands of medically underserved communities across the U.S., community health centers enroll low-income people in health coverage and provide care to millions of patients. Against the backdrop of significant health center expansion over several years and a full year of expanded health coverage under the Affordable Care Act (ACA), this brief examines change between 2013 and 2014 in the volume and health coverage profile of health center patients, and health center enrollment activities and service capacity, comparing states that implemented the ACA Medicaid expansion in 2014 and states that did not expand Medicaid in 2014. The study is based on 2014 data from the federal Uniform Data System and a 2014 national survey of health centers.
Several key findings emerged from the analysis:
In 2014, health centers served 22.5 million patients – an increase of nearly 1.2 million patients over 2013. From 2013 to 2014, the number of health center patients covered by Medicaid rose by 1.85 million, or 22%.
Between 2013 and 2014, the share of health center patients covered by Medicaid rose from 40% to 46%, the share with private insurance rose from 14% to 16%, and the share who were uninsured declined from 35% to 28%.
Changes in health center patient coverage were sharply different between Medicaid expansion and non-expansion states (Figure ES-1). In expansion states, the share of patients with Medicaid rose by 20% and the share who were uninsured fell by 29%. In non-expansion states, the share with Medicaid rose by 3% and the share who were uninsured fell by 8%. Private coverage rates remained low in both groups of states because most health center patients have income below the poverty level and are thus ineligible for Marketplace subsidies.
During the first ACA open enrollment period, the vast majority of all health centers provided Medicaid application assistance, but expansion states were more likely to assist with renewing Medicaid and selecting Medicaid plans, while non-expansion states were more likely to assist with Marketplace applications and Qualified Health Plan selection.
Health centers in expansion states were significantly more likely than those in non-expansion states to report having expanded their capacity for dental and mental health services since the start of 2014. They were also more likely to report increased wait times for appointments, possibly reflecting greater increases in demand for services associated with larger gains in coverage among health center patients in these states.
Figure ES-1: Health Insurance Coverage of Health Center Patients, 2013 and 2014
Issue Brief
Introduction
Community health centers play a major role in providing health care for millions of people who reside in areas designated by the federal government as medically underserved, based on high rates of poverty and infant mortality and other measures of health care need.1 In 2014, 1,249 community health centers in the 50 states and DC served nearly 22.5 million people.2 Another 81“look-alike” health centers, which meet all health center requirements but receive no federal funding, served nearly 900,000 additional patients.3 Health center patients are much more likely to be poor or low-income than Americans overall, and they are much more likely to be uninsured.4 Six in ten health center patients are nonelderly adults – a population largely excluded from Medicaid before the ACA.
The ACA expanded Medicaid eligibility to nonelderly adults up to 138% of the federal poverty level (FPL) and provided income-related subsidies for the purchase of private insurance through new Marketplaces for people with income between 100% and 400% FPL. Both these new avenues of coverage, but particularly the Medicaid expansion, have the potential to lower the uninsured rate among health center patients, a largely low-income population. Following the Supreme Court ruling that effectively made the Medicaid expansion to adults optional for states, many, but not all, states implemented it. In states that did not expand Medicaid, adults with incomes between 100% and 138% FPL are eligible for Marketplace subsidies. But in these states, many adults below 100% FPL fall into a coverage gap because they are above the Medicaid income cut-off in their state but below the income eligibility threshold for Marketplace subsidies. In Medicaid expansion states, there is a continuum of coverage options for low-income adults, with Medicaid for those up to 138% FPL and Marketplace subsidies for those with higher income.
The ACA coverage expansions have important implications for health centers, which anchor health care in underserved communities, providing comprehensive primary care, case management, and enabling services such as medical transportation, and serving as an entry point for access to more specialized care. In addition, health centers have experience providing onsite outreach and enrollment assistance to uninsured patients who may be eligible for Medicaid or other coverage. During the first ACA open enrollment period, health centers provided enrollment assistance to more than 10 million people.5
To investigate and compare the historical and recent experience of health centers in Medicaid expansion and non-expansion states, the Kaiser Family Foundation and the Geiger Gibson RCHN Community Health Foundation Research Collaborative at George Washington University’s Milken Institute School of Public Health used federal data to assess changes in health center patient volume and insurance coverage in the two groups of states. Findings from a nationwide survey of health centers, fielded in Fall 2014, provide insight into additional differences between health center experiences in Medicaid expansion and non-expansion states, related to their enrollment assistance efforts and service capacity. This survey followed on a Fall 2013 survey to assess health centers’ outreach and enrollment activities on the eve of the first year of ACA coverage expansions.6
Data and Methods
We analyzed data from the federal Uniform Data System (UDS), into which all health centers report annually, to assess growth in the volume of health center patients between 2013 and 2014 and over the 2004-2014 decade; 2014 UDS data became available for analysis in late August 2015. We also used UDS data to examine 2013-2014 changes in the health coverage profile of health center patients overall and separately in Medicaid expansion and non-expansion states.7
We used data from the 2014 Follow-up Survey of Health Centers’ Outreach and Enrollment Activities to analyze health centers’ enrollment assistance activities during the first ACA open enrollment period (October 1, 2013 through March 31, 2014); major barriers to their current enrollment efforts; and increases in selected measures of service capacity since January 1, 2014. We emailed the survey between late September and November 2014 to all health centers listed in the 2013 UDS (2014 UDS data were not yet available). A total of 6798 health centers in all 50 states and DC responded, yielding an overall response rate of 57%; the response rate was 50% or higher in 44 states and DC, and the lowest rate in any state was 40%. The survey responses were almost evenly distributed between the Medicaid expansion states (including DC) (n=364) and the non-expansion states (n=315). To adjust for observed differences between respondents and non-respondents, we weighted the survey data by total health center patients, the proportion reported as racial/ethnic minorities, and total revenue per patient, using the 2014 UDS data.
Figure 1: Status of State Medicaid Expansion Decisions, 2014
To investigate differences between the experiences of health centers in Medicaid expansion and non-expansion states, we sorted the UDS and survey data based on the Medicaid expansion status of the state in which the health center grantee was located. In most of our analyses, we counted states as Medicaid expansion states if they implemented the expansion at any time during 2014 (Figure 1). However, in our analysis of health center enrollment activities during the first ACA open enrollment period, we counted states as expansion states only if their Medicaid expansion was in effect on January 1, 2014. Therefore, two states that expanded Medicaid later in 2014 (Michigan and New Hampshire) were considered non-expansion states for this purpose.9
Findings
The number of people served by health centers and the number covered by Medicaid both grew substantially from 2013 to 2014.
In 2014, health centers served 22.5 million patients, an increase of 1.2 million patients over 2013. Over the course of the decade 2004-2014, the number of health centers rose by more than one-third, from 887 to 1,249, and the volume of patients served by health centers nearly doubled (Figure 2).
Figure 2: Health Center Patient Volume, 2004-2014
Between 2013 and 2014, the number of health center patients with Medicaid coverage rose by 1.85 million, or 22%. Over the decade 2004-2014, the number of health center patients covered by Medicaid more than doubled, rising from 4.4 million to 10.4 million. The Medicaid increase during the decade is attributable to multiple factors, including the impact of demographic, programmatic, and economic changes (e.g., population growth, state Medicaid eligibility policies, and the 2007-2009 economic recession). It is also attributable to the ACA Medicaid expansion in states that chose to implement it.
health coverage among health center patients changed markedly between 2013 and 2014, the year the ACA Coverage expansions took effect.
The share of health center patients with Medicaid increased sharply. From 2013 to 2014, the first year the Medicaid expansion was in effect in the states that adopted it, the share of health center patients with Medicaid grew by 15%, from 40% to 46% (Figure 3). To put this one-year increase in perspective, the average annual increase share of health center patients with Medicaid during the 10-year period 2004-2014 was 3% (data not shown).
Figure 3: Health Insurance Coverage of Health Center Patients, 2013 and 2014
The uninsured rate among health center patients declined sharply. The uninsured rate among health center patients declined by 20% between 2013 and 2014, dropping from 35% to 28%. Once more, for perspective, the average annual decline in the uninsured rate among health center patients over 2004-2014 was approximately 3.5%.
The share of health center patients with private insurance increased, but remained small. The share of health center patients with private coverage rose from 14% to 16% between 2013 and 2014. The private coverage rate among health center patients remains low due to health center patients’ low income, lack of access to employer-sponsored insurance, and limited access to subsidies for Marketplace coverage.
health center patients’ coverage profile is different in medicaid expansion versus non-expansion states.
Even before the ACA Medicaid expansion took effect in 2014, Medicaid coverage rates were higher and uninsured rates were lower in the expansion states than in the non-expansion states. In 2013, 44% of health center patients were covered by Medicaid in states that expanded Medicaid in 2014, compared to 33% of health center patients in the states that did not expand Medicaid. At least in part, this difference reflects higher pre-ACA Medicaid eligibility in the expansion states. In 2013, the median Medicaid income eligibility threshold for adults with dependent children was 106% FPL in states that expanded Medicaid in 2014, but just 48% FPL in states that did not expand Medicaid.10
Between 2013 and 2014, the Medicaid coverage rate among health center patients increased much more in Medicaid expansion states than non-expansion states, and to a higher level. In the 2013-2014 timeframe, the share of health center patients covered by Medicaid rose by 20%, from 44% to 53%, in the expansion states. In the non-expansion states, the share with Medicaid rose by 3%, from 33% to 34% (Figure 4).
Figure 4: Percentage Change in Share of Health Center Patients, by Coverage Type and State Medicaid Expansion Status, 2013-2014
The share of health center patients with private insurance grew more in Medicaid non-expansion than expansion states, but remained low even in non-expansion states. Between 2013 and 2014, private coverage among health center patients increased from 15% to 17% in the non-expansion states and from 14% to 15% in the Medicaid expansion states. While small, the increase indicates that some patients who obtain private insurance continue to rely on health centers for care. Still, the relatively small share of health center patients with private coverage even in non-expansion states indicates that Marketplace subsidies have limited potential as a coverage pathway for the health center patient population – a large majority of health center patients (71%) have incomes below 100% FPL, making them ineligible for Marketplace subsidies.11
The uninsured rate among health center patients declined much more in the Medicaid expansion states, and the gap between expansion and non-expansion states widened. Between 2013 and 2014, the uninsured rate for health center patients in expansion states fell by 29%, from 32% to 22%; it fell by 8%, from 41% to 38%, in non-expansion states. In short, for health center patients, insurance coverage in non-expansion states fell even further behind coverage in expansion states. In expansion states, there is a continuum of coverage options for low-income adults, with Medicaid eligibility for those up to 138% FPL and Marketplace subsidies for those with income above that level. On the other hand, in non-expansion states, many uninsured adults below poverty remain in a coverage gap, largely excluded from Medicaid in their states but also ineligible for Marketplace subsidies.12
Health Centers in Medicaid Expansion and Non-expansion States Invest Differently in Enrollment Assistance.
During the first ACA open enrollment period, health centers in Medicaid expansion states were more likely than those in non-expansion states to provide Medicaid enrollment assistance. All health centers received federal grants to provide outreach and enrollment assistance during the first ACA open enrollment period (October 1, 2013 – March 31, 2014). In the health center survey, more than 80% of health centers in both Medicaid expansion and non-expansion states reported providing assistance with Medicaid applications during this first open enrollment period. However, health centers in expansion states were significantly more likely than those in non-expansion states to assist patients with Medicaid renewal (78% vs. 66%) and Medicaid plan selection (69% vs. 49%) (Table 1).
Health centers in non-expansion states were more likely than those in expansion states to provide Marketplace enrollment assistance. By a small but statistically significant increment, a larger share of health centers in non-expansion states provided assistance with applications for Marketplace subsidies in the first ACA open enrollment period, compared to health centers in Medicaid expansion states (94% vs. 89%). Health centers in non-expansion states were also significantly more likely to provide assistance with a Qualified Health Plan selection compared to health centers in expansion states (87% vs. 79%). Precluded from securing Medicaid for most of their poorest uninsured patients, health centers in non-expansion states may have been more inclined to invest in assistance to help those with income of at least 100% FPL obtain coverage through the Marketplace.
Table 1: Enrollment Assistance Provided by Health Centers During the First ACA Open Enrollment Period
Medicaid expansion states
Medicaid non-expansion states
Medicaid assistance
Assistance with Medicaid/CHIP applications
86.9%
81.7%
Assistance with Medicaid renewals
78.4%
66.5%*
Assistance with Medicaid plan selection
69.2%
48.8%*
Marketplace assistance
Assistance with Marketplace applications
88.5%
94.2%*
Assistance with Qualified Health Plan selection
78.7%
87.1%*
NOTE: For this analysis, Michigan and New Hampshire were counted as non-expansion states because their Medicaid expansion was not effective January 1, 2014.
*Difference from Medicaid expansion states is significant at p<.05.
Health centers in Medicaid Expansion and Non-expansion States Report Some Common and Some Different major Barriers to Current Enrollment Activities.
Among health centers in non-expansion states, the state decision not to expand Medicaid was, by far, the most frequently reported major barrier to enrollment assistance.Nearly all (94%) health centers in non-expansion states ranked their state’s decision not to expand Medicaid as a major barrier to their enrollment assistance activities (Table 2).
About half of health centers in both groups of states reported patient confusion about eligibility for coverage as a major barrier. The large share of all health centers citing this issue indicates that patients’ understanding of their coverage options was unrelated to state Medicaid expansion status and, rather, that confusion was widespread everywhere in the early post-ACA implementation period studied.
Large shares of health centers in both Medicaid expansion and non-expansion states ranked problems related to documentation requirements and inadequate state information as major barriers to enrollment assistance.About 40% of health centers in Medicaid expansion states ranked incomplete or missing income, residency, or citizenship information as a major barrier, as did a significantly smaller but still large share (30%) of health centers in non-expansion states. Likewise, inaccurate or inconsistent answers from the state were considered a major barrier by 40% of health centers in expansion states and 30% of those in non-expansion states. One-quarter of health centers in expansion states and more than one-third in non-expansion states ranked inadequate consumer information provided by the state as a major barrier.
Inadequate outreach by the state was also cited as a major barrier to enrollment assistance. One in three health centers in non-expansion states, and one in five in expansion states, ranked inadequate state outreach as a major barrier to their current enrollment activities. Roughly one in five health centers in both groups of states considered the lack of a state procedure manual and inadequate funding major barriers; more than one in 10 health centers in both groups cited the lack of culturally and/or linguistically appropriate materials.
Table 2: Barriers to Current Health Center Enrollment Activities
Share of health centers reporting issue as a major barrier
Medicaid expansion states
Medicaid non-expansion states
State decision not to expand Medicaid
N/A
93.9%
Patient confusion regarding eligibility for insurance programs
50.8%
48.7%
Incomplete or missing income, residency, or citizenship documentation from patients
39.9%
30.0%*
Inadequate funding
20.4%
17.7%
Inadequate outreach by the state
19.4%
34.8%*
Inaccurate or inconsistent answers from the state
39.6%
29.3%*
Lack of state procedure manual
22.4%
23.3%
Inadequate consumer information provided by the state
25.7%
36.1%*
Lack of culturally and/or linguistically appropriate documents and materials
18.1%
13.2%
State navigator requirements
12.6%
11.0%
Inadequate staff training for enrollment system
9.2%
4.9%*
Inadequate staff understanding of enrollment system
5.4%
4.9%
*Difference from Medicaid expansion states is significant at p<.05.
Health Center Service Capacity is More Likely to have Expanded in Medicaid Expansion states.
Health centers in Medicaid expansion states were significantly more likely than those in non-expansion states to report expanded service capacity since January 2014. Health centers in expansion states were more likely than those in non-expansion states to have increased dental service capacity (37% vs. 31%) and mental health service capacity since January 2014 (42% vs. 35%) (Figure 5). These results are consistent with a finding from previous work that higher Medicaid income eligibility for adults and greater health center capacity were correlated.13 It is reasonable to surmise that increased patient revenues generated by increased coverage among low-income populations help health centers to expand their service capacity.
Figure 5: Change in Selected Measures of Health Center Capacity Since January 1, 2014
At the same time, wait times for health center appointments increased more in expansion states than in non-expansion states. Health centers in expansion states were more likely to report increased wait times to obtain an appointment compared to health centers in non-expansion states (35% vs. 20%). Increased wait times for appointments may reflect greater demand for health center services in Medicaid expansion states and increased strains on health center capacity at least in the short term.
Discussion
The findings from this study demonstrate that expanded health coverage under the ACA has lowered the uninsured rate among health center patients in all states. The largest gains in coverage among health center patients have occurred in Medicaid expansion states, a reflection of the deep poverty of the communities that health centers serve. In non-expansion states, the subgroup of health center patients with incomes equal to at least 100% FPL can qualify for Marketplace subsidies. The uptick in private coverage rates among health center patients in non-expansion states suggests that this coverage pathway – premium subsidies for Marketplace coverage – make a difference to health center patients as well as other low income people in non-expansion states.14 However, as important as the Marketplace subsidies are, most health center patients are too poor to qualify for them; furthermore, those who do qualify can face premiums and significant out-of-pocket burdens for deductibles, coinsurance, and copayments, depending on the plan they select. As coverage continues to expand under the ACA, health center grants will remain essential to keep care affordable for privately insured patients through income-related fee reductions, and to support the fundamental safety-role health centers play in serving the uninsured, who account for more than one in five health center patients even in states that have expanded Medicaid and almost 40% of health center patients in non-expansion states.
The finding that health centers in Medicaid expansion states were more likely to have expanded service capacity suggests that new patient revenues associated with the Medicaid expansion improved health centers’ financial position to invest. The health centers in non-expansion states lagged behind, but the grant funding provided to all health centers through the special ACA trust fund has provided crucial resources to help them build capacity to provide care, too.
Regardless of their state’s Medicaid expansion status, health centers play a crucial role in providing outreach and enrollment assistance to their patients and communities. Substantial gains in health coverage among health center patients provide new evidence of the impact of their efforts. Health centers are well-equipped to assist patients who are very poor, new to navigating a complex system of coverage, enrollment, and plan selection, and often without access to technology necessary to enroll online. Even so, despite streamlined enrollment systems under the ACA, patient confusion about eligibility and documentation requirements pose major challenges to health centers’ current enrollment activities. Health center grant funding will remain important to sustaining health centers’ ability to link their patients and communities to coverage.
Looking Ahead
As ACA implementation proceeds, a key ongoing role for health centers will be to identify and enroll uninsured health center patients who are eligible for coverage. Some patients remain ineligible for Medicaid or ACA coverage because of their immigration status. But health centers’ ability to connect patients with coverage is most powerfully influenced by state Medicaid expansion decisions, and at this writing, 20 states have not moved forward, leaving millions uninsured and straining health centers’ capacity to serve them. These non-expansion states are mostly in the South,15 where poverty is deepest, communities of color are more concentrated,16 and gaps in access to preventive care and treatment, leading to avoidable complications of disease and poor health outcomes17 are particularly great. It will be important to continue to assess the implications of Medicaid expansion for health center primary care capacity, including access to pediatric care, women’s health services, general adult medicine, and services for special needs populations, such as patients with physical and mental health disabilities. Understanding the broader impacts of Medicaid expansion on low-income communities, for example, on employment opportunities and local economies, would also help to inform state policy choices.
The high uninsured rate even among health center patients in Medicaid expansion states underscores the continuing importance of federal grant funding for health centers, as well as coverage expansion, to sustain and improve access to care in underserved communities. In addition, considering the significant role of health centers in serving Medicaid beneficiaries and other low-income populations, the extent to which they are integrated into emerging delivery systems that involve new provider alignments and performance-driven payment systems will have important implications for health care access and quality, the future of the health care safety-net, and efforts to improve population health.
Funding support for this paper was provided to The George Washington University by the RCHN Community Health Foundation.
Endnotes
Health Resources and Services Administration. Negotiated Rulemaking Committee on the Designation of Medically Underserved Populations and Health Professional Shortage Areas: Final Report to the Secretary, Table 5. 2011. http://www.hrsa.gov/advisorycommittees/shortage/nrmcfinalreport.pdf↩︎
The total number of health centers in 2014 was 1,278 when health centers in the U.S. territories are included. Bureau of Primary Health Care, Health Resources and Services Administration. National 2014 Health Center Data, 2015. http://bphc.hrsa.gov/uds/datacenter.aspx?q=tall&year=2014&state= ↩︎
Sharac J et al., How has the Affordable Care Act Benefitted Medically Underserved Communities? National Findings from the 2014 Community Health Centers Uniform Data System, 2015, Policy Research Brief No. 42, Geiger Gibson/RCHN Community Health Foundation Research Collaborative, George Washington University. http://www.rchnfoundation.org/?p=4998↩︎
Shin P et al., Assessing the Potential Impact of State Policies on Community Health Centers’ Outreach and Enrollment Activities, 2014, Policy Research Brief No. 35, Geiger Gibson/RCHN Community Health Foundation Research Collaborative, George Washington University. http://www.rchnfoundation.org/?p=3814↩︎
Data on health centers in the U.S. territories were excluded from this analysis. ↩︎
The number of responses including health centers in U.S. territories was 693. ↩︎
This hypothesis is consistent with recent findings that individuals with income of 100-150% FPL made up nearly half of Marketplace purchasers in non-expansion states, but under one-quarter of those in Medicaid expansion states. U.S. Department of Health and Human Services. “Health Insurance Marketplaces 2015 Open Enrollment Period: March Enrollment Report.” ASPE Issue Brief (2015): 1-72. http://aspe.hhs.gov/pdf-report/health-insurance-marketplace-2015-open-enrollment-period-march-enrollment-report↩︎
Although a Small Share of Medicare Part D Enrollees Take Specialty Drugs, A New Analysis Finds Those Who Do Can Face Thousands of Dollars in Out-of-Pocket Drug Costs Despite Plan Limits on Catastrophic Expenses
Some Medicare Part D enrollees can expect to pay thousands of dollars out-of-pocket for a single specialty drug in 2016, even though Part D plans provide substantial protection against catastrophic costs, according to a new analysis from the Kaiser Family Foundation. The findings illustrate how high prescription drug prices, one of the public’s top health care concerns, pose a financial challenge not only for Medicare and other federal health programs but for people on Medicare as well.
For 12 specialty drugs used to treat four health conditions —hepatitis C, multiple sclerosis, rheumatoid arthritis, and cancer—Part D beneficiaries face at least $4,000 and as much as nearly $12,000 in out-of-pocket costs in 2016 for one drug alone. In 2014, 2 percent of Part D enrollees used these and other specialty tier drugs, according to the Centers for Medicare and Medicaid Services, though not all will face out-of-pocket costs as high as those identified in the analysis. The analysis by researchers at Georgetown University and the Kaiser Family Foundation also found that a significant share of the out-of-pocket costs for such drugs, defined by Medicare as drugs that cost more than $600 per month, can be incurred even after enrollees’ drug spending reaches the drug benefit’s catastrophic threshold, which is intended to protect against high costs but is not an absolute limit on out-of-pocket spending.
Out-of-pocket costs are substantially higher—often ten times higher or more—for specialty drugs when they are not listed on formulary by a Part D plan. Six of the 12 specialty drugs included in the analysis were not on formulary in some plans; that can trigger added costs of $40,000 or more annually.
The full brief, It Pays to Shop: Variation in Out-of-Pocket Costs for Medicare Part D Enrollees in 2016, also shows how monthly out-of-pocket costs for commonly used brand and generic drugs can vary widely across plans, even when included on plan formularies. For five of ten top brands, monthly costs vary by as much as $100 across plans. The findings underscore why it is important for beneficiaries to compare plans during Medicare’s open enrollment season, which runs from Oct. 15 to Dec. 7, to choose a plan that best meets their needs.
For the full analysis, as well as other data and information about Medicare, visit kff.org.
Medicare Part D drug plans differ considerably in the drugs they list on their formularies, their use of formulary tiers, and the level and structure of cost sharing applied to those tiers. Plan premiums and the use of deductibles also vary widely. Plan decisions affect different beneficiaries in different ways, depending on the drugs they use. The financial consequences for Part D plan enrollees can be substantial. In this brief, we focus on out-of-pocket drug costs for Part D enrollees in 2016 for specialty, brand, and generic drugs.
The analysis is based on a selected set of specialty drugs and commonly prescribed brand and generic drugs. Out-of-pocket costs are taken from the Medicare Plan Finder, available at medicare.gov, as they apply to Part D enrollees who do not qualify for the Low-Income Subsidy. Drug costs were obtained for 20 prescription drug plans (PDPs) offered on a national or near-national basis, using a location in Baltimore, MD. In addition to examining costs for common drugs, we also examine profiles of multiple drugs for five hypothetical Part D enrollees. More details on the study methods can be found in Appendix 1: Methods.
Findings include:
Part D enrollees can expect to pay thousands of dollars out of pocket for a single specialty drug in 2016, even after their drug costs exceed the catastrophic coverage threshold.
Out-of-pocket costs are substantially higher—often ten times higher or more—for specialty drugs when they are not listed on formulary by a Part D plan.
Out-of-pocket costs for specialty drugs tend to be similar across Part D plans when on formulary and are typically subject to prior authorization.
Monthly out-of-pocket costs for commonly used brand and generic drugs tend to vary widely across Part D plans, even when included on plan formularies; for five of ten top brands, monthly costs vary by as much as $100 across plans.
Out-of-pocket costs for commonly used brand and generic drugs are often significantly higher when they are off formulary than when they are on formulary; for six top brands and one top generic drug, costs are at least $200 more per month when off formulary than the median cost on formulary.
Based on five hypothetical beneficiaries taking a mix of medications for multiple conditions, total out-of-pocket costs vary by as much as four-fold across Part D plans, taking into account the number and type of drugs they take, whether or not their drugs are on formulary, cost-sharing amounts, and monthly premiums.
Findings
Part D enrollees can expect to pay thousands of dollars out of pocket for a single specialty drug in 2016, even after their drug costs exceed the catastrophic coverage threshold
Specialty drugs, defined by Medicare as those that cost more than $600 per month, can contribute to high out-of-pocket costs for Part D enrollees. For 12 specialty drugs used to treat four health conditions —hepatitis C, multiple sclerosis, rheumatoid arthritis, and cancer—Part D enrollees face at least $4,000 and as much as nearly $12,000 in annual out-of-pocket costs in 2016 for one drug alone (Figure 1). (See Appendix Table 1 for drug-specific cost information.)
Figure 1: Even with catastrophic coverage, Medicare Part D enrollees can pay thousands of dollars annually for specialty drugs
Among the studied 12 specialty drugs median out-of-pocket costs are lowest for the three drugs used to treat rheumatoid arthritis. But these costs still range from $4,413 to $4,872 for a year’s treatment. Median out-of-pocket costs for Medicare beneficiaries taking any one of three hepatitis C specialty drugs range from $6,516 to $7,153 in 2016. Some cancer drugs cost Part D enrollees even more. Revlimid, used to treat cancer of the blood, including multiple myeloma and a form of lymphoma, has a median out-of-pocket cost of $11,538, while Gleevec (for certain types of leukemia) has a median out-of-pocket cost of $8,503.
At least one-third of total out-of-pocket costs for each of these 12 specialty tier drugs are incurred by Part D enrollees after their spending reaches the catastrophic coverage phase of the Part D benefit. For seven of these drugs, enrollees pay more than half of their total out-of-pocket costs above the catastrophic threshold. For example, 58 percent of an enrollee’s out-of-pocket costs for Sovaldi (a treatment for hepatitis C) occur in the catastrophic coverage phase, which translates to $3,828 in costs in the catastrophic phase in 2016. For Revlimid, this share rises to 76 percent, or $8,758 in out-of-pocket costs in the catastrophic coverage phase. These examples assume that the particular specialty drug in question is the only drug taken by a Part D enrollee. In the likely event that they take other drugs, the share of costs in the catastrophic phase will be even greater.
Part D enrollees taking high-cost specialty tier drugs often incur significant costs beyond the catastrophic threshold because the threshold is not an absolute limit on out-of-pocket spending. By law, Part D enrollees pay 5 percent of drug costs after exceeding the catastrophic threshold (equivalent to $7,515 in total drug costs in 2016 under the standard benefit).1 Therefore, despite having catastrophic coverage, Part D enrollees can face thousands of dollars in annual out-of-pocket costs if they take expensive drugs (or, as described later, if they take multiple high-cost brand-name drugs).
Part D enrollees who take specialty drugs face especially high costs at the start of the year (Figure 2). To illustrate, beneficiaries enrolled in the SilverScript Choice PDP face out-of-pocket costs of $6,221 in 2016 for Copaxone, a drug used to treat multiple sclerosis with a full cost of about $74,000. But they are liable for $2,404—over a third of the full year’s cost—in January. In this example, costs drop to $704 in February and then to $311 per month for the rest of the year. Similar patterns of front-loaded spending occur in other PDPs and for other high-cost specialty drugs. For enrollees who take specialty drugs over multiple years, the pattern repeats.
Figure 2: Part D enrollees’ out-of-pocket costs for many specialty drugs are substantial at the start of the year, and continue even after spending exceeds the catastrophic coverage threshold
This pattern occurs because the Part D benefit includes an initial coverage period during which enrollees pay from 25 percent to 33 percent (and, for two-thirds of plans, a deductible). The monthly cost of many specialty drugs is greater than the initial coverage limit ($3,310 in 2016), so enrollees shift quickly into the gap phase, during which enrollees pay 45 percent of the drug’s cost by statute (in 2016). Once the catastrophic threshold ($7,515 in total drug costs in 2016) is passed, enrollees pay 5 percent of the drug’s cost for the rest of the year.
Out-of-pocket costs are substantially higher—often ten times higher or more—for specialty drugs when they are not listed on formulary by a Part D plan
The most significant driver of out-of-pocket costs for a specialty drug, given the extraordinarily high cost of these drugs, is whether or not the drug is on formulary. Six of the 12 specialty drugs included in this study are on formulary in all plans—including two of the three hepatitis C drugs and all three of the cancer drugs (Figure 3). Cancer drugs are required to be on formulary by CMS guidance as one of six protected classes. Plans are also required to include at least two drugs on formulary in every category or class. Although the drugs in this study are not the only drugs in their drug classes, this requirement is a key factor in formulary design decisions.
Figure 3: Formulary coverage of selected specialty drugs varies across Part D plans
The other six specialty drugs in this study are off formulary in at least four PDPs, including all three of the drugs used to treat multiple sclerosis (MS). Although all 20 PDPs include at least one of the three studied MS drugs on formulary (there are other treatments for MS as well), 14 PDPs include just one of the three MS drugs. Plans omit drugs from their formularies for a variety of reasons, and they must use their pharmacy and therapeutics committee to incorporate clinical considerations in their decisions. A key reason for exclusion is price negotiation: plans reportedly get the deepest discounts from a manufacturer when competing drugs are excluded from the plan’s formulary.
The cost to the beneficiary when a specialty drug is off formulary is nearly ten times higher—or more—than the median cost when on formulary (Table 1). This represents an added out-of-pocket cost, from nearly $40,000 (for Orencia or Enbrel) to nearly $90,000 (for Viekira Pak).
Table 1: Part D enrollees’ out-of-pocket costs for specialty drugs vary significantly depending on their formulary coverage status
Drug
Median cost when listed on formulary in 2016
Median cost when not listed on formulary in 2016
Viekira Pak (hepatitis C)
$6,516 (n=2)
$95,818 (n=18)
Avonex (multiple sclerosis)
$5,979 (n=6)
$73,645 (n=14)
Copaxone (multiple sclerosis)
$6,448 (n=16)
$84,337 (n=4)
Tecfidera (multiple sclerosis)
$6,235 (n=8)
$79,886 (n=12)
Orencia (rheumatoid arthritis)
$4,413 (n=7)
$44,218 (n=13)
Enbrel (rheumatoid arthritis)
$4,872 (n=12)
$48,298 (n=8)
NOTE: Analysis includes 20 national and near-national stand-alone prescription drug plans in Baltimore, MD (zip code 21201) and reflects pricing at a Rite Aid pharmacy in this zip code. ‘n’ indicates number of plans listing or not listing each drug on formulary. Six other specialty drugs in this analysis not shown because they are on formulary in all plans (n=20).
SOURCE: Georgetown/Kaiser Family Foundation analysis of 2016 Medicare Plan Finder data.
Out-of-pocket costs for specialty drugs tend to be similar across Part D plans, when on formulary, and are typically subject to prior authorization
For these 12 specialty drugs, the maximum out-of-pocket cost in PDPs listing the drug on formulary is never more than 10 percent higher than the minimum out-of-pocket cost. The out-of-pocket cost for Harvoni, the most common treatment for hepatitis C, ranges from $7,072 to $7,245, a difference of only 2 percent (Figure 4). The cost of Enbrel, the most commonly prescribed treatment for rheumatoid arthritis, ranges from $4,571 to $4,926 when on formulary, a difference of 8 percent. The pattern for the two drug classes shown in Figure 4 is comparable to the other two drug classes in this study.
Figure 4: Annual out-of-pocket costs for selected hepatitis C and rheumatoid arthritis specialty drugs vary little across Part D plans when the drugs are listed on formulary
While plans differ in setting specialty-tier coinsurance in the initial coverage phase at rates ranging from 25 percent to 33 percent, the vast majority of total costs to the consumers taking specialty drugs is established by law and does not vary by much across plans. This is because the different coinsurance rates apply only in the initial coverage period, and the majority of costs incurred by consumers occur in the coverage gap and catastrophic phases where cost sharing is set by law.2
When included on plans’ formularies, 11 of the 12 specialty drugs included in this analysis are always covered on the specialty tier. One of the 12 drugs—Orencia, for rheumatoid arthritis—is covered on a non-preferred brand tier by the two PDPs offered by UnitedHealth. This placement results in higher enrollee cost sharing in the initial coverage period than if the drugs were on the specialty tier, because the coinsurance for non-preferred brand drugs in these two plans is higher than for specialty drugs: 40 percent in the AARP MedicareRx Saver Plus PDP and 50 percent in the AARP MedicareRx Preferred PDP (in pharmacies offering preferred cost sharing, these amounts are 30 percent and 40 percent, respectively).
Specialty drugs are regularly subject to prior authorization and quantity limits. For eight of the 12 specialty drugs studied, all plans that list these drugs on formulary also require prior authorization, and most plans do the same for the other four drugs (Copaxone, Orencia, Enbrel, and Zytiga). In only two cases do plans require step therapy for these specialty drugs: one plan for Orencia and another plan for Tecfidera. (See Appendix Table 2 for drug-specific tier placement and utilization management information.)
Monthly out-of-pocket costs for commonly used brand and generic drugs tend to vary widely across Part D plans, even when included on plan formularies; for five of ten top brands, monthly costs vary by as much as $100 across plans
Top Brand Drugs
Cost sharing for a 30-day supply of ten commonly prescribed brand drugs can be anywhere from two to 14 times higher in one PDP versus another (Figure 5). For example, Namenda (a drug used by people with Alzheimer’s disease with a typical price of $345) has median monthly cost sharing of $142 in 2016, but an enrollee in Aetna Medicare Rx Saver PDP or First Health Part D Value Plus PDP pays only $40, whereas an enrollee in WellCare Classic PDP pays $173. (See Appendix Table 1 for drug-specific cost information.)
Figure 5: For 5 of 10 top brands, the difference between the lowest and highest on-formulary out-of-pocket monthly cost is more than $100
Compared to specialty drugs, total out-of-pocket costs are more heavily driven by how plans structure their benefits and formularies. Differences across plans in out-of-pocket costs for enrollees are driven by three factors: (1) tier placement (typically, two tiers for generics and two tiers for brands), (2) cost-sharing amounts assigned to the tiers by plans, and (3) whether cost sharing is structured as copayments or coinsurance (mostly coinsurance for non-preferred brands, mixed for preferred brands). Most brand drugs not on the specialty tier are not costly enough by themselves to force the beneficiary into the catastrophic coverage phase.
The impact of benefit design variations is illustrated by the drug with the greatest range in cost sharing (including only PDPs where the drug is on formulary). The cost to the consumer of Spiriva, a drug used to treat emphysema or COPD with a typical price of $950, ranges from $33 to $472 per month in 2016. The highest cost sharing for this drug ($472) is for a PDP that places the drug on a non-preferred brand tier with 50 percent coinsurance. The lowest cost sharing ($33) is for a PDP with a flat copayment amount for a preferred brand tier. In PDPs that place Spiriva on a preferred brand tier with coinsurance for a preferred brand tier, the cost to the consumer is also high, ranging from $153 to $245 depending mostly on variations in the coinsurance percentage, but also in the retail price of the drug.
By contrast, the smallest range in cost sharing ($29 to $56) is for Crestor (for high cholesterol), a drug with a price of about $220 per month. The small range in cost sharing for Crestor partially reflects pricing at a level where coinsurance typically matches the copayments. In general, any brand drug priced higher than $200 per month has higher out-of-pocket costs in PDPs that use coinsurance rather than a copayment. Thus, copayments for Crestor range from $29 to $47 and PDPs with coinsurance charge from $35 to $56.
For a less expensive brand drug such as ProAir (a treatment for asthma priced just over $50), consumers face lower costs when plans use coinsurance. Based on the relatively low price of this drug, PDPs with coinsurance charge their enrollees from $8 to $13 per month, while PDPs with copays charge from $33 to $47.
In most cases, plan enrollees pay more when the drug is on a non-preferred tier as opposed to a preferred tier. But there are exceptions. Synthroid (for hypothyroidism) is typically priced at about $32 per month. For five PDPs that place the drug on a non-preferred brand tier with coinsurance, enrollees pay between $14 and $17 per month in 2016. By contrast, seven PDPs with preferred brand tier use copayments that exceed the price of this drug; thus, the enrollee pays the entire cost of the drug—about $32.
Top Generic Drugs
The range in out-of-pocket costs across Part D plans for a 30-day supply for ten top generic drugs tends to be much narrower than for brands (Figure 6). Most Part D enrollees who use the ten top generic drugs pay no more than $10 per month in cost sharing in 2016. The median cost sharing for all but one of these ten generics is between $3 and $8. Four of the top generics (furosemide, lisinopril, metformin, and metoprolol) are preferred generics for all 20 PDPs with a median copay of $3 or $4 and can be obtained for a zero copayment in some PDPs.
Figure 6: For 9 of 10 top generics, the difference between the lowest and highest on-formulary out-of-pocket monthly cost is $10 or more
However, in some cases, the differences in costs across plans are greater. Among the ten generic drugs included in this analysis, hydrocodone/APAP, an opioid used for pain relief, is covered by most plans as if it were a brand drug, which leads to higher costs for enrollees. Hydrocodone/APAP is placed on a brand tier for eight of the ten PDPs that have it on formulary. As a result, cost sharing in these ten PDPs is much higher than other generics, varying from $16 to $78 in 2016. (The full price for a month’s supply of hydrocodone/APAP also varies, ranging from $94 to $184 for the PDPs that have it on formulary.)
The two generic statins used to treat high cholesterol are treated somewhat differently. Atorvastatin has a median monthly copayment of $7 as result of being on the non-preferred generic tier on 12 of 20 PDPs (and on the non-preferred brand tier for 1 PDP). Simvastatin is a preferred generic for 17 of 20 PDPs and has a median copayment of $4. But, regardless of the PDP selected, either one of these generic drugs is less expensive for beneficiaries than the brand statin (Crestor), which has cost sharing of $29 to $56.
Out-of-pocket costs for commonly used brand and generic drugs are often significantly higher when they are off formulary than when they are on formulary; for six top brands and one top generic drug, costs are at least $200 more per month when off formulary than the median cost on formulary
Most (but not all) generics are on formulary for all PDPs, whereas many brand drugs are off formulary for a subset of PDPs. Eight of the ten top generic drugs in this study are always on formulary in 2016; hydrocodone/APAP is off formulary for 10 of 20 PDPs, and omeprazole is off formulary for 1 PDP. Just two of the ten top brands in this study are always on formulary. The remaining eight brands are off formulary for as few as 3 PDPs and as many as 7 PDPs of the 20 PDPs in this study.
Beneficiaries can face considerable costs for brands and for some generics when their drug is not listed on the plan’s formulary. For six of the top brands and one generic, the difference between median out-of-pocket cost when a drug is on formulary and the highest off-formulary cost is at least $200 per month in 2016 (Figure 7). A beneficiary with Alzheimer’s disease who takes Namenda will pay $392 per month in the five PDPs that leave this drug off formulary, compared to median cost sharing of $142. A beneficiary using Januvia to treat diabetes will see out-of-pocket costs increasing from $47 to $382.
Figure 7: For 6 top brands and 1 top generic, the difference between the median monthly out-of-pocket cost when on formulary and the highest monthly cost when not on formulary is at least $200
Even generic drugs can be expensive when off formulary. Beneficiaries may pay up to $114 for a month’s supply of omeprazole, compared to a monthly copayment of $5. Similarly, the price of hydrocodone/APAP is as high as $237 instead of a typical monthly copayment of $36.
Access to some drugs may be further influenced by utilization management restrictions, although these restrictions are applied less frequently for brands and generics than for specialty drugs. Two of the ten top brands in this study have prior authorization requirements in 2016. Six PDPs apply prior authorization to Lyrica, a treatment for nerve and muscular pain, and 13 PDPs have prior authorization requirements for Namenda, a drug used for patients with Alzheimer’s disease. Several drugs also have step therapy requirements: Lyrica (one PDP), Januvia (two PDPs), and both versions of Lantus (one PDP). In addition, one PDP has a step therapy requirement for two generic drugs (atorvastatin and hydrocodone/APAP). (See Appendix Table 2 for drug-specific tier placement and utilization management information.)
Based on five hypothetical beneficiaries taking a mix of medications for multiple conditions, total out-of-pocket costs vary by as much as four-fold across Part D plans, taking into account the number and type of drugs they take, whether or not their drugs are on formulary, cost-sharing amounts, and monthly premiums
Few Medicare beneficiaries take only one drug, and for those who use the Medicare Plan Finder, the total out-of-pocket costs displayed reflect costs for the full array of drugs they take throughout the year along with plan premiums and deductibles, if applicable. Total out-of-pocket costs—cost sharing for all drugs and premiums—for five hypothetical beneficiaries who take at least five medications for various health conditions differ by at least $800 across 20 PDPs available in a given area in 2016 (Figure 8). Alice (Profile A), who takes six drugs for conditions that include asthma and diabetes, would spend $3,451 out of pocket if she enrolls in the SilverScript Choice PDP, whereas it would cost her $14,600 if she enrolls in Transamerica MedicareRx Classic PDP. The contrast is considerably less for Dora (Profile D) who takes five generic drugs for diabetes, hypertension, and three other conditions. Her annual costs would be $951 in the AARP Medicare Rx Saver Plus PDP, compared to $1,771 in the Humana Enhanced PDP.
Figure 8: The total annual out-of-pocket cost (including premiums) for a mix of drugs varies across Medicare Part D plans by as much as four-fold
The wide variation in out-of-pocket costs across Part D plans is due to several factors, including whether the beneficiary’s drugs are on or off formulary, each drug’s placement on a cost-sharing tier, the different cost-sharing amounts associated with each tier, whether cost sharing is structured as coinsurance or copayments, and plan premium amounts. Total costs vary less for Dora because her five generic drugs are all on formulary for the 20 PDPs in this study. For a beneficiary such as Alice who takes drugs that are not always on formulary (in her case, two of six drugs are off formulary in some PDPs), total costs are as much as $10,000 higher.
But even when all of their drugs are on formulary, total out-of-pocket costs across all PDPs can still vary substantially (Table 2). Bob (Profile B) takes five drugs for Alzheimer’s disease and other conditions. His drugs are all on formulary for 19 of 20 PDPs; yet his costs for those plans range from $1,697 (AARP Medicare Rx Saver Plus PDP) to $3,349 (SilverScript Plus PDP). Premium differences ($34 versus $87 in this example) tend to be a greater factor in cost differences when comparing plans that have all drugs on formulary.
Earl (Profile E) has multiple chronic conditions for which he takes 13 drugs, including 9 brand drugs (but no specialty-tier drugs). His out-of-pocket costs add up to $5,433 even in the least expensive plan for his situation (Humana Enhanced PDP), but can be as much as $18,687 in a plan (Transamerica MedicareRx Classic PDP) where four of his drugs off formulary. Notably, the least expensive plan for Earl is the most expensive plan for Dora, illustrating how much costs can vary based on individual needs. Earl’s costs, even in the least expensive plan for him, put him over the catastrophic threshold. Like beneficiaries who take a single specialty drug, a large share (37 percent) of Earl’s total out-of-pocket drug costs occur while he is in the catastrophic phase.
Table 2: The total annual out-of-pocket cost for Part D enrollees taking a varying mix of medications to treat multiple conditions ranges up to four-fold in 2016
Profile A: Alice
Profile B: Bob
Profile C: Carla
Profile D: Dora
Profile E: Earl
Conditions
Asthma
Diabetes
High cholesterol
Hypertension
Alzheimer’s
Edema
High cholesterol
Overactive bladder
Hypertension
Hypothyroidism
Insomnia
Migraines
Pain
Diabetes
High cholesterol
Hypertension
Hypothyroidism
Osteoporosis
Alzheimer’s
Asthma
Diabetes
High cholesterol
Hypertension
Hypothyroidism
Insomnia
Overactive bladder
Pain
Schizophrenia
Medications
n=6:
Advair Diskus
Amlodipine
Crestor
Januvia
Lantus Solostar
Metformin
n=5:
Atorvastatin
Donepezil Furosemide Namenda XR Oxybutynin
n=5:
Eszopiclone
Lyrica
Sumatriptan SPR Synthroid
Valsartan/HCTZ
n=5:
Atorvastatin
Levothyroxine Metformin
Metoprolol Succinate ER
Raloxifene
n=13:
Crestor
Eszopiclone
Januvia
Lantus Solostar
Latuda
Lyrica
Metformin
Metoprolol Succinate ER
Namenda XR Rivastigmine
Symbicort
Synthroid
Vesicare
Brand/generic mix
4 brands
2 generics
1 brands
4 generics
2 brands
3 generics
0 brands
5 generics
9 brands
4 generics
Number of plans:
where all drugs are on formulary
13
19
3
20
2
where 1 drug is not on formulary
4
1
12
N/A
5
where 2+ drugs are not on formulary
3
N/A
5
N/A
13
Range in out-of-pocket costs:
in plans where all drugs are on formulary
Low: $3,451
High: $4,157
Low: $1,697
High: $3,349
Low: $3,12
High: $4,195
Low: $951
High: $1,771
Low: $5,433
High: $5,529
in plans where 1 drug is not on formulary
Low: $7,846
High: $9,154
$5,605
Low: $6,826
High: $8,025
N/A
Low: $5,475
High: $9,828
in plans where 2+ drugs are not on formulary
Low: $13,629
High: $14,600
N/A
Low: $7,645
High: $10,995
N/A
Low: $9,363
High: $18,687
NOTE: Analysis includes 20 national and near-national stand-alone prescription drug plans in Baltimore, MD (zip code 21201) and reflects standard pharmacy pricing at a Rite Aid pharmacy in this zip code. Total out-of-pocket costs include medication costs and monthly plan premiums. ‘n’ indicates total number of drugs in each profile. ‘N/A’ indicates not applicable.
SOURCE: Georgetown/Kaiser Family Foundation analysis of 2016 Medicare Plan Finder data.
Pharmacy choice can affect total out-of-pocket costs, and pharmacies offering preferred cost sharing can provide savings, but the magnitude of savings varies by plan, pharmacy, and the mix of drugs
There is some variation in out-of-pocket costs by pharmacy—driven by plans’ use of tiered pharmacy networks, by pricing differences across pharmacies, and by the availability of mail order. The recent trend toward greater use of tiered pharmacy networks has raised the issue of pharmacy choice as another factor for enrollees to consider in comparing plans. Under these arrangements, plans make preferred cost sharing available at a limited number of network pharmacies and higher (standard) cost sharing at other network pharmacies.
For three of our five hypothetical beneficiaries (Alice, Carla, and Earl), the typical (median) savings achieved by using a pharmacy with preferred cost sharing is less than 3 percent in 2016—measured across 13 PDPs with a nearby pharmacy that offers preferred cost sharing (Figure 9). For the other two hypothetical beneficiaries, the median savings for using a pharmacy with preferred cost sharing is greater: 11 percent for Bob and 19 percent for Dora.
Figure 9: Part D enrollees can obtain savings at pharmacies offering preferred cost sharing, compared to pharmacies offering standard cost sharing
Savings from pharmacies offering preferred cost sharing can be substantial, especially for drug profiles that are more heavily reliant on generics, but can be quite modest when most drugs are brands. This is because plans that use tiered pharmacy networks typically reduce cost-sharing amounts more for generic drugs than for brands, perhaps because pharmacies have more leverage over discounts for generic drugs.3 For example, cost sharing for generics can drop from $10 down to $1 or even $0 at pharmacies offering preferred cost sharing.
Alice and Earl have the highest overall out-of-pocket costs for the drugs they take—largely because they are more reliant on brand drugs than the three other hypothetical beneficiaries. But they have the smallest rate of savings from using a pharmacy with preferred cost sharing (Table 3). In dollar terms, they have the potential to save less than $200 based on their chosen pharmacy in 2016—a small amount for a set of drugs that cost them at least $3,000 out of pocket. From a beneficiary’s perspective, the selection of a pharmacy or the selection of a plan based on the pharmacy they typically use is more important, in terms of savings, if they take a lot of generic drugs.
Table 3: Total annual out-of-pocket costs for Part D enrollees taking a varying mix of medications to treat multiple conditions are modestly lower in pharmacies offering preferred cost sharing in 2016
Profile A: Alice
Profile B: Bob
Profile C: Carla
Profile D: Dora
Profile E: Earl
Brand/generic mix
4 brands
2 generics
1 brands
4 generics
2 brands
3 generics
0 brands
5 generics
9 brands
4 generics
Range in out-of-pocket costs:
at pharmacies offering standard cost sharing
Low: $3,575
High: $14,600
Low: $1,697
High: $5,605
Low: $3,127
High: $8,025
Low: $951
High: $1,771
Low: $5,433
High: $18,687
at pharmacies offering preferred cost sharing
Low: $3,445
High: $14,442
Low: $1,457
High: $5,438
Low: $3,028
High: $7,748
Low: $533
High: $1,564
Low: $5,438
High: $18,581
NOTE: Analysis includes 13 national and near-national stand-alone prescription drug plans in Baltimore, MD (zip code 21201) where a pharmacy with preferred cost sharing is available in this zip code. Total out-of-pocket costs include medication costs and monthly plan premiums.
SOURCE: Georgetown/Kaiser Family Foundation analysis of 2016 Medicare Plan Finder data.
Mail order can also offer some savings to enrollees, compared to retail pharmacies, but not for all PDPs. Mail order savings are greater when compared to pharmacies with standard cost sharing (versus preferred cost sharing); all five of our hypothetical beneficiaries save money using mail order compared to retail for most PDPs when the chosen retail pharmacy is one that uses standard cost sharing (Table 4). In many cases, however, the savings are less than 10 percent. Out-of-pocket costs for mail order are closer to costs at retail pharmacies with preferred cost sharing. In fact, for some PDPs, out-of-pocket costs are higher for mail order than for a retail pharmacy with preferred cost sharing.
Table 4: Some Part D plans offer savings for drugs purchased through mail order rather than retail pharmacies
Profile
Pricing for mail order compared to retail pharmacies with standard cost sharing
Pricing for mail order compared to retail pharmacies with preferred cost sharing
Number of plans where mail order pricing is less expensive in 2016
Number of plans where mail order pricing is more expensive in 2016
Number of plans where mail order pricing is less expensive in 2016
Number of plans where mail order pricing is more expensive in 2016
Profile A: Alice
20
0
10
3
Profile B: Bob
16
4
9
4
Profile C: Carla
17
3
7
6
Profile D: Dora
19
1
8
5
Profile E: Earl
20
0
13
0
NOTE: Analysis includes 20 national and near-national stand-alone prescription drug plans in Baltimore, MD (zip code 21201) and reflects pricing at a Rite Aid pharmacy in this zip code.
SOURCE: Georgetown/Kaiser Family Foundation analysis of 2016 Medicare Plan Finder data.
Discussion
This analysis shows that out-of-pocket costs can exceed thousands of dollars for beneficiaries who take just one specialty drug or a large number of less costly brands and generics. In 2014, 2 percent of Part D enrollees used specialty tier drugs, though not all enrollees who use these drugs will face out-of-pocket costs as high as those identified in this analysis.4 Out-of-pocket costs would be lower for enrollees who receive the Low-Income Subsidy and for enrollees who take specialty drugs that are less expensive than the drugs we analyzed.
Even with catastrophic coverage, Part D enrollees are exposed to high costs because the catastrophic coverage threshold is not a hard cap on out-of-pocket costs. In extreme situations, enrollees pay more money after reaching the catastrophic phase of the benefit than before it. Policymakers could strengthen financial protections for beneficiaries with significant drug costs by making the current catastrophic coverage threshold an absolute limit.
The highest costs occur when a prescribed drug is off formulary. Beneficiaries in this situation have the option to consult with their prescriber about therapeutic alternatives and get a different prescription if appropriate, or request an exception. Or they can try to obtain the drug through a source such as a manufacturer’s patient assistance program. Such programs, however, may require meeting income eligibility standards, and they must operate independently of the Part D program.
If the need for a new drug can wait until the first of the following year, after the open enrollment period, the high cost of specialty drugs, and even some brands, creates a strong incentive to enroll in a plan that has their drug on formulary. When a new drug is prescribed midyear, however, this delay may come with serious clinical consequences. Neither a new prescription for a drug that is off formulary nor a newly diagnosed health condition creates the basis for a midyear special enrollment period.
With median income among Medicare beneficiaries at about $24,000 per person, the cost of off-formulary specialty and other high-priced drugs is beyond the reach of many Part D enrollees.5 Some might be able to pay directly for off-formulary drugs out of pocket, but if they do, their costs will not count towards reaching their benefit phases, including the catastrophic threshold. Individual purchasers do not benefit from the manufacturer discounts that are available to plan purchasers in the form of post-invoice rebates paid by manufacturers to plans and kept confidential.
The Medicare Plan Finder can be a powerful tool to allow enrollees to predict total annual out-of-pocket costs across plans in their area, based on the drugs they take. Even so, the Plan Finder has inherent limitations. Beneficiaries can use the Plan Finder to search for plans based on drugs they are currently taking, but they cannot factor in their search the cost of a new prescription that comes after the enrollment period has ended. Nor can the Plan Finder easily show the beneficiary others ways to obtain a drug or what therapeutic alternatives are available. Furthermore, when a drug is off formulary, the price displayed may not reflect the actual price a beneficiary sees at the pharmacy.
Choice of plans matters in Part D. Beneficiaries’ health conditions and medication needs continually change, and plans often make changes in their formularies and cost sharing from one year to the next. The Plan Finder allows beneficiaries to compare plans during the open enrollment period, taking into account their current drugs and plan benefit designs for the coming year. A concise and personalized notice to enrollees describing how plan changes will affect them in the coming year might be one way to convince more to shop during the open enrollment period.
Our analysis shows that Part D enrollees can benefit from careful plan comparisons, looking not just at premiums, but also at formulary coverage and tier placement of their drugs, and at how their pharmacy is treated by plans. Yet while it pays to shop, most people do not switch plans during the open enrollment period.6,7 As a result, many Part D enrollees leave money on the table—sometimes thousands of dollars.
Appendix
Appendix 1: Methods
Data collection, plans, and pharmacies
All data were collected from the Medicare Plan Finder, using zip code 21201 in Baltimore, MD, mostly between October 19 and November 13, 2015. Data were collected for 20 PDPs, all of which are offered by 10 firms that sponsor plans on a national or near-national basis. The one other PDP in the selected zip code was Magellan Rx Medicare Basic PDP, which is offered in 20 of 34 regions and is not considered a near-national plan. Medicare Advantage drug plans were excluded from the analysis because plan participation varies geographically and few plans are offered on a national or near-national basis.
We are able to use one zip code as a reasonable representation of PDP costs nationally because nearly 90 percent of PDPs are offered on a national or near-national basis. These PDPs use the same formulary and the same formulary tier structure in all regions. Some of the national and near-national PDPs have modest variations in cost-sharing amounts from region to region, and there may be modest variations in the full price of drugs across pharmacies and across regions. Although total out-of-pocket costs will vary modestly across regions, the overall patterns reported here should not vary by geography.
Data were collected for two different pharmacies in Baltimore: (1) Rite Aid pharmacy on Lexington Avenue, selected to represent a pharmacy with standard cost sharing for all 20 PDPs, and (2) Community Pharmacy, a Walgreens pharmacy on Howard Street, selected to represent a pharmacy with preferred cost sharing for 13 of 20 PDPs. Three of the other seven PDPs (SilverScript Choice, WellCare Classic, and WellCare Extra) do not use tiered pharmacy networks. The remaining four PDPs (Humana Preferred, Humana Walmart, Symphonix Prime Saver Rx, and Symphonix Value Rx) had no pharmacies with preferred cost sharing within the default mileage distance used on the Medicare Plan Finder for the selected zip code. Data were also collected for mail order, as shown on the Medicare Plan Finder. A selection of data were also collected from two community pharmacies (Best Care and Mt. Vernon pharmacies) to verify that prices were relatively similar across pharmacies.
Drug selection
A set of ten brand-name and ten generic drugs were selected using the Medicare Provider Utilization and Payment Data: Part D Prescriber Public Use File (PUF) for 2013, released by CMS in April 2015. Drugs were sorted by numbers of claims. We used the ten generic drugs with the most claims for 2013. Similarly, we used the ten brand drugs with the most claims for 2013, but including only those brand drugs that have not acquired generic competition since that date.8 None of the excluded brands had quantities that would have qualified them for the list of most-used generics. Because of changes in drug utilization and availability, the actual top drugs in 2015 may vary somewhat.
Specialty drugs were selected for four health conditions that are commonly treated by specialty drugs: hepatitis C, rheumatoid arthritis, multiple sclerosis, and cancer. For the latter three conditions, the specific drugs were selected based on usage levels in the 2013 Part D Prescriber PUF. Because key drugs to treat hepatitis C were not approved for the market in 2013, we selected the three drugs that are recognized as significant therapeutic options in 2015. Many cancer drugs and some treatments for other conditions are covered under Part B, rather than Part D; thus, our selection of drugs includes those that are commonly paid for under Part D.
For all drugs, the dosage and the form of drug and the quantity of the medication used per month were taken from the defaults offered by the Medicare Plan Finder.
Data elements on drug costs collected for each drug
For each drug, we collected information on the full cost (price), cost-sharing amounts paid by enrollees, tier placement, and utilization management restrictions. For specialty drugs, cost information is presented on an annual basis because the 12 studied drugs are priced high enough that out-of-pocket costs are determined based on all benefit phases. For brands and generics, cost information is presented on a monthly basis because prices are low enough that beneficiaries do not routinely reach the gap or catastrophic phases based on taking any one drug.
The full cost of the drug is shown on the Medicare Plan Finder. The amount shown if the drug is on formulary is based on the drug’s unit price and dispensing fee as submitted by the plan. For off-formulary drugs, prices are inserted by CMS using a standard formula to approximate cash pricing: the wholesale acquisition cost (WAC) plus 15 percent for brands and WAC plus 20 percent for generics. The WAC is a publicly available list price that approximates what retail pharmacies pay wholesalers for single source drugs and is taken by CMS from the Medispan database, with First Data Bank as a backup. When we characterize a typical drug price in this report, it is based on the median price for plans that include that drug on formulary. For the drugs in this analysis, the CMS-supplied price tends to be about 10 percent to 20 percent higher than the median price for plans with the drug on formulary. But for some drugs it is considerably higher, probably reflecting lags in the data used to update the WAC.
Cost sharing is shown on the Medicare Plan Finder for four phases of the Part D drug benefit. Cost sharing in the deductible phase (where applicable) is equal to the full cost of the drug. Cost sharing in the initial coverage phase is determined based on the tier placement and cost-sharing structure for the particular plan. Cost sharing in the coverage gap phase is based on a statutory formula that takes into account the statutory manufacturer’s discount for most brand drugs and a required coinsurance amount. Cost sharing in the catastrophic phase is based on a statutory rule: the greater of 5 percent of the full cost of the drug or a nominal copayment amount.
Tier placement is also shown on the Medicare Plan Finder for each drug, as is the use of utilization management restrictions, including prior authorization, step therapy, and quantity limits.
Profiles of hypothetical beneficiaries
Five drug profiles were created for this study to reflect different utilization patterns that combine brand and generic drugs at different levels of drug costs. We included only commonly used drugs in the profiles and assembled drug combinations that reflect commonly co-occurring health conditions. No specialty drugs were included in the profiles because most Part D enrollees do not use any specialty drugs and because those drugs were analyzed separately.
Total out-of-pocket costs for these hypothetical beneficiaries were collected from the Medicare Plan Finder as described above for the specialty, brand, and generic drugs. Total costs include plan premiums, deductibles where applicable, and the total cost-sharing amounts owed. They also include the full cost of any off-formulary drugs, based on the CMS-supplied full cost for that drug.
Appendix 2: Data Tables
Appendix Table 1: Costs in Medicare Part D Plans for 12 Specialty Tier Drugs, 10 Top Brand-Name Drugs, and 10 Top Generic Drugs, 2016
Drug
Full drug costs
Out-of-pocket drug costs
On formulary
Off formulary
On formulary
Lowest cost
Median cost
Highest cost
Highest cost
Lowest cost
Median cost
Highest cost
BRAND-NAME DRUGS
Monthly costs
Monthly costs
Advair Diskus
$309
$312
$318
$474
$31
$47
$154
Crestor
$216
$220
$225
N/A
$29
$47
$56
Januvia
$330
$334
$343
$382
$29
$47
$86
Lantus
$248
$250
$255
$288
$29
$47
$115
Lantus Solostar
$372
$375
$382
$430
$29
$60
$172
Lyrica
$314
$320
$327
n/a
$29
$76
$161
Namenda
$338
$345
$348
$392
$40
$142
$173
Proair HFA
$50
$51
$53
$59
$8
$13
$47
Spiriva
$943
$950
$979
$1,271
$33
$181
$472
Synthroid
$31
$32
$33
$38
$8
$29
$32
GENERIC DRUGS
Monthly costs
Monthly costs
Amlodipine Besylate
$1
$4
$10
N/A
$0
$3
$10
Atorvastatin Calcium
$4
$7
$20
N/A
$0
$6
$20
Furosemide
$1
$3
$7
N/A
$0
$3
$7
Hydrocodone/APAP
$94
$161
$184
$237
$16
$36
$78
Levothyroxine Sodium
$6
$13
$15
N/A
$3
$8
$13
Lisinopril
$2
$3
$10
N/A
$0
$3
$10
Metformin Hcl
$2
$4
$19
N/A
$0
$4
$10
Metoprolol Tartrate
$2
$4
$19
N/A
$0
$3
$10
Omeprazole
$2
$6
$10
$114
$0
$5
$10
Simvastatin
$1
$4
$10
N/A
$0
$3
$10
SPECIALTY DRUGS
Annual costs
Annual costs
Sovaldi
$83,614
$84,925
$86,690
N/A
$6,547
$6,608
$6,704
Harvoni
$94,066
$95,541
$97,526
N/A
$7,072
$7,153
$7,245
Viekira Pak
$82,936
$82,936
$82,936
$95,818
$6,516
$6,516
$6,516
Avonex
$63,974
$64,074
$64,946
$73,645
$5,664
$5,979
$6,033
Copaxone
$73,259
$73,922
$75,693
$84,337
$6,146
$6,448
$6,568
Tecfidera
$69,143
$69,393
$71,700
$79,886
$5,945
$6,235
$6,361
Orencia
$38,269
$38,407
$38,756
$44,218
$4,397
$4,413
$4,749
Humira
$41,277
$42,059
$42,808
N/A
$4,572
$4,864
$4,943
Enbrel
$41,284
$41,499
$42,067
$48,298
$4,571
$4,872
$4,926
Revlimid
$174,370
$182,973
$186,781
N/A
$11,084
$11,538
$11,881
Gleevec
$120,917
$122,804
$125,377
N/A
$8,359
$8,503
$8,638
Zytiga
$95,521
$97,025
$99,047
N/A
$7,164
$7,227
$7,326
NOTE: Analysis includes 20 national and near-national stand-alone prescription drug plans in Baltimore, MD (zip code 21201) and reflects pricing at a Rite Aid pharmacy in this zip code. ‘N/A’ is not applicable.
SOURCE: Georgetown/Kaiser Family Foundation analysis of 2016 Medicare Plan Finder data.
Appendix Table 2: Formulary Tier Placement and Utilization Management Restrictions in Medicare Part D Plans for 12 Specialty Tier Drugs, 10 Top Brand-Name Drugs, and 10 Top Generic Drugs, 2016
Drug
Formulary tier placement
Utilization management restrictions
Number of plans placing drug on:
Number of plans requiring:
Generic or preferred generic
Non-preferred generic
Preferred brand
Non-preferred brand
Specialty
Off formulary
Prior authorization
Quantity limits
Step therapy
BRAND-NAME DRUGS
Advair Diskus
0
0
13
3
0
4
0
16
0
Crestor
0
0
20
0
0
0
0
19
0
Januvia
0
0
17
0
0
3
0
16
2
Lantus
0
0
16
1
0
3
0
0
1
Lantus Solostar
0
0
16
1
0
3
0
0
1
Lyrica
0
0
13
7
0
0
6
17
1
Namenda
0
0
6
9
0
5
13
7
0
Proair HFA
0
0
13
0
0
7
0
11
0
Spiriva
0
0
14
2
0
4
0
16
0
Synthroid
0
0
10
5
0
5
0
0
0
GENERIC DRUGS
Amlodipine Besylate
17
3
0
0
0
0
0
4
0
Atorvastatin Calcium
7
12
0
1
0
0
0
16
1
Furosemide
20
0
0
0
0
0
0
0
0
Hydrocodone/APAP
0
2
7
1
0
10
0
10
1
Levothyroxine Sodium
14
6
0
0
0
0
0
0
0
Lisinopril
20
0
0
0
0
0
0
2
0
Metformin Hcl
20
0
0
0
0
0
0
11
0
Metoprolol Tartrate
20
0
0
0
0
0
0
0
0
Omeprazole
5
14
0
0
0
1
0
11
0
Simvastatin
17
3
0
0
0
0
0
15
0
SPECIALTY DRUGS
Sovaldi
0
0
0
0
20
0
20
15
0
Harvoni
0
0
0
0
20
0
20
15
0
Viekira Pak
0
0
0
0
2
18
2
2
0
Avonex
0
0
0
0
6
14
6
3
0
Copaxone
0
0
0
0
16
4
13
13
0
Tecfidera
0
0
0
0
8
12
8
6
1
Orencia
0
0
0
2
5
13
6
2
1
Humira
0
0
0
0
20
0
20
12
0
Enbrel
0
0
0
0
12
8
11
9
0
Revlimid
0
0
0
0
20
0
20
9
0
Gleevec
0
0
0
0
20
0
20
12
0
Zytiga
0
0
0
0
20
0
20
13
0
NOTE: Analysis includes 20 national and near-national stand-alone prescription drug plans in Baltimore, MD (zip code 21201).
SOURCE: Georgetown/Kaiser Family Foundation analysis of 2016 Medicare Plan Finder data.
Endnotes
The statutory limit on out-of-pocket spending for 2016 is $4,850. This amount is substantially higher than the out-of-pocket spending shown before the catastrophic threshold (generally about $3,000) in Figure 1. Under the provision in the Affordable Care Act that phases out the coverage gap, manufacturers are required to discount the cost of certain drugs (mostly brand drugs) by 50 percent. The amount of this discount counts toward achieving the $4,850 catastrophic threshold. ↩︎
In general, specialty tier rates are limited to 25 percent by CMS guidance. But plans that reduce or eliminate the deductible can raise the specialty tier coinsurance rate as high as 33 percent. ↩︎
One of the brands on our list, Synthroid, has generic alternatives (levothyroxine), available long before 2013. But this drug is commonly prescribed as a brand because many clinicians believe that patients whose dosage has been established on the brand version are not readily switched to the generic version without further titration of the dosage. ↩︎
States have long used Medicaid funds as premium assistance to purchase private health insurance for beneficiaries as an alternative to providing coverage directly through the state Medicaid program. States using premium assistance generally must provide wrap-around benefits and cost-sharing protections so that Medicaid beneficiaries receiving private coverage will not have access to fewer benefits or pay higher out-of-pocket costs when private coverage fails to meet Medicaid’s level of coverage or is more expensive. Some states seeking alternative ways to implement the Affordable Care Act’s (ACA) Medicaid expansion have been interested in expanding Medicaid premium assistance programs and adopting new models to purchase individual market coverage. These initiatives can be informed by an understanding of how pre-ACA premium assistance programs are working, particularly regarding wrap-around benefits and cost-sharing protections.
This issue brief examines states’ approaches to administering wrap-around benefits and cost-sharing in long-standing Medicaid premium assistance programs and the information available to beneficiaries about how to access these program features. We present findings based on our survey in 2014 of eight states (AL, LA, NV, RI, TX, UT, VT, and WI) that previously had reported spending dedicated to premium assistance wrap-around benefits to collect updated data and ascertain what states considering premium assistance in the Medicaid expansion context could learn about wrap-around benefits and cost-sharing based on long-standing premium assistance programs. We supplement our analysis by examining these states’ written materials designed to inform beneficiaries about premium assistance coverage and end with a discussion of post-ACA premium assistance programs.
Little data are available about spending on wrap-around benefits in state premium assistance programs. Key findings from the 8 states include the following:
States serve relatively small numbers of people in premium assistance programs that pre-date the ACA’s Medicaid expansion, and to the extent that limited data are available, spending on wrap-around benefits as a percent of total premium assistance program spending varies considerably among states.
Few states report how much is spent on wrap-around benefits and cost-sharing protections in their premium assistance programs which makes it difficult to assess the extent to which beneficiaries are accessing those benefits and whether premium assistance programs are cost-effective.
The clarity of states’ written materials explaining how beneficiaries can access wrap-around benefits varies.
States’ written materials do not always clearly convey the availability of wrap-around EPSDT services for children.
States have different policies for administering wrap-around cost-sharing protections, with most protecting beneficiaries from paying excess cost-sharing upfront. However, wrap-around cost sharing protections in examined states are available only if beneficiaries receive services from a provider who is both in their private insurance plan network and also accepts Medicaid. Beneficiaries may not be aware of this limitation, and it may further restrict provider options rather than expanding them.
As states’ interest in Medicaid premium assistance models continues, further research is needed to examine the beneficiary experience in these programs. This is especially true for access to wrap-around benefits and cost sharing protections, as little data presently is available in this area. Premium assistance approaches could have political and practical advantages for enrollees, and implementation of new programs in the context of alternative Medicaid expansions, can be informed by states’ experiences with long-standing programs. At the same time, wrap-around benefits add a layer of complexity for beneficiaries, providers, and states in premium assistance programs. Explaining how the wrap-around works is a challenge, especially when broad benefits that may not be fully included in private coverage, like EPSDT, are involved. Given the complex nature of these programs and variation in state implementation, the extent to which enrollees have access to the full Medicaid benefit package and cost-sharing protections is an area for continued study.
In addition, to the extent that Medicaid beneficiaries enrolled in premium assistance programs do not have access to wrap-around cost sharing protections unless they see Medicaid providers, beneficiaries are not receiving one of the key advantages often cited by proponents of premium assistance – access to a wider network of providers. Educational materials provided to beneficiaries do not always clearly explain the availability of wrap-around benefits and cost sharing protections, particularly EPSDT, and varied considerably in the states we examined. As more states consider premium assistance models to serve greater numbers of beneficiaries, the need to understand how to best administer wrap-around benefits and cost-sharing protections is of growing importance.
Introduction
For many years, states have used Medicaid funding to purchase private health insurance for Medicaid beneficiaries as an alternative to providing coverage directly through the state Medicaid program. This approach, known as premium assistance, typically has been used to help people eligible for Medicaid afford the premiums for employer-sponsored insurance and has been a relatively small component of state Medicaid program enrollment prior to the Affordable Care Act (ACA). Since 2014, some states seeking alternative ways to implement the ACA’s Medicaid expansion have been interested in expanding Medicaid premium assistance programs to cover more beneficiaries and adopting new models to purchase coverage in the individual market.1 These initiatives can be informed by an understanding of how pre-ACA premium assistance programs are working, particularly regarding so-called “wrap-around” benefits and cost-sharing protections, which states generally must provide to supplement the private coverage and make it comparable to Medicaid.
This issue brief examines states’ approaches to administering wrap-around benefits and cost-sharing in long-standing Medicaid premium assistance programs and the information available to beneficiaries about how to access these program features. We sought to collect updated data and ascertain what states considering premium assistance in the Medicaid expansion context could learn about wrap-around benefits and cost-sharing based on long-standing premium assistance programs. We present findings based on data from our survey in 2014 of eight states that had previously reported spending dedicated to premium assistance wrap-around benefits. The states include Alabama, Louisiana, Nevada, Rhode Island, Texas, Utah, Vermont, and Wisconsin. We identified these states because they had reported such spending in 2009 in a Government Accountability Office (GAO) report.2 Of the 45 premium assistance programs in 37 states in the GAO report, nine states reported spending for wrap-around benefits. Of these, we excluded Virginia because its premium assistance program is limited to CHIP beneficiaries and only provides wrap-around benefits for immunizations. Since our survey, Vermont has discontinued its program, and Louisiana recently announced that it intends to discontinue its program as of December 1, 2015.
We supplement our analysis by examining these states’ written materials designed to inform beneficiaries about premium assistance coverage. We asked state officials to share these materials and accessed others online at the states’ websites. We did not receive written beneficiary materials from Vermont, and were unable to access materials online as its program was discontinued in 2014; we did receive a limited response to our survey on some of the spending questions. The brief ends with a discussion of post-ACA premium assistance programs.
Background
Medicaid Premium Assistance Options
State options to use premium assistance to purchase private coverage for Medicaid beneficiaries predate the ACA.3 The most common form of Medicaid premium assistance is the use of Section 1906 authority to purchase private group insurance with Medicaid dollars, authorized in 1990.4 These programs are commonly referred to as Health Insurance Premium Payment (HIPP) programs. If premium assistance for group coverage is deemed cost-effective by the state, relative to the cost of providing Medicaid coverage directly, beneficiaries may be required to enroll in Section 1906 premium assistance programs. While these programs can be implemented through a state plan amendment, some states operate premium assistance programs with similar features through Section 1115 demonstration authority. Because relatively few Medicaid beneficiaries have access to employer-sponsored or other private group health insurance, these premium assistance programs have remained small.5
In addition to subsidizing group coverage, the Centers for Medicare and Medicaid Services (CMS) has used Section 1905(a) to authorize Medicaid premium assistance for individual market coverage.6 Prior to the ACA, Medicaid beneficiaries’ access to individual market coverage was limited because the cost was often unaffordable, and insurers could deny coverage based on pre-existing medical conditions. The creation of the Marketplaces under the ACA has generated new interest among some states in using Medicaid as premium assistance for individual market coverage, and in 2013, CMS released regulations and guidance for such programs.7 Enrollment in Section 1905(a) premium assistance programs is voluntary, unless the state obtains Section 1115 demonstration authority from CMS to make enrollment mandatory; in such cases, states must offer beneficiaries a choice of at least two health plans.8
Wrap-Around Benefits and Cost-Sharing in Medicaid Premium Assistance
Medicaid serves people with low incomes and who often have greater health care needs relative to other populations. In light of these characteristics, federal Medicaid law contains minimum benefit standards and maximum cost-sharing limitations. Private insurance typically offers fewer benefits than Medicaid does.9 Certain Medicaid services, most notably non-emergency medical transportation, usually are not covered by private insurance, and some private plans may have more restrictive limits on prescription drugs and other services, such as physical therapy, than are available to adults under Medicaid. In addition, private coverage for children is almost certainly less extensive than Medicaid as Medicaid’s Early Periodic Screening Diagnosis and Treatment (EPSDT) benefit requires states to cover any services “necessary. . . to correct or ameliorate. . . physical and mental illnesses or conditions. . . .” 10 A service that is not covered by private insurance is likely unattainable for people with low-incomes if it is not available through the Medicaid benefit package and therefore must be paid out-of-pocket. Medicaid also limits beneficiaries’ cost-sharing obligations to nominal amounts for adults with income below the federal poverty level and generally prohibits cost-sharing for children,11 while private insurance is likely to have cost-sharing obligations in excess of Medicaid limits. For people with low incomes, a body of research has established that cost-sharing creates a barrier to accessing needed services.12
Given the characteristics of the Medicaid-eligible population, federal law generally requires states using premium assistance to provide wrap-around benefits and cost-sharing protections so that Medicaid beneficiaries receiving private coverage will not have access to fewer benefits or pay higher out-of-pocket costs when private coverage fails to meet Medicaid’s level of coverage or is more expensive.13 States need waiver authority from CMS to limit wrap-around benefits and cost-sharing protections. A small number of pre-ACA premium assistance programs operate under such waivers; these programs may have expanded coverage to populations who were otherwise ineligible for Medicaid and include fewer benefits and/or higher cost-sharing. As of 2014, the ACA provides authority for states to cover nearly all adults without a waiver as full Medicaid beneficiaries with enhanced federal matching funds.
Consistent with the ACA’s coverage expansion, CMS’s 2013 regulations governing individual market premium assistance specify that beneficiaries must be provided with the same benefits and cost sharing protections that they would have had under traditional Medicaid.14 The preamble to the regulations confirms that “[u]nder all premium assistance arrangements, Medicaid and CHIP-eligible individuals remain Medicaid or CHIP beneficiaries and continue to be entitled to all Medicaid/CHIP benefits and cost sharing protections.”15 Additional guidance issued in light of state interest in alternative Medicaid expansions using Marketplace premium assistance requires states to provide wrap-around benefits and cost sharing protections to “ensure that coverage is seamless [and] that cost-sharing reductions are effectively delivered.”16 CMS’s regulations and guidance do not prescribe the specific methods that states must use but rather confirm that “states have the flexibility to determine how best to meet these cost-sharing and benefit responsibilities.”17
The costs of providing wrap-around benefits and cost-sharing protections must be included when determining whether Medicaid premium assistance programs are cost-effective.18 States generally cannot use premium assistance unless the cost is comparable to the cost of providing direct coverage through state’s Medicaid program. In addition to the cost of wrap-around benefits and cost-sharing protections, cost-effectiveness determinations also must include the cost of administering premium assistance programs.19
GAO Report on State Premium Assistance Programs
The GAO identified 47 Medicaid and CHIP premium assistance programs in 39 states in 2009, and received survey responses from 45 programs in 37 states.20 Overall, enrollment in premium assistance programs is relatively small. Among the states reporting spending dedicated to wrap-around benefits, 2009 enrollment ranged from six beneficiaries in Alabama to nearly 8,700 in Texas. The GAO found that at least eight states target their premium assistance programs to people with high health care costs such as pregnant women, premature or low birth-weight infants, or people with HIV/AIDS, diabetes, or cancer.21
The GAO noted that “a reported issue with premium assistance programs is that there may be disparities in the benefits and cost-sharing protections offered to enrollees in such programs compared with those in direct coverage.”22 The GAO also identified some potential advantages of premium assistance programs, such as helping families transition to private coverage, expanding coverage to family members who are ineligible for Medicaid or CHIP, and supporting the private insurance market. It also notes that while premium assistance programs could generate cost savings by leveraging employer contributions, these programs may be more expensive than direct coverage through states’ Medicaid and CHIP programs.23
Few premium assistance programs reported spending dedicated to wrap-around benefits or cost-sharing protections in 2009. Nine of the 36 programs that provided at least some wrap-around benefits reported the dollar amount spent for those benefits.24 Four of the 34 programs that paid at least some cost-sharing (including copayments, coinsurance, and deductibles25 ) reported the dollar amount spent for wrap-around cost-sharing.26 Thus, limited data are available to assess state spending on wrap-around benefits and cost-sharing protections in Medicaid premium assistance programs.
Issue Brief
Key Findings About Wrap-Around Benefits and Cost-Sharing
Premium Assistance Program Enrollment
States serve relatively small numbers of people in premium assistance programs that pre-date the ACA’s Medicaid expansion. Enrollment in the premium assistance programs in states we examined ranges from 93 people in Nevada in 2014 to over 26,000 people in Texas in 2012 (Table 1). Despite wide state-level variation, enrollment in state premium assistance programs was a very small proportion of total Medicaid enrollment across all of the states. Enrollment in premium assistance accounted for 5% of total enrollment in Rhode Island and Vermont, and was less than 1% in all other states examined by this study.27 This relatively low enrollment in premium assistance programs compared with total Medicaid enrollment is consistent with earlier research on premium assistance programs in Medicaid.28
Some states target high cost/high need populations for their premium assistance programs. Similar to the GAO report, our survey found that some premium assistance programs (Alabama and Louisiana) specifically reach out to pregnant women, while others (Nevada) target people with conditions that incur high medical costs such as AIDS and cerebral palsy. Targeting populations with high needs may make sense for states seeking to ensure that their premium assistance programs are cost-effective. However, given their more extensive health care needs, this population may be even more likely to need access to wrap-around coverage for services that are available through Medicaid but not through private insurance.
Table 1:State Premium Assistance Program Enrollment and ExpendituresFrom 2014 KCMU/CCF Survey
State
Program Name
Total State Spending on Premium Assistance*
% of State Spending on Premium Assistance For Wrap-around Benefits
Total Enrollment in Premium Assistance
Per Enrollee Cost
Data Year
Alabama
Health Insurance Premium Program
$478,444
49.0%
127
$3,767
FY 2014
Louisiana
Health Insurance Premium Assistance Program
$6,576,418
14.4%
4,502
$1,461
FY 2014
Nevada
Health Insurance Premium Program
$501,058
N/R
93**
$5,388
FY 2014
Rhode Island
Rite Share
$13,073,000
69.6%
9,779
$1,337
FY 2014
Texas
Health Insurance Premium Payment Program
$140,520,309
N/R
26,244
$5,354
FY 2012
Utah***
Utah Premium Partnership for Health Insurance
$722,509
48.1%
813
$889
FY 2014
Vermont****
Catamount Health & Employer-sponsored premium assistance
N/R
N/R
N/R
N/R
N/R
Wisconsin
BadgerCare Health Insurance Premium Program
$163,032
N/R
133*
$1,226
FY 2013
NOTES: All states utilize premium assistance for employer-sponsored insurance; some states also provide premium assistance for COBRA and/or other group coverage. Data are presented for the most recent fiscal year available. Enrollment reflects data for the full year with the exception of Nevada, which reflects average monthly enrollment. Total state spending on premium assistance and per enrollee costs were calculated by KCMU/CCF based on premium assistance program spending and enrollment data provided by states. *Total state spending includes the following – AL: premiums, services fr Enrolle Costfor the table to reflect this. hthe ees; , and d to usin the revised text box-sponsored Insurance (ESI)es that r not covered by private insurance but paid by Medicaid, and cost-sharing; LA: premiums, total wrap-around charges, administration fees; NV: premiums; RI: premiums, total wrap-around charges; TX: premiums; cost-sharing, administration fees; UT: state reported total expenditure; VT: premiums, benefits wrap-around; WI : state reported total expenditure.**Reflects average monthly enrollment. *** Utah only provides wrap-around coverage for CHIP dental services. CMS, Factsheet for Utah Primary Care Network Section 1115 demonstration program (Dec. 19, 2014), available at http://www.medicaid.gov/Medicaid-CHIP-Program-Information/By-Topics/Waivers/1115/downloads/ut/ut-primary-care-network-fs.pdf. ****VT discontinued its program in 2014. SOURCE: 2014 KCMU/CCF survey of state officials in state premium assistance programs that reported spending on wrap-around benefits to GAO in 2009.
Premium Assistance Program Spending
Few states report how much is spent on wrap-around benefits in their premium assistance programs, and to the extent that limited data are available, spending on wrap-around benefits as a percentage of total premium assistance program spending varies considerably among states.Of the eight states we studied, four (Alabama, Louisiana, Rhode Island, Utah) reported spending for wrap-around benefits in 2014, and these data demonstrate variation in this spending among states (Table 1). The other states that responded to the survey noted their inability to break out costs for wrap-around benefits and were only able to report total spending for their premium assistance program.
The lack of data on spending devoted to wrap-around benefits in Medicaid premium assistance programs makes it difficult to assess the extent to which beneficiaries are accessing those benefits. Better data in this area would improve the ability of states and other stakeholders to determine whether beneficiaries are receiving wrap-around services. The availability of spending data broken down into categories, such as wrap-around benefits and wrap-around cost sharing protections, also could improve program monitoring and evaluation efforts. As one example, Utah is able to report the amount that it spends on the single wrap-around benefit that it offers in its premium assistance program, dental services for children (see Table 1 and Box 1).
Box 1: Utah’s Wrap-Around Coverage Focused on Dental Benefits
The wrap-around benefits provided in Utah’s premium assistance program are more limited in scope relative to other states’ programs. Operating under the authority of a Section 1115 demonstration, the Utah Premium Partnership for Health Insurance (UPP) subsidizes employer and individual coverage for families. UPP provides an additional $20 per month subsidy to purchase employer-sponsored dental coverage for children; however, there is no wrap-around for cost-sharing charges so families have to cover any cost-sharing associated with their employer-sponsored dental insurance. Alternatively, Utah’s program provides wrap-around coverage solely for children’s dental benefits for CHIP eligible children by allowing children with employer-sponsored coverage that omits dental benefits to enroll in the state’s CHIP dental plan.29 The narrow focus of Utah’s wrap-around coverage may be easier for beneficiaries to navigate and for the state to administer because the state only subsidizes one specific benefit rather than providing access to a range of wrap-around services. According to our survey, in FY 2014, UPP enrolled 813 children in its premium assistance program with a per capita cost of $889 (based on $347,861 in state expenditures for wrap-around dental coverage provided through CHIP and $722,509 in total state premium assistance program expenditures including monthly premium subsidies).
The lack of data on spending devoted to wrap-around benefits in Medicaid premium assistance programs also makes it difficult to assess whether these programs are cost-effective. Only two states (Louisiana, Texas) were able to break out spending for the administrative costs for their premium assistance programs in their responses to our survey. States are required to evaluate cost-effectiveness as part of determining eligibility for premium assistance, and this determination must include spending on wrap-around benefits and cost-sharing protections as well as administrative costs. Better data about spending devoted to the various components of premium assistance programs would allow for a more accurate assessment of cost-effectiveness.
Overall state spending on premium assistance programs varies considerably by state. Per enrollee spending ranged considerably in 2014, from a low of $1,337 in Rhode Island to a high of $5,388 in Nevada (Table 1). This is likely a result to some degree of the fact that states serve different populations in their programs as well as relatively low program enrollment, which could result in wide variation in per capita costs; however, it also may reflect state challenges in tracking premium assistance costs.
Access to Wrap-around Benefits
Of the seven states we examined,30 the clarity of the written materials provided to beneficiaries about how to access wrap-around benefits varied, and no state clearly conveyed the availability of EPSDT wrap-around services for children. This was despite the fact that all states targeted families with children in their premium assistance program enrollment materials. Federal regulations require states to use clear non-technical language to inform Medicaid-eligible children and their families about EPSDT, including what services are available and where and how to obtain those services.31 EPSDT is a broad benefit that includes regular screenings; vision, dental, and hearing services; and any treatment services necessary to correct or ameliorate physical or mental health conditions, regardless of whether such services are covered under the state’s adult benefit package.32
Rhode Island’s materials most clearly conveyed the availability of wrap-around benefits and described some of the benefits that EPSDT provides such as dental and vision services. Rhode Island’s premium assistance program booklet for beneficiaries explains that enrollees receive two cards – a private health plan card and a Medical Assistance Card. The booklet goes on to explain that “[t]he Medical Assistance Card is used for a few extra covered benefits listed in this booklet,” and provides details on eye care, dental services, bus passes, interpreter services, additional services that have limits in the employer plan (such as physical, occupational, and speech therapy; and mental health and substance abuse services), and over-the-counter medicine.33 Other examined states did not provide any explicit or more generalized description (similar to Rhode Island’s) of the kinds of services that children are guaranteed through the EPSDT benefit and should be able to access even when enrolled in employer-sponsored insurance.
Two states we examined, Texas and Alabama, did refer to beneficiaries’ ability to receive Medicaid covered services on a wrap-around basis, but without any explanation of what those might be. Texas’ online description of its premium assistance program states that “[o]f course, Medicaid will pay for services not covered by the employer-sponsored insurance, as long as they are Medicaid-covered services provided by a Medicaid provider.”34 While Alabama’s frequently asked questions for its premium assistance program explain that “[o]nce you are enrolled in the AL HIPP program, you will have access to benefits from both programs,”35 the program flyer that Alabama uses instead highlights that premium assistance includes “[c]overage of group health insurance AND Medicaid … including benefits Medicaid may not cover.”36 Nevada’s beneficiary brochure states that “Medicaid covered services may be included if covered through the employer health insurance,”37 which does not assure beneficiaries that Medicaid benefits outside of the employer-sponsored insurance will be covered (emphasis added).
It is worth noting that in addition to written materials, a number of states also mentioned toll free numbers or third party contractors who were available to answer questions about the program as a way of educating beneficiaries about how to access premium assistance benefits. Utah’s program materials are primarily designed to inform families about the larger Utah Premium Partnership program as dental services are the only wrap-around benefit available to children eligible for CHIP. The state does include a FAQ about dental coverage which clarifies that parents can receive $20 per month towards the cost of their employer’s dental coverage or enroll in the CHIP dental plan.38
By contrast, some states’ written materials made the opposite point, underscoring that the private health plan may cover services that are not covered by Medicaid. Beneficiary materials in Alabama, Louisiana, and Nevada all highlight that private insurance may cover benefits that Medicaid does not cover. For example, Louisiana’s materials highlight that employer-sponsored health insurance “may cover services that Medicaid doesn’t cover” rather than the reverse (i.e., that Medicaid is likely to cover services that your employer’s plan does not).39 Wisconsin enrollees receive a lengthy booklet about enrollment and benefits which describes the situations in which a family might be able to enroll in their employer-sponsored insurance but does not describe how premium assistance or the wrap-around benefits work in practice. However, the state indicated in its survey response that state staff calls and details the plan to the member at the time of enrollment.
Access to Wrap-Around Cost-Sharing Protections
States have different policies about how they administer wrap-around cost-sharing protections in their premium assistance programs, with most protecting beneficiaries from making upfront payments in excess of Medicaid limits. According to survey responses, in some states (Louisiana, Nevada, Texas), Medicaid beneficiaries receiving premium assistance do not pay cost-sharing or out-of-pocket charges directly. In Alabama and Wisconsin, beneficiaries are responsible only for paying out-of-pocket co-payments at Medicaid levels. By contrast, in Rhode Island, beneficiaries must pay the full cost-sharing required by the private plan upfront when receiving services and then are reimbursed monthly.
In six states, our survey found that wrap-around cost sharing protections are available only if beneficiaries receive services from a provider who is both in their private insurance plan network and also accepts Medicaid.40 If the provider does not accept Medicaid, beneficiaries must pay the entire cost of the service out-of-pocket. Thus, a family who is enrolled in their employer-sponsored insurance (ESI) with the help of Medicaid premium assistance may have to pay cost-sharing that exceeds Medicaid limits to have access to the full range of providers included in the ESI network, if all of those providers do not also accept Medicaid. Some of the premium assistance programs we examined target high-cost populations who may need specialty services and are likely frequent users of health care services. These populations may benefit from access to a private insurance network that is broader than the Medicaid provider network, but they also are unlikely to be able to afford out-of-pocket cost-sharing in excess of Medicaid limits. It is likely that beneficiaries may find that the need to see a provider who accepts both their private coverage and Medicaid further restricts their provider options rather than expanding them.
Beneficiaries may be unaware that they must see a provider who accepts both their private insurance plan and Medicaid to receive wrap-around cost-sharing protections. While written beneficiary materials overall were more clear about how to access wrap-around cost-sharing protections than wrap-around benefits, they did not consistently inform beneficiaries that they needed to see a Medicaid-participating provider to receive wrap-around cost-sharing protections. Some states’ materials are explicit on this point. For example, Rhode Island’s materials clearly state this limitation by informing beneficiaries that “[i]f you go to a provider who does not accept Medical Assistance, you will be required to pay the co-payment.”41 In addition, Alabama’s materials state that “[q]ualified Medicaid recipients have most out-of-pocket expenses covered by Medicaid when a recipient elects to go to a Medicaid provider,”42 and similarly, Texas’ materials state that “Medicaid pays the co-pays and deductibles when people with HIPP and Medicaid see a Medicaid doctor.”43 By contrast, Louisiana’s beneficiary flyer does not mention that the state will only cover cost-sharing charges for providers who also accept Medicaid,44 although it does point out that “[i]f you have both Medicaid and other health insurance coverage, you may get increased access to primary care doctors, specialty care doctors, and hospitals.”45 Alabama’s HIPP guide and application brochure state that “[m]embers receive … access to a wider network of doctors through group insurance coverage” while the application mentions that “Medicaid recipients’ out-of-pocket medical costs will be paid by Medicaid if they receive treatment from a Medicaid provider.46 Wisconsin provides a lengthy information packet to potential Medicaid beneficiaries, which includes only a small subsection on premium assistance and does not discuss limitations on accessing wrap-around cost-sharing.47
Post-ACA Premium Assistance Programs
Since 2014, a small number of states have included one or more premium assistance components as part of a Section 1115 waiver using an alternative approach to implementing the ACA’s Medicaid expansion.48 These programs differ from the premium assistance programs we examined in that they may cover a greater number of beneficiaries and often they use Medicaid premium assistance to purchase individual Marketplace coverage. Arkansas was the first state to adopt this model and requires all newly eligible Medicaid beneficiaries to enroll in Marketplace premium assistance.49 New Hampshire will be implementing a similar approach in 2016.50 Iowa initially required Marketplace premium assistance for newly eligible adults with income between 100-138% of the federal poverty level, but the program is now voluntary due to the loss of one of the two Marketplace plans that covered Medicaid beneficiaries.51
Some state Medicaid expansion waivers also include provisions for more traditional premium assistance programs for the purchase of employer-sponsored coverage; these are relatively small parts of the expansions approved in Iowa (which enrollment is required) and Indiana (voluntary enrollment).52 Other states that have debated the Medicaid expansion also have considered gubernatorial or legislative proposals that include premium assistance models.53 For example, Tennessee’s proposal included voluntary premium assistance for employer-sponsored coverage,54 and Utah’s proposal required premium assistance for Marketplace or employer-sponsored coverage.55 This trend may continue as states that have not yet expanded Medicaid may be more inclined to favor the use of program designs that emphasize private coverage or other features that require waiver authority.
CMS generally has not allowed states with Medicaid expansion waivers using premium assistance to waive benefits in lieu of providing wrap-around coverage. The one exception is limited permission to waive non-emergency medical transportation benefits in Iowa56 and Indiana.57 For all remaining benefits that are not covered in the private insurance package, states electing to use premium assistance must provide wrap-around coverage. For example, Arkansas is providing both non-emergency medical transportation and EPSDT services for 19- and 20-year-olds through its Medicaid fee-for-service program as a wrap-around benefit for newly eligible adults (see Box 2).
Box 2: Wrap-around Coverage for Early and Periodic Screening, Diagnostic, and Treatment Benefits in States Using Marketplace Premium Assistance to Expand Medicaid
Newly eligible individuals who are ages 19 and 20 are treated as adults for the purposes of eligibility under the ACA’s coverage expansion, but they are also entitled to the Early and Periodic Screening, Diagnostic, and Treatment (EPSDT) benefit package that Medicaid provides to all children up to age 21. CMS has not allowed any state to waive these benefits for 19 and 20 year olds eligible through the Medicaid expansion. As a result, this group receives EPSDT benefits via wrap-around coverage in states requiring newly eligible adults to enroll in Marketplace coverage using premium assistance to expand Medicaid.
To date, data about beneficiary access to wrap-around EPSDT benefits in Medicaid expansion waivers are available only for Arkansas. All newly eligible Medicaid beneficiaries in Arkansas receive coverage via premium assistance for Marketplace health plans, which do not cover the full extent of services required by EPSDT, such as vision and dental services. Arkansas provides EPSDT benefits through its fee-for-service Medicaid program on a wrap-around basis. In 2014, there were 9,971 newly eligible 19 and 20 year olds entitled to EPSDT benefits in Arkansas, although only 1,048 people in this group utilized wrap-around benefits, according to the state’s Department of Human Services. The total annual cost to provide wrap-around EPSDT benefits to newly eligible 19 and 20 year olds was $214,385, or $22 per capita, for all those eligible for EPSDT wrap-around benefits in Arkansas.58
CMS also generally has required states using Medicaid premium assistance for their new adult expansions to impose cost-sharing within Medicaid limits. This means that states electing premium assistance must determine how to administer wrap-around cost-sharing protections. Like most of the pre-ACA premium assistance programs that we examined, Arkansas’ approach to wrap-around cost-sharing protections shields beneficiaries from having to front high out-of-pocket costs and be reimbursed later.59 Because Arkansas is using a limited number of Marketplace plans for its premium assistance program, it may be administratively easier to implement this approach to wrap-around cost-sharing than in states that offer premium assistance for anyone with any employer-sponsored coverage.
Conclusion
As states’ interest in Medicaid premium assistance models continues, further research is needed to examine the beneficiary experience in these programs. This is especially true for access to wrap-around benefits and cost sharing protections, as little data presently is available in this area. Premium assistance approaches could have political and practical advantages for enrollees, and implementation of new programs in the context of alternative Medicaid expansions can be informed by states’ experiences with long-standing programs. At the same time, wrap-around benefits add a layer of complexity for beneficiaries, providers, and states in premium assistance programs. Explaining how the wrap-around works is a challenge, especially when broad benefits that may not be fully included in private coverage, like EPSDT, are involved. Given the complex nature of these programs and variation in state implementation, the extent to which enrollees have access to the full Medicaid benefit package and cost sharing protections is an area for continued study.
In addition, to the extent that Medicaid beneficiaries enrolled in premium assistance programs do not have access to wrap-around cost sharing protections unless they see Medicaid providers, beneficiaries are not receiving one of the key advantages often cited by proponents of premium assistance – access to a wider network of providers. Educational materials provided to beneficiaries do not always clearly explain the availability of wrap-around benefits and cost sharing protections, particularly EPSDT, and varied considerably in the states we examined. As more states consider premium assistance models to serve greater numbers of beneficiaries, the need to understand how to best administer wrap-around benefits and cost-sharing protections is of growing importance.
Joan Alker and Sean Miskell are with the Georgetown Center on Children and Families. MaryBeth Musumeci and Robin Rudowitz are with the Kaiser Family Foundation.
Appendix
SURVEY FOR KAISER/GEORGETOWN REPORT ON WRAPPED BENEFITS IN PREMIUM ASSISTANCE PROGRAMS
Thank you very much for your willingness to answer a short survey on your premium assistance program. We are mindful of how valuable your time is and have tried to keep this survey brief.
The purpose of this study is to examine the provision of wraparound benefits in state Medicaid premium assistance programs. Wraparound benefits are additional benefits and/or lower cost-sharing provided by Medicaid but not typically covered in a beneficiary’s private insurance plan.
We are interested in both STATE’s provision of benefits covered by Medicaid that are not covered by the beneficiaries’ private insurance plans as well as expenditures to reimburse additional cost-sharing charges (such as deductibles, copayments and coninsurance) when private insurance charges are higher than those permitted by Medicaid.
For the most recent fiscal year available, please share enrollment and overall program expenditures for your premium assistance program.
For the same fiscal year, please share expenditures on premium subsidies, “wrapped benefits” i.e. benefits not covered by the beneficiary’s private insurance, and cost-sharing charges paid by the state on the beneficiaries’ behalf. We would appreciate if you could be as specific as possible.
Please briefly describe for us how the wraparound works in practice –
How do beneficiaries learn about and access benefits that are covered by Medicaid but not by their private insurance plan?
How are providers reimbursed for additional benefits covered by the Medicaid program and on what fee schedule?
How is cost-sharing tracked and reimbursed? Do beneficiaries pay out-of-pocket at the point of service, and if so, are copayments limited to the Medicaid amounts?
Are there different cost-sharing reimbursement rules for providers that are participating Medicaid providers and those that are not?
Please share with us any program materials that you provide to beneficiaries to help them understand and access their wraparound benefits and cost-sharing protections. Are there other resources available to beneficiaries (such as call centers) if they have questions?
Please share with us any additional information and/or observations you have about issues associated with providing wraparound benefits and cost sharing protections.
United States Government Accountability Office, Medicaid and CHIP: Enrollment, Benefits, Expenditures, and Other Characteristics of State Premium Assistance Programs (Washington, DC: United States Government Accountability Office, Jan. 19, 2010), http://www.gao.gov/new.items/d10258r.pdf. ↩︎
42 U.S.C. § 1396e, https://www.law.cornell.edu/uscode/text/42/1396e. States also have the Section 1906A option to use premium assistance for Medicaid beneficiaries with access to employer-sponsored insurance with a minimum 40% employer contribution to premium costs. Section 1906A was limited to children and their parents when first effective in 2009, and extended to all Medicaid beneficiaries as of 2014. Unlike Section 1906 programs, beneficiaries cannot be required to enroll in premium assistance under Section 1906A. 42 U.S.C. § 1396e-1, as amended by ACA § § 2003 and 10203(b)(2)(B), http://www.ssa.gov/OP_Home/ssact/title19/1906A.htm#ft118. ↩︎
The top two challenges in implementing and operating premium assistance programs identified by states surveyed by the GAO in 2009 include the limited number of individuals with access to private health insurance and difficulty identifying those individuals. GAO at 11. ↩︎
42 U.S.C. § 1396d(a) (medical assistance payments “may include. . . other insurance premiums for medical or any other type of remedial care or the cost thereof”), https://www.law.cornell.edu/uscode/text/42/1396d. Only six states reported using Section 1905(a) authority in 2009. GAO at 15-16, Table 3. ↩︎
42 CFR § 435.1015(a)(2) and (3) (making premium assistance subject to the conditions that, inter alia, “[t]he agency furnishes all benefits for which the individual is covered under the State plan that are not available through the individual health plan” and that “[t]he individual does not incur any cost-sharing charges in excess of any amounts imposed by the agency under subpart A of part 447”). ↩︎
GAO at 2-3. Not all programs responded to all survey questions. All 45 programs offered premium assistance for group coverage, and 21 offered premium assistance for individual market coverage. GAO at 7. Less than half (20 programs) required beneficiaries to enroll in premium assistance. GAO at 8. ↩︎
We did not receive written materials from Vermont, although we did receive a limited response to our survey on some of the spending questions. We were not able to analyze Vermont’s materials as it discontinued its program in 2014. ↩︎
See generally Kaiser Commission on Medicaid and the Uninsured, The ACA and Medicaid Expansion Waivers (Feb. 2015), available at https://modern.kff.org/medicaid/issue-brief/the-aca-and-medicaid-expansion-waivers/. As of this writing, 31 states (including DC) have implemented the ACA’s Medicaid expansion to nearly all adults up to 138% of the federal poverty level (FPL, $16,243 for an individual in 2015), and most states have done so as Congress envisioned in the ACA. Kaiser Family Foundation State Health Facts, Status of State Action on the Medicaid Expansion Decision. Data Source: KCMU tracking and analysis of state executive activity (Nov. 2, 2015), https://modern.kff.org/medicaid/state-indicator/state-activity-around-expanding-medicaid-under-the-affordable-care-act/. As a result of the Supreme Court decision in National Federation of Independent Business v. Sebelius, states may now choose whether they wish to expand Medicaid. Kaiser Family Foundation, A Guide to the Supreme Court’s Affordable Care Act Decision (Washington, DC: Kaiser Family Foundation, June 2012), https://modern.kff.org/health-reform/issue-brief/a-guide-to-the-supreme-courts-affordable/. ↩︎
New Hampshire initially implemented the Medicaid expansion using its existing Medicaid delivery system. Kaiser Commission on Medicaid and the Uninsured, Medicaid Expansion in New Hampshire (Washington, DC: Kaiser Commission on Medicaid and the Uninsured, March 2015), https://modern.kff.org/medicaid/fact-sheet/medicaid-expansion-in-new-hampshire/. ↩︎
For example the proposal advanced by the Florida Senate (Florida Health Insurance Affordability Exchange Program) included a premium subsidy model that would potentially subsidize employer-sponsored insurance, www.ahealthyfloridaworks.com. ↩︎
Data was obtained via personal communication with the Arkansas Department of Human Services, Division of Medical Services, Coordination of Coverage Unit, April 2014, on file with authors. ↩︎
The Affordable Care Act (ACA) requires most private health insurance plans to provide coverage for a broad range of preventive services, including most contraceptives for women.1 This policy was at the center of a Supreme Court case brought forward by for-profit corporations (Hobby Lobby and Conestoga) that successfully claimed that the contraceptive coverage requirement violated their religious rights. Last month, the Supreme Court agreed to hear yet another challenge (Zubik v Burwell) to the contraceptive coverage requirement, this time brought by nonprofit corporations, claiming that the accommodation established by the federal government for religiously affiliated nonprofit employers with objections to contraceptives violates their religious rights.
While the nonprofits objecting to the accommodation are publicly identified in court documents, there is no centralized source of information that tracks what share of nonprofit employers have requested an accommodation (which has been available since 2013) and are not litigating. As part of the Kaiser Family Foundation/Health Research & Educational Trust (Kaiser/HRET) 2015 Annual Employer Health Benefits Survey, a nationally representative survey of non-federal public and private employers, nonprofit employers were asked whether they self-certified as a religiously-affiliated organization to avoid paying for coverage of some or all contraceptives. This data note provides the first nationally representative estimates of the share of nonprofit corporations that have requested an accommodation from the contraceptive coverage requirement.
Background
As part of the preventives services coverage requirements, most employers that offer health insurance are required to include coverage for contraceptives for women at no cost to them.2 The rule currently provides an “exemption” for houses of worship, which are not required to include contraceptive coverage in their employee plan, nor are their workers entitled to this coverage. An “accommodation” is provided by the federal government to religiously-affiliated nonprofit employers with a religious objection to contraception. The policy is designed so that women workers and dependents covered by a plan sponsored by an employer electing an accommodation can have contraceptive coverage, but their employer does not have to pay for it. Initially, the accommodation was triggered by having the religiously-affiliated nonprofit complete an EBSA 700 form to self-certify that they are an eligible organization and have a religious objection to providing coverage for some or all of any contraceptive services. The employer had to send the completed form to its insurer or third party administrator (TPA).
In July 2015, the Obama Administration issued new regulations extending the accommodation to closely held for-profit corporations (in light of the Supreme Court ruling on the Hobby Lobby case) and providing nonprofit employers eligible for the accommodation an additional choice: either to notify their insurance company or TPA or HHS about their objection. If the employer notifies HHS, they must include the contact information for their insurance company. Because the notifications go directly to insurers/TPAs or the federal government, there is no national information to date on how many nonprofits have elected the accommodation.
What Share of nonprofits is requesting an Accommodation?
Based on employer responses in the Kaiser Family Foundation/Health Research & Education Trust (Kaiser/HRET) 2015 Annual Employer Benefits Survey, overall 3% of nonprofits offering health benefits (with 10 or more workers) reported that they elected the accommodation (Figure 1). Only 2% of very small nonprofits offering health benefits (with between 10 and 49 workers) reported that they elected the accommodation. The share was considerably higher for larger nonprofits with more than 1,000 employees; 10% of nonprofits with 1,000 to 4,999 workers, and 10% of nonprofits with over 5,000 workers reported that they elected the accommodation. Many of the larger nonprofits are likely faith-based health systems or educational institutions.
Figure 1: Figure 1Percentage of Non-Profit Firms Offering Health Insurance That Self-Certify as a Religiously Affiliated Organization with Religious Objection to Some or All Contraceptives, by Firm Size, 2015
What Firms are Likely to request an Accommodation?
Nonprofits include a diverse group of organizations, ranging from very small organizations with all volunteer staffs to large health care systems employing thousands of workers. Approximately 1.41 million nonprofits registered with the Internal Revenue Service (IRS) in 2013.3 The IRS classifies nonprofits into those who are public charities, private foundations, and other types of nonprofit organizations but does not collect uniform information on whether they are religiously affiliated. Nonprofits such as universities or health care systems that have a religious affiliation are not always identified as such – but rather are identified under their primary purpose of health or education. Nonprofits do not need their primary focus to be religious to be eligible for the accommodation. Because of the way nonprofits are classified, there is no national estimate of the share of nonprofit corporations that have a religious affiliation.
The contraceptive coverage accommodation allows nonprofits affiliated with any religion to elect the accommodation and does not require religion to be the primary purpose of the organization. There are many nonprofit charities, educational institutions and health care providers that affiliate with the Catholic Church. Some nonprofits may affiliate with other religions that may not necessarily object to contraceptives in concept, but rather limit their objection to certain methods, particularly IUDs or emergency contraceptive pills. There are no data available, however, on the distribution of religiously affiliated nonprofits and their specific objections to some or all contraceptive methods.
Because of the Catholic Church’s objections to birth control4 , most nonprofits affiliated with the Catholic religion are likely among those firms notifying their insurer, TPA or HHS about their objection to contraceptive coverage to obtain an accommodation. The IRS treats every Catholic-affiliated institution, such as schools, hospitals, diocesan offices, and other organizations, as separate individual entities. There are over 6,800 Catholic schools (5% of the national total5 and 22%6 of all private schools), 645 Catholic nonprofit hospitals7 , and more than 160 Catholic Charities agencies across the country.8
Notably, many large nonprofits are public charities in the health or education fields. In 2011, 10% of all nonprofit hospitals were Catholic hospitals, and 10 of the 25 largest health systems in the U.S. were nonprofit Catholic-sponsored systems.9 When HHS announced the accommodation in 2013, the Catholic Health Association (CHA) announced that the accommodation was acceptable and said it would help its members implement the new policy. CHA’s membership includes over 600 Catholic nonprofit hospitals, and over 1400 nonprofit long term care and other health institutions.
There are approximately 1,700 private nonprofit colleges and universities in the US. According to the National Center for Education Statistics IPEDS database, there are a total of 260 nonprofit Catholic institutions of higher education in the United States. In addition, the Council of Christian Colleges and Universities has over 100 affiliate members in the United States. Some religious universities have accepted the accommodation as a workable solution. In July 2013, Georgetown University publicly announced it was electing the accommodation. Others, however, such as Southern Nazarene University, Geneva College, and East Texas Baptist University are among the plaintiffs in the cases that will soon be heard by the Supreme Court.
Discussion
The accommodation was developed to release nonprofit religiously-affiliated employers that oppose birth control from the requirement of paying for contraceptive coverage, and still enable their employees and dependents to obtain full coverage for contraceptives directly from the insurer, as they are entitled to under the law. The Obama Administration extended this same accommodation to closely held for-profit corporations with religious objections after the Supreme Court issued its ruling on the Hobby Lobby and Conestoga cases.
The findings from Kaiser/HRET survey indicate that a minority of nonprofits have elected an accommodation to the contraceptive coverage requirement. Some nonprofit corporations with religious affiliations, however, believe that the accommodation does not sufficiently address their concerns. These nonprofits are pursuing legal challenges to gain an “exemption” from the rule, rather than an “accommodation.” The Supreme Court’s decision for these nonprofit cases, Zubik v. Burwell, will determine if the employees of these corporations and their dependents will have no cost contraceptive coverage. For workers and their dependents, the distinction between an accommodation and an exemption is the difference between guaranteed no cost contraceptive coverage and having to pay out of pocket for services that could potentially exceed hundreds of dollars a year.
Methods
The Kaiser Family Foundation/Health Research & Educational Trust (Kaiser/HRET) 2015 Annual Employer Health Benefits Survey is based on a telephone survey of 1,997 randomly selected non-federal public and private employers with three or more workers. Researchers at HRET, NORC at the University of Chicago, and the Kaiser Family Foundation designed and analyzed the survey. National Research, LLC conducted the fieldwork between January and June 2015. In 2015, the response rate among firms which offer health benefits is 41%
Since firms are selected randomly, it is possible to extrapolate from the sample to national, regional, industry, and firm size estimates using statistical weights. In calculating weights, we first determine the basic weight, then apply a nonresponse adjustment, and finally apply a post-stratification adjustment. We use the U.S. Census Bureau’s Statistics of U.S. Businesses as the basis for the stratification and the post-stratification adjustment for firms in the private sector, and we use the Census of Governments as the basis for post-stratification for firms in the public sector. Firms’ ownership categories are based on respondents’ classification of their business as either “A private for-profit firm, including publically traded companies and privately owned businesses”, “A public organization such as a state or local government agency” or “A private not-for-profit, such as a 501(c)(3)”. Many houses of worship, such as churches, characterize themselves as nonprofits in the survey. In 2015, 15% of all firms and 22% of employers offering health benefits indicated that they were a private not-for-profit. For more information on the Employer Health Benefits Survey, see the full survey Methods Section at https://www.kff.org/report-section/ehbs-2015-methodology/.
Federal regulations require that most employers with fifty or more employees must offer employer sponsored insurance or pay an “Employer Shared Responsibility Payment” which is a $2,000 tax per full-time employee (excluding the first 30 employees) per year. If the employer chooses to provide employer sponsored insurance then the plan must include contraceptive coverage and other preventive services without cost-sharing unless they are offering coverage through a grandfathered plan or are a house of worship. If a large or small employer offers an employer sponsored insurance plan that does not include contraceptive coverage, they must pay a sizable financial penalty of $100 per day per enrollee. ↩︎
Broughman, SP, & Swaim, NL. (2013). “Characteristics of Private Schools in the United States: Results from the 2011-12 Private School Universe Survey.” U.S. Department of Education, Private School Universe Survey, and National Center for Education Statistics. Available: http://nces.ed.gov/pubs2013/2013316.pdf. ↩︎
As the U.S. Supreme Court gears up to hear a new round of legal challenges to the ACA’s contraceptive coverage requirement, a new Kaiser Family Foundation data note finds 10 percent of nonprofits with more than 1,000 employees have requested an “accommodation” to the health law’s birth control requirement.
The accommodation is provided by the federal government to religiously-affiliated nonprofits that oppose contraception on religious grounds but are not houses of worship. It is designed to ensure women employees and dependents have full contraceptive coverage without cost-sharing, as required by the health law, while releasing nonprofit religiously-affiliated employers that oppose birth control from the requirement of paying for contraceptive coverage.
Many of the nonprofits who have sought the accommodation are likely health systems or educational institutions affiliated with the Catholic Church, which objects to birth control, the analysis notes.
The Supreme Court will issue its decision on the cases brought by nonprofits claiming the accommodation is insufficient by the end of June 2016.