News Release

New Analysis Finds Limited Availability of Abortion Coverage in ACA Marketplaces in 31 States

Published: Jan 21, 2016

On the eve of the anniversary of the Roe v. Wade decision, a new Kaiser Family Foundation analysis finds 25 states either bar abortion coverage in Affordable Care Act (ACA) marketplace plans or limit it to cases of rape or incest or when the woman’s life is endangered. In an additional six states, no 2016 ACA plans offer abortion coverage despite the absence of state legislative restrictions (Delaware, Iowa, Minnesota, Nevada, West Virginia and Wyoming). In three states without bans, plans that include abortion coverage are unavailable in at least one county (Colorado, Illinois and Texas).

In two states (Hawaii and Vermont) every ACA marketplace plan offered includes abortion coverage.

By 2017, every ACA marketplace is required to have at least one Multi-State Plan that excludes abortion coverage.

Availability_of_Abortion_Coverage_through_Marketplace_Plans_-_EMAIL_v3.png

Coverage for Abortion Services in Medicaid, Marketplace Plans and Private Plans reviews federal and state policies on coverage of abortion services. It also examines the availability of abortion coverage in private plans, ACA marketplace plans, and Medicaid, providing estimates of the number of women with the option for coverage and those subject to restrictions.

For more information, see the Foundation’s interactive map showing how state policies on abortion coverage in Medicaid and private insurance have changed from 2000 to 2016.

Medicaid and CHIP Eligibility, Enrollment, Renewal, and Cost-Sharing Policies as of January 2016: Findings from a 50-State Survey

Authors: Tricia Brooks, Sean Miskell, Samantha Artiga, Elizabeth Cornachione, and Alexandra Gates
Published: Jan 21, 2016

Executive Summary

January 2016 marks the end of the second full year of implementation of the Affordable Care Act’s (ACA) key coverage provisions. This 14th annual 50-state survey of Medicaid and CHIP eligibility, enrollment, renewal, and cost-sharing policies provides a point-in-time snapshot of policies as of January 2016 and identifies changes in policies that occurred during 2015. Coverage is driven by two key elements—eligibility levels determine who may qualify for coverage, and enrollment and renewal processes influence the extent to which eligible individuals are enrolled and remain enrolled over time. This report provides a detailed overview of current state policies in these areas, which have undergone significant change as a result of the ACA.

Together, the findings show that, during 2015, states continued to implement the major technological upgrades and streamlined enrollment and renewal processes triggered by the ACA. These changes are helping to connect eligible individuals to Medicaid coverage more quickly and easily and to keep eligible people enrolled as well as contributing to increased administrative efficiencies. However, implementation varies across states, and lingering challenges remain. The findings illustrate that the program continues to be a central source of coverage for low-income children and pregnant women nationwide and show the growth in Medicaid’s role for low-income adults through the ACA Medicaid expansion.

Eligibility for Children, Pregnant Women, and Non-Disabled Adults

Medicaid and CHIP remained the central sources of coverage for low-income children and pregnant women nationwide during 2015. As of January 2016, 48 states cover children with incomes at or above 200% FPL, with 19 states extending eligibility to at least 300% FPL, while 33 states cover pregnant women with incomes at or above 200% FPL. Eligibility levels for children and pregnant women remained stable during 2015. This stability, in part, reflects the ACA’s maintenance of effort provisions, which prevent states from making any reductions in children’s eligibility through 2019. Some states made incremental changes that expanded access to coverage for children and pregnant women in 2015, such as eliminating waiting periods that required children to be uninsured for a period of time before enrolling in CHIP (Michigan and Wisconsin), eliminating the five-year waiting period for lawfully residing immigrant children and pregnant women (Colorado), expanding federally-funded CHIP coverage to dependents of state employees (Nevada and Virginia), and offering coverage to former foster youth from other states (New Mexico).

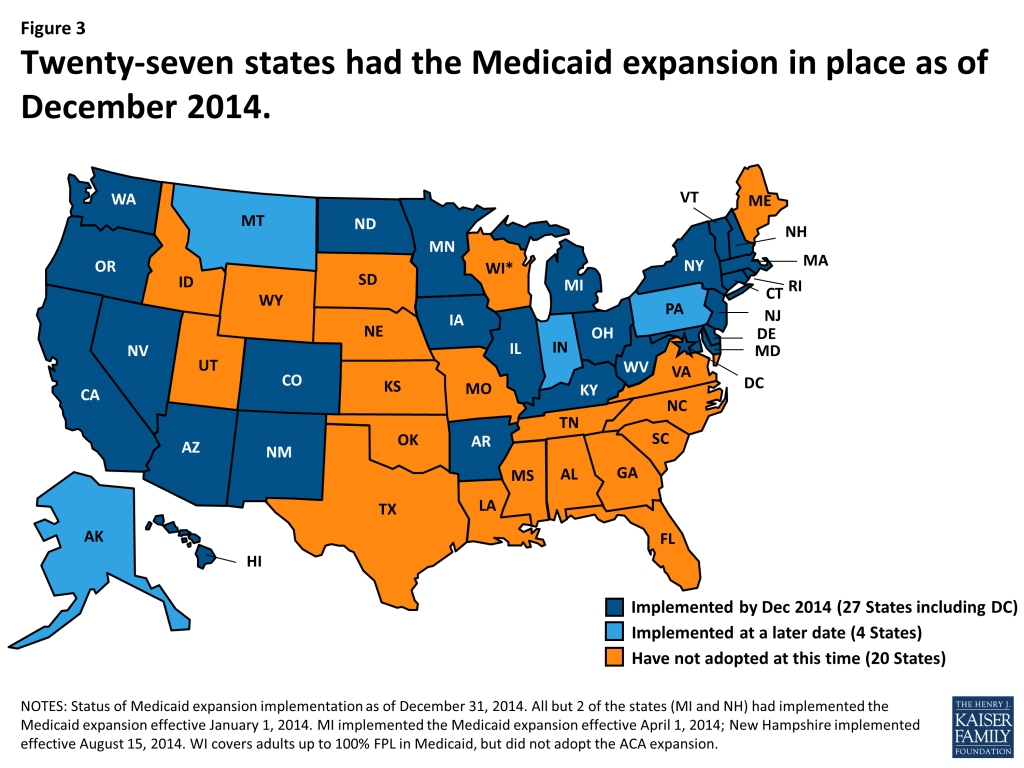
Medicaid’s role for low-income adults continued to grow through the ACA Medicaid expansion. As of January 2016, 31 states have expanded Medicaid eligibility to parents and other non-disabled adults with incomes up to at least 138% FPL. This count reflects the adoption of the Medicaid expansion in three states—Alaska, Indiana, and Montana—during 2015. However, in the 20 states that have not expanded, median eligibility levels are 42% FPL for parents and 0% FPL for other adults, leaving many poor adults in a coverage gap since they earn too much to qualify for Medicaid but not enough for tax credit subsidies to purchase Marketplace coverage, which begin at 100% FPL. Aside from adoption of the Medicaid expansion in three states, there were few changes in eligibility for parents and other adults during 2015. Connecticut reduced eligibility for parents, but eligibility remains above the expansion limit and many of those who became ineligible likely qualify for subsidies to purchase Marketplace coverage. In addition, New York implemented a Basic Health Program (BHP) to offer more affordable coverage to adults with incomes up to 200% FPL, joining Minnesota as the second state with a BHP.

Eligibility levels vary across groups and states, and state Medicaid expansion decisions have increased these differences. Median eligibility levels for children and pregnant women remain well above those for parents and other adults in both Medicaid expansion and non-expansion states. Within each eligibility group, median eligibility levels are higher in expansion states than non-expansion states (Figure 1). As expected, these differences between expansion and non-expansion states are largest for parents and other adults. Underlying these medians, there also is significant variation in eligibility levels across states. Eligibility levels range from 152% to 405% FPL for children, from 138% to 380% FPL for pregnant women, from 18% to 221% FPL for parents, and from 0% to 215% for other adults.

Figure 1: Median Medicaid/CHIP Income Eligibility Thresholds, January 2016

System Enhancements and Streamlined Enrollment and Renewal

Regardless of whether states have implemented the ACA Medicaid expansion to adults, the law ushered in major changes to Medicaid systems and processes in all states. The changes are designed to harness technology to provide a modernized enrollment experience for consumers and may lead to increased administrative efficiencies for states. As documented in last year’s survey, many states faced significant challenges implementing new systems and processes when they were launched in 2014. These difficulties resulted in backlogs and delays in enrollments and renewals, which were a major focus during 2014. This year’s findings show that, in 2015, states resolved many of these challenges and built on successes to refine and enhance their upgraded systems. However, experiences vary across states and lingering challenges remain.

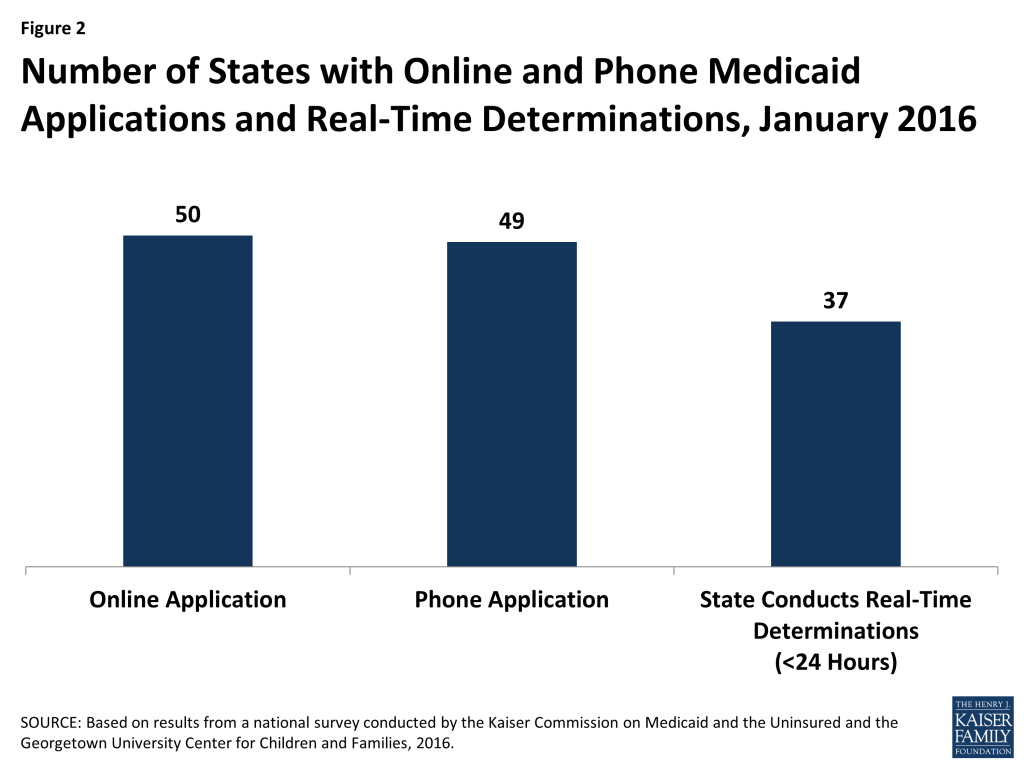
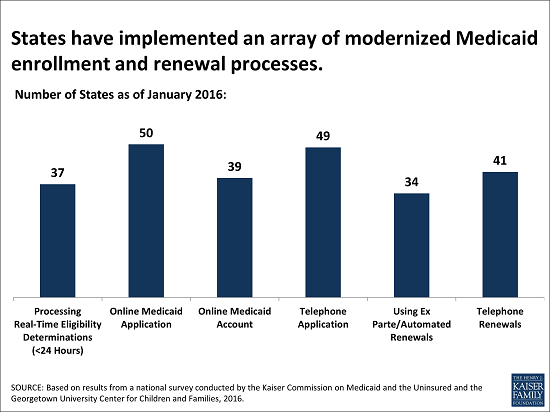
As of January 2016, individuals can apply for Medicaid online or by phone in nearly all states as envisioned by the ACA (Figure 2). All states, except Tennessee, have an online Medicaid application available either through the state Medicaid agency or an integrated portal that provides access to Medicaid and the State-Based Marketplace (SBM). Two states (Arkansas and Florida) began accepting telephone applications for Medicaid in 2015, bringing the total count of states doing so to 49 as of January 2016.

Figure 2: Number of States with Online and Phone Medicaid Applications and Real-Time Determinations, January 2016

As of January 2016, 37 states report they can make real-time Medicaid eligibility determinations (defined as less than 24 hours) for children, pregnant women, and non-disabled adults. Among the 27 states that were able to report the share of applications for these groups that receive a real-time determination, 11 indicated that more than 50% of applications receive a determination in real time.

States expanded functionalities of online applications and accounts during 2015. Reflecting this work, all but one of the 50 online Medicaid applications allow applicants to start, stop, and return to the application, and 33 allow applicants to upload documents as of January 2016. In addition, 39 states allow consumers to create an online account to manage their Medicaid coverage. During 2015, a number of states expanded account functionalities, enabling consumers to report changes, view notices, upload documentation, renew coverage, and more.

Coordination between state Medicaid agencies and the Marketplaces improved during 2015, but challenges remain. Among the 17 states operating a SBM, 13 have a single integrated system that makes eligibility determinations for both Medicaid and Marketplace coverage, which eliminates the need for account transfers between programs. However, the 38 states that rely on the Federally Facilitated Marketplace (FFM), Healthcare.gov, for Marketplace eligibility and enrollment must electronically transfer accounts between Medicaid and the FFM to provide access to all insurance affordability programs. As of January 2016, all 38 states that rely on the FFM report they can receive electronic account transfers from the FFM, and 36 states report they can send electronic account transfers to the FFM. Twenty states report they are having problems or delays with transfers, although the scope of these problems varies across states. Although challenges remain, there has been marked improvement in coordination since the Marketplaces were launched in 2014, when states faced major technical difficulties with transfers that contributed to enrollment delays.

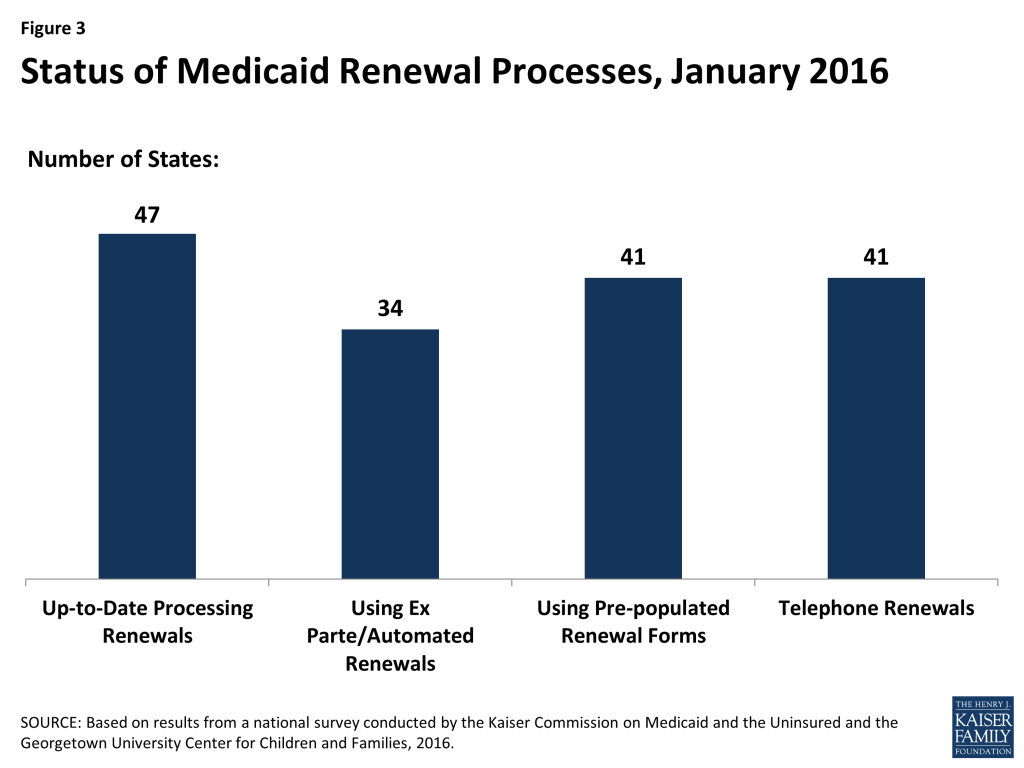
As implementation continues, a number of states eliminated delays in processing renewals and put streamlined renewal procedures in place as established by the ACA. When the ACA was first implemented, there was significant focus on implementing streamlined enrollment processes and establishing coordination between Medicaid and the new Marketplaces. As a result, most states delayed implementing new renewal procedures, and 36 states took up a temporary option to postpone renewals for existing Medicaid or CHIP enrollees during 2014. In 2015, most states caught up on renewals and many made gains in implementing streamlined renewal procedures. As of January 2016, 47 states are up to date in processing renewals for Medicaid (Figure 3). A total of 34 states report they can complete automatic or ex parte renewals by using information from electronic data sources, as outlined in the ACA. Among the 26 states that can report the share of renewals completed using automated processes, 10 indicate that over 50% of enrollees are automatically renewed, including 3 that report automatic renewal rates above 75%. In addition, 41 states can send pre-populated renewal forms, which states must use when they are unable to complete an automated renewal under ACA policies; 41 states offer telephone renewals as outlined by the ACA.

Figure 3: Status of Medicaid Renewal Processes, January 2016

Premiums and Cost-Sharing

Premiums and cost-sharing in Medicaid and CHIP remain limited, although under waiver authority a few states are charging higher levels than otherwise allowed under federal law. The number of states charging premiums or enrollment fees (30 states) or copayments (26 states) for children remained the same during 2015. While most states charge nominal copayments for parents (40 states) and expansion adults (23 of 31 expansion states), states generally do not charge these groups premiums given that most of these individuals have incomes below poverty. However, as of January 2016, five states (Arkansas, Indiana, Iowa, Michigan, and Montana) charge adults monthly contributions or premiums under Section 1115 waiver authority. Indiana also received approval to charge parents monthly contributions and, under separate Section 1916 waiver authority, to charge parents and adults higher cost-sharing for non-emergency use of the emergency room than otherwise allowed under federal law.

Looking Ahead

States’ Medicaid and CHIP eligibility policies and enrollment and renewal processes will play a key role in reaching the remaining low-income uninsured population and keeping eligible individuals enrolled over time. Together, these survey findings show that:

Medicaid and CHIP continue to be central sources of coverage for the low-income population, but access to coverage varies widely across groups and states. Medicaid and CHIP offer a base of coverage to low-income children and pregnant women nationwide. Eligibility for adults has grown under the Medicaid expansion, but remains low in states that have not expanded. Overall, eligibility continues to vary significantly by group and across states, resulting in substantial differences in individuals’ access to coverage based on their eligibility group and where they live.

Upgraded state Medicaid systems help eligible individuals connect to and retain coverage over time, provide gains in administrative efficiencies, and offer new options to support program management. One key outcome of the ACA has been the significant modernization of states’ Medicaid eligibility and enrollment systems. These higher-functioning systems help eligible individuals connect to coverage more quickly and easily, keep individuals enrolled over time, reduce paperwork burdens, and lead to increased administrative efficiencies. Moreover, the modernized systems offer new options to support program management. For example, states may have increased data reporting capabilities and expanded options to connect Medicaid with other systems. Further, as systems and processes become more refined over time, states may be able to manage enrollment more efficiently, which may allow them to refocus resources on other activities.

There remain key questions about how recent changes in eligibility and enrollment may be affected by a range of factors moving forward. Funding for CHIP is set to expire in 2017, raising key questions about the future of the program and what might happen in its absence. In addition, the ACA maintenance of effort provisions for children’s coverage end in 2019. State Medicaid expansion decisions will likely continue to evolve over time, and it remains to be seen how they might be affected by the gradual reduction in federal funding for newly eligible expansion adults, which begins to phase down in 2017 when it reduces to 95%. Pending proposals in current budget reconciliation legislation would roll back the Medicaid expansion to adults and eliminate the maintenance of effort requirements in 2017. Outside of these potential changes, it also will be important to examine how the Section 1115 waivers that allow states to charge adults premiums and monthly contributions are affecting coverage and program administration, particularly given that waiver authority is provided for research and demonstration purposes.

Introduction

January 2016 marks the second anniversary of the effective date of the Affordable Care Act’s (ACA’s) key coverage provisions. During 2015, Medicaid and CHIP continued to be central sources of coverage for low-income children and pregnant women nationwide, and Medicaid’s role for low-income adults grew as a result of the ACA Medicaid expansion. At the end of the second full year of implementation of the ACA’s coverage expansions, states have continued to implement and enhance new and upgraded eligibility and enrollment systems that underpin the ACA’s vision for a modernized data-driven enrollment experience. States also worked to implement automated renewal processes and improve coordination between Medicaid and the Marketplaces, resolving many problems and delays faced during the initial year of ACA implementation.

This annual report presents Medicaid and CHIP eligibility, enrollment, renewal and cost-sharing policies based on a survey of state program officials. It provides a point-in-time snapshot of policies in place as of January 2016 and identifies changes in state policies that occurred between January 2015 and 2016. These changes provide insight into how state policies are evolving from the new baseline that was established at the end of 2014, after the first full year of ACA implementation. State-specific information is available in Tables 1 to 21 at the end of the report.

Medicaid And Chip Eligibility

The ACA established a new minimum Medicaid eligibility level of 138% of the federal poverty level (FPL) for children, pregnant women, parents and non-disabled adults as of January 2014. This new minimum increased eligibility for parents in many states and provided a new eligibility pathway for other non-disabled adults who were largely excluded from Medicaid prior to the ACA. Although the expansion to adults with incomes up to 138% FPL was effectively made a state option by the Supreme Court’s 2012 ruling on the constitutionality of the ACA, the Court’s decision did not impact other eligibility changes in the law. As a result of the new 138% FPL minimum for children in Medicaid, some states moved certain children from CHIP to Medicaid. Moreover, all states implemented the ACA change to determine financial eligibility for Medicaid for children, pregnant women, parents, and non-disabled adults and CHIP based on Modified Adjusted Gross Income (MAGI). This change created alignment with the method used for determining eligibility for subsidies to purchase Marketplace coverage. States continue to determine eligibility for other groups, such as individuals with disabilities and elderly individuals, based on previous non-MAGI-based rules.

The findings below show Medicaid and CHIP eligibility levels for children, pregnant women, parents, and other non-disabled adults as of January 2016 and identify changes in eligibility that occurred between January 2015 and January 2016. These data show that Medicaid and CHIP continue to be central sources of coverage for the nation’s low-income children and pregnant women, with some states adopting optional policies in 2015 that expand access to coverage for certain children and pregnant women. They also highlight the continued growth of Medicaid’s role for low-income adults through the ACA Medicaid expansion.

Children and Pregnant Women

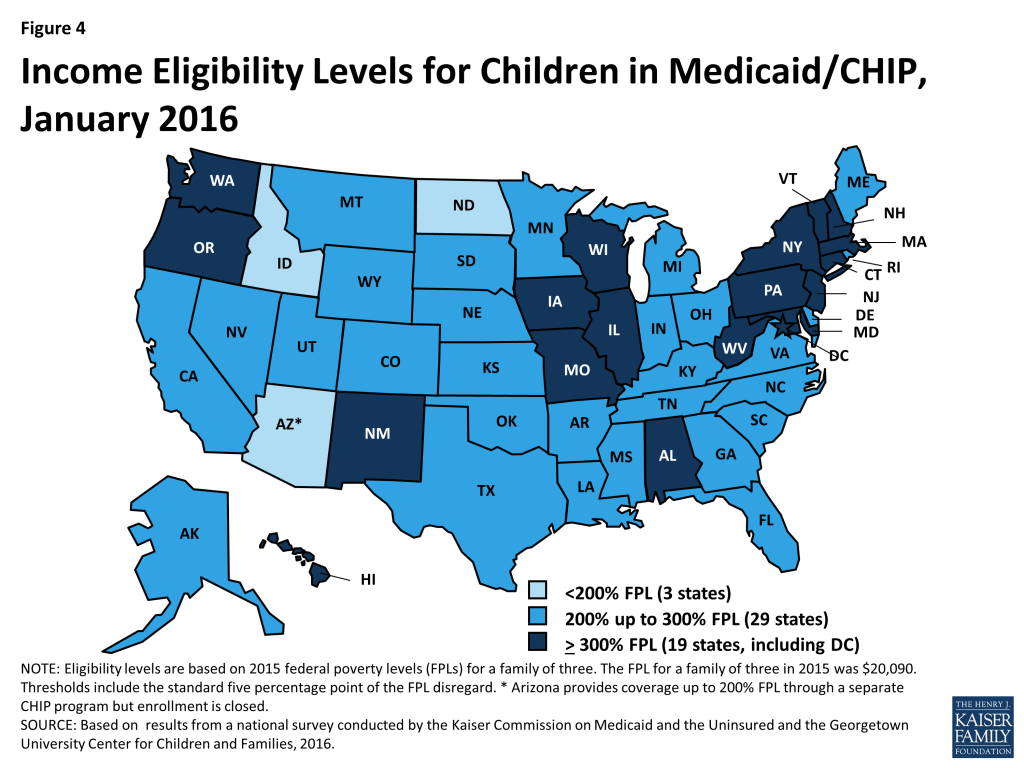
Coverage for children in Medicaid and CHIP remains strong and steady with median eligibility at 255% FPL. Under the ACA’s maintenance of effort protections, states cannot make reductions in children’s eligibility through 2019. Reflecting this protection, there were no policy changes to children’s eligibility in 2015. However, in Kansas, the state’s CHIP eligibility level is tied to the 2008 FPL; thus, CHIP eligibility declined from 247% to 244% FPL and will continue to erode over time. As of January 2016, 48 states cover children with incomes up to at least 200% FPL through Medicaid and CHIP, including 19 states that cover children at or above 300% FPL (Figure 4). Across states, the upper Medicaid/CHIP eligibility limit for children ranges from 152% FPL in Arizona to 405% FPL in New York.

Figure 4: Income Eligibility Levels for Children in Medicaid/CHIP, January 2016

Mirroring previous action taken by California and New Hampshire in 2014, Michigan transitioned all children from its separate CHIP program into Medicaid as of January 2016. In contrast, Arkansas established a new separate CHIP program and moved children with family incomes from 147% to 216% FPL from its CHIP-funded Medicaid expansion to the new separate CHIP program. Enrollment remains open in all states with separate CHIP programs except in Arizona. Arizona froze enrollment in its separate CHIP program at the end of 2009, prior to enactment of the ACA eligibility protections.

States continued to take up options to enhance children’s access to coverage during 2015.

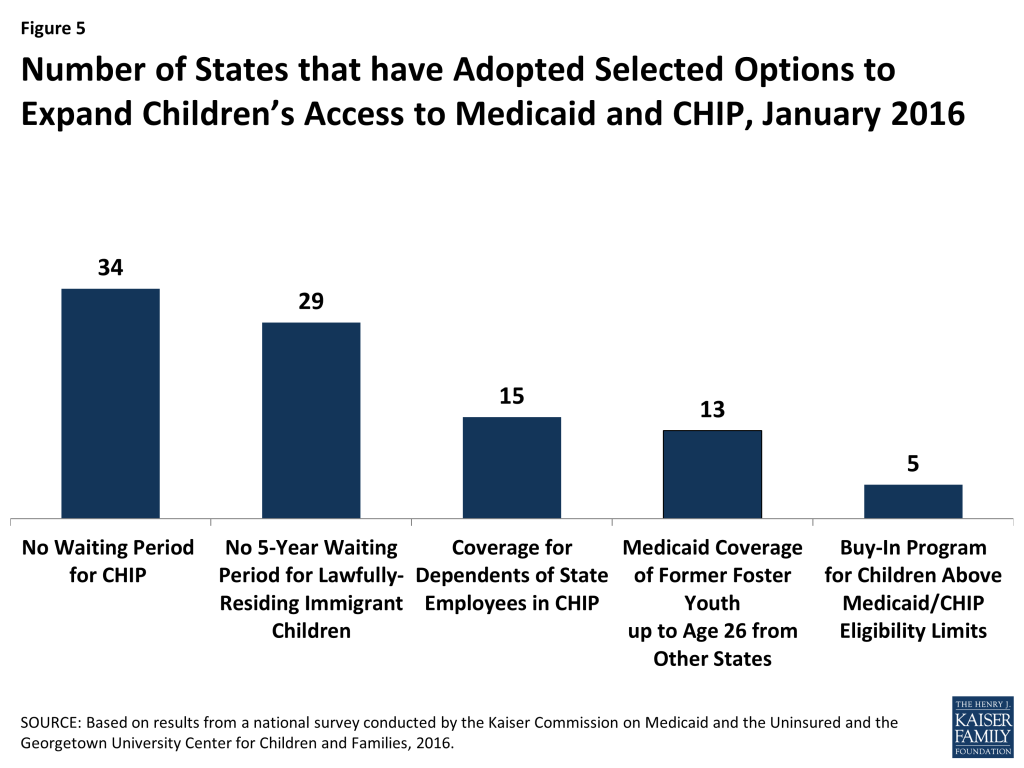
  • Eliminating waiting periods for CHIP coverage. During 2015, Wisconsin eliminated its waiting period for its separate CHIP program. In addition, Michigan’s CHIP waiting period was eliminated when it transitioned all children from its separate CHIP program to Medicaid. With these changes, 24 states have eliminated waiting periods for CHIP since the ACA was enacted in 2010. As of January 2016, 34 states do not have a waiting period for CHIP coverage (Figure 5). However, 16 of the 36 states with separate CHIP programs have a waiting period that requires a child to be uninsured for a period of time prior to enrolling. These waiting periods may not exceed 90 days.
Figure 5: Number of States that have Adopted Selected Options to Expand Children’s Access to Medicaid and CHIP, January 2016
  • Expanding coverage to recent lawfully residing immigrant children. With the addition of Colorado during 2015, 29 states have taken up the option to eliminate the five-year waiting period for lawfully present immigrant children in Medicaid and/or CHIP as of January 2016. In addition, six states (California, District of Columbia, Illinois, Massachusetts, New York, and Washington) use state-only funds to cover some income-eligible children regardless of immigration status.1  This count includes California, which has some local programs that cover children regardless of immigration status and recently passed legislation to cover children regardless of immigration status on a statewide basis starting in 2016.
  • Expanding federally-funded CHIP coverage to dependents of state employees. As of January 2016, 2 additional states (Nevada and Virginia) took up the option to cover otherwise eligible children of state employees in a separate CHIP program, bringing the total number of states that have taken up this option to 15.
  • Expanding coverage for former foster youth. Under the ACA, all states must provide Medicaid coverage to youth who were in foster care in the state up to age 26, but it is a state option to extend this coverage to former foster youth from other states. During 2015, New Mexico took up this option, raising the total number of states covering former foster youth from other states to 13 as of January 2016.

Following a trend since enactment of the ACA, the number of states offering buy-in programs for children in families above Medicaid or CHIP income limits continued to decline. States may offer buy-in programs to allow families with incomes above the upper limit for children’s coverage to buy-in to Medicaid or CHIP for their children. In 2015, North Carolina lifted the income limit on its buy-in program, while Connecticut eliminated its buy-in program. The number of states offering buy-in programs has declined from a peak of 15 in 2011 to 5 as of January 2016, reflecting that families above Medicaid and CHIP income thresholds may have new coverage options available through the Marketplaces.

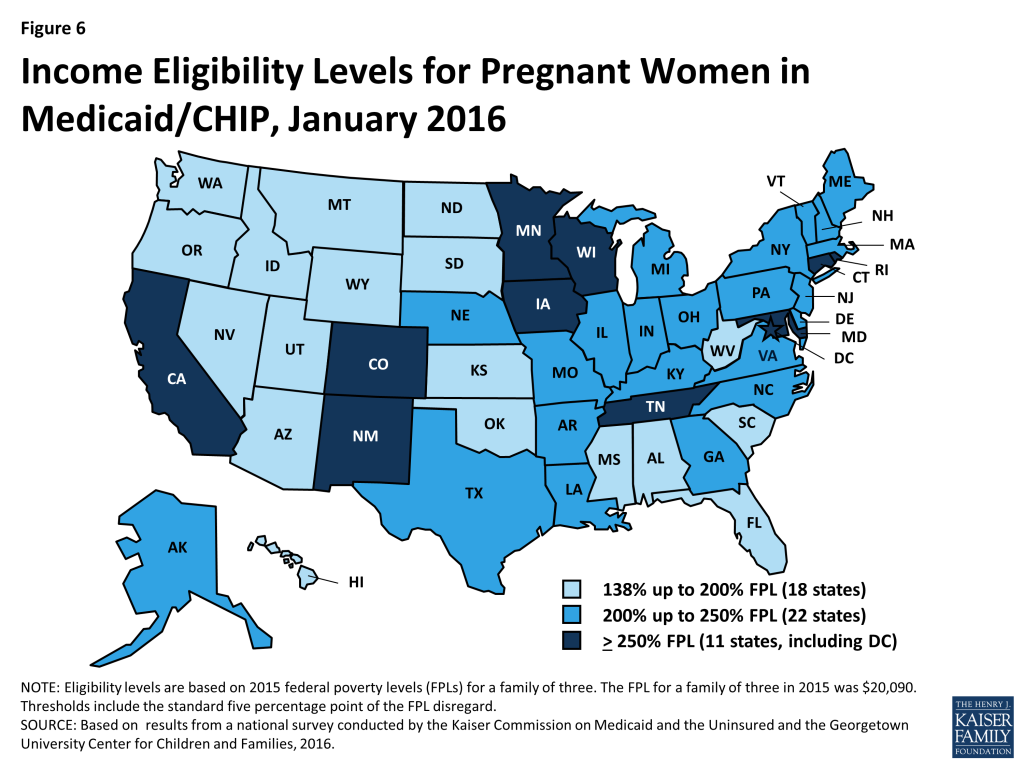
Coverage for pregnant women remained stable in 2015. The median eligibility level for pregnant women in Medicaid or CHIP held steady at 205% FPL, with eligibility ranging from 138% FPL in Idaho and South Dakota to 380% FPL in Iowa. Overall, 33 states cover pregnant women with incomes up to at least 200% FPL (Figure 6). The number of states that have eliminated the five-year waiting period for lawfully residing immigrant pregnant women in Medicaid and/or CHIP remained constant at 23. However, Colorado, which had previously covered recent lawfully-residing pregnant women in Medicaid, expanded this option to pregnant women in CHIP during 2015. The number of states covering income-eligible pregnant women regardless of immigration status through the CHIP unborn child option (15 states) or with state-only funds (3 states) remained unchanged.

Figure 6: Income Eligibility Levels for Pregnant Women in Medicaid/CHIP, January 2016

Parents and Adults

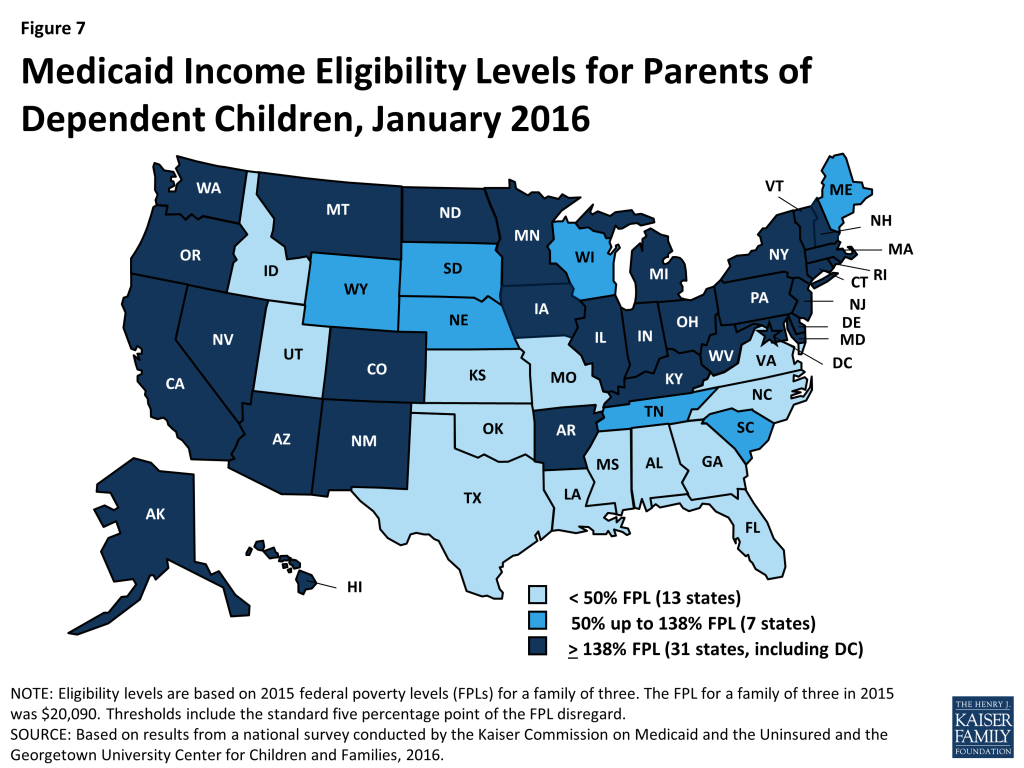
As of January 2016, 31 states, including the District of Columbia, have expanded Medicaid eligibility to parents and other non-disabled adults2  with incomes up to at least 138% FPL. This finding reflects adoption of the ACA Medicaid expansion to low-income adults in three states during 2015–Indiana, Alaska, and, most recently, Montana, where the expansion went into effect on January 1, 2016. Indiana and Montana joined four other states (Arkansas, Iowa, Michigan, and New Hampshire) that expanded Medicaid for adults under Section 1115 waiver authority, allowing them to implement the expansion in ways that extend beyond the flexibility provided by the law.3  During 2015, Pennsylvania moved from implementing its expansion through a waiver to regular expansion coverage, while New Hampshire moved from a regular expansion to a waiver as of January 2016. There is no deadline for states to adopt the Medicaid expansion, and additional states may expand in the future. Medicaid eligibility extends to parents and other adults with incomes up to at least 138% FPL in all 31 expansion states (Figures 7 and 8). Additionally, the District of Columbia covers parents up to 221% FPL and other adults up to 215% FPL. Connecticut reduced parent eligibility during 2015, lowering eligibility from 201% to 155% FPL. However, parent eligibility remains above the 138% FPL minimum, and many parents who lost Medicaid eligibility are likely eligible for subsidies to purchase Marketplace coverage.

Figure 7: Medicaid Income Eligibility Levels for Parents of Dependent Children, January 2016
Figure 8: Medicaid Income Eligibility Levels for Childless Adults, January 2016

As of January 2016, two states—Minnesota and New York—have implemented Basic Health Programs. The ACA provides an option for states to create a Basic Health Program (BHP) for low-income residents with incomes between 138% and 200% FPL, who would otherwise be eligible to purchase Marketplace coverage. Through this option, states provide alternative coverage that may cover more services or be more affordable than what is offered through the Marketplaces, which may reduce movement between plans and coverage types for people whose incomes fluctuate above and below Medicaid levels.4  New York’s BHP will be fully phased in as of January 2016, joining Minnesota as the second state with a BHP. When New York implemented its BHP, it stopped providing some additional Medicaid-funded subsidies to parents with incomes between 138% and 150% FPL who can now receive coverage through the BHP.

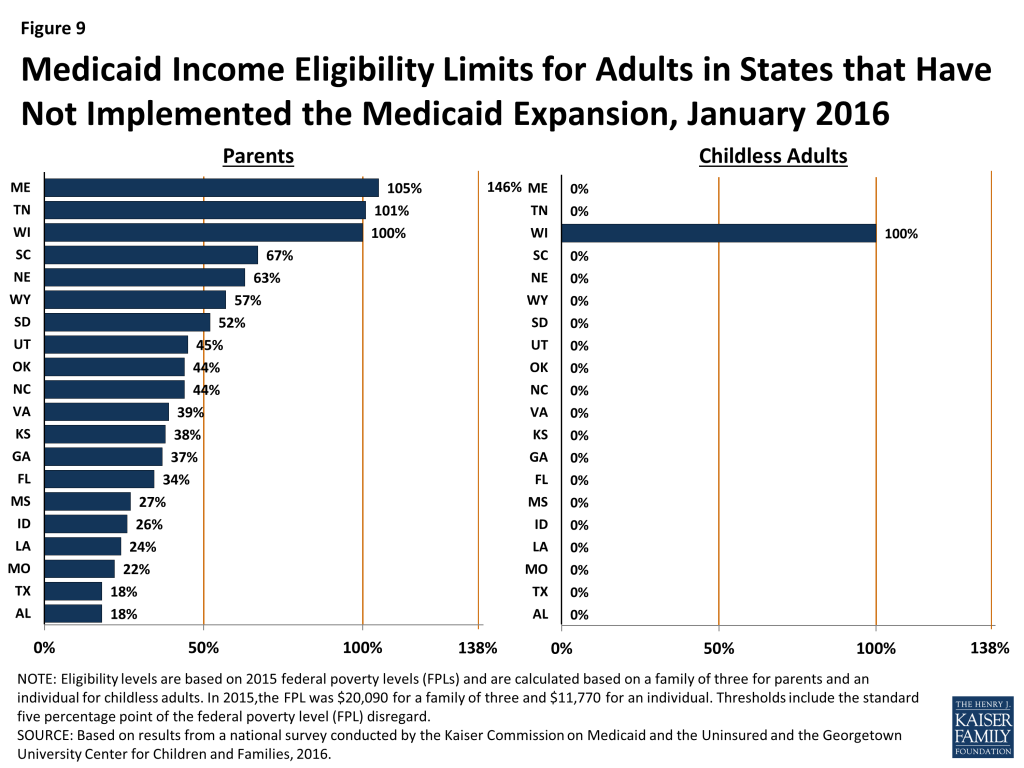
In the 20 states that have not expanded Medicaid, the median eligibility level for parents is 42% FPL; other adults remain ineligible regardless of income in all of these states except Wisconsin. Among the 2o non-expansion states, parent eligibility levels range from 18% FPL in Alabama and Texas to 105% FPL in Maine (Figure 9). Only 3 of these states—Maine, Tennessee, and Wisconsin—cover parents at or above 100% FPL, while 13 states limit parent eligibility to less than half the poverty level ($10,045 for a family of three as of 2015). Wisconsin is the only non-expansion state that provides full Medicaid coverage to other non-disabled adults, although its 100% FPL eligibility limit is lower than the ACA expansion level. While this study reports eligibility based on a percentage of the FPL, it also is important to note that 13 non-expansion states base eligibility for parents on dollar thresholds (which have been converted to an FPL equivalent in this report). Of those states, 12 do not routinely update the standards, resulting in eligibility levels that erode over time relative to the cost of living. Other analysis shows that three million poor adults fall into a coverage gap as a result of these low Medicaid eligibility levels in non-expansion states.5  These adults earn too much to qualify for Medicaid, but not enough to qualify for subsidies for Marketplace coverage, which are available only to those with incomes at or above 100% of FPL.

Figure 9: Medicaid Income Eligibility Limits for Adults in States that Have Not Implemented the Medicaid Expansion, January 2016

Eligibility levels for parents and other adults remain lower than those for children and pregnant women. Among expansion and non-expansion states, median eligibility levels for parents and other adults remain lower than those for pregnant women and children (Figure 10). In expansion states, median Medicaid and CHIP eligibility levels are 305% FPL for children and 213% FPL for pregnant women compared to 138% FPL for parents and other adults. However, these differences are more pronounced in states that have not implemented the Medicaid expansion. In the non-expansion states, the median Medicaid and CHIP eligibility level is 215% for children and 200% for pregnant women compared to 42% FPL for parents and 0% for other adults.

Figure 10: Median Medicaid/CHIP Income Eligibility Thresholds, January 2016

Medicaid And Chip Enrollment And Renewal Processes

During 2015, states continued to implement system enhancements and adopt processes to implement the ACA’s vision of a modernized data-driven enrollment experience and a largely automated renewal process. Adoption of these procedures represents significant transformation and streamlining in many states that previously relied on paper-based enrollment and renewal processes for Medicaid and CHIP. As states continued work developing the information technology systems that underpin enrollment and renewal, their functionality increased as demonstrated by the growing number of states that are able to make real-time eligibility determinations and automatically renew coverage. Coordination between Medicaid and the Marketplaces also improved considerably in 2015, but there are lingering challenges to ensure smooth transitions between coverage programs for individuals.

Eligibility and Enrollment Systems

In order to implement the new enrollment and renewal processes outlined in the ACA, most states needed to make major improvements to or build new Medicaid and CHIP eligibility and enrollment systems and coordinate enrollment with the Marketplaces. To support system development, the federal government provided 90% federal funding for system design and development. This increased funding level was initially set to expire at the end of 2015, but CMS finalized a rule in December 2015 to extend the higher federal match permanently.6  The extension of this funding will support continued work in states that have not implemented enhanced system functionality to fully meet ACA requirements. It also will support continued state work to phase in additional capabilities and consumer features and keep systems current as technology evolves in the future. Higher functioning systems facilitate the ability to enroll and keep eligible individuals in coverage by reducing paperwork burdens and allowing individuals to manage more activities through an online environment. They also may contribute to increased administrative efficiencies. Moreover, as these systems and processes become more refined, they may enable states to manage larger enrollments more efficiently, allowing them to refocus resources on other services such as helping individuals understand how to use their health care services. They may also provide new tools and options to support program management, such as increased data reporting and data connections with other systems or programs.

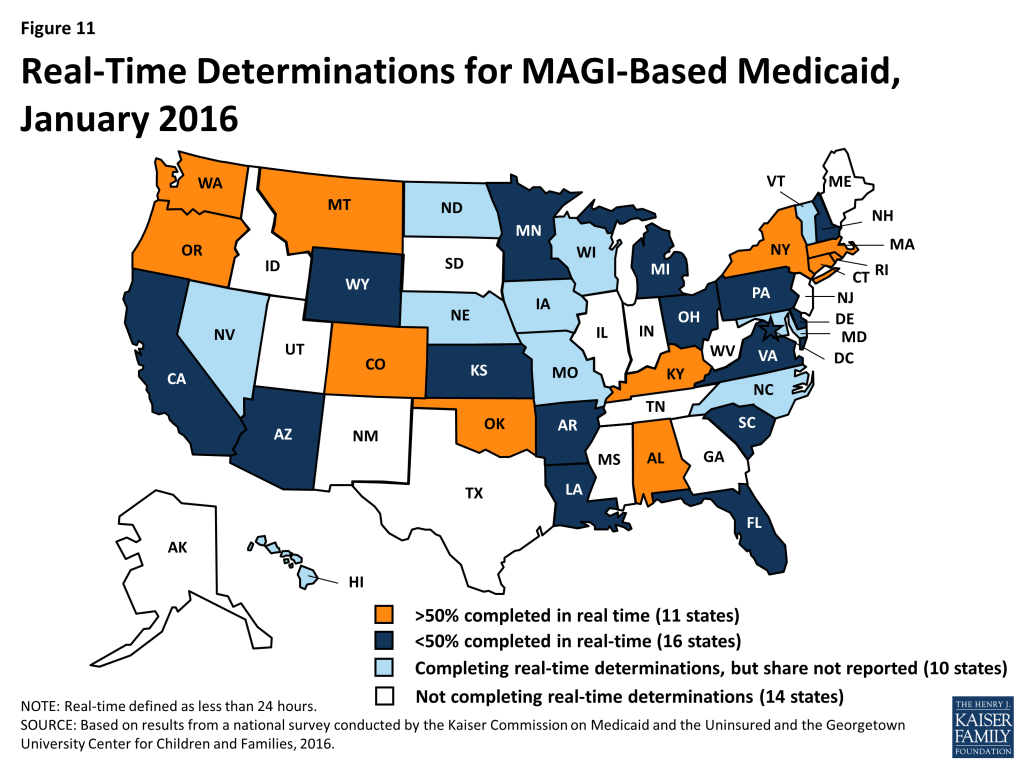
As of January 2016, 37 states can complete MAGI-based eligibility determinations in real-time (defined as less than 24 hours), and 11 states indicate that at least 50% of MAGI-based applications receive a real-time determination. Among the 27 states that were able to report the percentage of MAGI-based applications that receive a real-time determination, 11 states report a success rate that exceeds 50%, including 9 that report a rate over 75%. In the remaining 16 states, less than half of MAGI-based applications receive a determination in real-time (Figure 11). Looking ahead, many states will continue to work to increase the share of applications that receive a real-time determination.

Figure 11: Real-Time Determinations for MAGI-Based Medicaid, January 2016

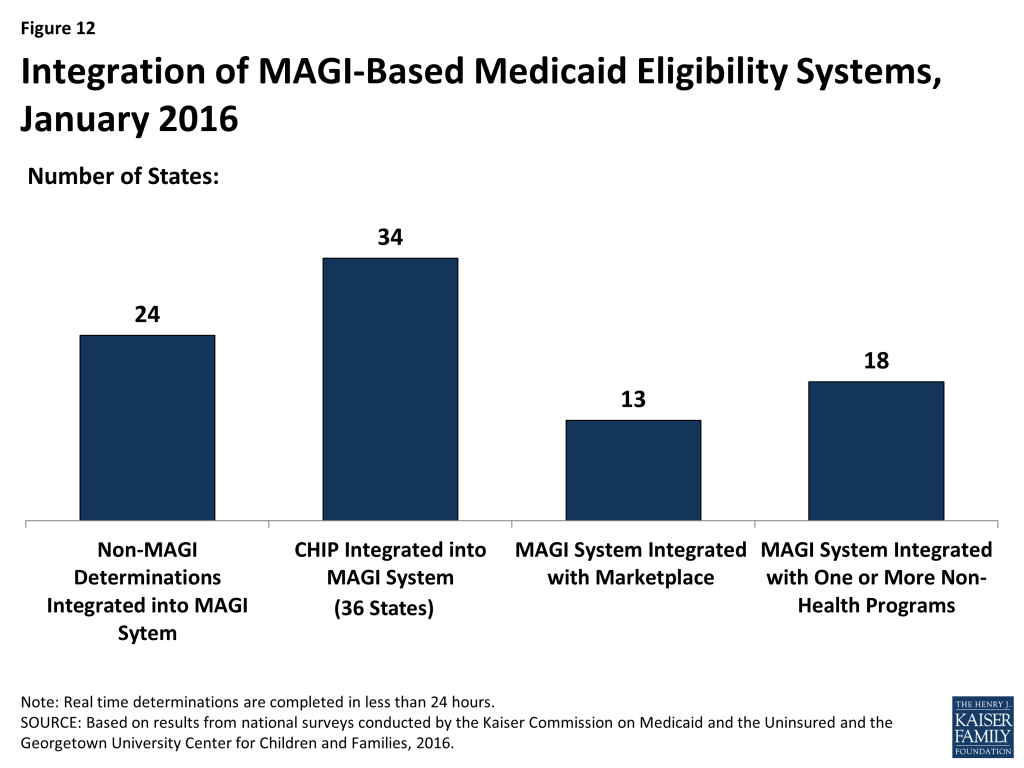
As of January 2016, states vary in the integration of other health programs in their MAGI-based Medicaid systems (Figure 12). During 2015, three states (Florida, Nebraska, and Virginia) integrated eligibility determinations for non-MAGI groups, which include elderly individuals and individuals with disabilities, into their MAGI-based systems. With these additions, 24 states process MAGI and non-MAGI groups through the same system as of January 2016. Most states with a separate CHIP program (34 of 36 states) have CHIP integrated into the MAGI-based system. Among the 17 states operating a State Based Marketplace (SBM), 13 have a single, integrated system that makes eligibility determinations for both MAGI-based Medicaid and Marketplace coverage. With Hawaii transitioning eligibility determinations from its SBM to the Federally Facilitated Marketplace (FFM) in 2015, 4 SBM states and the 34 FFM and Partnership states are using Healthcare.gov for Marketplace eligibility and enrollment functions as of January 2016. These 38 states all must maintain a separate Medicaid eligibility and enrollment system at the state level.

Figure 12: Integration of MAGI-Based Medicaid Eligibility Systems, January 2016

In 18 states, the MAGI-based Medicaid system is integrated with at least one non-health program, and a number of states are planning further integration in the future. Prior to the implementation of the ACA, 45 states had integrated systems to determine eligibility for Medicaid and other non-health programs such as the Supplemental Nutrition Assistance Program (SNAP or food stamps), Temporary Assistance for Needy Families (TANF), and childcare assistance. As states upgraded or built new Medicaid eligibility systems, many delinked these programs from the Medicaid system due to the large scale of the changes. However, as of January 2016, 18 states had integrated at least one non-health program into their MAGI-based Medicaid system. Colorado delinked non-health programs from its Medicaid system when it integrated its Medicaid system with its Marketplace system in 2015. However, a number of states plan to phase in additional non-health programs into their Medicaid system in 2016 or beyond. The continuation of enhanced funding for system development, as well as flexibility provided by CMS that requires other programs to pay only the incremental integration costs, support these efforts. Although this flexibility was slated to end at the close of 2015, CMS extended it for three more years.7 

Coordination between Medicaid and Marketplace systems improved considerably in 2015, but there are lingering challenges. In the 38 states relying on the FFM for Marketplace eligibility and enrollment functions, electronic accounts must be transferred between the federal and state systems to provide a coordinated, seamless enrollment experience for individuals as envisioned by the ACA. Such transfers are not necessary in the 13 SBM states with an integrated Medicaid and Marketplace eligibility system although, in some cases, data transfers must occur after the eligibility determination to complete enrollment. Among the 38 states relying on the FFM for eligibility and enrollment, 8 states have authorized the federal system to make final Medicaid eligibility determinations, which can expedite the enrollment process. However in these states, the FFM still must transfer accounts to the Medicaid agency to complete enrollment. The remaining 30 states allow the FFM to assess rather than determine Medicaid eligibility. These counts reflect three states (Louisiana, North Dakota, and Oregon) choosing to rely on the FFM for assessments rather than final determinations, and one state (Alaska) adopting the option for the FFM to make final determinations rather than assessments during 2015. States relying on the FFM for assessments must use the information received in the account transfer to determine eligibility based on the same verification requirements in place for individuals who apply directly through the state Medicaid agency. This process may require checking other data sources or requesting documentation for information that cannot be confirmed electronically. During 2014, there were significant difficulties with account transfers that contributed to delays in Medicaid enrollment. However, there have since been improvements in transfer functionality with all 38 states that rely on the FFM for Marketplace eligibility and enrollment functions reporting that they are receiving electronic account transfers from the FFM, and 36 states reporting that they are sending electronic account transfers to the FFM as of January 2016. A little more than half of these states (20 states) report they are still experiencing some delays or difficulties with transfers, although the scope of these challenges varies across these states.

Applications

Under the ACA, states must provide multiple methods for individuals to apply for health coverage, including online, by phone, by mail, and in person, using a single streamlined application for Medicaid, CHIP, and Marketplace coverage. The use of online applications, as well as online accounts, gives states new opportunities to offer features and functions that enhance individuals’ enrollment experience and expand their ability to manage their ongoing Medicaid coverage, which may help eligible individuals enroll and retain coverage over time. The increased use of technology may also provide administrative efficiencies to states by reducing paperwork and manual input of information that enrollees can report online, such as an address change. This growth in the use of technology has been supported by the 90% federal match for systems development and 75% federal match for ongoing operations that are now permanently available to states.

As of January 2016, individuals can apply online or by phone for Medicaid in nearly all states. In all states, except Tennessee, there is an online Medicaid application available through the state Medicaid agency or, in SBM states, an integrated portal that provides access to Medicaid and the SBM. In addition, 24 states offer an integrated online application that allows individuals to apply for Medicaid and non-health programs, such as SNAP or TANF. These states largely align with those states that have Medicaid and non-health programs integrated into a single eligibility system, although a few states are using separate eligibility systems to process multi-benefit applications. With the addition of Arkansas and Florida during 2015, 49 states are accepting Medicaid applications by phone as of January 2016. The number of states providing online and telephone Medicaid applications has significantly increased since initial implementation of the ACA changes in 2014 (Figure 13).

Figure 13: Number of States with Online and Telephone Medicaid Applications Over Time

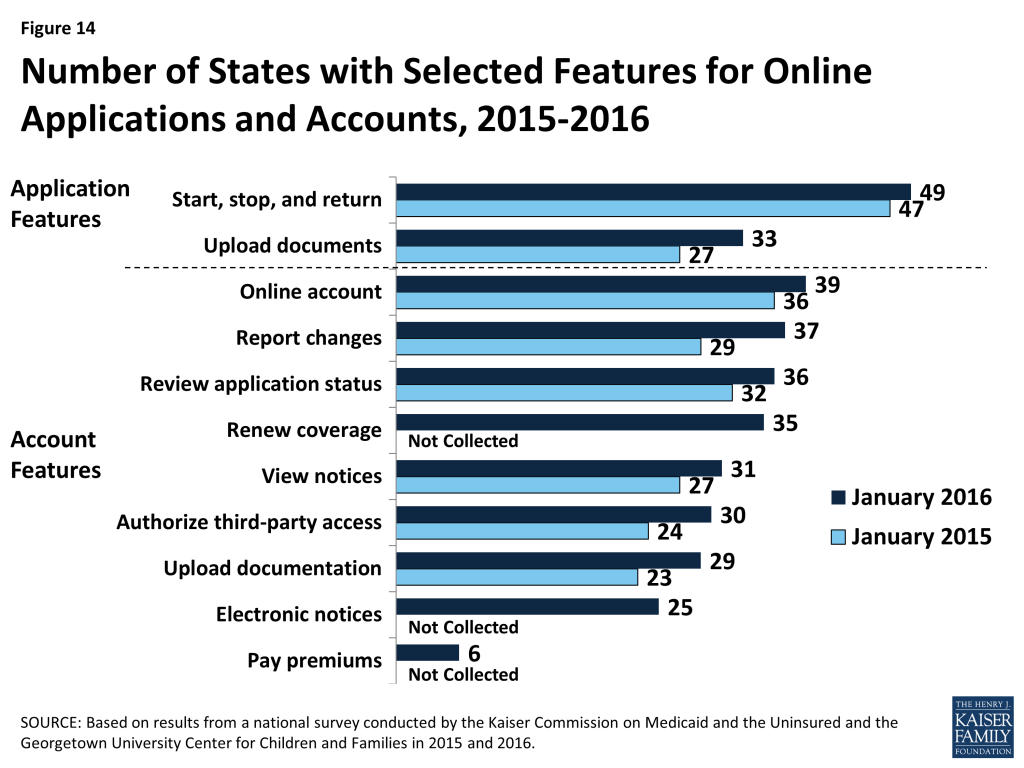
A number of states expanded the functionality of online applications and accounts during 2015. Between January 2015 and 2016, the number of states that provide applicants the option to start, stop, and return to complete their application at a later time increased from 47 to 49, while the number of states that allow applicants to upload electronic copies of documentation through the online application increased from 27 to 33 (Figure 14). In addition, the number of states that provide individuals the opportunity to create an online account for ongoing management of their Medicaid coverage rose from 36 to 39, with the addition of North Dakota, South Carolina, and South Dakota. A larger number of states added features to existing online accounts. Specifically, there were increases in the number of states that allow individuals to use their online account to report changes (29 to 37 states), review the status of their application (32 to 36 states), view notices (27 to 31 states), authorize third-party access (24 to 30 states), and upload documentation (23 to 29 states). This year’s survey also asked about additional account functionalities and found that individuals can use their account to renew coverage in 35 states, go paperless and receive electronic notices in 25 states, and pay premiums in 6 of the 32 states that charge premiums in Medicaid or CHIP. Additional states plan to add online accounts in 2016 or beyond, while states with online accounts plan to continue to add features. These online functions provide timely and convenient access to account information that is commonplace in today’s digital age, and may lead to administrative efficiencies by reducing mailing costs, call volume, and manual processing of updates. The ability for consumers to see and manage their application and information online also may contribute to increased enrollment and retention levels over time.

Figure 14: Number of States with Selected Features for Online Applications and Accounts, 2015-2016

Nearly half of the states (24 states) provide a web portal or secure login for authorized consumer assisters to submit applications they have facilitated on behalf of consumers. In some cases, these portals provide additional administrative features that support the work of assisters, such as the ability to check a renewal date or update an address. Providing better tools for assisters may reduce state administrative workloads and free resources for other consumer services. This functionality may also allow the agency to track, monitor and report application activity by assister more thoroughly, accurately, and efficiently.

Verification of Eligibility Criteria

Under the ACA, all states must verify income eligibility and citizenship or immigrant status but they have flexibility to accept self-attestation for other criteria such as age/date of birth, state residency, and household composition. If verification is required, states are expected to use electronic data sources to the extent possible. Verifying eligibility criteria electronically is not only technically complicated, but requires the establishment of data sharing agreements between agencies to ensure that the privacy and security of personally identifiable information is protected. These challenges in accessing electronic data sources can slow state progress in implementing or maximizing real-time eligibility determinations and automated renewals without the intervention of an eligibility worker. However, as of 2016, a number of states are reporting success completing real-time eligibility determinations and automatic renewals that are facilitated through electronic data matches.

States are relying on a mix of data sources to electronically verify eligibility criteria. To facilitate electronic verification, a federal data hub was established that allows states to access information from multiple federal agencies, including the Internal Revenue Service, the Social Security Administration (SSA), and the Department of Homeland Security (DHS), which is used by almost three quarters of states. States not using the federal hub rely on pre-ACA linkages to SSA and DHS databases. Nearly all states also use state databases that collect quarterly state wage information or unemployment compensation, which may contain more current income information. About half of the states also use information from their state vital records while a smaller number of states access information from other state databases, such as the Department of Motor Vehicles or State Tax Department.

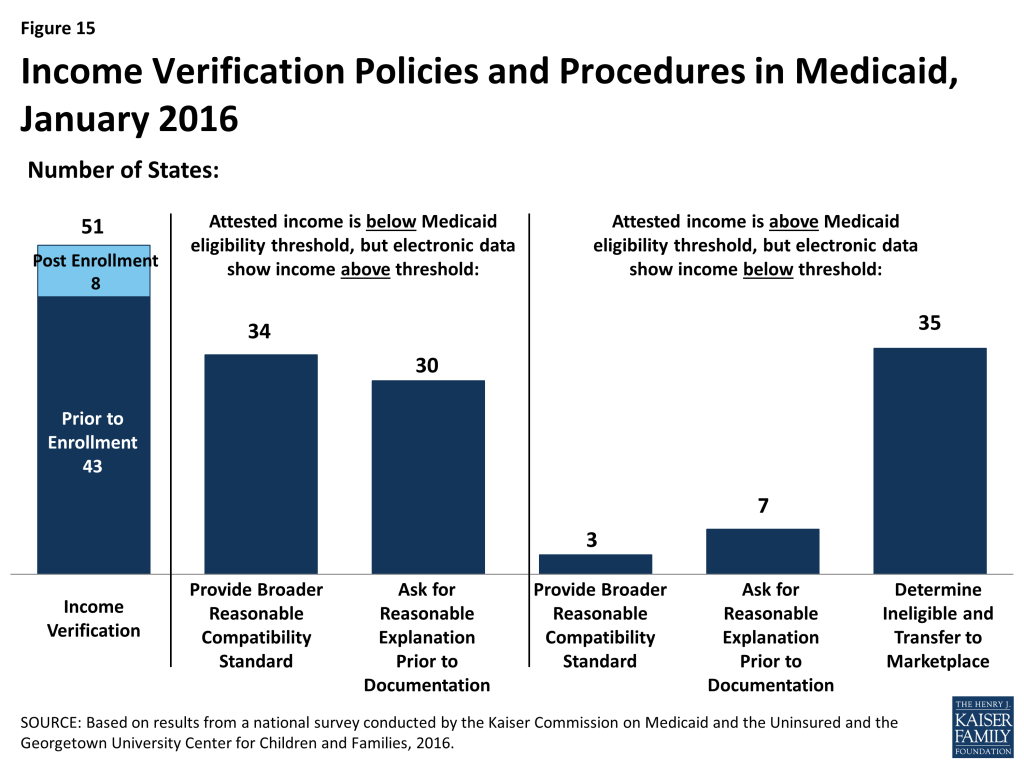
As of January 2016, 43 states use electronic data sources to verify income prior to enrollment, while 8 states verify after enrollment (Figure 15). States are required to verify income electronically either prior to or after enrollment and may apply “reasonable compatibility standards” to account for differences in self-reported income and data from electronic sources. If self-reported income and the data from the electronic source are both above or below the Medicaid or CHIP eligibility threshold, states must disregard the discrepancy since it does not impact eligibility. States have the option to establish broader reasonable compatibility standards, which 34 states have adopted for cases in which self-attested income is below but electronic data sources show income above the Medicaid or CHIP eligibility limit. If the difference is within this reasonable compatibility standard, which is most often 10%, states accept the self-reported income. In contrast, only three states (Colorado, Florida and New Jersey) have adopted a reasonable compatibility standard for when self-reported income is above the income standard but the electronic data source is below. In these circumstances, 35 states deny Medicaid or CHIP eligibility and transfer the account for an assessment of Marketplace eligibility. Regardless of whether they have set broader reasonable compatibility standards, states may accept a reasonable explanation of the difference (e.g., the individual lost a job) in lieu of requiring paper documentation.

Figure 15: Income Verification Policies and Procedures in Medicaid, January 2016

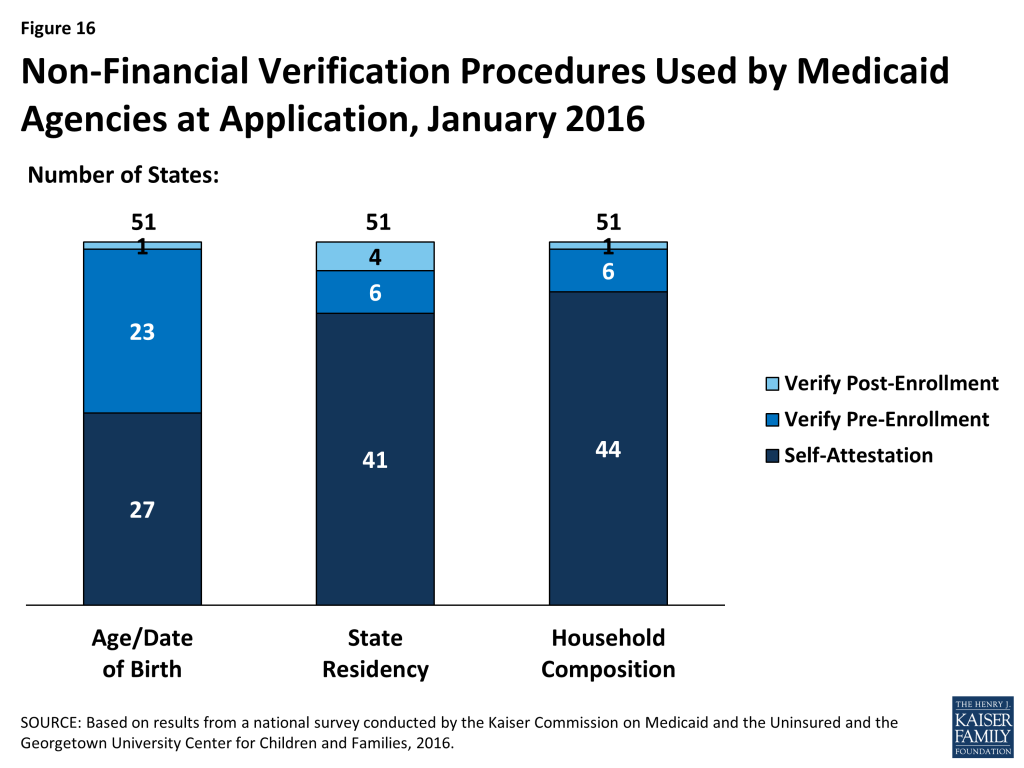
States’ procedures to verify non-financial eligibility criteria continue to evolve as their systems and electronic verification capacity develop. For non-financial eligibility criteria, including age/date of birth, state residency, and household composition, states may accept self-attestation or verify either before or after enrollment. Accepting self-attestation expedites the process for states and applicants, particularly when the state lacks access to trusted data sources that can be used for verification purposes. For states that rely on self-attestation, verification is required if a state has any information on file that conflicts with the self-attestation. As of January 2016, just over half of the states accept self–attestation of age/date of birth (27 states), while a majority of states do so for state residency (41 states) and household size (44 states) (Figure 16). The remaining states verify these eligibility criteria either prior to enrollment or post-enrollment, and about half of those states re-verify the information at renewal.

Figure 16: Non-Financial Verification Procedures Used by Medicaid Agencies at Application, January 2016

Facilitated Enrollment Options

States vary in their use of policy options to streamline enrollment. As states achieve high rates of real time eligibility determinations, the reliance on facilitated enrollment options may decline. However, there will always be some individuals who may benefit from expedited paths to enrollment since not all individuals will be able to have eligibility verified in real time. As of January 2016, states continue to rely on a range of these policy options to provide facilitated access to coverage as discussed below.

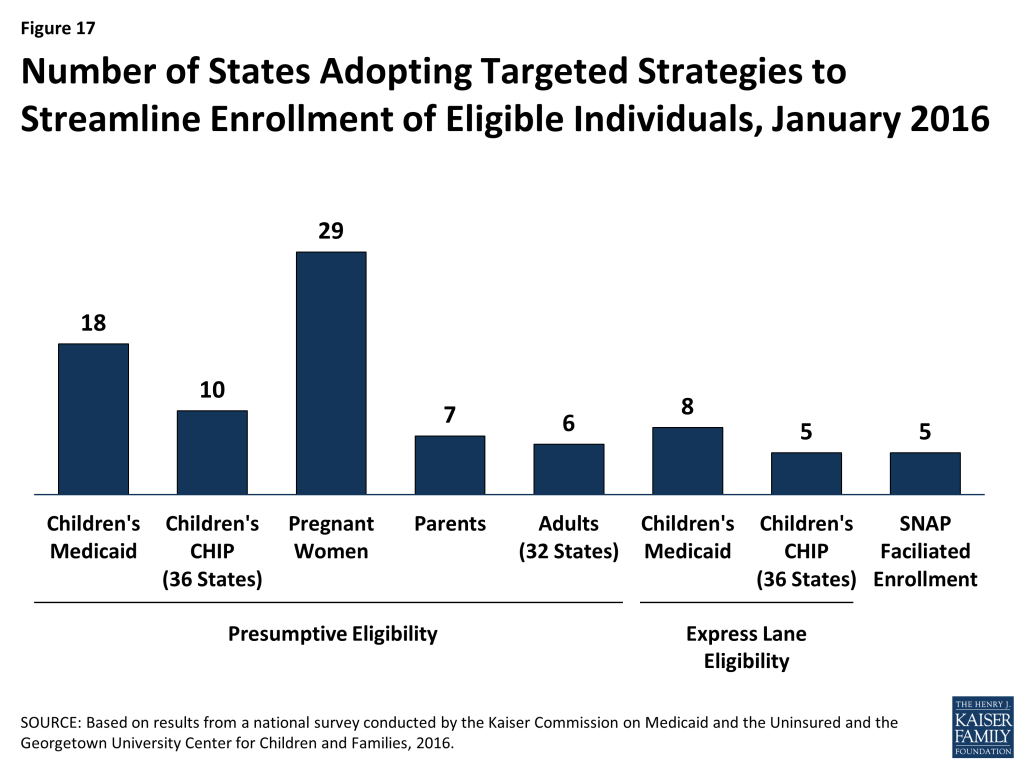
  • Presumptive eligibility. Presumptive eligibility is a longstanding option in Medicaid and CHIP, which allows states to authorize qualified entities—such as community health centers or schools—to make a temporary eligibility determination to expedite access to care for children and pregnant women while the regular application is being processed. The ACA broadened the use of presumptive eligibility in two ways. First, the law allows states that use qualified entities to presumptively enroll children or pregnant women to extend the policy to parents, adults, and other groups. As of January 2016, 18 states use presumptive eligibility for children in Medicaid, 10 for children in CHIP, 29 for pregnant women, 7 for parents, and 6 for other adults (Figure 17). This count reflects expansion of the use of presumptive eligibility to parents and adults in Colorado and Montana; to children in Medicaid and CHIP, parents, and adults in Indiana; and to pregnant women in Kansas during 2015. Second, the ACA gives hospitals nationwide the authority to determine eligibility presumptively for Medicaid for all non-elderly, non-disabled individuals. Hospital-based presumptive eligibility has been implemented in 45 states as of January 2016.
Figure 17: Number of States Adopting Targeted Strategies to Streamline Enrollment of Eligible Individuals, January 2016
  • Express Lane Eligibility. Express Lane Eligibility (ELE) is another pre-ACA option that allows states to enroll children in Medicaid or CHIP based on findings from other programs, like SNAP. During 2015, Oregon discontinued the use of ELE, while Iowa began using ELE to enroll CHIP eligible children. Following this state action, eight states (Alabama, Colorado, Georgia, Iowa, Louisiana, New Jersey, New York, and South Carolina) use ELE to enroll children in Medicaid, and five states (Colorado, Georgia, Iowa, New Jersey, and Pennsylvania) use ELE to enroll CHIP eligible children as of January 2016.
  • Facilitated enrollment using SNAP data. In 2013, CMS offered states new temporary facilitated enrollment options, including using SNAP data to identify and enroll eligible individuals and using child enrollment data to expedite parent enrollment. In 2015, CMS made the SNAP facilitated enrollment option permanent.8  As of January 2016, five states (Arkansas, California, New Jersey, Oregon, and South Dakota) are using the facilitated SNAP enrollment strategy. Given that analysis has shown that facilitated enrollment strategies contribute to success enrolling newly eligible adults and children and reducing administrative costs,9  other states may consider adopting the SNAP enrollment practice now that it is a permanent state option.

Renewal Processes

Many states eliminated delays in renewals during 2015. When the ACA was initially implemented, states and the federal government focused heavily on implementing streamlined enrollment processes and establishing coordination between Medicaid and Marketplace coverage. As a result, most states were delayed in implementing the new renewal procedures and 36 states took up a temporary option to postpone renewals for existing Medicaid or CHIP enrollees during 2014.10  During 2015, most states caught up on renewals. As of January 2015, 47 states reported that they are up to date in processing Medicaid renewals.

States continued to implement streamlined renewal processes, with 34 states using automated renewal processes as of January 2016, including 10 states that automatically verify ongoing eligibility for more than half of MAGI-based renewals. Similar to data-driven enrollment processes, the ACA requires states to first use available data to determine if ongoing eligibility can be established without requiring the individual to fill out a renewal form or provide paper documentation. As of January 1, 2016, 34 states are using this automated renewal process—known as ex parte. Not all of these states were able to report the share of renewals that are automatically renewed through this process. However, among the 26 states that did report this data, 10 states reported that they are successfully renewing more than 50% of enrollees automatically, with 3 achieving automatic renewals rates above 75% (Figure 18). Under ACA policies, if a renewal cannot be completed automatically based on data, states must send the enrollee a pre-populated notice or renewal form. As of January 2016, 41 states report they are able to send forms or notices that are pre-populated with information (beyond demographics), and 14 states use updated sources of data to populate the form. As is the case with enrollment, the ACA also requires states to provide individuals the option to renew their coverage by telephone. As of January 2016, 41 states provide this renewal option.

Figure 18: Automated/Ex Parte Renewals for MAGI-Based Medicaid, January 2016

States continue to use other policy tools to boost retention.

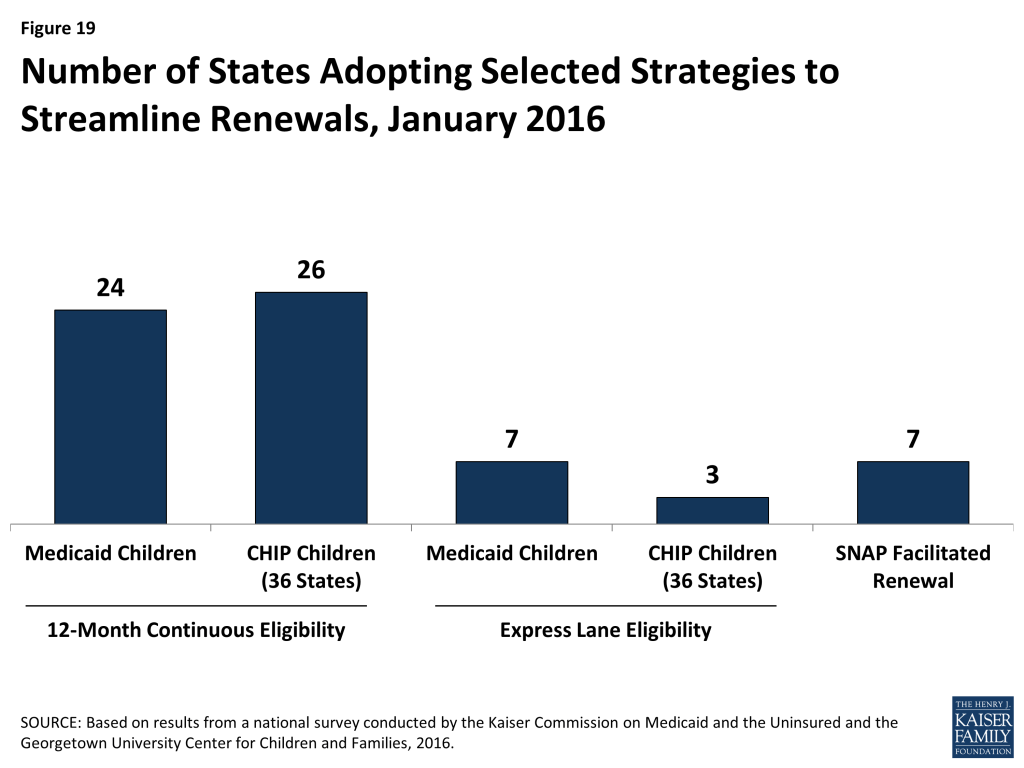
  • 12-month continuous eligibility. The ACA established a new policy that requires states to renew coverage no more frequently than once every 12 months. However, enrollees still are required to report changes and will lose coverage if these changes make them ineligible. One way states can provide more stable coverage over time is to provide 12-month continuous eligibility, which provides a full year of coverage regardless of changes in income or household size. This policy promotes retention and improves the ability of states to measure quality. It also reduces the number of people moving on and off of coverage due to small changes in income and lowers state administrative costs that result from processing small changes in income. States have an option to adopt 12-month continuous eligibility for children, but must obtain a waiver to provide it to other groups. As of January 2016, 24 states provide 12-month continuous eligibility to children in Medicaid, while 26 of 36 states with a separate CHIP program have adopted the policy, including Arkansas for its newly established separate CHIP program (Figure 19). In addition, as of January 2016, New York and Montana provide 12-month continuous eligibility to parents and other adults under Section 1115 waiver authority.
Figure 19: Number of States Adopting Selected Strategies to Streamline Renewals, January 2016
  • Express Lane Eligibility and Facilitated Renewal Using SNAP data. As is the case at enrollment, states can use ELE to streamline renewals. With the addition of Colorado, as of January 2016, 7 states (Alabama, Colorado, Iowa, Louisiana, Massachusetts, New York, and South Carolina) use ELE at renewal for children in Medicaid, and 3 of the 36 states with separate CHIP programs (Colorado, Massachusetts, and Pennsylvania) use ELE for CHIP renewals. In addition, Massachusetts uses ELE to renew parents and other adults in Medicaid under Section 1115 waiver authority. The new option or waiver to use SNAP data to expedite enrollment of eligible individuals also applies to using SNAP data to renew coverage for enrollees. As of January 2016, seven states (Alaska, Arkansas, New Jersey, Oregon, South Dakota, Tennessee, and Virginia) are using SNAP data to renew Medicaid coverage under the waiver or option.

Premiums And Cost-sharing

Given that additional expenses can strain the budgets of low-income individuals and families, federal rules in Medicaid and CHIP set limits on the amounts that states can charge for premiums and cost-sharing, including copayments, coinsurance, and deductibles (see Box 1). In light of this, premiums and cost-sharing generally remain low in Medicaid and CHIP as of January 1, 2016, with few changes in 2015. However, under Section 1115 waiver authority, several states have implemented monthly contributions or premiums for adults that would not otherwise be allowed under federal rules.

Box 1: Premium and Cost-sharing Rules for Medicaid and CHIP

States have flexibility to impose premiums and cost-sharing in Medicaid. The maximum allowable charges vary by income and coverage group within federal rules:

Premiums in Medicaid. Medicaid enrollees, including children, pregnant women, parents and the adult expansion group, with incomes below 150% FPL may not be charged premiums. Premiums are allowed for Medicaid enrollees (both children and adults) with incomes above 150% FPL.

Cost-sharing in Medicaid. Children with incomes below 133% FPL generally cannot be charged cost-sharing. Cost-sharing is allowed for adults enrolled in Medicaid, but charges for those with incomes below 100% FPL are limited to nominal amounts. Cost-sharing cannot be charged for preventive services for children or emergency, family planning, or pregnancy-related services in Medicaid. Under the ACA, preventive services defined as essential health benefits in Alternative Benefit Plans (ABP) in Medicaid also are exempt from cost-sharing for any individual enrolled in an ABP.

Out-of-pocket limit in Medicaid. Overall premium and cost-sharing amounts for family members enrolled in Medicaid may not exceed five percent of household income.

Premiums and Cost-sharing in CHIP. States have somewhat greater flexibility to charge premiums and cost-sharing for children covered by CHIP, although there remain federal limits on the amounts that can be charged, including an overall cap of five percent of household income.

See: Premiums, Copayments, and other Cost-Sharing at http://www.medicaid.gov/medicaid-chip-program-information/by-topics/cost-sharing/cost-sharing.html

Premiums and Cost-Sharing For Children

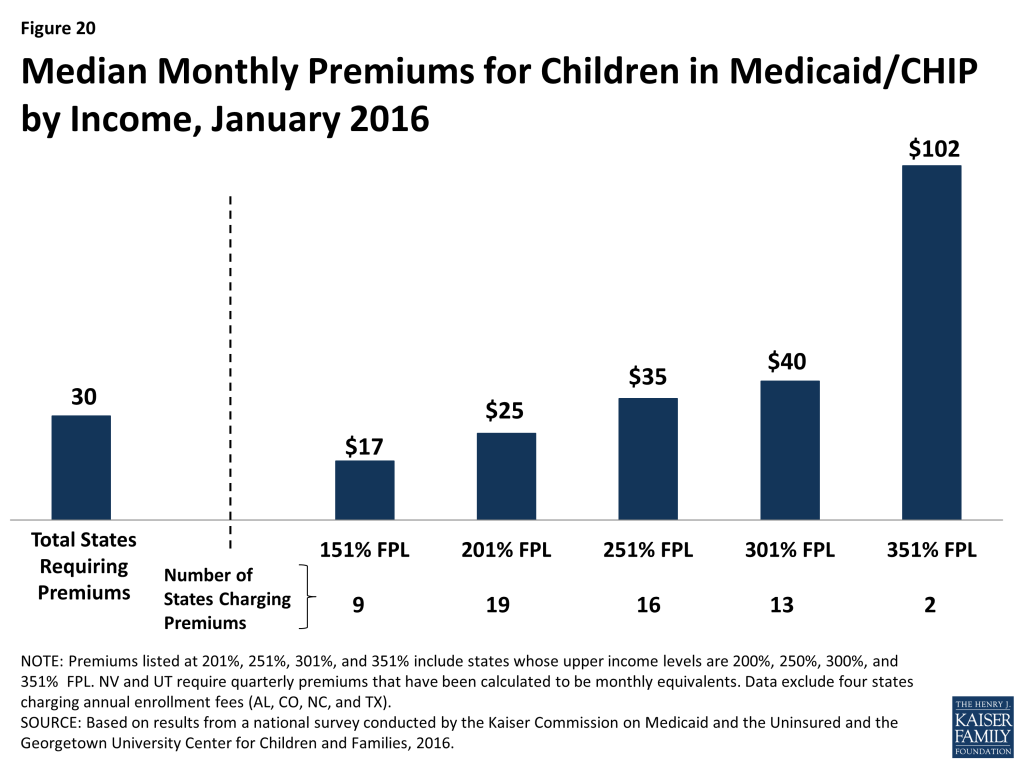
As of January 2016, 30 states charge premiums or enrollment fees for children in Medicaid or CHIP. Reflecting the ACA eligibility protections for children that extend through 2019, this count remained steady during 2015 as did most premium amounts. Under the ACA protections, states generally cannot increase premium amounts. One exception to this protection is if a state had a routine premium adjustment approved in its state Medicaid or CHIP plan prior to the enactment of the ACA on March 23, 2010. During 2015, two states (Maryland and Pennsylvania) increased premiums under such routine annual adjustments. Other changes included Michigan joining the three other states (California, Maryland and Vermont) that charge monthly premiums to children in Medicaid when it shifted all children from its separate CHIP program to Medicaid. Premiums and enrollment fees are more prevalent in CHIP than Medicaid due to the relatively higher incomes of families with children covered under CHIP and the program’s more flexible premium rules. 11  Overall, 26 states charge monthly or quarterly premiums and 4 charge annual enrollment fees for children in Medicaid or CHIP. In the 26 states charging monthly or quarterly premiums, charges begin for families above 150% FPL in 19 states, including 8 states in which charges begin above 200% FPL. Median monthly premium amounts range from $17 at 151% FPL to $102 at 351% FPL, although only two states extend eligibility up to this level (Figure 20).

Figure 20: Median Monthly Premiums for Children in Medicaid/CHIP by Income, January 2016

States vary in their policies for nonpayment of premiums. States must provide a minimum 60-day grace period in Medicaid before cancelling coverage for nonpayment of premiums and cannot require enrollees to repay outstanding premiums as a condition of reenrollment, nor can they delay reenrollment. In contrast, CHIP programs are required to provide only a minimum 30-day grace period and may impose up to a 90-day lockout period during which time a child is not allowed to reenroll. Among the 22 states that charge monthly or quarterly premiums or enrollment fees in CHIP, only 4 states limit the grace period to the minimum 30 days, while 17 states provide a 60-day or longer grace period. With the addition of New Jersey in 2015, 14 CHIP programs have a lock-out period after a child is disenrolled for nonpayment of premiums, which range from 1 month to the maximum 90 days. Sixteen states that charge monthly or quarterly payments in Medicaid or CHIP require children who have been disenrolled due to nonpayment of premiums to reapply for coverage. However, seven states reinstate coverage retroactively if outstanding premiums are repaid.

The number of states (26 states) charging cost-sharing for children in Medicaid or CHIP, as well as the amounts of copayments remained largely constant in 2015. As of January 2016, only three states charge cost-sharing for children in Medicaid, while 25 of the 36 states with separate CHIP programs charge cost-sharing. The number of states charging cost-sharing for children did not change in 2015; however, the data reflect Arkansas’ transition of children who were subject to cost-sharing in Medicaid to its new separate CHIP program. Only Tennessee charges cost-sharing for children in families with incomes below 133% FPL; under Section 1115 waiver authority, cost-sharing for children starts at the poverty level in the state. Copayments vary by service type. For example, for a child with family income at 201% FPL, 20 states charge cost-sharing for a physician visit, 13 charge for an emergency room visit, 20 charge for non-emergency use of the emergency room, 15 charge for an inpatient hospital visit, and 19 have charges for prescription drugs, although, in some cases, charges only apply to brand name or non-preferred brand name drugs (Figure 21).

Figure 21: Number of States with Cost-Sharing for Selected Services for Children at 201% FPL, January 2016

Premiums and Cost-Sharing for Parents and Other Adults

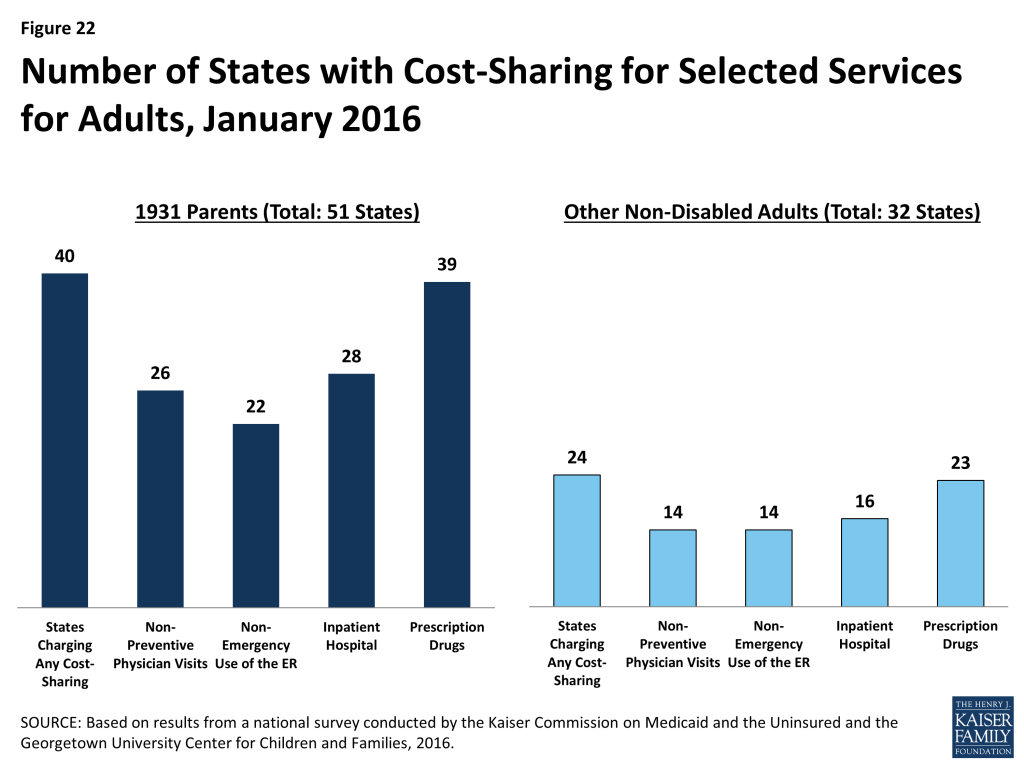
As of January 2016, states generally do not charge premiums for low-income parents in Medicaid, but many do have cost-sharing for these parents. Because most parents covered through the Section 1931 eligibility pathway that existed pre-ACA have incomes below poverty, states generally do not charge them monthly premiums. However, during 2015, Indiana implemented monthly contributions for Section 1931 parents under waiver authority, although enrollees cannot be disenrolled due to nonpayment. Forty states charge nominal cost-sharing for Section 1931 parents in Medicaid which varies by service. As of January 2016, 26 states charge parents cost-sharing for a physician visit, 22 charge for non-emergency use of the emergency room, 28 charge for an inpatient hospital visit, and 39 charge for prescription drugs, which may be limited to brand name drugs in some cases (Figure 22). Indiana is the only state to obtain Section 1916(f) waiver authority to charge parents higher cost-sharing than otherwise allowed, which applies to non-emergency use of the emergency room. Cost-sharing for parents remained stable in 2015 with a few exceptions: Florida and Oklahoma increased and Montana decreased cost-sharing for some services, and New York raised the income level at which cost-sharing begins from 0% to 100% FPL.

Figure 22: Number of States with Cost-Sharing for Selected Services for Adults, January 2016

There are no premiums for expansion adults in 26 of the 31 states that have implemented the ACA Medicaid expansion, but 5 states charge premiums or monthly contributions under Section 1115 waiver authority as of January 2016. Specifically, Arkansas, Indiana, Iowa, Michigan, and Montana charge premiums and/or monthly contributions for adults with incomes above poverty. The consequences of nonpayment of these charges vary across these states. Indiana and Montana can disenroll adults above poverty due to unpaid amounts and impose a lock-out period for those disenrolled. Iowa can also disenroll adults with incomes above poverty; however, it must waive the charges for individuals who self-attest to financial hardship and individuals can reenroll at any time. In Arkansas, monthly contributions are in lieu of point-of-service copayments; adults who do not make monthly contributions are responsible for point-of-service cost-sharing charges. The waivers in Arkansas, Iowa, Indiana, and Montana also allow the states to collect monthly contributions from individuals with incomes below poverty, although Arkansas has not implemented monthly contributions at this income level as of January 2016. Individuals with incomes below poverty cannot be disenrolled due to nonpayment. (See Box 2 for more details).

As of January 2016, 23 of the 31 states that have expanded Medicaid charge expansion adults cost-sharing. In addition, Wisconsin charges the adults it covers up to 100% FPL cost-sharing. Most states have aligned cost-sharing policies for adults and Section 1931 parents, although there are differences in some states. Cost-sharing amounts are generally nominal reflecting the low incomes of adults. Overall, 14 states charge cost-sharing for a physician visit, 14 charge for non-emergency use of the emergency room, 16 charge for an inpatient hospital visit, and 23 charge for prescription drugs as of January 2016. There were few changes in cost-sharing in the past year. These changes included some increases in copayments in New Hampshire and New York raising the income at which cost-sharing begins from 0% to 100% FPL.

 Box 2: Premiums/Monthly Contributions for Adults Under Section 1115 Waiver Authority

Arkansas received waiver approval to require certain enrollees to make monthly income-based contributions to health savings accounts (HSAs) to be used in lieu of paying point-of-service copayments and co-insurance. Medically-frail individuals, including those with disabilities or complex health conditions, are exempt from these payments. Monthly contributions are $10 for expansion adults with incomes between 101% – 115%, and $15 for individuals with incomes between 116% – 138%. Under the waiver, Arkansas can charge monthly HSA contributions for expansion adults with incomes down to 50% FPL, but the state is not currently charging those with incomes below poverty. Adults with incomes above poverty who fail to make monthly HSA contributions are responsible for copayments and co-insurance at the point of service, and providers can deny services for failure to pay cost-sharing. Cost-sharing charges are at amounts otherwise allowed under federal law.

In Iowa, the waiver allows the state to impose monthly contributions of $5 per month for non-medically frail beneficiaries with incomes between 50% and 100% FPL and $10 per month for non-medically frail beneficiaries with incomes above poverty beginning as of the second year of enrollment. The state cannot disenroll individuals below poverty due to unpaid premiums. Individuals above poverty have a 90-day grace period to pay past-due premiums before they are disenrolled, and the state must waive premiums for enrollees who self-attest to financial hardship. Individuals who are disenrolled for nonpayment can reenroll at any time.

The waiver in Indiana imposes monthly contributions at 2% of income for most newly eligible adults and Section 1931 parents. Those with incomes between 0% and 5% FPL must pay $1.00 per month. Individuals with incomes below poverty cannot be disenrolled due to nonpayment but receive a more limited benefit package and are subject to copayments at the point of service. (Medically frail individuals are not placed in the more limited benefit package.) Individuals above poverty are not enrolled in coverage until they make their first monthly payment. In addition, non-medically frail individuals above poverty can be disenrolled due to nonpayment after a 60-day grace period and are subject to a 6-month lock-out period.

Michigan’s waiver provides for monthly premiums of 2% of income for enrollees with incomes above poverty, as well as monthly payments into HSAs based on their prior six months of copayments for services used. The copayments are at the same level as what would have been collected without the waiver. Enrollees cannot lose or be denied Medicaid eligibility, be denied health plan enrollment, or be denied access to services, and providers may not deny services for failure to pay copayments or premiums.12 

In Montana, non-medically frail expansion adults with incomes above 50% FPL are subject to monthly premiums of 2% of income. Enrollees receive a credit in the amount of their premiums toward copayments incurred, so that they effectively only have to pay copayments that exceed 2% of income. Those with incomes above poverty can be disenrolled for nonpayment after notice and a 90-day grace period and can reenroll upon payment of arrears or after the debt is assessed against their state income taxes, no later than the end of the calendar quarter. Reenrollment does not require a new application, and the state must establish a process to exempt beneficiaries from disenrollment for good cause. Individuals below poverty cannot be disenrolled for nonpayment of premiums.


Source: M. Musumeci and R. Rudowitz, “The ACA and Medicaid Expansion Waivers,” The Kaiser Commission on Medicaid and the Uninsured, November 2015, available at https://www.kff.org/medicaid/issue-brief/the-aca-and-medicaid-expansion-waivers/

Looking Ahead

States’ Medicaid and CHIP eligibility policies and enrollment and renewal processes will play a key role in reaching the remaining low-income uninsured population and keeping eligible individuals enrolled over time. Together, these survey findings show that:

Medicaid and CHIP continue to be central sources of coverage for the low-income population, but access to coverage varies widely across groups and states. Medicaid and CHIP offer a base of coverage to low-income children and pregnant women nationwide. Eligibility for adults has grown under the Medicaid expansion, but remains low in states that have not expanded. Overall, eligibility continues to vary significantly by group, with coverage available to children and pregnant women at higher income levels relative to parents and other adults. Eligibility also varies across states, and these differences have increased as a result of state Medicaid expansion decisions. Given this variation, there are substantial differences in individuals’ access to coverage based on their eligibility group and where they live.

Upgraded state Medicaid systems help eligible individuals connect to and retain coverage over time, provide gains in administrative efficiencies, and offer new options to support program management. One key outcome of the ACA has been the significant modernization of states’ Medicaid eligibility and enrollment systems. Although state implementation of new eligibility systems got off to a rocky start in 2014, as of 2016, states have implemented system enhancements and processes to increasingly support real-time, data driven eligibility determinations and automatic, paperless renewals of coverage as envisioned by the ACA. The higher-functioning systems in states help eligible individuals connect to coverage more quickly and easily, keep eligible individuals enrolled over time, reduce paperwork burdens, and lead to increased administrative efficiencies as paper-based processes move to an electronic, automated environment. Moreover, the modernized systems offer new options to support program management. For example, states may have increased data reporting capabilities and expanded options to connect Medicaid with other systems and programs. Further, as systems and processes become more refined over time, states may be able to manage enrollment more efficiently, allowing for resources to be refocused on other activities. Looking ahead, states will continue to fully operationalize the streamlined enrollment and renewal processes outlined in the ACA and build on their developments to date to increase the use of technology, expand functionality, smooth out coordination across coverage programs, and integrate non-health programs into their new systems.

There remain key questions about how recent changes in eligibility and enrollment may be affected by a range of factors moving forward. Funding for CHIP is set to expire in 2017, raising key questions about the future of the program and what might happen in its absence. In addition, the ACA maintenance of effort provisions for children’s coverage end in 2019. State Medicaid expansion decisions will likely continue to evolve over time, and it remains to be seen how they might be affected by the gradual reduction in federal funding for newly eligible expansion adults, which begins to phase down in 2017 when it reduces to 95%. Pending proposals in current budget reconciliation legislation would roll back the Medicaid expansion to adults and eliminate the maintenance of effort requirements in 2017. Outside of these potential changes, it also will be important to examine how the Section 1115 waivers that allow states to charge adults premiums and monthly contributions are affecting coverage and program administration, particularly given that waiver authority is provided for research and demonstration purposes.

Tables

Trend and State-by-State Tables

Table A: Trends in State Medicaid and CHIP Eligibility, Enrollment, and Renewal Policies, July 2000 to January 2015

Table 1: Upper Income Eligibility Limits for Children’s Health Coverage as a Percent of the Federal Poverty Level (FPL), January 2016

Table 2: Waiting Period for CHIP Enrollment, January 2016

Table 3: Optional Medicaid and CHIP Coverage for Children, January 2016

Table 4: Medicaid and CHIP Coverage for Pregnant Women, January 2016

Table 5: Medicaid Income Eligibility Limits for Adults as a Percent of the Federal Poverty Level, January 2016

Table 6: MAGI Eligibility Systems, January 2016

Table 7: Coordination between Medicaid and Marketplace Systems, January 2016

Table 8: Online and Telephone Medicaid Applications, January 2016

Table 9: Online Account Capabilities for Medicaid, January 2016

Table 10: Income Verification Procedures Used by Medicaid Agencies at Application, January 2016

Table 11: Non-Financial Eligibility Criteria Verification Procedures Used by Medicaid Agencies, January 2016

Table 12: Use of Selected Options to Facilitate Enrollment in Medicaid and CHIP, January 2016

Table 13: Renewal Processes for MAGI-Based Medicaid Groups, January 2016

Table 14: Targeted Strategies to Streamline Renewals, January 2016

Table 15: Premium, Enrollment Fee, and Cost-Sharing Requirements for Children, January 2016

Table 16: Premiums and Enrollment Fees for Children at Selected Income Levels, January 2016

Table 17: Disenrollment Policies for Non-Payment of Premiums in Children’s Coverage, January 2016

Table 18: Cost-Sharing Amounts for Selected Services for Children at Selected Income Levels, January 2016

Table 19: Cost-Sharing Amounts for Prescription Drugs for Children at Selected Income Levels, January 2016

Table 20: Premium and Cost-Sharing Requirements for Section 1931 Parents, January 2016

Table 21: Premium and Cost-Sharing for Medicaid Adults, January 2016

Endnotes

  1. Iowa also used state funds to cover immigrant children in foster care. ↩︎
  2. This group of adults may include some adults with disabilities who are not eligible for Medicare. ↩︎
  3. MaryBeth Musumeci and Robin Rudowitz, The ACA and Medicaid Expansion Waivers (Washington, DC: Kaiser Commission on Medicaid and the Uninsured, November 2015), https://modern.kff.org/medicaid/issue-brief/the-aca-and-medicaid-expansion-waivers/. ↩︎
  4. Stan Dorn and Jennifer Tolbert, The ACA’s Basic Health Program Option: Federal Requirements and State Trade-Offs (Washington, DC: Kaiser Commission on Medicaid and the Uninsured, November 2014), https://modern.kff.org/health-reform/report/the-acas-basic-health-program-option-federal-requirements-and-state-trade-offs/. ↩︎
  5. Rachel Garfield and Anthony Damico, The Coverage Gap: Uninsured Poor Adults in States that Do Not Expand Medicaid – An Update  (Washington, DC: Kaiser Commission on Medicaid and the Uninsured, October 2015), https://modern.kff.org/health-reform/issue-brief/the-coverage-gap-uninsured-poor-adults-in-states-that-do-not-expand-medicaid-an-update/. ↩︎
  6. 80 Fed. Reg. 75817-75843 (December 4, 2015). Available at https://www.federalregister.gov/articles/2015/12/04/2015-30591/medicaid-program-mechanized-claims-processing-and-information-retrieval-systems-9010. ↩︎
  7. Kevin Concannon, Kevin Counihan, Mark Greenberg and Victoria Wachino, Tri-Agency Letter on Additional Guidance to States on the OMB Circular A-87 Cost Allocation Exception, July 20, 2015. Available at http://www.medicaid.gov/federal-policy-guidance/downloads/SMD072015.pdf. ↩︎
  8. Vikki Wachino, CMS Letter to State Medicaid Directors and State Health Officials, SHO # 15-001; ACA #34 Re: Policy Options for Using SNAP to Determine Medicaid Eligibility and an Update on Targeted Enrollment Strategies, August 31, 2015. Available at https://www.medicaid.gov/Federal-Policy-Guidance/downloads/SHO-15-001.pdf. ↩︎
  9. Jocelyn Guyer, Tanya Schwartz, and Samantha Artiga, Fast Track to Coverage: Facilitating Enrollment of Eligible People into the Medicaid Expansion (Washington, DC: Kaiser Commission on Medicaid and the Uninsured, November 2013), https://modern.kff.org/medicaid/issue-brief/fast-track-to-coverage-facilitating-enrollment-of-eligible-people-into-the-medicaid-expansion/. ↩︎
  10. “Targeted Enrollment Strategies,” CMS, accessed December 2015, http://www.medicaid.gov/medicaid-chip-program-information/program-information/targeted-enrollment-strategies/targeted-enrollment-strategies.html. ↩︎
  11. The Medicaid and CHIP Payment and Access Commission (MACPAC) has indicated that the prevalent use of premiums in CHIP leads to the problem of ‘premium stacking’ for families, in which families have to pay both premiums for children enrolled in CHIP and for adults enrolled in Marketplace coverage. MACPAC notes that these combined premiums could constitute a percentage of a family’s income that is higher than the limits established by the ACA. For more information see Medicaid and CHIP Payment and Access Commission, “Chapter 5: Children’s Coverage under CHIP and Exchange Plans,” in Report to the Congress on Medicaid and CHIP (Washington, DC: March 2014), 150-182, https://www.macpac.gov/wp-content/uploads/2015/01/2014-03-14_Macpac_Report.pdf. ↩︎
  12. On December 17, 2015, Michigan received approval for a waiver amendment. Under the approved waiver amendment, beneficiaries between 100% and 138% FPL who are not medically frail could choose between two coverage options as of April 2018: continued coverage through Medicaid managed care or the Healthy Michigan Plan or Marketplace coverage through a Qualified Health Plan (QHP) or the Marketplace Option. If beneficiaries choose Medicaid managed care, they will be required to meet a healthy behavior requirement or they could be transitioned to a QHP plan. Beneficiaries above 100% FPL would face monthly premiums of up to 2% of income in both Healthy Michigan and QHPs, but failure to pay would not result in termination of eligibility. See, Kaiser Commission on Medicaid and the Uninsured, Medicaid Expansion in Michigan (Washington, DC: Kaiser Commission on Medicaid and the Uninsured, January 2016), https://modern.kff.org/medicaid/fact-sheet/medicaid-expansion-in-michigan/. ↩︎
News Release

50-State Survey Finds States Have Upgraded Medicaid Enrollment and Eligibility Systems and Begun Resolving Initial ACA Implementation Issues, Although Challenges Remain

Published: Jan 21, 2016

Over its first two years, the Affordable Care Act (ACA) has triggered increases in Medicaid eligibility levels and upgrades in states’ Medicaid eligibility and enrollment systems, making it easier for individuals to enroll in Medicaid and producing faster eligibility decisions, according to a new Kaiser Family Foundation survey of Medicaid and Children’s Health Insurance Program eligibility levels and enrollment, renewal and cost-sharing policies.

The 14th annual 50-state survey, conducted by the Foundation’s Kaiser Commission on Medicaid and the Uninsured and Georgetown University’s Center for Children and Families, finds that as of January 2016, many states have revised enrollment and renewal processes in accord with the ACA (Chart). Online applications are now standard in virtually all states. Notably, 37 states can make Medicaid eligibility determinations for low-income children, pregnant women, and non-disabled adults within 24 hours.

AlertFigure_v3.png

The survey also shows that, in 2015, states began resolving many of the challenges they faced when the new systems and processes were first launched in 2014. After many states postponed renewals and delayed implementing new renewal procedures during 2014, states took up this task in 2015. As of January 2016, 47 states are up to date processing Medicaid renewals and 34 states can process automated renewals using information from electronic data sources. Moreover, coordination between state Medicaid agencies and marketplaces improved in 2015. Nearly all of the 38 states that rely on the Federally-Facilitated Marketplace (FFM), healthcare.gov, for marketplace eligibility and enrollment functions can send and receive electronic data transfers between the state Medicaid agency and Marketplace. However, 20 states are still reporting they are having problems or delays with the transfers, although the scope of these problems varies.

These higher-functioning systems and processes are helping states to enroll more eligible low-income people in Medicaid, keep eligible individuals enrolled, reduce paperwork burdens on people and program administrators, and are contributing to increased administrative efficiencies. They also are providing new tools to support program management, such as increased data reporting.

In addition, the survey report, Medicaid and CHIP Eligibility, Enrollment, Renewal, and Cost Sharing Policies as of January 2016: Findings from a 50-State Survey, provides 2016 eligibility levels in all 50 states and the District of Columbia for children, pregnant women and non-disabled adults in Medicaid and CHIP. Eligibility levels vary significantly across groups and by state, as well as by state Medicaid expansion status.

These and other findings from the survey were discussed today at a public briefing at the Foundation’s Washington, D.C. offices. An archived webcast of the briefing, as well as copies of presentation slides and other materials, will be available on kff.org later today. Also available is an updated issue brief, Trends in Medicaid and CHIP Eligibility Over Time.

Trends in Medicaid and CHIP Eligibility Over Time

Authors: Samantha Artiga and Elizabeth Cornachione
Published: Jan 21, 2016

Executive Summary

Over time eligibility for Medicaid and the Children’s Health Insurance Program (CHIP) has expanded to provide a base of coverage for the low-income population, which was most recently strengthened through the Affordable Care Act (ACA) Medicaid expansion as of 2014. While eligibility has increased over time, eligibility levels vary significantly across states and eligibility groups. This analysis examines trends in Medicaid and CHIP eligibility limits over time for children, pregnant women, parents, and other adults. It also explores how trends in eligibility for these groups vary by several variables, including geographic region, Medicaid expansion status, and state health ranking. (Eligibility levels for all 50 states and DC over time are available at https://www.kff.org/data-collection/trends-in-medicaid-income-eligibility-limits/.) Key findings include the following:

  • Eligibility for children and pregnant women has been consistently higher than for parents and other adults over time. The ACA Medicaid expansion narrowed the gap between medians for these groups, but median eligibility limits for parents and other adults still are lower than those for children and pregnant women.
  • Across eligibility groups, the Northeast generally has had the highest median eligibility limits. The South has the lowest median eligibility limits for all groups, except pregnant women, for whom the West has the lowest median eligibility limits. Over time, the gap between the region with the highest median eligibility limit and the region with the lowest median eligibility increased for children. This gap also widened for other adults when the Medicaid expansion took effect as of January 2014. In contrast, the gap between the highest and lowest regions has narrowed for parents and pregnant women over time.
  • States that implemented the Medicaid expansion have higher median eligibility limits compared to non-expansion states for all eligibility groups, and the gap between expansion and non-expansion states widened for all groups over time. As expected, the largest differences emerged for parents and other adults after implementation of the expansion in 2014. However, the difference between the median income limit for children in expansion states and non-expansion states also grew over time. The gap is smaller for pregnant women and has recently begun to narrow.
  • For children, parents, and other adults, states with the lowest health rankings have the lowest median eligibility limits over time, while states with the highest health rankings have the highest median eligibility limits. Gaps between median income eligibility limits for high and low health ranking states are largest for other adults and children. This gap also exists for parents, but it narrowed after implementation of the Medicaid expansion. For pregnant women, middle health ranking states have the highest median eligibility limits. While the high and low health ranking states have lower median eligibility limits compared to the middle health ranking states, the differences in median eligibility limits by health ranking are smaller for pregnant women compared to the other eligibility groups. These findings provide insight into how coverage levels vary by health needs; however, it is important to recognize that this is not a causal relationship given that health is impacted by a broad range of factors beyond health coverage and health care.

This analysis is based on 16 years of eligibility data collected by the Kaiser Commission on Medicaid and the Uninsured with the Center on Budget and Policy Priorities, 2000-2009; and with the Georgetown University Center for Children and Families, 2011-2015. The income eligibility limits are reported as a percentage of the federal poverty level (FPL), which is calculated each year by the Department of Health and Human Services. As of 2015, the FPL is $11,770 for an individual and $20,090 for a family of three.

The data show changes in eligibility levels by group over time as well as the impact of the ACA on eligibility. Prior to the ACA, states generally could not receive federal Medicaid matching funds to cover non-disabled adults without dependent children. As enacted, the ACA expanded Medicaid eligibility to adults with incomes at or below 138% FPL beginning in 2014, although this provision was effectively made a state option by the Supreme Court’s 2012 ruling on the ACA. Other eligibility changes established by the ACA went into effect across all states as of January 1, 2014, including establishing a new minimum eligibility level of 138% FPL for children of all ages in Medicaid and changing the method for determining financial eligibility for Medicaid for children, pregnant women, parents, and adults and CHIP to a standard based on modified adjusted gross income (MAGI). As such, the changes in eligibility levels between 2013 and 2014 reflect both changes in eligibility policy, including adoption of the Medicaid expansion, as well as the conversion to the MAGI-based standards. While many of the converted 2014 standards appear higher than 2013 levels, the converted thresholds are intended to approximate states’ existing eligibility levels using different methodology for determining income.

Report: Section 1: Eligibility Trends By Group

Eligibility for children and pregnant women has been consistently higher than for parents and other adults over time, reflecting both higher federal minimums and state take up of options to expand eligibility for these groups, including coverage under CHIP

1

. Median eligibility levels for each eligibility group have increased over time. The Medicaid expansion narrowed the gap between median eligibility limits for parents and other adults and children and pregnant women beginning in 2014, but median eligibility limits for parents and other adults still remain below those for children and pregnant women.

Children. For children, the number of states that limit eligibility to less than 200% FPL decreased from 14 to 3 between 2000 and 2016, while the number of states extending eligibility to children with incomes at 250% FPL or higher grew from 11 to 28 over the period

2

.

Pregnant women. Similar patterns were observed for pregnant women. The number of states limiting eligibility to less than 200% FPL decreased from 34 to 18 between 2003 and 2016, and the number of states covering pregnant women with incomes at or above 250% FPL rose from 3 to 11

3

.

Parents. Parent eligibility levels across states remained low and fairly stable over the study period prior to the Medicaid expansion

4

. The Medicaid expansion significantly increased the number of states covering parents at or above 138% FPL. However, 13 of the 20 states that had not implemented the expansion as of January 2016 still had eligibility limits for parents that were less than 50% FPL.

Other adults. Other adults remained ineligible for Medicaid in the majority of states prior to the Medicaid expansion, reflecting the fact that states could not cover these adults through Medicaid prior to the ACA unless they obtained a waiver

5

. The Medicaid expansion significantly increased the number of states covering these adults beginning in 2014, but they remain ineligible in all of the non-expansion states, with the exception of Wisconsin, which covers adults up to 100% FPL.

Report: Section 2: Eligibility Trends By Geographic Region

This section examines trends in eligibility by U.S. Census region, including the Northeast, South, Midwest, and West

1

. Across eligibility groups, the Northeast generally has had the highest median eligibility limits over time. The South has had the lowest median eligibility limits for all groups, except pregnant women, for whom the West has the lowest median eligibility limits. Over the study period, the gap between the region with the highest median eligibility limit and the region with the lowest median eligibility increased for children. Similarly, the gap between the region with the highest and lowest median limit widened for other adults when the Medicaid expansion took effect as of January 2014. In contrast, this gap between the highest and lowest regions has narrowed for parents and pregnant women over time.

Children. Between 2000 and 2016, median eligibility limits for children increased in all regions, but the increase in the South only reflects the conversion to MAGI-based thresholds beginning as of January 2014

2

. Increases were largest and occurred earliest in the Northeast. Median limits in the West also increased over the period, rising above the U.S. median. Smaller increases occurred in the Midwest, which remains below the U.S. median as of 2016.

Pregnant women. Median eligibility limits for pregnant women increased in all regions between 2003 and 2016

3

. The largest increase occurred in the West, although the median limit for the region still remains below the U.S. median as of 2015.

Parents. Changes in median eligibility limits for parents between 2002 and 2016 varied across the regions

4

. In the Midwest and West, median eligibility limits for parents significantly increased as of 2014 due to the Medicaid expansion. In the Northeast, the median decreased from 157% FPL to 138% FPL, reflecting Medicaid eligibility reductions in several states when parents above 138% FPL became eligible for new Marketplace coverage options as of 2014. In the South, the median eligibility limit remained relatively stable and low, at around half the poverty level, since most states in the region did not adopt the Medicaid expansion.

Other adults. Median eligibility limits for other adults substantially increased between 2011 and 2016 in all regions except the South

5

. In the Northeast, Midwest, and West, the median limit increased from 0% FPL to 138% FPL, reflecting adoption of the Medicaid expansion in most states in these regions. In the South, the median eligibility limit remains at 0% FPL since most states in the region have not adopted the expansion as of January 2016.

Report: Section 3: Eligibility Trends By Medicaid Expansion Status

This section analyzes trends in eligibility by the status of implementation of the Medicaid expansion as of January 2016, which is the most recent date of the eligibility data in this analysis

1

.

States that implemented the Medicaid expansion had higher median eligibility limits compared to non-expansion states across eligibility groups. Over time, the difference between median eligibility limits for expansion and non-expansion states widened for all eligibility groups. As expected, the largest differences emerged for parents and other adults after implementation of the expansion in 2014. However, the difference between the median eligibility limit for children in expansion states and non-expansion states also grew over time. The gap is smaller for pregnant women and has recently begun to narrow.

Children. Between 2000 and 2016, median eligibility limits for children increased in Medicaid expansion states 

2

. The median eligibility limit for non-expansion states remained unchanged, except for the increase in 2014 that reflected the conversion to MAGI-based standards.

Pregnant women. Similarly, median eligibility limits for pregnant women increased in expansion states between 2003 and 2016, while there was a smaller increase in non-expansion states

3

. This change in the non-expansion states reflected the conversion to MAGI-based standards as of 2014 and the reinstatement of coverage for pregnant women up to 205% FPL in Virginia as of 2015.

Parents. For parents, median eligibility limits increased in expansion states but declined in non-expansion states between 2002 and 2016, leading to a widening gap over time

4

. In the Medicaid expansion states, median eligibility limits for parents increased from 100% to 138% FPL, reflecting the fact that many of these states took up options to expand coverage for parents above minimum thresholds prior to the Medicaid expansion. In non-expansion states, the median parent eligibility limit remained low and decreased post-ACA, reflecting eligibility reductions in some states as well as continued erosion of the eligibility limit in some states that base eligibility on a dollar threshold that does not update over time.

Other adults. For other adults, the median eligibility limit rose from 0% to 138% FPL in expansion states between 2011 and 2016, while the median limit remains at 0% FPL in non-expansion states 

5

. Adults without dependent children are ineligible for Medicaid in all of the non-expansions states except Wisconsin, which covers adult up to 100% FPL.

Report: Section 4: Eligibility Trends By State Health Ranking

This section analyzes trends in eligibility over time by state health ranking. While these findings provide insight into how coverage levels vary by health needs, it is important to recognize that this is not a causal relationship given that health is impacted by a broad range of factors beyond health coverage and health care. State health rankings were based on the 2015 America’s Health Rankings report, which includes data for all 50 states, but not DC. America’s Health Ranking is produced annually by United Health Foundation, the American Public Health Association and the Partnership for Prevention (available at http://www.americashealthrankings.org/). The rankings are developed based on four groups of health determinants, including: behaviors, community & environment, policy and clinical care, and several measures of health outcomes. An overall health score is created for each state based on how they fare on each measure compared to the national average. (See Appendix B for more details.) For this analysis, states were categorized into three groups based on their health ranking scores. A total of 22 states with a negative score were classified as low health ranking states, 15 states with scores between 0 and .39 were grouped as middle health ranking states, and 13 states with scores above .40 were categorized as high health ranking states

1

.

For children, parents, and other adults, states with the highest health rankings generally have the highest median eligibility limits over time. Differences between median eligibility limits by health ranking are largest for children, but have narrowed over time for other groups.

Children. Between 2000 and 2015, median eligibility limits for children increased in high and middle health ranking states

2

. Increases were largest and occurred earlier in high health ranking states compared to the middle health ranking states. Median eligibility limits did not change in the low health ranking states except for the conversion to MAGI-based standards as of January 2014.

Pregnant women. For pregnant women, there were increases in median eligibility limits for high, middle, and low-ranking states between 2003 and 2016 

3

. The increases occurred earliest in high ranking health ranking states as of 2008, following by middle health ranking states at the end of 2009, and then last by low-ranking states in 2013. Reflecting these increases, the differences in median eligibility limits between high, middle, and low health ranking states are narrow as of January 2016.

Parents. Median eligibility limits for parents increased between 2002 and 2016 across all three groups of states

4

. States with high health rankings started with higher eligibility limits as of 2002 compared to the middle and low health ranking states, and remained the highest as of 2016. The middle and low health ranking states generally had similar median eligibility limits throughout the study period with an increase beginning in 2014 when the Medicaid expansion took effect. This increase narrowed the gap in eligibility limits between high and middle and low ranking states.

Other adults. The high health ranking states were the first group to show an increase in the median eligibility limit for other adults between 2011 and 2016, increasing from 0% FPL to 138% FPL as of January 2014 when the Medicaid expansion took effect

5

. This increase reflects adoption of the Medicaid expansion in most of the states that have a high health ranking as of January 2014. In contrast, the median eligibility limit for middle and low health ranking states remained at 0% FPL through 2015. However, as a result of additional states implementing the expansion during 2015, their median limits rose as of January 2016 and the gap in eligibility limits between high, middle, and low health ranking states narrowed.

Conclusion

Together these data show that over time Medicaid and CHIP eligibility levels have increased for all eligibility groups. However, there eligibility levels vary substantially across states and across eligibility groups. Eligibility remains higher for pregnant women and children compared to parents and other adults. Moreover, there generally have been widening disparities in access to coverage across states when examining them by geographic region and Medicaid expansion status. In contrast, for most groups, differences in median eligibility limits by state health ranking have narrowed over time.

Appendix

Appendix A

Table 1: States by Region, Medicaid Expansion Status, and Health Ranking
StateRegionMedicaid Expansion StatusHealth Ranking
AlabamaSouthHas Not AdoptedLow
AlaskaWestImplementedMiddle
ArizonaWestImplementedLow
ArkansasSouthImplementedLow
CaliforniaWestImplementedMiddle
ColoradoWestImplementedHigh
ConnecticutNortheastImplementedHigh
DelawareSouthImplementedLow
DCSouthImplementedNot Ranked
FloridaSouthHas Not AdoptedLow
GeorgiaSouthHas Not AdoptedLow
HawaiiWestImplementedHigh
IdahoWestHas Not AdoptedMiddle
IllinoisMidwestImplementedLow
IndianaMidwestImplementedLow
IowaMidwestImplementedMiddle
KansasMidwestHas Not AdoptedMiddle
KentuckySouthImplementedLow
LouisianaSouthHas Not AdoptedLow
MaineNortheastHas Not AdoptedMiddle
MarylandSouthImplementedMiddle
MassachusettsNortheastImplementedHigh
MichiganMidwestImplementedLow
MinnesotaMidwestImplementedHigh
MississippiSouthHas Not AdoptedLow
MissouriMidwestHas Not AdoptedLow
MontanaWestImplementedMiddle
NebraskaMidwestHas Not AdoptedHigh
NevadaWestImplementedLow
New HampshireNortheastImplementedHigh
New JerseyNortheastImplementedHigh
New MexicoWestImplementedLow
New YorkNortheastImplementedMiddle
North CarolinaSouthHas Not AdoptedLow
North DakotaMidwestImplementedHigh
OhioMidwestImplementedLow
OklahomaSouthHas Not AdoptedLow
OregonWestImplementedHigh
PennsylvaniaNortheastImplementedMiddle
Rhode IslandNortheastImplementedMiddle
South CarolinaSouthHas Not AdoptedLow
South DakotaMidwestHas Not AdoptedMiddle
TennesseeSouthHas Not AdoptedLow
TexasSouthHas Not AdoptedLow
UtahWestHas Not AdoptedHigh
VermontNortheastImplementedHigh
VirginiaSouthHas Not AdoptedMiddle
WashingtonWestImplementedHigh
West VirginiaSouthImplementedLow
WisconsinMidwestHas Not AdoptedMiddle
WyomingWestHas Not AdoptedMiddle
Sources: Regions based on U.S. Census Bureau, Medicaid expansion based on KCMU analysis, health ranking based on “America’s Health Ranking state health scores, 2015.

Appendix B: Overview of America’s Health Rankings

America’s Health Ranking is produced annually by United Health Foundation, the American Public Health Association and the Partnership for Prevention (http://www.americashealthrankings.org/). The health rankings for states are developed based on four groups of health determinants, including: behaviors, community & environment, policy and clinical care, and several measures of health outcomes.

The overall health score is calculated by adding the score of each measure multiplied by the measure weight (see Table 2). The ranking is the order of each state according its overall score; ties in values are assigned equal rankings.

The score for each measure is a representation of the number of standard deviations a state is above or below the national mean. The national mean is set at the average value of the states and DC. It is calculated by:

Score = (State value – National mean)/Standard Deviation of all state values.

This is commonly known as a “Z-score”. The score is stated as a decimal ranging from positive to negative 2. Higher scores mean that a state has a higher value than the national average, while lower scores mean that the state has a lower value than the national average. Table 2 shows whether a higher value has a negative or a positive impact on the health ranking.

Table 2: Measures, Weights, and Sources for America’s Health Rankings Scores, 2015

Name of Measure

% of ScoreEffect on ScoreSource
Behaviors25.0
Smoking (% of adult population)7.5NegativeBehavioral Risk Factors Surveillance System (BRFSS), 2014
Binge Drinking (% of adult population)2.5NegativeBRFSS 2014
Drug Deaths (Deaths/100,000)2.5NegativeNational Vital Statistics System, 2011 – 2013
Obesity (% of adult population)5.0NegativeBRFSS, 2014
Physical Inactivity (%of adult population)2.5NegativeBRFSS, 2014
High School Graduation (%of incoming 9th graders)5.0PositiveNational Center for Education Statistics, 2012 – 2013
Community & Environment22.5
Violent Crime (Offenses/100,000)5.0NegativeFederal Bureau of Investigation, 2013
Occupational Fatalities (Deaths/100,000 workers)2.5NegativeCensus of Fatal Occupational Injuries, 2012 – 2014 P&US Bureau of Economic Analysis
Infectious Disease (Combined score for Chlamydia, Pertussis, and Salmonella cases/100,000)5.0NegativeSummary of Notifiable Disease, 2013 & NCHHSTP Atlas, 2013
Children in Poverty (% of children)5.0Negative2014 Annual Social and Economic Supplement, 2014
Air Pollution (Micrograms of fine particles/ cubic meter)5.0NegativeEnvironmental Protection Agency, 2012 – 2014
Public & Health Policies12.5  
Lack of Health Insurance (% of population)5.0NegativeAmerican Community Survey, 2013 – 2014
Public Health Funding (Dollars/person)2.5PositiveTrust for America’s Health, 2013 – 2014
Immunization – Children (% aged 19 to 35 mos)2.5PositiveNational Immunization Survey, 2014
Immunization – Adolescents (% aged 13 to 17 yrs)2.5PositiveNational Immunization Survey, 2014
Clinical Care15.0  
Low Birthweight (Percent of live births)3.75NegativeNational Vital Statistics System, 2013
Primary Care Physicians (Number/100,000)3.75PositiveAmerican Medical Association, 2013
Dentists (Number/100,000)3.75PositiveAmerican Dental Association, 2013
Preventable Hospitalizations (Number /1,000 Medicare beneficiaries)3.75NegativeDarmouth Atlas, 2013
Outcomes25.0  
Diabetes (Percent of adult population)3.125NegativeBRFSS, 2014
Poor Mental Health Days (Days in previous 30 days)3.125NegativeBRFSS, 2014
Poor Physical Health Days (Days in previous 30 days)3.125NegativeBRFSS, 2014
Disparity in Health Status (Percent difference by education level)3.125NegativeBRFSS, 2014
Infant Mortality (Deaths per 1,000 live births)3.125NegativeNational Vital Statistics System, 2012 – 2013
Cardiovascular Deaths (Deaths/100,000)3.125NegativeNational Vital Statistics System, 2011 – 2013
Cancer Deaths (Deaths/100,000)3.125NegativeNational Vital Statistics System, 2011 – 2013
Premature Deaths (Years lost/100,000)3.125NegativeNational Vital Statistics System, 2013
Poll Finding

Americans’ Views on the U.S. Role in Global Health

Authors: Bianca DiJulio, Mira Norton, and Mollyann Brodie
Published: Jan 20, 2016

Findings

Executive Summary

As policymakers react to global crises and the 2016 presidential election season ramps up, it’s an important time to understand Americans’ views on the U.S. role in global health. The Kaiser Family Foundation has tracked public opinion on global health issues in-depth since 2009. This most recent survey examines views on U.S. spending on health in developing countries and perceptions of barriers and challenges to making progress on the issue.

Two-thirds of Americans (65 percent) overall and majorities of Democrats, independents and Republicans alike, say that the United States should play at least a major role in world affairs, including roughly one in five overall (18 percent) who say the U.S. should take the leading role. However, when it comes to global health efforts specifically, about half (53 percent) say the U.S. government is already doing enough to improve health for people in developing countries, and nearly half (46 percent) feel that the U.S. is doing more than its fair share compared to other wealthy countries. In addition, most Americans prefer a collaborative international approach in global health efforts over the U.S. acting alone, and this sentiment has increased over the past several years. The survey also finds a general skepticism on the part of the American people when it comes to the effectiveness of global health spending, with seven in ten saying the “bang for the buck” of U.S. spending in this area is only fair or poor, and more than half believing that spending more on global health efforts won’t lead to meaningful progress (a share that has grown since 2012). Republicans, and to a somewhat lesser extent, independents, are more likely than Democrats to think that more spending will not lead to progress, to feel that the U.S. is already doing enough, and to say the U.S. is doing more than its fair share compared to other wealthier countries, and these differences between Democrats and Republicans have grown over time. Related to this general skepticism towards such spending, many point to a variety of perceived problems, including corruption and misuse of funds, as barriers to improving the health of people in developing countries.

Although many Americans have concerns about the value of global health spending, six in ten say the U.S. spends too little (26 percent) or about the right amount (34 percent) on global health, and three in ten say it spends too much. Most also recognize benefits to such spending, both for Americans at home as well as for people and communities in developing countries. Nearly half (46 percent) say the most important reason for the U.S. to spend money on improving health in developing countries is because it’s the right thing to do, outranking other reasons, including improved diplomatic relationships (14 percent), national security (14 percent), or a stronger U.S. economy (11 percent).

Looking forward, while a large majority of Americans think an Ebola or similar disease outbreak is likely in the next five years, two-thirds say the U.S. government is well-prepared to handle such an outbreak.

Views of U.S. Role in World Affairs and in Global Health Efforts

Broadly, the American public is largely supportive of the U.S. playing a large role in trying to solve international problems. About two-thirds of Americans (65 percent) say that the U.S. should play at least a major role in world affairs, including 18 percent who say the U.S. should take the leading role and 47 percent who say the U.S. should play a major role but not the leading one. Despite recent international events, including the Ebola crisis in West Africa as well as the more recent terrorist attacks in Paris, these shares haven’t changed substantially since 2012. Majorities across all parties say the U.S. should play a major or leading role, with Republicans more likely to say that the U.S. should play a leading role compared to Democrats.

Figure 1: Most Want U.S. to Play Major or Leading Role in World Affairs

When it comes to global health issues specifically, a slim majority of Americans (53 percent) say the U.S. government is doing enough to improve health for people in developing countries, while four in ten (39 percent) say that it is not doing enough. In addition, half (51 percent) also say religious or faith-based organizations are doing enough and a similar share (46 percent) say the same about international nonprofit organizations. Americans are split on their opinion of the World Health Organization (WHO), the public health arm of the United Nations, with equal shares saying the WHO is doing enough and not doing enough (42 percent each).

On the other hand, majorities say that large international businesses and corporations (64 percent), the United Nations (54 percent), and the governments of other developed countries (51 percent) are not doing enough to improve health for people in developing countries.

Figure 2: Most Say U.S. is Doing Enough to Improve Health in Developing Countries; Two-Thirds Say Large Corporations Are Not

Unlike the bipartisan support for U.S. involvement in world affairs generally, there is a substantial partisan divide in views of U.S. efforts to improve health for people in developing countries. Majorities of Republicans (68 percent) and independents (59 percent) say the U.S. government is doing enough in this area, while a slim majority of Democrats (52 percent) feel the opposite, saying the U.S. is not doing enough. The difference between Republicans and Democrats on views of whether the U.S. is doing enough has widened somewhat since 2009.

Table 1: U.S. Government Doing Enough to Improve Health in Developing Countries
Would you say the U.S. government is doing enough or not doing enough to improve health for people in developing countries?TotalDemocratsIndependentsRepublicans
Yes, doing enough53%38%59%68%
No, not doing enough39%52%36%24%
NOTE: Should not be involved (Vol.) and Don’t know/Refused not shown.

Echoing the sentiment of about half of Americans who say the U.S. government is doing enough to improve the health of those in developing countries, nearly half (46 percent) say that the U.S. is doing more than its fair share compared to other wealthy countries, such as England, France, Germany and Japan. About a third (35 percent) say the U.S. contributes about its fair share, and 12 percent say the U.S. contributes less than its fair share. Again, there are partisan differences, with Republicans much more likely than Democrats to say that the U.S. is contributing more than its fair share (62 percent versus 34 percent). Here also, the difference in opinion between Republicans and Democrats has widened over the last few years, from a difference of 17 percentage points in 2012 to 28 percentage points currently.

Figure 3: Nearly Half Say U.S. Contributes More Than Its Fair Share

When it comes to U.S foreign aid aimed at improving health in developing countries, more Americans prefer a collaborative international approach over the U.S. acting alone in these efforts. Two-thirds of Americans (68 percent) prefer to see the country participate in international efforts so that other countries will do their fair share and efforts will be better coordinated. On the other side, a quarter (25 percent) say that the U.S. should operate on its own, allowing the government more control over how the money is spent and giving the U.S. more credit and influence in the country receiving aid. This gap has slowly widened over the past few years, with more Americans today saying that the U.S. should work alongside other countries than in 2009 (68 percent today versus 55 percent in 2009).

Figure 4: More Americans Today Say U.S. Should Participate in International Efforts to Improve Health in Developing Countries

Americans’ Views on U.S. Global Health Spending

Most Overestimate U.S. Spending on Foreign Aid and Doubt Value Of Global Health Spending

A large majority of the public overestimates the share of the federal budget that is spent on foreign aid. Just 3 percent of Americans correctly state that 1 percent or less of the federal budget is spent on foreign aid, and nearly half (47 percent) believe that share is greater than 20 percent. On average, Americans say spending on foreign aid makes up 31 percent of the federal budget.

Figure 5: Public Overestimates Share of Budget Going to Foreign Aid

Among the public, critics of U.S. global health funding often point to the poor value or “bang for the buck” of spending aimed at improving health in developing countries, that is, the number of lives saved relative to the amount of money spent. A large majority of Americans (69 percent) express doubt in the value of global health spending, saying that the “bang for the buck” of these dollars is “only fair” or “poor.” On the other side, about one in five (21 percent) say the value is “excellent” or “good.” There are no substantial partisan differences, with a majority of Democrats, Republicans, and independents reporting that the value of spending is “only fair” or “poor.”

Figure 6: Seven in Ten Americans Express Doubt in Value of U.S. Health Spending in Developing Countries

In addition, there is also doubt about the effectiveness of foreign aid from the U.S. and other wealthy nations, with more than half of Americans (55 percent) saying that spending more money will not lead to meaningful progress in improving health for people in developing countries. Still, about four in ten (38 percent) say that more spending on the part of the U.S. and other countries will lead to meaningful progress. This gap has widened somewhat since February 2012, when opinions regarding spending were more evenly divided. Republicans (67 percent) and independents (58 percent) are particularly skeptical, with majorities saying that more spending will not make much difference, compared to nearly four in ten Democrats (38 percent) who say the same. These partisan differences have increased over time, from a margin of 14 percentage points separating Republicans and Democrats who are doubtful that spending more will lead to meaningful progress in 2009, compared to a difference of 29 percentage points today.

Figure 7: Majority Say More Spending Won’t Make Much Difference in Improving Health in Developing Countries

Related to the general skepticism towards U.S. global health spending, the American public sees a number of barriers to making progress improving health for people in developing countries. Eight in ten Americans (79 percent) point to corruption and misuse of funds as a major reason for such difficulties. Roughly seven in ten say issues such as lack of infrastructure and resources (73 percent), widespread poverty (72 percent) and lack of political leadership (68 percent) are major reasons for difficulty in improving health, and nearly six in ten (57 percent) cite a lack of effective programs. Many fewer – just about a third (34 percent) – say that a major reason is a lack of money from the U.S. and other wealthier countries.

Although Americans say there are several major reasons for the difficulty of improving health for people in the developing world, when asked which is the single most important reason, the largest share (44 percent) name corruption and misuse of funds, while much smaller shares point to other issues, such as lack of infrastructure (16 percent) or lack of political leadership (15 percent).

Figure 8: Corruption Seen as Biggest Barrier to Improving Health in Developing Countries

Although much of the public doubts the value and effectiveness of global health spending and points to several barriers to progress, 60 percent say the U.S. spends too little (26 percent) or about the right amount (34 percent) on global health, and 30 percent say it spends too much. This is similar to previous Kaiser polls over the past several years.

Figure 9: Trend in Views of U.S. Spending on Health in Developing Countries

More Republicans say the U.S. spends too much on such global health spending than say it spends too little (40 percent versus 13 percent), while more Democrats say the U.S. spends too little, rather than too much (37 percent versus 20 percent). Independents are about evenly split, with about three in ten saying the U.S. spends too much (30 percent) or too little (28 percent). Still half or more of Republicans (52 percent), independents (61 percent) and Democrats (73 percent) say the U.S. is spending about the right amount or too little on efforts to improve global health.

Figure 10: Views of Current Levels of U.S. Global Health Spending by Political Partisanship

Most Say U.S. Global Health Aid Helps Protect Americans’ Health and It’s the Right Thing To Do

While there is general skepticism about the effectiveness of global health spending, many Americans believe there are a number of benefits to spending money to improve health in developing countries. More than six in ten (63 percent) say that such spending helps protect the health of Americans by preventing the spread of diseases like SARS, bird flu, swine flu, and Ebola and about half say it helps make people and communities in developing countries more self-sufficient (53 percent) and helps improve the U.S. image around the world (52 percent). Fewer Americans, however, say U.S. health spending in developing countries benefits the U.S. economy (33 percent) or helps U.S. national security by lessening the threat of terrorism (31 percent), while about two-thirds of the public thinks it does not have much impact in those areas.

Democrats are generally more likely than Republicans and independents to say that spending money on improving health in developing countries has such impacts, but still about six in ten Republicans and independents say it helps protect Americans’ health (58 percent and 62 percent, respectively).

Table 2: Impact of Global Health Spending
Percent who say spending money on improving health in developing countries helps…TotalDemocratsIndependentsRepublicans
…Protect the health of Americans by preventing the spread of diseases like SARS, bird flu, swine flu, and Ebola63%73%62%58%
…Make people and communities in developing countries more self-sufficient53654943
…Improve the U.S. image around the world52645142
…The U.S. economy by improving the circumstances of people who can buy more U.S. goods33413027
…U.S. national security by lessening the threat of terrorism originating in developing countries31393418

Although many acknowledge there are domestic interests that could benefit from global health aid, nearly half of Americans (46 percent) say that the most important reason that the U.S. spends money on improving health for people in developing countries is because it’s the right thing to do. This ranks far above other reasons, such as ensuring national security (14 percent), improving our diplomatic relationships (14 percent), helping the U.S. economy by creating new markets for U.S. businesses (11 percent), or improving the U.S.’s image around the world (9 percent). Americans’ views of the reasons for such spending do not vary by political party.

Figure 11: Moral Reason for Global Health Spending Trumps National Self-Interest

Moving Forward: U.S. Preparedness and U.N. Sustainable Development Goals

Most say Disease Outbreak Is Likely in Next 5 Years, But U.S. Is Well-Prepared

Most Americans say that another Ebola outbreak – or an outbreak of an equally serious disease – is likely in the next five years, but many also express confidence in U.S. preparedness in handling such an outbreak. A large majority of Americans (83 percent) say that another serious Ebola outbreak in Africa in the next five years is at least somewhat likely. About as many (87 percent) say it is at least somewhat likely that there will be an outbreak of a different disease, but one that is equally as serious as Ebola.

Although many Americans expect another outbreak, when asked how prepared the U.S. government is to respond to future disease outbreaks around the world, two-thirds overall (66 percent) say the U.S. is at least somewhat well-prepared, including 16 percent who say the country is “very well-prepared.” However, about a third (32 percent) say the U.S. government is not well-prepared. There are no substantial differences between political partisans on U.S. preparedness on this issue.

Figure 12: Large Majority Say Ebola or Other Serious Disease Outbreak Likely in the Next Five Years, Many Say U.S. is Well-Prepared

Limited Awareness of United Nations’ Sustainable Development Goals

Global health leaders often point to the recent adoption of the United Nations’ Sustainable Development Goals as an important multinational initiative for progress in improving health and development globally. These goals focus on economic and human development and the eradication of poverty and are meant to guide all global development efforts, including global health efforts, through 2030. However, a large majority of Americans (79 percent) say they haven’t heard of them. Only one in five (20 percent) say they have heard of these goals, including 6 percent who say they know a “fair amount” or “a lot” about them and 13 percent who say they know “only a little” or “almost nothing.”

Figure 13: Limited Public Awareness of United Nation’s Sustainable Development Goals

Methodology

This Kaiser Health Tracking Poll was designed and analyzed by public opinion researchers at the Kaiser Family Foundation (KFF). The survey was conducted December 1-7, 2015, among a nationally representative random digit dial telephone sample of 1,202 adults ages 18 and older, living in the United States, including Alaska and Hawaii (note: persons without a telephone could not be included in the random selection process). Computer-assisted telephone interviews conducted by landline (480) and cell phone (722, including 414 who had no landline telephone) were carried out in English and Spanish by Princeton Data Source under the direction of Princeton Survey Research Associates International (PSRAI). Both the random digit dial landline and cell phone samples were provided by Survey Sampling International, LLC. For the landline sample, respondents were selected by asking for the youngest adult male or female currently at home based on a random rotation. If no one of that gender was available, interviewers asked to speak with the youngest adult of the opposite gender. For the cell phone sample, interviews were conducted with the adult who answered the phone. KFF paid for all costs associated with the survey.

The combined landline and cell phone sample was weighted to balance the sample demographics to match estimates for the national population using data from the Census Bureau’s 2013 American Community Survey (ACS) on sex, age, education, race, Hispanic origin, nativity (for Hispanics only), and region along with data from the 2010 Census on population density. The sample was also weighted to match current patterns of telephone use using data from the July-December 2014 National Health Interview Survey. The weight takes into account the fact that respondents with both a landline and cell phone have a higher probability of selection in the combined sample and also adjusts for the household size for the landline sample. All statistical tests of significance account for the effect of weighting.

The margin of sampling error including the design effect for the full sample is plus or minus 3 percentage points. Numbers of respondents and margins of sampling error for key subgroups are shown in the table below. For results based on other subgroups, the margin of sampling error may be higher. Sample sizes and margins of sampling error for other subgroups are available by request. Note that sampling error is only one of many potential sources of error in this or any other public opinion poll. Kaiser Family Foundation public opinion and survey research is a charter member of the Transparency Initiative of the American Association for Public Opinion Research.

GroupN (unweighted)M.O.S.E.
Total

1202

±3 percentage points

Party Identification
   Democrats383±6 percentage points
   Republicans316±6 percentage points
   Independents339±6 percentage points
Insurance Status
  Insured, ages 18-64745±4 percentage points
  Uninsured, ages 18-64106±10 percentage points


News Release

New Survey, Analysis Suggest a Growing Partisan Split About U.S. Government Engagement on Global Health

Published: Jan 20, 2016

While U.S. global health programs have enjoyed bipartisan support in the past, a new survey of the public and findings from interviews with global health and foreign policy experts suggest a growing partisan divide, as the country gears up for the 2016 election.

Half (53%) of Americans say the U.S. is already doing enough to improve health in developing countries, and 46 percent think the U.S. is doing more than its fair share compared to other wealthy countries.

Republicans are far more likely than Democrats (62% vs. 34%) to say the U.S. contributes more than its fair share, a perception gap that has grown from 17 percentage points in 2012 to 28 percentage points currently. In addition, most Republicans (68%) and independents (59%) think the U.S. government is doing enough to improve global health, while just more than half of Democrats (52%) think the U.S. is not doing enough.

Seven in 10 Americans (69%) express skepticism about the “bang for the buck” in U.S. global health spending, saying it is only fair or poor. Still, most (60%) say the U.S. is spending too little (26%) or about the right amount (34%) on global health.

Additionally, a majority of Americans (63%) continue to say that spending on global health protects the health of Americans by preventing the spread of diseases; 53 percent say it helps make people and communities in developing countries more self-sufficient; and just more than half (52%) believe it improves the U.S. image around the world.

A separate report summarizes the views of global health and foreign policy leaders on the U.S. role in global health, based on interviews carried out by Hart Research Associates and Public Opinion Strategies. It also finds some evidence of partisan differences in how they believe U.S. global health funding should be allocated. Left-leaning experts more often favor an approach that integrates initiatives like nutrition, clean water, and maternal and child health, while right-leaning experts are more likely to prioritize greater cooperation between governments and private sector groups.

The Foundation also released an analysis of global health spending that finds funding for most global health programs remained essentially flat in the FY 2016 omnibus spending bill signed into law in December. After Congress provided an unprecedented level of emergency funding for Ebola in FY15 in response to the West African outbreak, other appropriations for global health programs continued at essentially FY15 levels in FY16.

The findings and analyses were discussed at a public briefing at the Foundation, featuring a panel discussion with experts on global health policy. An archived webcast of the briefing will be available later online.

Foreign Policy and Global Health Experts on the USG’s Role in Global Health

Authors: Geoff Garin, Leslie Rathjens, and Elizabeth Harrington
Published: Jan 20, 2016

Introduction

While global health has enjoyed significant bipartisan support among US policymakers over the past 15 years, the potential for changes in the political landscape in 2016 makes this an opportune time to assess the USG’s position relative to global health needs and funding. With this in mind, the Kaiser Family Foundation’s Global Health Policy Program asked Hart Research Associates and Public Opinion Strategies to solicit the views of specialists in foreign policy and global health. In October and November, 2015, Hart Research Associates and Public Opinion Strategies conducted focus group discussions and in-depth telephone interviews among center-left- and center-right-leaning foreign policy and global health experts. Working with Kaiser to identify the key areas of inquiry, we asked these experts to comment on:

  • The USG as a leader in global health—whether and why they feel it is important that the USG be a leader;
  • Priorities for USG involvement in global health—the specific initiatives or areas that should be the focus of our involvement;
  • Necessary or recommended changes to our approach to global health—deriving from past experience and learning, or from new exigencies, circumstances, or concerns;
  • The outlook for USG funding for global health—how funding levels are likely to change and whether bipartisan support can be maintained;
  • How to make the political case for why the USG should continue funding global health initiatives—the reasons that resonate for policy makers and their constituents, and the voices that are the most effective in making the case.

Four focus groups were held in Washington, DC and were divided by partisan leaning (center-left versus center-right) and area of expertise (global health versus other areas of foreign policy). A total of 51 experts volunteered their opinions for this project, speaking anonymously from their personal experience as policy makers, practitioners, and advocates. Participants included:

  • 22 Hill and government agency staffers;
  • 21 NGO and advocacy organization leaders;
  • 8 academics and think tank researchers.

Breakdowns by expertise and leaning are shown in the table below:

Left-Leaning ParticipantsRight-Leaning Participants
Focus groups9 global health experts7 foreign policy experts9 global health experts9 foreign policy experts
In-depth interviews10 global health and foreign policy experts7 global health and foreign policy experts

While the findings from this research are not projectable to any larger population, they offer important insights into anticipated opportunities and challenges for the advancement of global health through USG involvement and funding.

Issue Brief

Overview

The experts with whom we spoke have no doubt about the indispensability of the USG’s global health leadership—both strategically and from a funding standpoint. The issue for them, rather, is how the USG’s role can and should evolve with new learning, changing needs, and the political realities of a) presumably stagnant USG funding levels, and b) what sells global health.

The greatest tension by far is finding the right balance between expenditures that have near-term life-saving impacts and investments in sustainable solutions that have less certain outcomes. While most argue that global health funding should tilt to the latter, they are disinclined to shift current allocations, either because they feel that current allocations are correct, or because augmenting one area would necessarily come at the expense of another—a trade-off many feel reluctant or unqualified to make. Moreover, they recognize that systems-building is a far less evocative fund-raising platform compared with saving lives.

Among left-leaning experts, the approach most commonly advocated for addressing global health needs going forward is greater integration across initiatives (e.g., nutrition, clean water, and child and maternal health) and greater participation and cooperation among key stakeholder groups. This includes the USG exerting its leadership more as a facilitator, organizer, and coordinator, and inserting itself less through mandated interventions. Right-leaning experts are less focused on integration across initiatives, but advocate strongly for greater cooperation among current and potential players, including NGOs and recipient countries. While a more cooperative and/or integrated approach does not explicitly resolve the tension between short-term and long-term solutions, it has the virtue of accommodating both.

Specific expenditures advocated by experts range from continued investment in areas of known success (e.g., infectious disease prevention and treatment) to the build-up of local health care infrastructure and expertise, defining global health more broadly to include nutrition, improved access to clean water, education, and other health determinants. Many emphasize, however, that expenditures must be tied to benchmarks and approved on the basis of their performance. This is a particularly common theme among right-leaning experts.

In terms of the politics of global health funding, there are notable partisan differences in perceptions of the priority Congress assigns to global health funding. Left-leaning experts believe there continues to be strong bipartisan support for global health funding, while right-leaning experts feel that global health is not a high priority for many Republican members of Congress because other issues are seen as a much greater priority as well as some of the cross-pressures that some of the issues funded in global health present, specifically regarding reproductive health.

Aside from their views on Republican receptivity to global health as a priority, other notable differences between left- and right-leaning experts include:

  • Different views of PEPFAR: Right-leaning experts who are familiar with PEPFAR typically praise it as a beacon of efficient funding and bipartisan support, and as a model for success. By contrast, experts on the left are more critical of PEPFAR, citing it both for its successes and for what it has taught us about our approach to global health.
  • Different opinions on the use of data and benchmarks to determine funding allocations. Right-leaning experts argue that, given the limited amount of federal funding the USG can allocate to global health efforts, Congress should restrict its funding to initiatives that are proven to meet quantifiable benchmarks. By contrast, many left-leaning experts express concern that hewing rigidly to this approach could overlook valuable efforts whose outcomes are harder to measure or that would take years to produce measurable results.

Differences are fewer by area of expertise (global health versus other foreign policy issues) than by partisan leaning. That being said, foreign policy experts are often less confident than global health experts about the efficient use of USG global health expenditures; some simply lack the knowledge to comment, while others are skeptical about the USG’s reliance on for-profit contractors for administering global health programs, or else presume the same inefficiencies they observe in the US health care system. Foreign policy experts also make fewer distinctions between development and global health efforts. While this may reflect their unfamiliarity with specific global health initiatives, it may also stem from a more systems-oriented approach to foreign policy issues. Not surprisingly, they often see other foreign policy issues as being a higher priority than global health.

USG Leadership and Learning from Global Health Efforts

There is no question that the USG does and should continue to play a leadership role in advancing global health. Experts on the center-right and center-left cite two fundamental reasons for why they feel this way:

  • It is in our self-interest to promote global health: In a physically-connected world, treating and preventing infectious diseases elsewhere ultimately protects Americans; healthy nations are more stable and less prone to disruption; healthy nations are also better economic partners; and advancing the health of other countries fosters goodwill, enhancing our stature and soft power.
  • Supporting global health is part of our national character and a moral obligation given our nation’s wealth and ability to make a difference.

Sealing the case, USG support for global health is readily justified through measurable and viscerally-appealing accomplishments: reductions in child and maternal mortality, a stabilized HIV epidemic, the near-eradication of polio. Global health experts are quick to point out that global health expenditures yield among the highest returns from the USG’s foreign assistance budget.

The grounds for our success in global health are both practical and political. Experts cite a well-organized and thoughtful global health coalition—including private-sector companies and foundations—that have lobbied effectively, contributed technical expertise, and added significantly to the available funding. They also credit the process by which funding is assigned and administered: setting clear targets, simple guidelines, and measurable goals. Some left-leaning experts state specifically that the Millennium Development Goals provided important structure for organizing and promoting USG global health efforts. And finally, right- and left-leaning experts alike credit solid bipartisan support in Congress for providing the requested funding.

Amid our successes, however, we have also seen shortfalls. The most common complaint about global health efforts is insufficient coordination among stakeholders, resulting in wasted or underleveraged resources. In some instances the lack of coordination is the result of ignorance or poor planning. In others it stems from jurisdictional boundaries or deliberate choices that establish arbitrary boundaries for specific health issues and interventions. Left-leaning experts cite PEPFAR as a useful example, viewing it as a victim and perpetrator of each type of inefficiency:

  • One left-leaning expert witnessed PEPFAR, the Global Fund, and other donor nations provide funding to cover the same problems in the same countries, and questions whether their efforts are complementary or even coordinated;
  • Another notes that the funds given to USAID and the CDC in the early days of PEPFAR were so great that their programs necessarily overlapped, leading to territorial disputes and inefficient management;
  • A third comments that not all countries receiving PEPFAR support are able to absorb it; in essence, while the allocated funding may be commensurate to a country’s need, it is not necessarily aligned with that country’s capacity to use the funds effectively.

More complex concerns about insufficient coordination arise from the singular focus of many initiatives. Left-leaning experts again cite PEPFAR as an example. On the one hand, they laud the program for generating unprecedented resources and creating an enormous positive impact through its straight-forward and compelling mission. On the other hand, they criticize PEPFAR’s narrow targeting of HIV/AIDS for ignoring the reality that HIV/AIDS prevention and treatment is connected to a host of other issues. Some point out that the program has broadened its scope as it has matured (e.g., including funds to integrate nutrition into PEPFAR programs), but many contend that taking a more holistic approach from the start would have yielded even greater returns on the program’s investments.

A second lesson mentioned by left-leaning experts relative to recent USG initiatives is a variation on imperfect coordination: the potential for USG funding to crowd out other funders and to create disincentives for recipient countries to take ownership of their health. One left-leaning expert argues that PEPFAR was so effective that other donors retreated from the HIV/AIDS sector, placing even greater burden on USG efforts. Another left-leaning expert characterizes PEPFAR as the de facto Ministry of Health in many countries, relieving them of the responsibility to build their own health infrastructure.

The Ebola crisis of 2014 revealed additional areas that warrant USG attention as a global health leader: lapses in leadership, staffing, and funding at WHO; insufficient investment in disease surveillance by WHO and the CDC; the incapacity of in-country, on-the-ground health systems to monitor and intervene in order to keep an outbreak from becoming a pandemic. While many experts credit USG efforts for ultimately containing the Ebola epidemic, they view the epidemic as a wake-up call to the world to take seriously the potential for global pandemics. Left-leaning experts were more likely to reference problems with WHO and CDC, while those on the right focused more on issues with the US response. Some right-leaning experts point to the Ebola crisis as an example of how insufficient coordination negatively impacted our efforts. Some of these experts believe that our reaction to the crisis was too emotional, and that we responded too quickly without taking the time to organize our own efforts or collaborate with groups that were already in the area. One noted that other countries were developing vaccines before the crisis, and we were not a part of that research. A few volunteered that the US should strengthen its ties to international organizations such as WHO.

The use of data to drive decisions is perhaps the thorniest issue emerging from our experience as a global health leader, eliciting both practical and philosophical concerns. Experts on both sides consistently call for evidence-based decision-making and repeatedly cite the demonstrable return on investment as a key justification for our global health efforts. In line with this, they plea for better data collection and analysis in order to determine if our funding is having the intended effect, or if different allocations are warranted. A more basic concern among many left-leaning experts, however, is the potential for data-driven decision-making to skew efforts away from those that may be vitally important, but harder to measure. This includes initiatives that involve multiple factors with complex interactions, as well as those that would take years to yield quantifiable benefits; “strengthening health systems” is an example of both. Concerns about the use of data reveal a notable partisan divide: For many on the left, a fundamental question is whether our current accounting is circumscribing our approach to global health and ultimately compromising our long-term effectiveness. For those on the right, it is a necessity to use data from these programs to evaluate their effectiveness and determine funding levels.

As these experts consider the future of USG involvement in global health, they also identify emerging issues that could affect the global health burden and the funding needed to address them:

  • Both right- and left-leaning experts point to increased global conflict and mass migration creating new vulnerabilities to disease;
  • Additionally, left-leaning experts mention climate change and its potential to impact food security, as well as the spread of pathogens and insect-borne diseases.

Left-leaning experts also note that as we realize the easy gains (the “low-hanging fruit”), it will be harder to see the same kinds of impacts going forward. While there are certainly many populations that are still untouched by low-cost interventions, our successes are moving the health burden to more expensive non-communicable diseases. By contrast, several right-leaning experts maintain that going after the “low-hanging fruit” is a useful way to gain support for funding these initiatives, providing lawmakers with success stories that can be used to show their constituents how our support makes a difference.

Top Priorities for USG Involvement in Global Health

Experts’ top priorities for USG involvement in global health are informed by their views on our on-going commitments, our past successes and failures (in mostly siloed efforts), and what they hope and fear for the future. There is widespread agreement that USG priorities should be shifting to sustainable solutions for improved global health, but without losing sight of short-term needs and threats. In terms of goals, this means:

  • Consolidating and extending our wins, particularly in HIV/AIDS, malaria, and maternal and child mortality. The proven success of these initiatives—and the fear of backsliding if funds are cut—justify their continued emphasis. Some advocate a rebalancing of funds to acknowledge changes in the current disease burden (e.g., from HIV to maternal and child care) or to focus more on programs with the highest proven returns. Assuming a fixed budget, however, most are satisfied with the current allocations or else reluctant to propose changes, noting that each of these programs is serving a vital need.
  • Developing more scalable and systemic approaches. A lot of this involves strengthening systems and taking a more holistic view of health promotion and disease prevention for individuals and communities—to broaden individual and public health capabilities and to leverage the interconnected impacts of our interventions. Left-leaning experts particularly advocate better exploitation of the relationship between education, nutrition, and health—factors that are foundational to good health and that can also address the rise of non-communicable diseases. Right-leaning experts particularly emphasize the importance of better surveillance and measures for averting the risk of pandemics.
  • Building more self-reliant and locally sustainable systems. Both right- and left-leaning experts advocate strengthening local health systems in hopes that they can ultimately take over the responsibility for their health needs. This involves developing effective on-the-ground partnerships and expertise with local governments and civic societies, as well as providing education and helping to build the necessary infrastructure. It also means continuing to reduce the disease burden by focusing on communicable diseases that inhibit countries from building a basic level of primary care.

In terms of how the global health community can best address emerging priorities, the common theme is integration—both vertical and horizontal—to create better efficiencies and improve health outcomes. This involves better coordination:

  • Across USG programs and initiatives—recognizing that the success of development, education, and global health efforts are interdependent;
  • Between the USG and other donors and actors, including the private and nonprofit sectors—to take better advantage of what each does best;
  • Between donor and recipient countries—to ensure that aid is targeting the right issues and to help countries take ownership of their health;
  • Between donors and local implementers—for better operational efficiency and accountability.

Experts acknowledge that what we should and can do ultimately depends on the circumstances; for example, trying to build self-reliant and locally-sustainable systems is unrealistic in locales where there are no effective governing structures. But they also acknowledge that there will never be the funds to do everything that is important.

Given this reality, a particular concern is that investments with immediate life-saving impacts will always trump longer-term investments in systemic, sustainable solutions. Aside from having to develop new models and new levers to effect systemic change, the goals are less clearly measurable, the management is more complicated, and the time horizon for funding and evaluation is longer and less definite. The trifecta of abstract goals, complex processes, and uncertain payoffs makes this a far harder sell.

The Preferred Approach for the USG as a Global Health Leader

In keeping with the theme of a more integrated approach to global health issues, experts advocate a stronger partnership role for the USG, asking more of others and leading as a facilitator, organizer, and coordinator, as opposed to imposing interventions. As a global health leader, the USG should be helping to identify goals and shortfalls, encourage integrated solutions, and map strategies for developing nations to reduce their disease burden and promote wellness. Experts also expect the USG to leverage America’s technological expertise to find effective and cost-efficient solutions, and to disseminate this knowledge among our partners.

As for specific initiatives and goals, top priorities among these experts include:

  • Maintaining momentum in the prevention and treatment of deadly infectious diseases and in reductions in maternal and child mortality;
  • Investing in surveillance and rapid response programs to avert pandemics (a particular emphasis of right-leaning experts);
  • Addressing structural issues and social determinants of health to help build self-sufficient and sustainable health systems;
  • Helping to rebuild the effectiveness and credibility of key international institutions.

Finally, as noted earlier, right-leaning experts are notably more inclined than those on the left to advocate for USG investment in initiatives with clearly measurable goals and proven outcomes.

The Future of USG Global Health Funding

While some anticipate cuts in light of the current economic and political environment, others—particularly left-leaning experts—believe that the bipartisan support of the past will hold and funding will be preserved:

  • Right-leaning experts feel that many Americans, as well as some Republican members of Congress, think the US should be spending its money domestically rather than overseas. Those on the right agree it is important for the US to fund global health, but there are a variety of opinions as to what our funding priorities should be: addressing specific diseases through vaccinations and working to eradicate diseases, strengthening health systems, or preventative care. It is clear that, though supportive of US global health funding, these Republican policy experts want the funding tied to actual metrics for measuring success or proof of a return on our investment, as well as more coordination with other countries that are funding global health and with other organizations who are working on the ground. Most of these right-leaning experts see support for global health funding as more of a liability than a benefit for Republican members of Congress because of current levels of all federal spending and the money going overseas rather than here at home.
  • By contrast, those on the left believe that Republican support for global health spending is relatively secure, despite the opposition relating to family planning. One left-leaning expert notes that the community around healthy timing and spacing of children has created inroads to the reproductive health barrier.

Among left-leaning experts, the easiest political cases for continued or increased levels of USG investment in global health are emotional: the moral argument that it is part of our national character to save lives and help those in greatest need; and that protecting others from communicable diseases is necessary to protect our own health. Notably, both of these arguments connect more easily to immediate short-term interventions, as opposed to developing longer-term, sustainable solutions.

Right-leaning experts believe that the best political case to make with Republicans would be to tie global health funding to national security. They also feel that preventing disease from spreading to the US is a national security issue. Like the left-leaning experts, there is some sense that investing in global health is the morally correct thing to do.

Other arguments that appeal to Americans’ self-interest are also important, but are less intuitive and more intellectual; while experts on both sides note that healthy nations are less likely to foment conflict or require military intervention, are better economic partners, and are more inclined to hold the US in high regard, connecting these benefits to global health expenditures is more tenuous. That being said, national security arguments may be effective if delivered by respected national security leaders.

The voices deemed most effective for global health funding largely reflect who has been influential in the past, and are mostly overlapping between right- and left-leaning experts:

  • Those with strong content knowledge or involvement, e.g., WHO, CDC, and NIH executives; experts at educational institutions; the American College of Pediatricians;
  • NGOs and on-the-ground practitioners describing day-to-day issues and solutions, e.g., in-country medical practitioners; individuals from Doctors Without Borders, UNICEF, Save the Children, CARE, Mercy Corps;
  • The faith-based community, e.g., Pope Francis, Samaritan’s Purse, Bread for the World, ministers and rabbis;
  • Secretaries of State and Defense, and others with national security backgrounds making the case that global health spending is in our own interest, e.g., Colin Powell;
  • Private individuals and foundations known for supporting important causes, e.g., Bill Gates, Mark Zuckerberg;
  • Celebrities and others with high visibility, e.g., George Clooney, Jennifer Garner, Ben Affleck, Bono, Angelina Jolie, Jon Voigt.

Additionally, right-leaning experts mention:

  • Conservative-minded think tanks like the Heritage Foundation, Cato Institute, and others with an economic focus;
  • Former Republican elected officials, e.g., former President George H.W. Bush or Sen. Tom Coburn.

Others named by left-leaning experts include:

  • President Obama;
  • Rare combinations that capture attention and elicit strong bipartisan support, e.g., faith-based organizations joining with the HIV activist community;
  • Major companies with investments in developing countries.

Left-leaning experts also note that the global health community has been remarkably effective in a) cultivating key champions among the members of Congress to drive continued support for funding, and b) using trips to bring members close to the issues and making them feel personally invested in advancing solutions.

This issue brief was prepared by Geoff Garin and Leslie Rathjens of Hart Research Associates and Elizabeth Harrington of Public Opinion Strategies.
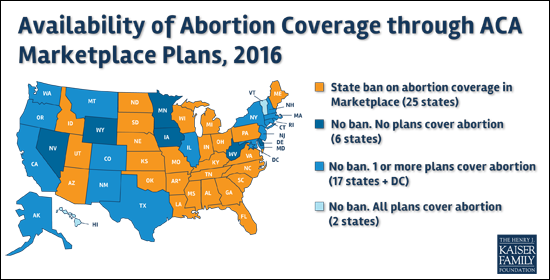
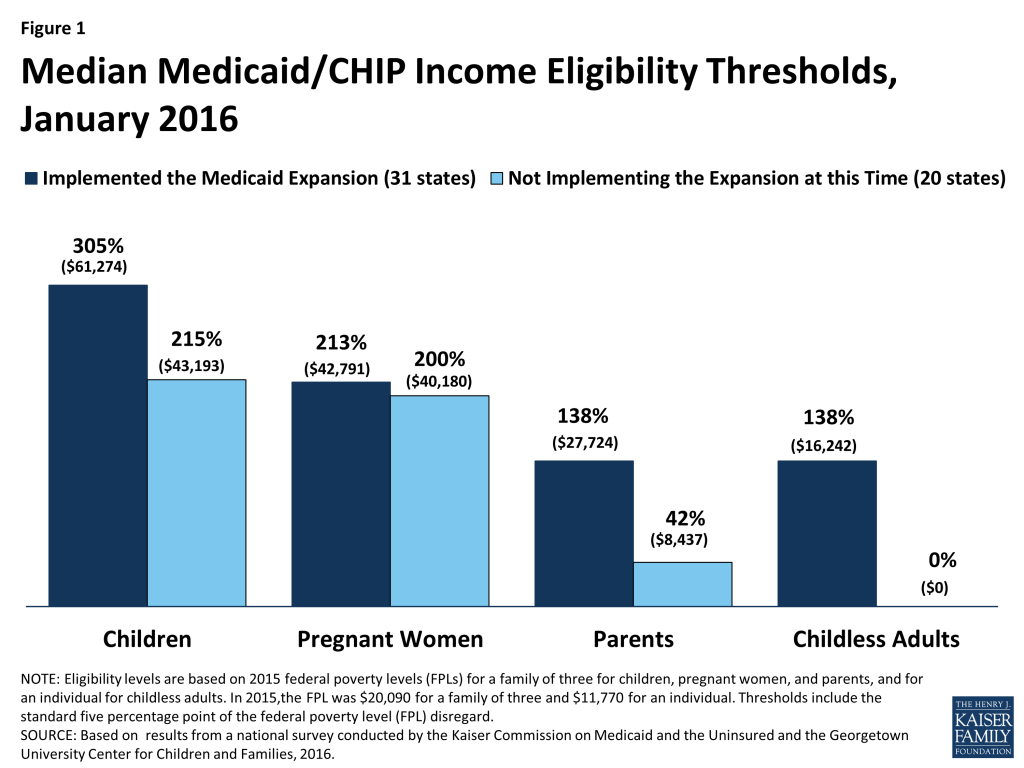
The U.S. Global Health Budget: Analysis of Appropriations for Fiscal Year 2016

Authors: Adam Wexler, Allison Valentine, and Jennifer Kates
Published: Jan 20, 2016

Issue Brief

Overview

After Congress provided an unprecedented level of emergency funding for Ebola in FY15 in response to the West African outbreak, beyond regular appropriations for global health programs, FY16 returned to business as usual.1  There was no additional emergency funding and global health amounts remained essentially flat funding compared to prior years. The FY16 Omnibus Appropriations bill, which was signed into law by the President on December 18, 2015, included an estimated $10.2 billion in funding for global health programs continuing a trend of essentially flat funding since FY10 (see Figure 1).2 

Figure 1: U.S. Global Health Funding, FY 2006-FY 2016

At the same time, because base funding within the international affairs budget,3  which provides almost 90% of all global health funding,4  declined in FY16, global health increased as a share of the international affairs budget for the second year, rising from 20% in FY12 to 23% in FY16 (see Table 1). Congress also continued its trend of providing more funding for global health than was requested by the President, which it has done in each of the past four years (see Figure 2).

Figure 2: U.S. Global Health Funding, Request and Enacted, FY 2013-FY 2016

Within the international affairs budget, most of the global health funding ($8.5 billion) specified in the FY16 Omnibus is provided through the Global Health Programs (GHP) account at U.S. Agency for International Development (USAID) and the State Department, which includes funding for the President’s Emergency Plan for AIDS Relief (PEPFAR) and the President’s Malaria Initiative (PMI), as well as other global health programs (see Figure 3 and Table 2). Within the GHP account, maternal and child health (MCH), nutrition, and malaria, were the only three programs to increase compared to FY15; all other programs remained flat.

Figure 3: Global Health Programs (GHP) Account, By Program, FY 2016

Funding by Program

This section provides an overview of global health funding levels by program area as specified in the FY16 Omnibus Appropriations bill (unless otherwise stated, all comparisons are to FY15 enacted levels).

PEPFAR/Bilateral HIV

PEPFAR’s bilateral HIV funding through the GHP account totaled $4,650 million ($330 million at USAID and $4,020 million at the State Department), matching the FY15 level, but more than $300 million less than its peak level of funding ($4,959 million) provided in 2010. Bilateral HIV accounts for the largest share (55%) of any program area within the global health portfolio under the GHP account. It includes funding for microbicides research ($45 million) and the U.S. contribution to the Joint United Nations Programme on HIV/AIDS (UNAIDS) ($45 million). The Omnibus bill also provided $128.4 million in HIV funding through the Centers for Disease Control and Prevention (CDC) and $8 million for HIV programs at the Department of Defense (DoD); both totals match FY15 levels. Additional funding for HIV research at the National Institutes of Health (NIH) is not yet known (in FY15, it was $451.2 million).

Global Fund to Fight AIDS, Tuberculosis and Malaria (Global Fund)

The Omnibus bill included $1,350 million for the U.S. contribution to the Global Fund, matching the FY15 level, which was $300 million below the peak level of $1,650 million provided in FY14. By law, U.S. contributions to the Global Fund may not exceed 33% of total contributions from all donors for a specified period; prior to the FY16 Omnibus bill, the period was from 2009 to the present. The FY16 Omnibus bill, adjusted this time period by making 2004 the starting year. The Global Fund accounts for the second largest share (16%) of U.S. funding for global health (in the GHP account).

Tuberculosis

Funding for tuberculosis (TB) programs through the GHP account totaled $236 million, which matches the FY15 level. Additional tuberculosis funding provided through the Economic Support Fund (ESF) and the newly reconstituted Assistance for Europe, Eurasia, and Central Asia (AEECA) account is not yet known (in FY15, $6.3 million was provided for TB through the ESF account).5 

Malaria

Malaria funding totaled $674.0 million and was one of only three program areas under the GHP account that increased above FY15 levels (an increase of $4.5 million or 1%). Additional malaria funding through the CDC and for research activities at the NIH is not yet known for the FY16 Omnibus; Malaria funding provided through DoD is not yet known for either FY15 or the FY16 Omnibus (in FY15, CDC funding was $11 million and NIH research funding was $169 million; in FY14, DoD was $17 million).

Family Planning & Reproductive Health (FP/RH)

Congress stated in the Omnibus bill that total bilateral funding for FP/RH programs should be “not less than $575 million” ($524 million through the GHP account and $51 million through other accounts such as ESF and/or AEECA), matching the FY15 enacted bilateral funding level.6 ,7  The Omnibus bill also included $32.5 million for the U.S. contribution to the United Nations Population Fund (UNFPA), a decrease of $2.5 million (7%) below the FY15 enacted level. While the Omnibus bill maintains existing policy requirements prohibiting the use of foreign assistance to pay for the performance of abortion as a method of family planning or to motivate or coerce any person to practice abortion, it does not include a reinstatement of the “Global Gag Rule,” which required foreign non-governmental organizations (NGOs) to certify that they would not perform or promote abortion as a method of family planning using funds from any source as a condition for receiving U.S. funding – a provision that had been included in the House State and Foreign Operations (SFOPs) appropriations bill, but not the Senate version.

Maternal & Child Health (MCH)

MCH was one of the three programs that received increased funding in FY16 in the GHP account which totaled $750 million in the FY16 Omnibus, a $35 million (5%) increase above FY15 levels. This includes $515 million in funding for bilateral programs, of which $51.5 million is for Polio, and a $235 million contribution to GAVI. The increase in MCH funding is entirely attributable to increased funding for GAVI (see below). Additional funding for MCH is provided to the CDC and State Department. Some additional MCH funding provided through other accounts at USAID, such as the ESF and Development Assistance (DA) accounts, is not yet known.

Specific components of MCH funding provided USAID as well as CDC and the State Department is as follows:

  • GAVI: The U.S. contribution to GAVI, which is included under MCH funding in the GHP account, totaled $235 million, a $35 million (18%) increase above FY15.
  • Polio: U.S. funding for polio programs is provided through USAID (as part of MCH funding via the GHP and ESF accounts) and CDC. Polio funding totaled $59 million at USAID, matching FY15 levels, and $169 million at CDC, a $10 million (6%) increase above FY15 levels.
  • United Nations Children’s Fund (UNICEF): The U.S. contribution to UNICEF totaled $132.5 million in the FY16 Omnibus, which essentially matches FY15 levels.8 

Nutrition

Nutrition funding through the GHP account totaled $125 million in FY16, an increase of $10 million (9%) above the FY15 level. Additional nutrition funding provided through other accounts, such as the ESF and DA accounts, is not yet known.

Vulnerable Children

Funding for vulnerable children, which is provided via the Displaced Children and Orphans Fund (DCOF) at USAID, totaled $22.0 million in the GHP account in FY16 matching the FY15 level.

Global Health Security

The Global Health Security Agenda (GHSA), an effort launched in February 2014 aimed at improving global capabilities to prevent, detect, and respond to epidemics and other emerging public health threats, includes funding from multiple agencies. At USAID, funding for Global Health Security (formerly Pandemic Influenza and Other Emerging Threats) is provided through the GHP account and totaled $72.5 million in the FY16 Omnibus, matching FY15 enacted levels. Funding for Global Public Health Protection at CDC, which includes funding for Global Disease Detection and Emergency Response as well as Global Public Health Capacity Development, totaled $55.2 million essentially matching the FY15 level.
Other Global Health Funding

The U.S. provides additional global health funding in support of water, sanitation and hygiene (WASH) activities, for international global health research efforts conducted through the Fogarty International Center (FIC) at NIH, and for multilateral organizations, such as the World Health Organization (WHO) and the Pan American Health Organization (PAHO), that play an important role in addressing global issues. In FY16, Congress provided $400.0 million for WASH projects, a $17.5 million (5%) increase above the FY15 enacted funding level.9  It is important to note that WASH is considered a cross-cutting issue supported through direct appropriations as well as funding provided through other programs areas (e.g. HIV, MCH, etc.); the $400.0 million in WASH funding provided through the FY16 Omnibus includes both direct appropriations as well as funding from other program areas and, therefore, is not included within the overall global health total.10  The FY16 Omnibus bill included $70.4 million for international global health research activities at FIC ($2.7 million or 4% above FY15). U.S. contributions to WHO and PAHO are not yet known.
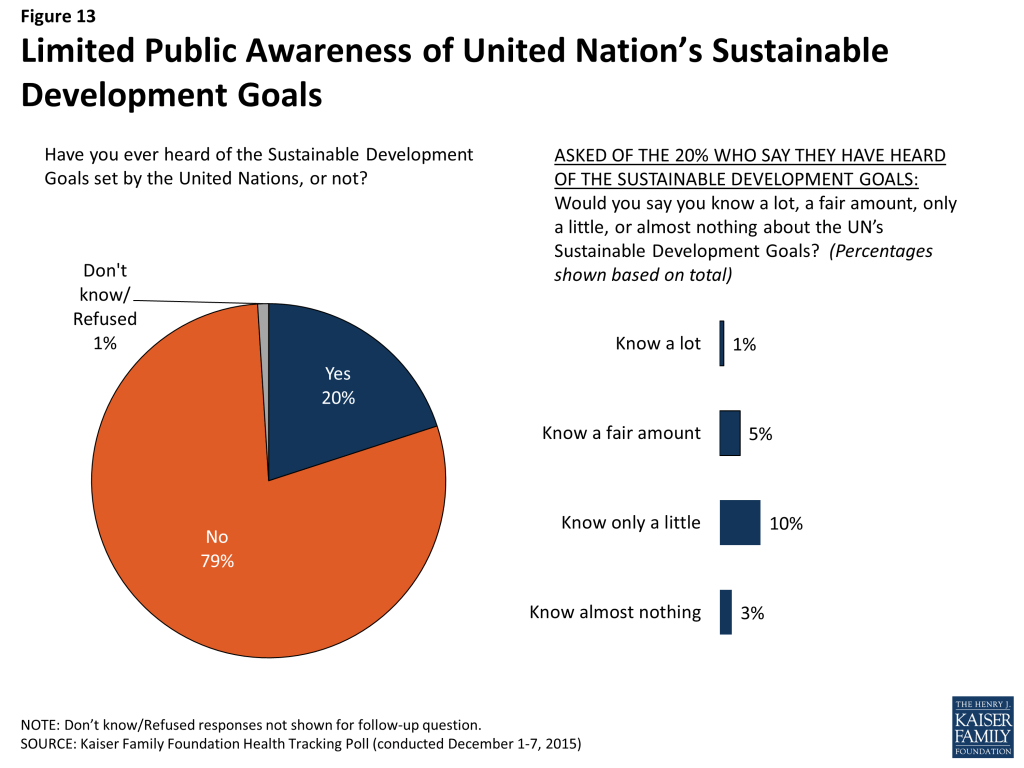
Other International Development Programs

The Omnibus bill provided funding for areas and agencies that are not directly involved in U.S. global health, but are related and may impact these efforts including: the Millennium Challenge Corporation (MCC), which is an independent U.S. foreign assistance agency that has the goal of reducing poverty in developing countries through supporting economic growth; Feed the Future (FtF), which is the U.S. Government’s Global Hunger and Food Security Initiative; broader food assistance through Food for Peace (FFP) and McGovern-Dole International Food for Education and Child Nutrition (McGovern-Dole); and other funding through the State & Foreign Operations Development Assistance (DA), Economic Support Fund (ESF), and the Assistance for Europe, Eurasia and Central Asia (AEECA) accounts. Among these areas and accounts, the ESF account was the only one that declined ($427.8 million or 9%) in the Omnibus bill, but this decline is largely attributable to funding being directed to the newly reconstituted AEECA account.[endnote 174403-5] Funding for FtF and MCC remained flat, while funding for the DA account, FFP, and McGovern-Dole all increased (see Table 3).
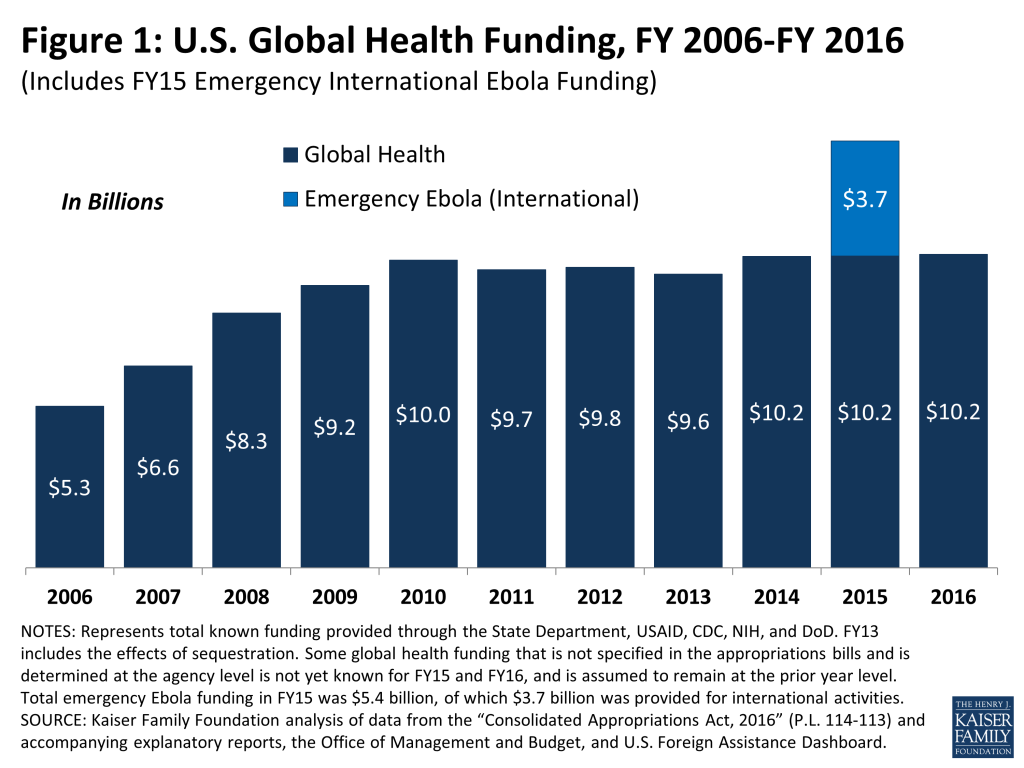
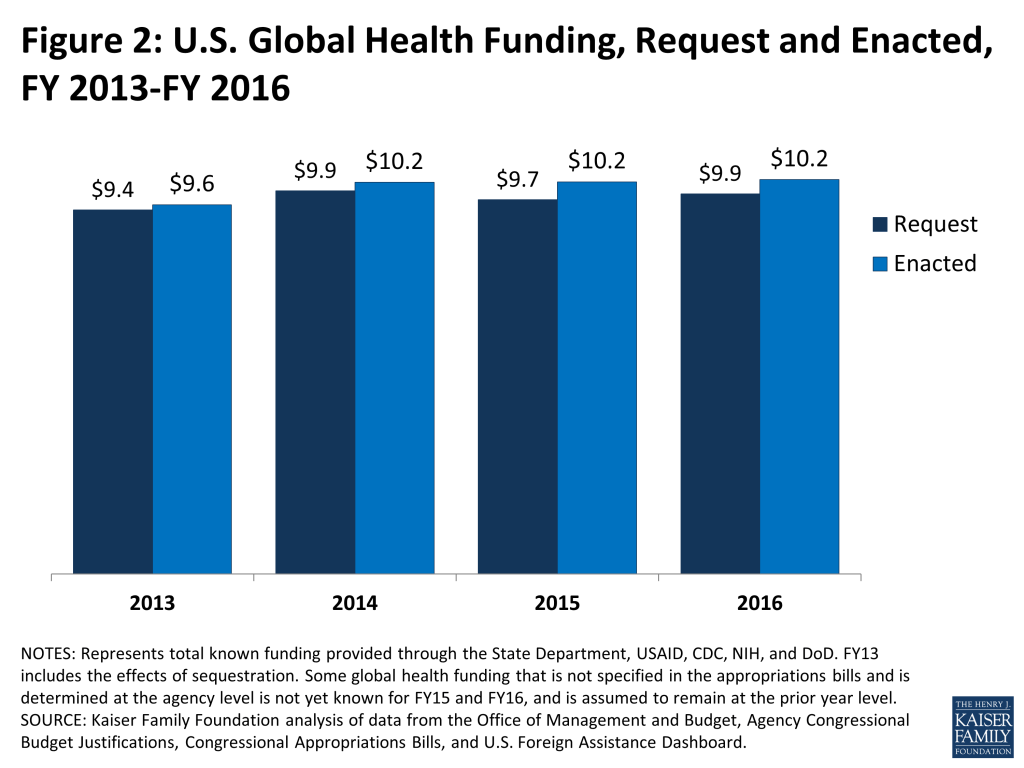
Acronym List

AEECAAssistance for Europe, Eurasia and Central Asia
CDCCenters for Disease Control and Prevention
DoDDepartment of Defense
DADevelopment Assistance
DCOFDisplaced Children and Orphans Fund
ESFEconomic Support Fund
FP/RHFamily Planning and Reproductive Health
FtFFeed the Future
FICFogarty International Center
FFPFood for Peace
GHPGlobal Health Programs
GHSAGlobal Health Security Agenda
MCCMillennium Challenge Corporation
MCHMaternal and Child Health
NIHNational Institutes of Health
NGOsNon-Governmental Organizations
PAHOPan American Health Organization
PEPFARPresident’s Emergency Plan for AIDS Relief
PMIPresident’s Malaria Initiative
SFOPsState & Foreign Operations
TBTuberculosis
USAIDU.S. Agency for International Development
UNAIDSJoint United Nations Programme on HIV/AIDS
UNICEFUnited Nations Children’s Fund
UNFPAUnited Nations Population Fund
WASHWater, Sanitation and Hygiene
WHOWorld Health Organization

Tables

Table 1: Comparison of Global Health Funding to International Affairs Budget, FY 2012 – FY 2016 (i)
 FY12(millions)FY13(millions)FY14(millions)FY15 Omnibus (millions)FY16 Omnibus (millions)
Global Healthii$9,792$9,571$10,150$10,159$10,219

of which International Affairs

$8,793$8,607$9,019$9,028$9,076
International Affairsiii$54,368$51,906$50,885$50,886$54,560

of which Base (Enduring)

$43,165$41,084$44,365$41,628$39,665

of which Overseas Contingency Operations (OCO)

$11,203$10,822$6,520$9,258$14,895
Global Health share of International Affairs Budget (Base Funding)20%21%20%22%23%
NOTES:i – FY12 through FY14 are final funding amounts. FY15 and FY16 are preliminary estimates.ii – Some global health funding (e.g. NIH funding for international HIV research) that is not earmarked by Congress in the appropriations bills and is determined at the agency level is not yet known for FY15 and FY16; for comparison purposes, any unknown global health funding amount is assumed to remain at the prior year level.iii – International Affairs is Function 150 Account only and includes both Base (Enduring) and Overseas Contingency Operations (OCO) funding. OCO has historically included some funding for global health programs, but this amount is not yet known for the FY15 or FY16. The majority of U.S. global health funding is provided as part of Base (Enduring) funding.
Table 2: U.S. Funding for Global Health Programs, FY 2015 – FY 2016 (i)
Department / Agency / AreaFY15 Omnibus (millions)FY16 Omnibus (millions)Difference (millions, %)
USAID – Global Health Programs (GHP)
HIV/AIDS$330.0$330.0$0(0%)
Tuberculosis$236.0$236.0$0(0%)
Malaria$669.5$674.0$4.5(0.7%)
Neglected Tropical Diseases (NTDS)$100.0$100.0$0(0%)
Global Health Security$72.5$72.5$0(0%)
Maternal & Child Health (MCH)$715.0$750.0$35(4.9%)
of which GAVI$200.0$235.0$35(17.5%)
of which Polio$51.5$51.5$0(0%)
Nutrition$115.0$125.0$10(8.7%)
Vulnerable Children$22.0$22.0$0(0%)
Family Planning & Reproductive Health (FP/RH)ii$524.0$524.0$0(0%)
Total USAID:$2,784.0$2,833.5$49.5(1.8%)
State – Global Health Programs (GHP)
HIV/AIDS Bilateral$4,320.0$4,320.0$0(0%)
of which UNAIDS$45.0$45.0$0(0%)
Global Fund$1,350.0$1,350.0$0(0%)
Total State:$5,670.0$5,670.0$0(0%)
Total GHP – State & USAID
Total USAID & State GHP:$8,454.0$8,503.5$49.5(0.6%)
State & Foreign Operations – Other Accounts
Family Planning & Reproductive Health (FP/RH)ii$51.1$51.1$0(0%)
HIV$0.2Not Yet Known
Maternal & Child Health (MCH)$117.6Not Yet Known
Polio$7.5$7.5$0(0%)
Nutrition$21.2Not Yet Known
Other Public Health Threats$31.6Not Yet Known
Tuberculosis$6.3Not Yet Known
State & Foreign Operations – International Organizations & Programs (IO&P)
United Nations Children’s Fund (UNICEF)$132.0$132.5$0.5(0.4%)
United Nations Population Fund (UNFPA)$35.0$32.5$-2.5(-7.1%)
State & Foreign Operations – Contributions to International Organizations (CIO)
World Health Organization (WHO$113.7Not Yet Known
Pan American Health Organization (PAHO)$65.7Not Yet Known
National Institutes of Health (NIH)
HIV Research$451.2Not Yet Known
Malaria Research$169.3Not Yet Known
Fogarty International Center (FIC)$67.8$70.4$2.7(3.9%)
Centers for Disease Control and Prevention (CDC)
Global HIV/AIDS$128.4$128.4$0(0%)
Global Immunization$208.6$219.0$10.4(5%)
Polio Eradication$158.8$169.0$10.2(6.4%)
Other Global/Measles$49.8$50.0$0.2(0.3%)
Parasitic Disease and Malaria$24.4$24.5$0.1(0.5%)
Global Public Health Protection$55.1$55.2$0.1(0.1%)
Global Disease Detection & Emergency Response$45.4$45.4$0(0.1%)
Global Public Health Capacity Development$9.8$9.8$0(0.4%)
Total CDC:$416.5$427.1$10.6(2.5%)
Department of Defense (DoD)
HIV/AIDS$8.0$8.0$0(0%)
Malaria$17.5Not Yet Known
Total Global Health Funding
Total Global Health Funding:i$10,158.6$10,219.4$60.7(0.6%)
NOTES:i – FY15 and FY16 are preliminary estimates. Some global health funding amounts (e.g. NIH funding for international HIV research) are not earmarked by Congress in the Omnibus bill and are determined at the agency level; for comparison purposes, any unknown global health funding amount is assumed to remain at the prior year level.ii – Both the FY15 Omnibus (P.L. 113-235) and the FY16 Omnibus (P.L. 114-113) state that, of the funding appropriated for bilateral assistance, “not less than $575,000,000 should be made available for family planning/reproductive health.” In recent years, final FP/RH funding amounts have been greater than the amount specified in the annual appropriations bills. For instance, according to data on ForeignAssistance.gov, final FY15 funding for FP/RH totaled $621 million (includes both bilateral funding and the U.S. contribution to UNFPA).
Table 3: Other Related Non-Global Health Funding, FY 2015 – FY 2016
Department / Agency / AreaFY15 Omnibus (millions)FY16 Omnibus(millions)Difference (millions, %)
Development Assistance (DA)$2,507.0$2,781.0$274(10.9%)
Economic Support Fund (ESF)$4,746.8$4,319.0$-427.8(-9%)
of which Overseas Contingency Operations (OCO)$2,114.3$2,422.7$308.4(14.6%)
Assistance for Europe, Eurasia and Central Asia (AEECA)$929.7
of which Overseas Contingency Operations (OCO)$438.6
Feed the Future (FtF) Initiativei$1,000.6$1,000.6$0(0%)
Global Agriculture and Food Security Program (GAFSP)ii$43.0
McGovern-Dole International Food for Education and Child Nutrition Program$191.6$201.6$10(5.2%)
Food for Peace (FFP-Title II)iii$1,466.0$1,716.0$250(17.1%)
Millennium Challenge Corporation (MCC)$899.5$901.0$1.5(0.2%)
NOTES:i – The bill states that, of the funds appropriated for bilateral assistance, “not less than $1,000,600,000 should be made available for food security and agricultural development programs.”ii – The FY15 Omnibus bill states that, of the funding appropriated for bilateral assistance programs, a portion “may be made available as a contribution to the Global Agriculture and Food Security Program if such contribution will not cause the United States to exceed 33 percent of the total amount of funds contributed to such program.”iii – According to the Explanatory Statement, the Omnibus bill provides $1,466 million for Food for Peace Title II Grants and “an additional one-time increase of $250,000,000 . . . [for] ongoing food assistance requirements as a result of growing conflicts throughout the world . . . [and] to respond to areas suffering from natural disasters.”

Endnotes

  1. The FY15 Omnibus bill (P.L. 113-235) included $5.4 billion in total emergency Ebola funding, of which $3.7 billion was provided for international activities (see Kaiser Family Foundation, “The U.S. Response to Ebola: Status of the FY2015 Emergency Ebola Appropriation,” December 2015). ↩︎
  2. Total earmarked global health funding in the FY16 Omnibus bill (P.L. 114-113) was $9.2 billion. Some global health funding is determined at the agency level, and is not earmarked by Congress in the annual appropriations bills (e.g. NIH estimates international HIV research. The estimated $10.2 billion in total global health funding for FY16 assumes that funding determined by the agencies (HIV and malaria research at NIH, malaria programs at DoD, U.S. contributions to WHO and PAHO, and global health funding provided through the ESF and DA accounts at USAID) is maintained at FY15 levels. Totals do not include funding provided through Food for Peace (FFP) due to the unique nature of the program. ↩︎
  3. The international affairs budget is comprised of base funding, which supports enduring programs, and funding for Overseas Contingency Operations/Global War on Terrorism (OCO/GWOT), which has been defined by the Administration as “extraordinary, but temporary” funding supporting efforts in Iraq, Afghanistan, and Pakistan (see Congressional Research Service, State, Foreign Operations, and Related Programs: FY2015 Budget and Appropriations,” December 8, 2014). The global health funding from USAID and the State Department detailed in this analysis is part of base funding in the international affairs budget. In the FY16 Omnibus bill, the total international affairs budget (base and OCO/GWOT) was $54.6 billion, an increase of approximately $3.6 billion from FY15 estimated levels. However, base funding, was $39.7 billion, a decrease of $2.0 billion from FY15 levels, while OCO/GWOT funding in the international affairs budget totaled $14.9 billion in the FY16 Omnibus, a $5.6 billion increase from FY15 levels. See “Consolidated Appropriations Act, 2016” (P.L. 114-113), and “FY 2016 Congressional Budget Justification – Department of State, Foreign Operations, and Related Programs”. ↩︎
  4. The international affairs budget includes funding for global health programs provided through the U.S. Agency for International Development (USAID) and the Department of State. Additional global health funding is provided through the Centers for Disease Control and Prevention (CDC), the National Institutes of Health (NIH), and the Department of Defense (DoD). ↩︎
  5. The Assistance for Europe, Eurasia and Central Asia (AEECA) account was eliminated in FY13. Funding provided through this account was incorporated into other accounts (e.g. GHP and ESF). The FY16 Omnibus bill reestablishes the AEECA account. ↩︎
  6. Both the FY15 Omnibus (P.L. 113-235) and the FY16 Omnibus (P.L. 114-113) bills state that, of the funding appropriated for bilateral assistance, “not less than $575,000,000 should be made available for family planning/reproductive health.” Both bills also provide an additional funding for the U.S. contribution to the United Nations Population Fund (UNFPA) ($35 million in FY15 and $32.5 million in FY16). According to data on ForeignAssistance.gov, actual FY15 funding for FP/RH (bilateral and UNFPA) totaled $616 million. ↩︎
  7. U.S. funding for UNFPA is provided through the International Organizations and Programs (IO&P) account at the State Department. ↩︎
  8. U.S. funding for UNICEF is provided through the International Organizations and Programs (IO&P) account at the State Department. ↩︎
  9. Congress stated in the Omnibus bill that “not less than $400,000,000 shall be made available for water and sanitation supply projects pursuant to the Senator Paul Simon Water for the Poor Act of 2005.” ↩︎
  10. WASH is considered a cross-cutting issue that receives funding from multiple accounts through both direct appropriations and as part of funding provided to other program areas (e.g. HIV and MCH). Since the FY16 Omnibus bill did not specify the accounts and program areas used to reach the $400 million in WASH funding, this amount was not included in overall global health funding totals in order to prevent double-counting of funding. ↩︎
News Release

In N.Y. Policy on Out-of-Network Medical Bills, a Model for Other States?

Published: Jan 11, 2016

In his latest column for The Wall Street Journal’s Think Tank, Drew Altman discusses surprise bills for out-of-network care, and New York state’s solution to the problem.

All previous columns by Drew Altman are online.

Medicaid Expansion Spending and Enrollment in Context: An Early Look at CMS Claims Data for 2014

Authors: Laura Snyder, Katherine Young, Robin Rudowitz, and Rachel Garfield
Published: Jan 11, 2016

Issue Brief

There have been long-standing questions about the effect the Medicaid expansion would have on spending and enrollment. Preliminary data from the Medicaid Budget and Expenditure System (MBES) released by the Centers for Medicare and Medicaid Services (CMS) may provide some early insights into these questions. CMS released preliminary spending and enrollment data from the MBES that covers the period from January 2014 through December 2014. This period is of particular interest because these are the first quarters that the Medicaid expansion was in effect. During this period, 27 states including DC, had implemented the Medicaid expansion; all but two of these states – Michigan (April 1, 2014) and New Hampshire (August 15, 2014) – implemented the Medicaid expansion January 1, 2014.

The MBES provides monthly Medicaid enrollment and quarterly Medicaid expenditure data with specific information about enrollment and spending for the new adult eligibility group, also referred to as the “Group VIII.”  The new adult group includes both those newly eligible under the Medicaid expansion (eligible for 100% federal match through December 2016) and those previously eligible (that were matched at traditional match rates but now receive a higher federal match.) While all states have reported expenditure data for the January – December 2014 period, California and North Dakota have not reported enrollment data for that same period.1   This brief examines the MBES data to be able to put the spending and enrollment for the expansion into the context of total Medicaid spending and enrollment. Key findings from this data show:

  • The new adult group represented a relatively small share (10%) of total Medicaid spending across all states in CY 2014. Looking at just expansion states, spending for the new adult group made up a slightly larger share (16%) total spending. The vast majority of spending for the new adult group is federal dollars (94%). This is driven by the 100% federal match available for those newly eligible adults, which make up three-quarters of enrollment in the new adult group.
  • Looking at current enrollment data available, the new adult group made up a relatively small share (13%) of total enrollment. The new adult group made up a larger share of total enrollment in expansion states. However, data are preliminary and enrollment data for large states like California are missing.
  • Spending per enrollee for the new adult group is notably lower than spending per enrollee across all groups ($4,513 vs. $7,150.)

Since this data claiming and reporting process is new, ensuring that the data are comparable and accurate across states may take time. This analysis is preliminary and will continue to be updated as data from missing states are added and data continue to be revised and updated.

Background

Data from the Medicaid Budget and Expenditure System (MBES) released by the Centers for Medicare and Medicaid Services (CMS) provides monthly enrollment and quarterly expenditure data with specific information about enrollment and spending on the new adult group (Group VIII). Historically, states have reported only expenditure data through the MBES, not enrollment data. However, to enable states to claim the enhanced funding available for adults made newly eligible by the ACA, CMS revised the form to require states to report claims separately by eligibility group, including separate reporting of claims for the new adult eligibility group, also referred to as the “Group VIII.”  Group VIII or the new adult group consists of those who are newly eligible as well as some other adults described in the box below. Those that do not qualify under the new adult group are referred to as “traditional Medicaid” for this analysis, which includes individuals with disabilities, the elderly, children, pregnant women and some low-income parents. Since this data claiming and reporting process is new, ensuring that the data are comparable and accurate across states may take time. Additionally, the enrollment data reported through the MBES differ in important ways from other enrollment data reported by CMS through the Performance Indicator process (see Appendix A for more details.)

Data included in this analysis looks at enrollment and expenditure data for January 1, 2014 through December 31, 2014, the first calendar year that the Medicaid expansion was in effect. During this period, 27 states including DC, had implemented the Medicaid expansion; all but two of these states – Michigan (April 1, 2014) and New Hampshire (August 15, 2014) – implemented the Medicaid expansion January 1, 2014. States that expanded after December 31, 2014 (Pennsylvania, Indiana, Alaska and Montana) are treated as non-expansion states in this analysis.

While all states have reported expenditure data for the January – December 2014 period, California and North Dakota have not reported enrollment data for that same period; other states had reported some but not all quarters.2   This brief examines the MBES data to be able to put the spending and enrollment for the expansion into the context of total spending and enrollment.

Who is eligible under the New Adult Group (Group VIII)

Newly-Eligible Adults. Beginning in 2014, newly eligible adults consist of non-elderly, non-disabled adults with incomes up to 138% FPL who would not be eligible for Medicaid under the rules that a state had in place on December 1, 2009. The ACA provides 100% federal financing for those made newly eligible for Medicaid by the law; the federal match rate falls to 95% in 2017, 94% in 2018, 93% in 2019, and then 90% in 2020 and beyond.

Other Group VIII Adults. Other Group VIII Adults include some childless adults in early expansion states as well as those who may be subject to technical adjustments. Some states already provided coverage at the traditional match rate to parents and adults without dependent children up to at least 100% FPL statewide as of March 23, 2010, when the ACA was enacted.  The law provides additional federal funding to these states through the “expansion state match rate” for adults without dependent children under age 65; this “expansion state match rate” is higher than the traditional match rate.3   A few states were able to make adjustments to account for individuals who would not have been eligible because of asset test requirements in place on December 1, 2009, enrollment caps in effect for waiver populations receiving full benefits as of December 1, 2009, and other special circumstances. These adjustments may result in some adults being enrolled in the expansion category who do not qualify for the 100% federal match for newly eligible adults.4 

During calendar year 2014, Medicaid expenditures totaled $486.1 billion dollars. This includes Medicaid spending for all groups – the new adult group as well as the traditional Medicaid population (individuals with disabilities, the elderly, children, etc.) (Appendix Table 2) Spending for the new adult group represented only 10 percent of all Medicaid spending – the vast majority of Medicaid spending was for the traditional population, funded at the regular matching rate. (Figure 1) Across all states and all groups, federal dollars made up nearly 62 percent of Medicaid spending – reflecting both the regular matching rates for the traditional Medicaid population as well as the enhanced funds for the new adult group. The share of federal dollars funding Medicaid spending has increased; historically the federal share has been lower (57%.)

Figure 1: Across all states, the vast majority of Medicaid spending in CY 2014 was for the traditional Medicaid population.

Over calendar year 2014, at least 58.9 million individuals were enrolled in Medicaid for at least some part of the year across the states that reported data. (Appendix Table 3) The inclusion of enrollment data as part of the MBES reporting process was new in 2014. While all states reported data for expenditures, not all states were able to report enrollment data, including large states like California. As revised data are published, this figure is expected to increase. Just as with spending, the new adult group made up a relatively small share (13%) of total Medicaid enrollment. (Figure 1) Among those states reporting both spending and enrollment data, spending per enrollee for the new adult group was much lower than total spending per enrollee across all groups (traditional Medicaid and the new adult group) – $4,513 vs. $7,150. (Figure 2)

Figure 2: Spending per enrollee for the new adult group was much lower than total spending per enrollee.

One of the major changes in the Affordable Care Act was the Medicaid expansion – establishing a new eligibility floor for non-elderly, non-disabled groups at 138 percent FPL and eliminating the long-standing exclusion of childless adults. The June 2012 Supreme Court decisions effectively made this optional for states. As of December 31, 2014, there were 27 states that had implemented the Medicaid expansion; states that expanded later (Pennsylvania, Indiana, Alaska and Montana) are treated as non-expansion states in this analysis. (Figure 3) The remainder of this analysis focuses on spending and enrollment trends in the 27 expansion states only.

Figure 3: Twenty-seven states had the Medicaid expansion in place as of December 2014.

Total and New Adult Group Spending

Across the 27 states that implemented the expansion during calendar year 2014, spending for the new adult group totaled $47.2 billion, representing 16 percent of total Medicaid spending across these states. (Figure 4) The vast majority of this spending (78%) was for those newly eligible adults whose expenditures qualify for the 100 percent federal match. The remaining share of spending for the new adult group was for those adults that were previously eligible at traditional match rates or subject to technical adjustments (see Box 1 for more details); expenditures for these adults are still matched at a higher rate than the traditional match rate, but not the 100 percent federal match.

Figure 4: Looking just at the Expansion states, spending for the new adult group still represents a small share of total spending.

Spending for the new adult group as a share of total Medicaid spending for this period varies across expansion states, ranging from more than 25 percent in Washington, Oregon and Kentucky to less than 10 percent in Illinois and New Hampshire (New Hampshire implemented the Medicaid expansion later – August 15, 2014.) (Figure 5)

Figure 5: The share of spending for the new adult group varies across expansion states.

Federal and State Spending Distribution of Spending

Across all expansion states, the federal share for all Medicaid spending in calendar year 2014 was 61 percent and the state share of spending was 39 percent (virtually the same as at the national level.) (Figure 6) However, there were large differences in these shares for the traditional Medicaid program and the new adult group.

Figure 6: The vast majority of the expenditures for the new adult group are paid for with federal dollars.

The federal government paid more than half of the costs for the traditional Medicaid population in expansion states (55%). This share varies by state according to the traditional FMAP. For the new adult group, virtually all of the expenditures (94%) were paid for with federal dollars. As noted earlier, the new adult group consists of spending for those newly eligible (which are paid for with 100% federal dollars) as well as some other adults that qualify for the new adult group but are not newly eligible. The newly eligible group accounted for more than 3 out of 4 dollars spent on the new adult group ($36.7 billion of the $47.2 billion in new adult group spending). While the other new adult enrollees are not eligible for the 100 percent federal match, the federal share for this group is still well above the traditional match rates that had previously applied to expenditures for these adults.

Distribution of Spending for the New Adult Group by State

In calendar year 2014, states claimed $47.2 billion in total Medicaid spending for the new adult group. Looking at the distribution across states, it is not surprising that larger expansion states had a higher share of expenditures for this group. Expenditures for the new adult group in California represent one quarter (26%) of all the expenditures for the new adult group during this period, followed by New York (14%), Washington (7%), Kentucky (5%) and Oregon (4%). Focusing just on expenditures for the newly eligible (which are 100% federally funded,) California reported one-third of all of these expenditures during this period, followed by Washington (9%), Kentucky, Oregon and New Jersey (all at 6%.) (Figure 7)  Some large states, such as New York, Massachusetts and Arizona, which had expanded coverage prior to the ACA, reported larger shares of new adult group spending for other new adult group enrollees whose expenditures don’t qualify for the 100 percent federal match. However, even in these states the vast majority of expenditures for the new adult group were federal, as the expenditures for the other new adult group enrollees still received a higher federal match than the traditional match rate available before.

Figure 7: Expenditures for the new adult group are concentrated in larger Expansion states.

Total and Group VIII Enrollment

The MBES data have historically not included information about enrollment or spending by eligibility group. To account for the newly eligible federal match rate, CMS has revised the CMS-64 form to require states to report claims separately by eligibility group, including separate reporting for newly eligible adults, as well as to report enrollment by eligibility group. Since this data reporting process is new, ensuring that the data are comparable and accurate across states may take time. Moreover, because these initial data are preliminary, states may continue to provide updates to the enrollment data over time, so the numbers will change. Not all states were able to report enrollment data; enrollment data are not reported for California and North Dakota for all three quarters.

Figure 8: Enrollment among the new adult group makes up a relatively small share of total enrollment among expansion states.

In the expansion states that reported enrollment data, approximately 23 percent of Medicaid enrollment was for the new adult group. (Figure 8) The remaining 77 percent of Medicaid enrollment was for those eligible under the “traditional” Medicaid program (e.g. children, pregnant women, elderly and individuals with disabilities.) However, this varies across expansion states. Enrollment in the new adult group made up nearly half of total enrollment in Oregon (48%) ranging down to 17 percent in Ohio, Minnesota and Massachusetts. (Figure 9)

The make-up of the new adult group (newly eligible vs. other) differs across expansion states. Across all expansion states, over two-thirds of enrollment in the new adult group were newly eligible (those whose expenditures are eligible for 100% federal match through December 2016.) While newly eligible adults made up the vast majority of new adult enrollment in many of the expansion states, there were a handful that saw the majority of enrollment in the new adult group among those not newly eligible (Arizona, Delaware, New York and Massachusetts.) (Figure 9) These states had expanded coverage to adults prior to the ACA.

Among the expansion states that reported enrollment data, the largest share of new adult enrollment was in New York (19% or nearly 1.5 million adults) followed by Illinois (8%), New Jersey, Washington and Michigan (7% each). These five states reported nearly half (47%) of all enrollment among the new adult group. However, the distribution of enrollment among newly eligible adults (those whose expenditures are eligible for 100% federal match through December 2016) differs slightly. Illinois accounted for the highest share of newly eligible adults (11%) followed by New Jersey (10%), Washington (9%), Michigan (9%) and Ohio (8%). As mentioned earlier, New York had expanded coverage to adults prior to the ACA so nearly 9 out of 10 adults eligible under the new adult group in New York are not newly eligible.

Figure 9: The share of enrollment in the new adult group varies across states.

Spending per enrollee

Because childless adults were historically excluded from the Medicaid program prior to the ACA, there was limited data and experience to draw on for determining what utilization and expenditures for this group would be. While the data are preliminary and missing large states such as California, the MBES data provides a window into what spending per enrollee for the new adult group looks like and how it compares to the rest of the Medicaid population. Spending per enrollee for the new adult group is notably lower than spending per enrollee across all groups in expansion states; average spending per enrollee for the new adult group was $4,513 compared to $7,371 per enrollee (new adult group and traditional Medicaid population). (Figure 10) This is in line with historical data on adult spending per enrollee, which has been roughly 60 percent of total spending per enrollee figures.

Figure 10: Spending per enrollee for the new adult group was much lower than spending per enrollee across all groups in expansion states.

Spending per enrollee for those in the new adult group varied widely across states; spending per new adult group enrollee ranged from $8,461 in Rhode Island to $1,706 in New Hampshire (which implemented the Medicaid expansion later). (Appendix Table 4) This level of variation mirrors in large part variation in total spending per enrollee seen across these states as well as patterns in historic spending per enrollee data for adults. There are a number of factors that can lead to this wide dispersion in spending per enrollee figures including differences in health care costs across states and the relative health status of the underlying populations.

Looking Ahead

Data from the MBES released by the CMS provide monthly enrollment and quarterly expenditure data with specific information about enrollment and spending for the new adult eligibility group, also referred to as the “Group VIII.” This new MBES data on spending and enrollment provide further insight into the early effects of the Medicaid expansion on Medicaid spending and enrollment. However, the data are preliminary and this is the first time enrollment data have been collected as part of the claiming process. It also is incomplete with enrollment data missing from some states (California and North Dakota.)  With additional updates and data from missing states, additional analyses can be conducted to understand differences across expansion states as well as difference across expansion and non-expansion states in terms of spending and enrollment patterns.

Methodology

Data from the Medicaid Budget and Expenditure System (MBES) released by the Centers for Medicare and Medicaid Services (CMS) provides monthly enrollment and quarterly expenditure data with specific information about enrollment and spending for the new adult eligibility group, also referred to as the “Group VIII.”  States began reporting enrollment data for the quarter beginning January 1, 2014 and more recently began reporting expenditure data for the new adult group on the Form CMS-64.

Spending data made public reflect the first full year that the Medicaid expansion was in effect: the last three quarters of FFY 2014 (January – September 2014) and the first quarter of FFY 2015 (October – December 2014.) During this period, 27 states including DC, had implemented the Medicaid expansion; all but two of these states – Michigan (April 1, 2014) and New Hampshire (August 15, 2014) – implemented the Medicaid expansion January 1, 2014.

Expenditure data reported in this brief were summed across the four quarters. Data reflect all Title XIX expenditures reported by states; data do not include expenditures under Title XXI (CHIP).

Enrollment data reported are based on the maximum enrollment level reported across the four quarters in each state for Title XIX only (enrollment for under Title XXI or CHIP are excluded.) While this measure is used to try to capture the total number of enrollees over the entire period, it is likely an undercount of the number of enrollees ever on the program; more detailed forthcoming data sources on enrollment (such as the T-MSIS) will yield more accurate (and likely higher) enrollment data. Because different states saw higher levels of enrollment among the newly eligible and the not newly eligible in the new adult group (Group VIII) the Group VIII enrollment reported for states reflects the sum of the maximum newly eligible and the maximum of the not newly eligible. Traditional Medicaid figures are calculated taking the maximum total enrollment figure and subtracting the maximum Group VIII enrollment figure. National numbers for total, traditional Medicaid, Group VIII, newly eligible and not newly eligible enrollment all reflect summations of state maximums and therefore will not match data as reported by CMS. While all states have reported expenditure data for the January – December 2014 period, California and North Dakota have not reported enrollment data for that same period; DC, Colorado, Nevada New Jersey and Washington had reported some but not all months.

Spending per enrollee data are calculated taking the sum of expenditure data over the 4 quarters over the maximum enrollment level. Expenditure data from California and North Dakota were excluded from national calculations since these states did not report enrollment data. The maximum enrollment figure is intended to better capture all people touched by the program over the calendar year examined; however this figure is likely low and is expected increase over time as data are updated and missing data from states like California are added.

Appendices: Appendix A: Comparison To Other Available Data Sources

Spending. States have historically reported expenditure data through the MBES for claiming purposes; this is sometimes referred to as CMS-64 data. However, the expenditure data in this report may differ from other data reported from the MBES due to differences in timing as well as adjustments made to the data. For example, expenditure data from the MBES is commonly reported on a Federal Fiscal Year (FFY) basis (October 1 – September 30) whereas the data in this report reflect the calendar year (January 1 – December 31).

Enrollment Data. Since December 2013, CMS has been providing another source of monthly enrollment data for Medicaid and CHIP as part of its Medicaid and CHIP Performance Indicator Project. There are important differences between the Performance Indicator and MBES enrollment data that limit the ability to make comparisons between the two datasets, as discussed below and highlighted in Appendix Table 1:

  • The data vary in their intended purpose. The MBES enrollment data are collected as part of the claiming process for federal Medicaid matching funds only, not CHIP. The Performance Indicator data are intended to provide timely insight into Medicaid and CHIP eligibility and enrollment trends to support program management and oversight.
  • There are key differences in who is included in the enrollment data. The MBES enrollment data include all enrollees whose spending is eligible for Medicaid matching funds (including limited benefit waiver enrollees and Medicare enrollees that receive cost-sharing and premium assistance from Medicaid). In contrast, the Performance Indicator enrollment data only include enrollees that receive full benefit coverage. Moreover, the MBES enrollment data only include enrollment in Medicaid and not CHIP; the claiming process for CHIP, which has different matching rates, is done separately. The Performance Indicator data include enrollment for both Medicaid and CHIP.
  • There are differences in the timing of the data. The MBES data include individuals enrolled in the state’s Medicaid program at any time during the month of the reporting period. In contrast, the Performance Indicator data are a point-in-time count based on the number of individuals enrolled as of the last day of the month. The MBES enrollment data cover the period between January and June 2015 (though only data through December 2014 is used in this analysis), while the most recent monthly Performance Indicator report included data through October 2015.
Appendix Table 1: Differences Between CMS MBES and Performance Indicator Enrollment Data
MBES DataPerformance Indicator Data
Eligibility Groups includedAll Medicaid enrollees, including those receiving limited benefits (e.g., limited benefit waiver enrollees and Medicare enrollees receiving cost-sharing and premium assistance from Medicaid). Does not include CHIP enrollees.Includes enrollees in Medicaid and CHIP enrollment. Does not include enrollees receiving limited benefits.
Enrollment data periodTotal number of enrollees ever enrolled during the month. (Data are reported on a quarterly basis.)Total number of enrollees as of the last day of the month.
Frequency of reportingQuarterlyMonthly
Most recent data available as of December 2015June 2015 (only data through Dec 2014 are used in this analysis)October 2015
Data purposeCollected as part of the claiming process for federal Medicaid matching funds.Collected as part of new Medicaid and CHIP Performance Indicator Project to inform program management and oversight.

Appendices: Appendix Table 2: Total Medicaid Expenditures, Cy 2014

Appendix Table 2: Total Medicaid Expenditures, CY 2014
StateTotalNew Adult GroupNewly EligibleNot Newly Eligible
Alabama$5,309,736,744N/AN/AN/A
Alaska$1,618,158,522N/AN/AN/A
Arizona$9,460,028,885$1,727,768,395$145,541,925$1,582,226,470
Arkansas$5,226,774,523$967,920,039$967,920,039N/A
California$64,055,189,072$12,199,943,279$12,199,943,279N/A
Colorado$6,368,524,285$992,468,785$968,850,624$23,618,161
Connecticut$7,494,388,273$1,200,936,868$1,181,124,042$19,812,826
Delaware$1,760,894,949$379,235,466$32,930,545$346,304,921
DC$2,334,112,770$297,107,909$282,271,893$14,836,016
Florida$21,336,121,602N/AN/AN/A
Georgia$9,613,091,392N/AN/AN/A
Hawaii$1,975,301,415$373,037,821$242,011,231$131,026,590
Idaho$1,683,668,434N/AN/AN/A
Illinois$16,084,380,996$1,085,547,824$1,072,644,820$12,903,004
Indiana$9,317,184,653N/AN/AN/A
Iowa$4,216,928,813$556,162,683$531,449,280$24,713,403
Kansas$2,842,501,614N/AN/AN/A
Kentucky$8,595,156,527$2,176,007,998$2,176,007,998N/A
Louisiana$7,031,732,700N/AN/AN/A
Maine$2,497,790,662N/AN/AN/A
Maryland$9,725,772,438$1,612,599,592$1,612,599,592N/A
Massachusetts$15,033,457,934$1,554,743,109N/A$1,554,743,109
Michigan$14,116,055,764$1,503,736,391$1,444,562,564$59,173,827
Minnesota$10,638,087,779$1,433,646,514$1,427,247,012$6,399,502
Mississippi$4,973,795,953N/AN/AN/A
Missouri$9,034,749,004N/AN/AN/A
Montana$1,105,703,601N/AN/AN/A
Nebraska$1,831,650,567N/AN/AN/A
Nevada$2,538,887,096$557,912,077$557,912,077N/A
New Hampshire$1,437,357,944$50,174,127$49,928,108$246,019
New Jersey$13,422,100,485$2,077,884,888$2,077,884,888N/A
New Mexico$4,488,133,924$1,015,477,316$1,015,477,316N/A
New York$55,839,970,423$6,717,924,807$446,736,046$6,271,188,761
North Carolina$12,049,566,135N/AN/AN/A
North Dakota$995,053,014$128,096,920$125,595,143$2,501,777
Ohio$19,867,991,538$1,955,996,607$1,842,525,912$113,470,695
Oklahoma$5,045,035,311N/AN/AN/A
Oregon$7,279,593,596$2,107,572,240$2,107,572,240N/A
Pennsylvania$22,961,627,929N/AN/AN/A
Rhode Island$2,522,983,052$457,942,487$457,942,487N/A
South Carolina$5,646,426,012N/AN/AN/A
South Dakota$781,309,878N/AN/AN/A
Tennessee$8,763,278,224N/AN/AN/A
Texas$33,027,788,301N/AN/AN/A
Utah$2,110,973,692N/AN/AN/A
Vermont$1,561,688,259$211,439,523N/A$211,439,523
Virginia$7,633,684,545N/AN/AN/A
Washington$11,262,917,875$3,437,117,412$3,267,848,402$169,269,010
West Virginia$3,500,885,440$420,573,988$420,573,988N/A
Wisconsin$7,547,033,281N/AN/AN/A
Wyoming$540,533,820N/AN/AN/A
United States$486,105,759,645$47,198,975,065$36,655,101,451$10,543,873,614
NOTES: Data reflect expenditures for January through December 2014. See Methodology for more details.SOURCE: KCMU analysis of Medicaid spending and enrollment data collected from the MBES, CMS, accessed December 2015

Appendices: Appendix Table 3: Preliminary Medicaid Enrollment, Cy 2014

Appendix Table 3: Preliminary Medicaid Enrollment, CY 2014
StateTotalNew Adult GroupNewly EligibleNot Newly Eligible
Alabama         1,050,254       N/AN/AN/A
Alaska             121,405       N/AN/AN/A
Arizona         1,732,726           359,093             61,709           297,384
Arkansas             871,098           265,032           224,870             40,162
CaliforniaData Not Reported
Colorado             976,972           211,389           210,013               1,376
Connecticut             851,013           188,969           177,393             11,576
Delaware             205,356             59,841               9,961             49,880
DC             243,852             53,954             53,954                      –
Florida         3,954,371       N/AN/AN/A
Georgia         1,793,252       N/AN/AN/A
Hawaii             333,090             84,838             46,061             38,777
Idaho             290,376       N/AN/AN/A
Illinois         2,992,947           590,415           577,455             12,960
Indiana         1,096,804       N/AN/AN/A
Iowa             553,661           121,275           112,326               8,949
Kansas             369,784       N/AN/AN/A
Kentucky         1,200,615           378,364           378,364                      –
Louisiana         1,351,281       N/AN/AN/A
Maine             300,720       N/AN/AN/A
Maryland         1,160,217           217,282           217,282                      –
Massachusetts         1,981,413           343,836                      –           343,836
Michigan         2,162,402           504,430           470,828             33,602
Minnesota         1,105,285           185,011           183,824               1,187
Mississippi             736,517       N/AN/AN/A
Missouri             840,679       N/AN/AN/A
Montana             152,200       N/AN/AN/A
Nebraska             237,519       N/AN/AN/A
Nevada             556,116           164,906           164,906                      –
New Hampshire             167,988             29,406             29,124                   282
New Jersey         1,652,548           539,902           539,902                      –
New Mexico             753,184           184,942           184,942                      –
New York         5,992,264       1,494,419           202,684       1,291,735
North Carolina         1,935,493       N/AN/AN/A
North DakotaData Not Reported
Ohio         2,924,123           485,312           448,378             36,934
Oklahoma             765,374       N/AN/AN/A
Oregon         1,035,570           492,687           407,990             84,697
Pennsylvania         2,110,761       N/AN/AN/A
Rhode Island             267,327             54,126             54,126                      –
South Carolina         1,193,222       N/AN/AN/A
South Dakota             108,302       N/AN/AN/A
Tennessee         1,504,276       N/AN/AN/A
Texas         4,330,364       N/AN/AN/A
Utah             323,730       N/AN/AN/A
Vermont             192,515             51,911                      –             51,911
Virginia             931,238       N/AN/AN/A
Washington         1,678,876           510,155           492,358             17,797
West Virginia             527,194           155,636           155,636                      –
Wisconsin         1,201,672       N/AN/AN/A
Wyoming               73,744       N/AN/AN/A
United States       58,891,690        7,727,131        5,404,086        2,323,045
NOTES: Data reflect preliminary maximum enrollment in calendar year 2014. See Methodology for more details.SOURCE: KCMU analysis of Medicaid spending and enrollment data collected from the MBES, CMS, accessed December 2015.

Appendices: Appendix Table 4: Spending Per Enrollee In Expansion States, Cy 2014

Appendix Table 4: Spending per Enrollee in Expansion States, CY 2014
StateSpending per enrollee forthe new adult group (Group VIII)Spending per enrollee across all groups(Traditional and Group VIII)
Arizona$4,811$5,460
Arkansas$3,652$6,000
California
Colorado$4,695$6,519
Connecticut$6,355$8,806
Delaware$6,337$8,575
District of Columbia$5,507$9,572
Hawaii$4,397$5,930
Illinois$1,839$5,374
Iowa$4,586$7,616
Kentucky$5,751$7,159
Maryland$7,422$8,383
Massachusetts$4,522$7,587
Michigan$2,981$6,528
Minnesota$7,749$9,625
Nevada$3,383$4,565
New Hampshire$1,706$8,556
New Jersey$3,849$8,122
New Mexico$5,491$5,959
New York$4,495$9,319
North Dakota
Ohio$4,030$6,795
Oregon$4,278$7,030
Rhode Island$8,461$9,438
Vermont$4,073$8,112
Washington$6,737$6,709
West Virginia$2,702$6,641
Expansion State Average$4,513$7,371
NOTES: Data for January through December 2014. Data are limited to the 27 states that had implemented the Medicaid expansion effective December 2014. Data reflect spending per enrollee for each state during this period using expenditures summed across the 4 quarters and the highest level of enrollment reported. Data were not reported for California and North Dakota. All but 2 of these states (MI and NH) implemented the expansion January 2014; MI’s expansion became effective April 1, 2014 and NH’s expansion became effective August 15, 2014.SOURCE: Kaiser Commission on Medicaid and the Uninsured analysis of Medicaid spending and enrollment data collected from the Medicaid Budget and Expenditure System (MBES), Centers for Medicare and Medicaid Services, accessed December 2015. http://medicaid.gov/medicaid-chip-program-information/by-topics/financing-and-reimbursement/expenditure-reports-mbes-cbes.html


Endnotes

  1. Additionally, not all states reported enrollment data for all periods. The District of Columbia reported enrollment data for all but the first quarter (January – March 2014). Colorado reported enrollment data for only the first quarter (January – March 2014). Hawaii reported enrollment data for all but the last quarter (October – December 2014). Nevada, New Jersey and Washington reported enrollment data in each quarter, they did not report enrollment data for each month in the 4th quarter of 2014 (data were reported for December only). ↩︎
  2. Additionally, not all states reported enrollment data for all periods. The District of Columbia reported enrollment data for all but the first quarter (January – March 2014). Colorado reported enrollment data for only the first quarter (January – March 2014). Hawaii reported enrollment data for all but the last quarter (October – December 2014). Nevada, New Jersey and Washington reported enrollment data in each quarter, they did not report enrollment data for each month in the 4th quarter of 2014 (data were reported for December only). ↩︎
  3. Expansion states that do not have any newly-eligible Medicaid beneficiaries because they already covered people up to 138% FPL or higher (e.g. Massachusetts) also receive a temporary (January 1, 2014 through December 31, 2015) 2.2 percentage point increase in their federal matching rate for all populations. ↩︎
  4. Robin Rudowitz, “Understanding How States Access the ACA Enhanced Medicaid Match Rates”, Kaiser Family Foundation, September 2014. https://modern.kff.org/medicaid/issue-brief/understanding-how-states-access-the-aca-enhanced-medicaid-match-rates/ ↩︎