Where President-elect Donald Trump Stands on Six Health Care Issues
Section:
Election 2016: The Issues

While health care was not central to the 2016 Presidential campaign, the election’s outcome will be a major determining factor in the country’s future health care policy. A number of issues have garnered media attention, including the future of the Affordable Care Act (ACA), rising prescription drug costs, and the opioid epidemic.
President-elect Donald Trump has laid out different approaches to addressing these and other health care issues. Central among these is his position to fully repeal the ACA.
See where he stands on six key health policy issues.
Health Insurance Coverage and Costs
The Affordable Care Act (ACA) set new standards for virtually all private health plans, including a prohibition on pre-existing condition exclusions and a requirement for private plans to extend dependent coverage to the age of 26. The law also established new marketplaces for the sale of nongroup insurance to all individuals except undocumented immigrants, and created new subsidies for nongroup coverage. New fees, taxes, and offsetting budget savings were adopted to finance ACA subsidies and reduce the deficit, including a so-called “Cadillac tax” on high-cost employer-sponsored plans. The Congressional Budget Office (CBO) estimated repeal of the ACA would increase the federal deficit by $137 – $353 billion over 10 years (2016-2025). Since enactment, the uninsured rate has fallen to 8.6% and an estimated 20 million Americans have gained coverage, while 27 million remain uninsured. Public opinion about the ACA remains divided, largely on partisan lines. Several issues have emerged in the 2016 campaign.
Donald Trump supports complete repeal of the ACA, including the individual mandate to have coverage. In lieu of requiring insurers to provide coverage to everyone regardless of health status, he would work with states to create high risk pools for individuals who have not maintained continuous coverage. In place of refundable premium tax credits, Trump would provide a tax deduction for the purchase of individual health insurance. He would promote competition between health plans by allowing insurers to sell plans across state lines; an insurer licensed under the rules of one state would be allowed to sell coverage in other states without regard to different state laws that might apply. He would promote the use of Health Savings Accounts (HSA), and specifically would allow tax-free transfer of HSAs to all heirs. Trump would also require price transparency from all hospitals, doctors, clinics and other providers so that consumers can see and shop for the best prices for health care procedures and other services.
Medicaid
Medicaid is the nation’s main public health insurance program for people with low incomes covering about 70 million Americans. Medicaid provides coverage for low income individuals and families with low or no out-of-pocket costs for care; assistance to low-income Medicare beneficiaries; coverage for long-term services and supports, and financing for safety-net hospitals, clinics and states.
Donald Trump supports a Medicaid block-grant and a repeal of the ACA (including the Medicaid expansion). He has said he would cover the low-income uninsured through Medicaid after repealing the ACA. The House Republican Plan, which is part of a larger package designed to replace the ACA and reduce federal spending for health care, would offer states a choice between a Medicaid per capita allotment or a block grant.
Medicare
Medicare is the nation’s health insurance program that provides coverage to 57 million seniors and younger adults with permanent disabilities. Four issues related to Medicare have emerged during the 2016 presidential campaign.
Donald Trump has stated that his Administration will act to “Modernize Medicare”. In the past, this term has been used to refer to proposals such as premium support and raising the age of Medicare eligibility. Mr. Trump supports repealing and replacing the ACA, which could affect the Medicare provisions included in the law, such as improved preventive and drug benefits and numerous Medicare savings proposals. On the issue of prescription drug costs, Mr. Trump previously supported allowing safe importation of prescription drugs from other countries, but this position is not currently reflected on his website.
Prescription Drugs
Prescription drugs are the third largest area of U.S. health spending, and a main driver of growth. New drugs, which require significant research and development (R&D) investments, receive a period of patent protection and market exclusivity. Following this period, the Food and Drug Administration (FDA) may approve generic drugs, which perform the same as the brand name product, often at much lower costs. The Affordable Care Act (ACA) includes a provision to fast-track approval of “biosimilars,” which are drugs that perform similarly to an existing biologic drug (one derived from living organisms). Since 2010, more new specialty drugs have been approved than traditional drugs. Unlike traditional drugs, specialty drugs (which are often biologics) require special administration (such as injection) or close observation by a physician.
Donald Trump supports allowing importation of drugs from overseas that are safe and reliable but priced lower than in the U.S. He also supports greater price transparency from all health providers, especially for medical exams and procedures performed at doctors’ offices, clinics, and hospitals, but does not specify whether this policy would also apply to retail prescription drugs, which typically are not considered services or procedures.
The Opioid Epidemic
In recent years, the use of prescription painkillers for nonmedical purposes, as well as drugs derived from opium (such as heroin), has emerged as a major public health issue. In 2013, 1 in 20 nonelderly adults used opioids for nonmedical purposes. For one in five users (almost 2 million nonelderly adults), the nonmedical use of opioids increases to the level of opioid use disorder, often referred to as abuse, dependence, or addiction. Overdose deaths involving opioids have quadrupled since 1999, with over 14,000 individuals dying from prescription opioid overdoses in 2014, leading to what many refer to as an “opioid epidemic.” The opioid epidemic creates an estimated $55 billion annually in societal costs, such as health care expenditures, workplace costs due to lost wages and utilization of sick days, and criminal justice costs. Proposed policy actions to address the opioid epidemic include efforts to change prescribing practices to curb utilization of opioids, improve access to treatment for individuals with opioid use disorder, and enforcing drug laws to combat access, sale and use of illicit drugs.
Donald Trump has said he will stop of the flow of illegal drugs into the country by building a wall on the U.S.-Mexican border and closing shipping loopholes that allow dangerous drugs to be mailed into the U.S. He would also enhance access to addiction services, end Medicaid policies that obstruct inpatient treatment, increase first responders’ access to naloxone, lift the cap on the number of patients that providers can treat with recovery medicines, and expand incentives for state and local governments to use drug courts and mandated treatment to respond to the addiction crisis.
Reproductive Health
Reproductive health is an essential element of women’s healthcare. The Affordable Care Act (ACA) greatly expanded coverage for these services for millions of women. Access and availability of abortion services and federal payments for contraceptive providers, however, have emerged as key issues in this year’s presidential election.
Donald Trump has called for defunding Planned Parenthood if they continue to provide abortion and would redirect their funding to community health centers. He states he is pro-life but with exceptions when the pregnancy is a result of rape, incest, and life endangerment. Trump has promised to appoint pro-life justices to the Supreme Court that seek to overturn Roe v. Wade. He would also work to make the Hyde Amendment permanent law and sign the Pain-Capable Child Protection Act, legislation that would sharply limit access to later term abortions. He would also repeal the ACA, which would eliminate minimum scope of benefits standards such as maternity care in individual plans and coverage of no-cost preventive services such as contraceptives in private plans.
News Release
Under the Affordable Care Act, People of Color Have Seen Greater Gains in Health Coverage But Remain More Likely Than Whites to Be Uninsured
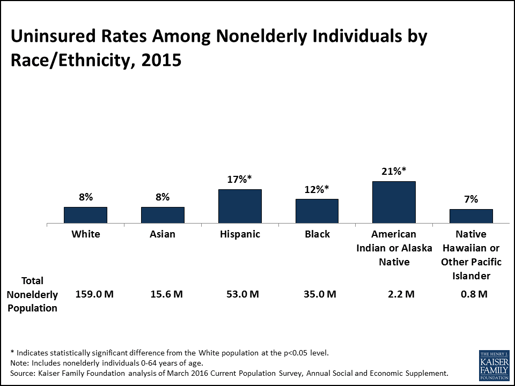
The uninsured rate has fallen among all racial and ethnic groups under the Affordable Care Act with steeper declines among people of color compared to Whites, according to a new analysis by the Kaiser Family Foundation. The findings for Hispanics were especially striking. Between 2013 and 2015, the uninsured rate for Hispanics fell from 26 percent to 17 percent – a sharper decline than for any other group. Nationally, the total number of nonelderly uninsured fell from 41.1 million to 28.5 million, reducing the overall uninsured rate from 15 percent to a historic low of 10 percent over the period.
Despite such gains, however, non-elderly Hispanics, Blacks and American Indian and Alaska Natives still remained more likely than Whites to be uninsured as of 2015. American Indians and Alaska Natives and Hispanics were at the highest risk of being uninsured (see figure).
The analysis of Current Population Survey data also shows that eligibility for coverage among the remaining uninsured varies by race and ethnicity. Overall, more than 4 in 10 remaining nonelderly uninsured people are eligible for help to gain coverage through the ACA. Key findings include:
- Sixty-seven percent of nonelderly uninsured American Indians and Alaska Natives are eligible for such help.
- Nearly half (47%) of nonelderly uninsured Blacks are eligible for coverage, but they are twice as likely as uninsured Whites (20% vs. 10%) to not qualify for help because their state did not expand Medicaid.
- The shares eligible for coverage are lower for Asians (34%) and Hispanics (33%) because they include more noncitizens that do not qualify based on immigration status.
Coverage is more available under the ACA, but more gains are possible by reaching the uninsured who are eligible but not enrolled. Overall, people of color account for over half (55%) of the total nonelderly uninsured who are eligible for Medicaid but not yet enrolled, and 42 percent of those eligible for ACA tax credits to help buy private insurance.
Health Affairs Blog: The Cost Of A Cure: Revisiting Medicare Part D And Hepatitis C Drugs
This post now available at the Health Affairs Blog by Jack Hoadley of Georgetown University’s Health Policy Institute, and Tricia Neuman and Juliette Cubanski, both of the Kaiser Family Foundation, updates a two-year-old analysis of Sovaldi (sofosbuvir), an oral drug approved by the FDA for the treatment of chronic hepatitis C, and the potential impact of the new specialty drug on Medicare spending and Part D premiums.For that 2014 piece, the authors used the best available data to estimate the number of people on Medicare who might seek treatment and the impact on Medicare spending. Here they revisit the earlier analysis using new data released by the Centers for Medicare and Medicaid Services, and consider both the ongoing impact of hepatitis C drugs for Part D and the broader implications for Medicare of new high-priced drugs entering the market.
News Release
More than 8 in 10 Workers With Spousal Health Benefits Have Access to Same-Sex Spousal Benefits, Analysis Finds
Following two major Supreme Court rulings on same-sex marriage, a new Kaiser Family Foundation data note finds that in 2016, 84 percent of employees who worked at firms offering spousal health benefits also had access to same-sex spousal benefits. Eight percent did not have access, while another 8 percent worked at firms who reported they had not encountered this benefits issue.
The data note draws from responses to the Kaiser/Health Research & Educational Trust (Kaiser/HRET) 2016 Annual Employer Health Benefits Survey. Small employers are less likely to offer same-sex spousal coverage, while larger firms, which employ the majority of U.S. workers, are more likely to offer this benefit. Ninety-four percent of workers at large firms (200 or more employees) with access to opposite-sex spousal health benefits also had access to same-sex spousal benefits, compared to 59 percent of workers at small firms.
Across all employers who offer spousal coverage, less than half (43%) say they offer coverage to same-sex spouses. About as many (41%) say they have not encountered this issue, while a smaller share (16%) say they do not offer same-sex spousal coverage.
2017 Premium Changes and Insurer Participation in the Affordable Care Act’s Health Insurance Marketplaces
How Premiums Are Changing in 2018 is now available.
Health insurance premiums on the Affordable Care Act’s marketplaces (also called exchanges) are expected to increase faster in 2017 than in previous years due to a combination of factors, including substantial losses experienced by many insurers in this market and the phasing out of the ACA’s reinsurance program. We analyzed 2017 premiums and insurer participation made available through Healthcare.gov on October 24, 2017, as well as data collected from states that run their own exchange websites.
Changes in the Second-Lowest Silver Premium
The second-lowest silver plan is one of the most popular plan choices on the marketplace and is also the benchmark that is used to determine the amount of financial assistance individuals and families receive. The table below shows these premiums for a major city in each state with available data. (We have been reporting premiums in these cities since the launch of the ACA’s exchanges in 2014; similar analyses for 2015 and 2016 are also available.)
Across these major cities in 2016, the second-lowest silver premium for a 40-year-old non-smoker ranged from $186 per month in Albuquerque, NM to $719 in Anchorage, AK, before accounting for the tax credit that most enrollees in this market receive. In 2017, the second-lowest silver premium for a 40-year-old non-smoker living in these cities will range from $229 in Louisville, KY and Cleveland, OH to $904 in Anchorage, AK, before accounting for the tax credit.
Of these major cities, the places with the largest increases in the unsubsidized second-lowest silver plan were Phoenix, AZ (up 145% from $207 to $507 per month for a 40-year-old non-smoker), Birmingham, AL (up 71% from $288 to $492) and Oklahoma City, OK (up 67% from $295 to $493). Meanwhile, unsubsidized premiums for the second-lowest silver premiums will decrease in Indianapolis, IN (down -4% from $298 to $286 for a 40-year-old non-smoker), Cleveland, OH (down -2% from $234 to $229), Boston, MA (down -1% from $250 to $247), and Providence, RI (down -1% from $263 to $261) and increase just 1% in Little Rock, AR (from $310 to $314).
Most enrollees in the marketplaces receive a tax credit to lower their premium. In most parts of the country in 2016, a 40-year-old adult making $30,000 per year would pay about $208 per month for the second-lowest-silver plan. If this person is willing to switch to whatever the new second lowest-cost silver plan is in 2017, they will pay a similar amount (the after-tax credit payment for a similar person in 2017 is $207 per month or a change of 0%). In some parts of the country (for example, in Albuquerque, NM), premiums for a 40-year-old are so low in 2016 that an enrollee making $30,000 may not have qualified for a subsidy. In these places, an increase in the benchmark silver premium may make them newly-eligible for financial assistance.
| Table 1: Monthly Silver Premiums and Financial Assistancefor a 40 Year Old Non-Smoker Making $30,000 / Year | ||||||||||
| State | Major City | 2nd Lowest Cost SilverBefore Tax Credit | 2nd Lowest Cost SilverAfter Tax Credit | Amount ofPremium Tax Credit | ||||||
| 2016 | 2017 | % Changefrom 2016 | 2016 | 2017 | % Changefrom 2016 | 2016 | 2017 | % Changefrom 2016 | ||
| Alabama | Birmingham | $288 | $492 | 71% | $208 | $207 | 0% | $80 | $285 | 256% |
| Alaska | Anchorage | $719 | $904 | 26% | $164 | $163 | -1% | $555 | $741 | 33% |
| Arizona | Phoenix | $207 | $507 | 145% | $207 | $207 | 0% | $0 | $300 | N/A |
| Arkansas | Little Rock | $310 | $314 | 1% | $208 | $207 | 0% | $102 | $107 | 4% |
| California | Los Angeles | $245 | $258 | 5% | $208 | $207 | 0% | $37 | $51 | 38% |
| Colorado | Denver | $278 | $313 | 12% | $208 | $207 | 0% | $70 | $106 | 51% |
| Connecticut | Hartford | $318 | $404 | 27% | $208 | $207 | 0% | $110 | $196 | 79% |
| Delaware | Wilmington | $356 | $423 | 19% | $208 | $207 | 0% | $148 | $216 | 46% |
| DC | Washington | $244 | $298 | 22% | $208 | $207 | 0% | $36 | $91 | 153% |
| Florida | Miami | $262 | $306 | 17% | $208 | $207 | 0% | $54 | $99 | 84% |
| Georgia | Atlanta | $254 | $286 | 13% | $208 | $207 | 0% | $46 | $79 | 72% |
| Hawaii | Honolulu | $262 | $347 | 32% | $179 | $178 | -1% | $83 | $169 | 104% |
| Idaho | Boise | $273 | $348 | 27% | $208 | $207 | 0% | $65 | $141 | 117% |
| Illinois | Chicago | $198 | $291 | 48% | $198 | $207 | 5% | $0 | $84 | N/A |
| Indiana | Indianapolis | $298 | $286 | -4% | $208 | $207 | 0% | $90 | $79 | -12% |
| Iowa | Cedar Rapids | $284 | $301 | 6% | $208 | $207 | 0% | $76 | $94 | 25% |
| Kansas | Wichita | $248 | $361 | 46% | $208 | $207 | 0% | $40 | $154 | 287% |
| Kentucky | Louisville | $223 | $229 | 3% | $208 | $207 | 0% | $15 | $22 | 47% |
| Louisiana | New Orleans | $332 | $373 | 13% | $208 | $207 | 0% | $124 | $166 | 34% |
| Maine | Portland | $288 | $341 | 19% | $208 | $207 | 0% | $80 | $134 | 68% |
| Maryland | Baltimore | $249 | $309 | 24% | $208 | $207 | 0% | $41 | $102 | 152% |
| Massachusetts | Boston | $250 | $247 | -1% | $208 | $207 | 0% | $42 | $40 | -5% |
| Michigan | Detroit | $226 | $237 | 5% | $208 | $207 | 0% | $18 | $29 | 65% |
| Minnesota | Minneapolis | $235 | $366 | 55% | $208 | $207 | 0% | $27 | $159 | 481% |
| Mississippi | Jackson | $283 | $352 | 25% | $208 | $207 | 0% | $75 | $145 | 95% |
| Missouri | St Louis | $287 | $310 | 8% | $208 | $207 | 0% | $79 | $103 | 31% |
| Montana | Billings | $322 | $425 | 32% | $208 | $207 | 0% | $114 | $218 | 92% |
| Nebraska | Omaha | $313 | $368 | 18% | $208 | $207 | 0% | $105 | $161 | 54% |
| Nevada | Las Vegas | $261 | $282 | 8% | $208 | $207 | 0% | $53 | $75 | 41% |
| New Hampshire | Manchester | $261 | $267 | 2% | $208 | $207 | 0% | $53 | $60 | 14% |
| New Jersey | Newark | $330 | $353 | 7% | $208 | $207 | 0% | $122 | $146 | 19% |
| New Mexico | Albuquerque | $186 | $258 | 39% | $186 | $207 | 11% | $0 | $51 | N/A |
| New York | New York City | $369 | $456 | 24% | $208 | $207 | 0% | $161 | $249 | 55% |
| North Carolina | Charlotte | $409 | $572 | 40% | $208 | $207 | 0% | $201 | $364 | 82% |
| North Dakota | Fargo | $304 | $331 | 9% | $208 | $207 | 0% | $96 | $124 | 29% |
| Ohio | Cleveland | $234 | $229 | -2% | $208 | $207 | 0% | $26 | $22 | -17% |
| Oklahoma | Okla. City | $295 | $493 | 67% | $208 | $207 | 0% | $87 | $286 | 230% |
| Oregon | Portland | $261 | $312 | 20% | $208 | $207 | 0% | $53 | $105 | 98% |
| Pennsylvania | Philadelphia | $276 | $418 | 51% | $208 | $207 | 0% | $68 | $211 | 209% |
| Rhode Island | Providence | $263 | $261 | -1% | $208 | $207 | 0% | $55 | $54 | -2% |
| South Carolina | Columbia | $314 | $404 | 29% | $208 | $207 | 0% | $106 | $197 | 85% |
| South Dakota | Sioux Falls | $309 | $448 | 45% | $208 | $207 | 0% | $101 | $241 | 138% |
| Tennessee | Nashville | $281 | $419 | 49% | $208 | $207 | 0% | $73 | $212 | 192% |
| Texas | Houston | $256 | $288 | 13% | $208 | $207 | 0% | $48 | $81 | 69% |
| Utah | Salt Lake City | $244 | $292 | 20% | $208 | $207 | 0% | $36 | $85 | 139% |
| Vermont | Burlington | $468 | $492 | 5% | $208 | $207 | 0% | $260 | $285 | 9% |
| Virginia | Richmond | $276 | $296 | 7% | $208 | $207 | 0% | $68 | $89 | 31% |
| Washington | Seattle | $227 | $238 | 5% | $208 | $207 | 0% | $19 | $31 | 62% |
| West Virginia | Huntington | $341 | $419 | 23% | $208 | $207 | 0% | $132 | $212 | 60% |
| Wisconsin | Milwaukee | $326 | $379 | 16% | $208 | $207 | 0% | $117 | $172 | 46% |
| Wyoming | Cheyenne | $426 | $464 | 9% | $208 | $207 | 0% | $218 | $257 | 18% |
| NOTES: In areas in which the two lowest-cost silver plans have the same premium, the next lowest-cost silver plan is used as the “second-lowest” silver plan. In some cases, a portion of the second lowest-cost silver plan is for non-essential health benefits so these values may differ from the benchmark used to determine subsidies.SOURCE: Kaiser Family Foundation analysis of premium data from Healthcare.gov and insurer rate filings to state regulators. For more information see “Early Look at 2017 Premium Changes and Insurer Participation in the Affordable Care Act’s Health Insurance Marketplaces” Jul 2016. | ||||||||||
Changes in Insurer Participation
As a result of losses in this market, some insurers like UnitedHealth and Aetna have announced their withdrawal from the ACA marketplaces or the individual market in some states. In 2016, the number of insurers participating in each state (grouped by parent company) ranged from 1 in Wyoming to 16 in Texas. In states that use Healthcare.gov, the average number of insurers participating in the marketplace will be 3.9 in 2017 (down from 5.4 companies per state in 2016, 5.9 in 2015 and 4.5 in 2014). Marketplace insurer participation in states using Healthcare.gov in 2017 ranges from 1 company in Alabama, Alaska, Oklahoma, South Carolina, and Wyoming, to 15 companies in Wisconsin.
| Table 2: Total Number of Insurers by State, 2014 – 2017 | ||||
| Total Number of Issuers in the Marketplace | ||||
| State | 2014 | 2015 | 2016 | 2017 |
| Alabama | 2 | 3 | 3 | 1 |
| Alaska | 2 | 2 | 2 | 1 |
| Arizona | 8 | 11 | 8 | 2 |
| Arkansas | 3 | 4 | 4 | 3 |
| California | 11 | 10 | 12 | NA |
| Colorado | 10 | 10 | 8 | NA |
| Connecticut | 3 | 4 | 4 | NA |
| Delaware | 2 | 2 | 2 | 2 |
| DC | 3 | 3 | 2 | NA |
| Florida | 8 | 10 | 7 | 5 |
| Georgia | 5 | 9 | 8 | 5 |
| Hawaii | 2 | 2 | 2 | 2 |
| Idaho | 4 | 5 | 5 | NA |
| Illinois | 5 | 8 | 7 | 5 |
| Indiana | 4 | 8 | 7 | 4 |
| Iowa | 4 | 4 | 4 | 4 |
| Kansas | 3 | 3 | 3 | 3 |
| Kentucky | 3 | 5 | 7 | 3 |
| Louisiana | 4 | 5 | 4 | 3 |
| Maine | 2 | 3 | 3 | 3 |
| Maryland | 4 | 5 | 5 | NA |
| Massachusetts | 10 | 10 | 10 | NA |
| Michigan | 9 | 13 | 11 | 9 |
| Minnesota | 5 | 4 | 5 | NA |
| Mississippi | 2 | 3 | 3 | 2 |
| Missouri | 3 | 6 | 6 | 4 |
| Montana | 3 | 4 | 3 | 3 |
| Nebraska | 4 | 4 | 4 | 2 |
| Nevada | 4 | 5 | 3 | 3 |
| New Hampshire | 1 | 5 | 5 | 4 |
| New Jersey | 3 | 5 | 5 | 2 |
| New Mexico | 4 | 5 | 4 | 4 |
| New York | 16 | 16 | 15 | NA |
| North Carolina | 2 | 3 | 3 | 2 |
| North Dakota | 3 | 3 | 3 | 3 |
| Ohio | 11 | 15 | 15 | 11 |
| Oklahoma | 4 | 4 | 2 | 1 |
| Oregon | 11 | 10 | 10 | 6 |
| Pennsylvania | 7 | 9 | 7 | 6 |
| Rhode Island | 2 | 3 | 3 | NA |
| South Carolina | 3 | 4 | 3 | 1 |
| South Dakota | 3 | 3 | 2 | 2 |
| Tennessee | 4 | 5 | 4 | 3 |
| Texas | 11 | 14 | 16 | 10 |
| Utah | 6 | 6 | 4 | 3 |
| Vermont | 2 | 2 | 2 | NA |
| Virginia | 5 | 6 | 7 | 9 |
| Washington | 7 | 9 | 9 | NA |
| West Virginia | 1 | 1 | 2 | 2 |
| Wisconsin | 13 | 15 | 16 | 15 |
| Wyoming | 2 | 2 | 1 | 1 |
| HealthCare.gov Average | 4.5 | 5.9 | 5.4 | 3.9 |
| US Average | 5 | 6.1 | 5.7 | NA |
| SOURCE: Kaiser Family Foundation analysis of premium data from Healthcare.gov and insurer rate filings to state regulators. For more information see “Early Look at 2017 Premium Changes and Insurer Participation in the Affordable Care Act’s Health Insurance Marketplaces” Jul 2016.NOTES: Insurers are grouped by parent company or group affiliation, which we obtained from HHS Medical Loss Ratio public use files and supplemented with additional research. For 2017, the number of insurers in non-Healthcare.gov states is not yet available. | ||||
Medicare and End-of-Life Care
View the JAMA Infographic
Visualizing Health Policy: Medicare and End-of-Life Care
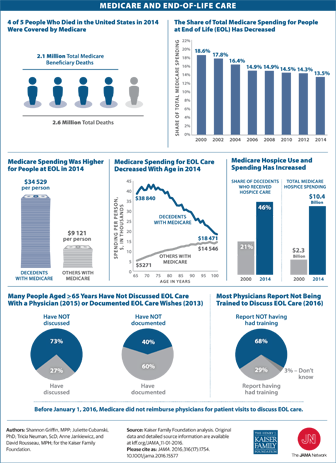
This Visualizing Health Policy infographic provides a snapshot of Medicare and end-of-life care. Of 2.6 million total deaths in the United States in 2014, 2.1 million were Medicare beneficiaries. Although Medicare spent significantly more on care for people at the end of life who died in 2014 ($34,529 per person) than for other beneficiaries that year ($9,121 per person), the share of total Medicare spending for people at the end of life decreased from 18.6% to 13.5% between 2000 and 2014. Medicare spending for people at the end of life also decreased with age. Hospice use among Medicare beneficiaries at the end of life increased between 2000 and 2014 to nearly half (46%) of all beneficiaries. Medicare spending on hospice also increased during that period, from $2.3 billion to $10.4 billion. Surveys show that more than 7 in 10 people aged 65 years and older have not discussed end-of-life care with a physician, and that 4 in 10 have not documented their end-of-life care wishes. Before Jan. 1, 2016, Medicare did not reimburse physicians for patient visits to discuss end-of-life care, and as of 2016, 68% of physicians report that they have not received training for such discussions.
Visualizing Health Policy is a monthly infographic series produced in partnership with the Journal of the American Medical Association (JAMA). The full-size infographic is freely available on JAMA’s website and is published in the print edition of the journal.
News Release
Visualizing Health Policy: Medicare and End-of-Life Care
This Visualizing Health Policy infographic provides a snapshot of Medicare and end-of-life care. Of 2.6 million total deaths in the United States in 2014, 2.1 million were Medicare beneficiaries. Although Medicare spent significantly more on care for people at the end of life who died in 2014 ($34,529 per person) than for other beneficiaries that year ($9,121 per person), the share of total Medicare spending for people at the end of life decreased from 18.6% to 13.5% between 2000 and 2014. Medicare spending for people at the end of life also decreased with age. Hospice use among Medicare beneficiaries at the end of life increased between 2000 and 2014 to nearly half (46%) of all beneficiaries. Medicare spending on hospice also increased during that period, from $2.3 billion to $10.4 billion. Surveys show that more than 7 in 10 people aged 65 years and older have not discussed end-of-life care with a physician, and that 4 in 10 have not documented their end-of-life care wishes. Before Jan. 1, 2016, Medicare did not reimburse physicians for patient visits to discuss end-of-life care, and as of 2016, 68% of physicians report that they have not received training for such discussions.
Visualizing Health Policy is a monthly infographic series produced in partnership with the Journal of the American Medical Association (JAMA). The full-size infographic is freely available on JAMA’s website and is published in the print edition of the journal.
News Release
Donor Government Funding for Family Planning was Essentially Flat in 2015 in Real Terms, Though It Declined When Measured in Current U.S. Dollars
A new Kaiser Family Foundation report finds that donor governments provided US$1.3 billion in bilateral funding for family planning programs in low- and middle-income countries in 2015, essentially matching 2014 levels in real terms (after accounting for exchange rate fluctuations and inflation). In current U.S. dollars, however, 2015 funding was 6 percent below the 2014 level, largely due to the appreciation of the U.S. dollar.
When measured in their currency of origin, the report finds five donors actually increased funding, while three donors decreased, and two donors remained flat.
The U.S. was the largest donor, providing US$638 million, or nearly half of all bilateral funding for family planning programs in 2015. The U.K. (US$270 million) was the second largest bilateral donor, followed by the Netherlands (US$166 million), France (US$69 million), and Sweden (US$66 million).
Among the ten donor countries profiled in the analysis, eight made commitments at the London Summit on Family Planning in 2012; seven of the eight are on track towards fulfillment of these commitments.
This analysis is being released at the same time as Family Planning 2020’s (FP2020) annual report on progress toward goals agreed upon at the 2012 London Summit on Family Planning.