KFF designs, conducts and analyzes original public opinion and survey research on Americans’ attitudes, knowledge, and experiences with the health care system to help amplify the public’s voice in major national debates.
Insurance coverage of contraceptive services has been the focus of policy attention by state and federal policy makers as well as in the courts over the past two decades. In 2012, all new private plans were required to cover, without cost-sharing, the full range of contraceptives and services approved by the Food and Drug Administration (FDA) as prescribed for women.1 For the first time, federal standards created a minimum set of benefits for most health plans regulated by the federal government (self-insured plans, federal employee plans) and states (individual, small and large group plans), including contraceptive coverage for women with no cost-sharing. This new requirement, however, has been at the center of a heated policy debate that culminated in the Supreme Court ruling on the religious rights of employers that object to contraception. At this time, the issue has not yet been resolved as additional cases are working their way through the courts, and may end up, yet again, at the Supreme Court. This issue brief explains the rules for private insurance coverage of contraceptives at the federal and state level and discusses key issues regarding the provision and coverage of contraception by private insurance plans.
Background
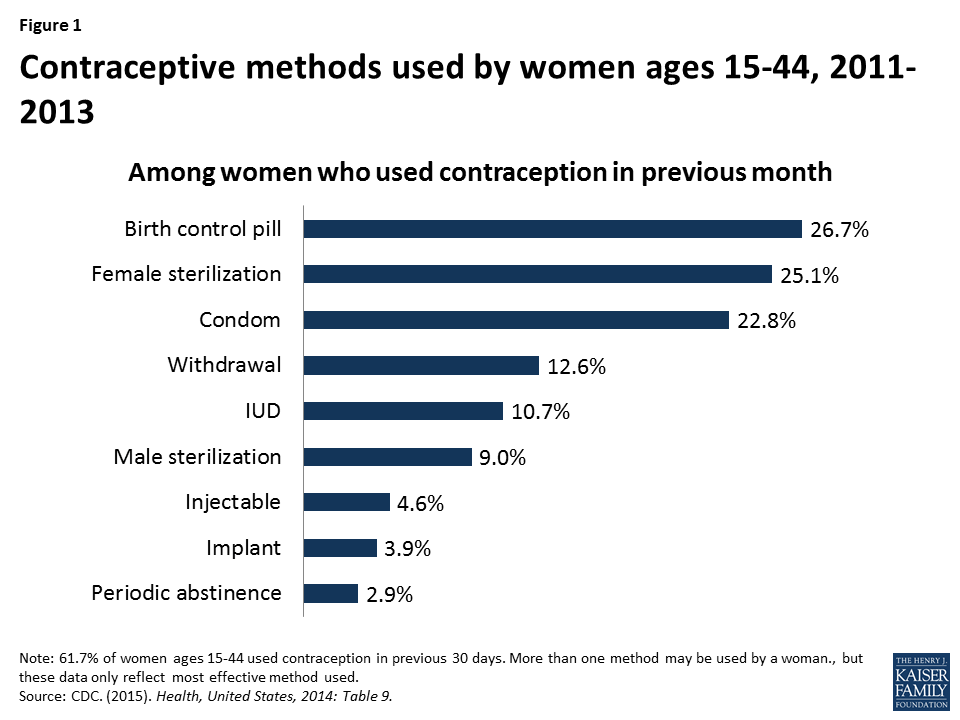
Access to contraception is a key element in shaping women’s health and well-being. Contraception is most notably used for family planning, but also to control symptoms associated with menstruation, endometriosis, and acne.2 Nearly all women (99%) have used contraceptives at some point in their lives and 62% of women are currently using at least one method.3 Of the more than 60 million women in their childbearing years (ages 15 to 44), 7 in 10 are sexually active and do not want to become pregnant.4 The most common form of contraception among women currently using contraception is the pill (26.7%) followed by female sterilization (25.1%) and male condoms (22.8%) (Figure 1).5 Use of long acting reversible contraception (LARCs) has been increasing over recent decades with the introduction of new intrauterine devices (IUDs) and implants.6 Efficacy of various methods ranges from greater than 99% effective with IUDs, to 91% with oral contraceptive pills, and 82% with condoms.7 According to the CDC, 6.9% of women of reproductive age are sexually active but are not using contraception, placing them at increased risk for unintended pregnancy.8
Figure 1: Contraceptive methods used by women ages 15-44, 2011-2013
Unintended pregnancies account for almost half of all pregnancies in the US.9 Women who use contraception incorrectly, experience gaps in contraceptive use, or do not use contraception are at particular risk for experiencing an unintended pregnancy, but no method is 100% effective. Approximately one quarter (23%) of women using contraception had a period of at least 1 month in the prior year when they were not using a contraceptive method.10 Insurance coverage of contraception has been shown to increase utilization of contraception, increase use of more effective methods, and decrease out-of-pocket costs for women.
The ACA’s Contraceptive Coverage Requirement
The ACA is the first law to set coverage requirement for health insurance across all markets – individual, small group, large group and self-insured plans. Individual, small and large group plans are regulated by the state, whereas self-insured plans are regulated by the federal government under the Employee Retirement Income Security Act (ERISA).
Before the ACA, coverage for prescription contraceptives was generally widespread in the private and public sectors, but not universal. Unless a state had a contraceptive coverage mandate, insurers and employers could choose whether or not to provide coverage for contraception. In 2000, a ruling by the Employment Equal Opportunity Commission found that employers that covered preventive prescription drugs and services, but did not cover prescription contraceptives were in violation of the Civil Rights Act.11 Currently, 28 states require insurance plans to cover contraceptives, with a wide range of coverage and cost-sharing requirements, and exemptions among these mandates.12 State laws, however, fell short of universal coverage as they only applied to state regulated plans, but not self-funded plans where 61% of covered workers are insured.13 In addition, they did not place contraceptives in a special class that was protected from cost-sharing.
More than half of women in the United States are insured through an employer-sponsored plan, either as the primary beneficiary or as a spouse or dependent. The 2010 Kaiser/HRET survey of employers reported that 85% of large firms covered prescription contraceptives in their largest health plans14 , although they may have charged cost-sharing, the amount of which can vary greatly by employer and type of plan. Only a small share of women has historically purchased insurance directly from an insurance company on the individual market, but this share is growing as previously uninsured women can now purchase coverage through ACA Marketplaces.
The ACA made contraceptive coverage a national policy, by requiring most private health insurance plans to provide coverage for a broad range of preventive services including FDA-approved prescription contraceptives15 and services for women without cost-sharing. Since the implementation of the ACA’s contraceptive coverage provision, fewer women are paying out of pocket for contraceptives.16 For example, the share of reproductive age women experiencing out-of-pocket spending on oral contraceptive pills declined from 20.9% in 2012 to 3.6% in 2014. This decline accounts for nearly two-thirds (63%) of the drop in out-of-pocket spending on retail drugs during this time period.
While most health plans are now required to provide contraceptive methods and counseling to women with reproductive capacity with no out-of-pocket costs, there are certain conditions that must be met. Women must be enrolled in a non-grandfathered plan17 and they must get services from an in-network provider. 18
In addition, the federal regulations implementing the preventive services coverage requirement explicitly permit plans and issuers to use reasonable medical management to control cost and promote efficient delivery of care.19 This applies to coverage of all preventive services, not just contraceptive care, but contraceptive services in particular had been documented as being unevenly covered by some plans because of how medical management was being interpreted by insurers.20 Examples of medical management tactics include, but are not limited to, categorizing brand and generic drugs and devices in tiers based on either cost, type and or mode of delivery; steering consumers to generic equivalent drug options; requiring provider authorization to acquire a preferred brand drug; requiring a consumer to first try a lower tier formulary drug or therapy to treat a medical condition before they will pay for an alternative drug or therapy for that condition (step therapy); and limiting quantity and or supply.
In response to reports about gaps in contraceptive coverage attributable to medical management policies,21 the Department of Health and Human Services (HHS) issued new guidance in May 2015 which clarifies that at least one form of all 18 FDA-approved methods of birth control must be covered without cost-sharing. If a provider recommends a specific option or product, plans must cover it without cost-sharing as well. Insurers may use reasonable medical management, however, to limit coverage to generic drugs when a generic version exists, and can impose cost-sharing for equivalent branded drugs. Plans are required to have a “waiver” process for women who have a medical need for contraceptives otherwise subject to cost-sharing or not covered.22
Exemptions and Accommodations
As mentioned above, women enrolled in “grandfathered” plans may not be covered for the full range of contraceptives without cost-sharing. In order to be classified as “grandfathered,” plans must have been in existence prior to March 23, 2010, and cannot make significant changes to their coverage (for example, increasing patient cost-sharing, cutting benefits, or reducing employer contributions). In 2014, 26% of workers covered in employer sponsored plans were still in grandfathered plans,23 and it is expected that over time almost all plans will lose their grandfathered status.
Certain religious employers have a religious objection to some or all contraceptive methods and may be “exempt” from the ACA contraceptive coverage mandate. Specifically “religious employers”, primarily churches and other institutions of worship are exempt. Exempt employers do not have to include contraceptive coverage for their workers and their dependents in their health plan.
There is also an “accommodation” available to nonprofit religiously-affiliated organizations and closely held24 for-profit corporations that object to contraceptive coverage on religious grounds25 Under the accommodation, an eligible employer does not have to contract, arrange, pay or refer their employees for contraceptive coverage. The health carrier used by the nonprofit employer or closely held for-profit employer must notify the policyholders, and provide separate coverage of contraceptives, at no cost, to the policyholders. Unlike an exemption, female employees and the female dependents covered by the plans of a nonprofit or closely held for-profit employer choosing an accommodation are entitled to the full contraceptive coverage from their insurance carrier.
Awareness of the Federal Standard Among Women and Providers
A recent HHS study estimates that 55 million women have private insurance coverage that includes no-cost coverage for contraceptive services and supplies.27 While the number of individuals who have gained coverage for no-cost preventive services is large, public awareness of the preventive services requirement is relatively low. In March 2014, three and half years after the rule took effect, less than half the population (43%) reported they were aware that the ACA eliminated out-of-pocket expenses for preventive services.28 A Kaiser Family Foundation study on plan coverage of contraceptives identified that some providers may not know how to correctly code all visits related to contraceptive services as a preventive service so the patient is not billed for the service.29 For the contraceptive coverage requirement to reach all women enrolled in private plans, additional public and provider education is needed.
Role of States in Expanding Coverage
States have historically regulated insurance and many have mandated minimum benefits for decades. Contraceptive coverage is no exception. Since the passage of the ACA, some states have looked to strengthening and expanding the federal contraceptive coverage requirement. For example, in 2014 California passed the Contraceptive Coverage Equity Act of 2014 which requires plans to cover prescribed FDA-approved contraceptives for women without cost-sharing. The law specifies that a plan does not have to cover more than one therapeutic equivalent of a contraceptive drug, device, or product, as long as at least one is covered without cost-sharing. Contraceptives with the same chemical formulation and delivery mechanism are therapeutically equivalent. Starting in January 2016, plans in California will be required to cover the cooper IUD (Paragard) and all three hormonal IUDs (Mirena, Skyla and Liletta), because none of the IUDs are therapeutically equivalent. The ACA requires plans to cover Pargard, and only one hormonal IUD.
In 2015, Oregon passed a law that requires insurers to pay for a 3 month supply of contraceptives when first prescribed, followed by a 12 month supply of contraceptives regardless of whether the woman was insured by the same plan at the time of the first dispensing.30 This law applies to oral contraceptive pills, the patch and the vaginal ring. In June 2015, the D.C. mayor signed a similar measure which would require health insurers that offer coverage of prescription birth control pills to cover a 12-month supply dispensed at one time. Congress has 30 days to review this bill.
Confidentiality and Consent for Minors and Young Adults
Prior to the ACA, young adults had the highest rates of uninsurance among all age groups.31 A provision of the law allows young adults to remain covered through their parents’ health insurance through age 26. While this expansion in coverage benefits young adults, young women and teens may face additional barriers to contraceptive services as a result. Confidentiality is a priority for teens and young adults. In a national survey, 71% of women 18 to 25 rated confidentiality about use of health care such as family planning or mental health services as “important.” Despite the importance of confidentiality, awareness of this practice was low among this age group, as only 37% of women knew that private insurers typically send an EOB to primary policy holders, often a parent. Awareness is even lower among teens ages 15 to 18, where only 24% reported knowing that EOBs were typically sent to the home.32 Confidentiality also remains an issue for adult women who may be insured as a dependent through their spouse’s insurance Concerns over confidentiality may prompt some women to not use their private insurance to cover the cost of contraception and instead seek contraceptive services from publicly funded clinics, or forgo their preferred contraceptive methods.33 This creates additional barriers for women seeking contraception, placing them at increased risk for unintended pregnancy.
Some states have enacted laws aimed at protecting confidentiality for women and girls insured as dependents but they are limited to plans that are regulated by the state (small and large group and individual plans and not self-funded plans).34 In 2013 California passed a law, effective January 2015, requiring insurance companies to honor requests for confidential communications when individuals receive sensitive health care services, including contraception, or when disclosure could lead to danger. Similarly, in 2013, Washington amended regulations that prohibit insurers from disclosing EOBs to policyholders for all services for which minor patients may consent, unless the patient expressly authorizes disclosure. Colorado also amended regulations effective in 2014 to require insurers to protect the privacy of adult dependents, but not minors. Insurers in Colorado must communicate directly with the adult child or adult dependent so that protected health information is not sent to the policyholder in the form of an EOB without prior consent. Other states have developed other strategies to try to protect the privacy of dependents insured by a primary policyholder.
State laws regarding minors’ consent to contraceptive services pose another barrier.35 Half the states (26 states and the District of Columbia) explicitly allow all minors ages 12 and older to consent to contraceptive services. An additional 20 states explicitly allow only certain categories of minors to consent to contraceptive services and 4 states have no relevant policy or case law. Private clinics and doctors need to abide by any state laws regarding parental notification or minor consent. However, federal Title X protections take precedence over state requirements for parental consent or notification, allowing minors to receive family planning services at Title X clinics without parental involvement.36 So minors enrolled in plans that include Title X clinics in the network will be able to use their insurance and receive confidential services.
Access to Over the Counter Contraceptives without Doctor’s Prescription
The ACA only requires insurance plans to cover prescribed female contraceptives without cost-sharing and has no requirement for plans to cover over the counter methods including condoms, spermicide, and progestin-based emergency contraception (which is only covered with a prescription). Proposals to extend over the counter (OTC) status for oral contraceptives to expand women’s access to contraception, beyond progestin-based emergency contraceptive pills, have been gaining attention. FDA approval, however, is required to move more contraceptives over the counter, and members of Congress have introduced legislation addressing this issue.37 One bill seeks to waive fees and give priority FDA review specifically for manufactures seeing over the counter status for oral contraceptives to women 18 and older. A different bill specifies that if the FDA approves oral contraceptive for OTC, the ACA would be amended to include insurance coverage with no cost-sharing for these pills.
In addition, there have been efforts at the state level to broaden access to hormonal contraceptive. In 2013, California passed a law that allows pharmacists to prescribe pills, vaginal ring, and the patch for women. While this law does not change the OTC status for contraceptives, it allows women to access some prescription contraceptives without a doctor visit and still receive insurance coverage free of cost-sharing for these contraceptives. The law is expected to be fully implemented by the end of 2015. Oregon passed a similar law in July 2015 which allows pharmacists to prescribe hormonal oral contraceptives and the patch.
Coverage of Contraception for Men
While the ACA requires private insurance plans to cover FDA-approved contraceptives as prescribed for women without cost-sharing, this requirement does not include methods used by men: vasectomy and male condoms.38 Because the ACA provisions on contraceptive coverage only address services for women, tubal ligation and tubal implant are covered without cost-sharing, but there is no equivalent requirement to cover vasectomies without cost-sharing. In their recommendations for the provision of high quality family planning service, the CDC and the Office of Population Affairs have clearly stated that offering women and men the full range of FDA-approved contraceptive methods is a critical element of high quality care and emphasize the importance of contraceptive choice in reducing couple’s risk of unintended pregnancy.39 In addition, for many women, condoms or a vasectomy may be their preferred method. Over 22% of women report that male condoms were their primary contraceptive method and 9% of women report relying on their partner’s vasectomy.40 (Figure 1) Furthermore, condoms are the only method that protect against STDs, including HIV. Federal or state legislation, or action by insurance plans to voluntarily expand coverage for men would be needed to address this gap.
Oversight
State regulators and the federal government have a role in the oversight of private plans including covered benefits, coverage appeals, and network adequacy.
Covered Benefits and Appeals
State regulators have the responsibility to oversee most private health insurance plans while the Department of Labor oversees self-funded plans. State regulators and the federal government can monitor contraceptive coverage as required by the ACA when reviewing plan documents for rate review. While most states have taken action to develop review processes that meet federal standards, CMS reviews plans in five states that have been determined not to have an adequate rate review process.41
At this time, this oversight does not appear to include review of the insurance carrier’s waiver process for the coverage of contraceptive methods that are not included in the plans formulary for no-cost coverage. Federal guidance requires plans to have a “waiver” process for patients who have a medical need for contraceptives otherwise subject to cost-sharing or not covered.42 A KFF study found that none of the insurance carriers reviewed had established a formal process for policy holders to file a waiver contesting limitations on coverage for preventive services beyond their usual appeal process.43 The use of the standard appeal process can create a time delay for women seeking timely contraceptive services which could increase women’s risk of unintended pregnancy. This is particularly problematic for women who need timely access to emergency contraceptives not covered under the policy.
Network Adequacy
Another important provision related to all preventive services including contraceptive services is network adequacy. The provider networks of the Marketplace plans determine where enrollees can seek medical care. Many states have laws to help ensure that networks are adequate to meet consumers’ needs.44 The ACA also requires that consumers in Marketplace plans have a “sufficient choice of providers,” defined in the regulations as a right to networks that are sufficient in the “number and types of providers, including providers that specialize in mental health and substance abuse services, to assure all services will be accessible without unreasonable delay.” Narrow networks may make finding an available provider offering reproductive health services challenging for some women, especially if distance, time, and transportation barriers exist.
Marketplace plans must also include in their networks essential community providers (ECPs) that serve predominantly low-income, medically underserved individuals, including Title X clinics and Federally Qualified Health Centers. ECPs often provide services that are specifically developed to address the health needs of low income individuals, including language services, patient support services, coordination of health and social services, and location in a low-income community. As noted above, minors can receive family planning services without parental involvement at Title X clinics. For women, particularly low-income women and women of color, clinic-based providers, family planning clinics and health centers are important sources of reproductive and sexual health care. Over one-quarter (28%) of women enrolled in Medicaid and 43% of uninsured women reported they had their most recent gynecological visit at either a clinic or health center.45 As many of these women gain insurance through Marketplace or employer-sponsored plans, community-based providers will continue to play an important role in reproductive health care.
It is unknown the extent to which state regulators and CMS are monitoring and enforcing federal and state network adequacy and ECP inclusion in Marketplace plans. As carriers are permitted to change networks during a plan year, the inclusion of ECPs in networks could change in the middle of a plan year. It is important to consider how federal and state oversight of the inclusion of ECPs can be ongoing and not just at the time of certification as a Qualified Health Plan.
Conclusion
The ACA has expanded contraceptive coverage without cost-sharing to millions of privately insured women across the nation. Ongoing consumer and provider education, continued oversight at the state and federal levels, and the resolution of the remaining legal challenges will determine how the ACA’s contraceptive coverage requirement is fully implemented.
Centers for Disease Control and Prevention. (2015). Health, United States, 2014. ↩︎
Kaiser Family Foundation. (2015). Intrauterine Devices ↩︎
Centers for Disease Control and Prevention. Effectiveness of Family Planning Methods. ↩︎
Daniels, K, Daugherty, J, & Jones, J. (2014). Current contraceptive status among women aged 15-44: United States, 2011-2013. National Center for Health Statistics, U.S. Department of Health and Human Services. ↩︎
Guttmacher Institute. (2015). Unintended Pregnancy in the United States. ↩︎
Liang, SY, Grossman, D, & Phillips, KA. (2011). Women’s out-of-pocket expenditures and dispensing patterns for oral contraceptive pills between 1996 and 2006. Contraception 83. ↩︎
Grandfathered plans are those that were in existence on March 23, 2010 and have stayed basically the same. If you buy coverage on your own and you first purchased your policy prior to March 23, 2010, it may be a grandfathered plan. See Kaiser Family Foundation, Health Reform FAQs, “What is a grandfathered plan? How do I know if I have one?” ↩︎
Plans are not required to provide no-cost contraceptive services and supplies to policyholders using out-of-network providers unless there are no available in-network providers able to provide the medical treatment. ↩︎
The Administration defines closely held corporation as an entity that 1) is not a nonprofit, 2) has no publicly traded ownership interests, and 3) has more than 50 percent of the value of its ownership interest owned directly or indirectly by five or fewer individuals. 45 CFR §147.131 (b)(4) ↩︎
To be eligible for an accommodation, for-profit closely held corporations must adopt a resolution establishing that the corporation objects to some or all contraceptive services on account of the owners’ sincerely held religious beliefs. 45 CFR §147.131 (b)(2)(ii) ↩︎
Supreme Court of the United States, per curium opinion, Zubik v. Burwell, May 16, 2016, page 4, ↩︎
Frost JJ, Gold RB and Bucek A. (2012). Specialized family planning clinics in the United States: why women choose them and their role in meeting women’s health care needs. Women’s Health Issues 22(6): e519–e525. ↩︎
Guttmacher Institute. (2015). An Overview of Minors’ Consent Law. State Policies in Brief. ↩︎
English, A. (2014). Adolescent Confidentiality Protections in Title X. Center for Adolescent Health & the Law, and National Family Planning & Reproductive Health Association. ↩︎
President-elect Trump and Republican leaders in Congress have vowed to repeal the Affordable Care Act (ACA) and replace it with an alternative plan. There are now 32 states (including DC) that have adopted the ACA’s Medicaid expansion. While the details of a repeal-and-replace plan are not yet available to assess its impact, a new brief reveals what’s potentially at stake for Medicaid in the debate by examining the changes in health coverage and financing that have occurred since the Medicaid expansion took effect in January 2014.
Key findings:
By 2015, an estimated 11 million Medicaid enrollees nationally were adults who were made newly eligible by the expansion. They were part of a larger net increase in Medicaid enrollment since the implementation of the ACA. (State-level Medicaid enrollment data as of 2015, including enrollment of those newly eligible in expansion states, is available in Appendix Table 2.)
The Medicaid enrollment gains contributed to a big decline in the uninsured rate among nonelderly individuals in the U.S., which fell from 16.6 percent in 2013 to a historic low of 10 percent in 2016.
Medicaid expansion states received $79 billion from January 2014 to June 2015 in new federal funding (with little or no state match) to help cover newly eligible enrollees. Under current law, federal funding will cover 95 percent of Medicaid expansion costs in 2017 and will phase down to 90 percent for 2020 and beyond.
As discussion about repeal of the Affordable Care Act (ACA) unfolds, questions emerge about how a repeal may affect Medicaid. The specific effects would depend on many factors that are currently unknown, including whether there is a replacement for the ACA, what happens to federal Medicaid expansion funding, and whether broader changes to the underlying financing structure of the Medicaid program are made. While it is difficult to quantify the specific effects of a repeal given these unknowns, this issue brief examines the changes in coverage and financing that have occurred under the Medicaid expansion to provide insight into the potential scope of coverage and funding that may be at risk under a repeal. It finds:
In 2015, an estimated 11 million enrollees were adults made newly eligible by the expansion who could be at risk for losing Medicaid coverage. However, the scope of coverage losses among this group would depend on the specifics of the repeal and any replacement plan as well as actions by individual states. The Medicaid expansion made many parents and other adults newly eligible for the program, as there was no option for states to cover most adults without children through Medicaid before the expansion. This eligibility expansion, along with outreach and enrollment efforts associated with the ACA, led to large increases in Medicaid enrollment. Between Summer 2013, just prior to the ACA, and September 2016, there was a net increase in Medicaid and CHIP enrollment of 15.7 million people. In 2015, an estimated 11 million Medicaid enrollees were adults made newly eligible by the expansion. This number has likely continued to grow since 2015 as enrollment has continued to increase and additional states have expanded, including Louisiana and Montana.
Loss of Medicaid coverage could reverse the progress in reducing the uninsured. The Medicaid enrollment gains contributed to a fall in the uninsured rate among nonelderly individuals, which declined from 16.6% in 2013 to a historic low of 10% in 2016.
As a result of the enhanced federal funding for expansion, expansion states have received $79 billion in federal funding from January 2014 through June 2015. The ACA Medicaid expansion provides enhanced federal funding for newly eligible adults with no or little state matching dollars. Alaska, Louisiana and Montana, had not claimed spending for the expansion group during this period.
Why did the ACA Expand Medicaid?
The ACA’s coverage provisions built on and attempted to fill gaps in an insurance system that left many without affordable coverage. This system had built up over time and included employer-based coverage for many—but not all—workers and their families, Medicaid coverage for certain categories of low-income people, directly-purchased coverage for a small number of people who bought policies on the non-group market, and Medicare for most people over age 65 as well as some younger people with disabilities. Under this system, many were ineligible for coverage or could not afford coverage that was available. In 2013, 44 million nonelderly people were uninsured. The majority who lacked coverage were poor and low-income adults (28% of the non-elderly uninsured had incomes below poverty and 62% had incomes below 200% of poverty in 2013). The main reason that most people said they lacked coverage was cost.1
The ACA Medicaid expansion was designed to fill gaps in coverage for low-income adults. Prior to the ACA, Medicaid eligibility for adults was very limited resulting in large numbers of uninsured poor adults. Income eligibility limits for parents were very low in most states, often below half the poverty level, and other non-disabled adults generally were not eligible regardless of their income. The ACA expanded Medicaid eligibility for parents and other adults to 138% FPL (about $16,000 for an individual or $28,000 for a family of three). Through this expansion and other changes, the ACA intended to establish a national minimum eligibility threshold in Medicaid of 138% FPL for nearly all individuals under age 65, making Medicaid the base of coverage for low-income people within the ACA’s broader coverage system. As enacted, this expansion was to occur nationwide beginning in January 2014. However, a 2012 Supreme Court ruling effectively made the expansion a state option.
In designing the ACA, expanding Medicaid was determined to be the most efficient and cost effective way to extend coverage to very poor adults. Medicaid had an existing role for the low-income population, and was already an operating program that could be extended rather than newly developed. Medicaid programs had experience providing coverage with low cost-sharing and comprehensive benefits suitable for a very low-income population. In addition, per capita spending in Medicaid is lower compared to private insurers after adjusting for the greater health needs of Medicaid enrollees.2
What Coverage is at Risk Under a Repeal of the Medicaid Expansion?
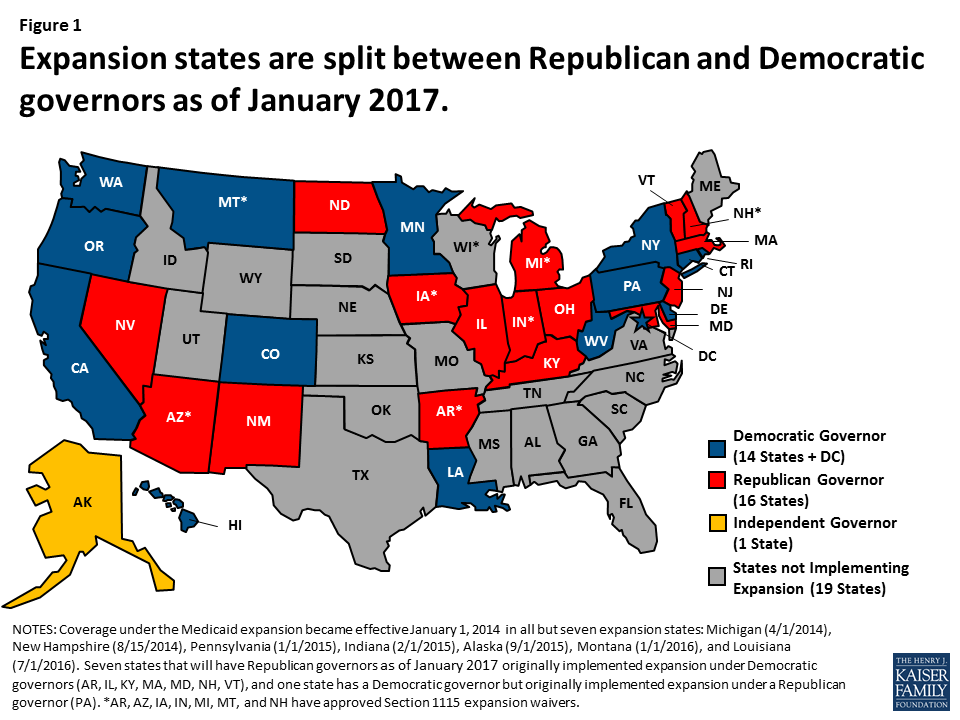
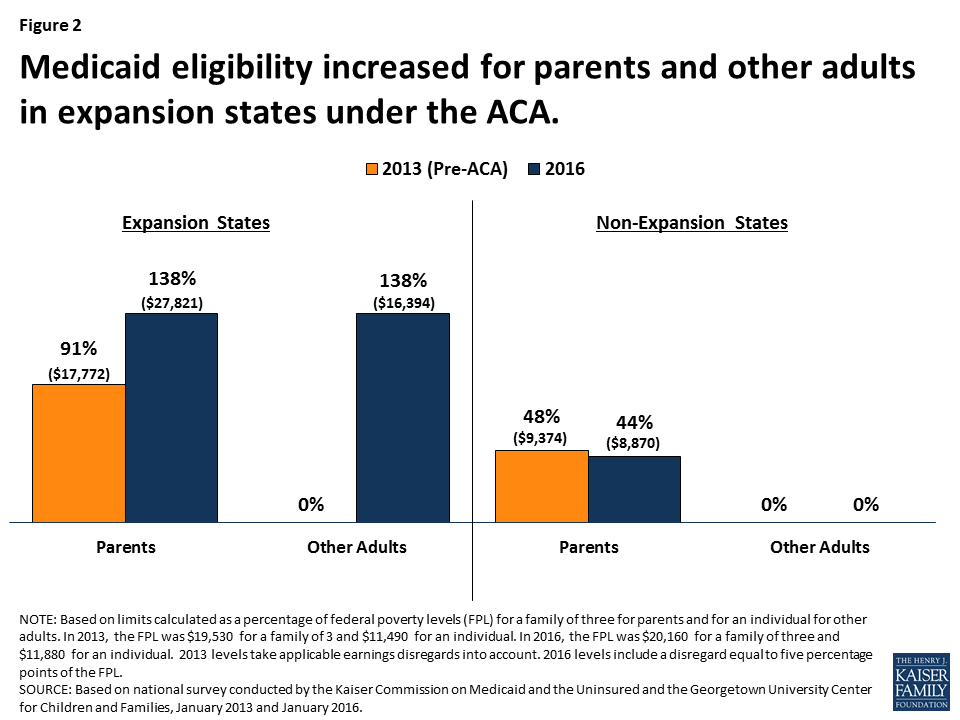
Under a repeal, many low-income parents and other adults could potentially lose eligibility for Medicaid. As of December 2016, 32 states including the District of Columbia implemented the ACA Medicaid expansion to adults. By January 2017, half (16) of the expansion states will have a Republican governor (Figure 1). Prior to the Medicaid expansion most states limited Medicaid eligibility for parents to less than the poverty level, and there was no option available to states within to cover other non-disabled adults within Medicaid (Appendix Table 1). As such, in expansion states, median eligibility increased from 91% to 138% FPL for parents ($27,821 for a family of three) and from 0% to 138% FPL for other adults ($16, 394 for an individual) (Figure 2 and Appendix Table 1 for state by state eligibility levels). In contrast, in non-expansion states, median eligibility for parents remains below half the poverty level and at 0% FPL for other adults.3 What would happen to eligibility levels would depend on the specifics of changes to federal eligibility rules under a repeal, including whether states would still have an option to cover adults, as well as other state choices. If states returned to their pre-ACA 2013 eligibility levels or lower, many parents and other adults would lose Medicaid eligibility in expansion states.
Figure 1: Expansion states are split between Republican and Democratic governors as of January 2017.Figure 2: Medicaid eligibility increased for parents and other adults in expansion states under the ACA.
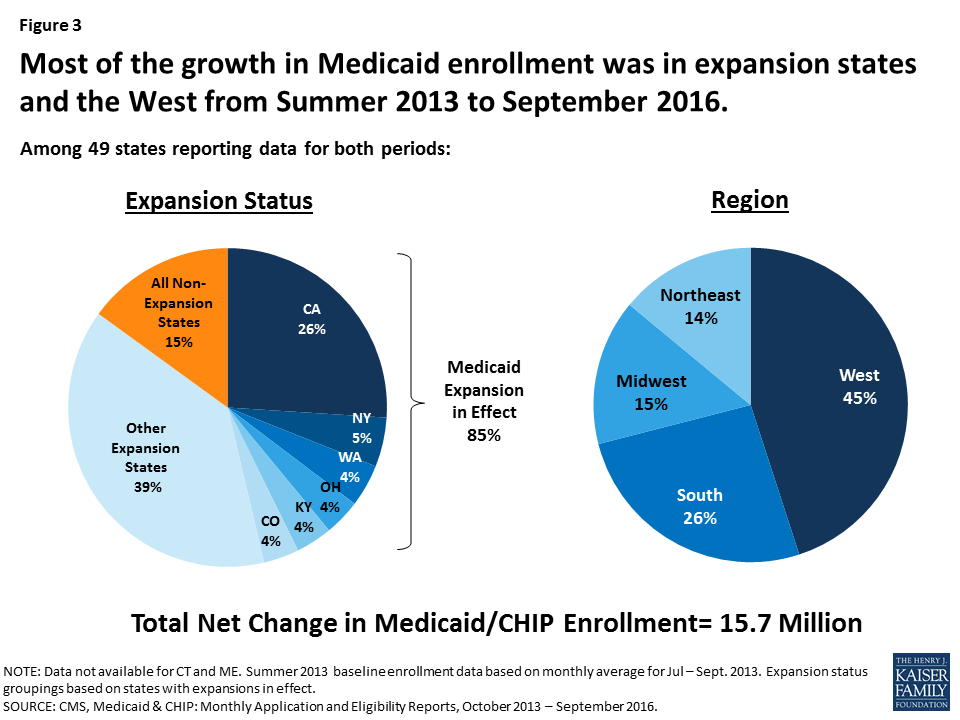
Decreases in eligibility would lead to declines in Medicaid enrollment, particularly in expansion states. Since the ACA coverage expansions were implemented starting in 2014 through September 2016, net Medicaid and CHIP enrollment has increased by 15.7 million, or 28% with the majority of growth occurring in expansion states. This growth included enrollment of newly eligible adults as well as children and adults who were previously eligible but not enrolled. Most growth was in large states in the West that expanded Medicaid (Figure 3). States that expanded Medicaid had over three times greater enrollment growth compared to non-expansion states (36% vs. 12%), although there was variation across states. If parents and adults were to lose eligibility for Medicaid, there would be declines in Medicaid enrollment, and most of these declines would likely be in areas that experienced the largest growth under expansion.
Figure 3: Most of the growth in Medicaid enrollment was in expansion states and the West from Summer 2013 to September 2016.
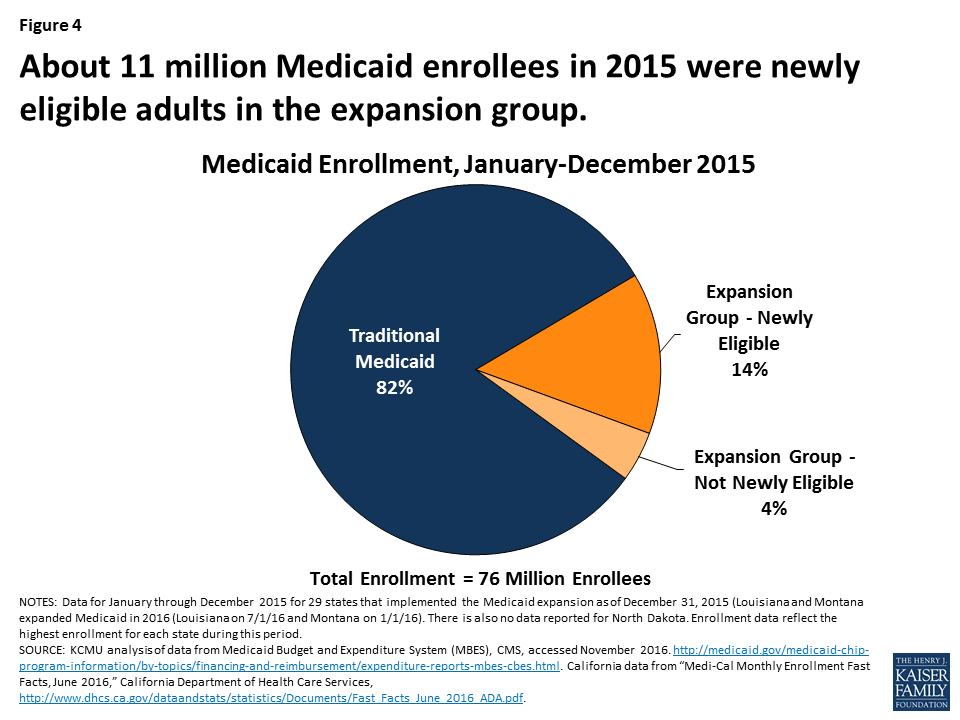
About 11 million Medicaid enrollees who were made newly eligible by the ACA Medicaid expansion would be at risk for losing Medicaid coverage if states no longer have an option to extend Medicaid eligibility to low-income adults and if federal enhanced financing is withdrawn under a repeal. The majority (82%) of Medicaid enrollees are eligible through pathways that existed prior to the ACA (e.g. children, pregnant women, elderly and individuals with disabilities). In addition, a small share of enrollees in the expansion group were eligible for Medicaid through pre-ACA expansions to adults.4 However, in 2015, about 11 million enrollees were adults in the expansion group who were made newly eligible by the ACA Medicaid expansion, accounting for 14% of all Medicaid enrollees (Figure 4 and Appendix Table 2 for state by state enrollment). Since 2015, this number has likely grown as enrollment has continued to increase and additional states have expanded, including Louisiana and Montana. Moreover, as of January 2016, an estimated 6.4 million adults were eligible for Medicaid but not enrolled, which include many newly eligible adults.5
Figure 4: About 11 million Medicaid enrollees in 2015 were newly eligible adults in the expansion group.
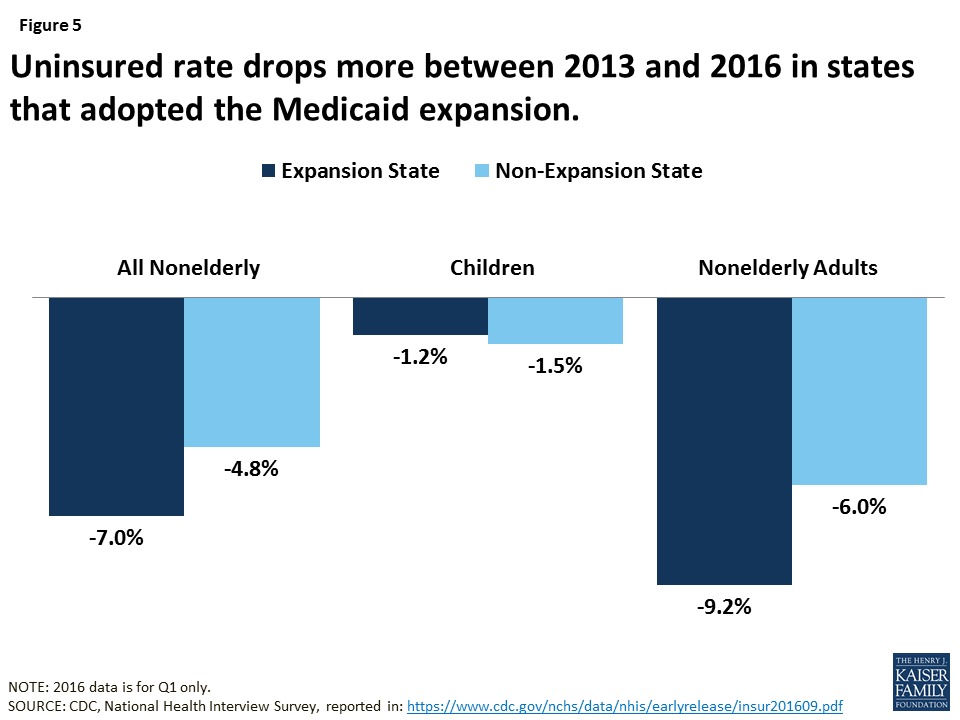
Uninsured rates could rise due to losses in Medicaid coverage, but, the extent of such losses would depend on what other coverage options may be available. Medicaid enrollment gains have played a significant role in decreasing the uninsured rate. Since implementation of the ACA, the uninsured rate among the nonelderly has fallen from 16.6% to a historic low of 10% in early 2016.6 Over 17 million more people have health coverage in 2016 compared to 2013, as the number of nonelderly uninsured dropped from 44 million to 27 million. Because the ACA coverage expansions mostly target adults, who have historically had higher uninsured rates than children, nearly the entire decline in the number of uninsured people has occurred among adults. Moreover, the decline in the uninsured rate for adults was larger among Medicaid expansion states compared to non-expansion states (Figure 5).
Figure 5: Uninsured rate drops more between 2013 and 2016 in states that adopted the Medicaid expansion.
What Financing is at Risk Under a Repeal of the Medicaid Expansion?
The law provided enhanced federal funding for states to implement the Medicaid expansion. Under current law, Medicaid provides a guarantee to states for federal matching payments. The federal share of Medicaid is determined by a formula set in statute that is based on a state’s per capita income. The formula is designed so that the federal government pays a larger share of program costs in poorer states. The federal share (FMAP) varies by state from a floor of 50% to a high of 74% in 2016, and states may receive higher FMAPs for certain services or populations. The ACA provided states 100% federal funding for the costs of adults made newly eligible under the Medicaid expansion from 2014-2016 with the federal share phasing down to 95% in 2017 and to 90% by 2020 and beyond.
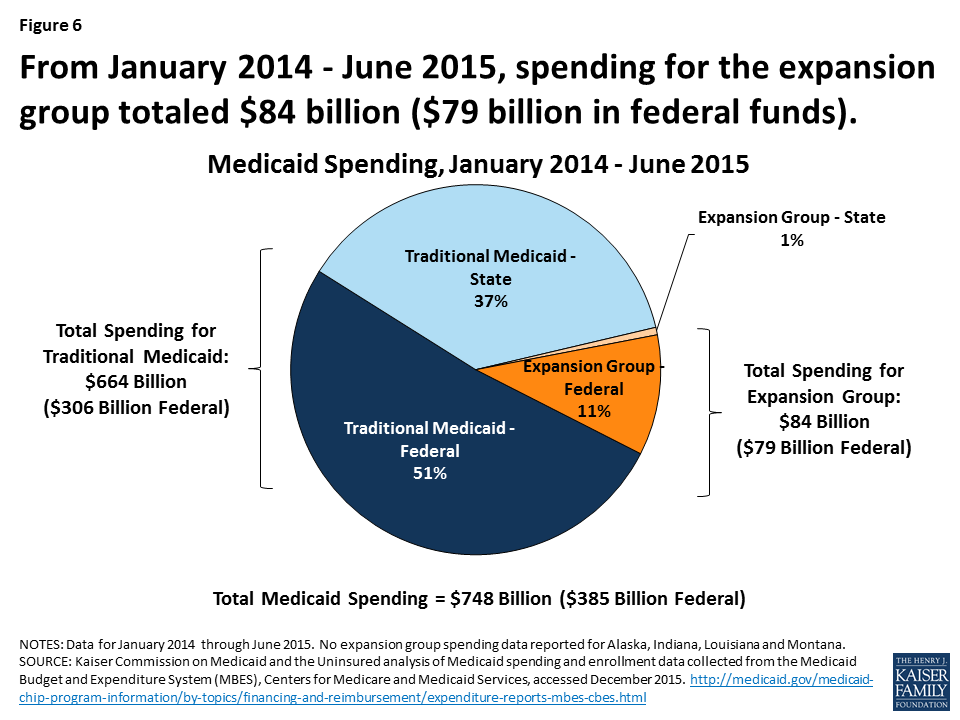
Under a repeal, states could potentially lose access to the enhanced federal funding made available for the Medicaid expansion. From January 2014 through June 2015, spending for the new adult group was $84 billion for the expansion group, accounting for about 12% of total Medicaid spending across all states over the period (Figure 6 and Appendix Table 3 for state by state spending). Nearly all expenditures for the new adult group ($79 billion out of $84 billion) were paid for with federal funds, reflecting the enhanced federal match for newly eligible adults.7 In contrast, federal funds comprised 58% of the costs for the traditional Medicaid population over the same period. Some states that implemented the expansion after January 2014, including Alaska, Louisiana and Montana, had not claimed spending for the expansion group during the data collection period.
Figure 6: From January 2014 – June 2015, spending for the expansion group totaled $84 billion ($79 billion in federal funds).
Broader economic gains states have realized as a result of the Medicaid expansion could be affected. National, multi-state, and single-state studies show that states expanding Medicaid under the ACA have realized budget savings, revenue gains, and overall economic growth despite Medicaid enrollment growth initially exceeding projections in many states.8 Studies show that states have achieved net positive economic impacts from increased employment; increased revenues to hospitals, physicians, and other providers; decreases in uncompensated care; and savings in other states programs, such as state-funded behavioral health or corrections.
Conclusion
As a new Administration and Congress debate a repeal of the ACA, it is important context to note that many Americans have favorable opinions of many individual provisions in the ACA with 8 in 10 (and two-thirds of Trump voters) who have a favorable opinion of giving states the option of expanding their existing Medicaid program to cover more low-income uninsured.9 Thirty-two states have implemented the Medicaid expansion, and as of January 2017, 16 of these states will have Republican governors. While it is difficult to quantify the specific effects of a repeal of the ACA Medicaid expansion given the many uncertainties that remain at this time, examining the changes in coverage and financing that have occurred under the Medicaid expansion provides insight into the potential scope of coverage and funding that may be at risk under a repeal. Experience to date suggests that under a repeal of the Medicaid expansion, many low-income parents and other adults would be at risk for potentially losing eligibility for Medicaid, which might contribute to increases in the number of uninsured, depending on what coverage options are available under a repeal. Moreover, states could lose access to the enhanced federal funding made available for newly eligible adults under the Medicaid expansion and face increased costs associated with rises in uncompensated care and spending in state programs for the uninsured.
Appendix
Appendix Table 1: Medicaid Eligibility Limits for Parents and Other Adults as a Percent of the Federal Poverty Level
State
Parents(in a family of three)
Other Adults(for an individual)
2013 (Pre-ACA)
2016
2013 (Pre-ACA)
2016
Federal Poverty Level
$19,530
$20,160
$11,490
$11,880
Alabama
23%
18%
0%
0%
Alaska
78%
143%
0%
138%
Arizona
106%
138%
100%
138%
Arkansas
16%
138%
0%
138%
California
106%
138%
0%
138%
Colorado
106%
138%
20%
138%
Connecticut
191%
155%
70%
138%
Delaware
120%
138%
110%
138%
District of Columbia
206%
221%
211%
215%
Florida
56%
34%
0%
0%
Georgia
48%
37%
0%
0%
Hawaii
138%
138%
100%
138%
Idaho
37%
26%
0%
0%
Illinois
139%
138%
0%
138%
Indiana
24%
139%
0%
139%
Iowa
80%
138%
0%
138%
Kansas
31%
38%
0%
0%
Kentucky
57%
138%
0%
138%
Louisiana
24%
138%
0%
138%
Maine
200%
105%
0%
0%
Maryland
122%
138%
0%
138%
Massachusetts
133%
138%
0%
138%
Michigan
64%
138%
0%
138%
Minnesota
215%
138%
75%
138%
Mississippi
29%
27%
0%
0%
Missouri
35%
22%
0%
0%
Montana
54%
138%
0%
138%
Nebraska
58%
63%
0%
0%
Nevada
84%
138%
0%
138%
New Hampshire
47%
138%
0%
138%
New Jersey
200%
138%
0%
138%
New Mexico
85%
138%
0%
138%
New York
150%
138%
100%
138%
North Carolina
47%
44%
0%
0%
North Dakota
57%
138%
0%
138%
Ohio
96%
138%
0%
138%
Oklahoma
51%
44%
0%
0%
Oregon
39%
138%
0%
138%
Pennsylvania
58%
138%
0%
138%
Rhode Island
181%
138%
0%
138%
South Carolina
89%
67%
0%
0%
South Dakota
50%
52%
0%
0%
Tennessee
122%
101%
0%
0%
Texas
25%
18%
0%
0%
Utah
42%
45%
0%
0%
Vermont
191%
138%
160%
138%
Virginia
30%
39%
0%
0%
Washington
71%
138%
0%
138%
West Virginia
31%
138%
0%
138%
Wisconsin
200%
100%
0%
100%
Wyoming
50%
57%
0%
0%
NOTES: The Federal Poverty Level (FPLs) is for the 48 contiguous states and DC. Alaska and Hawaii have separate FPLs. Eligibility limits are for full Medicaid benefits; waiver programs that provide more limited benefits or state-funded programs are not included. Parent limits are based on a family of three; other adults are based on an individual. For parent limits that are based on a dollar threshold, the reported values are FPL equivalents. 2013 levels take states’ earnings disregards, when applicable, into account. 2016 limits include a disregard equal to five percentage points of the FPL.SOURCE: Based on results from national surveys conducted by the Kaiser Commission on Medicaid and the Uninsured and the Georgetown University Center for Children and Families, updated to reflect Medicaid expansion decisions as of November 2016.
Appendix Table 2: Medicaid Enrollment (rounded to nearest 100), 2015
State
Expanded Medicaid by December 31, 2015
Medicaid Enrollment
Expansion Group Enrollment
Expansion Group- Newly Eligible Enrollment
Expansion Group- Not Newly Eligible Enrollment
Alabama
No
1,055,900
0
0
0
Alaska*
Yes
130,000
8,500
8,500
0
Arizona
Yes
1,873,400
413,000
105,700
307,200
Arkansas
Yes
1,183,700
291,600
266,700
39,500
California^
Yes
13,381,700
3,466,100
3,466,100
0
Colorado
Yes
1,209,900
347,800
346,200
1,600
Connecticut
Yes
840,600
201,000
187,000
19,600
Delaware
Yes
212,200
61,300
10,100
51,600
District of Columbia
Yes
249,000
62,000
62,000
0
Florida
No
4,080,200
0
0
0
Georgia
No
1,868,200
0
0
0
Hawaii
Yes
313,800
107,500
34,300
74,100
Idaho
No
303,300
0
0
0
Illinois
Yes
3,014,000
671,100
654,400
25,200
Indiana*
Yes
1,247,400
361,700
222,400
141,400
Iowa
Yes
587,100
146,300
136,100
10,300
Kansas
No
383,300
0
0
0
Kentucky
Yes
1,283,800
439,000
439,000
0
Louisiana*
No
1,462,800
0
0
0
Maine
No
279,000
0
0
0
Maryland
Yes
1,186,300
260,200
260,200
0
Massachusetts
Yes
2,037,600
410,900
0
410,900
Michigan
Yes
2,311,500
613,800
579,400
37,400
Minnesota
Yes
1,194,200
208,500
207,700
900
Mississippi
No
746,200
0
0
0
Missouri
No
962,000
0
0
0
Montana*
No
139,000
0
0
0
Nebraska
No
237,000
0
0
0
Nevada
Yes
566,400
187,100
187,100
0
New Hampshire
Yes
188,000
49,000
48,800
400
New Jersey
Yes
1,633,900
532,900
532,900
0
New Mexico
Yes
840,100
235,400
235,400
0
New York
Yes
6,657,700
2,276,900
285,600
1,993,000
North Carolina
No
1,975,200
0
0
0
North Dakota^
Yes
N/A
N/A
N/A
N/A
Ohio
Yes
3,078,200
665,900
618,200
47,600
Oklahoma
No
760,800
0
0
0
Oregon
Yes
1,113,800
546,400
474,800
71,600
Pennsylvania
Yes
2,670,400
603,300
548,000
55,400
Rhode Island
Yes
279,900
59,300
59,300
0
South Carolina
No
1,219,600
0
0
0
South Dakota
No
109,800
0
0
0
Tennessee
No
1,654,200
0
0
0
Texas
No
4,338,400
0
0
0
Utah
No
327,700
0
0
0
Vermont
Yes
207,100
60,700
0
60,700
Virginia
No
992,800
0
0
0
Washington
Yes
1,813,800
592,100
577,400
15,600
West Virginia
Yes
554,600
175,000
175,000
0
Wisconsin
No
1,213,000
0
0
0
Wyoming
No
72,600
0
0
0
Total
30 expanded by 12/31/15
76,041,000
14,054,100
10,728,200
3,363,900
NOTES: *Medicaid expansion column reflects if states expanded Medicaid by December 31, 2015. Alaska and Indiana expanded mid-2015 (Alaska on 9/1/15 and Indiana on 2/1/15). Louisiana and Montana have since expanded Medicaid (Louisiana on 7/1/16 and Montana on 1/1/16). ^California and North Dakota data were unavailable from CMS. California data were obtained from California Department of Health Report. This report does not distinguish newly eligible and not newly eligible adults, but because California did not provide full benefits to the new eligibility group prior to expansion, we classified all California beneficiaries as newly eligible.Enrollment from both MBES and CA DHCS report is reported for each month. In an effort to take into account that some beneficiaries are enrolled for only part of the year, maximum monthly enrollment for each state is used to estimate total annual enrollment.Due to rounding, state totals may not sum to national total.SOURCE: Kaiser Commission on Medicaid and the Uninsured analysis of Medicaid spending and enrollment data collected from the Medicaid Budget and Expenditure System (MBES), Centers for Medicare and Medicaid Services (accessed November 2016) and California Department of Health Care Services report “Medi-Cal Monthly Enrollment Fast Facts, June 2016”. https://www.medicaid.gov/medicaid/program-information/medicaid-and-chip-enrollment-data/enrollment-mbes/index.html. http://www.dhcs.ca.gov/dataandstats/statistics/Documents/Fast_Facts_June_2016_ADA.pdf. State expansion status available at “Status of State Action on the Medicaid Expansion Decision,” KFF State Health Facts, https://www.kff.org/health-reform/state-indicator/state-activity-around-expanding-medicaid-under-the-affordable-care-act
Appendix Table 3: Medicaid Spending (in millions), January 2014-June 2015
State
Total Medicaid Spending
Traditional Medicaid- Federal Spending
Traditional Medicaid- State Spending
Expansion Group -Federal Spending
Expansion Group -State Spending
Alabama
$7,816
$5,418
$2,398
N/A
N/A
Alaska*
$2,400
$1,408
$992
N/A
N/A
Arizona
$14,613
$8,211
$3,542
$2,512
$349
Arkansas
$8,018
$4,516
$1,829
$1,673
$0
California
$105,621
$42,732
$41,637
$21,252
$0
Colorado
$9,977
$4,191
$4,039
$1,743
$4
Connecticut
$11,320
$4,816
$4,650
$1,817
$37
Delaware
$2,680
$1,143
$957
$469
$111
District of Columbia
$3,609
$2,198
$944
$464
$3
Florida
$31,790
$19,127
$12,662
N/A
N/A
Georgia
$14,720
$9,964
$4,756
N/A
N/A
Hawaii
$2,986
$1,230
$1,110
$599
$47
Idaho
$2,600
$1,869
$731
N/A
N/A
Illinois
$26,478
$11,832
$11,224
$3,370
$52
Indiana*
$13,992
$8,904
$4,345
$610
$133
Iowa
$6,573
$3,226
$2,359
$967
$21
Kansas
$4,409
$2,516
$1,894
N/A
N/A
Kentucky
$12,591
$6,415
$2,687
$3,488
$0
Louisiana*
$10,956
$6,861
$4,095
N/A
N/A
Maine
$3,765
$2,351
$1,414
N/A
N/A
Maryland
$14,465
$6,117
$5,943
$2,405
$0
Massachusetts
$22,980
$10,465
$10,100
$1,858
$556
Michigan
$21,984
$12,507
$6,354
$3,081
$42
Minnesota
$14,821
$6,476
$6,310
$2,034
$2
Mississippi
$7,689
$5,682
$2,007
N/A
N/A
Missouri
$13,861
$8,793
$5,067
N/A
N/A
Montana*
$1,741
$1,179
$562
N/A
N/A
Nebraska
$2,776
$1,509
$1,266
N/A
N/A
Nevada
$4,124
$2,004
$1,092
$1,029
$0
New Hampshire
$2,278
$1,060
$1,020
$198
$1
New Jersey
$20,607
$8,795
$8,229
$3,583
$0
New Mexico
$6,983
$3,693
$1,560
$1,730
$0
New York
$86,485
$37,759
$36,143
$9,265
$3,317
North Carolina
$18,669
$12,379
$6,290
N/A
N/A
North Dakota
$1,273
$557
$535
$179
$2
Ohio
$31,119
$17,554
$9,809
$3,676
$79
Oklahoma
$7,388
$4,750
$2,638
N/A
N/A
Oregon
$11,559
$5,284
$2,717
$3,559
$0
Pennsylvania
$33,939
$17,677
$15,479
$757
$26
Rhode Island
$3,659
$1,518
$1,481
$660
$0
South Carolina
$8,809
$6,240
$2,569
N/A
N/A
South Dakota
$1,204
$689
$515
N/A
N/A
Tennessee
$12,895
$8,443
$4,452
N/A
N/A
Texas
$48,556
$28,854
$19,702
N/A
N/A
Utah
$3,266
$2,311
$955
N/A
N/A
Vermont
$2,382
$1,162
$877
$276
$68
Virginia
$11,685
$5,936
$5,750
N/A
N/A
Washington
$16,420
$5,914
$5,702
$4,751
$52
West Virginia
$5,349
$3,282
$1,311
$755
$0
Wisconsin
$11,569
$6,895
$4,675
N/A
N/A
Wyoming
$817
$418
$399
N/A
N/A
Total
$748,267
$384,829
$279,775
$78,761
$4,902
NOTE: *Alaska and Indiana expanded mid-2015 (Alaska on 9/1/15 and Indiana on 2/1/15). Louisiana and Montana have since expanded Medicaid (Louisiana on 7/1/16 and Montana on 1/1/16). Due to rounding, spending amounts may not sum to subtotals or national total.SOURCE: Kaiser Commission on Medicaid and the Uninsured analysis of Medicaid spending data collected from the Medicaid Budget and Expenditure System (MBES), Centers for Medicare and Medicaid Services (accessed November 2016). https://www.medicaid.gov/medicaid/financing-and-reimbursement/state-expenditure-reporting/expenditure-reports/index.html
Changes between 2013 and 2016 reflect the conversion to use of Modified Adjusted Gross Income to determine financial eligibility under the ACA. In addition, a number of non-expansion states tie parent eligibility to a dollar value that does not regularly adjust. As such, its value as a percent of the FPL erodes over time as the FPL increases each year. ↩︎
Robin A. Cohen, Ph.D., Michael E. Martinez, M.P.H., M.H.S.A., and Emily P. Zammitti, M.P.H., Health Insurance Coverage: Early Release of Estimates From the National Health Interview Survey, January–March 2016 (National Health Interview Survey Early Release Program, September 2016), http://www.cdc.gov/nchs/data/nhis/earlyrelease/insur201609.pdf↩︎
In some states that had expanded coverage to adults prior to the ACA, the new adult group includes some adults that were previously eligible through these pre-ACA expansions. These adults may be matched at a rate lower than the 100% rate for 2014-2016. ↩︎
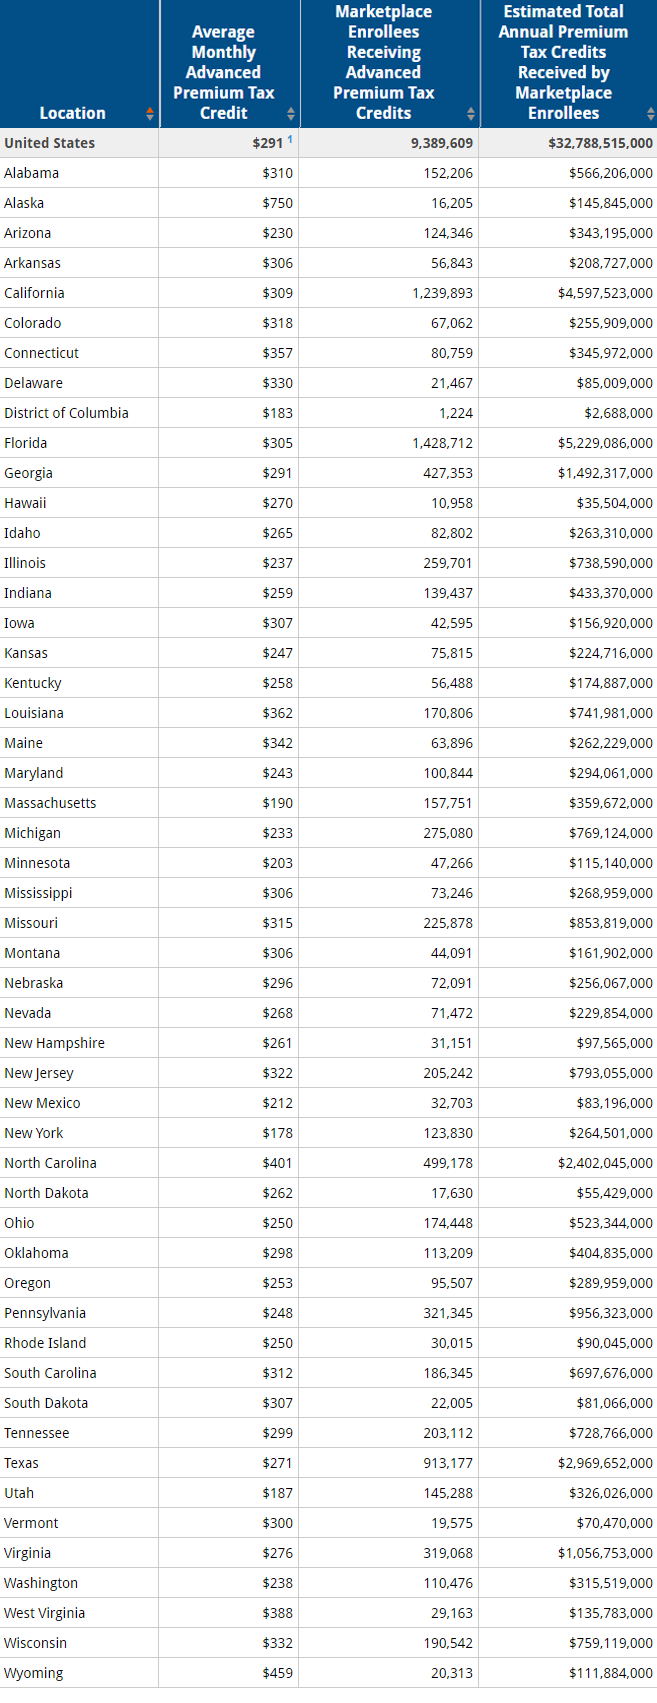
New state data from the Kaiser Family Foundation estimate that 9.4 million Americans who bought health plans through Affordable Care Act marketplaces will receive a total of about $32.8 billion in premium tax credits for 2016.
The data include estimates of the total amount of tax credits received in each state for 2016, based on the average tax credit per person and the number of ACA marketplace enrollees receiving tax credits as of March 31.
Under the health law, people with low or moderate incomes are eligible for tax credits that reduce monthly payments for insurance plans purchased through ACA marketplaces. A repeal of the health law would eliminate these subsidies.
Estimated Total Premium Tax Credits Received by Marketplace Enrollees (as of 3/31/2016)
View state map of 2016 total premium tax credits received by ACA marketplace enrollees.
Among Those Who Favor Repeal, Arguments About Loss of Coverage for Those with Pre-Existing Conditions Can Sway Some Opinions
Many Obamacare Provisions Remain Broadly Popular Across Party Lines, But Not its Mandate
The first Kaiser Health Tracking Poll since the 2016 election finds that Americans are largely divided on the future of the Affordable Care Act even though many of the law’s major provisions remain quite popular across party lines.
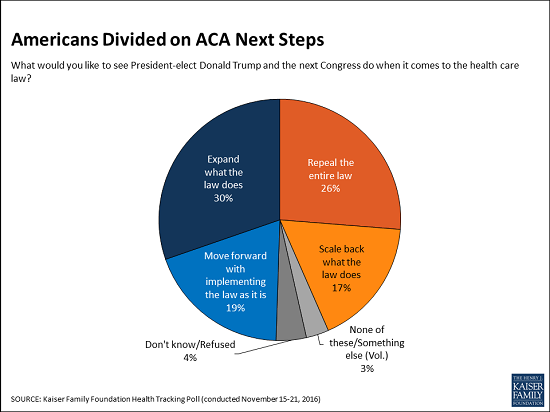
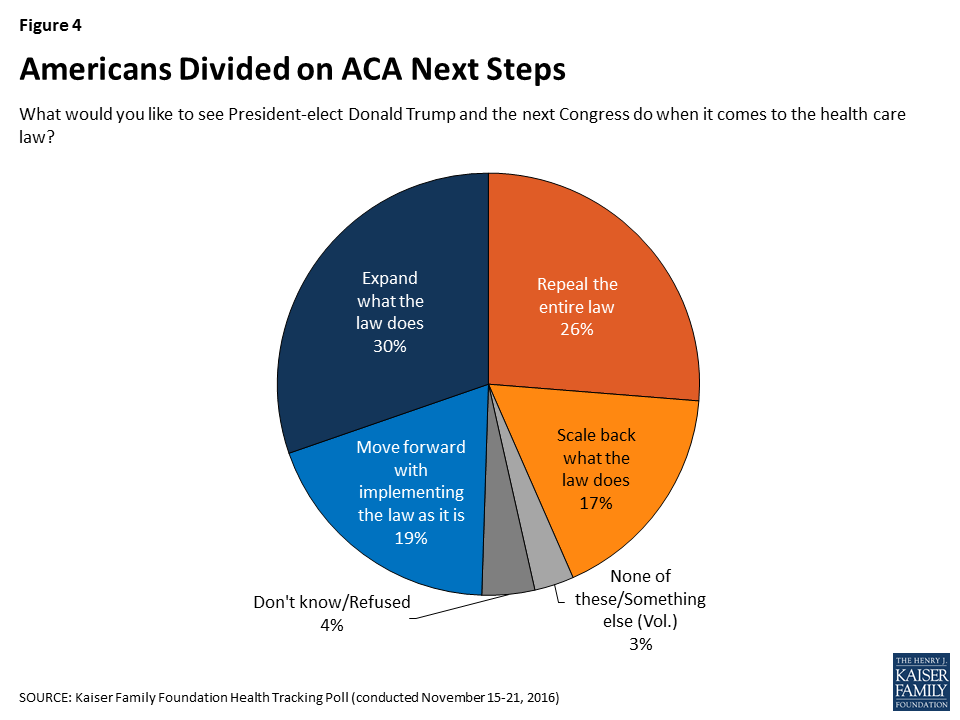
The new survey finds that one fourth (26%) of Americans want to see President-elect Donald Trump and the next Congress repeal the entire law, and an additional 17 percent want them to scale back what the law does. This compares to 30 percent of the public who want to see the law expanded and 19 percent who want to see lawmakers move forward with implementing the law as it is.
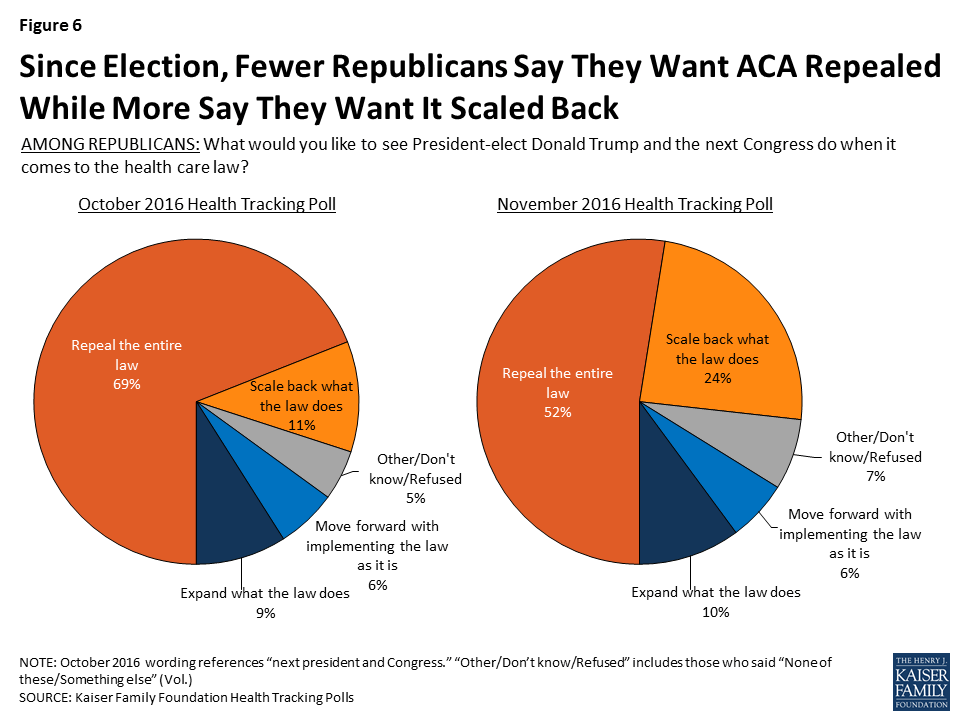
The poll captures a slight uptick in the share of Americans who want lawmakers to scale back the law as well as a decrease in the share who want lawmakers to repeal the entire law. This is largely driven by Republicans: About half (52%) of Republicans now say they want to see the Affordable Care Act repealed, down from 69 percent in October. At the same time, a quarter (24%) of Republicans now want to see the law scaled back, up from 11 percent in October.
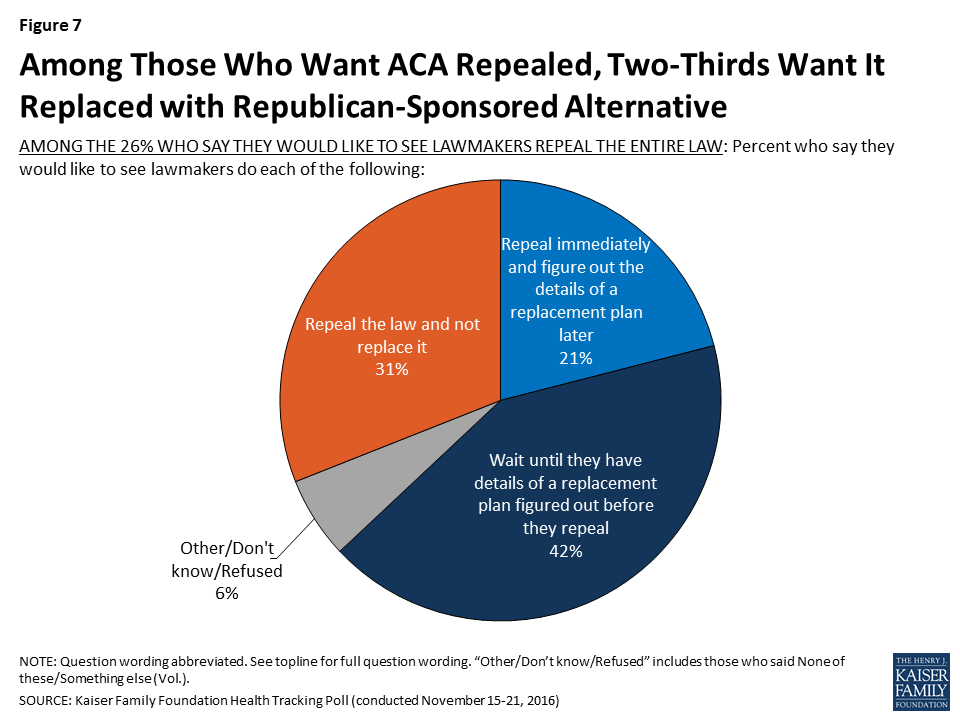
Among the quarter (26%) of Americans that want to see the Affordable Care Act repealed, 31 percent want to see the health care law just repealed and not replaced. About two-thirds wants lawmakers to repeal the health care law and replace it with a Republican-sponsored alternative, with 42 percent wanting lawmakers to wait to repeal it until the details of a replacement plan have been figured out and 21 percent wanting lawmakers to repeal it immediately and figure out a replacement plan later.
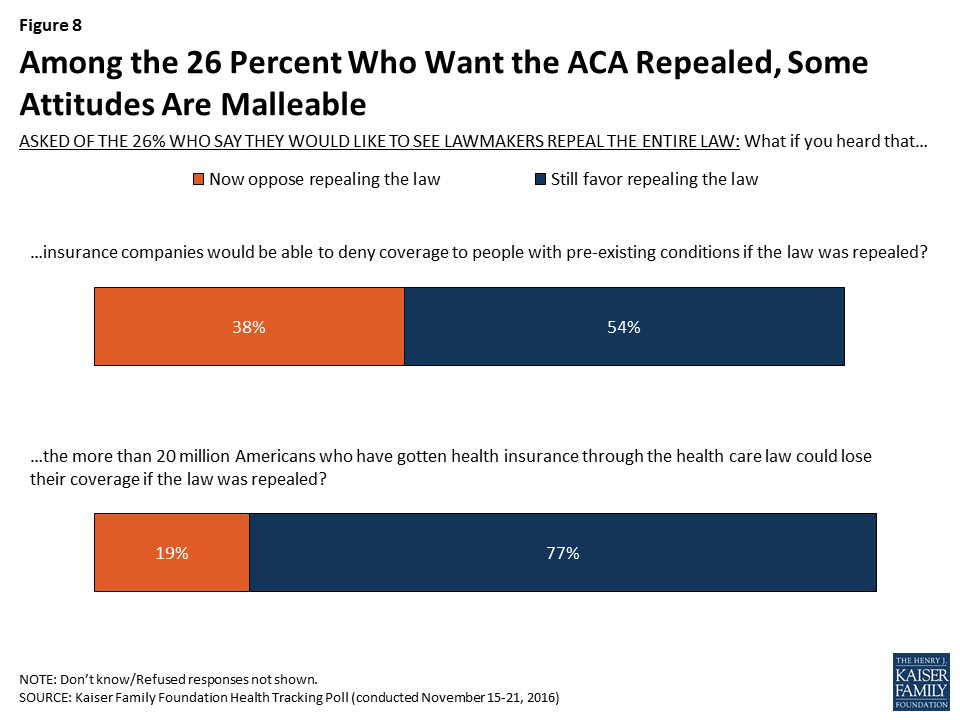
Among those who want the law repealed, 38 percent (or 10% of the public overall) change their opinion after hearing the argument that repealing the ACA would mean that insurance companies could deny coverage to people with pre-existing conditions. A slightly smaller share change their opinion after hearing that more than 20 million Americans could lose their coverage.
Public supports many specific Obamacare provisions, but not the individual mandate
While President-elect Donald Trump and Republican leaders in Congress work on a replacement to the Affordable Care Act, the new poll finds many of the law’s specific provisions remain popular even among President-elect Trump’s supporters, potentially complicating the path ahead.
For example, majorities of Republicans, Democrats and independents alike say they favor:
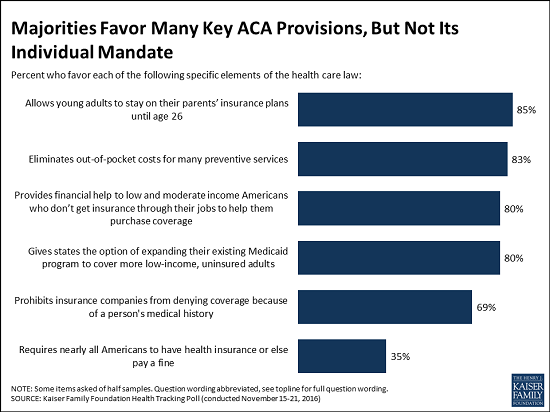
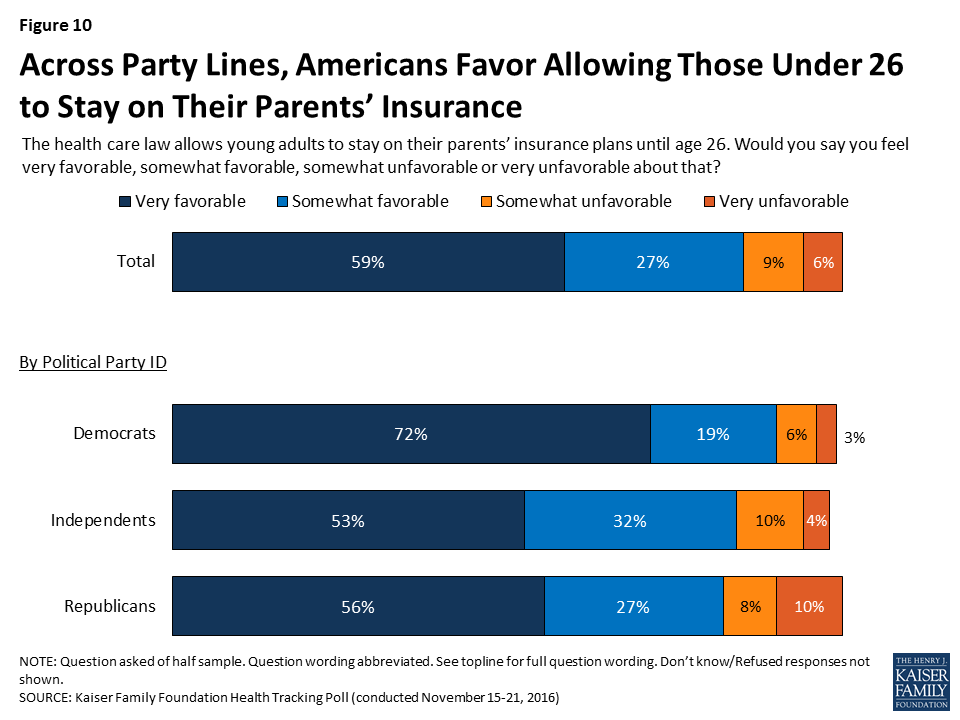
Allowing young adults to stay on their parents’ insurance plans until age 26 (85% of the public, including 82% of Republicans);
Eliminating out-of-pocket costs for many preventive services (83% of the public, including 77% of Republicans);
Providing financial help to low- and moderate-income Americans who don’t get insurance through their jobs to help them purchase coverage (80% of the public, including 67% of Republicans);
Giving states the option of expanding their existing Medicaid programs to cover more uninsured low-income adults (80% of the public, including 67% of Republicans); and
Prohibiting insurance companies from denying coverage because of a person’s medical history (69% of the public, including 63% of Republicans).
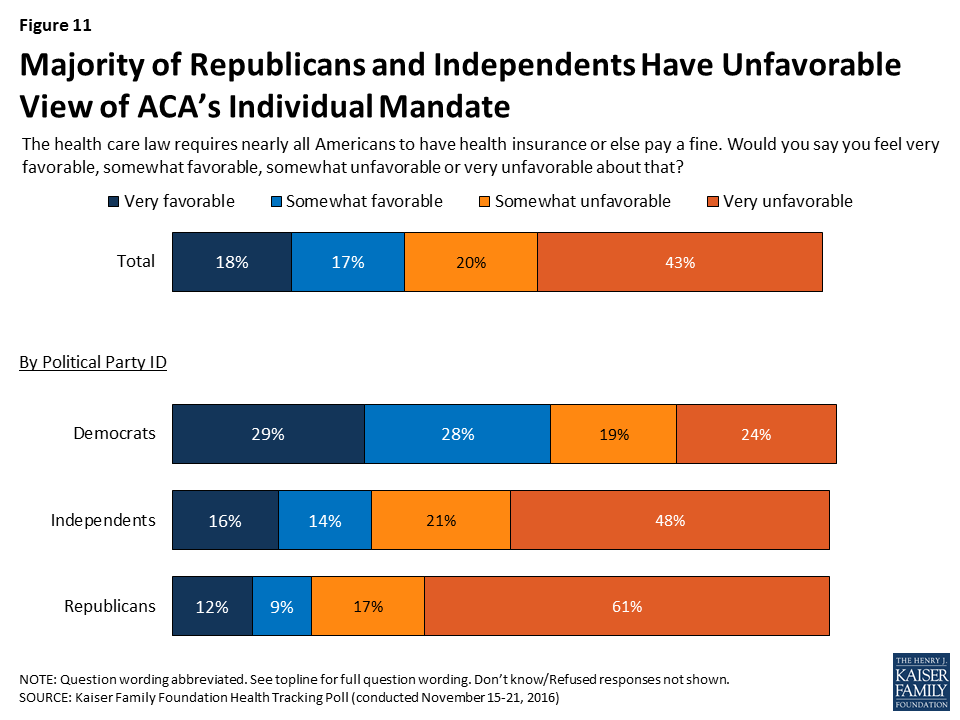
In contrast, a third (35%) of the public says they favor the law’s provision requiring that nearly all Americans have health coverage or pay a fine (63% have an unfavorable view). A majority of Democrats (57%) favor this provision but far fewer independents (30%) and Republicans (21%) do.
Support for the law’s requirement that employers with at least 50 workers offer health insurance or pay a fine is more mixed, with a majority of the public (60%) supporting it, including majorities of Democrats and independents. In contrast, just 45 percent of Republicans favor this provision.
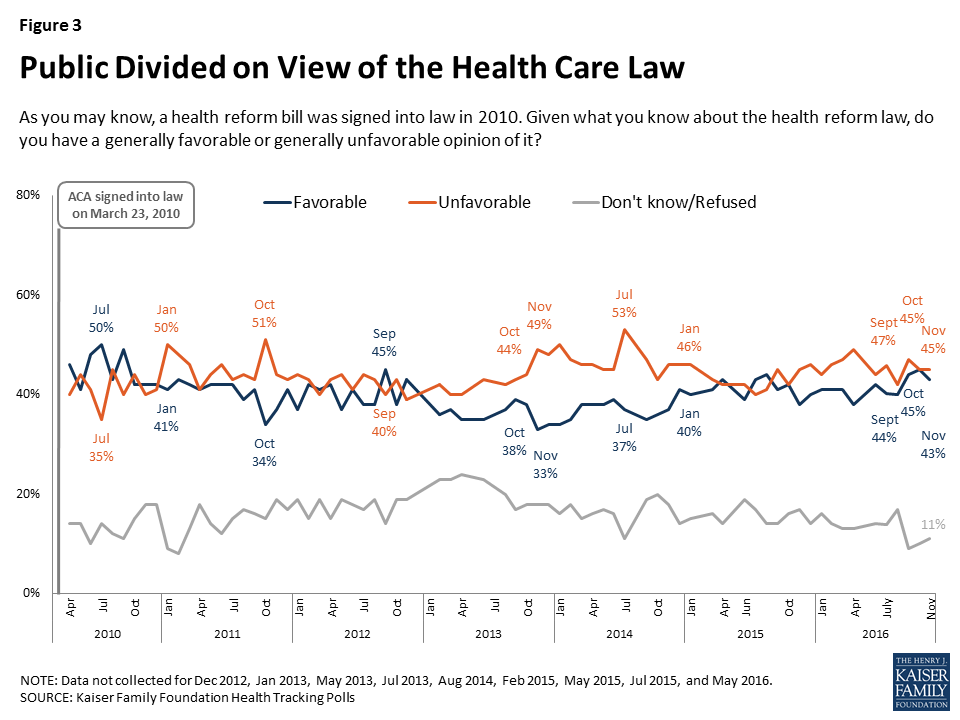
Overall attitudes towards the Affordable Care Act are largely unchanged following the election: 45 percent of the public has an unfavorable view and 43 percent has a favorable view. In addition, the poll finds health care played a limited role in voters’ 2016 election decisions, with 8 percent of voters saying health care was the biggest factor in their vote.
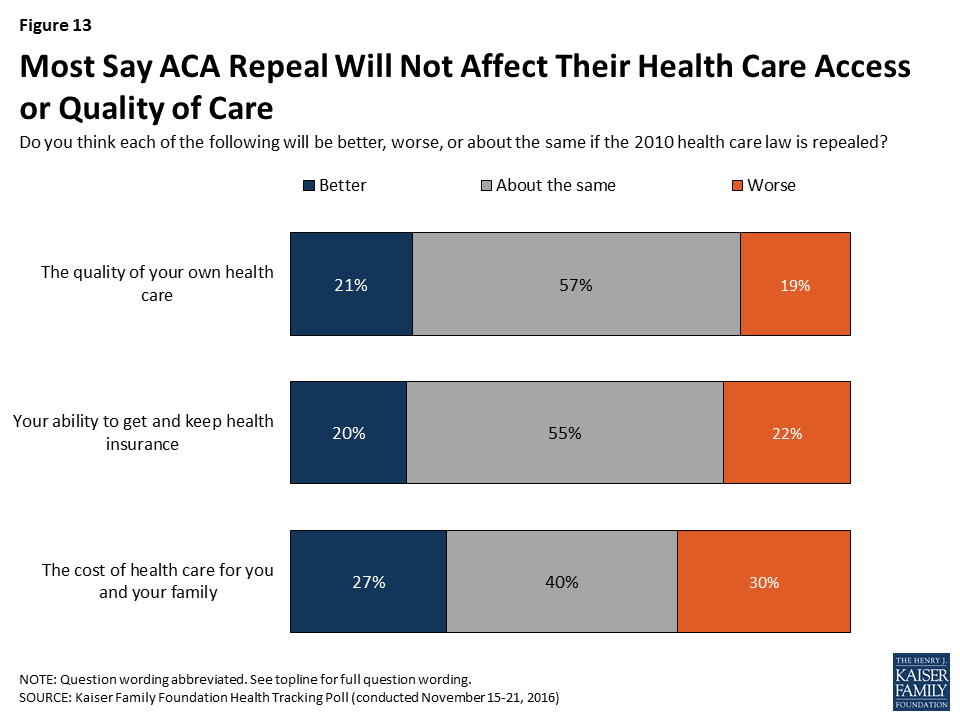
As many say repeal would worsen their family’s health care costs as say it would improve
Americans are divided on how repeal would affect health care costs for them and their family, with nearly equal shares saying repealing the law would make costs worse (30%) as saying it would make costs better (27%). Another four in 10 say their health care costs would be about the same. Most also say that, under repeal, they would expect their quality of care and access to health insurance to remain about the same.
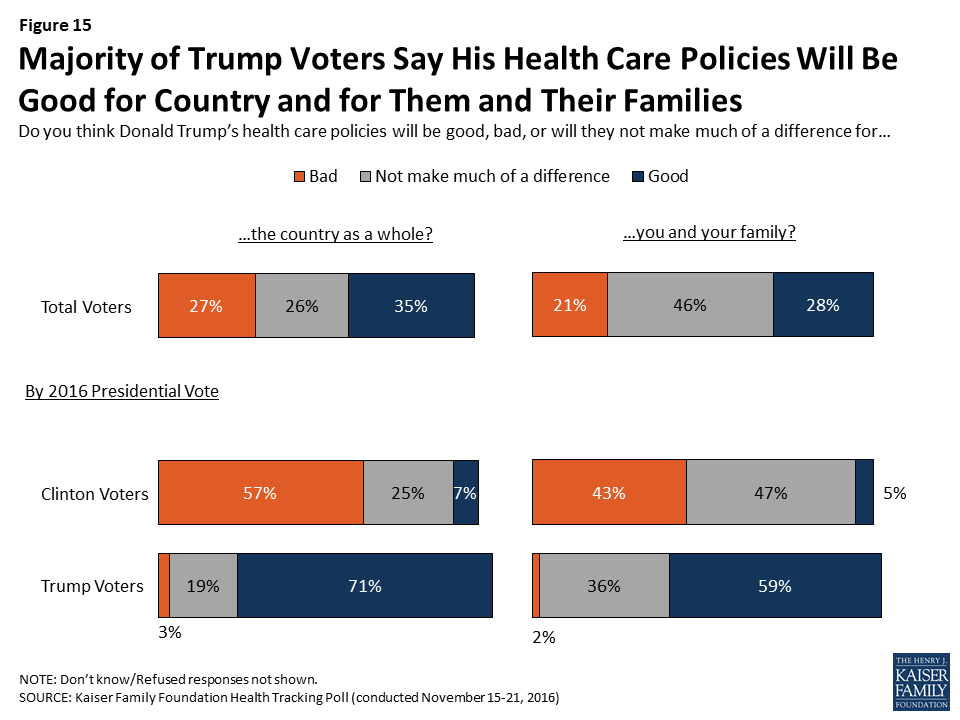
Importantly, Trump voters are much more likely to say repeal would help them personally. Half (52%) of those who supported Trump say the cost of health care for them and their family will get better under repeal, and many say the quality of their health care (39%) and their ability to get and keep health insurance (35%) would get better.
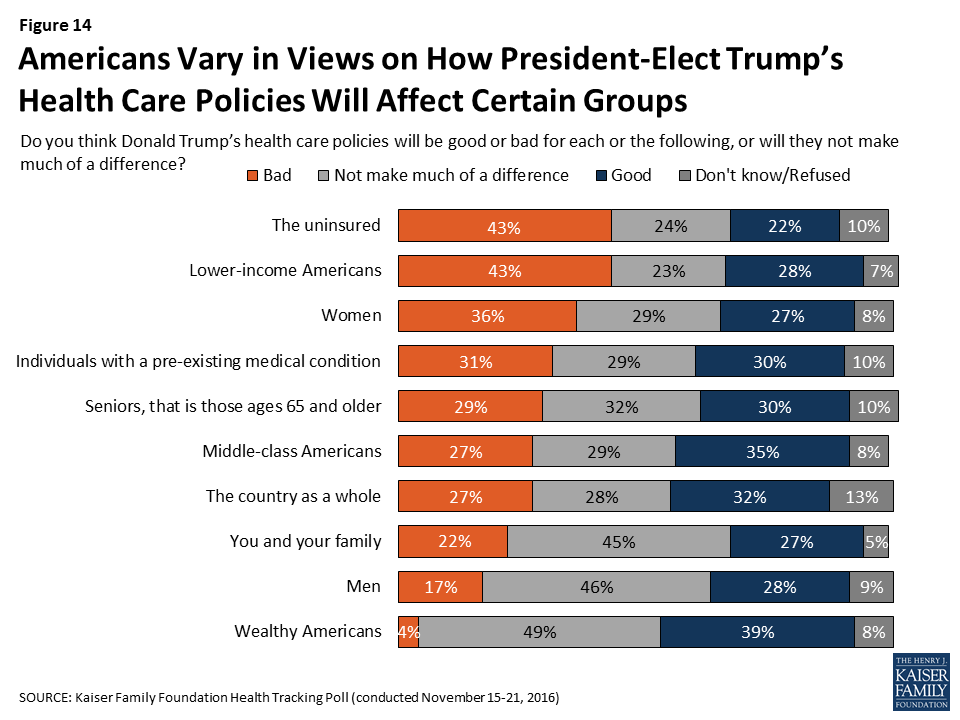
The poll also probes the public’s views of whether President-elect Trump’s health care policies would be bad or good for different groups of Americans. The public is more likely to predict “bad” results for the uninsured (43%), lower-income Americans (43%) and women (36%), and more likely to predict “good” results for wealthy Americans (39%).
Designed and analyzed by public opinion researchers at the Kaiser Family Foundation, the poll was conducted from November 15-21 among a nationally representative random digit dial telephone sample of 1,202 adults. Interviews were conducted in English and Spanish by landline (422) and cell phone (780). The margin of sampling error is plus or minus 3 percentage points for the full sample. For results based on subgroups, the margin of sampling error may be higher.
The November Kaiser Health Tracking Poll, conducted one week after the 2016 presidential election, finds health care played a limited role in voters’ 2016 election decisions, with larger shares of voters saying the biggest factor in their vote was the direction of the country (31 percent), Donald Trump’s personal characteristics (15 percent), jobs and the economy (15 percent), or Hillary Clinton’s personal characteristics (12 percent), than who say the same about health care (8 percent).
While health care was not a leading factor in voters’ presidential decisions, President-elect Trump and Republican lawmakers have made it clear that one of their top priorities is the repeal of the 2010 health care law. Americans are divided on what they want to see lawmakers do to the ACA with one-fourth of Americans (26 percent) wanting to see President-elect Donald Trump and the next Congress repeal the entire law while an additional 17 percent want them to scale back what the law does. This is compared to 30 percent of the public who want to see the law expanded and 19 percent who want to see lawmakers move forward with implementing the law as it is. Among Trump voters, 50 percent want to see the law repealed and 29 percent want to see it scaled back.
While President-elect Trump and Republican members of Congress work on a replacement to the ACA, this month’s survey finds that many of the law’s major provisions continue to be quite popular, even across party lines. The notable exception is the requirement that nearly all Americans have health insurance or else pay a fine.
Among Trump voters, 52 percent say the cost of their health care will get better, 39 percent say the quality of their health care will get better, and 35 percent say their ability to get and keep health insurance will get better if the 2010 health care law is repealed. In general, the majority of Trump voters say President-elect Trump’s health care policies will be good for the country as a whole (71 percent) and good for them and their families (59 percent).
Health Care in the 2016 Election
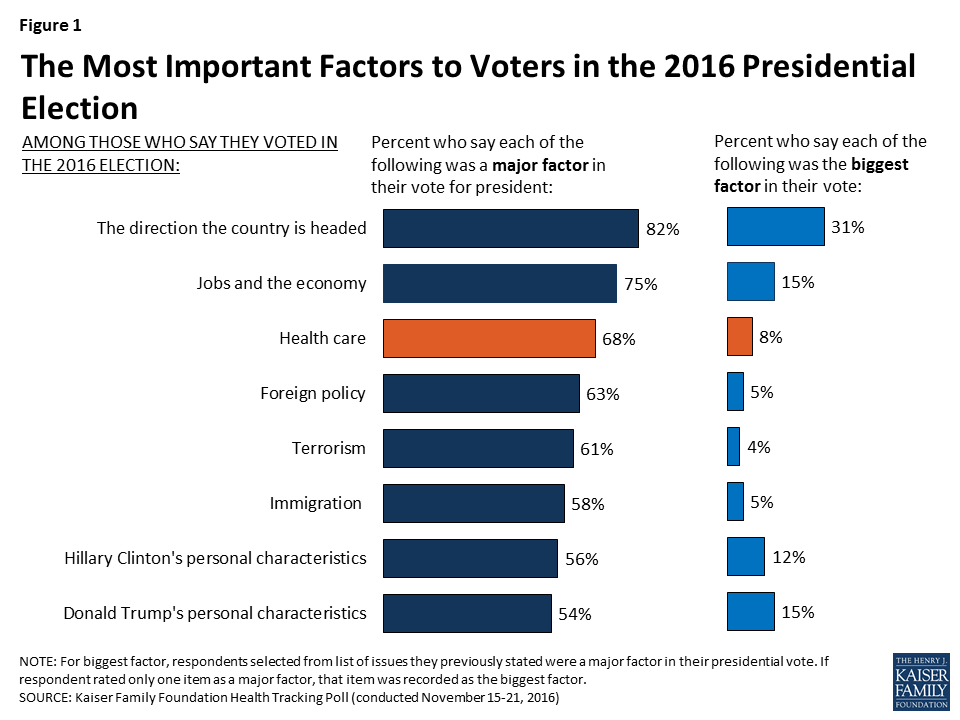
Many factors were important to voters’ choices in the 2016 presidential election, with over two-thirds of voters stating that the direction the country is headed (82 percent), jobs and economy (75 percent), and health care (68 percent) were a “major factor” in their vote. Majorities also cite foreign policy (63 percent), terrorism (61 percent), immigration (58 percent), and candidates’ personal characteristics (56 percent for Clinton’s and 54 percent for Trump’s) as “major factors.” When voters are asked to select the “biggest factor” in their vote for president, the direction of the country (31 percent), Donald Trump’s personal characteristics (15 percent), jobs and the economy (15 percent), and Hillary Clinton’s personal characteristics (12 percent) rank above health care (8 percent).
Figure 1: The Most Important Factors to Voters in the 2016 Presidential Election
Biggest Factor for Trump Voters and Clinton Voters
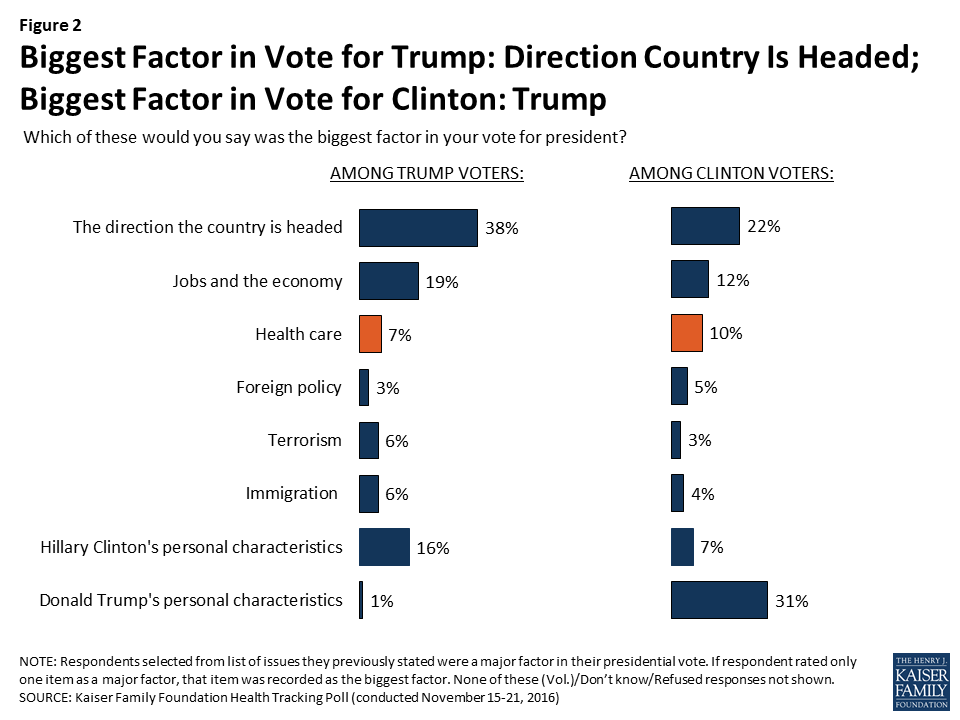
Among voters who supported Republican nominee Donald Trump, four in ten (38 percent) say the direction the country is headed was the “biggest factor” in their vote while about one-third of Clinton voters say Trump’s personal characteristics was the “biggest factor.” For both Trump and Clinton voters, it appears health care is a second-tier issue, with about one in ten saying it was the “biggest factor” (7 percent and 10 percent, respectively).
Figure 2: Biggest Factor in Vote for Trump: Direction Country Is Headed; Biggest Factor in Vote for Clinton: Trump
President-elect Trump and Health Care
While health care was not a leading factor in voters’ decisions in the 2016 presidential election, President-elect Trump and Republican lawmakers in Congress have said they would like to move quickly in 2017 on several health care issues – including most notably, the repeal and replacement of the Affordable Care Act.
The November survey, conducted after the 2016 election, finds overall public opinion towards the 2010 health care law is stable from previous months, with similar shares of the public saying they have an unfavorable opinion (45 percent) as say they have a favorable opinion (43 percent) of the law.
Figure 3: Public Divided on View of the Health Care Law
Repealing the Affordable Care Act
During the past six years, Republican lawmakers in Congress have voted to repeal parts or all of the 2010 health care law more than fifty times1 , only to have efforts blocked by either Democrats or President Obama. Now, with Republicans controlling both the executive branch and Congress, lawmakers have reaffirmed their commitment to repealing the Affordable Care Act. One-fourth (26 percent) of Americans want to see President-elect Trump and Congress repeal the entire law, and an additional 17 percent want them to scale back what the law does. This is compared to 30 percent of the public who want to see the law expanded and 19 percent who want to see lawmakers move forward with implementing the law as it is.
Figure 4: Americans Divided on ACA Next Steps
Vast Majority of Trump Voters Have Unfavorable Views of ACA, Half Want Law Repealed
Focusing specifically on voters who supported Republican nominee Donald Trump, the majority have an unfavorable view of the health care law with 63 percent having a “very unfavorable” opinion and an additional 18 percent having a “somewhat unfavorable” opinion. This is compared to 79 percent of Clinton voters who have a favorable view of the law (40 percent have a “very favorable” and 39 percent have a “somewhat favorable” view).
Table 1: Voters’ Attitudes Towards the ACA
As you may know, a health reform bill was signed into law in 2010. Given what you know about the health reform law, do you have a generally favorable or generally unfavorable opinion of it?
All voters
Trump voters
Clinton voters
Favorable (NET)
45%
15%
79%
Very favorable
20
5
40
Somewhat favorable
25
10
39
Unfavorable (NET)
50
81
18
Very unfavorable
33
63
5
Somewhat unfavorable
17
18
13
Don’t know/Refused
5
4
4
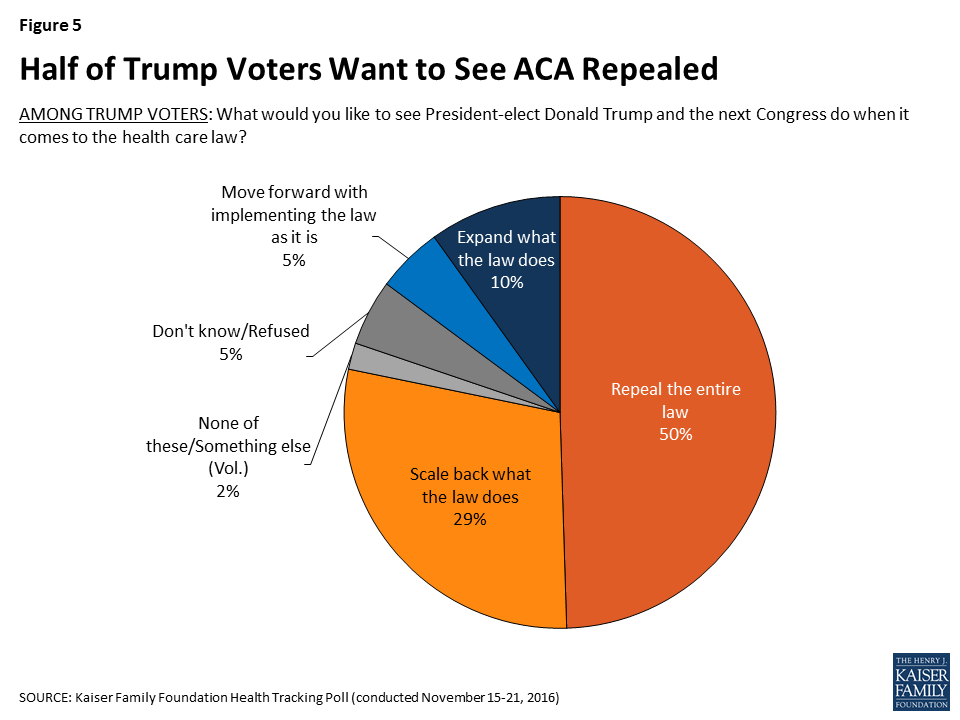
In addition, half of Trump voters want to see the law repealed, three in ten (29 percent) want President-elect Trump and the next Congress to scale back what the law does, 5 percent want lawmakers to move forward with implementing the law as it is, and one in ten want them to expand what the law does.
Figure 5: Half of Trump Voters Want to See ACA Repealed
Republicans May Be Shifting Attitudes on ACA from Repeal to Scale Back
The November Kaiser Health Tracking Poll finds a slight uptick in the share of Americans who want lawmakers to scale back the law (17 percent compared to 9 percent last month) as well as a decrease in the share who want lawmakers to repeal the entire law (26 percent compared to 32 percent in October).
The shift in attitudes is largely driven by Republicans, with about half (52 percent) of Republicans saying they want the ACA to be repealed this month, down from 69 percent in October. At the same time, there was a corresponding increase in the share of Republicans who want lawmakers to scale back what the law does, from 11 percent to 24 percent.
Figure 6: Since Election, Fewer Republicans Say They Want ACA Repealed While More Say They Want It Scaled Back
Republican-Sponsored Alternative to the ACA
Republican members of Congress, including House Speaker Paul Ryan, have suggested alternative health reform plans to the ACA. Among those who want to see the ACA repealed (26 percent of total population), 31 percent want to see the health care law just repealed and not replaced. Two-thirds want lawmakers to repeal the health care law and replace it with a Republican-sponsored alternative, including 42 percent who want lawmakers to wait to repeal until the details of a replacement plan have been figured out and 21 percent who want them to repeal the law immediately and figure out a replacement plan later.
Figure 7: Among Those Who Want ACA Repealed, Two-Thirds Want It Replaced with Republican-Sponsored Alternative
These results are similar among Trump voters who want lawmakers to repeal the law, with about two-thirds wanting lawmakers to repeal the health care law and replace it with a Republican-sponsored alternative.
Among Those Who Want to See ACA Expanded or Repealed, Some Attitudes Are Malleable
Among Americans who have the most polarized attitudes towards the ACA – those who want to see it expanded or repealed – some attitudes can be swayed after hearing arguments for or against repeal or expansion of the law. Among those who want to see the ACA repealed, 38 percent (meaning 10 percent of the public overall) change their opinion after hearing the argument made by proponents that repealing the ACA would mean that insurance companies would be able to deny coverage to people with pre-existing conditions. A slightly smaller share (19 percent of those who wanted to see the law repealed, 5 percent, overall) change their opinion after hearing that more than 20 million Americans who have gotten health insurance through the health care law could lose their coverage if the law was repealed. Trump voters react similarly, with a larger share changing their opinion after hearing that repealing the ACA would mean that insurance companies would be able to deny coverage to people with pre-existing conditions (27 percent) than changing their opinion after hearing that more than 20 million Americans could lose their coverage (8 percent).
Figure 8: Among the 26 Percent Who Want the ACA Repealed, Some Attitudes Are Malleable
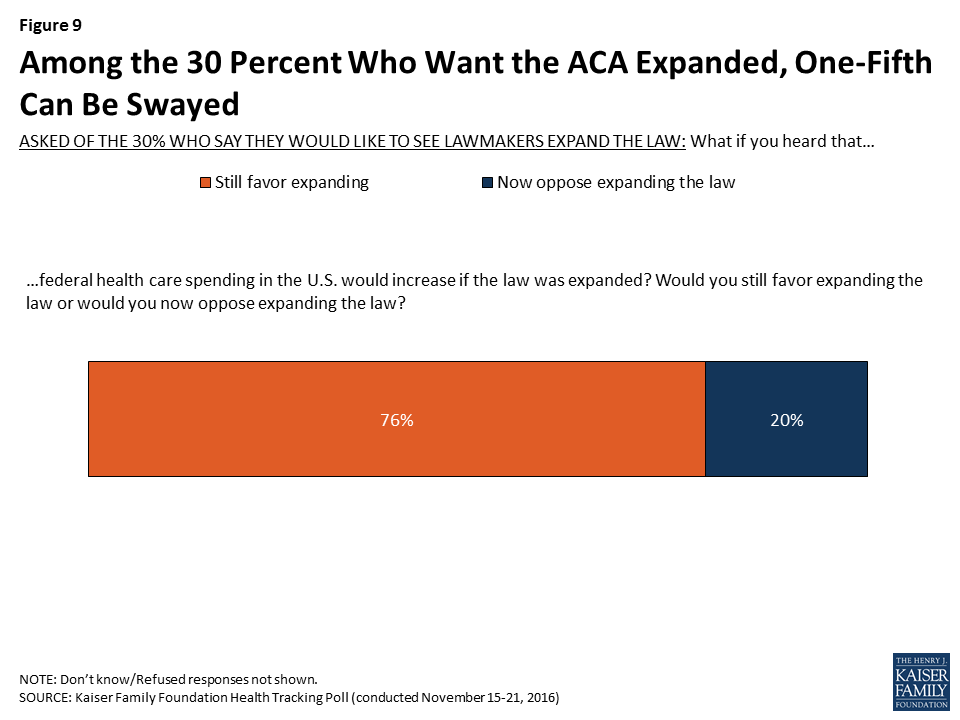
On the other hand, among those who want to see the ACA expanded, one-fifth change their opinion after hearing that federal health care spending in the U.S. would increase if the law was expanded (6 percent, overall).
Figure 9: Among the 30 Percent Who Want the ACA Expanded, One-Fifth Can Be Swayed
Americans Have Favorable Attitudes towards Some ACA Provisions
While President-elect Trump and Republican members of Congress make efforts to repeal the ACA, many of the law’s major provisions continue to be quite popular, even across party lines.
Table 2: Americans’ Opinions of ACA Provisions
Percent who say they have a FAVORABLE opinion of each of the following provisions of the law:
Total
Democrats
Independents
Republicans
Allows young adults to stay on their parents’ insurance plans until age 26
85%
90%
85%
82%
Eliminates out-of-pocket costs for many preventive services
83
89
83
77
Closes the Medicare prescription drug “doughnut hole” so people on Medicare will no longer be required to pay the full cost of their medications
81
86
89
69
Creates health insurance exchanges where small businesses and people can shop for insurance and compare prices and benefits
80
90
80
72
Provides financial help to low- and moderate-income Americans who don’t get insurance through their jobs to help them purchase coverage
80
91
81
67
Gives states the option of expanding their existing Medicaid program to cover more low-income, uninsured adults
80
90
79
67
Prohibits insurance companies from denying coverage because of a person’s medical history
69
75
65
63
Increases the Medicare payroll tax on earnings for upper-income Americans
69
82
63
63
Requires employers with 50 or more employees to pay a fine if they don’t offer health insurance
60
83
60
45
Requires nearly all Americans to have health insurance or else pay a fine
35
57
30
21
Note: Some items asked of half samples. Question wording abbreviated. See topline for full question wording.
For example, large shares of Americans – including at least eight in ten overall and at least eight in ten Democrats, Republicans, and independents – have a favorable view of the fact that the law allows young adults to stay on their parents’ insurance plans up to age 26.
Figure 10: Across Party Lines, Americans Favor Allowing Those Under 26 to Stay on Their Parents’ Insurance
In addition, at least seven in ten Democrats, Republicans, and independents have a favorable view of the provisions that eliminate out-of-pocket costs for preventive services and create health insurance exchanges or marketplaces where small businesses and people who don’t get coverage through their employers can shop for insurance and compare prices and benefits.
Other provisions of the ACA including those that close the Medicare “doughnut hole” for prescription drug coverage, provide financial help to low- and moderate-income Americans to help them purchase coverage, and give states the option of expanding Medicaid are favored by the vast majority of Democrats and independents, and at least six in ten Republicans. Fewer, but still a majority of Democrats, Republicans, and independents, favor the fact that the law prohibits insurance companies from denying coverage based on pre-existing conditions and establishes the Medicare payroll tax on earnings for upper-income Americans.
The provision that requires employers with 50 or more employees pay a fine if they do not offer health insurance to their employees is favored by a majority of Democrats and independents (83 percent and 60 percent, respectively) but by fewer than half of Republicans (45 percent). The glaring exception to the popularity of individual provisions of the law is the requirement that nearly all Americans have health insurance or pay a fine, which is viewed unfavorably by about two-thirds of the public.
Figure 11: Majority of Republicans and Independents Have Unfavorable View of ACA’s Individual Mandate
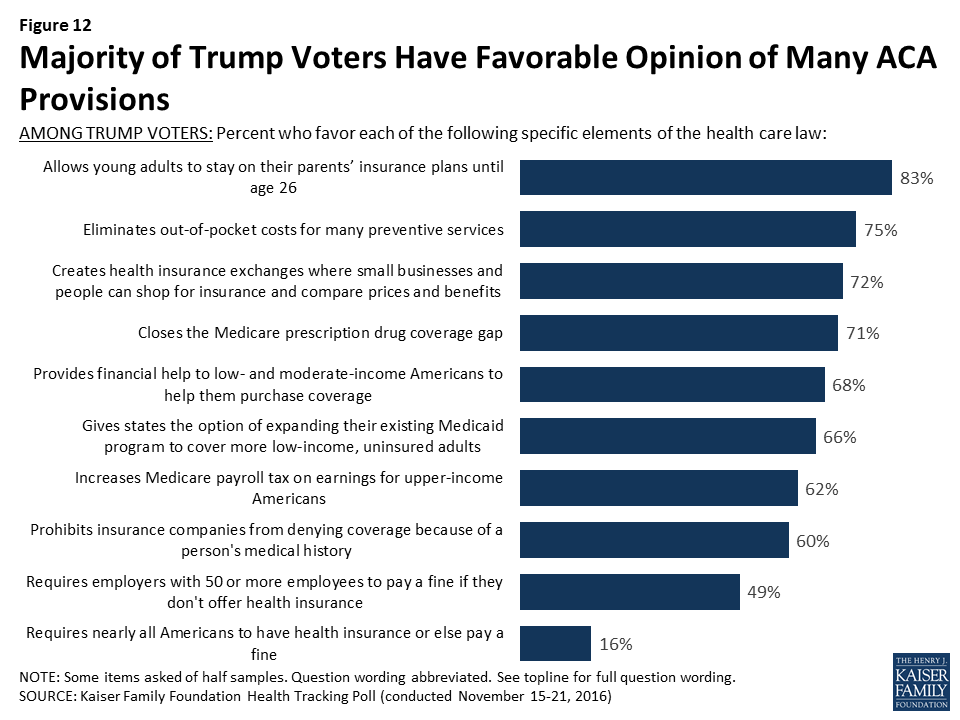
Majority of Trump Voters Have Favorable Attitudes Towards Many ACA Provisions
Many of the ACA’s major provisions are also quite popular among Trump voters, with more than seven in ten having favorable attitudes towards the provisions that allow young adults to stay on their parents’ insurance plans up to age 26 and eliminate out-of-pockets costs for preventive services. In addition, at least two-thirds of Trump voters also favor the fact that the law creates health insurance exchanges or marketplaces where small businesses and people who don’t get coverage through their employers can shop for insurance and compare prices and benefit (72 percent), closes the Medicare prescription drug coverage gap (71 percent), provides financial help to low- and moderate-income Americans to buy health insurance (68 percent), and gives states the option of expanding Medicaid to cover more low-income, uninsured adults (66 percent).
Figure 12: Majority of Trump Voters Have Favorable Opinion of Many ACA Provisions
Perceived Impact of Health Care Changes on Americans
Most Say Changes to Health Care Law Will Not Impact Them, But Some Concern For How Trump’s Health Care Policies Could Affect At-Risk Populations
When asked how a repeal of the 2010 health care law would affect the quality of and access to health care, most Americans say the quality of their own health care as well as their own ability to get and keep health insurance would stay about the same (57 percent and 55 percent, respectively). Americans are more divided on how a repeal of the ACA would affect health care costs for them and their family with 30 percent saying the cost of their health care would get worse, 27 percent saying it would get better, and 40 percent saying it would stay about the same.
Figure 13: Most Say ACA Repeal Will Not Affect Their Health Care Access or Quality of Care
Among Trump voters, 52 percent say the cost of their health care will get better, 39 percent say the quality of their health care will get better, and 35 percent say their ability to get and keep health insurance will get better if the 2010 health care law is repealed.
Some Concern That President-elect Trump’s Health Care Policies Will be Bad for Women, Uninsured, and Lower-Income Americans
A large share of Americans do not think that President-elect Trump’s health care policies will make much of a difference to many groups (wealthy Americans, men, and them and their family). The public is less positive about how other groups – including the uninsured, lower-income Americans, and women – will fare. About four in ten Americans think President-elect Trump’s health care policies will be “bad” for the uninsured (43 percent), lower-income Americans (43 percent), and women (36 percent). Attitudes are more split on how individuals with a pre-existing condition, seniors, middle-class Americans, and the country as a whole will fare, with similar shares saying Trump’s health care policies will be good, bad, or not make much of a difference to these groups.
Figure 14: Americans Vary in Views on How President-Elect Trump’s Health Care Policies Will Affect Certain Groups
The majority of Trump voters say President-elect Trump’s health care policies will be good for the country as a whole (71 percent) and good for them and their families (59 percent). This is compared to 7 percent of Clinton voters who say his health care policies will be good for the country as a whole and 5 percent who say his policies will be good for them and their families.
Figure 15: Majority of Trump Voters Say His Health Care Policies Will Be Good for Country and for Them and Their Families
Kaiser Health Policy News Index: November 2016
The November Kaiser Health Tracking Poll finds the Republican nominee Donald Trump’s election as the 45th president of the United States dominated the public’s attention during the past month with eight in ten Americans (82 percent) closely following news about his presidential campaign win. Other stories that captured the attention of Americans include the conflict involving ISIS in Mosul, Iraq (71 percent) and the top health policy story this month – Republican plans to repeal the ACA (70 percent). Fewer Americans report following three additional health policy stories: news about rising prescription drug costs (59 percent), reports about rising ACA health insurance premiums (55 percent), and the ACA’s fourth open enrollment period (45 percent).
Figure 16: Kaiser Health Policy News Index: November 2016
Methodology
This Kaiser Health Tracking Poll was designed and analyzed by public opinion researchers at the Kaiser Family Foundation (KFF). The survey was conducted November 15-21, 2016, among a nationally representative random digit dial telephone sample of 1,202 adults ages 18 and older, living in the United States, including Alaska and Hawaii (note: persons without a telephone could not be included in the random selection process). Computer-assisted telephone interviews conducted by landline (422) and cell phone (780, including 467 who had no landline telephone) were carried out in English and Spanish by Princeton Data Source under the direction of Princeton Survey Research Associates International (PSRAI). Both the random digit dial landline and cell phone samples were provided by Survey Sampling International, LLC. For the landline sample, respondents were selected by asking for the youngest adult male or female currently at home based on a random rotation. If no one of that gender was available, interviewers asked to speak with the youngest adult of the opposite gender. For the cell phone sample, interviews were conducted with the adult who answered the phone. KFF paid for all costs associated with the survey.
The combined landline and cell phone sample was weighted to balance the sample demographics to match estimates for the national population using data from the Census Bureau’s 2014 American Community Survey (ACS) on sex, age, education, race, Hispanic origin, and region along with data from the 2010 Census on population density. The sample was also weighted to match current patterns of telephone use using data from the July-December 2015 National Health Interview Survey. The weight takes into account the fact that respondents with both a landline and cell phone have a higher probability of selection in the combined sample and also adjusts for the household size for the landline sample. All statistical tests of significance account for the effect of weighting.
The margin of sampling error including the design effect for the full sample is plus or minus 3 percentage points. Numbers of respondents and margins of sampling error for key subgroups are shown in the table below. For results based on other subgroups, the margin of sampling error may be higher. Sample sizes and margins of sampling error for other subgroups are available by request. Note that sampling error is only one of many potential sources of error in this or any other public opinion poll. Kaiser Family Foundation public opinion and survey research is a charter member of the Transparency Initiative of the American Association for Public Opinion Research.
Under current law, Medicare has several financial protections in place that are designed to safeguard Medicare beneficiaries—seniors and people with permanent disabilities—from unexpected and confusing charges when they seek care from doctors and other practitioners. These protections include the participating provider program, limitations on balance billing, and conditions on private contracting. This issue brief describes these three protections, explains why they were enacted, and examines the implications of modifying them for beneficiaries, providers, and the Medicare program.
Main Findings
The participating provider program was enacted in 1984 for two purposes: (1) to assist Medicare patients with identifying and choosing providers who charge Medicare-approved rates; and (2) to encourage providers to accept these rates. Given this program’s strong provider incentives, the number of participating providers grew rapidly across all states and today, the vast majority (96%) of eligible physicians and practitioners are “participating providers”—agreeing to charge Medicare’s standard fees when they see beneficiaries.
The Congress instituted limitations on balance billing in 1989, in conjunction with implementation of the Medicare physician fee schedule. This financial protection limits the amount that “non-participating” providers may charge beneficiaries through balance billing—whereby beneficiaries are responsible for the portion of the provider’s charge that exceeds Medicare’s fee-schedule rate. Total out-of-pocket liability from balance billing has declined significantly over the past few decades dropping from $2.5 billion in 1983 ($5.65 billion in 2011 dollars) to $40 million in 2011.
In 1997, the Congress codified several conditionsforprivate contracting that apply to physicians and practitioners who “opt out” of Medicare and see beneficiaries only under individual private contracts. These restrictions were instituted to ensure that beneficiaries are aware of the financial ramifications of entering into these private contracts, and to safeguard patients and Medicare from fraud and abuse. In general, private contracting is relatively rare with only 1 percent of practicing physicians opting out of Medicare.
Background: Current Provider Options for Charging Medicare Patients
Under current law, physicians and practitioners have three options for how they will charge their patients in traditional Medicare. They may register with Medicare as (1) a participating provider, (2) a non-participating provider, or (3) an opt-out provider who privately contracts with each of his or her Medicare patients for payment (Figure 1). This issue brief describes these three options and then examines three current provisions in Medicare that provide financial protections for Medicare beneficiaries.
Participating providers:Physicians and practitioners who register with Medicare as participating providers agree to “accept assignment” for all of their Medicare patients. Accepting assignment entails two conditions: agreeing to accept Medicare’s fee-schedule amount as payment-in-full for a given service and collecting Medicare’s portion directly from Medicare, rather than the patient. Therefore, when Medicare patients see participating providers, they can be certain that these providers will not charge fees higher than Medicare’s published fee-schedule amount and that they will not face higher out-of-pocket liability than the maximum 20-percent coinsurance for most services. The vast majority (96%) of providers who provide Medicare-covered services are participating providers.
Non-participating providers: Non-participating providers do not agree to accept assignment for all of their Medicare patients; instead they may choose—on a service-by-service basis—to charge Medicare patients higher fees, up to a certain limit. When doing so, their Medicare patients are liable for higher cost sharing to cover the higher charges. This arrangement is called “balance billing” and means that the Medicare patient is financially responsible for the portion of the provider’s charge that is in excess of Medicare’s assigned rate, in addition to standard applicable coinsurance and deductibles for Medicare services. When non-participating providers do not accept assignment, they may not collect reimbursement from Medicare; rather, they bill the Medicare patient directly, typically up front at the time of service. Non-participating providers must submit claims to Medicare on behalf of their Medicare patients, but Medicare reimburses the patient, rather than the nonparticipating provider, for its portion of the covered charges. A small share (4%) of providers who provide Medicare-covered services are non-participating providers.
Opt-out providers, privately contracting: Physicians and practitioners who choose to enter into private contracts with their Medicare patients “opt-out” of the Medicare program entirely. These opt-out providers may charge Medicare patients any fee they choose. Medicare does not provide any reimbursement—either to the provider or the Medicare patient—for services provided by these providers under private contracts. Accordingly, Medicare patients are liable for the entire cost of any services they receive from physicians and practitioners who have opted out of Medicare. Several protections are in place to ensure that patients are clearly aware of their financial liabilities when seeing a provider under a private contract. An extremely small portion of physicians (less than 1% of physicians in clinical practice) have chosen to “opt-out” of the Medicare program, of whom 42 percent are psychiatrists.
These provider options have direct implications on the charges and out-of-pocket liabilities that beneficiaries face when they receive physician services (Figure 2). They also play a major role in several financial protections in current law—namely, the physician participation program, limitations on balance billing, and conditions for private contracting—which help beneficiaries understand the financial implications of their provider choices and encourage providers to accept Medicare’s standard fees.
Figure 1: Physician/Practitioner Billing Options in Traditional MedicareFigure 2: Medicare reimbursement and beneficiary cost-sharing for a $100 fee-schedule service
Medicare’s Participating Provider Program
Medicare’s participating provider program includes several incentives (both financial and nonfinancial) to encourage physicians and practitioners to “accept assignment” for all of their Medicare patients. When providers accept assignment, they agree to accept Medicare’s fee-schedule amount as payment-in-full for a given service and are allowed to bill Medicare directly for its portion of the reimbursement. Physicians and practitioners who agree to accept assignment on all services that they provide to Medicare patients are “participating providers” and are listed in Medicare provider directories. Beneficiaries who select a participating provider are assured that, after meeting the deductible, their coinsurance liability will not exceed 20 percent of the charge for the services they receive (Figure 2).
Congress established the participating provider program in the 1984 Deficit Reduction Act (DEFRA) to address two main concerns: confusion among beneficiaries about the fees they were being charged when they saw a doctor and escalating rates of balance billing from charges that exceeded Medicare’s established “usual, customary, and reasonable” rates for their area.1 At that time, aside from Medicaid-eligible beneficiaries, Medicare had no limits on the amount that physicians and practitioners could balance bill for their services. Surveys conducted by the Physician Payment Review Commission (PPRC), a congressional advisory body and predecessor of the Medicare Payment Advisory Commission (MedPAC), revealed that prior to the participating provider program, beneficiaries often did not know from one physician to the next whether they would face extra out-of-pocket charges due to balance billing and how much those amounts might be.2 By 1984, beneficiaries’ payment for balance billing reached 27 percent of total Medicare Part B out-of-pocket liability and was jeopardizing their access to affordable physician services.3
The establishment of the participating provider program in Medicare instituted multiple incentives to encourage providers to accept assignment for all their patients and become participating providers. For example, Medicare payment rates for participating providers are 5 percent higher than the rates paid to non-participating providers. Also, participating providers may collect Medicare’s reimbursement amount directly from Medicare, in contrast to non-participating providers who may not collect payment from Medicare and typically bill their Medicare patients upfront for their charges. (Non-participating providers must submit claims to Medicare so that their patients are reimbursed for Medicare’s portion of their charges.) Participating providers also gain the benefit of having electronic access to Medicare beneficiaries’ supplemental insurance status, such as their Medigap coverage. This information makes it considerably easier for providers to file claims to collect beneficiary coinsurance amounts, as well as easing the paperwork burden on patients. Additionally, Medicare helps beneficiaries in traditional Medicare seek and select participating providers by listing them by name with their contact information on Medicare’s consumer-focused website (www.Medicare.gov).
Given the strong incentives of the participation program, combined with limits on balance billing (discussed in the next section), it is not surprising that the share of physicians and practitioners electing to be participating providers has risen to high levels across the country. Overall, the rate of providers with participation agreements has grown to 96 percent in 2011, up considerably from about 30 percent in 1986, two years after the start of the participating provider program (Figure 3).4As a result, across all states, most beneficiaries now encounter predictable expenses for Medicare-covered services, and are never responsible for Medicare’s portion of the fee (Appendix 1).
Figure 3: Strong incentives in Medicare have led to a high rate of “participating providers”
Medicare’s Balance Billing Limitations
Despite the incentives to become participating providers, a small share (4%) of physicians and practitioners who are registered with Medicare are non-participating providers. These providers can—on a service-by-service basis—charge patients in traditional Medicare higher fees than Medicare’s fee-schedule amount, up to a specified maximum. When charging higher fees, beneficiaries are responsible for the difference between Medicare’s approved amount and the providers’ total charge—essentially the balance of the bill remaining after accounting for Medicare’s reimbursement. This higher cost-sharing arrangement is called “balance billing” and means that the Medicare patient is financially liable for not only the applicable coinsurance and deductible, but also for any amount in which the provider’s charge exceeds Medicare’s assigned rate. Providers may not balance bill Medicare beneficiaries who also have Medicaid coverage.5
When non-participating providers balance bill, they bill the beneficiary directly, typically for the full charge of the service—including Medicare’s share, applicable coinsurance and deductible, and any balance billed amount. Non-participating providers are then required to submit a claim to Medicare, so that Medicare can process the claim and reimburse the patient for Medicare’s share of the charge. Two Medigap insurance policies, which beneficiaries may purchase to supplement their Medicare coverage, include coverage for balance billing.6 Balance billing is prohibited for Medicare-covered services in the Medicare Advantage program, except in the case of private fee-for-service plans.
In traditional Medicare, the maximum that non-participating providers may charge for a Medicare-covered service is 115 percent of the discounted fee-schedule amount. (Medicare’s fee-schedule rates for non-participating physicians are reduced by five percent.) Accordingly, non-participating providers may bill Medicare patients up to 9.25 percent more than participating providers (i.e., 1.15 x 0.95= 109.25). If the non-participating physician or practitioner balance bills the maximum amount permitted (not including any unmet deductible), total beneficiary liability for Medicare-covered services is about 33 percent of Medicare’s regular fee schedule amount (Figure 2).
Balance billing limitations were implemented in conjunction with the institution of Medicare’s physician fee-schedule in the Omnibus Budget Reconciliation Act of 1989. At the time, Medicare’s charge-based methodology for physician services gave rise to rapid spending growth and confusion among beneficiaries about what charges they would face for physician services.7 Moreover, high cost-sharing liabilities weighed disproportionately on beneficiaries who were sickest and used the most physician services. Despite physician reports that they took patient incomes into account when determining whether to charge higher-than Medicare rates, PPRC research did not find a relationship between beneficiary income and the probability that claims would be assigned.8
While the Congress constrained growth in provider fees through the implementation of the fee schedule, it also implemented maximum “limiting charges” to establish further certainty and predictability for patients on their expected costs for services. In trying to rein in Medicare fee-schedule payments, the Congress sought to protect beneficiaries from excess charges that providers could otherwise impose in response to restrictions on their fees.9
The continued desire to protect beneficiary spending during the implementation of the new physician fee schedule gave rise to the question of whether Congress might consider imposing even greater restrictions on balance billing or even mandate assignment (prohibiting balance billing) for all claims.10 Ultimately, the rationale in Congress for allowing limited balance billing was that it would provide for: (1) a “safety valve” for physicians who believed that the fee schedule did not adequately reflect the quality of services that they provided; (2) a means to correct any underpricing of resource costs in the fee schedule; and (3) necessary financial protections for beneficiaries, particularly in areas of the country where choice of physicians was limited.11
As limits on balance billing were implemented and incentives for physicians and practitioners to take assignment took hold, beneficiary liability for balance billing declined dramatically. CMS data show that in 2011, total balance billing amounted to $40 million, down significantly from $2.5 billion in 1983, (which equals $5.6 billion in 2011 dollars) (Figure 4). Concurrently, the rate of assigned claims to total covered charges climbed from 51% in 1983 to 99% in 2011.
Figure 4: Balance billing in Medicare has declined significantly; almost all physician services are now paid on assignment
Private Contracting Conditions for Providers who Opt Out of Medicare
A very small share of providers (less than 1 percent of physicians) have elected to “opt out” of Medicare and contract privately with all of their Medicare patients, individually.12 Their fees are not bound by Medicare’s physician fee schedule in any way, which means that these providers have no limits on the amounts they may charge beneficiaries for their services. Medicare does not reimburse either the provider or the patient for any services furnished by opt-out providers. Therefore, Medicare patients are financially responsible for the full charge of services provided by providers who have formally opted out of Medicare.13
Serving as beneficiary protections, several important conditions exist for providers who elect to contract privately with Medicare patients. One condition is that prior to providing any service to Medicare patients, physicians and practitioners must inform their Medicare patients that they have opted out of Medicare and provide their Medicare patients with a written document stating that Medicare will not reimburse either the provider or the patient for any services furnished by opt-out providers. Their Medicare patients must sign this document to signify their understanding of it and their right to seek care from a physician or other practitioner who has not opted-out of Medicare.
Providers opt-out by submitting a signed affidavit to Medicare agreeing to applicable terms and affirming that their contracts with patients include all the necessary information. Physicians or practitioners who opt out of Medicare must privately contract with all of their Medicare patients, not just some. Once a physician or practitioner opts out of Medicare, this status lasts for a two-year period and is automatically renewed unless the physician or practitioner actively cancels it.14 Providers may not enter into a private contract with a beneficiary who also has Medicaid benefits or who is experiencing an urgent or emergent health care event. 15
These conditions, which provide protections for both beneficiaries and the Medicare program, were included in the Balanced Budget Act of 1997 as part of the legislation that first codified physicians’ ability to privately contract with Medicare beneficiaries. Requiring opt-out providers to privately contract for all services they provide to Medicare patients (rather than being able to select by individual patients or services) was intended to prevent confusion among Medicare patients as to whether or not each visit would be covered under Medicare and how much they could expect to pay out-of-pocket. Similarly, requiring providers to opt out for a minimum period of time—two years—was intended to ensure that beneficiaries had consistent information to make knowledgeable choices when selecting their physicians. Both of these provisions also addressed Medicare’s duty to guard against fraudulent billing in an administratively feasibly manner. If, for example, physicians contracted with only some of their patients and/or services, Medicare would have to examine each contract for each submitted claim to discern which claims were eligible for Medicare reimbursement and which were not.
Previous Kaiser Family Foundation analysis shows that psychiatrists are disproportionately represented among the 0.7 percent of physicians (4,863) who have opted out of Medicare—comprising 42 percent of all physicians who have opted out (Figure 5).16 Another 1,775 clinical professionals with non-physician doctorate degrees (i.e. oral surgeon dentists, podiatrists, and optometrists) also have opted-out of the Medicare program.17 Dentists who are oral surgeons comprise the majority of this group (95%). Earlier research that examined opt-out providers through 2002 found similarly low numbers of providers opting out (2,839) as well as relatively higher opt-out rates among psychiatrists compared with other specialties.18
Some physician organizations attribute physician decisions to opt out of Medicare to frustration with Medicare’s fees and regulations.19 Others have noted a similar trend in physician refusal to work with any insurers—including commercial insurance plans—especially in prosperous communities. 20 In these cases, providers require patients to pay them directly out-of-pocket, leaving the patient to seek reimbursement, if any, from their insurer. For providers with patients who have the resources to make the payments, this billing method significantly reduces providers’ paperwork.
Figure 5: Less than 1% of physicians in patient care have formally “opted out” of Medicare, with psychiatrists making up the largest share
Specialty
Number of physicians in patient care, 20101
Percent of physicians in specialty
Number of Medicare opt-out providers, 20132
Percent of Medicare opt-out providers in specialty
Percent of total opt-out providers
Physicians
Addiction Medicine
NA
—
4
—
0.1%
Allergy/Immunology
3,668
0.5%
35
1.0%
0.7%
Anesthesiology
36,462
5.4%
30
0.1%
0.6%
Cardiovascular Disease/Cardiology
19,637
2.9%
29
0.1%
0.6%
Colorectal Surgery/Proctology
NA
—
1
—
0.0%
Dermatology
10,101
1.5%
96
1.0%
2.0%
Emergency Medicine
30,094
4.4%
53
0.2%
1.1%
Endocrinology
4,502
0.7%
32
0.7%
0.7%
Family Medicine/General Practice
97,779
14.4%
702
0.7%
14.4%
Gastroenterology
11,550
1.7%
20
0.2%
0.4%
General Surgery
21,896
3.2%
41
0.2%
0.8%
Geriatric Medicine
3,367
0.5%
5
0.1%
0.1%
Hand Surgery
NA
—
3
—
0.1%
Hematology/Oncology
10,261
1.5%
14
0.1%
0.3%
Infectious Disease
5,007
0.7%
10
0.2%
0.2%
Internal Medicine
93,381
13.8%
447
0.5%
9.2%
Maxillofacial Surgery
NA
—
245
—
5.0%
Nephrology
7,020
1.0%
2
0.0%
0.0%
Neurology
10,748
1.6%
47
0.4%
1.0%
Neurosurgery
4,505
0.7%
36
0.8%
0.7%
Obstetrics/Gynecology
36,978
5.5%
375
1.0%
7.7%
Ophthalmology
16,598
2.4%
30
0.2%
0.6%
Orthopedic Surgery
18,625
2.7%
140
0.8%
2.9%
Osteopathic Manipulative Medicine
NA
—
49
—
1.0%
Otolaryngology
8,636
1.3%
35
0.4%
0.7%
Pain Mgt/Interventional Pain Mgt
NA
—
21
—
0.4%
Pathology
11,231
1.7%
2
0.0%
0.0%
Pediatric Medicine
55,686
8.2%
52
0.1%
1.1%
Physical Medicine And Rehab, Sports Medicine
7,435
1.1%
50
0.7%
1.0%
Plastic And Reconstructive Surgery
6,379
0.9%
127
2.0%
2.6%
Preventative Medicine
4,060
0.6%
24
0.6%
0.5%
Psychiatry, Geriatric Psychiatry, Neuropsychiatry
38,781
5.7%
2,029
5.2%
41.7%
Pulmonary Disease, Critical Care/Intensivists
10,486
1.5%
6
0.1%
0.1%
Radiation Oncology
4,032
0.6%
1
0.0%
0.0%
Radiology, Nuclear Medicine
24,887
3.7%
19
0.1%
0.4%
Rheumatology
4,069
0.6%
12
0.3%
0.2%
Thoracic Surgery
4,222
0.6%
4
0.1%
0.1%
Urology
9,180
1.4%
29
0.3%
0.6%
Vascular Surgery
2,582
0.4%
6
0.2%
0.1%
Other, unspecified specialty*3
44,479
6.6%
NA
—
—
Total for all physician specialties
678,324
100.0%
4,863
0.7%
100.00%
Non-physician clinicians with doctorate
Chiropractic
NA
—
5
—
0.3%
Optometry
NA
—
52
—
2.9%
Oral Surgery (Dentist Only)
NA
—
1,692
—
95.3%
Podiatry
NA
—
26
—
1.5%
Total Non-physician clinicians with doctorate
1,775
100.0%
NOTES: Physician counts include active physicians in patient care with an MD (Medical Doctor) or DO (Doctor of Osteopathic Medicine) degree. NA (not available) indicates that the specified specialty category is not supplied in the applicable data source. *Physicians in specialties with fewer than 2,500 total physicians are not categorized by specialty in AAMC analysis of AMA data (see Sources); 44,749 is the difference between the total number of physicians in patient care (678,324) and the number categorized by specialty (633,845).
SOURCES: Kaiser Family Foundation analysis of: 1Physician counts from Association of American Medical Colleges (AAMC) 2012 Physician Specialty Data Book, using American Medical Association (AMA) Physician Masterfile (December 2010); 2Unpublished data from the Center for Medicare and Medicaid Services, September 2013; 3Physician counts from AAMC, 2011 State Physician Workforce Data Book, using AMA Physician Masterfile (December 31, 2010).
Concierge Practice Models
Some physicians are turning to concierge practice models (also called retainer-based care), in which they charge their patients annual membership fees and typically have smaller patient caseloads. Physicians in a concierge practice model do not necessarily need to opt-out of Medicare to see Medicare patients. However, if they do not opt-out of Medicare, these physicians are subject to Medicare’s balance billing rules, and therefore, cannot charge beneficiaries additional fees for services that are already covered by Medicare.21 For example, the annual fee for a concierge practice may not be used for the yearly wellness visit covered by Medicare, but it could be applied to items such as a newsletter and high-end waiting room furniture. More controversy exists about concierge practices applying annual fees paid by Medicare beneficiaries to enhanced appointment access and extra time with patients.22
While anecdotal reports suggest a significant migration of primary care physicians to concierge/retainer practices, particularly in areas around Washington D.C and other major east and west coast cities, reliable data on the number of these practices are lacking. In 2010, a report for MedPAC found listings for 756 concierge physicians, compared with 146 found by Government Accountability Office in 2005.23 Other news articles have reported larger numbers (4,400 in 2012) according to the American Association of Private Physicians.24
Implications of Proposals to Modify Incentives and Relax Certain Financial Protections—Pros and Cons
Proposals introduced by Rep. Tom Price, House Speaker Paul Ryan and others have sought to relax private contracting conditions either throughout the Medicare program or as a demonstration project that could be implemented by the Administration. For example, in 2015, two Bills introduced in the House with a companion Bill in the Senate25 include provisions to allow physicians and practitioners to engage in private contracting on a beneficiary-by-beneficiary basis, instead of requiring providers to opt-out of Medicare entirely. These Bills would also allow beneficiaries to seek Medicare reimbursement for the portion of the privately contracted fee that equals Medicare’s fee schedule amount, but no out-of-pocket limits would apply to the remaining portion of the provider’s charge. Similar changes are also proposed as a demonstration in the 2016 House Republican Plan, “A Better Way, our Vision for a Confident America.”26 An earlier House Bill also included a demonstration to allow non-participating providers to collect Medicare’s portion of their charge directly from Medicare.27
Pros: Support for Relaxing restrictions and increasing physician autonomy
Proponents of such proposals, including the American Medical Association, support relaxing restrictions on balance billing and private contracting for a number of reasons—perhaps the foremost is that they would allow physicians to charge Medicare beneficiaries higher rates and thereby get relief from fees that they say have failed to keep pace with the rising costs of running their practices.28 Proponents also assert that this ability could increase the overall number of providers willing to accept Medicare patients. This concern may be an issue in some geographic areas, though surveys and other data sources show that nationally, access to physicians among Medicare seniors is generally comparable to access among people age 55 to 64 with private insurance.29
Physician groups also state that proposals to relax constraints on balance billing and private contracting would give providers a sense of greater autonomy in how they relate to both their patients and the Medicare program and would allow physicians to charge higher fees to some patients based on their assessment of their patients’ ability to pay.30 Additionally, beneficiaries would be able to seek at least partial Medicare reimbursement for services they received under private contracts. Proposals that would allow non-participating providers to collect Medicare’s portion of their charge directly from Medicare would obviate the need to charge patients the full fee upfront. This circumstance could be helpful to those patients who do not want to wait for Medicare’s reimbursement, even if on net, they would incur higher out-of-pocket liability due to balance billing. Non-participating providers could also experience a more reliable payment from Medicare, compared with the challenges, in some cases, of collecting fees from Medicare patients for unassigned claims.
Cons: Concerns about Eroding Financial Protections
Other analysts have raised concerns about the effects of relaxing private contracting rules and balance billing restrictions.31 To the extent that such changes lead to increases in the number of non-participating and/or opt-out providers, they could exacerbate problems that lower-income beneficiaries face when seeking care. Beneficiaries without the ability to pay higher rates (who are also likely to be disproportionately sicker) could find a reduced pool of physicians willing to accept them. Also, for rarer physician specialties and in some geographic areas, such as rural parts of the country, patients may have little choice among physicians. If the limits on balance billing and private contracting were relaxed, beneficiaries in these situations could face the types of problems that existed prior to the imposition of limits on balance billing—high out-of-pocket costs and greater confusion and uncertainty about possible charges. Additionally, concerns have been raised about the accuracy and appropriateness of providers determining which Medicare patients in their caseload can afford higher fees, and by how much.
While proposals that allow beneficiaries and non-participating physicians to seek reimbursement from Medicare may, in the short term, reduce out-of-pocket liability for beneficiaries, they could also decrease the incentives for physicians and practitioners to become participating providers. In the long run, if significantly more providers balance billed their Medicare patients or opted-out of Medicare, this shift could alternatively increase beneficiary out-of-pocket spending.
From the perspective of the Medicare’s program integrity, Medicare would have significant difficulty tracking fraud and abuse if physicians were able to contract selectively for services with some but not all beneficiaries. Medicare would have to examine every physician-patient contract, on a claim-by-claim basis, to determine which claims could be reimbursed directly to the physician and which would be the full responsibility of the patient. Additionally, Medicare would need to examine these physicians’ billing practices to ensure that beneficiaries were not being charged inappropriately.
Conclusions
Balance billing limits, with incentives for physicians to accept assignment, have proven effective in limiting beneficiaries’ out-of-pocket liability for physician services. Today, a small share of Medicare beneficiaries experience balance billing just as only small share of provider claims in Medicare are paid unassigned—very different from the years before balance billing limits were instituted. Moreover, only about 1 percent of physicians provide services to beneficiaries on a private contracting basis. As the Congress has been considering changes to the way in which Medicare pays for physician service in the context of SGR repeal, some proposals have briefly surfaced to relax constraints on balance billing and private contracting.
On the one hand, these proposals could increase physician autonomy and provider willingness to treat Medicare patients, particularly among those providers who charge higher fees. On the other hand, such proposals could result in higher out-of-pocket liability, particularly in the longer term, which could affect beneficiary access to care. Additionally, relaxing these protections could foster less predictability in the fees beneficiaries encounter when seeing physicians and practitioners. Patients most at risk for experiencing a greater financial burden would be those with modest incomes and greater health care needs. Beneficiaries in geographic areas with limited choices of physicians might also be at higher risk if a growing number of providers choose to balance bill or require private contracts with their Medicare patients. The key is to strike a balance between assuring that providers receive fair payments from Medicare while also preserving financial protections that help beneficiaries face more predictable and affordable costs when they seek care.
Technical support in preparation of this brief was provided by Health Policy Alternatives, Inc.
Appendix
APPENDIX 1: In all states, physician participation rates have increased significantly, 1986 to 2011
Endnotes
Physician Payment Review Commission, “Chapter 9: Assignment and the Participating Physician Program: Current Status,” Annual Report to Congress, March 1998. ↩︎
Physician Payment Review Commission, “Appendix E: Trends in Assignment, Participation and Balance Billing,” Annual Report to Congress, 1989. ↩︎
Physician Payment Review Commission, “Chapter 9: Assignment and the Participating Physician Program: Current Status,” Annual Report to Congress, March 1998. ↩︎
U.S. House of Representatives Committee on Ways and Means, 2004 Green Book, March 2004, WMCP: 108-6, Table 2-34. Much of that increase is attributed to the implementation of the Participating Physicians program. Centers for Medicare & Medicaid Services, Data Compendium 2011, Table VI.6, Medicare Participating Physician Program, December 2011. ↩︎
Specifically, providers are prohibited from balance billing Medicare beneficiaries who have full Medicaid coverage (dual eligible) or those who receive Medicaid coverage through the Qualified Medicare Beneficiary (QMB) program. Also, some services are not eligible for balance billing such as clinical diagnostic laboratory services. ↩︎
Medigap plans F and G include coverage for balance billing, referred to as “excess charges.” Regarding other supplemental coverage, balance billing is prohibited for Medicare-covered services in the Medicare Advantage program, except for private fee-for-service plans. Among employer-sponsored retiree health plans, potential liability for balance billing depends on the terms of each plan. ↩︎
Burney, I., et al., “Medicare Physician Payment Participation, and Reform,” Health Affairs, 3, no.4 1984; and Physician Payment Review Commission, “Chapter 9: Assignment and the Participating Physician Program: Current Status.” Annual Report to Congress, March 1998. ↩︎
Ginsburg, P. and P. Lee, “Physician Payment,” in Eli Ginzberg (ed) Health Services Research: Key to Health Policy. Harvard University Press, 1991. ↩︎
See statements from Senator Dole (130 Cong.Rec.S. 8373, 8375 (daily ed. June 27, 1984) reprinted in 1984 U.S. Code Cong. & Admin News, Deficit Reduction Act Legislative History at 2156) and Senator Rostenkowski (130 Cong.Rec.H. 7085, 7086 (daily ed. June 27, 1984) reprinted in Legislative History at 1450. Accord, H.Conf.Rep. No. 98-861, reprinted in Deficit Reduction Act Legislative at 751, 1308). ↩︎
Holahan, J. and S. Zuckerman, 1989. “Medicare Mandatory Assignment: An Unnecessary Risk,” Health Affairs, Spring 1989. ↩︎
Physician Payment Review Commission, “Appendix E: Trends in Assignment, Participation and Balance Billing,” Annual Report to Congress, 1989. ↩︎
Boccuti, C. et al., “Medicare Patients’ Access to Physicians: A Synthesis of the Evidence,” Kaiser Family Foundation, December 2013. ↩︎
Medigap plans do not make payments for services provided by opt-out physicians. Other supplemental insurance plans have the discretion to determine whether or not they will cover services provided by opt-out physicians. ↩︎
Automatic renewal provisions were included in 2015 legislation, The Medicare Access and CHIP Reauthorization Act of 2015 (MACRA), Pub.L. 114-10, 114th Congress (2015-2016). ↩︎
Specifically, providers are prohibited from entering into private contracts with Medicare beneficiaries who have full Medicaid coverage (dual eligible) or those who receive Medicaid coverage through the Qualified Medicare Beneficiary (QMB) program. ↩︎
Boccuti, C. et al., “Medicare Patients’ Access to Physicians: A Synthesis of the Evidence,” Kaiser Family Foundation, December 2013. ↩︎
Dentists, podiatrists, and optometrists did not become eligible to opt out of Medicare until December 2003. Section 603 from the Medicare Prescription Drug, Improvement, and Modernization Act of 2003 added dentists, podiatrists, and optometrists to the definition/list of physicians who may opt out of Medicare. ↩︎
Buczko, W. “Provider Opt-Out Under Medicare Private Contracting.” Health Care Financing Review, vol 26, no 2, Winter 2004-2005. ↩︎
Melinda Becker, “More Doctors Steer Clear of Medicare, Some Doctors Opt Out of Program Frustrated With Payment Rates and Mounting Rules,” New York Times, July 29, 2013 ↩︎
See for example, Rabin, Roni C., “When Doctors Stop Taking Insurance,” New York Times, October 1 2012; When physicians state that they “don’t take insurance,” it often indicates that they will bill the patient for the full charge and the patient must seek reimbursement (if applicable) from their insurer, similar to non-participating providers in Medicare. ↩︎
Physicians in concierge practices who have opted out of Medicare may charge whatever fees they have outlined in their private contracts with their Medicare patients; Medicare does not reimburse either the physician or the Medicare patient for items or services provided by opt-out physicians. ↩︎
Pasquale, F. “The Three Faces of Retainer Care: Crafting a Tailored Regulatory Response,” Yale Journal of Health Policy, Law, and Ethics Vol.7: Iss. 1, Article 2. 2007. ↩︎
Hargrave, E., et al. “Retainer-Based Physicians: Characteristics, Impact, and Policy Considerations” Prepared for the Medicare Payment Advisory Commission, March 2010. ↩︎
Leonard, D. “Is Concierge Medicine the future of Health Care?” Bloomberg Business Week, November 29, 2012. ↩︎
See H.R. 2300 (Empowering Patients First Act of 2015) and H.R.1650 / S.1849 (Medicare Patient Empowerment Act of 2015). ↩︎
See “A Better Way: Our Vision for a Confident America,” House Republican proposal, June 22, 2016. ↩︎
See The Chairman’s amendment in the nature of a substitute to H.R. 2810 (Medicare Patient Access and Quality Improvement Act of 2013). ↩︎
This new fact sheet examines key questions around the potential changes President-elect Donald Trump and the next Congress may seek to make in Medicaid, a program that covers 73 million people nationally.
Depending on how it is structured, a repeal of the Affordable Care Act could reverse the expansion of Medicaid coverage that helped bring the nation’s uninsured rate to a historic low. The brief also examines the prospect of capping and reducing federal financing for Medicaid through a block grant or a per capita cap. These approaches are typically designed to save the federal government money and provide states with additional flexibility but, depending on how they are structured, could put populations and providers who disproportionately rely on Medicaid funding — including the elderly and people with disabilities, nursing homes and safety net hospitals – at risk.
The fact sheet also discusses how executive powers can be used to make changes to Medicaid without congressional action, including new regulations and Medicaid waivers.
Medicaid covers about 73 million people nationwide. Jointly financed by the federal and state governments, states have substantial flexibility to administer the program under existing law. Medicaid provides health insurance for low-income children and adults, financing for the safety net, and is the largest payer for long-term care services in the community and nursing homes for seniors and people with disabilities. President-elect Trump supports repeal and replacement of the Affordable Care Act (ACA) and a Medicaid block grant. The GOP plan would allow states to choose between block grant and a per capita cap financing for Medicaid. The new Administration could also make changes to Medicaid without new legislation.
1. How Would ACA repeal affect Medicaid?
A repeal of the ACA’s coverage expansion provisions would remove the new eligibility pathway created for adults, increase the number of uninsured and reduce the amount of federal Medicaid funds available to states. The Supreme Court’s 2012 ruling on the ACA effectively made the Medicaid expansion optional for states. As of November 2016, 32 states (including the District of Columbia) are implementing the expansion. The full implications of repeal will depend on whether the ACA is repealed in whole or in part, whether there is an alternative to the ACA put in place and what other simultaneous changes to Medicaid occur. However, examining the effects of the ACA on Medicaid provide insight into what might be at stake under a repeal.
What happened to coverage? The ACA expanded Medicaid eligibility to nearly all non-elderly adults with income at or below 138% of the federal poverty level (FPL) – about $16,396 per year for an individual in 2016. Since summer of 2013, just before implementation of the ACA expansions, through August 2016 about 16 million people have been added to Medicaid and the Children’s Health Insurance Program. While not all of this increase is due to those made newly eligible under the ACA, expansion states account for a much greater share of growth. States that expanded Medicaid have had large gains in coverage, although ACA related enrollment has tapered. From 2013 to 2016 the rate of uninsured non-elderly adults fell by 9.2% in expansion states compared to 6% in non-expansion states.
What happened to financing? The law provided for 100% federal funding of the expansion through 2016, declining gradually to 90% in 2020 and beyond. Expansion states have experienced large increases in federal dollars for Medicaid and have claimed $79 billion in federal dollars for the new expansion group from January 2014 through June 2015. Studies also show that states expanding Medicaid under the ACA have realized net fiscal gains despite Medicaid enrollment growth initially exceeding projections in many states.
What other Medicaid provisions were in the ACA? The ACA required states to implement major transformations to modernize and streamline eligibility and enrollment processes and systems. The ACA also included an array of new opportunities related to delivery system reforms for complex populations, those dually eligible for Medicare and Medicaid and new options to expand community-based long-term care services.
2. What would changes in the financing structure mean for Medicaid?
A Medicaid block grant or per capita cap policy would fundamentally change the current structure of the program. These policies are typically designed to reduce federal spending and fix rates of growth to make federal spending more predictable, but could eliminate the guarantee of coverage for all who are eligible and the guarantee to states for matching funds. States would gain additional flexibility to administer their programs but reduced federal funding could shift costs and risk to beneficiaries, states, and providers.
How would it work? Block grants or per capita caps could be structured in multiple ways. Key policy decisions would determine levels of federal financing as well as federal and state requirements around eligibility, benefits, state matching requirements, and beneficiary protections. Previous block grant proposals have determined a base year financing amount for each state and then specified a fixed rate of growth for federal spending. Under a Medicaid per capita cap, the federal government would set a limit on how much to reimburse states per enrollee. Payments to states would be based on per enrollee spending multiplied by enrollees. Spending under per capita cap proposals fluctuate based on changes in enrollment, but would not account for changes in the costs per enrollee beyond the growth limit. To achieve federal savings, the per capita growth amounts would be set below the projected rates of growth under current law.
What are the key policy questions? Key questions in designing these proposals include: what new flexibility would be granted to states, what federal requirements would remain in place, what requirements would be in place for state matching funds, what is the base year and growth rates, and how would a potential repeal of the ACA work with a block grant proposal? Given the lack of recent administrative data, setting a base year could be challenging. These financing designs could lock in historic spending patterns and variation in Medicaid spending across states, resulting in states deemed “winners” or “losers.”
What are the implications? Capping and reducing federal financing for Medicaid could have implications for beneficiaries, states, and providers including: declines in Medicaid coverage or new financial barriers to care; limited funding for children (the majority of Medicaid enrollees) as well as the elderly and those with disabilities (populations that represent the majority of Medicaid spending); reduced funding for nursing homes and community-based long-term care (Medicaid is the largest payer of these services); reductions in federal revenues to states and Medicaid revenues for safety-net providers. A block grant would not adjust to increased coverage needs during a recession. Block grants or per capita caps would not adjust to changes in health care or drug costs or emergencies. Recently Medicaid costs have increased due to high cost specialty drugs and Medicaid has been used to help combat the growing opioid crisis.
3. How could Medicaid be changed through administrative actions?
The Administration could make changes to Medicaid without changes in legislation.
How can changes be made through guidance? A new administration can reinterpret existing laws through new regulations and new sub-regulatory guidance. While there are rules that govern how to change regulations, a new administration has more flexibility to issue or amend sub-regulatory guidance, such as state Medicaid director letters. Rules promulgated by the Obama administration could be rolled back or changed.
How can changes be made through waivers? Throughout the history of the Medicaid program, Section 1115 waivers have provided states an avenue to test and implement demonstrations that, in the view of the Health and Human Services Secretary, advance program objectives but do not meet federal program rules. Longstanding federal policy has required waivers to be budget neutral for the federal government.
What kind of waivers may be considered? Seven states are using waivers to implement the ACA Medicaid expansion, including Indiana. The Indiana waiver, implemented under then Governor Pence, includes provisions to impose: premiums on most Medicaid beneficiaries; a coverage lock-out period for individuals with incomes above the poverty level who fail to pay premiums; health savings accounts; and healthy behavior incentives. The Obama administration has not approved waivers that would require work as a condition of Medicaid eligibility. It also has denied Ohio’s waiver request to impose premiums regardless of income and exclude individuals from coverage until all arrears are paid on the basis that this would restrict or undermine coverage from existing levels. Many other states are using waivers to implement payment and delivery system reforms. The incoming administration could decide whether or not to renew existing waivers and can approve a new set of waivers to promote its own program goals.
Policymakers, health care providers, and policy analysts continue to call for “delivery system reform”—changes to the way health care is provided and paid for in the United States—to address concerns about rising costs, quality of care, and inefficient spending. The Affordable Care Act (ACA) established several initiatives to identify and test new health care payment models that focus on these issues. Many of these ACA programs apply specifically to Medicare, the social insurance program that provides coverage to 57 million Americans age 65 and older and younger adults with permanent disabilities.
This Primer describes the framework and concepts of three payment models that CMS is currently testing and implementing within traditional Medicare—medical homes, ACOs, and bundled payments. Combined, these three models account for care provided to over 10 million Medicare beneficiaries and are frequently cited by media, researchers, and policymakers as current examples of ongoing delivery system reforms. Within each of these three broad models, the Centers for Medicare and Medicaid Services (CMS) is testing a variety of individual payment approaches and program structures. This Primer reviews each of the models, including their goals, financial incentives, size (number of participating providers and beneficiaries affected), and potential beneficiary implications. It also summarizes early results with respect to Medicare savings and quality.
Preliminary results from these models are somewhat mixed at this point, with some models showing more promise than others. This might be expected given their early stages, the diverse number of approaches being implemented, and methodological challenges associated with calculating savings. Many of the models are meeting quality targets and showing improvements in quality of care, but to date, overall net savings to Medicare are relatively modest, with large variation between models as well as among the individual programs running within them. More results are expected to be released in the future, and new models launched in 2016—several of which are designed to address issues raised by stakeholders with respect to the initial model designs.
Looking ahead, as more results become available, a key question is how Medicare patients fare in these delivery system reform models, especially those with the greatest health care needs. The answer, along with performance on overall spending and quality, will help policymakers identify which models to pursue or discard, which to alter, and what might be needed to disseminate successful models more broadly.
Executive Summary
The Affordable Care Act (ACA) established several initiatives to identify new payment approaches for health care that could lead to slower spending growth and improvements in the quality of care. Many of these new delivery system reforms are currently being implemented and tested in traditional Medicare. This Primer describes the framework and concepts of three broad alternative payment models—medical homes, ACOs, and bundled payments—and reviews their goals, financial incentives, size (number of participating providers and beneficiaries affected), and potential beneficiary implications. It also summarizes early results with respect to Medicare savings and quality.
Context for Delivery System Reform in Medicare
Delivery system reform in Medicare focuses on shifting a portion of traditional Medicare payments from fee-for-service (FFS) (which reimburses based on the number of services provided) to payment systems that incorporate some link to the “value” of care as determined by selected metrics, such as patient outcomes and Medicare spending. The Department of Health and Human Services has announced a goal to have 90 percent of traditional Medicare payments linked to quality or value by 2018.1 The agency also reports that it has met its goal of having 30 percent of Medicare payments tied specifically to alternative payment models (such as Accountable Care Organizations (ACOs), bundled payments, and medical homes) by the end of 2016, and expects to reach 50 percent by the end of 2018.2Additionally, recent legislation to reform Medicare payments for physician services, the Medicare Access and CHIP Reauthorization Act (MACRA), includes bonus payments for physicians and other health professionals who participate in qualifying alternative payment models.3
To establish a central place for designing, launching, and testing new payment models, the ACA created the Center for Medicare and Medicaid Innovation (CMMI), also referred to as the “Innovation Center,” housed within CMS. The ACA granted CMMI wide authority to design and test new models that aim to either lower spending without reducing the quality of care, or improve the quality of care without increasing spending.4 The intent of designing and launching multiple new models is that the cream of all of these approaches will rise to the top, providing direction as to what works and what does not—so best practices can be quickly disseminated across the country. In fact, the ACA gives CMMI unprecedented authority to expand models across the U.S. when they are found to be successful.
Medical Homes, ACOs, and Bundled Payments
Medical homes, ACOs, and bundled payment models, combined, account for care provided to over 10 million Medicare beneficiaries5 and are frequently cited by media, researchers, and policymakers as major examples of delivery system reforms implemented widely across the U.S.6 These models are described briefly below:
Medical homes are team-based models of patient care that rely heavily on the primary care practice (provider and care team) as the main and central source for delivery and coordination of the majority of health, illness, and wellness care for Medicare beneficiaries. Health insurers that support the medical home model typically provide monthly care management fees or other payments in addition to fee-for-service reimbursement for activities related to patient care and coordination.
ACOs are groups of doctors, hospitals, and other health care providers who agree to share collective accountability for the quality and cost of care delivered to the patients attributed to their ACO. Payments to ACOs incorporate varying levels of financial incentives in the form of shared savings or losses (sometimes referred to as bonuses or penalties) for performance on identified spending and quality metrics.
Bundled payments focus on discrete episodes of care by establishing an overall budget for services provided to a patient receiving a course of treatment for a given clinical condition over a defined period of time. In contrast to paying for each service individually, bundled payments provide incentives for providers to come in “under budget” for episodes of care.
Within each of these three delivery system reforms, CMS is managing the implementation and assessment of multiple payment models (Table 1).
Table 1: Medical Homes, Accountable Care Organizations (ACOs), and Bundled Payment Models
Delivery System Reform
CMS/CMMI Models
Medical Homes (Advanced Primary Care)
Multi-Payer Advanced Primary Care Practice (MAPCP)
Comprehensive Primary Care (CPC)
Federally-Qualified Health Center (FQHC) Advanced Primary Care Practice*
Independence at Home (IAH)
Comprehensive Primary Care Plus (CPC+)
Accountable Care Organizations (ACOs)
Medicare Shared Savings Program (MSSP) (Tracks 1-3)
Advance Payment ACO
ACO Investment Model
Pioneer ACO
Next Generation ACO
Bundled Payment
Bundled Payment for Care Improvement (BPCI) Models 1–4–Focus of bundles:
Model 1: Inpatient hospital services
Model 2: Inpatient hospital, physician, and post-acute services
Model 3: Post-acute services
Model 4: Inpatient hospital and physician services
Oncology Care Model (OCM)
Comprehensive Care for Joint Replacement (CJR)
NOTE: Centers for Medicare and Medicaid Services (CMS); Center for Medicare and Medicaid Innovation (CMMI). All programs listed above are managed by CMMI, with the exception of the MSSP. *The FQHC/APCP model ended in October 2014.
Ongoing Evaluation of these Models and Programs
The ACA requires that each model managed by CMMI be evaluated for changes in both spending and quality of care provided.7 In fact, the ACA incorporates assessments of both quality and cost in the criteria for granting the Secretary of Health and Human Services the authority to expand models nationally if they either reduce spending without reducing the quality of care or improve the quality of care without increasing spending.8
By working with many types of providers who are treating a variety of patients in various kinds of facilities, CMMI is evaluating cost and quality not just for the models overall, but also how these results may differ based on other variables, such as patient and provider characteristics. CMS is also examining the attractiveness of the models to providers based on model participation rates, feedback from participants regarding the process (challenges, barriers, success strategies, etc.), and other operational, quantitative, and qualitative measures.
Preliminary results from these models are modest and mixed at this point, with some models showing more promise than others (Table 2). This might be expected given their early stages, the diverse number of approaches being implemented, and methodological challenges associated with calculating savings. Many of the models are meeting quality targets and showing improvements in quality of care, but to date, overall net savings to Medicare are relatively modest, with large variation between models as well as among the individual programs running within them. Given the difference in beneficiary counts, care models, and evaluation time periods for each model, it is difficult to compare the relative magnitude of savings among them.
Table 2: Summary of Early Results for Medical Home, ACO, and Bundled Payment Models
Delivery System Reform
CMS/CMMI Model Results
Medical Homes (Advanced Primary Care)
Savings: In the MAPCP model, one state out of eight achieved savings over the first two years, net of care management fees. Although the CPC model almost broke even in the second year, neither it nor the FQHC/APCP model achieved savings net of care management fees in the first two years. In contrast, the IAH model, which has no care management fees and focuses on providing care to chronically ill patients in their own homes, achieved savings—over $25 million in year 1 and over $10 million in year 2.
Quality: Small differences in quality were found between CPC practices and comparison primary care practices, as well as between FQHCs participating in the APCP model compared with FQHCs not participating. In year 1 of the IAH model, all participating practices met quality goals on at least three of six quality measures; in year 2, all participating practices showed further improvement from the previous year on at least two of six quality measures.
Provider participation: Generally stable across models.
Accountable Care Organizations (ACOs)
Savings: From the most recently available results, both MSSP and Pioneer ACOs had lower beneficiary expenditures than their benchmarks in 2015. For MSSPs, bonus payments exceeded savings, resulting in a total net cost of $216 million. For Pioneer ACOs, net savings after bonuses totaled under $1million. Nearly one third of the MSSP ACOs and half of the Pioneer ACOs received shared savings. The CMS Office of the Actuary certified the Pioneer ACO model as cost-saving.
Quality: In addition to quality improvements over time, CMS states that ACO performance on quality measures is comparably as good as or better than the traditional Medicare program overall. ACOs that participated for multiple years performed better on quality measures and were more likely to share in savings than those that withdrew.
Provider Participation: The number of MSSP ACOs has about doubled, growing from about 200 MSSP ACOs in the initial year to over 400 in 2016. Participation in the Pioneer ACO model declined to 9 from its initial count of 32; several of the withdrawing Pioneer ACOs became MSSP ACOs.
Bundled Payments
Savings: In the most prevalent model (Model 2), first year results show spending differences between BPCI and control group episodes in 2 out of 6 clinical categories. Namely, for orthopedic surgery (mostly hip and knee replacements), Medicare payments declined more for BPCI episodes than for their control group’s episodes; in contrast, for spinal surgery, spending increased more for the BPCI episodes relative to the control group. For the other clinical categories in Model 2, as well as most other categories in the other 3 BPCI models, results did not show significant differences in spending between BPCI and control group episodes.
Quality: Most clinical episode groups across the 4 BPCI models did not differ on quality outcomes relative to comparison episodes. When differences were detected, they varied both between BPCI models and within the models by several factors, including: clinical episode groups (e.g., orthopedic, cardiovascular, etc.), whether or not beneficiaries had a surgical procedure, and whether or not beneficiaries received post-acute care.
Provider Participation: 2 of the 4 models grew steadily in provider participation during the first year, but the other two 2 models experienced multiple withdrawals among their participants.
SOURCES: Individual evaluation reports and CMS documentation are cited for each result in the next section of this Primer.
Implications for Medicare Beneficiaries
Questions about how beneficiaries are involved in these new payment approaches and the implications these models have on beneficiary care—particularly for those with multiple chronic conditions—are key issues, yet at this stage, the answers are not well understood. For the most part, Medicare beneficiaries in these models do not experience any changes in their Medicare benefits, as they are not required to see certain providers and do not experience differences in their levels of cost-sharing. Accordingly, even though beneficiaries are notified of their providers’ participation in these models, it is not clear that beneficiaries are aware of their “attribution” to them, nor the inherent implications of the model’s payment incentives for less costly care. Beneficiaries whose primary care provider is transforming their practice into a medical home may notice differences in the delivery of their care—for example, greater reliance on clinical teams and electronic health records—but for the ACO and bundled payment models, beneficiaries would not necessarily notice changes in care practices.
On the one hand, having Medicare attribute beneficiaries to these new delivery models is least disruptive to beneficiaries and places greater responsibility on the providers to engage with their patients and deliver better quality care. It is also less susceptible to selection issues, whereby beneficiaries with higher health costs may be somehow discouraged from enrolling in an ACO or medical home. On the other hand, some analysts propose that beneficiaries could play a greater role in lowering health care costs and improving quality if they took a more active role in selecting a medical home or ACO and encountered incentives to see providers affiliated with or recommended by their ACO or medical home, or if the providers did more to actively engage them. (CMS is exploring several of these approaches via new ACO models that started in 2016.)
Issues about directing patients to certain providers also play a role in bundled payment approaches. For example, when beneficiary and provider incentives are aligned, patients leaving the hospital may seek or receive recommendations for post-acute providers and settings that deliver high-quality care at relatively lower overall costs. However, other considerations, such as patient convenience and the absence of family caregiver support are factors that may play a far greater role in beneficiary preferences than provider interests. These issues highlight the need to monitor care provided to the vulnerable patients in these models of care and to institute patient protections if quality and access problems are found.
Looking Ahead
In traditional Medicare, delivery system reforms and alternative payment models are being implemented and tested to determine how they might encourage better care coordination for patients across settings—particularly for those patients with chronic conditions and high health care needs—while simultaneously reducing provider inefficiencies and potentially lowering costs (or cost growth) for Medicare. By design, these goals are intrinsic to these models, and stakeholders (including CMS, other payers, providers, patients/ consumers, and the Congress) naturally want to see real-world results from their investments as soon as possible. This pressure presents a clear tension between the desire for immediate results versus the time it takes to test fully-implemented interventions.
CMS’s commitment to “rapid cycle” improvements in the demonstrations means that CMS is able to refine the payment models as they are being implemented in light of early results and unforeseen circumstances.9 While potentially advantageous, tracking and monitoring the changes will be difficult, and designing evaluations that can hold constant all other factors, including site-specific variables, to determine definitively what works and what does not, presents methodological challenges.10 Additionally, the evaluation of medical homes, ACOs, and bundled payments are conducted separately, which may preclude assessing how they might work together in a coherent way.
CMMI has also launched a number of new models in 2016, several of which are designed to address issues raised by stakeholders with respect to the initial model offerings. For example, new ACO and bundled payment models, described later in this Primer, will provide advance payments to providers to address their concerns about start-up resources needed for transforming their patient care and business models. CMMI is also offering models that aim to inform and engage beneficiaries about the goals of the new payment approaches. Consumer involvement has not, as yet, been a major component of delivery system reform, particularly outside of medical home models. It will be helpful in future models to see how beneficiaries’ understanding of the models affects provider approaches, changes in service utilization, and patient outcomes. With increased beneficiary involvement also comes the need to incorporate appropriate measures for beneficiaries who have cognitive impairments.
Introducing delivery system reform in Medicare is an extremely ambitious effort and one that comes with a number of challenges. Health care is changing rapidly, and while it is difficult to guarantee a controlled experiment in which only the changes of interest (typically targeted payment incentives) are allowed to vary, understanding the ability of providers to lower costs while maintaining or improving quality may help illuminate the ingredients of success (or failure). Ultimately, a key consideration for CMS and Congress to track is how Medicare patients fare in these delivery system reform models, especially those with the greatest health care needs. This issue, along with overall spending and quality, will help policymakers identify which models to pursue, and what it will take to disseminate the most successful payment and delivery models more broadly.
Report
Medical Homes, Accountable Care Organizations (ACOs), and Bundled Payments: Descriptions and Summaries of Early Evidence
Medical Homes
What is a Medical Home?
The medical home—also called an advanced primary care practice model or a patient-centered medical home—is a team-based approach to patient care that is intended to provide comprehensive care and serve as the medical practice which provides for the majority of their patients’ health care needs.11 When seeking care, medical home patients either obtain care from their medical home directly, or the medical home coordinates their care with another provider. Overall management of care in a medical home is generally led by a primary care clinician—often a physician, but it may also be another health professional, such as a nurse practitioner.12 Health insurers that support the medical home model typically provide monthly care management fees or other resources to the practice to support certain activities. These include care management and coordination, communication with patients outside of office visits for acute, chronic, and preventive health care needs (including by email, internet “portals,” and telephone), and data collection for reporting patient outcomes and quality improvement. CMMI is supporting the transformation of primary care practices into medical homes through grant funding and technical assistance for several models. Among them, CMS has released results on savings and quality (detailed in Table 3) for the following four models located across the country (Figure 1):
Figure 1: Medical Home Models
Multi-Payer Advanced Primary Care Practice (MAPCP) – The MAPCP model tests if medical homes that receive monthly care management fees for most of their patients across multiple insurers (including but not limited to Medicare) perform better on quality and spending measures than either (a) medical homes without payer alignment of these fees (non-MAPCP medical homes); or (b) practices which are not medical homes. State agencies coordinate the medical practice requirements and monthly care management fees across Medicare, Medicaid, and commercial insurers.
Comprehensive Primary Care (CPC) – Similar to the MAPCP model, the CPC model is also testing a multi-payer approach for medical homes. However, CMMI—rather than the state—is playing the major role in convening insurers to combine resources to provide care management fees to medical homes, provide data feedback on patient utilization, and implement quality and efficiency incentives that are aligned across all insurers. Participating payers provide practices with care management fees and an opportunity for regional shared savings. They also share data on cost and utilization to give practices information on their patients’ total spending.
Federally-Qualified Health Center (FQHC) Advanced Primary Care Practice (APCP) – The FQHC/APCP model, which ended in 2014, tested effects on the cost and quality of care for Medicare beneficiaries served by FQHCs. Each participating FQHC was paid monthly care management fees per Medicare beneficiary to support services and activities associated with requirements for patient-centered medical homes. An additional goal of the FQHC/APCP model was to help FQHCs achieve recognition by the National Committee for Quality Assurance for as a “Level-3” medical home.
Independence at Home (IAH) – The IAH model is testing effects on health outcomes and Medicare spending when primary care services are provided to chronically ill beneficiaries in their own homes. Although IAH practices have the same home visit coverage in traditional Medicare as other practices, IAH practices are uniquely eligible for incentive payments for meeting quality and spending targets. Unlike MAPCP and CPC, IAH providers are not paid monthly care management fees.
Conceptually, How Could Medical Homes Improve Quality and Reduce Costs?
The overarching goals of medical homes are to improve clinical outcomes and patient experience while reducing overall health costs through reductions in unnecessary and avoidable acute care services and long-term expenses associated with chronic illness and its complications. In fully implemented models, the medical home relies on several features: a care team (including clinicians, care managers and coordinators, social workers, and when applicable, pharmacists community health workers, and others); health information technology; standardized preventive and acute care consistent with evidence-based guidelines; patient and family engagement in care and medical decision-making; access to clinicians outside of regular office hours; and consideration of the whole patient, inclusive of social, mental, and behavioral health and other issues.13 This model presumes that in addition to better patient care, it costs less on the whole to provide patients with comprehensive primary care than it does to cover the health care costs of patients who seek specialty services without care management and coordination by their primary care provider.
How Do Medical Homes Differ from the Status Quo in Traditional Medicare?
Aside from the recently established chronic care management code, medical practices, in general, may not bill Medicare separately for many activities that are outside of the direct provision of face-to-face medical care.14 Such activities could include care coordination with external providers taking place between a patient’s visits, information technology enhancements, follow-up phone communications with patients, and after-hours clinical access. Three of the medical home models being tested (MAPCP, CPC, and FQHC/APCP) provide additional payments in the form of supplemental per member per month fees to primary care providers that are intended, in part, to offset the costs of these activities whether or not they are performed in the presence of the patient. Additional costs defrayed by these care management fees include staffing expenses and infrastructure costs needed to perform functions of, or be recognized as, a medical home.
How Are Medicare Beneficiaries Involved in Medical Home Models?
Approximately 1.4 million beneficiaries are attributed to one of the four CMMI models of medical homes described in Table 3. A core concept of the medical home model of care is that the beneficiary be actively engaged and involved in their care. While these medical home models have beneficiary satisfaction and engagement measures as part of their quality indicators, the degree to which patients themselves are educated about the medical home model and informed about their role and options is not clear and varies across models. Even less clear is how well beneficiaries understand the model, even after receiving these explanations. In general, providers do not enroll beneficiaries in the CMMI medical homes; instead, eligible beneficiaries in traditional Medicare are attributed through a claims-based process by CMS. Beneficiaries are notified by mail or by a posted notification within the practice that their primary care provider is part of a medical home model being tested by CMMI. This notification also explains that beneficiaries may opt out of having CMS share their Medicare utilization and spending data with the medical home. Consistent with traditional Medicare, beneficiaries are free to seek services from other Medicare providers such as specialists at any time and are not required to obtain care from the medical home to which they are attributed.
What Are Some of the Implications for Beneficiaries in Medical Homes?
Beneficiaries whose primary care providers are converting to medical homes may encounter new care models that include greater reliance on clinical teams and electronic health records—which may or may not be features beneficiaries desire—and enhanced access to clinicians outside of office visits and after regular business hours. Patients with higher health risks are considered key targets for care management in medical homes, so patients with multiple chronic conditions may receive more frequent contact from their primary care practice to encourage them to maintain prescribed treatment protocols and to monitor their health. Beneficiaries in the IAH model are able to stay home to receive primary care services. While beneficiaries in medical homes may be receiving more advanced primary care services, this emphasis could possibly translate to the beneficiary as reluctance from their primary care providers to make referrals to specialists.
What Are Some of the Implementation Challenges with Medical Homes?
Implementation of the medical home model presents many practical challenges for both the primary care clinicians in medical homes and researchers examining their impact on care quality and spending. The key elements of the medical home—including expanded patient access, acute and preventive care management, and adoption of health information technology—represent changes to the process and design of current primary care practice. Accordingly, organizational and financial hurdles may surface when trying to transform practices into medical homes.15 Further, providers in medical homes report operational problems stemming from the lack of incentives for external providers and systems to interact with medical homes, minimal mechanisms for physicians to share in overall savings in certain models, and insufficient resources to hire additional staff and purchase infrastructure (such as electronic health record systems), particularly for models with little or no monthly care management fee structures.16
Medical home providers have also noted that beneficiaries do not have financial incentives to consult with their medical home prior to seeking specialty care or going to a hospital emergency department. Health services researchers face significant challenges evaluating the impact of medical home interventions on clinical outcomes, due to the variability in how these models are being implemented across the many sites involved, and the rapid cycle manner of continuously adapting and modifying interventions based on real-time feedback in the field. Additionally, there may be some self-selection issues among primary care practices that voluntarily joined the CMMI models, raising the potential for greater challenges with dissemination across primary care practices that may be less interested in the medical home model of care.
What Early Results Are Available for the Medical Home Models?
Early results from CMMI’s medical home and advanced primary care models are mixed (Table 3). In the MAPCP model, one state (Michigan) out of eight achieved savings over the first two years, net of care management fees. The CPC model almost broke even after care management fees, and the FQHC/APCP models experienced comparatively greater net losses, on average. In contrast, the IAH model, which focuses on providing care to chronically ill Medicare patients in their own homes, showed savings—over $25 million in its first year and over $10 million in its second year.17 Unlike the other medical home models, the IAH model does not pay monthly care management fees to providers. Given the difference in beneficiary counts for each medical home model, it is difficult to compare the relative magnitude of savings among the different models.
With respect to quality, evaluation results across the medical home models have found some improvement, but generally minimal effects across most measures. For the CPC model, patient-reported measures on their experience with the practice improved slightly more for CPC practices than for comparison groups, as did performance on quality measures for diabetes care. CMS also reports that for 2015, CPC quality scores improved overall compared to 2014. For the FQHC/APCP model, little difference was noted on quality measures between FQHCs that were participating in the medical home model and those that were not, and FQHCs had higher rates of emergency room visits compared to non-medical home FQHCs. In the first year of the IAH model, all 17 participating practices (including one consortium) met quality goals on at least three or six quality measures, such as lower hospital readmissions and greater follow-up contact between the patient and the provider after a hospital or emergency department discharge. In the second year, all 15 participating IAH practices further improved on at least two of six quality measures, and four practices met goals for all six quality measures.
Table 3: Medical Home Models in Medicare (Active in 2014 and 2015)
Multi-Payer Advanced Primary Care Practice (MAPCP)
Comprehensive Primary Care (CPC)
Federally-Qualified Health Center (FQHC) Advanced Primary Care Practice (APCP)
Independence at Home (IAH)
Description of Model; what is being tested
The MAPCP model is testing if medical homes that receive monthly care management fees for most of their patients, across multiple insurers, perform better on quality and spending measures than either (a) medical homes without payer alignment of these fees; or (b) practices which are not medical homes. State agencies coordinate the medical practice requirements and monthly care management fees across Medicare, Medicaid, and commercial insurers.
The CPC model is also testing a multi-payer approach for medical homes. Unlike the MAPCP model, CMMI—rather than the state—is convening insurers to combine resources to provide care management fees to medical homes and technical assistance and data feedback on patients’ total cost and utilization to practices. Quality and efficiency incentives are aligned across all insurers.
The FQHC/APCP model is testing effects on patient care and costs of care for Medicare beneficiaries served by FQHCs. Each participating FQHC was paid monthly care management fees per Medicare beneficiary to support services and activities associated with requirements for patient-centered medical homes.
The IAH model is testing effects on health outcomes and Medicare spending when primary care practices, which focus on providing services to chronically ill beneficiaries in their own homes, are able to share in financial savings if they meet specified quality and spending targets. Unlike the MAPCP and CPC models, IAH providers are not paid monthly care management fees.
Start date/ End date
Start date7/2011 (initial cohort)
Start date10/2012 (initial cohort)
Start date11/2011
Start date6/2012
End dateInitially, MAPCP was a 3-year demonstration but was extended through 2016 for 5 of 8 states
End dateExpected to end 12/2016
End date10/2014
End dateInitially, IAH was a 3-year model, but was extended by Congress for all participants an additional 2 years into 2017
Num./type of participants
5 states participating (as of 10/2016)b
481 primary care practices participating (as of 12/2015)c
434 FQHCs (as of 10/2014)d
13 home-based primary care practices and 1 consortium (as of 8/2016)e
Num. Medicare beneficiaries
Over 900,000 beneficiaries at the end of year 3b
Over 376,000 Medicare beneficiaries (as of 12/2015)c
AR, CO, NJ, OR, and specified regions of NY, KY/OH, OK (as of 1/2016)
All states and DC, except DE, NV, UT, and VT (as of 10/2014)
DE, DC, FL, MA, MI, NY, NC, OH, OR, PA, TX, VA, WI (as of 1/2016)
Payment arrangements
Care management feesMedical homes in MAPCP models receive Medicare care management fees of about $10 per beneficiary per month, varying by state, in addition to fees paid by other insurers. The care management fees are paid in addition to regular fee-schedule payments in traditional Medicare.
Care management feesMedical homes in CPC models receive an average of $18-20 per beneficiary per month from Medicare in years 1 and 2 (decreasing to $15 in years 3 and 4), in addition to fees paid by other insurers. Like the MAPCP, these care management fees are on top of regular Medicare fee-schedule payments.
Care management feesFQHCs received Medicare care management fees of $18 per beneficiary per quarter, in addition to payments received for Medicare services rendered.
Care management feesIAH practices do not receive any care management fees.
Other payments and financial incentivesMedical homes may receive additional payments for meeting medical home accreditation. Medicare payments in some states may support community health teams and state’s operational expenses for the MAPCP. In PA, medical homes can share in savings.
Other payments and financial incentivesCPC practices can share in financial savings to Medicare, based on (a) risk-adjusted, practice-level performance on quality and patient experience measures; and (b) regional (market-level) utilization measures.
Other payments and financial incentivesFQHCs received financial support from the Health Resources and Services Administration (HRSA) to help with costs associated with becoming a medical home.
Other payments and financial incentivesIAH practices share savings when at least 3 of 6 quality standards and reducing total costs based on projected FFS expenditures.
Early results
SavingsIn the first two years of MAPCP, 6 of 8 states had savings net of care management fees, but savings were only significant in one state (Michigan). At $336 million, these savings were considerably larger than in the other states.a
Savings In the first three years, CPC did not yield total net savings to Medicare when factoring in expenditures on care management fees.c, g In year 2, CPC practices lowered gross Medicare spending on services (by $11 on average per beneficiary; $91.6 million cumulatively) but Medicare expenditures on care management fees exceeded these savings (averaging $18 per beneficiary; cumulative amount unreported).g In year 3, CPC produced $57.7 million in gross savings, but spent $58 million in care management fees.c
SavingsIn a little more than the first two years (9 quarters) the FQHC/APCPs did not achieve savings, relative to FQHCs not participating in the APCP medical home model. A final evaluation is pending.h
SavingsIn the first year, the IAH model produced net Medicare savings totaling over $25 million. CMS paid no care management fees.f, i–In the second year, the IAH model produced net Medicare savings totaling over $10 million.j
QualityAcross the first two years, there were few significant differences in quality between MAPCP medical homes and non-MAPCP. On process measures (e.g., diabetes tests, screenings), results showed measure-by-measure and state-by-state variation in MAPCP performance. On preventable hospitalizations and composite prevention scores, most states had no significant differences between their MAPCP and control group.a
QualityAcross the first two years, patient-reported experience measures improved slightly more for CPC practices than for comparison groups, as did performance on quality measures for diabetes care. In the third year (2015), CMS states that CPC practices demonstrated lower than expected hospital admissions and readmission rates, and favorable performance on patient experience measures.c
QualityOn most quality measure categories (40 of 46), participating (medical home) FQHCs did not perform better than non-participating FQHCs and had higher Medicare utilization and rates of emergency room visits among its Medicare beneficiaries.h
Quality In the first year, all IAH practices met quality goals on at least 3 of 6 designated measures. On average, IAHs had fewer hospital readmissions and met quality standards for follow-up and medication management after hospital discharges, and lower rates of hospital use for certain chronic conditions.fIn the second year, all practices further improved on at least 2 of 6 quality measures; 4 practices met goals for all 6 quality measures.k
ParticipationNo participants discontinued during initial study period; 6 of 8 states were offered opportunity to continue after 2014, of which 5 elected to extend through 2016.a
ParticipationParticipation decreased from 502 practices in the first year to 481 in 2015. 2 of 31 insurers discontinued participation in 2013, with no change in 2014.c, g
ParticipationThe number of FQHC medical homes decreased from 500 to 434.j
ParticipationParticipation decreased from 17 practices in year 1 to 15 practices in year 2.f, k
What are the Newest Medical Home Models to be Introduced?
Comprehensive Primary Care Plus (CPC+) Model – After the conclusion of the CPC model at the end of 2016, current participants and new practices will have the opportunity to transition into (or join) the CPC+ model in January 2017. CMS projects that the new CPC+ model will have a greater number of participants (up to 5,000 practices in 20 regions) compared to the CPC model. All CPC+ practices will receive a prospective Medicare care management fee, as in the CPC model; however, CPC+ practices will also receive a pre-paid incentive for meeting quality and utilization benchmarks that, if not met, will be recouped by CMS. Also, the CPC+ model will include two payment tracks to accommodate practices that are more or less advanced in their existing medical home capabilities. CPC+ practices will receive higher prospective payments under track 2 than track 1, but lower standard office visit payments—a hybrid payment arrangement that CMMI designed to provide a greater incentive for care management outside of face-to-face encounters. In August 2016, CMMI selected 14 regions for the CPC+ model. CMMI estimates that up to 5,000 primary care practices serving an estimated 3.5 million beneficiaries could participate in the model.
Accountable Care Organizations (ACOs)
What is an ACO?
ACOs are groups of doctors, hospitals, and other health care providers who form partnerships to collaborate and share accountability for the quality and cost of care delivered to Medicare beneficiaries who are attributed to their ACO. Medicare payments to ACOs incorporate financial incentives for their performance on specified spending and quality metrics for their attributed beneficiaries. These financial incentives—in the form of shared savings or losses (sometimes referred to as bonuses or penalties)—are paid to, or collected from, the ACO rather than being divided among the individual providers or facilities that treated each of the ACO’s attributed beneficiaries. ACOs can be comprised of physicians only, or include hospitals and other providers, as well. CMS and CMMI are currently implementing several ACO models across the U.S. (Figure 2), including the following three, for which early results are described in Table 4:
Figure 2: Accountable Care Organization (ACO) Models
Medicare Shared Savings Program (MSSP) ACOs — The MSSP is a permanent ACO program in traditional Medicare that provides financial incentives for meeting or exceeding savings targets and quality goals. The MSSP allows ACOs to choose between sharing in both savings and losses, or just savings. Overwhelmingly, for 2016, most ACOs are in models which only include potential for shared savings. MSSPs are accountable for at least 5,000 assigned Medicare beneficiaries.
Pioneer ACOs — Like the MSSP, the Pioneer ACO model is designed to assess the effects of providing ACOs with financial incentives to lower overall spending and maintain or improve care quality. However, unlike most MSSP ACOs, all Pioneer ACOs are required to pay back CMS if spending exceeds a target amount. Thus, all Pioneers accept both upside and downside risk. Also, Pioneer ACOs enter the model already having experience accepting risk through contracts with other payers and are accountable for at least 15,000 assigned Medicare beneficiaries.
Advanced Payment ACOs — The Advance Payment ACO model is a subset of the MSSP. It provides up-front payments to ACOs to support infrastructure development and operations. The Advance Payment ACO model assesses whether or not these early investments increase participation in the MSSP among smaller and/or rural providers. Advance Payment ACOs also receive monthly, population-based payments and can share in savings, if realized after CMS recoups the additional advance payments.
Conceptually, How Could an ACO Improve Care and Reduce Costs?
The basic assumption underlying the ACO model of care is that patient care is improved and less fragmented when providers have a financial incentive to work together to coordinate care. Under this premise, joint accountability among providers may lead to lower costs and better quality, such as reductions in unnecessary or duplicative testing, fewer medical errors, and lower rates of hospitalizations due to exacerbations of chronic conditions and medical complications.18 The ACO model is designed to reward providers financially for working together, sharing information, and coordinating care, especially for high-risk and high-cost chronically-ill patients. In addition to overall Medicare spending, CMS also factors in performance on quality measures to determine final payments to ACOs. Accordingly, quality and cost savings intersect in the overall incentive structure of the ACO model.
How Are ACOs Different from the Status Quo in Traditional Medicare?
In traditional Medicare, providers do not receive bonuses or penalties tied to the overall net spending for their patients in a given time period; rather, they receive payment for the care they provide in their own practices/facilities. When Medicare spends less on patients in an ACO—netted across all settings—than their target amount (based, in part, on national spending in traditional Medicare), the ACO shares in the Medicare savings. Pioneer ACOs and a small number of MSSP ACOs are also at a financial risk when the reverse happens: when their spending is higher than expected, they owe CMS a portion of the “excess” cost (i.e., a penalty). When applicable, shared-savings payments offer ACO providers the opportunity to gain additional revenue without providing additional care. Savings and losses may be shared across partnering providers as an incentive for furnishing high quality care and, in the case of shared savings, to offset costs associated with services and staff needed to effectively implement their care protocols.
In theory, as a result of these incentives, greater coordination between the various providers and across settings distinguishes care delivered by ACO providers from non-ACO providers in traditional Medicare. This coordination may occur in a variety of ways. For example, care coordinators or care managers may work with individual patients as navigators and advocates, reaching out to patients in between visits to the physician. Coordination may also occur through the sharing of information via electronic health records and health information exchanges, so that all providers have timely access to complete and current information. Similar to the medical home model, in the ACO model, the primary care provider or medical practice ideally coordinates all patient care to reduce fragmentation of care across different specialists and facilities. Additionally, ACOs may have incentives to encourage patients to seek care at lower-cost settings, provided the care meets the patients’ needs.
How Are Medicare Beneficiaries Involved with ACOs?
As of January 2016, almost 9 million Medicare beneficiaries were attributed to an ACO.19 CMS attributes beneficiaries to ACOs based on fairly complex claims analyses, which vary based on the type of ACO, but generally reflect beneficiaries’ link to a primary care practice affiliated with an ACO. By and large, beneficiaries do not actively select (or enroll in) an ACO; rather, they are informed of their attribution by their provider and can opt-out if they do not wish their data to be shared with other providers. Pioneer ACOs may submit attestations from beneficiaries regarding their desire to be attributed or not attributed to the ACO. Consistent with traditional Medicare, beneficiaries are free to seek services from any provider who will see them, so there is no “lock-in” from the beneficiary’s standpoint and they have no obligation or financial incentive to stay within the ACO and its network of providers. In newer ACO models, CMS is testing ways for beneficiaries to indicate or verify whether they consider their assigned ACOs to be their main provider (described later in this section).
What Are Some of the Implications for Beneficiaries in ACOs?
Essentially, Medicare beneficiaries attributed to ACOs do not experience any difference in their traditional Medicare benefits. In many cases, they may not be aware that their physician is part of an ACO and that CMS has attributed them to one, despite having received notification with this information or being told by their doctor. On the one hand, this attribution method is the least disruptive to beneficiaries and places greater responsibility on the providers to engage with beneficiaries and provide better quality care. It is also less susceptible to selection issues, whereby beneficiaries with lower health costs are somehow encouraged to “join” an ACO, either through an enrollment process or through their selection of a primary care physician. On the other hand, some analysts propose that beneficiaries could play a greater role in lowering health care costs if they understood how Medicare and ACO incentives are aligned, and if they had incentives to see providers in their ACO and participate in care management activities. Further, when providers and Medicare share in savings, some propose that beneficiaries could as well. In newer ACO models, CMS is exploring ways for beneficiaries to receive financial incentives from CMS for seeking care from ACO providers (described later in this section).
While analyses of Pioneer ACOs and MSSP ACOs finds that beneficiaries attributed to ACOs are demographically similar to beneficiaries in comparison groups in the same market areas, additional research is needed to examine how Medicare beneficiaries in ACOs compare to the general Medicare population.20 In particular, it would be useful to understand the extent to which ACOs across the country are serving high-cost and high-need populations—such as beneficiaries with multiple chronic conditions and beneficiaries dually covered by Medicare and Medicaid.
What Are Some of the Implementation Challenges with ACOs?
Policy analysts, researchers, and ACOs providers have raised a number of challenges associated with implementing ACOs. For example, some have cited that the infrastructure costs for ACOs are front-loaded with start-up expenses including: hiring and training of staff; creation of partnerships; design and implementation of coordination tools, such as electronic health record (EHR) upgrades; and process changes. These investments may take years to recoup—if at all—through future shared savings. Further, the up-front investments serve the entire patient population of that practice, not just the Medicare ACO patients. Yet if savings are achieved, they only reflect amounts associated with Medicare ACO patients and therefore do not account for savings realized by other payers. CMS is also faced with challenges determining the best benchmark upon which to measure spending performance. ACOs have noted that benchmarks which incorporate ACOs’ spending history make it more difficult for high-saver ACOs to perform better in future years. CMS is offering new methods for benchmarking in future years to address some of these concerns.
Another implementation challenge involves how beneficiaries are attributed to each ACO based on a CMS claims analysis, as described above. As with the medical home models, because beneficiaries do not take an active role in selecting an ACO and have no obligation or financial incentive to stay within the ACO and its network of providers, ACOs have little control over costs that may result from out-of-ACO utilization. The challenge for ACO providers lies in educating and engaging beneficiaries about their health care and reasons for staying within the ACO network. This issue is magnified by the retrospective process of beneficiary attribution to ACOs in the MSSP (for 2015 and earlier), preventing the ACOs from knowing at the point of care whether they will ultimately be held accountable for the beneficiary. Addressing this concern, CMS provides ACOs with a prospective list of likely assigned beneficiaries, but the final payment reconciliation is based on retrospective assignment. Pioneer ACOs have more opportunities to know with certainty their attributed beneficiaries because Pioneer ACOs may submit attestations from beneficiaries regarding their desire to be attributed/not attributed to the ACO, and beneficiaries who were part of the ACO in previous years may be prospectively attributed.
Another consideration that has been raised is the potential for ACOs to contribute to the current trends for market consolidation through hospital and health system mergers and the purchase of physician practices.21 When a limited number of health systems consume a large portion of a market area, they may have the ability to drive up health care spending, particularly for non-Medicare insurers.
What Early Results Are Available for the ACOs?
Medicare ACOs are, by most accounts, showing mixed results, with most ACOs reaching quality benchmarks, but realizing relatively modest or no savings on net.22 From the most recently reported results, for 2015, less than one third of the MSSP ACOs and half of the Pioneer ACOs earned shared savings bonuses because their total spending was low enough (compared to their benchmark) and their quality scores were high enough. Among the Pioneer ACOs that did not receive shared savings bonuses, a small share owed CMS payments to account for spending over their benchmarks. About one quarter of the Advance Payment ACOs, a subset of the MSSP ACOs, qualified for shared savings.
Both MSSP ACOs and Pioneer ACOs achieved lower beneficiary expenditures than their benchmarks in 2015; but after factoring in Medicare’s shared savings bonuses only the Pioneer ACOs saved Medicare, on net, totaling $669,000 in savings (Table 4).23 In contrast, total bonus payments Medicare made to MSSP ACOs exceeded the total savings that MSSP ACOs achieved on beneficiary expenditures, resulting in a net cost of $216 million in 2015. Advance payment ACOs saved $45 million on net, after bonus payments. It is difficult to compare the magnitude of savings across models because of the variation in their sizes.
Table 4: Accountable Care Organization (ACO) Models in Medicare (Active in 2015)
Medicare Shared Savings Program (MSSP) ACOs
Pioneer ACOs
Advance Payment ACOs
Description of Model; what is being tested
The MSSP is a permanent ACO program in traditional Medicare that provides financial incentives for meeting or exceeding savings targets and quality goals. The MSSP allows ACOs to choose between sharing in both savings and losses, or just savings. For 2016, the vast majority of ACOS are in models which only include potential for shared savings. MSSPs are accountable for at least 5,000 assigned Medicare beneficiaries.a
The Pioneer ACO model is also testing the effects of financial incentives to lower spending and maintain or improve quality. Unlike most MSSP ACOs, all Pioneer ACOs are required to pay back CMS if spending exceeds their target. Pioneer ACOs are accountable for at least 15,000 assigned Medicare beneficiaries and must have experience accepting risk through contracts with other payers.c
The Advance Payment ACO model is a subset of the MSSP, testing if providing advance payments to typically smaller providers (such as physician-owned and/or rural practices) towards infrastructure and operations increases participation in the MSSP and how these payments affect spending and quality.
Start date/ End date
Start dateApril 2012 (initial cohort)
Start dateJanuary 2012 (initial cohort)
Start dateApril 2012 (initial cohort)
End dateNone
End dateEnd of 2016
End dateUnspecified
Num./type of participants
433 MSSP ACOs (as of 4/2016); comprised of multiple provider types, including physician practices, pharmacies, hospitals, rehabilitation facilities, durable medical equipment suppliers, and othersb
9 Pioneer ACOs (as of 9/2016); comprised of multiple provider types, similar to the MSSP ACOs, but because of beneficiary capacity requirements and existence of other risk contracts, Pioneer ACOs are generally largerd
35 Advance Payment ACOs (as of 2/2016); similar provider types as MSSP ACOs, but limited to being either small (<$50 million annual revenue), or with limited inpatient facilities and <$80 million in annual revenuee
Num. Medicare beneficiaries
7.7 million beneficiaries (as of 4/2016)b
Not available for 2016(2015: 461,442 beneficiaries)m
Not available for 2016(2015: 270,427 beneficiaries)h
States with participants
All states, DC, and PR, except HI (as of 1/2016)
AZ, CA, MA, MI, MN, NY (as of 1/2016)
AR, CA, CT, FL, IN, KY, MD, MA, MS, MO, NE, NH, NC, OH, RI, TN, TX (as of 1/2016)
Payment arrangements
Providers within MSSP ACOs continue to receive traditional Medicare payments for services rendered. Assessment of each ACO’s overall spending and quality—for calculating shared savings eligibility and amount—is based on the collective performance of all of the ACO’s providers for all of the ACO’s assigned beneficiaries. Although ACOs get a preliminary list of prospective beneficiaries, final assessments are based on retrospective attribution (usually based on their primary care providers). A future MSSP track will have prospective attribution opportunities.
Like MSSPs, individual providers in Pioneer ACOs receive traditional Medicare payments and performance is also based on the collective provider performance on spending and quality for attributed beneficiaries, using the same quality measures as MSSP ACOs. Beneficiary assignment to Pioneer ACOs is also usually based on primary care utilization, but Pioneer ACOs may submit beneficiary attestations regarding their desire to be attributed/not attributed to the ACO if the beneficiary was attributed to the ACO in the prior year.
Like both the MSSPs and the Pioneer ACOs, individual providers within Advance Payment ACOs continue to receive payments under traditional Medicare, but receive additional upfront and monthly payments. These payments are calculated to be recouped by CMS before being eligible for shared savings.
Shared savings/lossesMSSP ACOs are eligible to receive additional payments (essentially, share in financial savings with CMS) if total Medicare spending for their assigned beneficiaries is at or below pre-set, risk-adjusted spending benchmarks and their performance on quality metrics meets specified targets. 99% of MSSP ACOs are in Track 1 (eligible for shared savings); 1% are in Track 2 (potential for higher shared savings, but also at risk for shared losses).
Shared savings/lossesLike MSSP ACOs, Pioneer ACOs that meet quality standards can share in Medicare savings. However, unlike MSSP ACOs, all Pioneer ACOs are also at risk for losses if total spending exceeds risk-adjusted, retrospectively calculated benchmark. Pioneer ACOs have a higher maximum allowed shared saving percentage than the MSSP ACOs, and quality scores affect final sharing/loss rates by either increasing applicable bonuses or decreasing applicable losses.
Shared savings/lossesAdvanced Payment ACOs follow the same shared savings arrangements as the MSSP ACOs, but CMS recoups previously made advance payments from any allocated shared savings.
Population-based paymentsPioneer ACOs with savings in their first two years may start receiving a combination of traditional Medicare fees and population-based payments (per beneficiary payments) in their third year.–Medicare waiverPioneer ACOs are eligible for a waiver of the Medicare requirement for 3-day hospital stay prior to SNF coverage.
Upfront advanced paymentsACOs receive two upfront payments towards startup costs: one fixed payment and one variable payment based on the number of assigned beneficiaries.–Monthly advanced paymentsEach ACO also receives monthly payments towards operational activities based on the number of its assigned beneficiaries.
Early results
SavingsNet savings on beneficiary expenditures before bonuses:2012-2013: $234 millionf2014: $291 milliong2015: $429 millionh–Net savings after bonuses:2012-2013: -$78 millionf2014: -$50 milliong2015: -$216 millionh–For 2015, 119 of 392 MSSP ACOs generated enough savings to receive bonus payments from CMS; 83 produced savings that were not high enough for bonus payments; 189 generated losses.i–(CMS results for 2014 also reported savings of $465 million, which did not include Medicare spending above benchmark for ACOs that did not achieve savings; however, that total did account for bonus payments to qualifying ACOsj
SavingsNet savings on beneficiary expenditures before bonuses:2013: $96 millionk2014: $120 millionl2015: $37 millionm–Net savings after bonuses:2013: $41 millionk2014: $47 millionl2015: $669,000m–For 2015, 8 of 12 Pioneer ACOs generated savings, and 6 of these earned enough savings to receive shared-savings bonus payments from CMS; 4 generated losses (of which 1 had enough to owe a portion to CMS).i–(Other evaluation results showed higher gross savings in first two years, based on an analysis comparing Pioneer ACO beneficiaries to similar non-ACO beneficiaries.n)
SavingsNet savings on beneficiary expenditures before bonuses:2012-2013: $8 millionf2014: $85 milliong2015: $112 millionh–Net savings after bonuses:2012-2013: $22 millionf2014: $41 milliong2015: $45 millionh–For 2015, 17 of 33 Advance Payment ACOs generated savings; all were high enough to receive bonus payments from CMS.h–Note: Advance Payment ACO savings are a subset of MSSP savings.
QualityAcross 33 measures within four categories (patient/caregiver experience; care coordination/patient safety; preventive health; and at-risk populations),o most quality measures for MSSP ACOs improved from the previous year.i, p MSSP ACOs also scored as well or better than providers in traditional Medicare on comparable quality measures.a–Overall average composite score:2014: 83%g2015: 91%h
QualityUsing the same measures as MSSPs, most quality measures for Pioneer ACOs improved from the previous year.i Pioneer ACOs also scored as well or better than providers in traditional Medicare on comparable quality measures.a–Overall average composite score:2014: 87%i2015: 92%i
QualityUsing the same measures as MSSPs, most quality measures for Advance Payment ACOs improved from the previous year.a–Overall average composite score:2014: 85%g2015: 90%h
ParticipationIncreased to 433 MSSP ACOs in April 2016, from 220 in the initial year (2012-2013).b, q
ParticipationDecreased to 9 Pioneer ACOs in 2016, from 20 ACOs in 2014, 23 in 2013, and 32 in 2012 (8 Pioneer ACOs transitioned to MSSP ACOs).p, r
ParticipationParticipation has remained relatively steady. The model included 35 participants during both its first year as well as during 2016.s, e However, 2015 performance results included only 33 participants.h
Evaluation contractor/ Most recent report
No independent evaluator.Performance data released on CMS website.
n This analysis found gross savings of $280 million in the first performance year (2012) and $104.5 million in the second year (2013): Evaluation of CMMI Accountable Care Organization Initiatives: Pioneer ACO Evaluation Findings from Performance Years One and Two,” L&M Policy Research, March 2015, available at https://innovation.cms.gov/Files/reports/PioneerACOEvalRpt2.pdf.
In addition to quality improvements since their initial years, CMS has stated that for both MSSP and Pioneer ACOs, performance on quality measures is comparably as good or better than the traditional Medicare program overall.24 Further, ACOs that continued in the program for multiple years performed better on quality measures and were more likely to share in savings than ACOs that withdrew.25 In terms of participation in the ACO models, the number of MSSP ACOs has almost doubled, growing from about 200 MSSP ACOs in the initial year to over 400 in 2016. In contrast, participation in the Pioneer ACO model has declined from 32 at the start to 9 in 2016, but several Pioneer ACOs that withdrew transitioned to become MSSP ACOs.
What are the Newest ACO Models to be Introduced?
In addition to establishing a “Track 3” option in the MSSP program (described below), CMMI has launched new ACO models to test additional interventions and refinements to the current models, based on the early ACO experiences and discussions with stakeholders.
Track 3 MSSP ACO — Started in 2016, Track 3 of the MSSP ACO model offers new financial incentive structure and different beneficiary attribution rules. For example, under Track 3, ACOs have the potential for both greater shared risk and greater shared savings than under Track 2, the initial track that had downside risk. Also, in Track 3, beneficiaries are prospectively attributed to the ACO, allowing ACOs to know their assigned beneficiaries ahead of time, and in 2017, beneficiaries will be able to select the ACO in which their main doctor is participating. Beneficiaries may request a waiver from traditional Medicare rules requiring a 3-day hospital stay for most post-acute care coverage. In several ways, the Track 3 MSSP ACO program is similar to the Pioneer ACO model, but can have fewer than 10,000 attributed beneficiaries. As of November 2016, 16 ACOs are participating in this model.
The ACO Investment Model— Started in 2016, this model provides advanced capital resources to MSSP ACOs to aid in their development of infrastructure for population health care management. This model is focused predominantly on physician-only ACOs and rural ACOs with between 5,000 and 10,000 assigned beneficiaries. It follows a similar financial structure as the Advance Payment ACO, which provides for shared savings opportunities after accounting for advance payments. As of November 2016, 45 ACOs are participating in this model.
The Next Generation ACO Model — Also started in 2016, this new ACO model is designed to allow experienced ACOs with at least 10,000 Medicare beneficiaries to assume higher levels of both financial risk and reward than the earlier ACO models. Additionally, beneficiaries have the opportunity to confirm or reject their claims-based attribution to an ACO and may receive a coordinated care incentive (payment made directly to beneficiaries from CMS) if at least a specified percentage of their patient encounters are with their Next Generation ACO’s providers/suppliers (or preferred providers and affiliates). As with other ACOs, and consistent with traditional Medicare, patients in Next Generation ACOs will continue to have no restrictions on their ability to see any providers they choose, whether or not the providers are affiliated with their assigned ACO. As of November 2016, 18 ACOs are participating in this model.
Bundled Payments
What Are Bundled Payments?
Also known as episode-of-care payments, the concept of bundled payments is to establish a total budget for all services provided to a patient receiving a course of treatment for a given clinical condition over a defined period of time. For example, a single payment amount for a patient undergoing knee replacement would include: the surgeon’s fee, the anesthesiologist charges, the hospital’s charges, other physician charges for hospital-based care, and costs for post-surgical physical therapy. Rather than each provider (or each site) being responsible only for their part in the patient’s care and spending, all of the affiliated providers share a portion of the total budget. As such, if total expenses for an episode of care are lower than the target price of the bundle, then the affiliated providers may share in the “savings”; alternatively, if their costs for that episode of care exceed the bundle’s target price, then the providers may “lose” money on that episode.
CMS is testing several new and ongoing bundled payment models for acute and post-acute care, four of which are part of the Bundled Payment Care Improvement (BPCI) initiative.As noted below, these models vary based on scope of services included in the bundle, type of organization that holds the overall risk contract for the episodes (e.g., inpatient hospital or post-acute provider), and payment methodology. In some of the models, providers also have flexibility to choose the length of the episode (30, 60, or 90 days). Early results from BPCI are detailed in Table 5; newer models, for which results are not yet available, are described later in this section. Across the country (Figure 3), the four BPCI models that CMMI is implementing are:
Figure 3: Bundled Payments for Care Improvement (BPCI) Models
BPCI Model 1—Model 1 bundles all inpatient hospital services for the episode of care and applies a discount to the usual Medicare hospital payment. Hospitals can make “gainsharing” payments to contracted physicians or practitioners to provide incentives for lowering overall episode spending.
BPCI Model 2—Model 2 bundles inpatient hospital services, physician services, and post-acute care services throughout an episode of care (beginning with an inpatient hospitalization), as well as other Part A and Part B services received post-discharge from the hospital, including hospital readmissions. CMS retrospectively compares actual expenditures against a target price.
BPCI Model 3—Model 3 bundles post-acute care services throughout an episode of care (which begins after discharge from an inpatient hospitalization), as well as other Part A and Part B services received post-discharge from the hospital, including hospital readmissions. Like Model 2, CMS retrospectively compares actual expenditures against a target price.
BPCI Model 4—Model 4 bundles all inpatient and physician services during the initial hospital stay and subsequent hospital readmissions, but does not include post-acute care services in the bundle. Unlike models 2 and 3, Model 4 provides a prospective payment at the start of the episode of care.
Conceptually, How Could Bundled Payments Improve Care and Reduce Costs?
When a set of providers shares the budget for multiple services provided to a given patient within one episode of care, rather than separate payments for each service, the providers have a financial incentive to collaborate to improve efficiency and possibly lower their own costs associated with an episode of care.26 For example, under models two and three, providers may find ways to eliminate duplicative or unnecessary services and work with patients and other physicians to select the most appropriate post-acute patient care settings. Bundled payments may also create incentives to improve care quality, because the cost of treatments due to errors or medical complications comes from within the total episode budget. Fewer complications may translate into higher savings to be shared among the participating providers, as well as better patient experience.
How Do Bundled Payments Differ from the Status Quo in Traditional Medicare?
Under traditional Medicare, each provider or facility is reimbursed separately for the services they deliver, whether or not they are part of a larger episode of care for a given patient. In contrast, with bundled payment arrangements, Medicare determines a single target price for a defined episode of care, which may span across multiple providers (potentially, hospitals, physicians, and post-acute care providers). Presumably, the financial risk and savings are shared across providers, but the extent to which individual providers in bundled payment arrangements incur losses or bonuses depends on their contractual agreements with the organization that is officially designated as accountable for the episodes of care (i.e., the “awardee”).
CMS payment to BPCI providers are subject to the same quality incentive payments administered through traditional Medicare, such as in the Hospital Value-Based Purchasing program.27 The reconciliation payments (e.g., the savings to Medicare that providers keep from spending below their target levels) are not tied to specific quality metrics. BPCI awardees, however, may make incentive payment to partnering providers that meet quality performance targets pre-determined in their contractual agreement.
How Are Beneficiaries Involved in Bundled Payment Models?
CMMI estimates that about 130,000 beneficiaries are affected by the BPCI models—all of whom had a hospitalization to “trigger” the episode of care under a bundled payment arrangement. CMS requires that providers participating in all four models of the BPCI inform their patients that they are participating in the model, and that as beneficiaries in traditional Medicare, they are free to obtain services from any willing Medicare provider. Providers participating in bundled payment models may recommend or direct patients to certain provider partners (such as certain home health agencies), if they determine that those providers might offer care that could help meet quality and spending targets.
What Are Some of the Implications for Beneficiaries of Bundled Payments?
On the one hand, beneficiaries may experience better health outcomes, considering providers’ financial incentives to improve care to avoid re-hospitalizations and other complications. Additionally, for patients who wish to recover at home following a hospital admission, bundled payment arrangements may help providers find ways to provide adequate care in lower-cost environments. On the other hand, with incentives to reduce the overall costs, there is a concern that bundled payment arrangements may encourage some providers to stint on care or avoid caring for sicker patients.28 Patients with high health needs and less family caregiver support at home may require more costly post-acute care than other patients, highlighting the need for program evaluation to monitor care provided to these vulnerable patients. Also, while Medicare beneficiaries have free choice of their providers, it will also be important to examine discharge patterns to understand if or how patients may be steered to affiliated facilities—which may be beneficial to patients when the facilities provide better and more efficient care, but may not be as helpful to patients if the facilities are inconvenient or provide lower-quality care.
What Are Some of the Implementation Challenges with Bundled Payments?
Administering bundled payments raises several implementation challenges from the standpoints of both Medicare and the individual providers. For Medicare and CMS, these include determining what services are included in the bundles, setting payment levels for each bundle, and identifying appropriate quality measures. Except for model 1, all other BPCI models allow provider participants to select the conditions for which their bundled payments will apply (from 48 options), which may minimize the potential benefit of the payment approach. Provider organizations receiving bundled payments also face challenges, including determining which partners bear the costs of infrastructure investments and how potential savings will be shared among the affiliated providers, given that some may see more patients, or costlier patients, than others.
What Early Results Are Available from the Bundled Payment Models Being Tested?
Evaluation results for the BPCI models show variation both between models and within models, depending on the type of clinical episode and other variables, such as post-acute care settings (Table 5). For example, for Model 1, which bundles inpatient hospital care, evaluators report that for the first 15 months, BPCI episodes achieved lower cost growth overall than non-BPCI episodes (relative to the baseline level). Savings during the initial hospital stay were minimized when factoring in relatively higher spending in the post-acute period for the BPCI participants. Regarding quality, the first evaluation found no significant differences in readmission rates or mortality rates between BPCI and non-BPCI episodes, but evaluators noted need for further analysis of outlier mortality measures. Multiple withdrawals during the evaluation period among participants in Model 1 affected the measurability of these results.
Table 5: Bundled Payment for Care Improvement (BPCI) Models in Medicare
Model 1Bundle focus: Inpatient hospital services
Model 2Bundle focus: Inpatient hospital, physician, and post-acute services
Model 3Bundle focus: Post-acute services
Model 4Bundle focus: Inpatient hospital and physician services
Description of Model; what is being tested
Four BPCI models are testing the effects on Medicare spending and quality of patient care when CMS allocates a single, pre-determined payment amount (“bundle”) for an episode of care. The participants gain financially if total spending for an episode is below the pre-determined bundled amount (a target price, generally discounted 1-3% from applicable fee-schedule totals) or conversely incur financial losses if spending exceeds the bundled amount. The range of potential services included in the bundle (e.g., acute hospital inpatient services, post-acute care) differ across models. Currently, BPCI payments are not tied to specific quality metrics.
Start date/ End date
Start date4/2013 (initial cohort)
Start date10/2013 (initial cohort)
Start date10/2013 (initial cohort)
Start date10/2013 (initial cohort)
End date3-year participation period
End date3-year participation period, initially; extended two additional years through September 2018
End date3-year participation period, initially; extended two additional years through September 2018
End date3-year participation period, initially; extended two additional years through September 2018
Num./type of participants
1 acute care hospitals (as of 7/2016)a
601 acute care hospitals, post-acute care facilities, or physician group practices (as of 7/2016)b
836 post-acute care facilities or physician group practices (as of 7/2016)c
10 acute care hospitals (as of 7/2016)d
Num. Medicare beneficiaries
130,000 beneficiaries across 4 models; individual model estimates are not availablee
130,000 beneficiaries across 4 models; individual model estimates are not availablee
130,000 beneficiaries across 4 models; individual model estimates are not availablee
130,000 beneficiaries across 4 models; individual model estimates are not availablee
States with participants
KS (as of 7/2016)
All states and DC except AK, HI, ID, KS, ME, MD, MT, NE, NM, ND, OK (as of 7/2016)
All states and DC except AK, AR, CO, DE, HI, KS, LA, ME, MS, MO, NE, NV, NH, NJ, NM, ND, OK, SC, VT, VA, WV, WY (as of 7/2016)
CA, FL, MI, NJ, PA, TX (as of 7/2016)
Payment arrangements
Individual hospitals automatically receive a discounted (up to 1%) MS-DRG payment from CMS. Hospitals can make gainsharing payments to contracted physicians or practitioners to provide incentives for lowering episode spending.
Individual providers continue to receive regular payments under traditional Medicare. A 2-3% discount is applied to the episode target price during reconciliation.
Like Model 2, individual providers continue to receive regular payments under traditional Medicare, but a 3% discount is applied to the episode target price during reconciliation.
Unlike Models 2 and 3, participating hospitals receive prospective payments equal to a pre-determined, risk-adjusted bundled amount, rather than starting with regular payments under traditional Medicare. A 3%-3.25% discount is applied to the prospective payment.
Services in bundleAll Part A services provided in episode of care.
Services in bundleAll related Part A/B services (with some exceptions) during initial hospitalization and related services for up to 90 days after discharge from the hospital; includes related readmissions.
Services in bundleAll related Part A/B services (with some exceptions) during post-acute period for up to 90 days; includes related readmissions.
Services in bundleAll related Part A/B services (with some exceptions) during initial inpatient stay; includes related readmissions.
Payment reconciliationNone. CMS’s hospital payments (MS-DRG) are automatically discounted. Any internal cost savings are kept by the hospital and potentially redistributed to partnering providers through gainsharing arrangements.
Payment reconciliationRetrospectively, CMS compares actual total spending for each episode of care against pre-determined risk-adjusted bundled amount (“target price”); if spending was below the bundled amount, CMS makes added payment to hospital; if higher, then hospital owes CMS.–Medicare waiverParticipants are eligible for waiver of requirement for 3-day hospital stay prior to SNF coverage.
Payment reconciliationSame as Model 2.
Payment reconciliationCMS makes prospective payments to hospitals based on pre-determined amounts that bundle hospital and physician services. Hospitals are responsible for determining payments to partnering physicians if costs are lower than CMS payments.
Early results
SavingsIn the first 15 months, BPCI episodes had lower spending growth compared to baseline spending than non-BPCI episodes (by $123) overall. Savings during the initial hospital stay were minimized by highed spending after discharge (to other providers) for BPCI-episodes compared to non-BPCI episodes.f
SavingsFirst year results found that for orthopedic surgery episodes (mostly hip and knee replacements), average overall episode payments declined more for BPCI participants (by $864) than non-BPCI participants, but increased more for spinal surgery episodes (by $3,477). For the four remaining clinical groups, difference in spending growth between BPCI and non-BPCI episodes were not statistically significant.g
SavingsFirst year results found no significant difference in the growth of average total episode payments between BPCI providers and non-BPCI providers. Within the episodes, SNF days decreased for BPCI episodes relative to the comparison group, but this decline did not significantly affect total episode spending differences.g
SavingsFirst year results found no significant difference in spending growth between BPCI episodes and non-BPCI episodes for cardiovascular surgery and orthopedic surgery. Results are limited by small sample sizes.g
QualityNo significant differences in readmission rates or mortality rates between BPCI and non-BPCI episodes, relative to baseline. Outliers were identified on measures for increased mortality after discharge among BPCI providers.f
QualityDifferences in quality between BPCI and non-BPCI episodes varied by measure and clinical episode group.g
Hospital Readmissions: No difference from non-BPCI episodes
Emergency Dept. Use: No difference in 90-day period; higher for BPCI episodes vs. non-BPCI episodes for 30-day period
Mortality: With more months of data, found no significant differences between BPCI and non-BPCI episodes in mortality in most clinical groups
QualityDifferences in quality between BPCI and non-BPCI episodes varied by measure and clinical episode group.g
Hospital readmissions: variation includes higher 30-day rate for BPCI non-surgical cardiovascular episodes, but lower rates for surgical BPCI episodes
Emergency dept. use lower for BPCI surgical episodes
Mortality: No difference from non-BPCI episodes
QualityLimited sample for analysis, but no significant differences between BPCI and non-BPCI episodes in mortality, 30-day readmission rates, or emergency dept use (without hospitalization) after hospital discharge.g
ParticipationDecreased in the first 5 quarters from 24 to 15 participants.f, h Subsequently decreased to 1 participant.a
ParticipationIncreased from 9 episode initiators (EI) in the first 3 months to 113 by the end of the first year.g, h Note: EIs can include multiple provide participants.
ParticipationIncreased from 9 EIs in the first 3 months to 94 by the end of the first year.g, h
ParticipationIncreased from 1 EI in the first 3 months to 20 by the end of the first year; 10 EIs subsequently withdrew.g, h
h The provider count refers to “episode initiators.” These are generally acute care hospitals, under Models 1, 2, and 4; or, under Model 3 post-acute care providers, such as skilled nursing facilities, long-term care hospitals, inpatient rehabilitation facilities, and home health agencies; or physician group practices under Models 2 and 3.
Model 2, for which hospitals and physician groups are accountable for both the acute and post-acute period of care, was the most widely adopted model among BPCI participants. Evaluation results for the first year found that orthopedic surgery episodes (mostly hip and knee replacements) among BPCI participants had lower spending over 90 days than non-BPCI participants. This reduction was attributable, in part, to decreases in the use of skilled nursing facility (SNF) services and inpatient rehabilitation facilities (IRF) concurrent with increases in the use of home health services, and reductions in hospital readmissions. Spinal surgery episodes, however, had higher Medicare payments among BPCI participants compared to non-BPCI participants. The remaining four clinical episode groups showed no statistically significant difference in spending between BPCI and non-BPCI episodes. Researchers are considering the impacts that noted increases in the number of episodes may have on total Medicare spending among BPCI hospitals.29 Quality outcomes showed no differences between BPCI and non-BPCI episodes in hospital readmissions, but certain BPCI episodes had higher emergency department use. Using additional months of outcome data, evaluators generally found no statistically significant differences in mortality rates for most episode groups.
In Model 3, which focused only on post-acute care episodes, and Model 4, which focused only on acute care, most clinical episode groups did not show a statistically significant change in overall spending, though days in SNF care among Model 3 participants was lower. Also for Model 3, quality outcomes were similar to those in comparison groups, with a few exceptions, including an increase in readmission rates. Model 4 participation declined during the evaluation period, limiting the ability to detect statistically significant differences in spending and quality.
What are the Newest Bundled Payment Models to be Introduced?
CMS is planning additional bundling payment models in the near future, including:
Oncology Care Model (OCM) — This model, started in 2016, focuses on care provided by medical practices to beneficiaries receiving chemotherapy for cancer during six-month episodes of care. It will include a two-part payment system—a per-beneficiary payment for each month of the episode and a lump sum performance-based payment for episodes of chemotherapy care based on quality and spending outcomes. This program is also seeking agreements with other insurers, including commercial insurers and state Medicaid agencies, to join this payment model for participating practices and potentially create broader incentives for care transformation at the practice level, not just for Medicare beneficiaries in traditional Medicare. As of November 2016, nearly 200 physician practices are participating.
The Comprehensive Care for Joint Replacement (CJR) Model — This bundled payment model, started in 2016, is designed for episodes of care initiated by a hospital stay for lower extremity joint (hip and/or knee) replacements. This model is similar to BPCI Model 2, but a key difference is that for most hospitals in the 67 selected geographic areas, participation is mandatory rather than voluntary. Under the CJR model, about 800 hospitals will be at financial risk for the care provided during the initial hospital stay plus 90 days after discharge from the hospital. As with other bundled payment approaches, the aim is to give hospitals and other providers an incentive to improve care coordination and invest in activities that will increase quality and efficiency.
Appendix
Appendix: Payments Allocated for CMMI Models
Table A1: Innovation Center Model Payments, as of September 2014(From the Centers for Medicare and Medicaid Services’ Report to Congress, December 2014)a
Initiative
CMS Innovation Center payments made to model participants
Payments under Title XVIII or XIX made for services on behalf of beneficiaries
Other CMS Innovation Center funds obligated to support model development and testing
Primary Care Transformation
Comprehensive Primary Care
$172,740,615
Payments not yet made (expected FY 2015)
$57,609,096
Federally Qualified Health Center (FQHC) Advanced Primary Care Practice (APCP)
$45,967,680
N/A
$22,868,754
Accountable Care Organizations
Pioneer Accountable Care Organization Model
N/A
$80,719,585
$87,048,657
Advance Payment Accountable Care Organization Model
$67,801,572b
$5,705,754c
$5,371,781
Comprehensive End-Stage Renal Disease Care Model
N/A
Payments not yet made
$16,476,376d
Bundled Payments for Care Improvement
Bundled Payments for Care Improvement (Models 1-4)
N/A
Data not yet available
$40,399,579
Initiatives Focused on the Medicaid Population
Strong Start for Mothers and Newborns (Strategies 1 & 2)
$23,594,395
N/A
$47,649,930
Initiatives Focused on Medicare-Medicaid Enrollees
State Demonstrations to Integrate Care for Medicare-Medicaid Enrollees
$70,509,361
N/A
$18,928,906
Financial Alignment Initiative
$5,207,996
Data not yet available
$79,839,514e
Initiative to Reduce Avoidable Hospitalizations Among Nursing Facility Residents
$78,900,786
N/A
$11,245,590
Initiatives to Speed the Adoption of Best Practices
Partnership for Patients
N/A
N/A
$451,352,024
Million Hearts®
N/A
N/A
N/A
Initiatives to Accelerate New Service Delivery and Payment Model Testing
Prior Authorization Model: Repetitive Scheduled Non-Emergent Ambulance Transport
N/A
N/A
$4,338,941
Subtotals
$1,645,815,124
$86,425,339
$952,665,577
SOURCES:–a Table taken from: Table 3 of Centers for Medicare and Medicaid Services, Report to Congress, December 2014, available at https://innovation.cms.gov/Files/reports/RTC-12-2014.pdf.–b Payments made to model participants in the Advance Payment ACO Model represent the advance payments given to ACOs as part of the model, which were distributed under the authority of section 1115A of the Social Security Act.–c Payments made to model participants in the Advance Payment ACO Model under Title XVIII or XIX were distributed as shared savings payments under the authority of the Medicare Shared Savings Program.–d Of this amount, $1,321,039 was obligated as application support through the FY2013 pre-implementation budget.–e Of this amount, $1,495,660 was obligated for the Financial Alignment Initiative under the FY2011 budget for the State Demonstrations to Integrate Care for Medicare-Medicaid Enrollees.–f This total reflects the full amount of grant funding provided to HCIA awardees for the 3-year period of performance. Funds are used by awardees to implement models, including payments to providers of services, and to suppliers.–g This funding was used for the Medicaid Innovation Accelerator Program (IAP) Learning Collaborative in FY2014. The IAP program is budgeted separately in FY2015 and thereafter.
Includes programs managed outside of CMMI, such as the Medicare Shared Savings Program. Calculated from data provided on Center for Medicare and Medicaid Innovation sites as of August, 2015, available at https://innovation.cms.gov. ↩︎
Shrank, W., “The Center for Medicare and Medicaid Innovation’s Blueprint for Rapid-Cycle Evaluation of New Care and Payment Models,” Health Aff. (Millwood) 2013;32(4):1-6. ↩︎
For further discussion of the evaluation methods for the CMMI models, see: Howell, B., P. Conway, and R. Rajkumar, “Guiding Principles for Center for Medicare & Medicaid Innovation Model Evaluations,” Journal of American Medical Association, 313;23 (June 16, 2015). http://jama.jamanetwork.com/article.aspx?articleid=2278025. ↩︎
Centers for Medicare and Medicaid Services: Center for Medicare and Medicaid Innovation, “Accountable Care Organizations (ACOs): General Information,” cited November 23, 2015, available at https://innovation.cms.gov/initiatives/ACO/. ↩︎
McWilliams, M, et al, “Early Performance of Accountable Care Organizations in Medicare,” N Engl J Med 374:2357-2366 (June 2016). Nyweide, D., et al, “Association of Pioneer Accountable Care Organizations vs Traditional Medicare Fee for Service with Spending Utilization, and Patient Experience,” JAMA 313(21), (May 2015). ↩︎
Cutler, D.M. and F.S. Morton, “Hospitals, Market Share, and Consolidation,” JAMA 2013;310(18):1964-70; Baicker, K., “Coordination versus Competition in Health Care Reform, N Engl. J. Med. 2013;369(9):789-91. ↩︎
On balance, the CMS Office of the Actuary certified the Pioneer ACO model as cost-saving. Nyweide, D., et al, “Association of Pioneer Accountable Care Organizations vs Traditional Medicare Fee for Service with Spending Utilization, and Patient Experience,” JAMA 313(21), May 2015. ↩︎
Centers for Medicare and Medicaid Services, August 2015; U.S. General Accounting Office, “Results from the First Two Years of the Pioneer Accountable Care Organization Model,” April, 2015. ↩︎
Miller, H. and Strategic Initiatives Consultant, [Working Draft] “From Concept to Reality: Implementing Fundamental Reforms in Health Care Payment Systems to Support Value-Drive Health Care,” July 21, 2008, available at http://amcp.org/WorkArea/DownloadAsset.aspx?id=13445. ↩︎
Fisher, E.S., “Medicare’s Bundled Payment Program for Joint Replacement: Promise or Peril?” JAMA 2016;316(12):1262-64. ↩︎