KFF designs, conducts and analyzes original public opinion and survey research on Americans’ attitudes, knowledge, and experiences with the health care system to help amplify the public’s voice in major national debates.
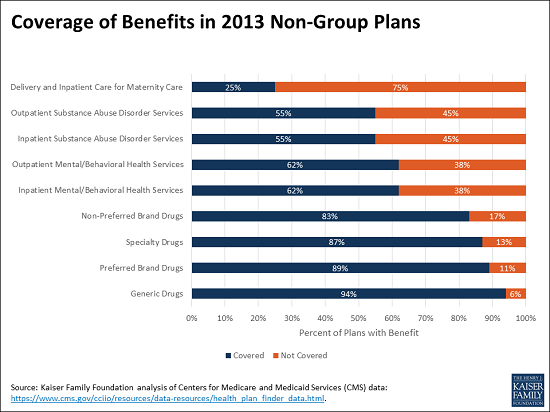
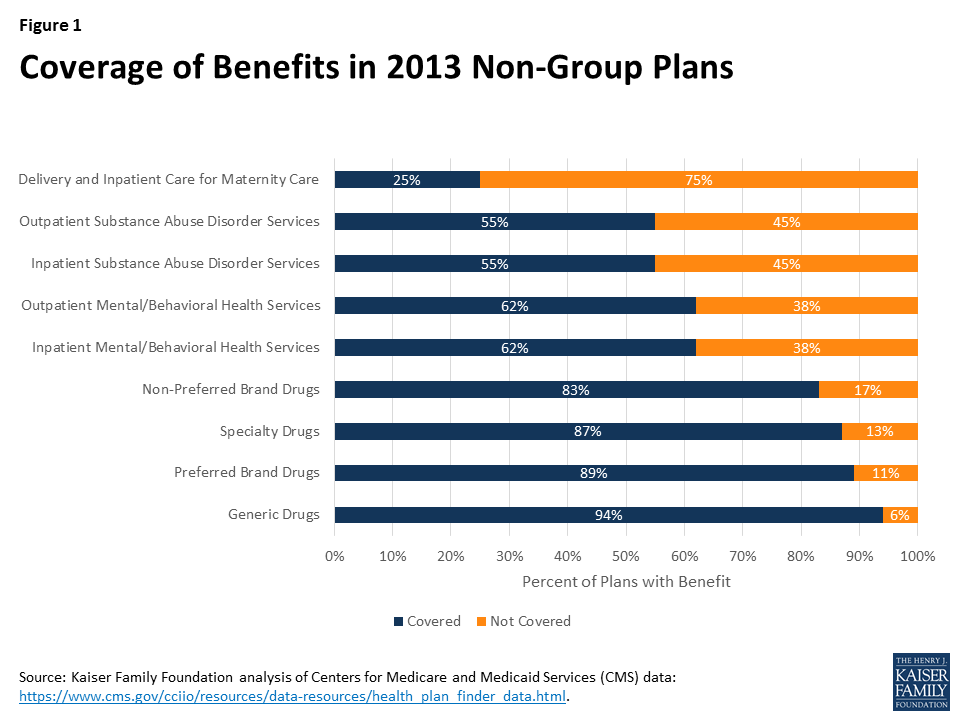
Three in four health plans in the non-group insurance market did not cover delivery and inpatient maternity care in 2013, before the Affordable Care Act (ACA) essential health benefits requirement took effect, finds a new Kaiser Family Foundation analysis.
Other major benefits most often left uncovered before the ACA include substance abuse disorder services (inpatient and outpatient services each not covered by 45% of 2013 non-group plans) and mental/behavioral health services (inpatient and outpatient services each uncovered by 38% of the plans).
Additionally, some plans that covered maternity, substance abuse or mental health care services included meaningful limits or restrictions, the analysis finds.
Since 2014, the ACA has required non-group plans to cover 10 categories of essential health benefits comparable to those offered in employer group plans. The new analysis offers a window into how insurers could respond if the essential health benefits requirement is rolled back, a change being considered by Congressional leaders and allowed through state waivers by the House-passed American Health Care Act as a potential way for lowering premiums.
Without the requirement, however, insurers in the non-group market would likely be reluctant to offer coverage for some expensive services that have an element of predictability and persistence, as people who needed these benefits would disproportionately select policies covering them. Unlike in the pre-ACA market, insurers would not be able to exclude from coverage altogether people with pre-existing conditions.
The new analysis finds that all 2013 non-group plans covered basic benefits, such as inpatient hospital services, inpatient physician and surgical services, and emergency room services. Some plans didn’t provide various levels of prescription drug coverage, however.
The analysis uses data insurers provided for the Health Plan Finder on HealthCare.gov for the last quarter of 2013. Certain provisions of the ACA, such as the prohibition of annual and lifetime dollar limits on benefits, had already begun to be phased in by that point, so the data does not reflect all of the types of limitations in non-group policies prior to the ACA.
As the debate over amending health insurance market rules continues, proponents of changing the law have proposed reducing the health benefits provided by non-group plans as a potential way to lower premiums in the market. The Affordable Care Act (ACA) prescribes 10 categories of essential health benefits that non-group and small-group policies must cover, and provides in most cases that the scope of these benefits should be similar to those in employer group health plans, which cover most non-elderly Americans. The American Health Care Act (AHCA), which passed the House of Representatives on May 5, would permit states to seek waivers to amend the required benefits if doing so would achieve one of several purposes, including lowering premiums.1 We look below at the benefits covered by non-group plans before the ACA as a possible indication of how states could respond to the waiver authority under the AHCA.
Background
The lack of coverage for benefits such as maternity and mental health care in many nongroup plans, which was a frequent point of criticism when the ACA was debated, was one (but not the only) reason why non-group coverage was less expensive before the ACA was enacted. In the pre-ACA market, certain benefits were excluded to make coverage more affordable and to guard against potential adverse selection by applicants with more predictable, chronic health care needs. Even with the ability to medically screen applicants for non-group policies, some insurers excluded coverage for conditions such as mental health and substance abuse care unless states required that they be covered.
States determined coverage requirements for health insurance policies prior to the ACA. A few states defined a standard benefit package to be offered by insurers in the nongroup market. Most states adopted some mandates to cover or offer specific benefits or benefit categories – such as requirements for policies to cover maternity benefits or mental health treatments. In addition to deciding which categories of benefits must be included or offered, states might also specify a minimum level or scope of coverage; for example, a few states required that mental health benefits have similar cost sharing and limits as other outpatient services (sometimes called parity).
Pre-ACA non-group plans varied considerably in scope and comprehensiveness of coverage, with some plans limiting benefit categories or putting caps on benefits, while others offered more comprehensive options. For example, some plans did not cover prescriptions, others covered only generic medications or covered a broader range of medications subject to an annual cap, while still others covered a more complete range of medications. This diversity was possible because insurers generally were able to decline applicants with pre-existing conditions, and could require their existing customers to pass screening if they wanted to upgrade to more comprehensive benefits. This prevented applicants from selecting the level of coverage they wanted based on their known health conditions, but also prevented many people from being able to obtain non-group coverage at all.
To look more closely at the benefits provided in pre-ACA non-group plans, we analyzed data submitted by insurers for display on HealthCare.gov for the last quarter of 2013. Beginning in 2010, insurers submitted information about their non-group plans to be displayed on HealthCare.gov; the data includes information on benefits, coverage levels for each benefit, benefit limits, premiums and cost sharing parameters, and enrollment. We focus here on the benefits and benefit limits. We use data from 2013 because it is the most current year prior to when the ACA’s major insurance market changes went into effect, provides more benefit categories than some earlier years, and has more information about benefit limits for each category. We note, however, that the ACA prohibition on annual dollar limits took effect shortly after enactment and was phased in between 2010 and 2013, so these types of limits would likely not be reflected often in data we received. This means that our analysis likely misses some of the limits (for example, dollar limits on prescriptions) that existed in nongroup policies before the ACA was enacted. We limit the analysis to plans where insurers report enrollment in the product upon which the plan is based. Our methods are described in more detail in the appendix.
Results
The data include 8,343 unique plans across 50 states and the District of Columbia. We looked at the percentage of plans that included coverage for major benefit categories. Not surprisingly, all of the plans covered basic benefits such as inpatient hospital services, inpatient physician and surgical services, emergency room services, and imaging services, while virtually all (99%) covered outpatient physician/surgical services, primary care visits, home health care services, and inpatient and outpatient rehabilitation services.
Certain other benefits, however, were covered much less often (Figure 1). Large shares of plans did not provide coverage for inpatient or outpatient mental/behavioral health care services (38% each), inpatient or outpatient substance abuse disorder services (45% each), and delivery and inpatient care for maternity care (75%).2 In addition, 6% of plans did not provide coverage for generic drugs, 11% did not provide coverage for preferred brand drugs, 17% did not provide coverage for non-preferred brand drugs, and 13% did not provide coverage for specialty drugs.
Figure 1: Coverage of Benefits in 2013 Non-Group Plans
Even when coverage was provided, some policies had meaningful limits or restrictions for certain benefits. Mental/behavioral health care is a case in point. Among plans with coverage for outpatient mental/behavioral health services, 23% limited benefits for some or all mental/behavioral services to fewer than 30 visits or sessions over a defined period (often a year) and 12% limited it to 12 or fewer. A small share (about 5%) of plans providing coverage for outpatient mental/behavioral health services provided benefits only for conditions defined as severe mental disorders or biologically-based illnesses or applied limits (such as visit limits) if the illness was not defined as severe or biologically based. The definitions of these terms varied by state.3
Similarly, for plans covering outpatient substance abuse disorder services, 22% limited the benefit to fewer than 30 visits or sessions; 12% limited it to 12 or fewer. In many of these plans, visits for either mental health or substance abuse care were combined to apply toward the same limit.
Among the relatively few plans that provided coverage for delivery and inpatient maternity care, a small share (3%) applied separate deductibles of at least $5,000 for maternity services and some plans (6%) applied a separate waiting period of at least year before benefits were available. A few plans restricted benefits to enrollees enrolled in family coverage or required that the enrollee’s spouse also be enrolled.
Discussion
The ACA raised the range of benefits provided by non-group policies such that the benefits now offered by non-group plans are comparable to those offered in employer group plans. The desire to lower non-group premiums, however, has led policymakers to consider allowing states to roll back the essential health benefits prescribed by the ACA.
Among the pre-ACA policies we reviewed, virtually all included benefits for certain services: hospital, physician, surgical, emergencies, imaging, and rehabilitation. Other services were covered less often, including prescription drugs, mental/behavioral health care, substance abuse disorder care, and coverage for pregnancy and delivery. This latter group of services all have some element of predictability or persistency that make them more subject to adverse selection. For example, many people use drug therapies over long periods and would be much more likely to select policies covering prescriptions than people who do not regularly use prescription drugs. If states were to drop any of these services from the list of essential health benefits for non-group plans, access to them could be significantly reduced.
The difficulty is that insurers would be very reluctant to offer some of these services unless they were required in all policies because people who need these benefits would disproportionately select policies covering them. In the pre-ACA market, insurers were able to offer products with different levels of benefits because they generally were able to control who could purchase them by medically screening new applicants. Even existing customers faced medical screening if they wanted to change to a more comprehensive policy at renewal. Through these practices, insurers were able to avoid the situation where people could choose cheaper policies when they were healthy and upgrade to better benefits when their health worsened. The proposed AHCA market rules, however, would not guard against this type of adverse selection, because people with pre-existing health conditions would be able to select any policy offered at a standard premium rate, and change their selection annually without incurring a penalty, as long as they maintained continuous coverage. This means that the range of benefits provided by insurers in states with essential health benefit waivers would likely be more limited than what insurers offered in the pre-ACA non-group market. Benefit choice might be particularly limited in states that specify only a few benefits as essential.
It is hard to imagine that insurers would cover certain benefits if they were not required. For example, some insurers before the ACA did not offer mental health benefits unless required by a state, even when they could medically screen all of the applicants. And given the current problems with substance abuse in many communities, insurers would be reluctant to include coverage to treat them unless required. Offering these benefits as an option (for example, including them in some policies but not in others), would result in very high premiums for optional benefits because people who know they need them would be much more likely to choose them.
The AHCA presents state policymakers with a dilemma: they can reduce the essential health benefits to allow less expensive insurance options for their residents, but doing so may eliminate access to certain benefits for people who want and need them.
Methodology
The data we used in our analysis were obtained from the Centers for Medicare and Medicaid Services (CMS) through a Freedom of Information Act Request, submitted January 10, 2017, with data supplied April 11, 2017. The data are now available here: https://www.cms.gov/cciio/resources/data-resources/health_plan_finder_data.html. Insurers submitted the data to CMS to be displayed on the Health Plan Finder on HealthCare.gov. Data were submitted periodically and updated periodically by CMS. We received data for three quarters in 2011, and for four quarters in 2012 and 2013. The data fields changed over the period; we used data from the fourth quarter of 2013, the last available, for our analysis. The 2013 data have more benefit categories than the 2011 data and more information about limits on benefits than the 2012 data. Our discussion with CMS staff suggested that the data became more complete as they were updated through the year, so we chose to use the fourth quarter.
The analysis is limited to plans for which the insurer reported that there were enrollees in the underlying product upon which the plan was based. Results are not enrollment weighted. Enrollment was reported only by product, so we do not know if there were actually enrollees in each of the plans associated with that product. A plan was assumed not to offer coverage for a benefit category if the dataset left the coverage description blank for that category. The analysis of benefit limits was conducted among plans that offered coverage for the benefit category analyzed, for example outpatient mental/behavioral health services.
Endnotes
In its application for a waiver, the state must show that the waiver would reduce average premiums for health insurance, increase enrollment in health insurance, stabilize the market for insurance coverage, stabilize premiums for applicants with pre-existing conditions, or increase choice of health plans.u00a0 AHCA, section 136. ↩︎
u00a0 Plans generally paid for complications from pregnancy, but not for the costs associated with a normal delivery. ↩︎
Roach, J., u201cDiscrimination and Mental Illness, Codified in Federal Law and Continued by Agency Practice,u201d 2016 Mich. St. Law Review 269, at 285:288. ↩︎
This data note reviews the Medicaid estimates included in the American Health Care Act as passed by the House of Representatives on May 4, 2017 prepared by the Congressional Budget Office (CBO) and staff at the Joint Committee on Taxation (JCT).
American Health Care Act (AHCA)
CBO estimates that the coverage provisions of the AHCA as passed by the House of Representatives would reduce direct spending for Medicaid by $834 billion over the 2017-2026 period (Figure 1). By 2026, Medicaid spending would be about 24 percent less than what CBO projects under current law. Most of the reduction in spending is tied to estimates of lower enrollment. By 2026, CBO estimates 14 million fewer people would be enrolled in Medicaid compared to current law. Overall, the AHCA would reduce federal deficits by $119 billion over the 2017-2026 period with a number of provisions that increase costs and decrease revenues offset by large reductions in federal spending coming primarily from Medicaid and the elimination of subsidies for non-group health insurance included in the Affordable Care Act (ACA). Overall, the total uninsured would reach 51 million in 2026, or 23 million more than what is projected under current law with the ACA. Key Medicaid provisions include the following:
Figure 1: CBO Estimates of Reductions in Federal Medicaid Spending in the American Health Care Act (AHCA) for Coverage Provisions
End of Enhanced Match for the ACA. Under current law, states that adopted the ACA Medicaid expansion receive an enhanced match rate for those newly eligible for coverage. Beginning in 2020, the AHCA would reduce the enhanced federal matching rate for newly eligible adults from 90 percent to the traditional match rate (which ranges from 50% to 75%) for those newly enrolled after December 31, 2019. CBO estimates the following effects from this provision:
No additional states will adopt the expansion resulting in 5 million fewer enrollees by 2026 compared to projections under current law;
Some states that have already expanded their Medicaid programs would not continue that coverage (some states might also begin to reduce coverage prior to 2020); and
Reductions in spending for those covered at the enhanced match (those with coverage as of December 31, 2019 without a break in coverage) as they cycle off the program (fewer than one-third of those enrolled as of December 31, 2019 would have maintained continuous eligibility two years later and the higher federal matching rate would apply for fewer than 5 percent of newly eligible enrollees by the end of 2024). New enrollees are covered at the traditional match rate.
Impose a Per Capita-Based Cap or Block Grant for Medicaid. Under current law, the federal government matches state Medicaid spending with no pre-set limit. Under the AHCA, beginning in 2020, Medicaid would transition to per capita cap to limit federal financing. The per capita cap would be set for five enrollment groups (the elderly, individuals with disabilities, children, newly eligible adults, and all other adults), increased by the consumer price index for medical care services (CPI-M) for children and adults and CPI-M plus one percentage point for the elderly and people with disabilities multiplied by the number of enrollees in each category in that year. CBO assumes:
Medicaid per enrollee growth constrained to CPI-M (3.7% over the 2017-2026 period) would be lower than the average annual rate of 4.4 percent projected under current law.
With less federal funding for Medicaid, states would need to increase state funding to maintain the program at current-law levels or make cuts to Medicaid by reducing payments to providers and health plans, eliminating optional services, restricting eligibility for enrollment, or (to the extent feasible) arriving at more efficient methods for delivering services (or employ a combination of strategies).
Key Changes in the Managers Amendment and House Passed Bill: The bill as amended and then passed by the House of Representatives included additional provisions that on net reduced federal savings from $880 billion to $834 billion:
Increases the per capita costs for aged, blind, and disabled enrollees by the CPI-M plus one percentage point;
Reduces the per capita allotment in Medicaid for the state of New York in proportion to any financing the state receives from county governments;
Provides states the option to make eligibility for Medicaid conditional on satisfying work requirements for enrollees who are not single parents of children under age 6 or who are not pregnant or disabled;
Allows states to receive a block grant for Medicaid coverage of children and some adults instead of funding based on a per capita cap.
Impact of Other Medicaid Provisions. Other Medicaid provisions would result in reduced federal outlays, and two provisions would result in increased outlays.
Repeal of Medicaid Provisions. Repeal increase in Medicaid eligibility to from 100% to 138% FPL for children ages 6-19 as of December 31, 2019; repeal hospital presumptive eligibility provisions and presumptive eligibility for expansion adults, effective January 1, 2020, and repeal enhanced FMAP for the Community First Choice (CFC) option to provide attendant care services effective January 1, 2020 ($19.2 billion in savings 2017-2026 with $12 billion from CFC repeal)
Reduce Medicaid Costs. Require states to treat lottery winnings and certain other income as income for purposes of determining eligibility; decrease the period when Medicaid benefits may be covered retroactively, and eliminate states’ option to increase the amount of allowable home equity from $500,000 to $750,000 for individuals applying for Medicaid coverage of long-term services and supports ($6.2 billion in savings 2017-2026).
Repeal Medicaid Disproportionate Share Hospital (DSH) cuts for FY2020 – FY2025; exempt non-expansion states from DSH cuts for FY2018 – FY 2019 ($31 billion increase 2017-2016).
Safety-Net Funding. Provide $2 billion in funding in FY 2018 to FY 2021 to states that did not expand Medicaid eligibility under the ACA ($10 billion increase 2017-2026).
Interaction with Other Provisions.
Planned Parenthood. Prohibit funding for Planned Parenthood from Medicaid, which would reduce direct spending by $234 million over the 2017-2026 period; but savings would be partially offset by increased Medicaid spending for additional births ($.1 billion over the 2017-2026 period) and some new Medicaid coverage costs.
Marketplace Provisions. Eliminate penalties associated with the individual mandate results in fewer people enrolling in Medicaid.
President Trump’s fiscal year 2018 budget request would cut global health programs by approximately $2.5 billion. As Congress begins considering the Administration’s request, a new Kaiser Family Foundation analysis models the potential impact of the Administration’s proposed budget, as well as two budget scenarios with more modest decreases.
Among the findings, the impact of global health budget reductions, depending on the size of the cuts, could range from:
49,100 to 198,700 additional new HIV infections
7,600 to 31,100 additional new TB cases
6.5 million to 25 million fewer couples/women receiving contraception
7,000 to 31,300 additional maternal, newborn, and child deaths
The analysis uses newly-developed budget impact models that examine the relationship between funding levels in U.S.-supported countries and health outcomes to gauge the magnitude and direction of U.S. global health funding.
The Children’s Health Insurance Program (CHIP) is an important complement to Medicaid, covering 8.9 million children with family incomes above Medicaid eligibility limits who often lack access to affordable private coverage.1 Together with Medicaid, which covers an additional 37.1 million children,2 the programs provide a strong base of coverage for our nation’s low-income children. New legislative authority is needed to continue funding for CHIP beyond September 2017. Failure to extend CHIP funding would likely result in coverage losses for children and increased financial pressure for states. These effects would be compounded if combined with the changes in the American Health Care Act (AHCA), which would fundamentally restructure Medicaid by capping federal funding and eliminate longstanding federal protections and standards for children. Following are key facts that highlight what is at stake for children.
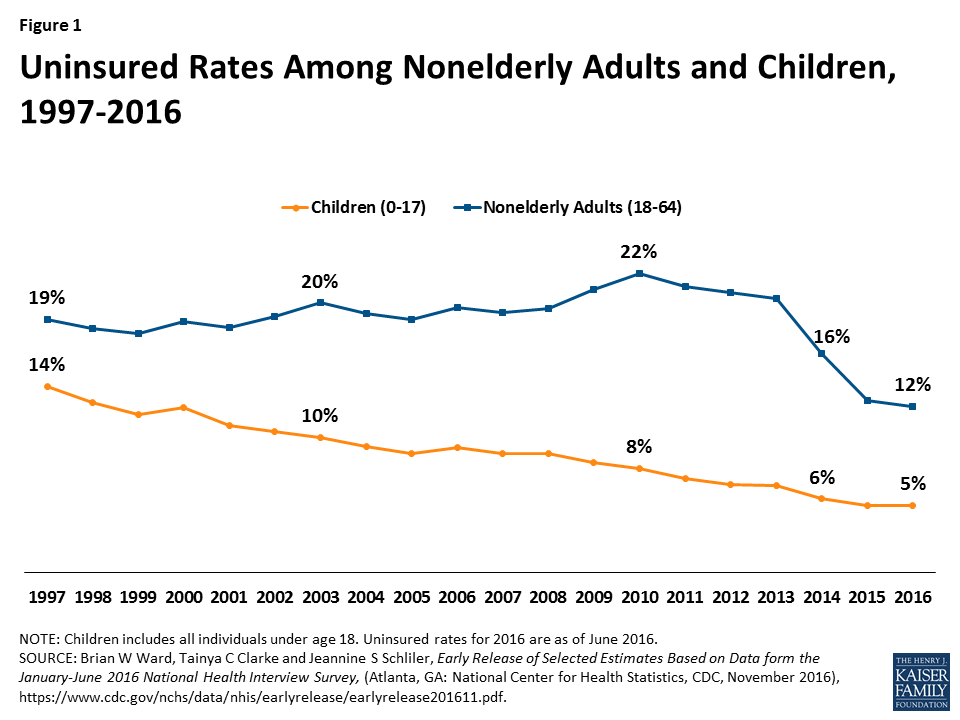
Expansions of Medicaid and CHIP have helped reduce the children’s uninsured rate to a record low of 5% (Figure 1).
Figure 1: Uninsured Rates Among Nonelderly Adults and Children, 1997-2016
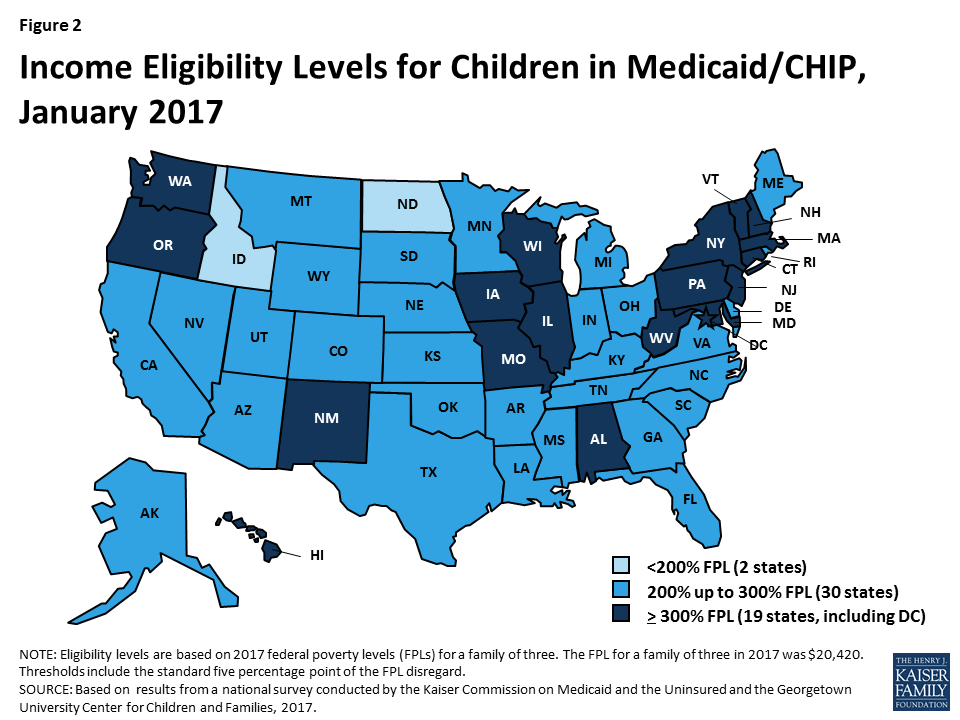
All states have expanded eligibility for children through Medicaid and CHIP above federal minimum levels (Figure 2).
Figure 2: Income Eligibility Levels for Children in Medicaid/CHIP, January 2017
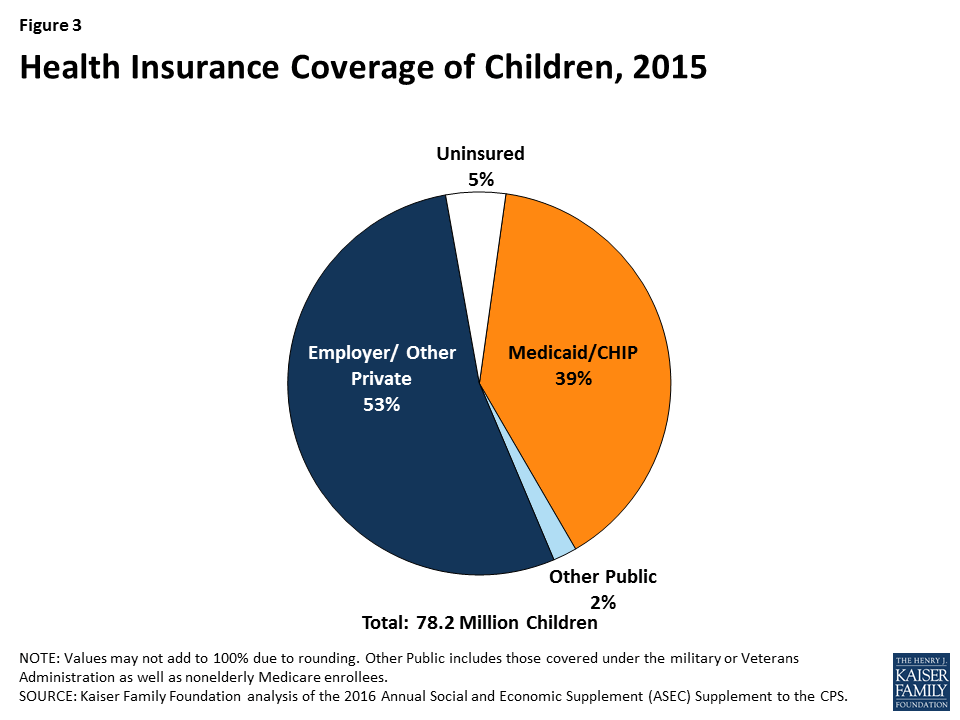
Medicaid and CHIP are major sources of coverage for our nation’s children (Figure 3).
Figure 3: Health Insurance Coverage of Children, 2015
In 2017, Congress has been debating legislation, the American Health Care Act (AHCA), which would end the enhanced federal matching funds for the Affordable Care Act (ACA) Medicaid expansion and fundamentally alter the structure and financing of the Medicaid program. Specifically, it would cap and significantly reduce the amount of federal funding provided to states for Medicaid through a per capita cap or block grant. The Congressional Budget Office estimated that the AHCA as passed by the House would reduce federal Medicaid spending by $834 billion from 2017-2026 and reduce enrollment by 14 million by 2026 compared to projections in current law. The proposed Trump Administration budget for FY 2018 would have deeper Medicaid reductions.
The cap on federal funding would lock-in current state spending patterns that reflect historic Medicaid policy choices. Today, Medicaid is a state and federal partnership where the federal government sets core requirements for Medicaid and states administer the program; financing for Medicaid is shared by states and the federal government with no caps. Due to flexibility in the current law, states historically have made different Medicaid decisions related to coverage, scope of benefits, reimbursement rates and delivery system models. In response to a funding cap, each state would need to make budget decisions to fill in gaps in federal funding (through taxes or other budget cuts) or to restrict Medicaid programs.
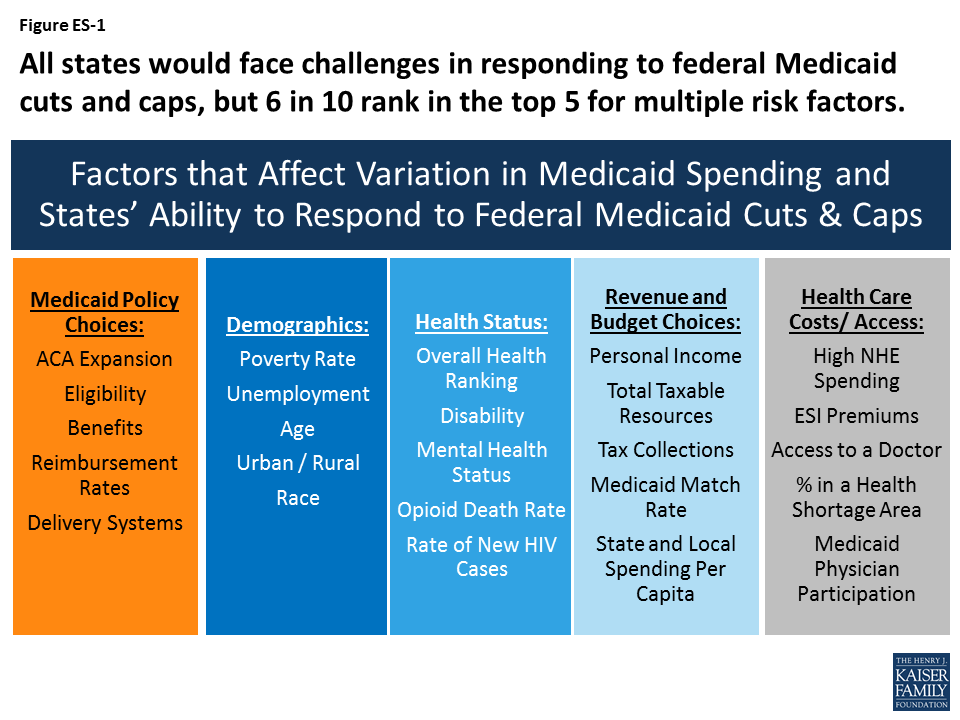
All states could face challenges responding to federal Medicaid cuts and caps to varying degrees, but states with certain characteristics are more at risk. This analysis examines 30 factors in five groups that could be high risk factors affecting states’ ability to respond to federal Medicaid cuts and caps and identifies states ranked in the top five for each factor as high risk (ES-1). This analysis shows that more than 6 in 10 states rank in the top five for multiple risk factors. Eleven states rank in the top five for five or more risk factors (Alabama, Arizona, Florida, Georgia, Kentucky, Louisiana, Mississippi, New Mexico, South Carolina, Texas, and West Virginia).
Figure ES-1: All states would face challenges in responding to federal Medicaid cuts and caps, but 6 in 10 rank in the top 5 for multiple risk factors.
States that adopted the Medicaid expansion have experienced gains in coverage and financing that are at risk under proposals like the AHCA that would end the enhanced federal match for the expansion. However, states that have not adopted the expansion would lose the option to access enhanced federal matching dollars for coverage in the future.
Arkansas, Kentucky, Nevada and Oregon are among states that rank in the top five for multiple risk factors tied to the end of enhanced funding for expansion (i.e. large coverage gains, a high share of expansion enrollees, and a high share of expansion funding relative to the total). In total numbers, California, New York, Pennsylvania, Ohio and Illinois account for the largest number of enrollees in the expansion group (54%) and California, New York, Ohio, Michigan and Illinois account for the highest levels of federal expansion funding (52%).
Non-expansion states would lose the future option to provide coverage to poor uninsured adults with enhanced federal dollars. Florida, Georgia and Texas have the largest number of uninsured residents who fall into the coverage gap (i.e. not eligible for Medicaid but have incomes below poverty so are not eligible for tax credits in the Marketplace) and the highest overall uninsured rates.
States with limited Medicaid programs and other challenging characteristics such as poor demographic indicators, poor health status, high cost health care markets and low state fiscal capacity could face more challenges in responding to per capita cap or block grant policies. States with limited Medicaid benefits or low provider reimbursement rates have less room to make further restrictions in benefits or to lower rates in response to reductions in federal financing. For these states, trade-offs within Medicaid would be difficult. States with an aging population, high levels of disability, a high share of people in health professional shortage areas or low per capita income may have higher demand for Medicaid services, but less capacity (especially with limited federal financing) to address those issues. In addition, because financing caps lock states into historic Medicaid decisions, states with limited programs and other risk factors will have a harder time adapting to future changes such as increased costs or changing demographics. One example of an emerging health issue is the opioid epidemic. Medicaid plays a central role in the nation’s effort to address the opioid epidemic through coverage of people struggling with opioid addiction and financing for states, limited funding could impede efforts to address this as well as other future health issues.
The findings below show states that rank in the top five for multiple risk factors within each of the five categories (beyond expansion):
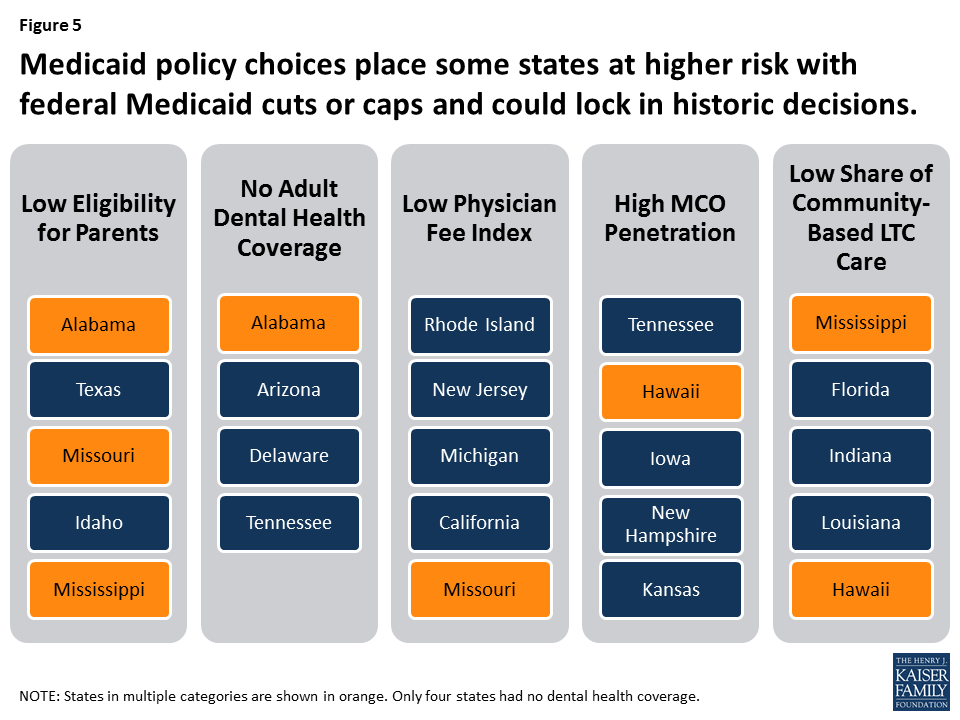
Medicaid Policy Choices:Alabama, Hawaii, Mississippi and Missourihave more than one restrictive Medicaid policies that would make it more challenging for them to implement additional program reductions (i.e. low eligibility levels, limited benefits, low provider reimbursement, high managed care penetration and/or a lower share of community based long-term care services).
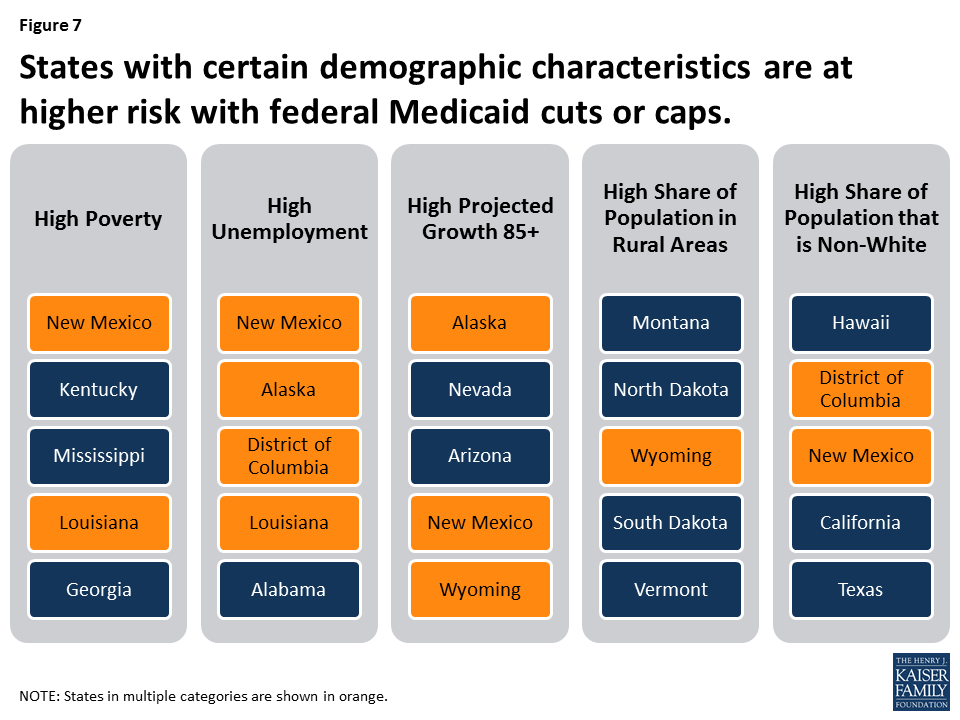
Demographics: Alaska, District of Columbia, Louisiana, New Mexico and Wyomingeach have multiple demographic characteristics that indicate higher needs for Medicaid (i.e. high poverty, high unemployment, faster expected growth in the 85 year old population, high share of the population in rural areas, and / or high share of the population that is non-white).
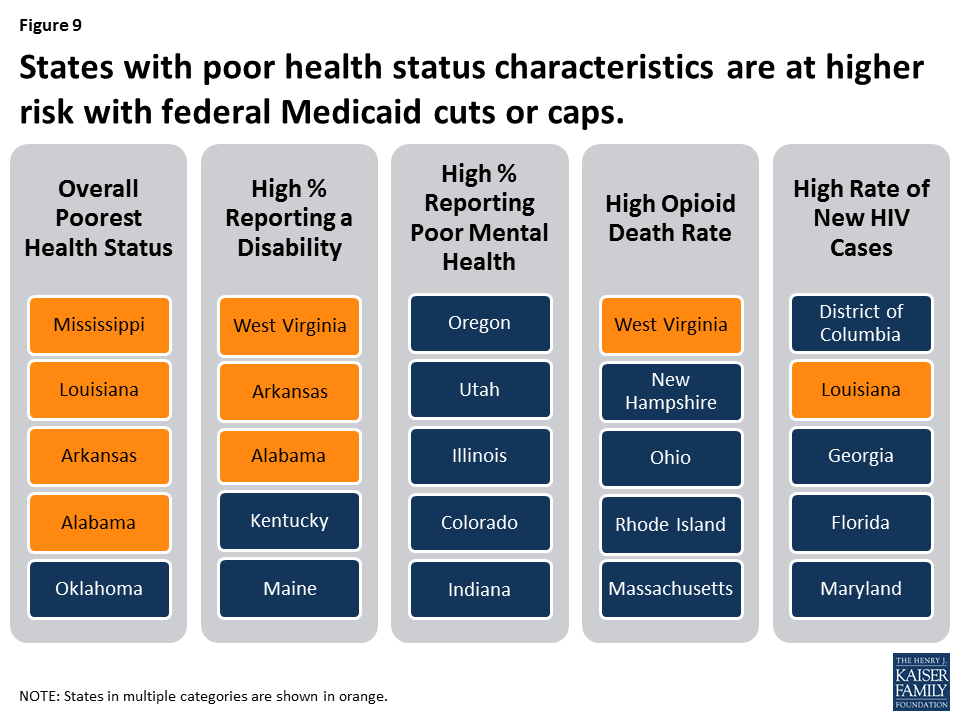
Health Status: Alabama, Arkansas, Louisiana, Mississippi and West Virginia have populations with multiple high health needs (i.e. overall poor health status, high share reporting a disability, high share reporting poor mental health, high opioid death rate and/or high rate of new HIV cases). Ohio, New Hampshire and West Virginia reported the highest opioid related drug overdoses at over 24 people in every 100,000.
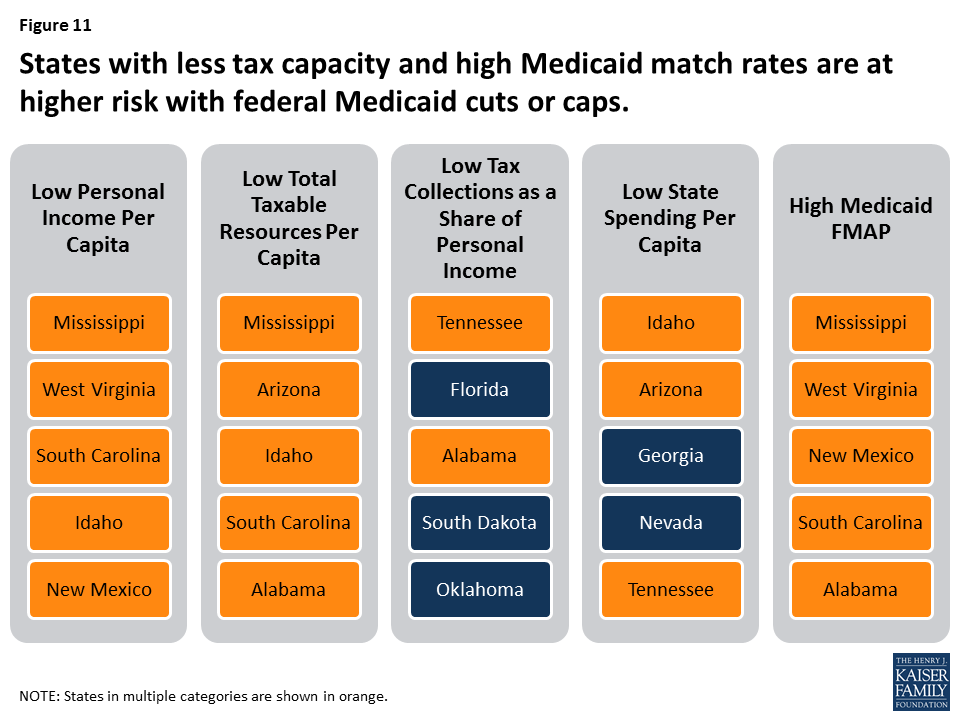
Revenue and Budget Choices: Alabama, Arizona, Idaho, Mississippi, New Mexico, South Carolina, Tennessee and West Virginiahave multiple tax capacity challenges (i.e. low personal income, low total taxable resources, low tax effort or share of taxes relative to personal income, high Medicaid match rates, and/or low state and local spending per capita).
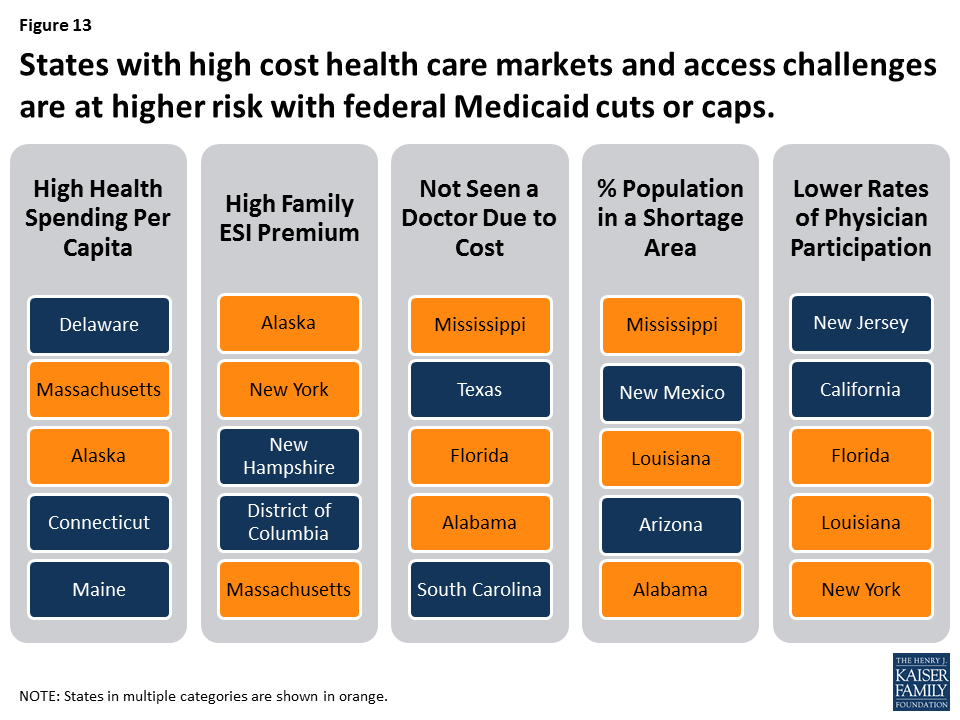
Health Care Costs/Access: Alaska, Alabama, Florida, Louisiana, Massachusetts, Mississippi and New Yorkhave high cost health care markets and access challenges (i.e. high national health expenditures per capita, high employer sponsored insurance premiums, high share or people not seeking care due to cost, high share of the population in a shortage area and/or lower Medicaid physician participation).
While all states have risk factors to varying degrees, this analysis shows that more than 6 in 10 states rank in the top five for multiple risk factors. Eleven states rank in the top five for five or more risk factors (Alabama, Arizona, Florida, Georgia, Kentucky, Louisiana, Mississippi, New Mexico, South Carolina, Texas, and West Virginia). States that have multiple risk factors could face even more challenges making Medicaid program cuts or filling gaps in federal funding. Looking ahead, limiting the growth in federal Medicaid spending could force states to make difficult choices in their current programs and could also limit states ability to afford new drug therapies or other medical advances, adapt to changing demographics or make future investments to improve delivery systems or address broader health status issues in the future.
Tables with state-level data for each of the 30 risk factors considered in the analysis are included at the end of the report. Sources for data included in the tables and described in the report can be found in the appendix.
Issue Brief
Introduction
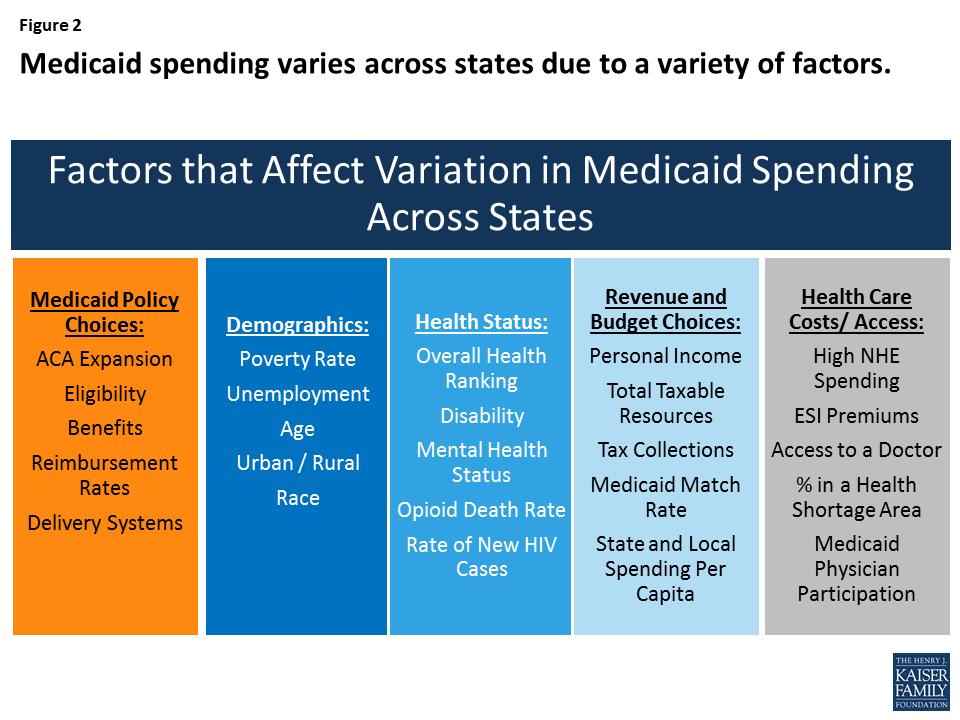
Medicaid, the nation’s primary health insurance program for low-income and high-need Americans, is jointly financed by states and the federal government, but states administer Medicaid programs within broad federal rules. Under federal law, Medicaid provides an entitlement to coverage to individuals who are eligible for the program and a guarantee to federal matching dollars. Given the current financing structure of the program, Medicaid is both a budget item and a revenue item in state budgets. State Medicaid policy choices (including the ACA coverage expansion, other eligibility levels, scope of benefits, reimbursement rates and delivery system models) as well as other factors such as demographics, health needs, health care markets, and state fiscal capacity affect Medicaid spending. Due to all of these factors, Medicaid coverage and financing vary significantly across states (Figures 1 and 2).
Figure 1. State Characteristics
>
For notes and sources, see the appendix.
Figure 2: Medicaid spending varies across states due to a variety of factors.
This brief, builds on earlier work that examined the factors contributing to variation in Medicaid spending from 2012. This update reflects changes including the implementation of the ACA and a slowly improving economy. In 2017, Congress has been debating the AHCA, legislation that could eliminate enhanced federal matching funds for the ACA Medicaid expansion and fundamentally change the structure and financing of the overall program by capping and significantly reducing the amount of federal funds provided to states. This brief examines 30 key factors that contribute to variation in Medicaid per enrollee spending and highlights states that may be at particularly high risk under federal cuts or caps in Medicaid funding. We identify “high risk” states as ranking in the top five for each factor. While we use this ranking construct, there may not be significant differences between states that follow in rank order. The brief has findings in five key areas:
Medicaid policy choices (including implementation of the ACA Medicaid expansion);
Demographics;
Health status;
Available tax revenues and state budget choices; and
Health care markets (costs and access).
Table 1 includes state level data to show expansion status, Medicaid per enrollee spending for FFY 2014 and number of state residents. The appendix provides sources for data included in the tables and described in the report.
Key Findings
1. Medicaid Policy Choices
Medicaid ACA Expansion
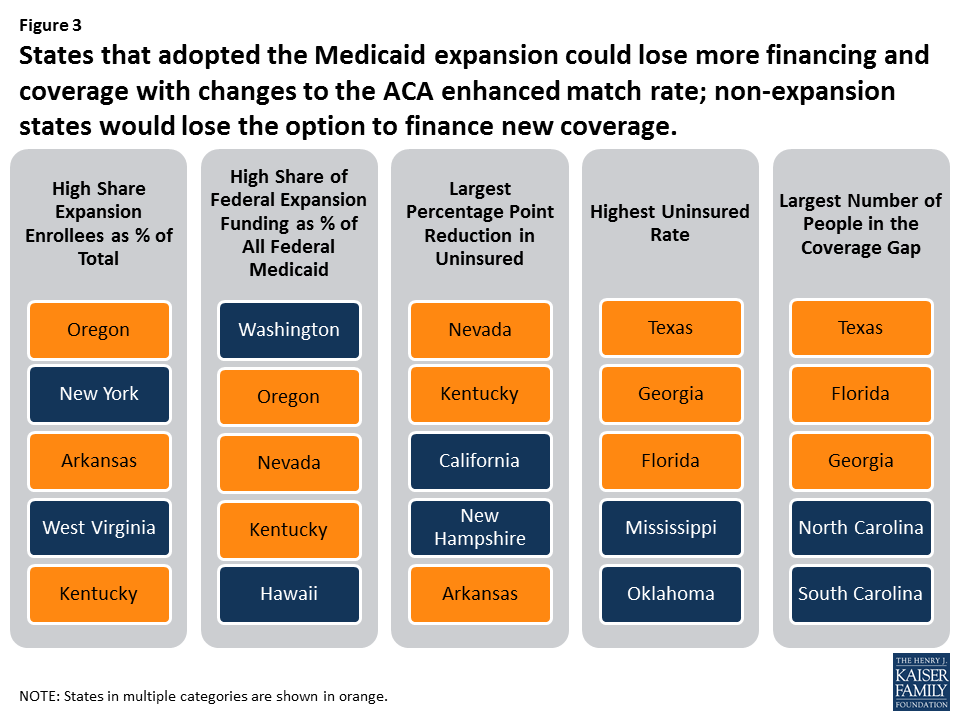
The ACA expanded Medicaid coverage to nearly all adults up to 138% of the federal poverty level (FPL) and provided states with enhanced federal financing for this new coverage; however, the Supreme Court ruling that effectively gave states the option to adopt the expansion resulted in even greater variation in Medicaid programs across states. Following the implementation of the ACA in 2014, millions of people have enrolled in new coverage options (Medicaid and Marketplace), and the uninsured rate for the non-elderly had dropped to a historic low of 10% by early 2016. The proposed elimination of federal enhanced matching funds for the ACA Medicaid expansion included in the AHCA would have different implications for states based on the decision to implement the expansion and the effects of that decision in a given state. States that expanded have experienced benefits tied to coverage gains and financing that could be at risk, while non-expansion states risk the future loss of Medicaid enhanced matching funds for expansion (Figure 3 – states in multiple categories are shown in orange).
Figure 3: States that adopted the Medicaid expansion could lose more financing and coverage with changes to the ACA enhanced match rate; non-expansion states would lose the option to finance new coverage.
Expansion States. Policy proposals that would end the enhanced federal matching funds for the ACA Medicaid expansion could have significant implications for coverage and financing in expansion states. To date, 32 states (including DC) adopted the Medicaid expansion. Coverage gains were particularly large among low-income people living in states that expanded Medicaid. At the start of 2016, there were 14.4 million adults in the Medicaid expansion group, including 11 million who were “newly” eligible due to the ACA expansion. Overall, expansion enrollment accounted for about 20% of all Medicaid enrollment. From 2014-2016, the federal government financed 100% of the costs of those newly eligible under the expansion. Under the law, this rate phased down to 95% in 2017 and gradually phases down to 90% by 2020. Federal funding for the expansion group totaled $68.2 billion in FY 2015 (about 21% of all federal Medicaid funding). In total numbers, California, New York, Pennsylvania, Ohio and Illinois account for the largest number of enrollees in the expansion group (54%) and California, New York, Ohio, Michigan and Illinois account for the highest levels of federal expansion funding (52%).
In Oregon, New York, Arkansas, West Virginia, and Kentucky, Medicaid expansion enrollees accounted for 35% or more of total enrollment (Figure 4).
In Washington, Oregon, Nevada and Kentucky, expansion funding accounts for at least 40% of all federal Medicaid funds.
Nevada, Kentucky, California, New Hampshire and Arkansas experienced the largest percentage point reduction in the uninsured from 2013 to 2015.
Non-Expansion States. The 19 states that have not expanded would lose the option to expand in the future and access to enhanced federal funds to support their capacity to cover low-income uninsured adults. Most of the non-expansion states (12 of 19) limit Medicaid eligibility for parents to less than half the poverty level and other low-income adults are not eligible regardless of income, except in Wisconsin. Many poor parents and other adults in these states fall into a coverage gap since they do not qualify for Medicaid, but have incomes below 100% of poverty so cannot access tax credits to purchase Marketplace coverage. The ongoing coverage gap for low-income adults in these states limits state capacity to achieve overall improvements in population health. Texas, Florida, Georgia, North Carolina, and South Carolina are the states with the highest number of adults who fall into the coverage gap.
Table 2 includes state level data related to the ACA Medicaid expansion and source information can be found in the appendix.
States with more limited Medicaid programs in terms of eligibility, benefits and payment rates could be at higher risk with reductions or caps in federal financing because it could be more difficult for these states to find savings if some core federal requirements remain in place. Moreover, nearly all community based long-term care services are an optional service in Medicaid, so states that have lower levels of home and community-based services (HCBS) may find it difficult to expand these services to shift utilization and achieve savings from reductions in more costly institutional care in the face of federal Medicaid cuts. The AHCA repeals the 6% enhanced federal funding for the Community First Choice Option to provide attendant care services as of 2020, which would result in a $12 billion decrease in federal funding over 10 years and further hinder efforts to increase community integration. In addition, states that have already moved enrollees to managed care would not be able to recoup some of the one-time savings that some states experience in that transition.
Figure 5 identifies states with restrictive Medicaid programs that would face particular challenges to achieving increased savings within their programs in response to reductions in federal funding. States in multiple categories are shown in orange.
Figure 5: Medicaid policy choices place some states at higher risk with federal Medicaid cuts or caps and could lock in historic decisions.
Eligibility. Federal law requires states to cover certain population groups up to minimum income eligibility levels in order to receive federal matching funds. States can expand coverage beyond federal minimum levels and receive federal matching funds. As of January 2017, the median eligibility levels were 255% of the federal poverty level (FPL) for children and 138% FPL for parents and adults without dependent children. Eligibility levels for adults in non-expansion states are much lower for parents and Wisconsin is the only non-expansion state to provide Medicaid coverage to childless adults. Alabama, Texas, Missouri, Idaho and Mississippi have the lowest eligibility levels for parents. The median eligibility thresholds for parents in non-expansion states is 44% FPL (Figure 6).
Figure 6. Medicaid Policy
>
For notes and sources, see the appendix.
Benefits. States participating in Medicaid must cover a core set of benefits, but states can also receive federal matching funds for coverage of “optional benefits.” All states cover some optional benefits, but the scope of state benefit packages varies widely across states. States also have flexibility in determining the amount, duration and scope of the benefits they offer. Adult dental benefits can be used as a proxy to understand the variation across state benefit packages. While almost all states (46) and DC currently provide some dental benefits for adults in Medicaid, the scope of Medicaid adult dental benefits varies widely by state. As of February 2016, 15 states provided extensive adult dental benefits, 19 states provided limited dental benefits, and 13 states covered only dental care for pain relief or emergency care for injuries, trauma, or extractions. Four states provided no dental benefits at all. Like other optional Medicaid services, adult dental benefits are often cut when states face budget pressures.
Payment Rates/Physician Fees. States largely determine provider payments within limited federal requirements. Federal law requires that payments be consistent with efficiency, economy, quality and access, and safeguard against unnecessary utilization. For physicians and other providers, states are required to pay rates that are sufficient to ensure access equal to the rest of the area population. In 2014, Medicaid paid physicians on average 66% of Medicare rates and 59% of what Medicare pays for primary care. Relative to what other states reimburse for physicians, Rhode Island, New Jersey, Michigan, California and Missouri have the lowest physician fee index.
Managed Care. Today, 39 states contract with managed care organizations (MCOs) and risk-based managed care is the dominant delivery system in Medicaid. Hawaii, Tennessee, Iowa, New Hampshire, Kansas and New Jersey all report that at least 95% of enrollees are in MCOs. Sometimes, when states first transition to managed care arrangements, they can see some savings relative to fee-for-service arrangements, but savings are not sustained not over time. States that have already transitioned to managed care have less ability to use this as a mechanism to reduce future per enrollee costs.
Long-Term Care Setting. Medicaid covers a continuum of long-term care service settings. Driven by requirements under the Americans with Disabilities Act (ADA), consumer preferences and efforts to control long-term care costs, states continue to work on reorienting their Medicaid long-term care delivery systems away from institutional settings and toward more community-based services. Overall, more than half of spending (55%) for long-term care is for HCBS, but this varies by state from a high of 82% in Oregon to 31% in Mississippi.
Table 3 includes state level data related to Medicaid policies and source information can be found in the appendix.
2. Demographics
Demographic characteristics vary across states. These characteristics affect demand for Medicaid as well as public health services more broadly. States with high rates of poverty, unemployment, and uninsured could have higher demands for Medicaid. Similarly, because Medicaid is the largest provider of long-term services and supports, states with higher shares of elderly as well as states facing the fastest growth projections in their population over 85 years old could face increased demand for Medicaid. In addition, Medicaid plays an important role in providing coverage to people of color as well as people in rural areas. States with demographic factors that contribute to high demand for Medicaid could be disproportionately impacted by cuts or caps in federal Medicaid funding compared to other states. High demand and limited funding could make it challenging for these states to meet the needs of the residents in their state. Individuals in poverty or who are unemployed are unlikely to have another source of health coverage and those who are uninsured are at risk for not getting needed health services.
Figure 7 highlights states with demographic characteristics that lead to increased need for Medicaid. States in multiple categories are shown in orange.
Figure 7: States with certain demographic characteristics are at higher risk with federal Medicaid cuts or caps.
Poverty. Many government assistance programs are targeted to help low-income families. Programs administered or supported by the United States Department of Health and Human Services (HHS) use the department’s federal poverty guidelines. The annual federal poverty level in 2017 is $12,060 for an individual and $20,420 for a family of three. In 2015, 14% of people living in the U.S. had incomes below the poverty level. The percent of the population living below poverty varies by state, ranging from less than 10% of residents in Alaska, Connecticut, Minnesota, New Hampshire and Utah up to 20% in Kentucky and New Mexico.
Unemployment. During an economic downturn, individuals lose jobs, incomes drop, and state revenues decline at the same time that demand for public programs such as Medicaid, cash assistance, and food stamps increase. During the most recent recession, unemployment peaked at 10% in October 2009. The economy has been improving since then and unemployment rates have been stable at less than 5% since May 2016, but rates vary across states. As of April 2017, the national unemployment rate was 4.4%. Colorado, Hawaii, Maine, Nebraska, New Hampshire, North Dakota, and South Dakota had unemployment rates at 3% or less, while Alaska and New Mexico had rates greater than 6%.
Age. Demand for health care services varies by age. For example, those over the age of 65 are more likely to need long-term care services than children, who generally require fewer medical services and mostly preventive care and acute care. In 2015, the elderly accounted for 15% of the population and the population 85 years of age and older accounted for 2%.1 From 2015 to 2030, the percent of the population 85 years and older is expected to grow by 41% with 21 states projecting growth in the 85 and older population of more than 50% (Figure 8).
Figure 8. Demographics
>
For notes and sources, see the appendix.
Rural. States with large rural populations tend to have poorer residents with complex and costly health needs, which are often exacerbated by workforce shortages and large geographic distances between patients and providers. Medicaid plays a central role in helping to fill gaps in private coverage in rural areas. States including Montana, North Dakota, and Wyoming have all of their populations living in rural areas.
Table 4 includes state level data related to demographic characteristics and source information can be found in the appendix.
3. Health Status
Health status characteristics vary across states and these characteristics affect demand for Medicaid as well as public health services more broadly. Medicaid plays an important role in serving individuals with disabilities, addressing public health crises, and providing mental health care. Medicaid also plays a central role in helping states address the opioid crisis and the HIV epidemic. Cuts or caps in federal Medicaid financing could increase the challenges in addressing the opioid and HIV epidemics and providing care for individuals with disabilities. Figure 9 shows states that have particularly high health needs across certain measures; states in multiple categories are shown in orange.
Figure 9: States with poor health status characteristics are at higher risk with federal Medicaid cuts or caps.
Overall Health Ranking. America’s Health Rankings® Annual Report provides annual state-by-state rankings based on behaviors, community and environment, policy, clinical care, and outcomes data. Based on these data, Hawaii, Massachusetts, Connecticut, Minnesota and Vermont are the healthiest states and Mississippi, Louisiana, Arkansas, Alabama and Oklahoma have the greatest challenges.
Disability. Medicaid covers more than 3 in 10 nonelderly adults with disabilities, providing a broad range of medical and long-term care services that enable people with disabilities to live and work in the community. There are a number of factors that determine the need for health and long-term care services in states, including the prevalence of disability and chronic conditions as well as other indicators of health. In 2015, 13% of the non-institutionalized population reported having a disability. Sixteen states had 15% or more of noninstitutionalized people reporting a disability (Figure 10). In FY 2014, Medicaid enrollees with a disability accounted for 40% of Medicaid spending, but only 14% of Medicaid enrollment; the spending per enrollee for these individuals was three times as much as the average spending per all enrollees.2
Figure 10. Health Status
>
For notes and sources, see the appendix.
Mental Health. The Medicaid program covers a disproportionate share of individuals with behavioral health conditions. More than one in four adults with Medicaid (27%) have a mental illness. The Medicaid program serves as a safety net for many low-income individuals with behavioral health conditions by facilitating access to and financing numerous services, including clinical services, case management, prescription medication and rehabilitative services. Over one-third of adults nationally (35%) report poor mental health.
Opioid Deaths. The opioid epidemic is increasing among Americans with addiction to heroin and prescription painkillers. Medicaid plays a central role in the nation’s effort to address the opioid epidemic through coverage of people struggling with opioid addiction and financing for states. In 2015, more than 10 people in every 100,000 died from an opioid related drug overdose nationally and opioid overdoses accounted for 63% of all drug overdoses. West Virginia, New Hampshire and Ohio reported the highest opioid related drug overdoses at over 24 people in every 100,000.
HIV. Medicaid is the largest source of coverage for individuals with HIV. By covering more people with HIV and increasing state capacity to provide treatment to individuals with HIV, Medicaid plays a key role in curbing the epidemic. In 2015, the new HIV diagnoses rate among adults and adolescents was 14.7 people for every 100,000.
Table 5 includes state level data related to health status and source information can be found in the appendix.
4. Available Revenues And State Budget Choices
States vary in the amount of revenue resources available and in how they tap into those resources to pay for public services and programs. States also make different decisions about how revenue is allocated across different areas of spending. Medicaid is an important revenue source for states, but also a major source of spending. Figure 11 highlights states with lower tax bases, lower tax collections and higher federal Medicaid match rates, which would be at higher risk with reductions or caps in federal financing because it would be more difficult for these states to offset the loss of federal funds with state funds. States in multiple categories are shown in orange.
Figure 11: States with less tax capacity and high Medicaid match rates are at higher risk with federal Medicaid cuts or caps.
Tax Base. A states’ tax base provides a measure of resources that may be available to a state. Two measures of tax base include personal income and total taxable resources. Per capita personal income3 is currently used to determine the Federal Medical Assistance Percentage (FMAP) for Medicaid. States with low personal income per capita have a higher FMAP. Personal income per capita does not include all potential taxable income sources in a state.4 In 2014, personal income per capita was $46,049 nationally (Figure 12). Total taxable resources (TTR) is an alternative and more comprehensive measure of tax base designed to better account for a state’s available resources to provide public services.5,6 Mississippi, West Virginia, South Carolina, Idaho and New Mexico had the lowest personal income per capita in 2014. Mississippi, Arizona, Idaho, South Carolina and Alabama had the lowest TTR in 2014.
Figure 12. Available Revenues and State Budgets
>
For notes and sources, see the appendix.
Tax Collections. Tax collections are one measure of how a state taps into its available resources. In 2014, tax collections per capita averaged $4,675 across the U.S.7 This brief examines tax collections as a percent of personal income as a proxy for a more representative measure of tax effort, that is, how much a state collects in taxes relative to its tax capacity. Tax collections as a share of personal income averaged 10%. Tennessee, Florida, Alabama, South Dakota and Oklahoma had the lowest tax collections as a share of personal income.
State and Local Spending Per Capita. Because states must balance their budgets annually, state spending is a function of how much revenue is collected. Average state and local spending per capita in 2014 was $8,489. Idaho, Arizona, Georgia, Nevada and Tennessee had the lowest state and local spending per capita from all sources.
Federal Medical Assistance Percentage (FMAP). As noted above, the FMAP is based on a state’s relative personal income per capita. States with lower relative personal income have a higher FMAP. In FY 2018, the FMAP ranged from a floor of 50% to a high of 76% in Mississippi.
Table 6 includes state level data related to income, tax, spending data and FMAP variables and source information can be found in the appendix.
5. Health Care Markets (Costs and Access)
Medicaid programs purchase services from the private market as other insurers do. Therefore, some of the variation in Medicaid spending is due to differences in health care markets and the ability to access care as well as the number of providers and health care facilities in a given state. The share of the population living in health professional shortage areas and the share of providers accepting Medicaid also varies by state and can contribute to overall variation in per enrollee costs. Figure 13 highlights states with high health care costs and limited access, which could be at higher risk under reductions or caps in federal financing because it would become increasingly difficult to purchase services in a high cost market or make improvements in access to care. It also highlights states with low Medicaid physician participation, which would be at risk under Medicaid cuts or caps because it would be difficult to increase provider rates beyond the caps to promote additional provider participation. States in multiple categories are shown in orange.
Figure 13: States with high cost health care markets and access challenges are at higher risk with federal Medicaid cuts or caps.
Health Care Costs. Medicaid spending is, in part, affected by the cost of procuring health care in the state market. Differences in the cost of obtaining health care in a particular state affects the amount state Medicaid programs have to spend in order to purchase services. Health care costs typically outpace inflation. In 2009, national health expenditures (NHE) per capita were $6,815. Half of all U.S. residents and 56% of non-elderly residents are covered by employer-sponsored insurance (ESI) plans. In 2015, the average premium cost for a family (including the employee and employer shares) for employer-based coverage was $17,322 (with 73% paid by the employer).
Access to Care. Access varies across states due to factors such as provider availability, geography and population density, payment, and other local factors. The presence of access barriers may influence Medicaid beneficiaries’ ability to access services and, in turn, state Medicaid spending. Nationally, 13% of the population reported that they had not seen a doctor because of cost. This was most likely to occur in Mississippi, Texas, Florida, Alabama, and South Carolina. Areas with a documented shortage of providers are designated as Health Professional Shortage Areas (HPSAs) by the Health Resources and Services Administration (HRSA). As of December 2016, HRSA had designated 6,626 primary care HPSAs across the country, affecting over 66 million people. Nationally, 20% of the population lives in a primary care HPSA. Mississippi, New Mexico, Louisiana, Arizona and Alabama have the highest share of their populations in primary care HPSAs (Figure 14).
Figure 14. Health Care Markets (Cost and Access)
>
For notes and sources, see the appendix.
Physician Participation. Nationally, 69% of all office-based physicians accept new Medicaid patients. The percentage of physicians accepting new Medicaid patients varies by state, ranging from 39% in New Jersey to 97% in Nebraska. In one-quarter of states (14), more than 85% of physicians accept new Medicaid patients.
Table 7 includes state level data related to health care market costs and access, and source information can be found in the appendix.
Looking Ahead
Today, Medicaid is a state and federal partnership. The program is largely administered by states within broad federal rules. States have flexibility to make policy choices related to eligibility, benefits and how to deliver and pay for care. States and the federal government share financing for Medicaid and states have a guarantee to federal matching dollars with no set limit. Under current law, Medicaid spending per enrollee varies across states due to a complex array of factors that involve state policy choices, residents’ needs for public health services as well as health and long-term care, states’ abilities to raise revenue and collect revenue, Medicaid policy choices, and the underlying health care market in a state.
Congress continues to debate and consider legislation to eliminate the enhanced match for the Medicaid ACA expansion and cut and cap federal Medicaid financing through a block grant or per capita cap. The cap on federal funding would lock-in current state spending patterns that reflect historic Medicaid policy choices. All states could face challenges responding to federal Medicaid cuts and caps, but states with certain characteristics are more at risk.
Challenging demographics, poor health status, low tax capacity and state spending, high health care costs and poor access are key factors that would place states at higher risk from a per capita cap or block grant. If states are locked in to prior policy choices, states with limited eligibility and benefits, lower provider rates and those that have already moved to capitated care arrangements could be at higher risk with federal Medicaid spending caps because these states would have few options to reduce the scope of the program or generate new efficiencies. States that have seen the largest gains in coverage and those that have high shares of federal Medicaid dollars from the expansion could see the biggest losses if the ACA Medicaid expansion funds are eliminated, while other states that have not expanded, could lose the future opportunity to expand and see similar gains in coverage and financing.
This analysis of 30 factors in 5 groups shows that all states have risk factors to varying degrees; more than 6 in 10 states rank in the top five for multiple risk factors. Eleven states rank in the top five for five or more risk factors (Alabama, Arizona, Florida, Georgia, Kentucky, Louisiana, Mississippi, New Mexico, South Carolina, Texas, and West Virginia). Looking ahead, limiting the growth in federal Medicaid spending could force states to make difficult choices in their current programs and could also limit states’ ability to afford new drug therapies or other medical advances, adapt to changing demographics or make future investments to improve delivery systems or address broader health status issues.
State Tables
Table 1. State Characteristics
>
For notes and sources, see the appendix.
Table 2. Affordable Care Act (ACA) Expansion
>
For notes and sources, see the appendix.
Table 3. Medicaid Policy
>
For notes and sources, see the appendix.
Table 4. Demographics
>
For notes and sources, see the appendix.
Table 5. Health Status
>
For notes and sources, see the appendix.
Table 6. Available Revenues and State Budgets
>
For notes and sources, see the appendix.
Table 7. Health Care Markets (Cost and Access)
>
For notes and sources, see the appendix.
Table Sources
Appendix: Table Notes and Sources
Table 1: State Characteristics
Expansion Status, as of January 1, 2017Source: Kaiser Family Foundation’s State health Facts, Status of State Action on the Medicaid Expansion Decision, as of January 1, 2017.
Share of Medicaid Spending, by Enrollment Group, FFY 2014Source: Kaiser Family Foundation estimates based on analysis of data from the FFY 2014 Medicaid Statistical Information System (MSIS) and CMS-64 reports. Because FY 2014 data was missing some or all quarters for some states, we adjusted the data using secondary data to represent a full fiscal year of enrollment.
Total Number of Residents, 2015Note: Population numbers are rounded to the nearest 100.Source: Kaiser Family Foundation estimates based on the Census Bureau’s March 2016 Current Population Survey (CPS: Annual Social and Economic Supplement).
Federal Expansion Funding, Amount and as a Share of all Federal Medicaid Spending, FFY 2015Note: Alaska expanded on September 1, 2015 and thus reported expansion data for one month in FFY 2015. Louisiana (7/1/2016) and Montana (1/1/2016) expanded after FFY 2015.Source: CMS, Medicaid Budget and Expenditure System (MBES) Expenditure Reports, December 2016.
Nonelderly Uninsured Rate, 2015Source: Kaiser Family Foundation estimates based on the Census Bureau’s March 2014, March 2015, and March 2016 Current Population Survey (CPS: Annual Social and Economic Supplements).
Number of Adults in the Medicaid Coverage Gap, 2016Note: Wisconsin covers adults up to 100% FPL in Medicaid under a waiver but did not adopt the ACA expansion. No data is available for Maine.Source: Kaiser Family Foundation analysis based on 2016 Medicaid eligibility levels and 2016 Current Population Survey.
Percent of Long-Term Care Spending for Home and Community Based Services (HCBS), FY 2015Note: Data do not include expenditures for managed care programs in California and North Carolina. Percent HCBS is not calculated for these states because a significant portion of data are missing.Source: Truven, Medicaid Expenditures for Long-Term Services and Supports (LTSS) in FY 2015, April 14, 2017
Table 4: Demographics
Percent of the population below 100% FPL, 2015Note: The U.S. Census Bureau’s poverty threshold for a family with two adults and one child was $19,078 in 2015.Source: Kaiser Family Foundation estimates based on the Census Bureau’s March 2016 Current Population Survey (CPS: Annual Social and Economic Supplements).
Unemployment Rate, as of April 2017Source: Bureau of Labor Statistics (BLS), Regional and State Employment and Unemployment (Monthly), Table 1, Civilian labor force and unemployment by state and selected area, seasonally adjusted, April 2017; and BLS Employment Situation News Release, State Employment and Unemployment Summary – April 2017, May 19, 2017.
Projected Change in persons 85+, from 2015 to 2030Source: U.S. Census Bureau, Population Division, Interim State Population Projections, 2005, compiled by the US Administration on Aging.
Percent of Total Population that is Non-White, 2015Note: Non-White includes Black, Hispanic, Asians, NHOPIs, American Indians and persons of two or more races.Sources: Kaiser Family Foundation estimates based on the Census Bureau’s March 2016 Current Population Survey (CPS: Annual Social and Economic Supplements).
Table 5: Health Status
Overall State Health Ranking, 2016Note: The Overall Health Status Score is compiled by the United Health Foundation and is a weighted standard deviation relative to the US value. It is based on a series of measures related to health behavior, community and environment, policy, clinical care, and health outcomes. For a complete list of measures and methodology, see http://assets.americashealthrankings.org/app/uploads/ahr16-complete-v2.pdf. The District of Columbia is not ranked.Source: United Health Foundation, America’s Health Rankings: 2016 Annual Report; May 25, 2016.
Percent of Adults Reporting Poor Mental Health, 2015Source: Kaiser Family Foundation analysis of the Centers for Disease Control and Prevention (CDC)’s Behavioral Risk Factor Surveillance System (BRFSS) 2013-2015 Survey Results.
Age-Adjusted Opioid Overdose Deaths Rates, per 100,000Source: Kaiser Family Foundation analysis of Centers for Disease Control and Prevention (CDC), National Center for Health Statistics. Multiple Cause of Death 1999-2015 on CDC WONDER Online Database, released 2016. Data are from the Multiple Cause of Death Files, 1999-2015, as compiled from data provided by the 57 vital statistics jurisdictions through the Vital Statistics Cooperative Program. Accessed at http://wonder.cdc.gov/mcd-icd10.html on March 2, 2017.
Personal Income Per Capita, 2014Source: Bureau of Economic Analysis, state personal income accounts, 2014.
Total Taxable Resources Per Capita, 2014Source: U.S. Department of Treasury, Total Taxable Resources, accessed April 2017.
Tax Collections as a Percent of Personal IncomeSource: KFF analysis of Bureau of Economic Analysis, state personal income accounts, 2015; and U.S. Census Bureau, 2014 State & Local Government Finance, 2014.
KFF analysis of the March 2016 Current Population Survey, Annual Social and Economic Supplement. ↩︎
KFF estimates based on analysis of data from the FFY 2014 Medicaid Statistical Information System (MSIS) and Urban Institute estimates from CMS-64 reports. ↩︎
Personal income is the income that is received by persons from all sources. It is calculated as the sum of wage and salary disbursements, supplements to wages and salaries, proprietors’ income with inventory valuation and capital consumption adjustments, rental income of persons with capital consumption adjustment, personal dividend income, personal interest income, and personal current transfer receipts, less contributions for government social insurance. This measure of income is calculated as the personal income of the residents of a given area divided by the resident population of the area. BEA uses the Census Bureau’s annual midyear population estimates. http://www.bea.gov/regional/definitions/nextpage.cfm?key=Per%20capita%20personal%20income%20%28dollars%29. ↩︎
Items excluded from person income include profits retained for investment purposes by corporations or other business entities and business or commuter income earned in the state by out of state residents, which can be influential in areas with large commuter populations, i.e. New York and New Jersey. ↩︎
TTR estimates are currently used to allocate funds for the Community Mental Health Services and Substance Abuse Prevention and Treatment block grants. ↩︎
Total Taxable Resources (TTR) for the District of Columbia was calculated to be over $101,000. However, because the District of Columbia does not have the same legal right as the states to tax certain resources, using the same methodology to derive TTR estimates for the District of Columbia is flawed. http://www.treasury.gov/resource-center/economic-policy/Documents/wpnewm.pdf. ↩︎
Congress is currently debating the American Health Care Act (AHCA), passed by the House on May 4th 2017. This bill would end the enhanced federal matching funds for the Affordable Care Act (ACA) Medicaid expansion and fundamentally restructure federal Medicaid financing for other eligibility groups. Currently, the federal government matches state Medicaid spending with no limit. The AHCA would cap and significantly reduce federal Medicaid financing provided to states through a per capita cap or, at state option, a block grant for certain populations. Specifically, the AHCA would cap federal Medicaid funding per enrollee starting in FY2020. Each state would have its own federal per enrollee cap based on its Medicaid per enrollee expenditures in 2016 trended forward to 2019. Per enrollee caps would be set for each state by eligibility group. Beginning in 2020, these per enrollee amounts would increase by a set index per eligibility group. These same growth rates would apply to all states. The Congressional Budget Office estimates that the AHCA would reduce federal Medicaid spending by $834 billion from 2017 through 2026.
Current variation in state Medicaid spending per enrollee reflects the flexibility built into the program for states to make policy choices to administer their programs within broad federal rules as well as other factors such as the availability of revenues, demand for service, health care markets, and state budget and policy processes. Using a base year and a uniform index to establish the federal caps, as proposed in the AHCA, would lock in variation in states’ Medicaid spending levels per enrollee and reduce the federal contribution to Medicaid over time. As a result, the proposal would have differential impacts on states’ ability to address changing needs and new health challenges. To understand the potential implications of per capita cap proposals, this data note shows variation in per full-benefit enrollee spending by state and eligibility group.
Medicaid Spending Per Full-Benefit Enrollee
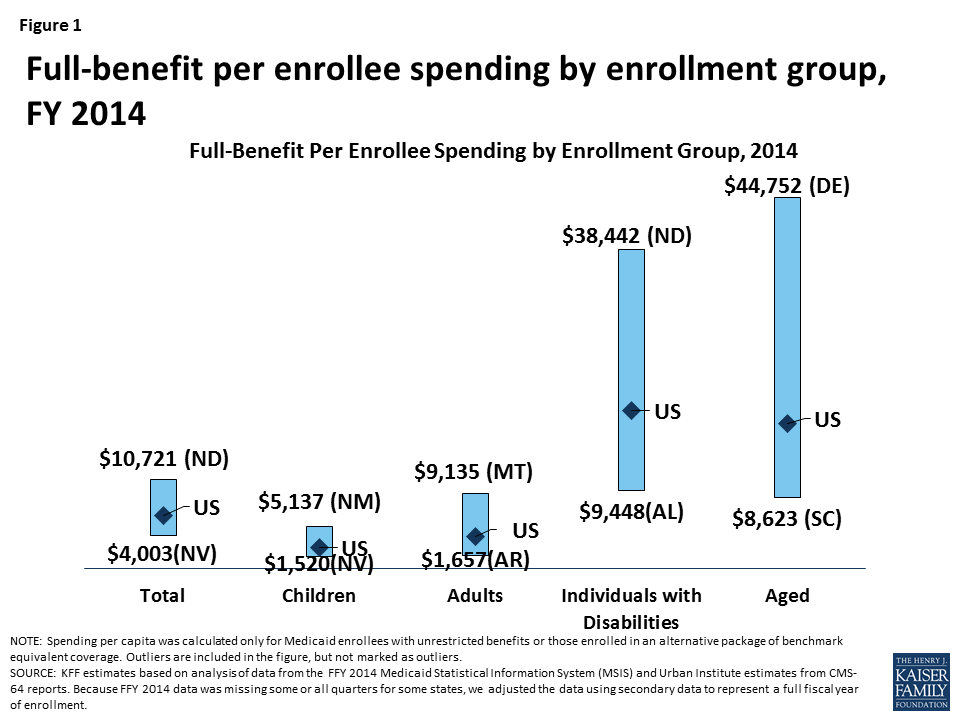
Some Medicaid enrollees are only eligible for “partial benefits.” For example, “partial-benefit enrollees” include those eligible for family planning services only, people who receive only emergency services, those in premium assistance programs, and dual eligibles for whom Medicaid covers only Medicare premiums and cost sharing. Under the AHCA, spending for “partial benefit” enrollees is not subject the cap.1 Among full-benefit enrollees who would be subject to a cap, average Medicaid spending per enrollee was $6,396 in 2014. Per enrollee spending is higher among the aged and individuals with disabilities due to the higher use of complex acute services and long-term care among these populations ($17,476 and $19,033, respectively, for FY 2014). Average spending per Medicaid enrollee was lower for adults and children ($3,955 and $2,602, respectively). For each eligibility group, there is considerable variation across states in per enrollee spending (Figure 1 and Map 1). An additional table provides an index value to show how per enrollee amounts for each state compare to the average per enrollee spending for the US as a whole. For example, spending for full-benefit enrollee ranges from $4,003 to $10,721, or 0.63 (63%) to 1.68 (168%) of the US per enrollee amount.
Figure 1: Full-benefit per enrollee spending by enrollment group, FY 2014
Interactive Map 1: Spending Per Full-Benefit Enrollee, FY 2014 (back to top)
>
Health care spending across payers consistently shows that a small group of high-spenders account for a large majority of the spending. Even within a specific eligibility group within a state, spending varies considerably. We examined states with average per enrollee spending close to the national median and found that wide variation in spending within the eligibility group within states. For example, average spending per disabled enrollee in Pennsylvania is $18,310, but spending ranges from $1,051 for those in the first quartile to $116,515 for those in the top 5th percentile of spending. In Louisiana, spending per aged enrollee ranges from an average of $143 for those in the first quartile to $70,173 for those in the top 5th percentile of spending. Despite the general lower cost for child enrollees, the variation in spending per child was wide in Oklahoma. Similarly, the variation in adult spending per enrollee was wide in Ohio, an expansion state, as well as Mississippi, a non-expansion state. Under a per enrollee cap in federal Medicaid funds, states may face incentives to enroll individuals with lower per enrollee costs or may be challenged to finance their programs if a larger share of high cost individuals enroll.
Table 1: Average Spending Per Full-Benefit Enrollee by Percentile in Select States, FY 2014
Percentile
Aged in Louisiana
Individuals with Disabilities in Pennsylvania
Adults in Ohio
Adults in Mississippi
Children in Oklahoma
0-25%
$143
$1,051
$530
$1,103
$131
>25-50%
$1,436
$10,846
$2,898
$3,625
$735
>50-75%
$16,685
$17,977
$4,981
$4,341
$1,849
>75-90%
$39,931
$23,432
$6,845
$6,293
$4,269
>90-95%
$50,036
$34,642
$10,492
$10,147
$8,186
>95%
$70,173
$116,515
$20,143
$22,205
$24,571
NOTE: We selected states with spending per enrollee for the given eligibility group that was at or close to the national median.SOURCE: KFF estimates based on analysis of data from the FFY 2014 Medicaid Statistical Information System (MSIS) and Urban Institute estimates from CMS-64 reports.
Methods
This analysis is based on KFF estimates from the 2014 Medicaid Statistical Information System (MSIS) and Urban Institute estimates from CMS-64 reports. We adjusted MSIS spending to CMS-64 spending to account for MSIS undercounts of spending. Due to differences in the way CMS-64 and MSIS handle spending for managed long-term services and supports (MLTSS) and increased use of MLTSS in Medicaid, we have revised our methodology of adjusting MSIS to CMS-64. As a result, spending per enrollee totals in this note are not comparable to previously published KFF analysis of Medicaid spending amounts from the MSIS.
Because FY 2014 MSIS data was missing some or all quarters for some states, we also adjusted the enrollment data using secondary data to represent a full fiscal year of enrollment. We accounted for a state’s expansion status, the number of quarters of missing data, and the state’s historical patterns of spending and enrollment in making state-by-state adjustments.
Specifically, for states missing any quarter of enrollment data, we adjusted total enrollment using fiscal year totals in the Medicaid Budget and Expenditure System (MBES), adjusted to account for underlying differences in data between MSIS and MBES. For non-expansion states, we adjusted the distribution of enrollment by eligibility group by using either the existing MSIS data (if any quarters were available) or the previous year’s distribution. For expansion states, we adjusted the distribution of enrollment by eligibility group using either the existing MSIS data (if any expansion quarters were available), the median for expansion states with a full year of data, or the state’s historical distribution (if historical data indicated a higher share of adult enrollment than medians). We estimated full-benefit enrollment among aged, child, and disabled enrollees based on each state’s historical full/partial beneficiary split. We estimated full-benefit enrollment among adult enrollees using either each state’s historical full/partial beneficiary split (for non-expansion states) or, for expansion states, the existing MSIS data (if any expansion quarters were available), the median for expansion states with at least one quarter of expansion data, or the state’s historical distribution (if historical data indicated a higher share of adult enrollment than medians).
We followed a similar approach for adjusting spending data, though fewer spending adjustments were necessary as the spending data had already been adjusted to the full-year CMS-64 data and did not need to account for missing quarters. For non-expansion states with no data, we adjusted the available FY 2013 MSIS data to the FY 2014 CMS-64 data. For expansion states with no data, we estimated total spending using data from the CMS-64 data and distributed the spending by eligibility group based on the median distribution for expansion states. For expansion states that did not have data covering the post-expansion period, we allocated spending across eligibility groups using either the median for other expansion states or the state’s historical distribution (if historical data indicated a higher share of adult spending than medians). We estimated the share of spending for full-benefit enrollees using the same approach used for enrollment.
Adjustments vary across states, and some adjustments were made for the following states: Alabama, Alaska, Colorado, Delaware, District of Columbia, Florida, Illinois, Kansas, Kentucky, Maine, Maryland, Montana, Nevada, New Hampshire, New Mexico, North Carolina, North Dakota, Rhode Island, South Carolina, Texas, and Wisconsin. Due to these adjustments, enrollment and spending estimates here may not match other analysis based on the MSIS data or state’s own reporting systems.
Table 2: Medicaid Spending per Full-Benefit Enrollee (back to top)
>
NOTES: Due to a data quality issue, we are unable to report spending for the elderly in New Mexico. However, we do include this spending in state and national spending per enrollee calculations.
SOURCE: KFF estimates based on analysis of data from the FFY 2014 Medicaid Statistical Information System (MSIS) and Urban Institute estimates from CMS-64 reports. Because FFY 2014 data was missing some or all quarters for some states, we adjusted the data using secondary data to represent a full fiscal year of enrollment.
Table 3: Ratio of State Per Enrollee Spending to the Average US Per Enrollee Medicaid Spending by Eligibility Group (back to top)
>
NOTES: Data represent the ratio of state per full-benefit enrollee spending to the average per full-benefit enrollee spending in the U.S. For example, spending for full-benefit enrollee ranges from $4,003 to $10,721 or 0.63 (63%) of the national average to 1.68 (168%) of the national average. Due to a data quality issue, we are unable to report spending for the elderly in New Mexico. However, we do include this spending in state and national spending per enrollee calculations.
SOURCE: KFF estimates based on analysis of data from the FFY 2014 Medicaid Statistical Information System (MSIS) and Urban Institute estimates from CMS-64 reports. Because FFY 2014 data was missing some or all quarters for some states, we adjusted the data using secondary data to represent a full fiscal year of enrollment.
Eliminating partial-benefit enrollees (including those eligible for family planning services only or dual eligibles for whom Medicaid covers only Medicare premiums and cost sharing but not other Medicaid services) provides a better understanding of what Medicaid spends for people eligible for the full scope of benefits. Eliminating partial-benefit enrollees from the computation of per enrollee spending generally increases estimates of per enrollee spending (because partial-benefit enrollees tend to be less expensive than full-benefit enrollees). This is particularly true for aged beneficiaries, as a relatively large share of enrollees in this category are partial benefit enrollees for whom Medicaid only pays Medicare cost sharing and premiums. ↩︎
Grayson K. Vincent and Victoria A. Velkoff, The Next Four Decades: The Older Population in the United States: 2010 to 2050 (Washington, DC: US Census Bureau, May 2010), https://www.census.gov/prod/2010pubs/p25-1138.pdf
Gretchen Jacobson, Associate Director of the Foundation’s Program on Medicare Policy, testified on June 7, 2017 before the U.S. House Committee on Ways and Means, Subcommittee on Health as part of the Committee’s hearing on Promoting Integrated and Coordinated Care for Medicare Beneficiaries. Her testimony focused on the challenges and opportunities presented by three approaches for integrating and coordinating care for high-cost, high-need Medicare beneficiaries, many of whom are dually eligible for Medicare and Medicaid. These approaches included Medicare Advantage Special Needs Plans (SNPs), the Program of All-Inclusive Care for the Elderly (PACE), and value-based insurance design (VBID) for beneficiaries who choose to enroll in Medicare Advantage plans.
For the first time, 1 in every 3 people with Medicare is enrolled in Medicare Advantage, the private Medicare plans that have played an increasingly large role in the Medicare program over the past decade, according to a new analysis from the Kaiser Family Foundation.
Medicare Advantage enrollment has more than tripled since 2004, reaching 19 million, or 33 percent of enrollees, in 2017, the analysis shows. That milestone is up from 17.6 million beneficiaries (31% ) in 2016, and 11.1 million beneficiaries (24%) in 2010, the year in which Congress reduced payments to Medicare Advantage plans as part of the Affordable Care Act. The Congressional Budget Office has projected that enrollment in Medicare Advantage will continue to rise, reaching 41 percent of all beneficiaries by 2026.
Medicare Advantage enrollment continues to be highly concentrated among a handful of insurers, both nationally and in local markets, the new analysis shows. UnitedHealthcare and Humana together account for 41 percent of enrollment in 2017, for instance, and in 17 states one company has more than half of all Medicare Advantage enrollment – an indicator that these markets may not be very competitive. (Antitrust concerns – in Medicare Advantage and other insurance markets – scuttled recent proposed mergers between Humana and Aetna and Anthem and Cigna.)
The new analysis, Medicare Advantage 2017 Spotlight: Enrollment Market Update, examines trends in this market, including premiums and cost sharing; enrollment and market penetration at the state- and large metropolitan county-level; Medicare Advantage enrollment by firm nationally; and market share of the top three Medicare Advantage firms by state.