Detailed Analysis
Strategies to Reduce Medicaid Acute Care Spending
Premiums, Cost Sharing, and Enrollee Wellness Incentives
Premiums and Cost Sharing
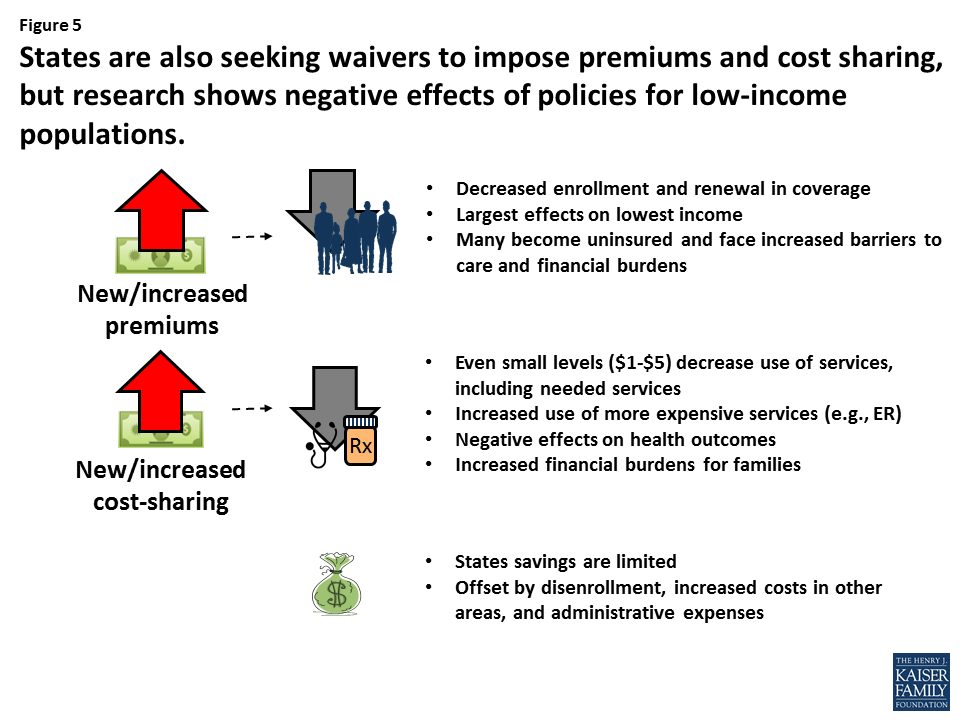
State Medicaid programs are given the flexibility to charge cost sharing (defined here as deductibles, premiums, and copayments) for certain groups of individuals or types of services, subject to limitations. States have greater flexibility to charge cost sharing in the Children’s Health Insurance Program (CHIP) relative to Medicaid. In either program, cost sharing cannot exceed 5% of household income, and Medicaid enrollees with income below 150% of the federal poverty level are generally exempt from cost sharing. Cost sharing shifts some health care costs to enrollees to encourage them to avoid unnecessary care. When enrollees are responsible for some portion of the cost of care, economic theory suggests they will be more selective in the care they choose to consume. Payers can deter the use of low-value services by placing greater cost-sharing requirements on those services, and they can encourage the use of high-value services by removing or lowering cost sharing. Reduced use may translate into lower expenditures for Medicaid, provided the reductions in use are great enough. However, small changes in use may not result in significant changes in program expenditures. We provide a brief overview of the extensive literature on enrollee response to cost sharing, with a specific focus on Medicaid or CHIP.
Charging premiums can lead to disruptions in Medicaid or CHIP coverage, which, in turn, may lead to increased Medicaid spending. Several studies have found that implementation of or an increase in premiums in Medicaid or CHIP leads to disenrollment from or less time in the program.1 ,2 ,3 In Oregon and Wisconsin, increases in Medicaid premiums were associated with disenrollment for nondisabled adults.4 ,5 Among children, increases in premiums in Medicaid or CHIP in Kansas, Kentucky, New Hampshire, Florida, and Wisconsin were associated with fewer new enrollments into the program, increased likelihood of disenrollment, and fewer days enrolled in the program.6 ,7 ,8 Lower-income Medicaid or CHIP enrollees are often at higher risk for disenrollment relative to higher-income Medicaid enrollees.9 When former Medicaid enrollees in Oregon, Wisconsin, and Utah were surveyed about why they were no longer enrolled, cost sharing in the form of premiums, enrollment fees, and copayments was frequently reported.10 ,11
Individuals with chronic conditions, such as diabetes or depression, who experience interruptions in Medicaid coverage have been shown to have higher Medicaid expenditures once they return to Medicaid, primarily due to a subset of individuals who experience acute needs while off the program and have more emergency department (ED) visits and hospitalizations upon re-enrollment. Disenrollees that remain uninsured, particularly individuals with chronic conditions who need continuous medical management for their condition and contend with household medical debt, and safety-net systems that care for the uninsured experience greater strain as these disenrollees enter their systems for care.
Copayments can reduce use, but their impact on spending is less clear. Seminal findings of the RAND Health Insurance Experiment showed that the more individuals must pay out-of-pocket, the fewer medical services they use.12 Studies on cost sharing have noted that reductions in service use are common when copayments are introduced or increased, and that reductions can happen for low-value, high-cost services such as non-emergent ED visits as well as for high-value, low-cost services such as ambulatory care.13 ,14 ,15 Very few studies have explicitly examined the impact of copayments on total Medicaid expenditures, but those that have report either no change or higher expenditures.16 ,17 The impact of copayments on use need to be considered together with expenditures per user. Reductions in use may not necessarily lead to reductions in expenditures if expenditures per user increase at the same time (e.g., the number of hospital stays may fall, but the average cost per hospital stay increases).18
Predicting revenues associated with collecting premiums and copayments is challenging. If premiums induce disenrollment from Medicaid or CHIP, then revenues from premiums will decrease.19 There are also administrative costs to implementing programs to collect premiums, track enrollees who fail to pay premiums or cost sharing in a timely manner, and re-instate individuals who lose and regain Medicaid coverage.
It is not clear from the literature that Medicaid programs will realize significant savings from cost sharing above and beyond the savings that may accrue from individuals exiting the program due to the initiation or increase of premiums. For those that re-enroll in Medicaid later, costs may be higher because individuals with chronic conditions experience exacerbations that lead to high resource use upon re-enrollment. Although other forms of cost sharing, such as co-payments, do reduce use, the evidence shows that consumers are not selective in how they reduce their care, potentially foregoing high-value care. How these reductions directly impact total Medicaid spending is still unclear.
Enrollee Wellness Incentives
Medicaid programs20 have been experimenting with incentives for engaging in wellness or preventive behaviors, such as wellness visits, evidence-based preventive care, tobacco cessation services, medication adherence, and weight-reduction activities.21 Incentives can take various forms such as vouchers, gift cards, points redeemable for health-related items, or reduced premiums or cost sharing, and incentive program design varies.
Limited evidence suggests some effects on the uptake of specific services, but evidence for reduced Medicaid spending has not yet emerged. Incentives have been shown to motivate individuals to engage in healthy behaviors and use preventive services.22 ,23 ,24 The uptake of such activities is expected to improve health, which, in turn, may lead to lower health care spending over time. The target behavior, target population, type of incentive, and the incentive’s magnitude and frequency are critical design elements that can impact a program’s success. Evaluations of early initiatives have found that these programs can be effective at increasing short-term or one-time activities, such as physician visits, medication adherence, and preventive care use.25 ,26 A more recent evaluation of 10 Medicaid programs that received Medicaid demonstration funds to test financial incentives to promote engagement in chronic disease prevention or management programs found that Medicaid enrollees were more likely to use a service (e.g., attend a diabetes prevention class or call a smoking cessation Quitline) if they received a financial incentive to do so. There was little evidence that the receipt of financial incentives was associated with short-term (1–2 years post-enrollment) changes in the use of the ED, inpatient, or total Medicaid expenditures.27 There was also no evidence to suggest that one type of program (e.g., prevention vs. disease management, smoking cessation vs. weight management) was more successful than another. However, findings are not conclusive because the evaluation occurred midway through states’ demonstration programs. It is important to note that these programs have experienced implementation challenges that could limit impact. Notable challenges include low program enrollment, lack of awareness of or difficulty understanding the incentive program, not perceiving a benefit from the incentives, and not knowing how to redeem incentives once earned.28 Furthermore, return on investment for prevention can take many years to realize, certainly well beyond the typical 2 to 4 years of study post-intervention for many of these evaluations.
Although the use of financial incentives to promote wellness holds some promise for increasing the use of wellness services, the long-term impacts on Medicaid spending are not known.
Complex Care Management
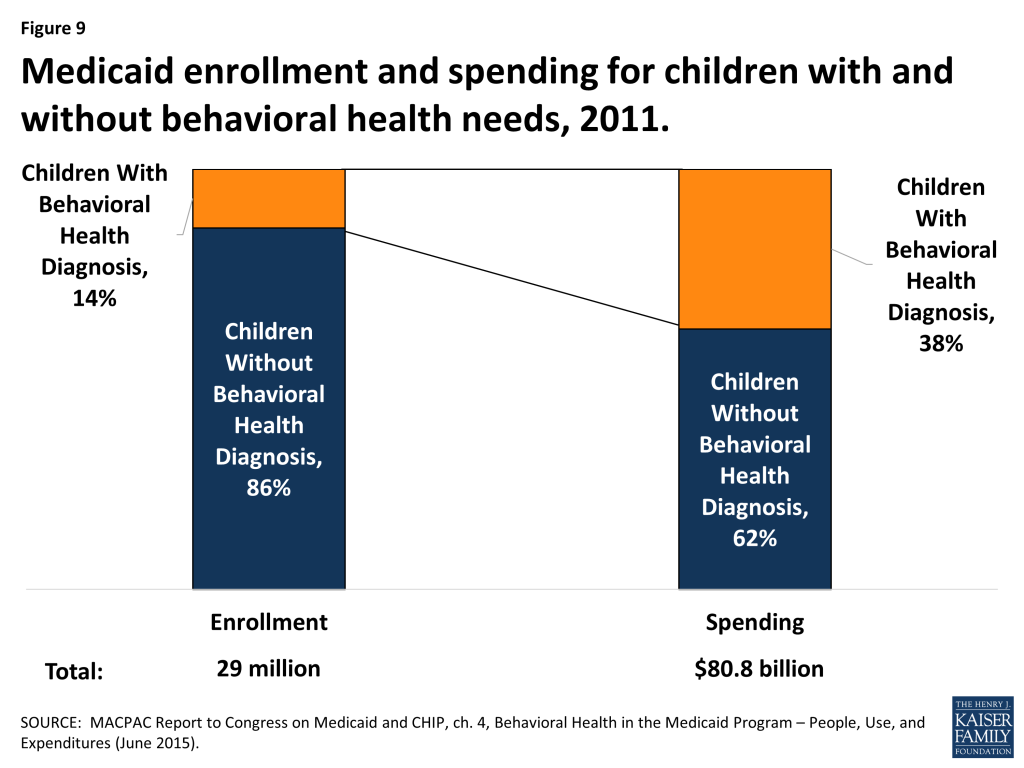
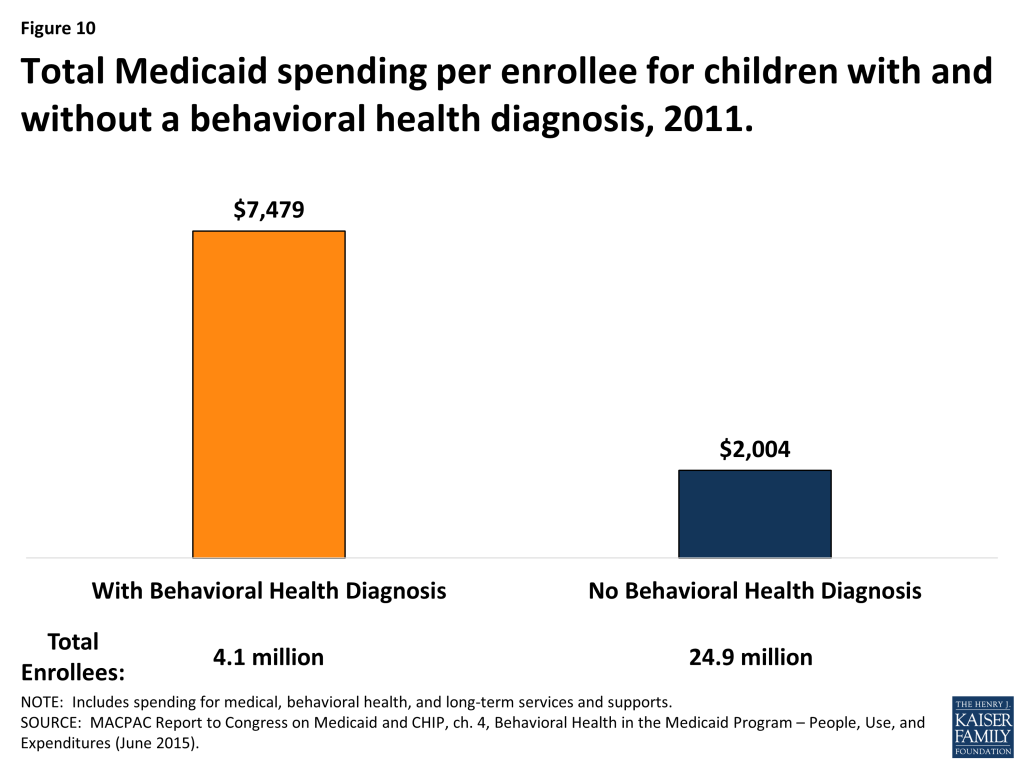
Medicaid programs, health systems, and communities are experimenting with efficient and effective approaches to identifying and engaging with high-cost, high-use enrollees, commonly referred to as super-utilizers. The expectation is that targeted, often intense care management of these individuals will lead to reductions in unnecessary use and greater connections to needed community-based resources. Controlling costs in this population can have a significant impact on total Medicaid spending given that an estimated 5% of Medicaid beneficiaries with complex medical and psychosocial needs account for 54% of total Medicaid spending.29 Super-utilizer programs have expanded considerably in the last decade, with substantial support from the Centers for Medicare & Medicaid Services and foundations such as the Robert Wood Johnson Foundation.30 ,31 These care management programs vary widely in the population targeted, methods for deciding who is eligible for services, and the scope and intensity of services offered.
Evidence that super-utilizer programs in Medicaid can reduce the use and costs of care is mixed. Although some programs have found success, others have not realized significant reductions or savings. Many programs find substantial changes in use or expenditures after providing care management service to super-utilizers.32 Because program participants have extreme use and costs at baseline, their use and commensurate costs at a later date will often be lower, a phenomenon known as regression to the mean.33 ,34 Without a group of individuals to compare trends in use over time, regression to the mean cannot be ruled out as a possible explanation for use and spending reductions. A closer examination of programs that have employed more rigorous study designs have noted that the impact of complex care management programs among Medicaid and the uninsured are mixed.35 ,36 ,37 ,38 Some programs have shown success in reducing ED visits, hospital admissions, inpatient expenditures, and total Medicaid expenditures,39 ,40 ,41 ,42 while other programs have noted no change in outcomes or reductions in use and expenditures that did not reach statistical significance.43 ,44 ,45 The evidence is not any stronger in Medicare, with one evaluation of a large-scale care coordination program finding minimal impact on use and expenditures.46
Reductions in use and costs of care may depend on which populations are offered CCM services. Some evaluations have found that changes in use can vary over time, with some showing immediate impact and others suggesting that reductions accrue over time.47 Others have also found that subgroups within a program (e.g., people who engage more or the highest risk individuals) are relatively more successful in reducing use and costs compared to the other subgroups or the full population under study.48 ,49 Thus, the cost savings generated from lower use depend on targeting resources to the population most amenable to change.
Evidence that super-utilizer programs can generate net savings for Medicaid remains unknown. Reductions in high-cost services such as hospitalizations and ED visits may indicate the potential for reduced health care spending. However, it is unclear if cost savings are achieved from reduced use once the costs of implementing and administering a care management program are considered. Several studies suggest that net savings are possible or may be feasible after several years if significant reductions in total Medicaid costs are realized. However, if significant cost reductions are not achieved, financial losses attributable to the program can be high because these programs can be costly if the care management model relies on intense follow-up and frequent interactions with a care manager.50 ,51 Given the lack of information regarding net savings in Medicaid, lessons from Medicare may provide insight for Medicaid. An evaluation of Medicare-funded care coordination programs found little evidence that Medicare savings, when generated, were great enough to offset care coordination fees.52
There is insufficient evidence that supportive housing reduces total Medicaid costs. Supportive housing is an emerging model that provides care and case management as well as stable housing to homeless or precariously housed patients.53 Evaluations of these relatively new efforts are limited, and even more so for the Medicaid population, but small programs in Oregon, New York City, and Chicago have reported some positive results for reduced use and/or spending.54 ,55 ,56 ,57 Several states are currently experimenting with leveraging Medicaid funds to support individuals in these settings, so more may be known about the effect of these programs in coming years.
Complex care management programs to target super-utilizers are promising, but prior studies employing rigorous evaluation designs are not conclusive that these programs can consistently reduce use and costs. Programs vary considerably in their design, and success may lie in being able to effectively target the right mix of care management resources to the right population at the right level of intensity. These programs can be expensive, and the return on investment as a viable cost-containment strategy is still not fully understood.
Patient-Centered Medical Homes
Over the last several decades, primary care has struggled to meet the needs of patients in the face of a health care system that incentivizes providers to furnish more care and that emphasizes specialty and acute care over prevention and population health management and care fragmentation over coordination and patient-centeredness. The patient-centered medical home (PCMH) is an approach to redesigning primary care to be accessible, continuous, comprehensive, patient- or family-centered, coordinated, compassionate, and culturally effective. A team of providers takes collective responsibility for the patient and coordinates care across health systems and within a community. PCMH models are very diverse, but the expectation for any model is that this coordinated approach will improve access to care, patient experience, and quality of care, as well as reduce costs, largely by reducing high-cost services such as ED and hospital use.58 However, if ED and hospital use do not substantially decrease, overall costs could increase if PCMHs are successful at delivering unmet needed care and connecting patients to services.
There has been widespread adoption of the PCMH model. Currently, 26 state Medicaid agencies are operating PCMH programs, often within the context of broader Medicaid redesign efforts.59 ,60 These programs provide enhanced Medicaid payments to PCMHs either through additional fee-for-service payments or through Medicaid managed care contract requirements. Practices use these enhanced payments, often termed care management fees, to support their PCMH activities.
Evidence that PCMHs can reduce Medicaid use and costs is mixed. Few rigorous evaluations examine the impact on Medicaid populations only,61 ,62 but implications for Medicaid may be drawn from an extensive literature on PCMH effectiveness. Some evaluations have documented associations between PCMHs and reduced ED and hospital use, lower total costs of care and costs for specific services, and improvements in quality of care relative to matched comparison groups. Other evaluations, also employing rigorous study designs with matched comparison groups, have found no change or minimal change in these outcomes.63 ,64 ,65 ,66 ,67 ,68 ,69 ,70 ,71 ,72 ,73 Systematic reviews that compare results across many medical home evaluations also find that PCMHs are not consistently associated with reductions in ED visits, hospital stays, or total costs of care relative to matched comparisons, but they do improve quality.74 ,75 ,76 One potentially promising finding across several of the systematic reviews suggests that PCMHs may differentially benefit individuals with more significant health needs (e.g., older adults and individuals who are more ill). Some review studies have found that these groups may experience reductions in high-cost use and total costs that are not found in a general population,77 ,78 ,79 ,80 but other large-scale evaluations of Medicare-funded comprehensive primary care activities have found modest results, at best, for older individuals.81 ,82 ,83
Net savings may be challenging to achieve. A less-studied but critical consideration when assessing cost containment is the impact these programs have on net savings. Several large-scale, multi-site PCMH initiatives funded by Medicare commonly experience net losses because reductions in total spending do not offset PCMH payments to practices.84 ,85 ,86 Evidence in Medicaid is much more limited, but one study of Iowa’s Medicaid Health Home initiative (see description of health homes below) did find evidence for reductions in total cost even after accounting for PCMH payments.87
Program heterogeneity and short evaluation periods may contribute to lack of consistent findings. Considering the diversity of programs in terms of target population, supporting payers, and implementation approach, there is no clear evidence that one type of setting or approach to PCMHs performs better than another. This inherent heterogeneity across programs may explain the lack of consistent findings. Further, the relatively short time over which PCMH patients are followed (typically 1 to 3 years after a PCMH initiative’s implementation) may also contribute to lack of findings. Qualitative studies of PCMH initiatives often find that the first couple years of PCMH transformation are devoted to identifying which services, supports, and processes need to be in place and redesigning work flows accordingly, so the full benefits of delivery system redesign may not be immediately realized.88
There is little evidence to determine if the Medicaid health home program can reduce total Medicaid costs. The concept that individuals with greater needs may benefit most from the medical home is of importance for state Medicaid programs. Under the Affordable Care Act, Medicaid programs can establish health homes for enrollees who have or are at risk for multiple chronic conditions or who have at least one serious and persistent mental health condition. Health homes are similar to PCMHs, but they specifically target individuals with chronic conditions and emphasize physical and behavioral health integration as well as improved linkages to community and social supports and long-term services and supports.89 Twenty-two states have implemented the Medicaid health home program.90 A 5-year evaluation of the initiative sponsored by the federal government is ongoing, and findings on the impact of health homes on use and costs are not yet available.91 However, a couple of state-funded evaluations of health home programs have reported some significant decreases in service-specific use and costs.92 ,93
The PCMH model, and the more recent Medicaid health home model, has experienced widespread support, and public and private payers continue to invest in this model. The ability of the PCMH to effect significant change on total health care costs and high-cost use remains inconclusive. By themselves, PCMHs may be challenged to contain Medicaid cost growth, but they may serve as an integral component of a larger cost containment strategy such as alternative payment models or ACOs.
Alternative Payment Models
Under fee-for-service, there is little financial incentive to manage and coordinate patient care. Therefore, Medicaid programs are experimenting with alternative payment models (APMs) that task providers with managing the cost and quality of a defined population, sometimes within a defined budget, in exchange for bonus payments for staying within a budget or meeting cost and quality goals.94 In an effort to stay under spending targets, providers may avoid caring for the sickest patients or may not recommend needed but costly services, so quality goals or other incentives are included in these models to guard against barriers to access and quality. There are many different APMs, and here we focus on several relatively new APMs—accountable care organizations (ACOs), episode-based payment, and global budgeting. Because many of these models are new, evidence for their effectiveness in Medicaid is very limited. Therefore, we highlight findings from Medicare and commercial payers to illustrate, when necessary, what may be feasible under these models.
Accountable Care Organizations
ACOs are groups of doctors, hospitals, and other health care providers who voluntarily agree to share responsibility for the health care delivery and outcomes for a defined population. ACOs are expected to reign in cost growth by providing coordinated, high-quality care. When cost and/or quality goals are achieved and cost savings are generated, providers share the savings. ACOs typically choose to accept either one-sided or two-sided risk. With one-sided risk, the ACO will share in savings if it meets certain cost and quality targets. With two-sided risk, providers share in savings (the savings will be higher than one-sided risk options), but they also pay back money if certain targets are not met.
Limited evidence from one state Medicaid program and Medicare suggests that ACOs could reduce total Medicaid costs. At least 10 states are in the early stages of operating Medicaid ACOs, with many opting for one-sided risk.95 Some states have reported reductions in total Medicaid expenditure growth under the ACO when compared to expected expenditure growth from historical trends; reductions in inpatient and ED visits were also achieved.96 With the exception of Oregon, discussed in greater detail in the “Global Budgeting Model” section, there are no rigorous evaluations comparing spending trends to a matched comparison group. Given the lack of rigorous Medicaid evaluations to date, evidence from Medicare’s ACO initiatives may inform expectations for Medicaid. Early results from evaluations of the Medicare Shared Savings Program (MSSP) and Pioneer ACO program have shown modest savings in total cost of care and improved quality when ACO participants are compared to a control group. Cost reductions are generally driven by reductions in acute and post-acute settings, and some have also seen reductions in outpatient and physician services. Savings also tend to be greater for ACOs with higher baseline spending, and those with more experience operating in risk-based payment models.97 ,98 ,99 ,100 The ability to sustain cost reductions beyond 2 years of implementation remains to be seen. At this early stage, the programs result in a net loss to Medicare because reductions in total spending have not been great enough to offset the shared savings bonus payments paid to high-performing ACOs.101 Because most ACOs are currently operating with one-sided risk only, the relative effectiveness of taking on more risk is unknown.
Episode-based Payment Model
The episode-based payment model places financial risk on providers for a set of services to treat a clinical condition (e.g., acute asthma exacerbation) or conduct a procedure (e.g., total joint replacement). Providers held responsible for the episode of care are rewarded, are penalized, or remain financially neutral depending on how actual costs of care and/or quality compare to a predetermined threshold.
There is no evidence yet to determine if episode-based payment models reduce total Medicaid costs. Initiatives to test episode-based payment are relatively new across payers, and Medicaid programs are just now beginning to experiment with this model. Evidence on model success to date primarily comes from Medicare. The largest initiative began in 2013 when the Centers for Medicare & Medicaid Services (CMS) launched the Bundled Payments for Care Improvement (BPCI) initiative to test 48 episodes of care within Medicare. In the first year of operation, changes in Medicare expenditures were not notably different for BPCI providers relative to a comparison group of providers.102 In a separate study of BPCI providers focused solely on lower extremity joint replacement episodes, the rate of Medicare spending decreased for BPCI providers relative to a comparison group, without a significant change in quality.103 Arkansas and Tennessee are leaders in episode-based payment within Medicaid. Launched in 2012, the Arkansas Payment Improvement Initiative involves Medicaid and commercial payers in an episode-based payment model for 14 episodes.104 One report stated that Arkansas’ model is reducing the growth of Medicaid spending compared to historical trends, but a rigorous evaluation of the model is not yet available.105 Tennessee launched the first episodes of care for its Medicaid providers in January 2015, and analyses of model impact are not yet available.106
Global Budgeting Model
Global budgeting places a spending limit on an entity such as an ACO or a hospital. In exchange for taking on the risk of staying within the budget, the entity is given flexibility in how it pays providers and designs services, often choosing a suite of services that are tailored to the needs of the providers’ target population.
There is insufficient evidence that global budgets may reduce total Medicaid costs. Few global budget models have been examined in depth. Oregon’s Medicaid ACO program, mentioned above, prospectively pays ACOs for risk-adjusted total costs of care for an attributed population. One study found that when compared with a neighboring state, Oregon had experienced a decrease in total Medicaid costs, primarily due to decreases in inpatient admissions, but Oregon also saw reductions in primary care visits and related costs, which raises questions about the ability of the program to sustain access to primary care. Cost reductions were greater for adults compared to children and for individuals at high risk for use and morbidity.107 A commercial sector program in Massachusetts found lower total expenditures relative to a control group for adults, but not for children, and did not compromise quality of care.108 ,109 Net savings (after factoring in bonuses and shared savings) were not realized until later in the program.110 An all-payer, global hospital budget program implemented in 2014 in Maryland has shown some promise at reducing hospital costs to Medicare in the first year of operations but little change in total Medicare costs relative to a comparison group. Medicaid and commercial data are not yet available.111
Because Medicaid programs are only recently beginning to experiment with ACOs, episode-based payments, and global budgets, there is very limited evidence on the effectiveness of these models to contain Medicaid costs. Modest declines in spending attributable to Medicare ACOs 1 or 2 years after implementation suggests that reduced spending may be feasible within the ACO model but that net savings may take time to realize, and Oregon’s early success with Medicaid ACOs and global budgets may hold promise for cost containment. Further, experience managing one population (e.g., Medicare or commercial) does not guarantee that providers will know how to effectively manage a higher-needs, higher-cost Medicaid population. Providers will need time to learn which package of services and supports will be most effective at managing costs, quality, and use in the short and long term. Given the evidence thus far, the utility of APMs to reduce long-term Medicaid cost growth and generate net savings for Medicaid programs remains uncertain.
Strategies to Reduce Medicaid Long-Term Care Spending
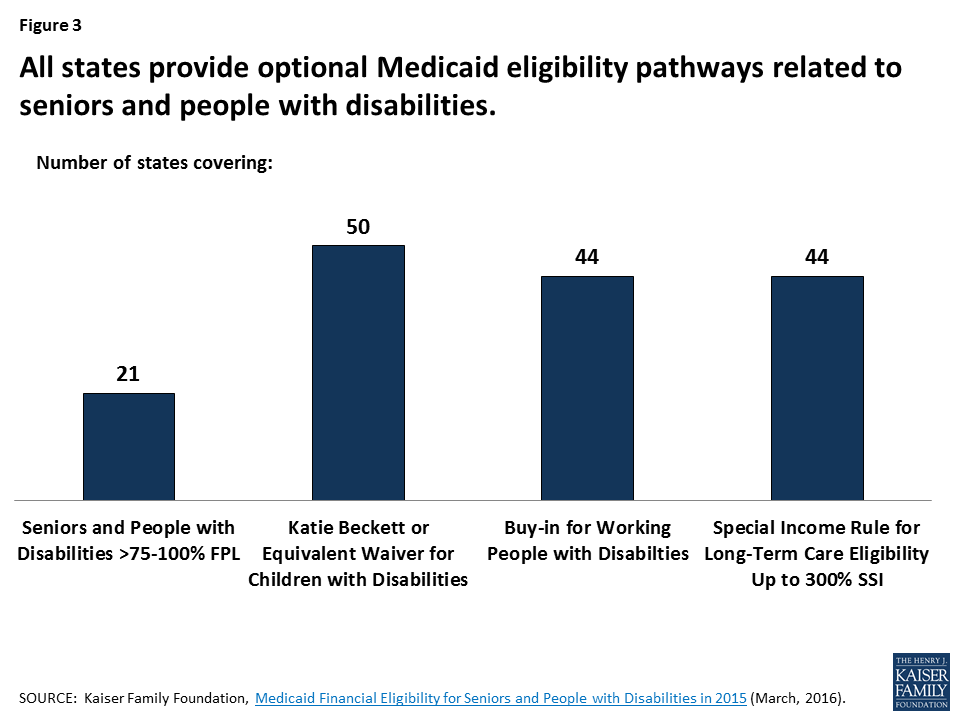
Tightening Financial Eligibility Rules for Long-Term Care Services
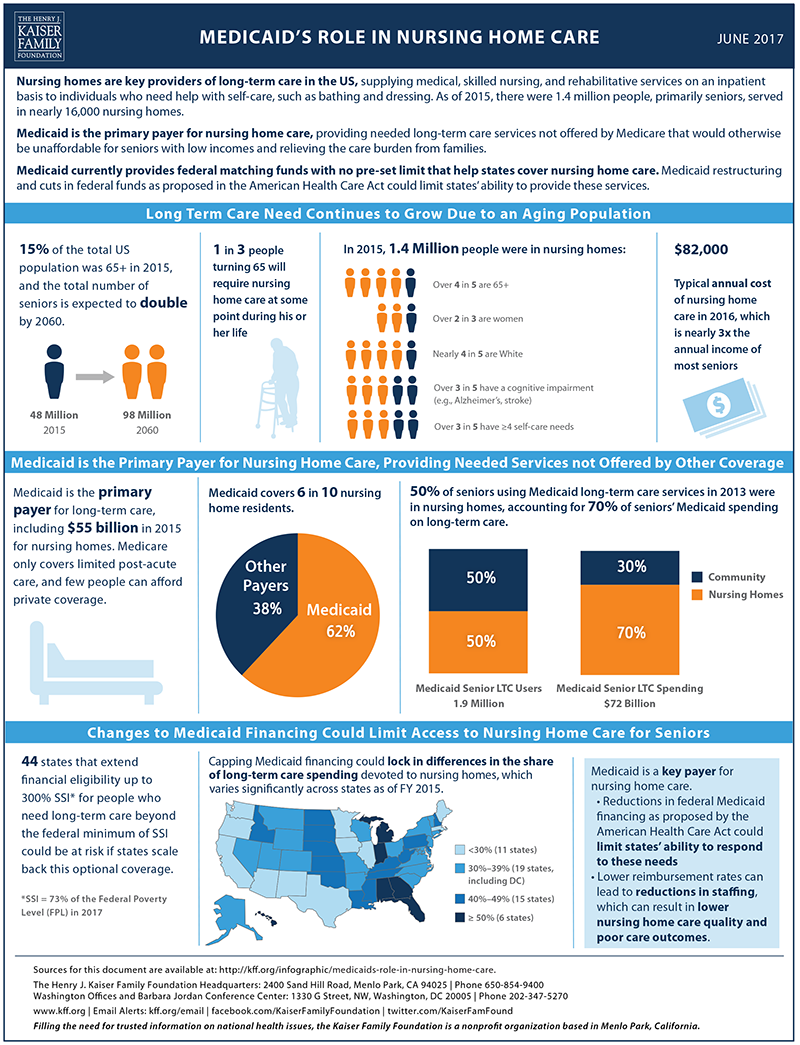
Most elderly and disabled Medicaid beneficiaries are eligible for Supplemental Security Income, the income support program for low-income older people, blind persons, and people with disabilities. The maximum federal Supplemental Security Income monthly benefit is $735 for an individual or $1,103 for a couple (73 percent of the federal poverty level in 2017). Individuals receiving SSI must have low incomes and countable assets of no more than $2,000 for an individual or $3,000 for a couple.112 The asset levels have not increased since the Deficit Reduction Act of 1984.
Certain assets are excluded from the Medicaid financial eligibility determination. In 2017, the value of the family home up to $560,000 is exempt and states can exempt up to $840,000 in personal and household items113 and some or all qualified retirement accounts (e.g., 401(k) and individual retirement accounts [IRAs]) in most states.114 Spousal impoverishment rules also protect the financial status of the spouse not receiving Medicaid nursing home or HCBS benefits.115
Medicaid also provides coverage to people who originally had income and assets above the Medicaid eligibility level but who spent down because of the high cost of medical care and LTSS.116 ,117 For example, examining people age 50 and older who spent down to Medicaid over the 1996/98 to 2008 period118 estimated that 66 percent of Medicaid nursing home residents spent down.
Because Medicare does not cover LTSS and few people have private LTC insurance and services are expensive, some people transfer their assets to relatives at less than fair market value for the purpose of appearing artificially poor and obtaining Medicaid eligibility. To discourage Medicaid applicants from transferring assets, Medicaid prohibits such transfers. The Deficit Reduction Act of 2005 established a look-back period of 60 months to establish whether transfers occurred.119 Should transfers occur during this period, states can impose a period of ineligibility for Medicaid that is related to the amount of assets transferred.120 Some observers believe that there is a significant amount of unallowable transfer of assets.121 ,122 The Government Accountability Office123 found that although most states ask applicants to document income and asset information, very few require documentation going back for 5 years.
In addition to prohibitions against transfer of assets, as part of the Omnibus Budget Reconciliation Act of 1993, Congress mandated that states implement estate recovery programs to recoup the cost of Medicaid LTSS from the estate of deceased Medicaid beneficiaries.
To capture additional private resources to offset Medicaid spending, some observers have proposed tightening transfer of asset rules and more aggressively enforcing these rules and estate recovery. More recently, some observers have proposed stricter rules about what should be considered excluded assets. Warshawsky and Marchand124 argue that retirement income generating assets such as IRAs should be counted toward the Medicaid assets limit.
Asset Transfer
Most empirical research on transfer of assets has found that relatively little transfer takes place or that the amount transferred is small.125 ,126 ,127 Examining the population age 50 and older, Wiener et al.128 found that people who spend down to Medicaid are much less likely to transfer their assets than are people who do not spend down to Medicaid. Among respondents age 65 and older who spent down to Medicaid, 24.7 percent of people transferred more than $500 to children, compared to 41.6 percent of people who did not spend down. In a study using the 1993 to 2002 waves of the Health and Retirement Study, Lee et al.129 found that between 9 and 15 percent of new Medicaid beneficiaries living in nursing homes had transferred assets to their families, but that the average amount was about $4,000—an amount that is below the cost of 1 month of nursing home care in most of the country.
To understand the extent to which asset sheltering is practiced, the Government Accountability Office130 conducted a review of 465 Medicaid nursing application files in three states. Of these applicants, about 10 percent (47) had transferred assets at less than the fair market value for the then 36-month131 look-back penalty period. The median value of the transferred assets was just over $15,000. The length of the penalty period assessed for the improper transfer averaged 6 months, although for nine of the applicants there was no penalty because it would have been less than 1 month.
Moreover, survey data suggest that most severely disabled older people have little in the way of assets; people cannot transfer large amounts of assets if they do not have them. In their analysis of Medicaid spend down, Wiener et al.132 found that the spend-down group had few asset at baseline, in a period up to 10 years prior to spend down: the median total wealth (not including IRAs) for the spend-down group was $33,000 compared with $135,000 for people age 50 and older who did not spend down. Non-housing assets for the spend-down group averaged $24,000 compared to $86,000 for the non–spend-down group and the median net home equity was $17,000 and $68,000, respectively. Similarly, Spillman and Waidmann133 found that those most likely to transition to Medicaid were those in the poor and near poor income groups134 and those who were not homeowners. Conversely, for those in the higher income group who did not use nursing homes the Medicaid transition rate was less than 0.5 percent (although for those who did use nursing home care, the transition rate went up to 5 percent).
Moreover, the financial wealth135 of adults with disabilities, who are most likely to use LTSS, is much lower than for those without limitations. Using the Health and Retirement Study, Johnson136 found that the 2012 median financial wealth for people age 65 and over with two or more activities of daily living (ADL) impairments was $8,300, compared to $104,300 for those who did not have limitations. Furthermore, 31 percent of those with two or more ADL limitations had no financial assets at all. Johnson and Wiener137 reported that frail older adults with disabilities start off with less wealth then their healthier counterparts and that the gap widens over time.
Estate Recovery
Current efforts to recover Medicaid LTSS expenditures from the estates of deceased beneficiaries have not yielded large amounts of funds. A 2015 survey conducted by the Medicaid and CHIP Payment and Access Commission138 found that in fiscal year 2014 states collected $589.2 million from beneficiaries’ estates, about 0.1 percent of total Medicaid spending. Warshawsky and Marchand139 extrapolated that if every state performed at the level of the states with the highest recovery efforts, then about $2.4 billion annually could be recovered, about 0.5 percent of total Medicaid spending. As noted above, Medicaid LTSS beneficiaries are likely to have few assets of any significant value.
States would need to overcome both operational and symbolic barriers if they are to implement more aggressive estate recovery programs. Operationally, they will need to hire additional staffing to identify and recover money from the estates of deceased Medicaid beneficiaries. Because of the complex interaction between Medicaid rules with state property, probate, homestead and creditor laws, recovery efforts are conducted on a case-by-case basis, a time-consuming and potentially expensive process. Moreover, pursuing the estates of deceased older people may be politically unpopular.
Including Retirement Accounts as Countable Assets
Despite the change from defined benefit to defined contribution pensions, many retirees have limited savings in retirement savings mechanisms, such as 401(k)s and IRAs. Using the Health and Retirement Study (1993-2008), Poterba et al.140 show that older people do not have much in terms of retirement assets. In 2008 only 20.9 percent of all households (single and married) aged 85 and older had personal retirement assets in IRAs, Keoghs, 401(k)s, and similar retirement savings mechanisms. The average personal retirement value for all households was $15,069, but the median holding was zero for both single and married couples’ households. Thus, including retirement accounts is unlikely to yield significant savings, again because few Medicaid beneficiaries are likely to have high balances in their accounts.
Retirement accounts are generally excluded from determining Medicaid eligibility because they are the source of income for retirees and must be withdrawn at a regular schedule designed to match projected mortality rates. Given that almost half of nursing home residents are age 85 or older,141 there is unlikely to be much left in the retirement accounts. Forcing Medicaid applicants to rapidly deplete their retirement accounts could result in a lack of income if institutionalized beneficiaries return to the community and higher Medicaid spending in later years. Medicaid beneficiaries in nursing homes are required to contribute all their income, including from retirement account withdrawals, toward their cost of care, except for small personal needs allowances; Medicaid only pays the difference between the remaining amount. Thus, if the retirement accounts are depleted before a person becomes a beneficiary, there will be less available to contribute to the cost of care in later years.
Prevention of asset transfer, more aggressive estate recovery, and counting retirement savings have been proposed as Medicaid cost saving measures as ways to bring additional private resources into LTSS financing. However, empirical evidence indicates that savings would be small and offset to some extent by additional administrative expenses states would need to incur. Studies suggest that transfer of substantial amounts of assets by people applying for Medicaid is relatively rare. Moreover, older people with substantial disabilities have limited assets in most cases, giving them little to transfer. Because people needing LTSS have little in the way of assets, estate recovery programs and claiming retirement savings are unlikely to yield substantial additional savings.
Private Long-Term Care Insurance
Medicaid provides coverage for LTSS not only for people who are poor, but also for people who have become poor because of the high cost of services, especially nursing home care.142 ,143 Some advocates of private LTC insurance have argued that purchase of policies by middle-class people could reduce Medicaid LTSS expenditures by preventing policyholders from depleting their income and assets when they use LTSS services.144 In 2012, 7.4 million people had private LTC insurance, about 2.4 percent of the American population.145 In 2014, only about 11.5 percent of people age 40-70 had private LTC insurance, and purchase was heavily skewed toward people with higher incomes and assets.146 ,147 This upper-income/asset orientation is not surprising given that the policies are expensive; in the Federal Long-Term Care Insurance Program,148 a policy purchased at age 65 that covers 3 years of care at $150 per day with a 4 percent inflation adjustment costs approximately $2,600 a year.
The ability of private LTC insurance to reduce Medicaid LTSS expenditures depends partly on whether people who purchase the policies would otherwise be Medicaid beneficiaries. It also depends on the general state of the market for private LTC insurance and whether there are companies actively marketing products.
Microsimulation studies of the potential impact of private LTC insurance on Medicaid LTSS expenditures find little to no effect even far into the future. Using the Urban Institute’s DYNASIM Model, Favreault, Gleckman, and Johnson149 analyzed the effect of three types of private LTC insurance—a policy that provided coverage for the first part of a nursing home or HCBS stay, a policy that only provided coverage after a long deductible period, and a policy that provides comprehensive benefits—on Medicaid expenditures. In the current voluntary purchase scenario, in 2070, the policies reduced Medicaid LTSS expenditures by between zero and 1 percent. With a subsidy for purchase, the impact increased from 2 to 7 percent, but Medicaid savings would be offset by the cost of the subsidy. Higher levels of subsidy would likely increase the savings, but also the cost of the subsidy. In contrast, a mandatory public LTC program would reduce managed LTSS expenditures by between 7 and 35 percent; again Medicaid savings would be offset by the cost of the public insurance plan. These findings of little or no impact of private LTC insurance are consistent with earlier analyses conducted by Wiener, Illston, & Hanley150 and Rivlin and Wiener.151
One approach to expand the market would be for the government to pay the LTSS costs beyond what is covered in an approved private LTC insurance policy. This strategy provides lifetime coverage without requiring people to buy a costly private LTC insurance policy that provides lifetime benefits, a type of policy that has largely disappeared from the marketplace. A version of this approach, the Long-Term Care Partnership, is currently being implemented in many states, with Medicaid providing the government backup. This approach has not generated a large increase in sales. As of June 30, 2011, 43 states had adopted the Partnership approach, with approximately 630,000 policies in force.152 Studies differ as to whether the LTC Partnership will modestly reduce or increase Medicaid LTSS expenditures.153 ,154 ,155
The private LTC insurance market is in sharp decline, and the future role of the product as a source of financing for LTSS for the general population is in doubt. The ability of private LTC insurance to produce Medicaid savings depends on whether insurance companies are actively marketing policies. In 2002, the market started to unravel as private LTC insurance sales plummeted and companies left the market. Additionally, after a steady increase in the number of LTC insurance policies in force between 1992 and 2005, the number of insured lives remained relatively flat—at about 7.4 million—between 2005 and 2012.156 Additionally, new sales fell precipitously; in 2013, only 172,000 new private LTC policies were sold.157 ,158 ,159 New policies that link insurance with life insurance or annuities have come on the market with modest success, but they are targeted at people with large amounts of assets. Although 125 companies had competed in the private LTC insurance market in 2000, by 2012, fewer than 15 insurance companies remained that actively sold standalone LTC insurance.160
Most of the remaining insurers have substantially increased their premiums, including for existing policyholders. A doubling in premiums from one year to the next has not been uncommon. Further, LTC insurers have tightened their underwriting while reducing benefits, making it more difficult for people to buy policies.161 A recent study estimated that 40 percent of the general population aged 50-71 could not pass the medical underwriting for private LTC insurance.162
Although the decline in the private LTC insurance market began in 2002, the more recent collapse of the LTC insurance market can be traced to the Great Recession.163 Because of the low interest rates during the recession and thereafter, the returns on reserves held by insurers fell well below the actuarial assumptions used to determine initial premiums. Thus, the reserves were inadequate to cover both actual and expected claims. Furthermore, the lapse rate—the proportion of individuals who discontinue their insurance—was lower than actuarial predictions, which meant that companies were required to pay claims on policies they had not expected to be in force. The resulting rise in premiums engendered bad publicity and hard feelings toward many insurance companies.
It has long been the hope of private LTC insurance advocates that wide-scale purchase of the product would result in substantial Medicaid savings. This market penetration has not occurred for a variety of reasons, two of which are most important. First, private LTC insurance is expensive and without large, costly subsidies is unlikely to be affordable by many middle-class families. Thus, the product does not reach far enough down the income distribution to include many people who would otherwise spend down to Medicaid and result in program savings. Second, the private LTC insurance market is in disarray. The number of companies selling policies has declined precipitously over the last 15 years and the industry views the product as posing substantial risk. Thus, the total number of policies has stagnated and it is unlikely that private LTC insurance will be more than a niche product for upper-moderate and higher income people with substantial amounts of assets.
Expanding Home and Community-Based Services
Many policymakers and consumer advocates have long argued that expanding HCBS is a way of reducing the use of expensive institutional care, such as nursing homes and intermediate care facilities for individuals with intellectual disabilities. HCBS includes a broad spectrum of services, including personal care, home health, adult day service centers, residential care facilities, home-delivered meals, habilitation, job coaching, and personal response systems. In addition to the desire for Medicaid savings, quality of care problems in nursing homes and other institutional settings and the U.S. Supreme Court’s Olmstead v L.C. decision (which held that the unjustified institutionalization of people with disabilities is illegal discrimination) have placed pressure on states to expand HCBS services. Further, survey data show that Americans have a strong preference for aging in place. Few Americans would choose to move into a nursing home in the event of a disability,164 and most wish to stay in their current residence and local community if possible.165
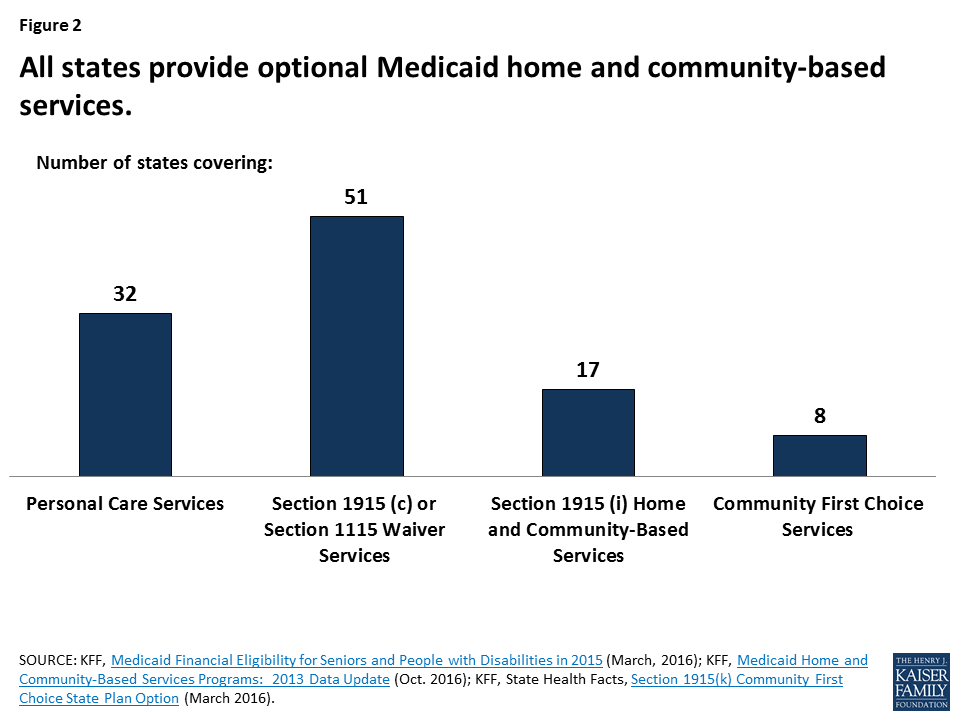
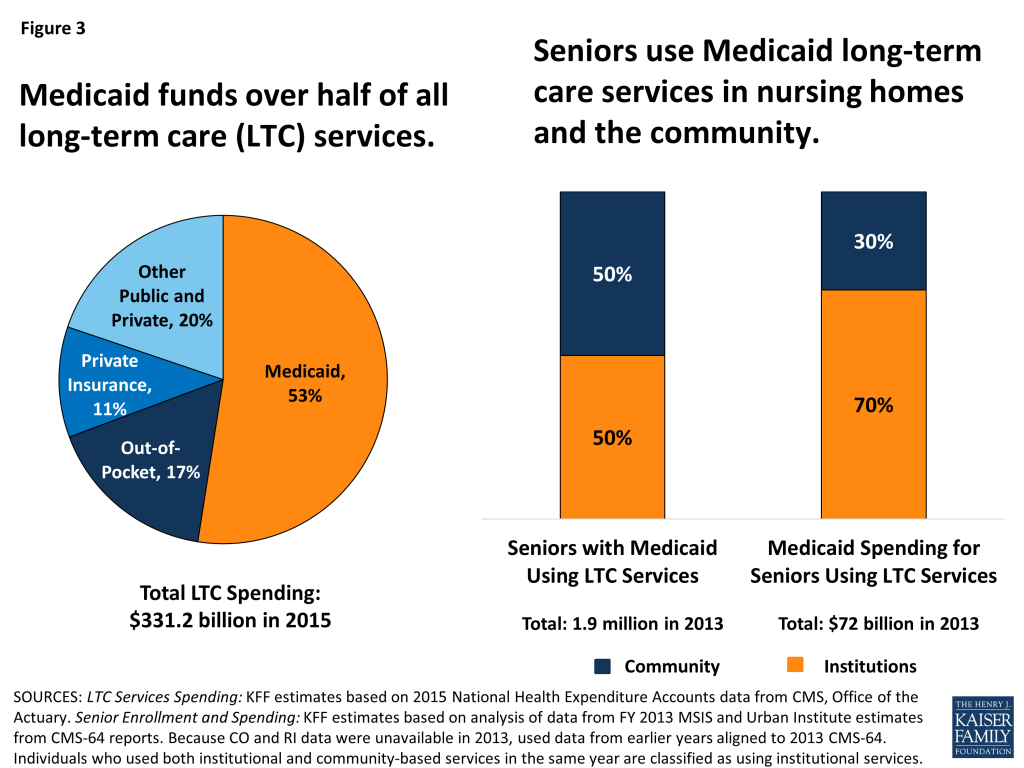
Historically, Medicaid LTSS spending has been primarily for institutional care, rather than HCBS. However, the balance of care has been changing toward HCBS, and in 2013, Medicaid HCBS spending surpassed institutional spending for the first time.166 This shift reflected decades of rebalancing efforts at both the federal and state levels, bolstered in recent years by Affordable Care Act provisions, such as the Money Follows the Person Demonstration and the Balancing Incentive Program, and new and expanded state plan options under Section 1915 (k) Community First Choice and Section 1915 (i). Medicaid HCBS spending reached $80.6 billion in FY 2014, with the new federal authorities alone accounting for 7.4 percent of total HCBS expenditures. The three largest Medicaid HCBS services (Section 1915 (c) waivers, state plan personal care, and state plan home health) helped nearly 3 million Medicaid enrollees in 2013.167 Despite rapid growth in services, waiting lists for Medicaid HCBS waivers continue to grow; nationally, with more than 640,000 people on waiting lists in 2015.
Although proponents of HCBS believe savings can be achieved by substituting high-cost institutional services with lower cost HCBS, the research literature is mixed. Several studies have shown small or nonstatistically significant reductions in nursing home use resulting from HCBS expansion.168 ,169 ,170 One review of the literature found that HCBS use reduces nursing home admissions by an average of 3.15 percent.171
On the other hand, other studies have found a stronger impact. Segelman et al.172 also found that increasing HCBS spending at the state and local levels by $1,000 per waiver enrollee per month was associated with an 8 to 14 percent reduction in the risk of long-term nursing home admission. Similarly, Thomas, Keohane, & Mor173 found that increased Medicaid HCBS spending is associated with lower rates of nursing home admissions among younger people with disabilities. A study on Medicaid LTSS spending in Michigan showed that HCBS cuts were associated with increased permanent nursing home placement.174 Studies also find that the availability of HCBS increases the disability severity of nursing home residents175 ,176 and reduces the prevalence of nursing home residents with low-intensity care needs,177 suggesting that HCBS expansion may divert individuals with fewer care needs from nursing homes.
One issue in achieving cost savings is whether the people receiving HCBS would be institutionalized without the services. Although few studies directly examine differences between HCBS waiver participants and nursing home residents, studies comparing these two populations found some evidence that nursing home residents exhibit more ADL dependencies and cognitive impairment than HCBS waiver participants.178 ,179 ,180 Waiver participants also may have more social supports available to them.181 ,182
Moreover, relatively few waiver participants end up being institutionalized, which may reflect the effectiveness of the program or may suggest that the program is serving a different population. The Weissert and Frederick183 literature review concluded that fewer than one-quarter of people identified as being at risk of institutionalization (or nursing home-certifiable) end up being admitted to a nursing home within the same year. Studies of Section 1915(c) waiver enrollees have found that 17 to 19 percent of enrollees transitioned to nursing homes over the study period.184 ,185 This research suggests that HCBS may not reduce Medicaid expenditures because participants would not otherwise be institutionalized; thus, large increases in HCBS use are offset by only modest reductions in institutional service use.
Similarly, studies examining the cost savings of HCBS programs show mixed results. Early studies from the 1980s, including the evaluation of the Channeling demonstration, found that expanding HCBS did not result in overall cost savings.186 ,187 ,188 ,189
Although extensive research demonstrates that Medicaid HCBS cost less per service user than institutional settings,190 ,191 ,192 ,193 these studies usually do not match nursing home residents and HCBS participants on characteristics such as availability of informal caregivers and disability levels and do not address issues of whether HCBS successfully target people who would otherwise be institutionalized.
More recent analyses are more favorable to the ability of HCBS to achieve savings. Kaye, LaPlante, and Harrington194 found that states with higher HCBS expenditures saw slower Medicaid LTSS spending growth than states with lower HCBS expenditures. However, while states expanding HCBS saw an increase in LTSS expenditures, states with established programs saw some reduction in the rate of increase in overall LTSS spending after a few years. Thus, cost savings may depend on the states’ level of investment in expanding HCBS and the maturity of the HCBS programs.
A 2013 review of 38 studies of publicly funded HCBS programs showed wide variation among programs in different states, but promising results related to cost savings.195 Some programs (e.g., Georgia’s SOURCE program, which is the state’s HCBS waiver for aged, blind, and disabled individuals and individuals who qualify for nursing facility care) found per capita savings when comparing HCBS to nursing home expenditures, and others demonstrated overall savings from nursing home diversion and transition efforts (e.g., Arkansas’s Community Connector Program, West Virginia’s Money Follows the Person program). The review also highlighted other promising outcomes of HCBS programs, including improved health status, client satisfaction, and service access.
A cross-state evaluation of the Money Follows the Person demonstration, which transitions people from institutions to the community, found a 16 percent decrease in total Medicare and Medicaid expenditures post-transition among older adults with no mental health conditions, a 20 percent decrease among older adults with a mental health condition, and an 18 percent decrease among younger adults with physical disabilities.196 Despite large investments in resources over several years, however, relatively few people have been transitioned to the community; from January 2008 to December 2015, approximately 63,000 Medicaid beneficiaries in institutions had been transitioned to the community.197 Although there is overlap from year to year, on average there are about 1,000,000 Medicaid beneficiaries each year in nursing homes. Thus, the proportion of residents transferred back to the community has been small.
Proponents also suggest that HCBS expansion may result in Medicaid savings by reducing use of acute and post-acute care services. However, some recent studies show that the effect of HCBS on medical care may be complex. Wysocki et al.198 found that dual-eligible Medicare-Medicaid enrollees who used HCBS were 1 percent more likely to experience a potentially avoidable hospitalization, and dual-eligible HCBS users who had transitioned from a nursing home were 40 percent more likely to experience a potentially avoidable hospitalization.199 In an analysis of six states, Wiener et al.200 found that higher HCBS expenditures slightly increased other Medicaid spending. Within the Money Follows the Person demonstration, non-LTSS expenditures (e.g., inpatient and post-acute) remained the same or declined during this post-transition period. One study of dual-eligible beneficiaries in California found average monthly differences of $174 for acute care services and $20 for post-acute services between HCBS users compared to nursing home residents, with HCBS participants having lower expenditures.201 Evidence of overall Medicaid savings on acute and post-acute expenditures, however, remains limited.
Over the last 30 years, policymakers and consumer advocates have successfully sought to expand Medicaid HCBS. The current financing system is moving steadily in the direction of more spending on HCBS and less on institutional services. Under the current Medicaid structure, continued shifts from institutional to HCBS services are likely to continue, allowing states to capitalize on any savings. Although a longstanding research topic in LTSS, recent research on the cost savings to be achieved through expanding HCBS has mixed results, although more recent studies are more favorable. Especially since the widespread use of the Medicaid HCBS waivers, states are serving a population with greater functional needs, exercising control over the number of waiver slots, targeting waiver services to certain populations or geographic areas, and using lower cost participant-directed care rather than agencies.202 ,203 There may be reasons other than cost savings to pursue policies expanding beneficiary access to HCBS, such as improved health outcomes or increased enrollee satisfaction.
Managed Long-Term Care Services
The financing and service delivery of medical care, LTSS, and behavioral health for older people and younger people with disabilities are splintered and uncoordinated.204 ,205 ,206 Fragmentation exists within and across these multiple systems. For example, financing for medical and post-acute care for dual-eligible beneficiaries is primarily a federal responsibility through Medicare, whereas financing for LTSS is primarily a state responsibility through Medicaid. Because of this bifurcation of responsibility, medical care providers have little incentive to be concerned about the LTSS needs of their patients and LTSS providers have little incentive to be concerned about the medical care needs of their consumers. As result, care is not coordinated, utilization of expensive services and costs may be higher than necessary, and quality of care is sometimes poor.
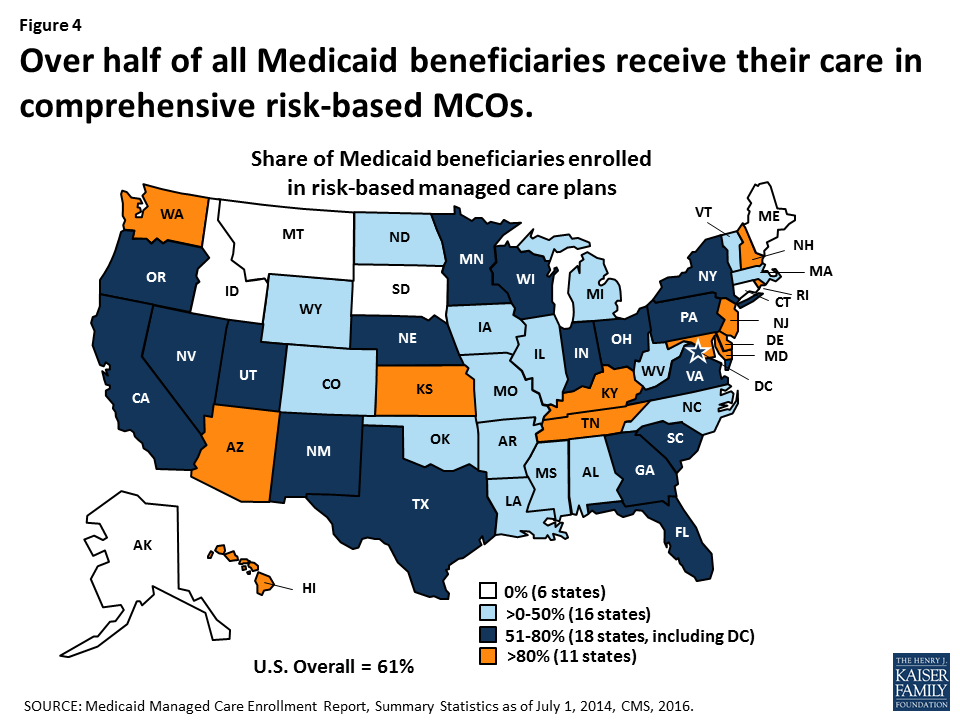
To address this problem, states and the federal government are increasingly turning to managed care, where a single entity is responsible for medical care and LTSS. The expectation is that integrated delivery models will improve quality of care, enhance the beneficiary experience with care and services, and help control expenditure growth.
In Medicaid managed LTSS programs, the managed care organization is responsible for a range of LTSS or a range of LTSS and medical services. During the past decade the number of states with managed LTSS programs has also grown from 8 in 2004 to 21 in 2016, and with an additional 8 states having plans to implement managed LTSS.207 ,208 In 2014, between 500,000 and 1.7 million Medicaid beneficiaries were served by managed LTSS programs.209 To operate managed LTSS programs, states need Centers for Medicare & Medicaid Services (CMS) approval of state plan amendments, but have flexibility in deciding the populations that will be served, the types of services covered, whether enrollment is mandatory or voluntary, and the type of payment methodology used to compensate providers.210 ,211
In addition, CMS has developed the Financial Alignment Initiative to test demonstrations of integrated care and financing models for Medicare-Medicaid enrollees.212 The goal of these demonstrations is to develop person-centered care delivery models that integrate medical, behavioral health, and LTSS for Medicare-Medicaid enrollees. Under this initiative, CMS made two models available to states: (1) a capitated model in which managed health plans receive Medicare and Medicaid payments for the full range of health services and LTSS, and (2) a managed fee-for-service model in which states are eligible to benefit financially from savings resulting from initiatives that improve quality and reduce costs. Ten states—California, Illinois, Massachusetts, Michigan, New York, Ohio, Rhode Island, South Carolina, Texas, and Virginia—are participating in the managed care model and two states—Colorado and Washington—are participating in the managed fee-for-service model.213
Although there is some evidence that the use of managed LTSS can lead to lower utilization of some services like preventable emergency room visits, hospital stays, and institutional services—factors typically associated with high spending—cost studies have offered mixed evidence on overall savings.214 The Financial Alignment Initiative is still underway and final quantitative results are not available.
Evaluations of managed LTSS from the mid-2000s found inconclusive and inconsistent evidence that these programs produced savings. Furthermore, given that some of these programs included a large fraction of dual-eligible enrollees, it was not clear if the Medicaid savings accrued had simply been shifted costs from Medicaid to Medicare.215 ,216 , 217 Grabowski reported that of the six programs he reviewed—PACE, Wisconsin Family Care, Minnesota MSHO, Arizona ALTCS, S/HMO II in Nevada, and Texas STAR+PLUS—only two—Arizona ALTCS and Texas STAR+PLUS programs—offered good evidence of savings. In comparing the ALTCS cost estimates with what the traditional Medicaid program would have cost for the first 5 years of the program, ALTCS costs were on average 16 percent per year lower.218 Benchmarked against predicted fee-for-service expenditures had the program not been implemented, the Texas STAR+PLUS was estimated to have 17 percent savings.219 These two studies suffered from significant methodological limitations, hence the findings should be viewed with caution. Another program that has shown promising potential for cost savings is New Mexico’s managed LTSS CoLTS program. An independent evaluation conducted in 2011 found it to be cost-effective and actuarially sound. Specifically, it found that participating MCOs’ per member per month spending was just below their capitated costs.220
A major challenge in managed care arrangements for LTSS is setting the capitation rate so that MCOs have adequate funds to provide care to beneficiaries, provide care management, market the plans and cover other administrative needs, and still achieve savings. A rule of thumb for marketing and standard administrative costs in managed care plans and other employer-based insurance is about 10 percent of costs and care management might be another 5 percent of costs, leaving perhaps 85 percent of standard fee-for-service expenditures for both services and profit to the managed care organization. Rates that are too low will discourage plans from participating, force them to drop out of the arrangement, or provide a disincentive to offer optimal care. For states that have low fee-for-service rates to begin with, designing capitation rates below them will be difficult. In this case, achieving savings will be difficult and will require substantial reductions in utilization of expensive health care services, such as hospitals and nursing homes.221
The expansion of programs that use MCOs to integrate LTSS and medical care could facilitate improved services and lower costs. However, despite the popularity of these initiatives, there is a marked paucity of evaluations of their effectiveness in lowering unnecessary utilization and expenditures and improving quality of care. Although they provide opportunities for better care and lower costs, managed care always carries risks because of the financial incentives to provide less care and to contract with only low-cost providers.