President Trump’s Proclamation Suspending Entry for Immigrants without Health Coverage

Published: Oct 10, 2019

Introduction

On October 4, 2019, President Trump released a proclamation suspending entry of immigrants into the United States unless they provide proof of health insurance within 30 days of entry or have financial resources to pay for reasonably foreseeable health insurance costs. The proclamation indicates that the suspension is necessary to protect the health care system and taxpayers from uncompensated care costs. This brief provides an overview of the proclamation and data on health coverage and health care use for immigrants.

Overview of Proclamation

Effective November 3, 2019, the proclamation would suspend entry of immigrants unless they can prove they will be covered by approved health insurance within 30 days of entry into the U.S. or that they have financial resources to pay for reasonably foreseeable medical costs.

Approved health coverage. Under the proclamation, approved health insurance would include employer-sponsored and other private coverage, including unsubsidized coverage through the ACA Marketplaces, short-term plans, traveler plans, or catastrophic plans. Subsidized Marketplace coverage and Medicaid coverage for adults would not count as approved coverage. State or local programs and other programs, like Ryan White, are also not included as approved coverage in the proclamation.

Individuals subject to suspension. The suspension would apply to individuals seeking an immigrant visa on or after November 3, 2019. The new requirement would primarily affect family-based immigrants. It would not apply to refugees, asylees, people entering as non-immigrants, and certain other groups. Children under age 18 are subject to suspension if they are traveling with a parent who is also subject to the suspension.

Individuals subject to the proclamation will need to establish that they meet its requirements to the satisfaction of a consular officer before an immigrant visa is issued. The proclamation indicates that the Secretary of State may establish standards and procedures for these determinations.

An earlier regulation from the Trump administration made changes to public charge policies that will make it harder for immigrants to adjust to lawful permanent resident status or get a green card if they are low-income, sick, or likely to enroll in Medicaid. It is likely that the confusion and chilling effect surrounding the regulation will lead to declines in Medicaid and CHIP coverage among immigrant families beyond those directly affected by the changes and increase the uninsured rate among immigrant families.

Health Coverage and Health Care for Immigrants

In 2017, there were 22 million noncitizens residing in the United States, accounting for about 7% of the total U.S. population.1  About six in ten noncitizens were estimated to be lawfully present immigrants, while the remaining four in ten were estimated to be undocumented immigrants:2  Many individuals live in mixed immigration status families that may include lawfully present immigrants, undocumented immigrants, and/or citizens.

Noncitizens are more likely to be uninsured than citizens, but citizens account for the majority of the total uninsured. Noncitizens, including lawfully present and undocumented immigrants, are significantly more likely to be uninsured than citizens, reflecting limited eligibility for coverage options and enrollment barriers. As of 2017, among the total nonelderly population, 23% of estimated lawfully present immigrants and more than four in ten (45%) estimated undocumented immigrants were uninsured compared to fewer than one in ten (8%) citizens (Figure 1). Despite the higher uninsured rate among noncitizens, citizens still accounted for three-quarters of the total 27.4 million uninsured.

Figure 1: Uninsured Rates and Distribution of the Uninsured among the Nonelderly Population by Immigration Status, 2017

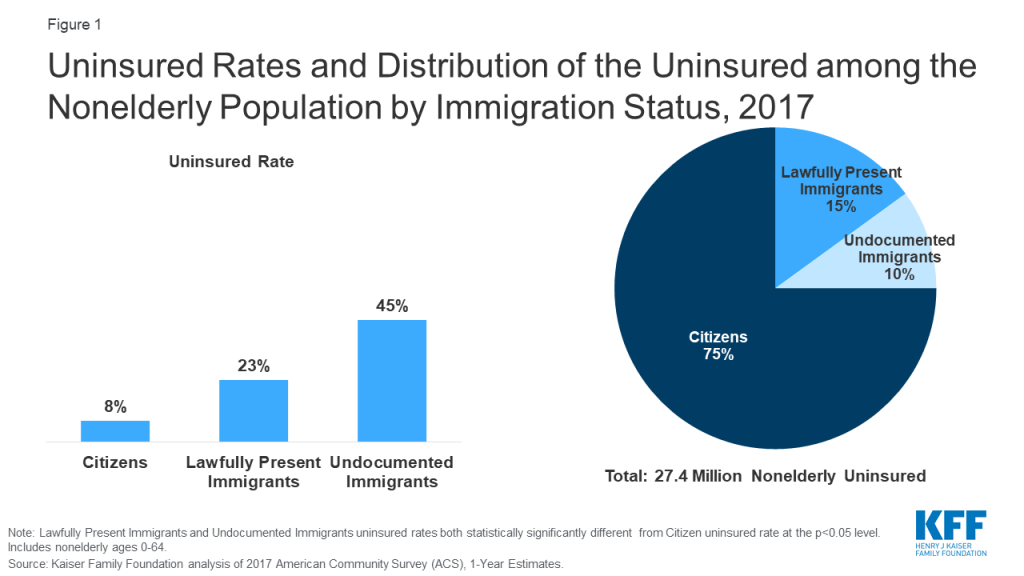
The higher uninsured rates among noncitizens reflect limited access to employer-sponsored coverage; eligibility restrictions for Medicaid, CHIP, and ACA Marketplace coverage; and barriers to enrollment among eligible individuals.

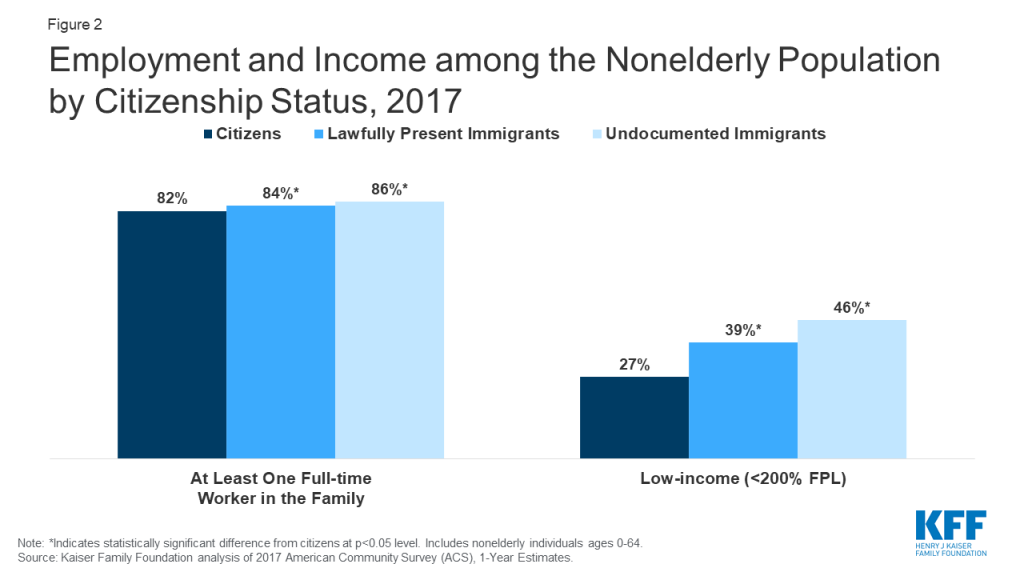
  • Although most nonelderly noncitizens live in a family with a full-time worker, they face gaps in access to private coverage. Nonelderly noncitizens are more likely than nonelderly citizens to live in a family with at least one full-time worker, but they also are more likely to be low-income (Figure 2). They have lower incomes because they are often employed in low-wage jobs, and they work in industries that are less likely to offer employer-sponsored coverage. Further, given their lower incomes, noncitizens face increased challenges affording employer-sponsored coverage when it is available or purchasing coverage through the individual market.
Figure 2: Employment and Income among the Nonelderly Population by Citizenship Status, 2017
  • Lawfully present immigrants may qualify for Medicaid and CHIP but are subject to certain eligibility restrictions. In general, lawfully present immigrants must have a “qualified” immigration status to be eligible for Medicaid or CHIP and many, including most LPRs or “green card” holders, must wait five years after obtaining qualified status before they may enroll. States have an option to eliminate the five-year wait for lawfully residing immigrant children and pregnant women, and half of states (24) apply the option to both children and pregnant women, while ten states use it for children only, and one state (Wyoming) uses it only for pregnant women.3  Lawfully present immigrants can purchase coverage through the ACA Marketplaces and may receive subsidies for this coverage within the five-year waiting period. Undocumented immigrants are not eligible to enroll in Medicaid or CHIP or to purchase coverage through the ACA Marketplaces.
  • Many lawfully present immigrants who are eligible for coverage remain uninsured because immigrant families face a range of enrollment barriers, including fear, confusion about eligibility policies, difficulty navigating the enrollment process, and language and literacy challenges.

Research shows immigrants tend to be younger and healthier and to use less health care than U.S born individuals. Data show that immigrants spend less on health care, compared to their U.S. born counterparts, and make larger out-of-pocket health care payments compared to nonimmigrants.4  Immigrants have lower spending, in part, because they use less care due to their low coverage rates and limited access to care.5  They also tend to be younger and healthier than nonimmigrants, although this health difference decreases over time as immigrants spend longer in the United States.6 

Though uninsured people are less likely to access care than those with coverage, when they do seek care they are typically billed for these services. Most uninsured people do not receive health services for free or at reduced charge, and many are asked to pay in full up front before they receive care.7  As a result, when uninsured people use care, they are at risk of incurring medical debt. Like other uninsured individuals, many immigrants without coverage can obtain low-cost care through community health centers. Moreover, under federal law, hospitals are required to screen and stabilize every patient who seeks emergency care.

Some of the cost of care for uninsured people is converted to uncompensated care for providers, but uncompensated care costs have declined in recent years and immigrants likely account for a small share of uncompensated care costs. When uninsured people are unable to pay their bills, providers absorb some of the cost of care for the uninsured. Some uncompensated care is offset by private or public programs specifically for this purpose. In recent years, uncompensated care costs have declined due to coverage expansions under the Affordable Care Act (ACA).8  Further, there is limited evidence that uncompensated care for uninsured patients is associated with hospitals charging higher prices for those who are privately insured.9  Given that immigrants account for a small share of the total uninsured population and that they use less care compared to the U.S. born, they likely account for a small share of total uncompensated care costs.

  1. Kaiser Family Foundation analysis of 2017 American Community Survey (ACS), 1-Year Estimates. ↩︎
  2. The estimate of the total number of non-citizens in the US is based on the 2017 American Community Survey (ACS). The ACS does not include a direct measure of whether a non-citizen has legal status or not. We impute documentation status by drawing on methods underlying the 2013 analysis by the State Health Access Data Assistance Center (SHADAC) and the recommendations made by Van Hook et. al.. This approach uses the second wave of the 2008 Survey of Income and Program Participation (SIPP) to develop a model that predicts immigration status for each person in the sample; it then applies the model to a second data source, controlling to state-level estimates of total undocumented population as well as the undocumented population in the labor force from the Pew Research Center. See, “U.S. Unauthorized Immigrant Total Dips to Lowest Level in Decade,” available here: http://www.pewhispanic.org/2018/11/27/u-s-unauthorized-immigrant-total-dips-to-lowest-level-in-a-decade/. ↩︎
  3. Tricia Brooks, Lauren Roygardner, and Samantha Artiga. Medicaid and CHIP Eligibility, Enrollment, and Cost Sharing Policies as of January 2019: Findings from a 50-State Survey. (Washington, DC: The Kaiser Family Foundation, 2019), https://modern.kff.org/report-section/medicaid-and-chip-eligibility-enrollment-and-cost-sharing-policies-as-of-january-2019-findings-from-a-50-state-survey-medicaid-and-chip-eligibility/ ↩︎
  4. Lila Flavin, Leah Zallman, Danny McCormick, and J. Wesley Boyd, Medical Expenditures on and by Immigrant Populations in the United States: A Systematic Review, (Boston, MA: Tufts University School of Medicine, 2018), https://doi.org/10.1177%2F0020731418791963 ↩︎
  5. Ibid. ↩︎
  6. Ibid. ↩︎
  7. Kaiser Family Foundation analysis of the 2015 Kaiser Family Foundation/New York Times Medical Bills Survey. ↩︎
  8. Larisa Antonisse, Rachel Garfield, Robin Rudowitz, and Madeline Guth. The Effects of Medicaid Expansion under the ACA: Updated Findings from a Literature Review. (Washington, DC: The Kaiser Family Foundation, 2019), https://modern.kff.org/medicaid/issue-brief/the-effects-of-medicaid-expansion-under-the-aca-updated-findings-from-a-literature-review-august-2019/ ↩︎
  9. Teresa A. Coughlin, John Holahan, Kyle Caswell, and Megan McGrath. Uncompensated Care for the Uninsured in 2013: A Detailed Examination. (Washington, DC: The Kaiser Family Foundation, 2014),   https://modern.kff.org/uninsured/report/uncompensated-care-for-the-uninsured-in-2013-a-detailed-examination/ ↩︎

Nearly 4 in 10 Adults With Mental Illness Reporting Thoughts of Suicide Did Not Receive Needed Care

Published: Oct 10, 2019

Source

State Health Facts: Mental Health and Substance Use

News Release

Nearly 54 Million Americans Have Pre-Existing Conditions That Would Make Them Uninsurable in the Individual Market without the ACA

Published: Oct 4, 2019

Almost Half of Non-Elderly Families have At Least One Adult with a Pre-Existing Condition

An updated KFF analysis estimates that almost 54 million people – or 27% of all adults under 65 —have pre-existing health conditions that would likely have made them uninsurable in the individual markets that existed in most states before the Affordable Care Act.

The share of adults under 65 with such declinable pre-existing conditions varies significantly across states, from at least a third in West Virginia (37%), Arkansas (34%), Kentucky (34%), and Mississippi (34%) to a little more than one in five in Colorado (22%).

Older working-age Americans (ages 55-64) are the most likely age group to have declinable pre-existing conditions (44%), more than twice the share (18%) among the youngest age group (18-34). Women are more likely than men to have declinable conditions (30% compared to 24%).

Almost half (45%) of non-elderly families include at least one adult with a medical condition who might not be able to buy individual insurance without the ACA’s prohibition of medical underwriting.

The analysis comes as the Fifth Circuit Court of Appeals weighs a decision in the Texas v. Azar case, which seeks to overturn the entire Affordable Care Act, including the provisions that prohibit insurers from denying coverage or charging more to people with pre-existing conditions. The Trump administration has joined the conservative state Attorneys General in arguing that the ACA should be invalidated.

While most people with pre-existing conditions are covered now through employers or public programs such as Medicaid, people may look to the individual market for coverage during periods of transition, such as losing or changing a job, leaving a job due to illness, starting a business, aging off a parent’s policy, retiring before age 65, or losing Medicaid eligibility.

Before the ACA protections took effect in 2014, private insurers in the individual market could use applicants’ health status, history and other risk factors to determine whether and under what terms to issue coverage. Some conditions that could lead to automatic denials of coverage at the time include cancer, diabetes, epilepsy, heart disease, and pregnancy.

Using 2018 data from two large government surveys, the analysis estimates the total number of nonelderly adults in each state with a health condition that could lead to a denial of coverage in the individual insurance market, based on pre-ACA field underwriting guides for brokers and agents. The estimates do not include people with other health conditions that would not necessarily cause a denial, but could lead to higher insurance costs based on underwriting.

Whether and how people with pre-existing conditions could be affected if they seek coverage on the individual market in the future depends on the outcome of the ongoing court challenge, and how federal and state lawmakers respond to the court’s decision.

Pre-Existing Condition Prevalence for Individuals and Families

Authors: Gary Claxton, Cynthia Cox, Anthony Damico, Larry Levitt, and Karen Pollitz
Published: Oct 4, 2019

The impending decision by the Fifth Circuit Court of Appeals in the Texas v. Azar case raises the prospect that insurers will once again be able to return to using people’s health status in determining their eligibility and premiums for health insurance, at least for coverage obtained from the non-group, or individual insurance, market.  In the case, the plaintiff states’ Attorneys General and the Trump Administration are arguing that the Affordable Care Act is unconstitutionally structured and should be invalidated in its entirety.  This would include overturning provisions that guarantee that people with pre-existing health conditions cannot be denied coverage or charged higher premiums due to their health status.

Given the significant barriers to coverage that may reemerge if these provisions in the ACA were to be invalidated, we are updating our prior work looking at the share of nonelderly adults with health conditions that would likely to have caused them to be denied coverage if they applied for non-group health insurance prior to the effective date of the ACA.  And because the financial consequences of these changes would potentially affect the whole family, we extend our analysis to estimate the percent of nonelderly families with at least one adult who has one or more declinable conditions.

Consistent with our previous analysis, we estimate that 27% of nonelderly adults have a declinable health condition, which is about 53.8 million people in 2018.  We further estimate that 45% of nonelderly families have at least one nonelderly adult member with a declinable health condition.  Finally, we update our state-based estimates of the prevalence of declinable pre-existing conditions with the most current data available, showing that the share of non-elderly adults with pre-existing conditions ranges from 22% in Colorado to 37% in West Virginia.

People with pre-existing health conditions were often denied coverage or charged higher premiums for individual market coverage before the ACA took effect in 2014.  While most of people with pre-existing health conditions are covered currently by employer-based coverage or public programs, such as Medicaid, the non-group market is where they may need to look for coverage in times of transition, for example, if they lose a job, change jobs, start a business, divorce, age-off of a parent’s policy, retire before age 65, leave employment due to serious illness, get a job and lose Medicaid, or otherwise lose their eligibility for work-based or public coverage. While we cannot predict how the court would fashion relief if these ACA provisions were overturned, access to individual market insurance for people with pre-existing conditions could be seriously reduced.

Use of Health Status in Underwriting and Rating Before the ACA

Table 1: Examples of Declinable Conditions In the Medically Underwritten Individual Market, Before the Affordable Care Act
Condition
AIDS/HIVLupus
Alcohol abuse/ Drug abuse with recent treatmentMental disorders (severe, e.g. bipolar, eating disorder)
Alzheimer’s/dementiaMultiple sclerosis
Arthritis (rheumatoid), fibromyalgia, other inflammatory joint diseaseMuscular dystrophy
Cancer within some period of time (e.g. 10 years, often other than basal skin cancer)Obesity, severe
Cerebral palsyOrgan transplant
Congestive heart failureParaplegia
Coronary artery/heart disease, bypass surgeryParalysis
Crohn’s disease/ ulcerative colitisParkinson’s disease
Chronic obstructive pulmonary disease (COPD)/emphysemaPending surgery or hospitalization
Diabetes mellitusPneumocystic pneumonia
EpilepsyPregnancy or expectant parent
HemophiliaSleep apnea
Hepatitis (Hep C)Stroke
Kidney disease, renal failureGender Dysphoria
SOURCE: Kaiser Family Foundation review of field underwriting guidelines from Aetna (GA, PA, and TX), Anthem BCBS (IN, KY, and OH), Assurant, CIGNA, Coventry, Dean Health, Golden Rule, Health Care Services Corporation (BCBS in IL, TX) HealthNet, Humana, United HealthCare, Wisconsin Physician Service.  Conditions in this table appeared on declinable conditions list in half or more of guides reviewed.

 NOTE: Many additional, less-common disorders also appearing on most of the declinable conditions lists were omitted from this table.

Estimates of the Share of Adults with Pre-Existing Conditions

We used data from the National Health Interview Survey (NHIS) to estimate that 27% of nonelderly adults had a declinable health condition in 2018, the same percentage that we found in our earlier analysis for 2015. The NHIS has a number of questions about whether the respondent has ever been diagnosed with a number of the health conditions that would have been declinable in the pre-ACA non-group market. While we cannot duplicate the underwriting processes carried out by insurers, we feel that our approach is reasonable and may be conservative because the NHIS does not contain information about all of the conditions (e.g.,  AIDS/HIV) used by insurers and does not provide information on prescriptions that insurers also used to decline applicants for coverage.

Although each family member would have been separately underwritten in the pre-ACA non-group market, the economic consequences of having a member of the family denied coverage or surcharged due to their health would likely be felt by all members of the family. To look at the number of people that might be affected, we extended our previous methods and estimate that, in 2018, 45% of non-elderly families included a non-elderly adult with a declinable condition. Individuals living in households without a relative are considered to be a family of one person for this analysis.

A larger share of non-elderly adult women (30%) than men (24%) have declinable pre-existing conditions in 2018, unchanged from 2015.  We estimate that 23.7 million men have a pre-existing condition that would have left them uninsurable in the individual market pre-ACA, compared to 30.1 million women. Pregnancy explains part (about 2 million women) but not all of this difference.

The prevalence of declinable conditions also increases with age among non-elderly adults: ranging from 18% of those in the 18-34 age group to 44% for those in the 55-64 age group.

Table 2 Share of Non-Elderly People with Declinable Condition
Age GroupShare with Declinable Condition
18-3418%
35-4424%
45-5429%
55-6444%

The rates of declinable pre-existing conditions continue to vary from state to state. On the low end, in Colorado, at least 22% of non-elderly adults have conditions that would likely be declinable if they were to seek coverage in the individual market under pre-ACA underwriting practices.  Rates are higher in other states – particularly in the South – such as Arkansas (34%), Kentucky (34%), Mississippi (34%), and West Virginia (37%), where at least a third of the non-elderly population would have declinable conditions.

Table 3: Estimated Number and Percent of Non-Elderly People with Declinable Pre-Existing Conditions Under Pre-ACA Practices, 2018
StatePercent of Non-Elderly Population Number of Non-Elderly Adults
Alabama33%957,000
Alaska26%119,000
Arizona28%1,145,000
Arkansas34%597,000
California25%6,093,000
Colorado22%789,000
Connecticut24%529,000
Delaware28%160,000
District of Columbia23%113,000
Florida28%3,526,000
Georgia28%1,805,000
Hawaii25%212,000
Idaho26%259,000
Illinois26%2,045,000
Indiana30%1,210,000
Iowa25%466,000
Kansas27%465,000
Kentucky34%890,000
Louisiana33%932,000
Maine28%225,000
Maryland27%1,019,000
Massachusetts23%975,000
Michigan29%1,753,000
Minnesota23%790,000
Mississippi34%593,000
Missouri30%1,079,000
Montana24%152,000
Nebraska26%295,000
Nevada26%487,000
New Hampshire28%233,000
New Jersey25%1,359,000
New Mexico28%337,000
New York26%3,200,000
North Carolina28%1,762,000
North Dakota25%113,000
Ohio29%1,983,000
Oklahoma31%718,000
Oregon28%701,000
Pennsylvania27%2,105,000
Rhode Island27%175,000
South Carolina30%914,000
South Dakota24%123,000
Tennessee32%1,302,000
Texas28%4,794,000
Utah24%438,000
Vermont24%92,000
Virginia26%1,349,000
Washington25%1,154,000
West Virginia37%382,000
Wisconsin25%883,000
Wyoming25%86,000
US27%53,884,000
SOURCE: Kaiser Family Foundation analysis of data from National Health Interview Survey and the Behavioral Risk Factor Surveillance System.NOTE: Five states (MA, ME, NJ, NY, VT) had broadly applicable guaranteed access to insurance before the ACA. What protections might exist in these or other states under a repeal and replace scenario is unclear.

Discussion

Since the effective date of the ACA market changes in January of 2014, people with pre-existing health conditions have not had to worry about their health conditions affecting their access to health insurance or increasing the premiums that they pay. The legislation assures people access to individual market coverage with comprehensive benefits through a variety of changes in their work and life circumstances.  This could change quite quickly if the ACA market protections for people with pre-existing conditions were invalidated.  While many adults with pre-existing conditions have Medicaid or employer coverage that would still provide protection, over a quarter of nonelderly adults have a health condition that would jeopardize their access to non-group coverage without the ACA market protections, potentially affecting almost one-half of non-elderly families in the country.  For these families, an invalidated ACA could fundamentally affect future access to health care.

Methods

To calculate nationwide prevalence rates of declinable health conditions, we reviewed the survey responses of nonelderly adults for all question items shown in Methods Table 1 using the CDC’s 2018 National Health Interview Survey (NHIS).  Approximately 27% of 18-64 year olds, or 54 million nonelderly adults, reported having at least one of these declinable conditions in response to the 2018 survey.  The CDC’s National Center for Health Statistics (NCHS) relies on the medical condition modules of the annual NHIS for many of its core publications on the topic; therefore, we consider this survey to be the most accurate means to estimate both the nationwide rate and weighted population.

Since the NHIS does not include state identifiers nor sufficient sample size for most state-based estimates, we constructed a regression model for the CDC’s 2018 Behavioral Risk Factor Surveillance System (BRFSS) to estimate the prevalence of any of the declinable conditions shown in Methods Table 1 at the state level.  This model relied on three highly significant predictors: (a) respondent age; (b) self-reported fair or poor health status; (c) self-report of any of the overlapping variables shown in the left-hand column of Methods Table 1.  Across the two data sets, the prevalence rate calculated using the analogous questions (i.e. the left-hand column of Methods Table 1) lined up closely, with 21% of 18-64 year old survey respondents reporting at least one of those declinable conditions in the 2018 NHIS and 23% of 18-64 year olds in the 2018 BRFSS.  Applying this prediction model directly to the 2018 BRFSS microdata yielded a nationwide prevalence of any declinable condition of 29%, a near match to the NHIS nationwide estimate of 27%.

In order to align BRFSS to NHIS overall statistics, we then applied a Generalized Regression Estimator (GREG) to scale down the BRFSS microdata’s prevalence rate and population estimate to the equivalent estimates from NHIS, 27% and 54 million.  Since the regression described in the previous paragraph already predicted the prevalence rate of declinable conditions in BRFSS by using survey variables shared across the two datasets, this secondary calibration solely served to produce a more conservative estimate of declinable conditions by calibrating BRFSS estimates to the NHIS.  After applying this calibration, we calculated state-specific prevalence rates and population estimates off of this post-stratified BRFSS sample.

Methods Table 1: Declinable Medical Conditions Available in Survey Microdata
Declinable Condition Questions Available in both the 2018 National Health Interview Survey and also the 2018 Behavioral Risk Factor Surveillance SystemDeclinable Condition Questions Available in only the 2018 National Health Interview Survey
Ever had CHDMelanoma Skin Cancer
Ever had AnginaAny Other Heart Condition
Ever had Heart AttackStomach Duodenal or Peptic Ulcer
Ever had StrokeDifficulty Due to Mental Retardation
Ever had COPDDifficulty Due to Cerebral Palsy
Ever had EmphysemaDifficulty Due to Senility
Chronic Bronchitis in past 12 monthsDifficulty Due to Depression
Ever had Non-Skin CancerDifficulty Due to Endocrine Problem
Ever had DiabetesDifficulty Due to Blood Forming Organ Problem
Weak or Failing KidneysDifficulty Due to Drug / Alcohol / Substance Abuse
BMI > 40Difficulty Due to Schizophrenia, ADD, or Bipolar Disorder
Pregnant

To calculate nationwide prevalence rates of declinable health conditions at the family-level, we imputed person-level presence of any condition onto the NHIS person file using the main 2018 NHIS sample adult estimate.  This model relied on three highly significant predictors: (a) respondent age; (b) self-reported fair or poor health status; (c) self-report of any health-related activity limitation, disability, hospitalization, or high rate of physician visits.  Since all individuals responding to the NHIS sample adult questionnaire also respond to the NHIS person component of the survey, these factors produced a reasonably predictive estimate, matching 27% of non-elderly adults with pre-existing conditions for all individuals participating in the survey.  Unlike the NHIS sample adult file, the NHIS person file allows for analyses of family-wide characteristics.  This prediction yielded 53% of non-elderly adults having a declinable condition themselves or co-habiting with a non-elderly adult family member with a declinable condition; using the NHIS family weights, this results in 45% of non-elderly families (families having at least one non-elderly adult family member) having one or more adults with a declinable condition.  In total, approximately 54 million non-elderly adults may have a pre-existing condition and almost as many non-elderly adults without pre-existing conditions live with a family member that does.

The programming code, written using the statistical computing package R v.3.6.1, is available upon request for people interested in replicating this approach for their own analysis.

News Release

Kaiser Health News (KHN) Wins Prestigious Barlett & Steele Investigative Journalism Award

Published: Oct 2, 2019

SAN FRANCISCO – KFF is pleased to announce that Kaiser Health News (KHN), its editorially independent health news service, has won a top prize Wednesday in the 13th annual Barlett & Steele Awards for Investigative Journalism.

KHN Senior Correspondent Christina Jewett discovered that for nearly 20 years, the FDA was striking deals with medical device makers to keep millions of malfunction and injury reports out of the public database known as MAUDE – and instead letting device makers submit reports to a secret database, hidden from public view.

KHN’s “Hidden Harm” investigative series also revealed that the FDA granted special reporting exemptions that were so obscure that safety experts, doctors and even a recent FDA commissioner were not aware they existed.

The hidden database included 500,000 reports of injuries or malfunctions tied to breast implants; 66,000 surgical stapler malfunctions and more than 50,000 incidents tied to the Sprint Fidelis, a device implanted in the chest to shock a patient’s heart back to normal.

Citing KHN’s work, device-safety experts called on the FDA to open up the hidden reports of harm. That triggered FDA Commissioner Dr. Scott Gottlieb to tweet that the reports would be open to the public:  “We’re now prioritizing making ALL of this data available,” Gottlieb wrote. On June 21, the FDA published its entire hidden database online, revealing 5.7 million device-related injuries or malfunctions for the first time.

“We established KHN to do truly important and impactful journalism just like this – getting out the facts, holding government accountable, and most of all helping people,”  said Drew Altman, KFF’s President and CEO and Founding Publisher of KHN.

“It’s so gratifying to publish an investigation that has such rapid impact and will make medical care safer for millions of patients,” said KHN editor-in-chief Elisabeth Rosenthal. “‘Transparency’ is all the rage in health care. But as Christina showed, it often take relentless reporting to expose the truth.”

The KHN series was one of two “Gold” award winners in the Barlett & Steele Awards, administered by the Donald W. Reynolds National Center for Business Journalism at Arizona State University.  Other winners announced Wednesday include The Wall Street Journal, the International Consortium of Investigative Journalists, NBC News, The Associated Press and The Oregonian.

The awards are named for the investigative team of Don Barlett and Jim Steele, whose honors included two Pulitzer prizes.

About The Henry J. Kaiser Family Foundation and Kaiser Health News:

Filling the need for trusted information on national health issues, KFF (the Kaiser Family Foundation) is a nonprofit organization based in San Francisco, California.  KHN is an editorially independent program of KFF and is the nation’s leading and largest health and health policy newsroom, producing stories that run on kffhealthnews.org and are published by hundreds of news organizations across the country.

Contraceptive Implants

Published: Oct 1, 2019

The contraceptive implant is the most effective reversible birth control method available. Implants, along with intrauterine devices (IUDs), are known as long-acting reversible contraception (LARCs) because they can be used to prevent pregnancy for several years and can be removed at any time. Implants are a relatively newer contraceptive method and have undergone substantial design modifications since their marred debut in the 1990s. The newest generation implant was introduced to the U.S. market in 2006, and remains the only contraceptive implant available in the U.S. Barriers to implant use include high up-front cost, lack of awareness and availability, and required insertion and removal by a trained health care provider. This fact sheet provides an overview of contraceptive implants including use, availability, and financing.

Background

In 1990, the Food and Drug Administration (FDA) approved Norplant, manufactured by Leiras Oy, the first subdermal contraceptive implant that was inserted under the skin of a woman’s upper arm by a health care provider. Made of silicone, it had six capsules containing levonorgestrel, a synthetic hormone, and was effective for up to five years. Following concerns about its effectiveness and lawsuits on behalf of women who experienced complications, Norplant’s distributor, Wyeth-Ayerst, discontinued its U.S. distribution in 2002.

In 2006, the FDA approved Implanon, a single, thin, plastic, etonogestrel-releasing rod manufactured by Organon USA (a division of Merck). The improved design and composition made Implanon easier and faster to insert and remove than first generation implants. In 2010, the manufacturer replaced Implanon with Nexplanon, which is designed to be radiopaque (visible through x-ray) and has an improved insertion device. It is FDA-approved for use up to three years, although some research indicates effectiveness beyond that period.1 ,2 

With a 0.05% failure rate, the contraceptive implant is the most effective FDA-approved reversible contraceptive. Additionally, the implant removes the potential for user error and non-use associated with self-administered contraception because it is inserted by a provider and does not require any regular maintenance by the user.

Implants must be inserted and removed by a trained clinician who uses a special insertion device to place the implant just under the skin of the patient’s upper arm. The minor surgical procedure takes a few minutes and requires a local anesthetic and a small incision. After three years of use, the implant must be removed by a trained clinician. If the patient desires, a new implant can be placed at that time. Implants may be removed by a clinician at any time before three years and pregnancy can occur as soon as the first week following removal.

Contraceptive implants are safe for most women and can be inserted any time if it is reasonably certain she is not pregnant. Implants are primarily used for pregnancy prevention, but they can also be used to reduce menstrual cramps and make menstrual periods lighter. While there has been some concern about hormonal birth control for women who are breastfeeding, most findings show that progestin-only methods, such as the implant, do not appear to negatively affect breastfeeding outcomes.3  Some of the common side effects include irregular menstrual bleeding, headache, weight gain, acne, and breast pain, which may lead to discontinuation among some users.4  Less common risks associated with implant use include insertion and removal complications, ectopic pregnancy, and ovarian cysts. Although rare, some women who use the implant are at higher risk of developing blood clots, heart attack, or stroke.

Implant Use, Availability, and Outlook

Use

Because of their efficacy, continuation, and satisfaction rates, leading medical groups including the American College of Obstetricians and Gynecologists and the American Academy of Pediatrics have recommended the use of LARCs, like implants, for most women of reproductive age, including adolescents, and nulliparous and post-partum women. However, research demonstrates persistent misperceptions and a lack of awareness about implants. Although implant use in the U.S. has increased since it was first introduced in 1995, it is still lower than other contraceptive methods such as the IUD, pill, and sterilization.

In 2015-2017, the most recent years for which there are national data, about 4% of women ages 15-44 who currently use contraception used the implant, an increase from 1% in 2011-2013.5  At the same time, there has been a substantial rise in use of intrauterine devices (IUDs), which have also been promoted by several medical groups in recent years, from 10% to 14% during that same time period.

Implant users tend to be younger, lower-income, and have Medicaid coverage or are uninsured (compared to having private coverage) [Figure 1]. Possible explanations for the association of higher implant use among younger, less affluent women include the desire to avoid pregnancy for a longer period of time, lower maintenance and chance of user error, promotion of LARCs by medical organizations for adolescents, and availability at publicly-funded clinics.

Figure 1: Women using the contraceptive implant tend to be younger, lower income, and have Medicaid or are uninsuredCharacteristics of Women Using the Implant, 2015-2017

Availability

Access to implants can depend, in part, on the clinician’s ability and willingness to offer them. The 2020 KFF National Physician Survey on Reproductive Health found that the majority (87%) of obstetricians and gynecologists (ob/gyns) offer the implant, though fewer (39%) offer same-day placement. Other research indicates that reasons for clinicians not offering the implant include lack of patient interest, insufficient training in this method, inadequate reimbursement, and provider beliefs.6 ,7 ,8 

Furthermore, the FDA requires that clinicians complete specialized in-person training from the manufacturer. It should be noted that in addition to medical doctors, the training is open to advanced practice clinicians (such as nurses and physician assistants) who are authorized to perform implant insertions and removals in their practice jurisdiction. Although the 2-hour manufacturer training is offered at no cost to the provider, clinics may incur costs for travel and may encounter staffing challenges while their providers are being trained. It is unknown what percentage of providers have completed the manufacturer training, but one study found that approximately 90% of senior ob/gyn residents responding to a survey had received some implant training and felt comfortable inserting them.9  Additional clinical trainings for the implant are available from a variety of reproductive health organizations.

Federally Qualified Health Centers (FQHCs) are an important source of care for many low-income and uninsured women of reproductive age. However, provision of LARCs, including implants, has been challenging for some FQHCs due to high up-front costs of stocking them and limited training and staff capacity.10  A 2011 study found that only 36% of FQHCs offered contraceptive implants on-site. That share increased to 63% in 2017. Among these health centers, Title X grantees were more likely than non-Title X grantees to offer a broader range of contraceptive methods, including the implant (89% vs. 54%). A separate study found that specialized family planning clinics were more likely than primary care practices to offer long acting contraceptive methods. Furthermore, Planned Parenthood clinics were more likely than other types of publicly-funded clinics to offer a LARC method (98% vs. 69%-77%), and were more likely to provide same-day, on-site implant insertion, eliminating the need for women to make an additional visit or travel to another location. Research has found that reasons for clinics not offering same-day provision of implants include screening and waiting for STI test results (which is not required for implants), clinic flow, and scheduling issues.11 

Outlook

There is currently no generic or therapeutically-equivalent version of Nexplanon available in the United States. Nexplanon’s manufacturer, Organon USA (a division of Merck), holds a patent on the device until 2027.

Although Merck does not indicate any current development of new or improved implants, the Contraceptive Pipeline Database, Calliope, lists several laboratory studies that are underway to develop a biodegradable contraceptive implant. None of these studies has moved beyond the pre-clinical development stage, but if successful, a biodegradable implant could reduce some of the barriers to implant use including the need to have it removed in a clinic and the procedure’s associated costs.

Insurance Coverage and Financing of Implants

The costs of implants have been a barrier to its use, for both patients and providers.12  Although implants are cost-effective and have been shown to become cost-saving within 3 years relative to short-acting methods, the up-front costs are high.13  The wholesale price for an implant is nearly $800, in addition to costs associated with insertion and removal.14  While many insurance plans have covered implants for years, prior to the passage of the Affordable Care Act (ACA), women with private insurance were likely to face out-of-pocket charges for the product as well as the associated visits. The ACA has eliminated these costs for many women, including those with private coverage. Medicaid has required coverage of family planning services without cost sharing in all states for decades, but the ACA expanded that to require coverage of all contraceptive methods for women enrolled in a Medicaid expansion program.15 

Private Insurance

The ACA includes a requirement that most private insurance plans must cover at least one type of all 18 FDA-approved contraceptive methods for women as prescribed without cost sharing. This means that most private plans (small and large group, self-funded, and individually purchased plans) must cover the implant at no cost to policy holders. Research has found a 72% decline in average out-of-pocket spending on implants among women covered by one large insurer in the first year of the requirement.16  An analysis of claims data found that following the implementation of the ACA’s contraceptive coverage requirement in 2013, the median cost for implant insertions for women in private plans decreased to $0 and the percentage of women paying $0 for implants increased dramatically.17  Other analyses show increased utilization of LARCs among women with employer-sponsored insurance after implementation of this policy, suggesting that removing the high up-front cost of these methods may increase their use.18 ,19 

Medicaid

Federal law requires Medicaid programs to cover family planning services and supplies without cost sharing, but there are variations in coverage or specific benefits between states and between different Medicaid populations. For women enrolled in traditional Medicaid programs that were in place prior to the passage of the ACA, coverage of implants is determined by each state program. In a 2015-2016 survey of 40 states and DC, all states reported covering all LARC methods (including IUDs and implants) in their traditional Medicaid programs. States may limit coverage to only certain brands or types or apply medical management protocols to restrict availability, which some states do. Additionally, in some states, LARC devices are tied to a specific patient, so if they are not used by the person for which they were ordered, the device must be discarded at a financial loss to the clinic (rather than being permitted for use by another patient). Recognizing the high (cost) effectiveness of LARCs, many states are pursuing policies to reduce barriers to provision, like reimbursing for insertion and removal, returning unused devices for credit, and providing hospitals with separate payments for post-partum LARC insertion.

Women who qualify for Medicaid under the ACA’s expansion of the program must receive coverage for the implant because the ACA requires these expansion programs to cover all FDA-approved methods for women without cost sharing, which is the same as the requirement for private insurance plans.

Currently, 25 states extend Medicaid coverage for family planning services, including contraception, to some uninsured women who do not qualify for full scope Medicaid. States retain the flexibility to decide whether implants are covered by these programs; however, the survey mentioned above found that all responding states that extend Medicaid for family planning also cover all LARCs.

Uninsured

The federal Title X Family Planning Program funds a network of clinics to provide family planning care to millions of low-income and uninsured women at reduced or no cost. In March 2019, the Trump administration finalized new regulations that made major changes to Title X, resulting in numerous grantees withdrawing from the program while lawsuits challenging the regulations make their way through the courts. The national program has emphasized increasing access to LARCs, especially to teens, by providing additional training for providers and clinics. Although on-site provision of the implant has increased in both Title X and non-Title X clinics in recent years, Title X clinics are more likely than non-Title X clinics to offer implants on-site. In 2017, 89% of Title X clinics offered implants on-site, an increase from 51% in 2011. While implant use among women visiting Title X clinics is still low, it increased from 1% in 2009 to 7% in 2018.

Recent initiatives around the country have found young women are very likely to choose the most effective methods of contraception when cost barriers are removed and contraceptive counseling is provided.20 ,21 ,22  The Contraceptive CHOICE Project offered women of reproductive age in the St. Louis, MO, region contraception of their choice with no cost sharing, leading to a reduction in teen births and repeat abortions among participants.23  Seventy-five percent of participants chose a LARC as their method of contraception, including 17% who chose the implant.24  While participants were more likely to choose the IUD than the implant, the percentage of participants choosing the implant is noteworthy in that it is higher than the percentage of women using the implant nationally. Research shows that satisfaction and continuation rates were relatively high among women who chose either method [Table 1]. High continuation rates among implant users have also been documented in populations with Medicaid coverage and coverage through an employer.25 ,26 

Table 1: Method Choice, Satisfaction, and Continuation Among Contraceptive CHOICE Project Participants
 ImplantIUDOther Methods
Method choice117%58%25%
Satisfaction with method279%83%51%
Continuation after 12 months283%86%54%
1  McNicholas, C, et al. (2014). The Contraceptive CHOICE Project round up: What we did and what we learned. Clinical Obstetrics and Gynecology 57(4).2  Peipert, J, et al. (2011). Continuation and satisfaction of reversible contraception. Obstetrics & Gynecology 117(5).

***

Contraceptive implants are the most effective form of contraception, but use is relatively low, owing in part to: lack of awareness (they are newer to the market than many other methods); misperceptions about safety and efficacy; and high up-front costs. However, recent guidelines and initiatives have promoted implants and other long-acting reversible contraceptives as a first-line of defense against unintended pregnancy and an increasing share of health centers are offering them. Furthermore, the ACA’s requirement for coverage of contraceptive services and supplies without cost sharing removes cost barriers for millions of women, and policy changes in some state Medicaid programs are reducing the cost burden associated with stocking them in clinics. Programs that eliminate the high up-front financial barriers combined with contraceptive counseling may lead to increased use of highly-effective methods like the implant and contribute to a reduction in unintended pregnancies.

  1. McNicholas, C, et al. (2015). Use of the etonogestrel implant and levonorgestrel intrauterine device beyond the U.S. Food and Drug Administration–approved duration. Obstetrics and Gynecology 125(3). ↩︎
  2. Ali, M, et al. (2016). Extended use up to 5 years of the etonogestrel-releasing subdermal contraceptive implant: comparison to levonorgestrel-releasing subdermal implant. Human Reproduction 31(11). ↩︎
  3. Phillips S, et al. (2016). Progestogen-only contraceptive use among breastfeeding women: a systematic review. Contraception 94(3). ↩︎
  4. Diedrich, J, et al. (2015). Three-year continuation of reversible contraception. American Journal of Obstetrics and Gynecology 213(5). ↩︎
  5. Kaiser Family Foundation analysis of the National Survey of Family Growth, 2011-2013 and 2015-2017. ↩︎
  6. Luchowski, A, et al. (2014). Obstetrician-Gynecologists and contraception: long-acting reversible contraception practices and education. Contraception 89(6). ↩︎
  7. Thompson, et al. (2018), Training contraceptive providers to offer intrauterine devices and implants in contraceptive care: a cluster randomized trial. American Journal of Obstetrics and Gynecology (218)6. ↩︎
  8. Morgan, et al. (2019). Health care provider attitudes about the safety of “quick start” initiation of long-acting reversible contraception for adolescents. Journal of Pediatric and Adolescent Gynecology (32)4. ↩︎
  9. Davis, S, et al. (2017). Familiarity with long-acting reversible contraceptives among obstetrics and gynecology, family medicine, and pediatrics residents: results of a 2015 national survey and implications for contraceptive provision for adolescents. Journal of Pediatric and Adolescent Gynecology 31(1). ↩︎
  10. Wood, S, et al. (2014). Accessibility of long-acting reversible contraceptives (LARCs) in Federally Qualified Health Centers (FQHCs). Contraception 89(2). ↩︎
  11. Biggs, M, Harper, C, & Brindis, C. (2015). California family planning health care providers’ challenges to same-day long-acting reversible contraception provision. Obstetrics & Gynecology 126(2). ↩︎
  12. Morse, J, et al. (2012). Postabortion contraception: qualitative interviews on counseling and provision of long-acting reversible contraceptive methods. Perspectives on Sexual and Reproductive Health 44(2). ↩︎
  13. Trussell, J, et al. (2015). Achieving cost-neutrality with long-acting reversible contraceptive methods. Contraception 91(1). ↩︎
  14. Prescott G & Matthews C. (2013). Long‐acting reversible contraception: A review in special populations. Pharmacotherapy 34(1). ↩︎
  15. Grandfathered plans are exempt from this requirement. These are plans in existence prior to March 23, 2010, that have not made significant changes in coverage policies. In 2018, 16% of covered workers were in grandfathered plans. ↩︎
  16. Becker, N & Polsky, D. (2015). Women saw large decrease in out-of-pocket spending for contraceptives after ACA mandate removed cost sharing. Health Affairs 34(7). ↩︎
  17. Weisman, et al. (2019). ACA’s contraceptive coverage requirement: Measuring use and out-of-pocket spending. Health Affairs 38(9). ↩︎
  18. Carlin, C, Fertig, A, & Dowd, B. (2016). Affordable Care Act’s mandate eliminating contraceptive cost sharing influenced choices of women with employer coverage. Health Affairs 35(9). ↩︎
  19. Becker, N. (2018). The impact of insurance coverage on utilization of prescription contraceptives: Evidence from the Affordable Care Act. Journal of Policy Analysis and Management 37(3). ↩︎
  20. Sanders, J, et al. (2018). Contraceptive method use during the community-wide HER Salt Lake contraceptive initiative. American Journal of Public Health 108(4). ↩︎
  21. Ricketts, S, Klingler, G, & Schwalberg, R. (2014). Game change in Colorado: Widespread use of long-acting reversible contraceptives and rapid decline in births among young, low-income women. Perspectives on Sexual and Reproductive Health 46(3). ↩︎
  22. Secura, G, et al. (2010). The Contraceptive CHOICE Project: Reducing barriers to long-acting reversible contraception. American Journal of Obstetrics and Gynecology 203(2). ↩︎
  23. Peipert, J, Madden, T, Allsworth, J, & Secura, G. (2012). Preventing unintended pregnancies by providing no-cost contraception. Obstetrics and Gynecology 120(6). ↩︎
  24. McNicholas, C, et al. (2014). The Contraceptive CHOICE Project round up: What we did and what we learned. Clinical Obstetrics and Gynecology 57(4). ↩︎
  25. Romano, M, Toye, P, & Patchen, L. (2018). Continuation of long-acting reversible contraceptives among Medicaid patients. Contraception 98(2). ↩︎
  26. Berenson, A, et al. (2015). Complications and continuation rates associated with 2 types of long-acting contraception. American Journal of Obstetrics and Gynecology 212(6). ↩︎

Senate Appropriations Committee Approves FY 2020 State and Foreign Operations (SFOPs) Appropriations Bill

Published: Sep 27, 2019

UPDATED: The Senate Appropriations Committee approved the FY 2020 State & Foreign Operations (SFOPs) appropriations bill (and accompanying report) on September 26, 2018 (a draft version of the bill and report were released on September 18, 2019). The SFOPs bill includes funding for U.S. global health programs at the State Department and the U.S. Agency for International Development (USAID).[i] Funding for these programs, through the Global Health Programs (GHP) account, which represents the bulk of global health assistance, totaled $9.1 billion, an increase of $279 million above the FY 2019 enacted level, $2.8 billion above the President’s FY 2020 request, and $181 million below the House FY 2020 level.

Key highlights are as follows (see table for additional detail):

  • Funding for most global health programs at State and USAID increased compared to the FY19 enacted level, with the exception of bilateral HIV funding at the State Department, which declined slightly, and neglected tropical diseases (NTDs) programs, which remained flat. In all cases, funding was above the President’s FY 2020 request, which had proposed significant cuts; funding levels varied compared to the House FY20 appropriations bill.
  • Bilateral HIV funding through the President’s Emergency Plan for AIDS Relief (PEPFAR) is $4,650 million in the Senate FY20 bill, $50 million below the FY19 enacted and FY20 House levels ($4,700 million), but $1,300 million above the FY20 Request ($3,350 million).
  • The bill includes $1,560 million as the U.S. contribution to the Global Fund to Fight AIDS, Tuberculosis and Malaria (Global Fund), an increase of $210 million above the FY19 enacted level ($1,350 million), $602 million above the FY20 Request ($958 million), and matching the FY20 House level.
    • The report accompanying the bill states that the committee “anticipates that the United States will pledge not less than [$1.56 billion] for each of the three fiscal years pertaining to the Global Fund’s Sixth Replenishment . . . [and] does not support the administration’s proposal to amend the longstanding matching rates for U.S. contributions to the Global Fund and expects the United States to continue to match other donor contributions at a rate of $1 for every $2 received from other donors.
  • Funding for tuberculosis (TB) totals $310 million, $8 million above the FY19 enacted level, $49 million above the FY20 Request ($261 million), and matching the FY20 House level.
  • Funding for malaria totals $789 million, $34 million above the FY19 enacted and FY20 House levels ($755 million), and $115 million above the FY20 Request ($674 million).
  • The bill includes $847 million for maternal and child health (MCH), an increase of $12 million above the FY19 enacted level ($835 million), $227 million above the FY20 Request ($629 million), and $3 million below the FY20 House level ($850 million). Specific areas under MCH include:
    • Gavi, the Vaccine Alliance funding totals $290 million, matching the FY19 enacted and FY20 House levels, and $40 million above the FY20 Request ($250 million).
    • Polio funding through the GHP account totals $61 million, $2 million above the FY19 enacted and FY20 House level ($59 million).[ii] The President’s FY 2020 Request did not specify funding for polio.
    • The bill includes $137.5 million for the U.S. contribution to the United Nations Children’s Fund (UNICEF) provided through the International Organizations and Programs (IO&P) account, matching the FY19 enacted level and $10 million below the House FY20 level ($147.5 million). While the FY20 Request did not specify a funding amount for UNICEF and proposed to eliminate the IO&P account, it is possible that organizations such as UNICEF could receive funding through other accounts.
  • Funding for nutrition totals $150 million, $5 million above the FY19 enacted and FY20 House level ($145 million), and $71.5 million above the FY20 Request ($78.5 million).
  • Bilateral family planning and reproductive health (FP/RH) funding totals $633 million ($582 million through the GHP account and $51 million through the ESF account), $58 million above the FY19 enacted level, and $374 million above the FY20 Request ($259 million), but $117 million below the FY20 House level ($750 million).[ii]
  • Funding for the United Nations Population Fund (UNFPA) totals $32.5 million, matching the FY19 enacted level, but $23 million below the FY20 House level ($55 million); the FY20 Request proposed eliminating funding for UNFPA.
  • Funding for the vulnerable children program totals $26 million, $2 million above the FY19 enacted and FY20 House level ($24 million); the FY20 Request proposed eliminating funding for this program.
  • Funding for neglected tropical diseases (NTDs) totals $102.5 million, matching the FY19 enacted and FY20 House level, and $27.5 million above the FY20 Request ($75 million).
  • Funding for global health security totals $100 million in the bill. While this is a decrease compared to the FY19 enacted level ($138 million), $38 million of the FY19 amount was provided through a one-time transfer of unspent emergency Ebola funding. The Senate FY20 amount is an increase compared to the FY20 Request ($90 million) and matches the FY20 House level.

Resources:

  • FY2020 State and Foreign Operations Appropriations Bill – Draft Bill
  • FY2020 State and Foreign Operations Appropriations Bill – Draft Report

The table (.xls) below compares global health funding in the FY 2020 Senate SFOPs appropriations bill to the FY 2019 enacted funding amounts as outlined in the “Consolidated Appropriations Act, 2019” (P.L. 116-6; KFF summary here), the President’s FY 2020 request (KFF summary here), and the House FY 2020 SFOPs bill (KFF summary here).

Table: KFF Analysis of FY20 Senate SFOPs Funding for Global Health
Department / Agency / AreaFY19 Enactedi(millions)FY20 Requestii(millions)FY20 Houseiii(millions)FY20 Senate(millions)Difference(millions)
FY20 Senate – FY19 EnactedFY20 Senate – FY20 RequestFY20 Senate – FY20 House
 SFOPs – Global Health
HIV/AIDS$4,700.0$3,350.0$4,700.0$4,650.0$-50(-1%)$1300(39%)$-50(-1%)
State Department$4,370.0$3,350.0$4,370.0$4,320.0$-50(-1%)$970(29%)$-50(-1%)
USAID$330.0$0.0$330.0$330.0$0(0%)$0(0%)
of which Microbicides$45.0$0.0$45.0$45.0$0(0%)$0(0%)
Global Fund$1,350.0$958.4$1,560.0$1,560.0$210(16%)$601.6(63%)$0(0%)
Tuberculosisiv$262.0 –
Global Health Programs (GHP) account$302.0$261.0$310.0$310.0$8(3%)$49(19%)$0(0%)
Economic Support Fund (ESF) accountNot specified$1.0Not specifiedNot specified
Malaria$755.0$674.0$755.0$789.0$34(5%)$115(17%)$34(5%)
Maternal & Child Health (MCH)vvi –
GHP account$835.0$619.6$850.0$847.0$12(1%)$227.4(37%)$-3(-0.4%)
of which Gavi$290.0$250.0$290.0$290.0$0(0%)$40(16%)$0(0%)
of which Polio$51.5$16.0$59.0$61.0$9.5(18%)$45(282%)$2(3%)
UNICEFvii$137.5Not specified$147.5$137.5$0(0%)$-10(-7%)
ESF accountNot specified$75.5Not specifiedNot specified
of which Polio$7.5$7.0Not specifiedNot specified
Nutritionviii$89.7 –
GHP account$145.0$78.5$145.0$150.0$5(3%)$71.5(91%)$5(3%)
ESF accountNot specified$11.2Not specifiedNot specified
Family Planning & Reproductive Health (FP/RH)ix$607.5$259.0$805.5$665.1$57.6(9%)$406.1(157%)$-140.5(-17%)
Bilateral FPRH$575.0$259.0$750.0$632.6$57.6(10%)$373.6(144%)$-117.5(-16%)
GHP account$524.0$237.0$750.0$581.5$57.6(11%)$344.5(145%)$-168.5(-22%)
ESF account$51.1$22.0Not specified$51.1$0(0%)$29.1(132%)
UNFPA$32.5$0.0$55.5$32.5$0(0%)$-23.0(-41%)
Vulnerable Children$24.0$0.0$24.0$26.0$2(8%)$2(8%)
Neglected Tropical Diseases (NTDs)$102.5$75.0$102.5$102.5$0(0%)$27.5(36.7%)$0(0%)
Global Health Security$138.0$90.0$100.0$100.0$-38(-28%)$10(11%)$0(0%)
GHP account$100.0$90.0$100.0$100.0$0(0%)$10(11%)$0(0%)
Ebola transfer$38.0$0.0$0.0$0.0$-38(-100%)
Emergency Reserve Fundx$2.0$0.0$10.0$0.0$-2(-100%)$-10(-100%)
Ebola transfer$2.0$0.0$0.0$0.0$-2(-100%)
Unallocated$52.6
Total (GHP account only)$8,837.5$6,343.5$9,296.5$9,116.0$278.5 (3%)$2772.5 (44%)$-180.5 (-2%)
Notes:
i – The FY19 Enacted includes the transfer of $40.0 million in unspent Emergency Ebola funding including: $2.0 million for the Emergency Reserve Fund and $38.0 million for “programs to accelerate the capacities of targeted countries to prevent, detect, and respond to infectious disease outbreaks.”
ii – In the FY20 Request, the administration proposed to consolidate the Development Assistance (DA), Economic Support Fund (ESF), the Assistance for Europe, Eurasia, and Central Asia (AEECA), and the Democracy Fund (DF) accounts in to one new account — the Economic Support and Development Fund (ESDF). ESF funding for the FY20 Request reflects the amounts requested by the administration for ESDF.
iii – The House FY20 SFOPs bill proposes to move the Economic Support Fund (ESF) from “Bilateral Economic Assistance” to “Security Assistance” and “redirects development, and most democracy and governance, funding that is long-term in nature to the Development Assistance or Democracy Fund accounts.” If the House FY20 bill is approved by Congress, it is possible that global health funding previously provided under the ESF account may be provided under the Development Assistance (DA) account.
iv – Some tuberculosis funding is provided under the ESF account, which is not earmarked by Congress in the annual appropriations bills and determined at the agency level (e.g. in FY17, TB funding under the ESF account totaled $2.64 million).
v – Some MCH funding is provided under the ESF account, which is not earmarked by Congress in the annual appropriations bills and determined at the agency level (e.g. in FY17, MCH funding under the ESF account totaled $56.54 million).
vi – It is not possible to calculate total MCH funding in the FY20 request because UNICEF, which has historically received funding through the International Organizations and Programs (IO&P) account, was not specified in the FY20 request.
vii – UNICEF funding in the FY19 Enacted and FY20 Senate totaled $137.5 million, of which $5 million is earmarked for programs addressing female genital mutilation.
viii – Some nutrition funding is provided under the ESF account, which is not earmarked by Congress in the annual appropriations bills and determined at the agency level. (e.g. in FY17, nutrition funding under the ESF account totaled $21 million).
ix – In prior fiscal years, bilateral FP/RH funding has been provided through both the GHP and ESF accounts. The report accompanying the House FY20 SFOPs bill states that “The Committee recommendation includes $750,000,000 for reproductive health and voluntary family planning in this Act.” All of this funding is included under the GHP account. The bill summary released by the House Committee on Appropriations states that the $750 million for FP/RH is an increase of $175 million above total funding provided in FY19 (GHP and ESF accounts).
x – The draft House FY20 appropriations bill states that “up to $10,000,000 of the funds made available under the header ‘Global Health Programs’ may be made available for the Emergency Reserve Fund.” Based on the language in the bill and the GHP totals presented in the report, this is not a specified funding line but is an authority given to the administration to transfer funds specified for other purposes under the GHP account to the Emergency Reserve Fund.
Updated: September 27, 2019

[i] Total funding for global health is not currently available as some funding provided through USAID and DoD is not yet available.

[ii] The House FY20 SFOPs bill proposes to move the Economic Support Fund (ESF) from “Bilateral Economic Assistance” to “Security Assistance” and “redirects development, and most democracy and governance, funding that is long-term in nature to the Development Assistance or Democracy Fund accounts.” If the House FY20 bill is approved by Congress, it is possible that global health funding previously provided under the ESF account may be provided under the Development Assistance (DA) account.