News Release

Temporary Enhanced Federal Medicaid Funding Can Soften the Economic Blow of the COVID-19 Pandemic on States, but is Unlikely to Fully Offset State Revenue Declines or Forestall Budget Shortfalls

Published: Jul 22, 2020

The temporary boost in federal Medicaid funding enacted as part of the Families First Coronavirus Response Act (FFCRA) will soften the economic blow of COVID-19 on states, but is unlikely to fully offset state revenue declines or forestall budget shortfalls stemming from the pandemic, finds a new KFF analysis.

The 6.2 percentage point increase in the Medicaid FMAP — designed to provide states with broad fiscal relief, not just help with Medicaid costs — is effective from January 1 through the duration of the public health emergency period. The current emergency period is set to expire on July 24 (with the enhanced Medicaid funding ending Sept. 30), but is likely to be extended since the pandemic continues.

To be eligible for the enhanced funds, states cannot tighten Medicaid eligibility standards beyond policies in place as of January 1, must at least maintain current enrollment through the emergency period and cannot impose cost sharing for COVID-19 related testing and treatment services. The enhanced funding does not apply to the Medicaid expansion group under the Affordable Care Act.

The enhanced Medicaid funding would provide states with a total fiscal relief of $64 billion if the temporary FMAP boost were in place through September 2021, the end of the federal fiscal year, without factoring in additional changes in enrollment. (The amount would be just $26.4 billion if the emergency declaration were not renewed this month.)

An increase in the FMAP could offset or reduce state spending but is unlikely to fully offset state revenue declines and address budget shortfalls.  Even if the fiscal relief is in place for all of state fiscal year 2021, early reports show that some states are projecting revenue decline of up to 20 percent for SFY.  Pre-pandemic state estimates of state revenue were $944 billion for SFY2021, so federal fiscal relief available through the FFCRA accounts for roughly 4 percent of state revenues for SFY2021. This means many states still will likely need to make large cuts in many areas of their budget, including Medicaid, to meet balanced budget requirements.

For the full analysis, as well as more data and analysis about Medicaid and the pandemic, visit kff.org.


How Much Fiscal Relief Can States Expect From the Temporary Increase in the Medicaid FMAP?

Authors: Robin Rudowitz, Bradley Corallo, and Rachel Garfield
Published: Jul 22, 2020

Issue Brief

The economic consequences of the coronavirus pandemic have led to historic levels of job loss in the United States and severe declines in state revenues. Medicaid is a countercyclical program, so during economic downturns more people lose income and will qualify for Medicaid at a time when it is difficult for states to support increased program spending. The Families First Coronavirus Response Act (FFCRA) provided a 6.2 percentage point increase in the federal share of Medicaid spending with requirements to maintain eligibility and provide continuous coverage for Medicaid enrollees. The FMAP increase included in the FFCRA was designed to provide broad fiscal relief to all states; however, the current level of aid may be small relative to state revenue losses and projected shortfalls, and the duration of the aid is not certain. It is likely that without an increase in federal support, states will need to make large budget cuts in many areas of the budget, including Medicaid, to meet balanced budget requirements. Without an extension in declaration of the public health emergency (PHE) set to expire at the end of July, the FMAP increase could end on September 30, 2020 (the end of federal fiscal year 2020 but partway through most state fiscal years), further deteriorating state finances.

This brief examines how much fiscal relief states can expect from the increase in the FMAP under FFCRA under different assumptions about the duration of the relief, how the FMAP increase provides broad fiscal relief to states and the factors that affect how much relief is available across states.

How much fiscal relief can states expect from the FMAP increase in FFCRA?

The Families First Coronavirus Response Act (FFCRA) included a temporary increase in the Medicaid FMAP from January 1, 2020 through duration of the emergency period. Federal fiscal relief provided through increases in the Medicaid FMAP—or the share of Medicaid costs paid by the federal government— during significant economic downturns has been successful in helping to support Medicaid and provide efficient and effective fiscal relief to states in the past. FFCRA uses this model as well. The 6.2 percentage point increase does not apply to the expansion group under the Affordable Care Act (ACA), for which the federal government already pays 90% of costs. To be eligible for the funds, states cannot implement more restrictive eligibility standards or higher premiums than those in place as of January 1, 2020, must provide continuous eligibility for enrollees through the end of the month of the emergency period, and cannot impose cost sharing for COVID-19 related testing and treatment services including vaccines, specialized equipment, or therapies. To access the enhanced funds, states submit claims for federal reimbursement for Medicaid expenditures. The purpose of the additional federal aid is not only to provide support to cover anticipated increases in enrollment, but also to provide broader fiscal relief for states.

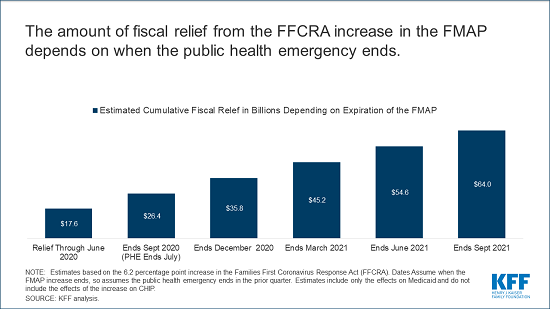
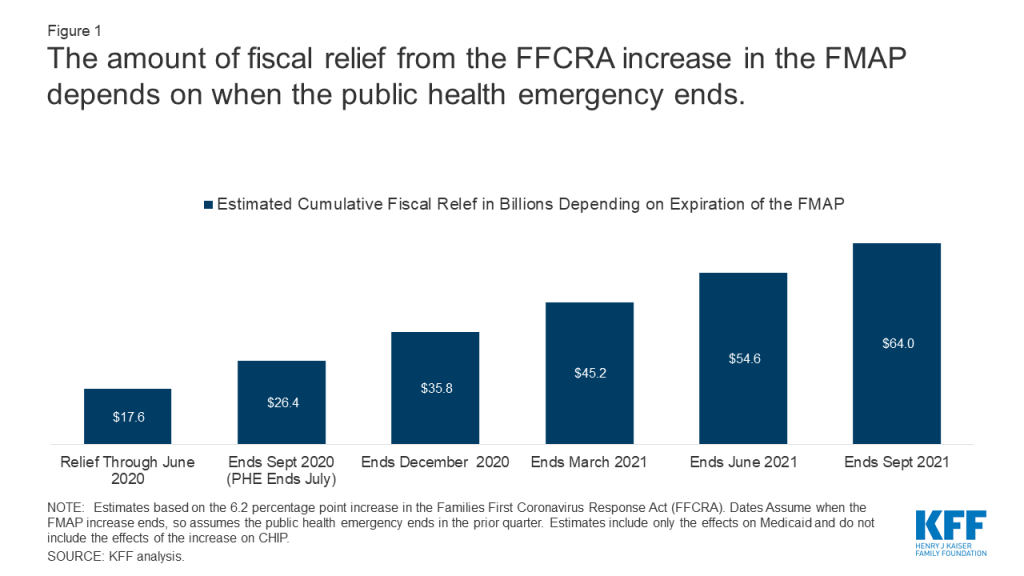
The amount of federal relief to states is uncertain at this time because the duration of the FMAP increase is tied to the public health emergency (PHE). The current 6.2 percentage point increase in the match rate will expire at the end of the quarter in which the PHE ends. The current PHE is issued by the Secretary of HHS for 90 day periods. The PHE was first issued on January 31 and then renewed on April 26; it is set to expire on July 24. While it is expected that the PHE will be renewed again, if it were to expire in July, the increase in the match rate would expire on September 30, 2020. Under this scenario, states would receive an estimated $26.4 billion in relief (including an estimated $17.6 billion that may have gone out to states through June 2020, corresponding with the end of the 2020 fiscal year in most states). The amount of fiscal relief to states would grow if the increase in the match rate under FFCRA were in place longer. States could receive a total of $54.6 if the relief is in place through June 2021 (the end of state fiscal year 2021 for most states) and $64 billion if in place through September (the end of the federal fiscal year 2021) (Figure 1, Appendix Table 1).

Figure 1: The amount of fiscal relief from the FFCRA increase in the FMAP depends on when the public health emergency ends

An increase in the FMAP could offset or reduce state spending but is unlikely to fully offset state revenue declines and address budget shortfalls. An increase in the federal match rate would allow states to reduce state spending for Medicaid at the same amount as the increase in federal spending. Such a reduction in state Medicaid spending would relieve other budget pressures stemming from reduced revenues and other state spending increases. However, federal fiscal relief through Medicaid will not fully address state budget shortfalls.  Early estimates indicate that states are facing large shortfalls, with some estimates showing state budget shortfalls of $110 billion for SFY 2020 and $290 billion for SFY 2021. These shortfalls compare to an estimated $17.6B in federal fiscal relief in SFY2020 and $37.0B in SFY2021 (Exhibit 1) assuming the relief is in place through June 2021 and the increase in the FMAP at the current rate assuming the relief is in place through June 2021 (which is not certain). Other early reports from states similarly show state revenue declines of up to 15% in SFY 2020 and up to 20% for SFY 2021; compared to pre-pandemic state estimates of state revenue totaling $913B for SFY2020 and $944B in SFY2021, federal fiscal relief available through the FFCRA accounts for roughly 2% of state revenue in SFY2020 and 4% in SFY2021. Uncertainty about federal fiscal relief makes it difficult for states to budget and plan to meet balanced budget requirements. It is likely that the economic consequences of the pandemic will persist even beyond the public health crisis.

Table 1: The Amount of Federal Fiscal Relief Funds to States under FFCRA FMAP Depends on When the PHE Ends
PHE EndsFMAP Increase EndsFunds Received inSFY 2020(ended June 2020)Funds Received in SFY2021(ends June 2021)Funds Received in SFY2022(ends June 2022)Total
July 2020September 2020$17.6B$8.8B$26.4B
September 2020December 2020$17.6B$18.2B$35.8B
December 2020March 2021$17.6B$27.6B$45.2B
March 2021June 2021$17.6B$37.0B$54.6B
June 2021September 2021$17.6B$37.0B$9.4B$64.0B

How does an FMAP increase provide state fiscal relief?

The FMAP increase included in the FFCRA was designed to provide broad fiscal relief to all states. Medicaid is a countercyclical program, so during economic downturns more people lose income and will qualify for Medicaid at a time when it is difficult for states to support increased program spending. Federal matching payments automatically increase as Medicaid spending grows, but state costs increase as well. The increase in federal support through a higher FMAP can help states maintain Medicaid coverage at a time when many people need it and can also help pay for costs for expected increases in enrollment. Because states make claims on federal Medicaid dollars throughout the year, and because Medicaid responds to economic conditions, increasing the FMAP provides relief funds to states using an existing mechanism and does not require development of new formulas to distribute grant funds, so funds can be distributed quickly. This can provide broad fiscal relief by freeing up funds for other purposes or filling gaps in overall state budget shortfalls.

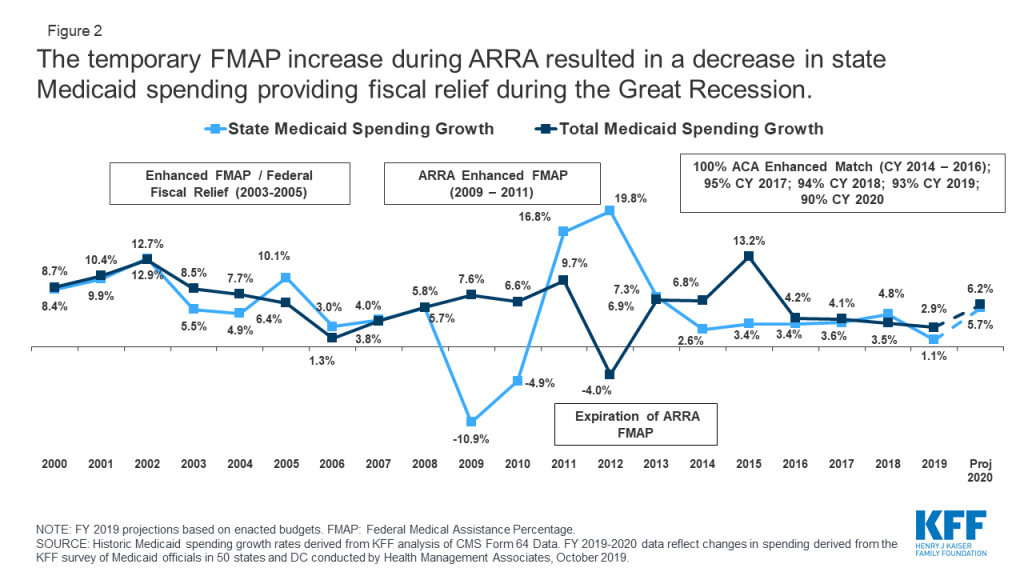
Temporary FMAP increases to provide fiscal relief to states during economic downturns prior to the COVID-19 crisis allowed states to maintain Medicaid and address budget shortfalls. The enhanced match rate included in the American Recovery and Reinvestment Act (ARRA) provided states over $100 billion in additional federal funds during the Great Recession when the unemployment rate peaked at 10 percent in October 2009. As a result of this federal support, state spending for Medicaid declined by more than 10 percent in state fiscal year 2009, even with eligibility protections and increased enrollment (Figure 2). States reported that the relief was used to close Medicaid or other general fund budget shortfalls, support enrollment growth, and to mitigate or avoid provider and benefit restrictions.

Figure 2: The temporary FMAP increase during ARRA resulted in a decrease in state Medicaid spending providing fiscal relief during the Great Recession

What are other factors that affect the amount of fiscal relief available to states?

Expected increases in enrollment could offset a large share of the fiscal relief. States anticipate increased Medicaid enrollment due to the economic downturn, though it is unclear when enrollment will occur and what share of people will take up coverage. A survey of states found that nearly all states that had developed projections anticipate higher enrollment growth into FY 2021 as a result of the pandemic, and review of Medicaid managed care enrollment has shown early enrollment increases in many states, though enrollment is likely to grow over time. An earlier KFF analysis estimated potential loss of employer-based insurance (ESI) due to job losses from March 1 through May 2 and eligibility for ACA coverage among people losing ESI. It estimated by January 2021, when unemployment insurance (UI) benefits cease for most people, nearly 17 million people would be eligible for Medicaid, assuming those who are recently unemployed have not found work. The estimates do not account for participation rates among those newly eligible, those who may have lost jobs after May, individuals who do not lose job based coverage (i.e. those who may have had marketplace coverage) but experience income loss and become eligible for Medicaid, or the effect of the maintenance of eligibility (MOE) provisions that are in effect as a condition for states to receive the enhanced FMAP. The federal share for those newly eligible in the expansion group would be 90% (same as current law) while those newly eligible and enrolled in other categories would receive the regular lower match rate plus 6.2 percentage points, assuming the FMAP increase is still in place.

States have limited choices to cut Medicaid. As noted, to receive the increase in the FMAP under FFCRA, states cannot restrict eligibility and must provide continuous coverage for current enrollees. In prior economic downturns, states have turned to reductions in provider rates as well as cuts in some optional benefits. Often, these rates and benefits may be restored when economic conditions improve. States also frequently turn to greater reliance on provider taxes to help raise the state share of Medicaid during economic downturns. However, given that many providers, particularly those serving Medicaid enrollees, may be under fiscal strain from the pandemic, provider rate cuts may be harder to implement.

To save state dollars, states need to make larger program cuts to Medicaid. Because Medicaid is funded from a combination of federal and state funds, states need to make substantial cuts to Medicaid to generate state savings. For example, for a state with a 50 percent match rate, a $100 cut to Medicaid will reduce state spending by $50 and federal spending by $50. However, for the ACA expansion population, a $100 reduction will yield only $10 in state savings and reduce federal spending by $90 (as the federal match rate is set at 90 percent for newly eligible expansion adults).

The needs may vary across states. The pandemic may have different effects on economies and Medicaid enrollment across states. The current structure of the relief is broad and uniform across states and not tied to changes in unemployment or other economic conditions.

Looking Ahead

Without any additional changes in federal law, the amount of the fiscal relief from the FMAP increase without regard to enrollment changes will depend on the duration of the public health emergency. If the public health emergency is not renewed beyond the end of July, the FMAP increase will expire at the end of September, or the end of FY 2020. A July 10 letter from state groups again urged Congress to consider extending and increasing the FMAP increase (to 12 percentage points through September 2021) given overall state budget issues and increased demands for Medicaid. The House passed Health and Economic Recovery Omnibus Emergency Solutions Act (HEROES) included an additional increase in the FMAP of 14 percentage points from July 1, 2020 through June 30, 2021, but that proposal has not yet been considered in the Senate. Congress may consider a further increase in the FMAP during debate on additional legislation to address the pandemic, as well as options to target the fiscal relief to states experiencing the greatest need in terms of enrollment increases or increases in the unemployment rate.

Methods

We estimated baseline spending for FFY 2020 and 2021 using Medicaid enrollment and spending data from the 2014 Medicaid Statistical Information System (MSIS), the 2018 Medicaid Budget Expenditure System (MBES), the Congressional Budget Office (CBO), and the CMS Office of the Actuary (OACT).

FY 2020 and FY 2021 Baseline Spending: We used 2018 MBES enrollment for total enrollment and enrollment in the expansion group; we then distributed non-expansion enrollment groups (children, disabled, aged, and non-expansion adults) based on the proportion of enrollees in each group using 2014 MSIS. We inflated enrollment to FFY 2020 and FFY 2021 using annual enrollment growth by eligibility group from the 2018 Actuarial Report on the Financial Outlook for Medicaid by OACT. We did not use CBO growth rates for enrollment as their projects are rounded to millions and do not provide precise growth rates. For spending, we used total spending and spending for the expansion population based on 2018 MBES data and distributed spending for non-expansion edibility groups based on the distribution of spending by eligibility group in the 2014 MSIS. Then, we calculated spending per enrollee by dividing the total spending for each enrollment group by the total number of enrollees in each group. We inflated the spending per enrollee to FFY 2020 and 2021 using an average of the projected annual growth rates for each eligibility group as reported in the 2018 Actuarial Report by OACT and the March 2020 baseline estimates from the CBO. We averaged spending per enrollee growth from the CBO and OACT because the two estimates had substantial differences in annual growth rates for some enrollment groups, especially for 2018-2019 and 2019-2020. Finally, we multiplied enrollment and per enrollee spending estimates for each enrollment group to calculate a total spending baseline in FFY 2020 and 2021.

Special Adjustments: Special adjustments using state data were made for states that expanded after the FFY 2018 period including Idaho, Maine, Utah, and Virginia. Due to anomalies in New York’s 2017 and 2018 MBES data, we used total spending for New York from the CMS Form-64 for FY 2018 and estimated expansion spending based on estimates included in the National Association of State Budget Officers’ 2019 State Expenditure Report.   We distributed other spending using the same methodology used for other states noted above.

FMAP Change: We assumed total spending remained constant and that increases in the FMAP from FFCRA increased federal spending and reduced state spending by the same amount. This resulted in different percentage changes in federal and state spending from the baseline.

Appendix

Appendix Table 1: Estimated Cumulative Fiscal Relief from a 6.2 Percentage Point Increase in FMAP,Depending on Expiration of FMAP Increase (In Millions)
StateRelief Through June 2020EndsSept. 2020EndsDec. 2020EndsMarch 2021EndsJune 2021EndsSept. 2021
United States17,61726,42635,81145,19754,58263,967
Alabama193290393497600703
Alaska5887117148179210
Arizona3084616257899531,117
Arkansas158236320404488572
California2,4773,7155,0346,3547,6738,992
Colorado263394534673813953
Connecticut226339459580700821
Delaware6090123155187219
District of Columbia81121164207250293
Florida8071,2111,6412,0722,5022,932
Georgia3715567549521,1501,347
Hawaii5684114144174204
Idaho68103139176212249
Illinois5828741,1841,4941,8052,115
Indiana3214816528229931,164
Iowa136205277350422495
Kansas120180244308372436
Kentucky245368499630760891
Louisiana274411557703849995
Maine96143194245296347
Maryland3054576197819441,106
Massachusetts5287921,0741,3551,6361,917
Michigan4326498791,1091,3391,569
Minnesota3825737769801,1831,386
Mississippi183274372469567664
Missouri3605407329241,1161,307
Montana406081102123145
Nebraska73109148187226265
Nevada93140190239289339
New Hampshire5989121152184216
New Jersey4136198391,0581,2781,498
New Mexico127191259327395462
New York2,0703,1064,2095,3136,4177,520
North Carolina4556839251,1681,4101,653
North Dakota33506886103121
Ohio6249361,2681,6001,9332,265
Oklahoma168252342432522611
Oregon228342463585706828
Pennsylvania8571,2861,7422,1982,6553,111
Rhode Island74111151191230270
South Carolina216324439554668783
South Dakota3146637996112
Tennessee3415126948761,0581,239
Texas1,3251,9882,6943,4014,1074,814
Utah86129174220266311
Vermont487197122148173
Virginia3214816528229931,164
Washington3114666327989631,129
West Virginia96144196247298349
Wisconsin4166248451,0671,2881,510
Wyoming213142536576
NOTES: State estimates may not sum to national total due to rounding. Estimates based on the 6.2 percentage point increase in the Families First Coronavirus Response Act. Dates assume when the FMAP increase ends, so assumes the public emergency ends in the prior quarter. Estimates include only the effects on Medicaid and do not include the effect of the increase on CHIP.SOURCE: KFF Analysis.

Rising Cases in Long-term Care Facilities Are Cause for Concern

Published: Jul 21, 2020

Data Note

Over the last month, many states have seen a surge of coronavirus cases, particularly in states that have loosened social distancing requirements. Data shows that younger people make up a growing percentage of new coronavirus cases in cities and states, and much recent media coverage has focused on the resurgence of the pandemic being driven by cases among younger adults. Less attention has been paid to recent trends in cases among residents and staff in long-term care facilities and how these relate to surges in “hotspot” states.

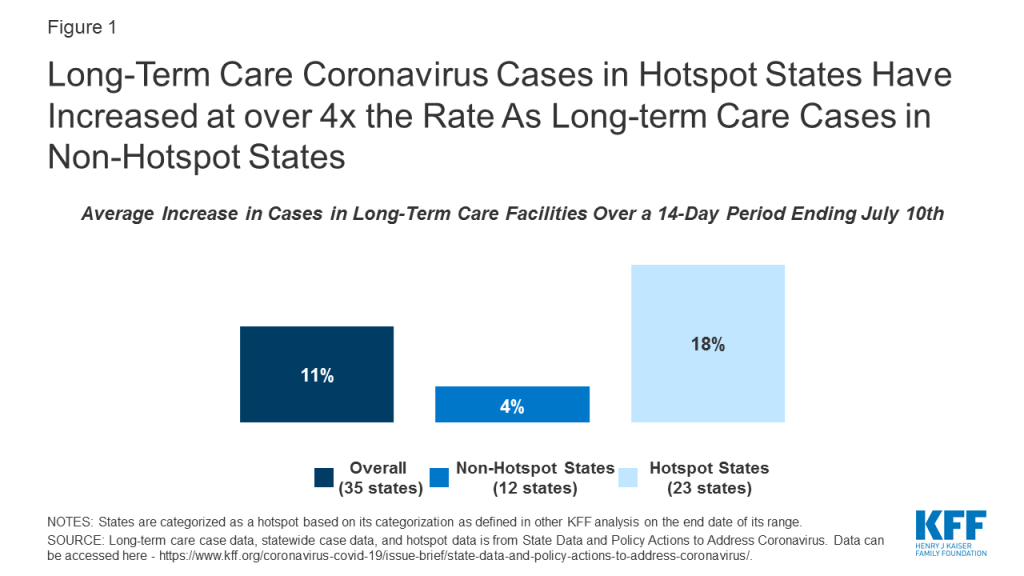
Coronavirus cases in long-term care facilities continue to rise. Over a 14-day period that ended on July 10th, cases increased by 11% in long-term care facilities across the 35 states for which we were able to trend this data over this period (Table 1 and Figure 1). Long-term care facilities have implemented the strictest protocols in the country not only to prevent the virus from entering facilities, but also to prevent the spread of the virus once it is in the facility. Some of these policies include universal testing for residents and staff in long-term care facilities, strict visitor restrictions, and isolating positive-testing residents. Regardless of these measures, facilities continue to see a rise in cases. A rise in cases in long-term care facilities is particularly concerning, given that those who live in long-term care facilities are more vulnerable to severe illness and death from the virus than the general population.

Figure 1: Long-Term Care Coronavirus Cases in Hotspot States Have Increased at over 4x the Rate As Long-term Care Cases in Non-Hotspot States

Long-term care cases in “hotspot states” with wider community transmission have risen at four times the rate as long-term care cases in non-hotspot states. Long-term care facility cases in 23 hotspot states where data are available rose by 18% over a 14 day period (from 123,000 cases to 144,800 cases), while long-term care cases in 12 non-hotspot states rose by 4% over a similar 14-day period (from 125,500 cases to 130,300 cases). (Figure 1). These patterns indicate likely connection between widespread community transmission and long-term care cases, despite precautions in place in most long-term care facilities.

The two states with the highest overall increase in cases statewide, Texas and Florida, also report the highest increase in cases in long-term care facilities, with both states reporting an increase of approximately 50% in long-term care cases between June 24th and July 9th and nearly a doubling of cases during this time period (Table 1). These states, in particular, have garnered media attention, given the record-breaking numbers of new cases every day in these states. Experts have attributed these spikes to their quick pace of reopening, lack of social distancing measures such as face mask requirements, and increased population movement due to warmer weather. Increased cases in long-term care facilities may be attributed in part to increased testing of long-term care residents, but it likely represents a real increase in infections connected to the near doubling of all cases across the state in this 14-day period. The share of tests coming back positive in Texas and Florida are well over 10%, suggesting that community transmission is widespread and increasing.

Another factor that may contribute to continued long-term care case increases is resource shortages, with nearly 1 of 3 nursing homes reporting a staffing shortage, PPE shortage, or both. As of June 28th, nearly 3,000 nursing homes across the country indicated a shortage of nursing staff, clinical staff, aides, or other staff. Nearly 2,700 nursing homes indicated a shortage of PPE supplies, which includes N95 masks, surgical masks, eye protection, gowns, gloves, and hand sanitizer. About 4,800 nursing homes (nearly 1 in 3 nursing homes) reported either a staffing shortage or a PPE shortage, indicating relatively widespread resource shortages. These shortages look similar between hotspot and non-hotspot states, with about 30% of nursing homes in each group of states reporting any shortages of staff or PPE (2,800 of 9,400 nursing homes in hotspot states and 1,000 of 3,300 nursing homes in non-hotspot states).1 

Methods

This analysis includes data from 35 states that reported the number of COVID-19 cases in long-term care facilities over a recent two-week period. The definition of “long-term care facility” differs by state, but data reflect a combination of nursing facilities, assisted living facilities, adult care centers, intermediate care facilities, and/or other long-term care facilities. Data primarily reflects cumulative cases for residents and staff, where available. States update their data on different schedules, many weekly, so we chose the most recent two-week period for each state. The starting date of the time period analyzed ranges from 6/17-6/25, and the ending date ranges from 7/2-7/10. Long-term care data availability is limited by state’s reporting. Thus, the “2-week period” or “14-day time period” for which we calculate the case increase rate ranges between 13 and 17 days, depending on how often a state updates its data. Some states that report long-term care case data were excluded from this analysis because of inconsistent reporting (e.g. data comes from inconsistently available media reports), changes in reporting over the two-week period (e.g. the addition of staff cases), or the inability to identify new cases over the course of the two-week period. States are categorized as a hotspot based on its categorization as defined in other KFF analysis on the end date of its range. Detailed state-level data is available in Table 1.

Table

Table 1: Increase in Coronavirus Cases in Long-term Care Facilities and Statewide Over 14-Day Time Period
Time Period Beginning DateTime Period Ending DateIncrease in Long-term Care CasesIncrease in State CasesCategorized asa Hotspot asof Time PeriodEnding Date?
TOTAL (35 states)11%42%Yes (23 states),No (12 states)
Alabama6/24/20207/9/202021%53%Yes
Arkansas6/24/20207/8/202037%47%Yes
California6/24/20207/8/202023%47%Yes
Colorado6/24/20207/8/20203%12%Yes
Connecticut6/17/20207/2/20203%3%No
Delaware6/19/20207/3/20203%14%Yes
District of Columbia6/23/20207/9/20202%6%No
Florida6/24/20207/7/202051%96%Yes
Georgia6/24/20207/8/202015%50%Yes
Idaho6/19/20207/2/202035%70%Yes
Illinois6/19/20207/3/20207%7%No
Indiana6/23/20207/8/20208%14%Yes
Kansas6/24/20207/8/202012%34%Yes
Kentucky6/24/20207/9/202024%27%Yes
Louisiana6/22/20207/6/202025%32%Yes
Maryland6/24/20207/8/20204%8%No
Massachusetts6/24/20207/9/20201%3%No
Michigan6/23/20207/8/20203%9%No
Minnesota6/24/20207/9/20204%19%Yes
Mississippi6/22/20207/8/202023%47%Yes
Nevada6/24/20207/9/20208%84%Yes
New Jersey6/24/20207/8/20202%2%No
North Carolina6/21/20207/7/202014%48%No
Ohio6/24/20207/8/202013%29%Yes
Oklahoma6/24/20207/9/202010%61%No
Oregon6/24/20207/8/202024%45%Yes
Pennsylvania6/23/20207/10/20205%13%Yes
Rhode Island6/19/20207/3/20203%4%No
South Carolina6/23/20207/7/202023%78%Yes
Tennessee6/24/20207/10/20203%60%Yes
Texas6/24/20207/9/202047%89%Yes
Utah6/24/20207/9/202034%62%No
Vermont6/24/20207/8/20204%6%No
Virginia6/25/20207/10/20207%15%Yes
Wisconsin6/24/20207/9/20205%32%Yes
NOTES: Some states that report long-term care case data were excluded from this analysis because of inconsistent reporting (e.g. data comes from inconsistently available media reports), changes in reporting (e.g. the addition of staff cases), or the inability to identify new cases over the course of 2 weeks. States were categorized as a hotspot based on its categorization on the end date of its range. Long-term care case data, statewide case data, and hotspot data is from State Data and Policy Actions to Address Coronavirus. Data can be accessed here – https://www.kff.org/coronavirus-covid-19/issue-brief/state-data-and-policy-actions-to-address-coronavirus/.

Endnotes

  1. KFF analysis of CMS COVID-19 Nursing Home Data from June 28th. Data can accessed here: (https://data.cms.gov/stories/s/COVID-19-Nursing-Home-Data/bkwz-xpvg/). ↩︎

This Week in Coronavirus: July 10 to July 16

Published: Jul 17, 2020

Every Friday we recap the past week in the coronavirus pandemic from our tracking, policy analysis, polling, and journalism.

The United States continues to see a spike in COVID-19 cases this week, and yesterday crossed another disturbing threshold: over 77,000 new cases were confirmed on Thursday. With many schools scheduled to begin the new academic year next month, parents, school staff and government officials have been heavily engaged this week in the debate around the safety and feasibility of in-person teaching.

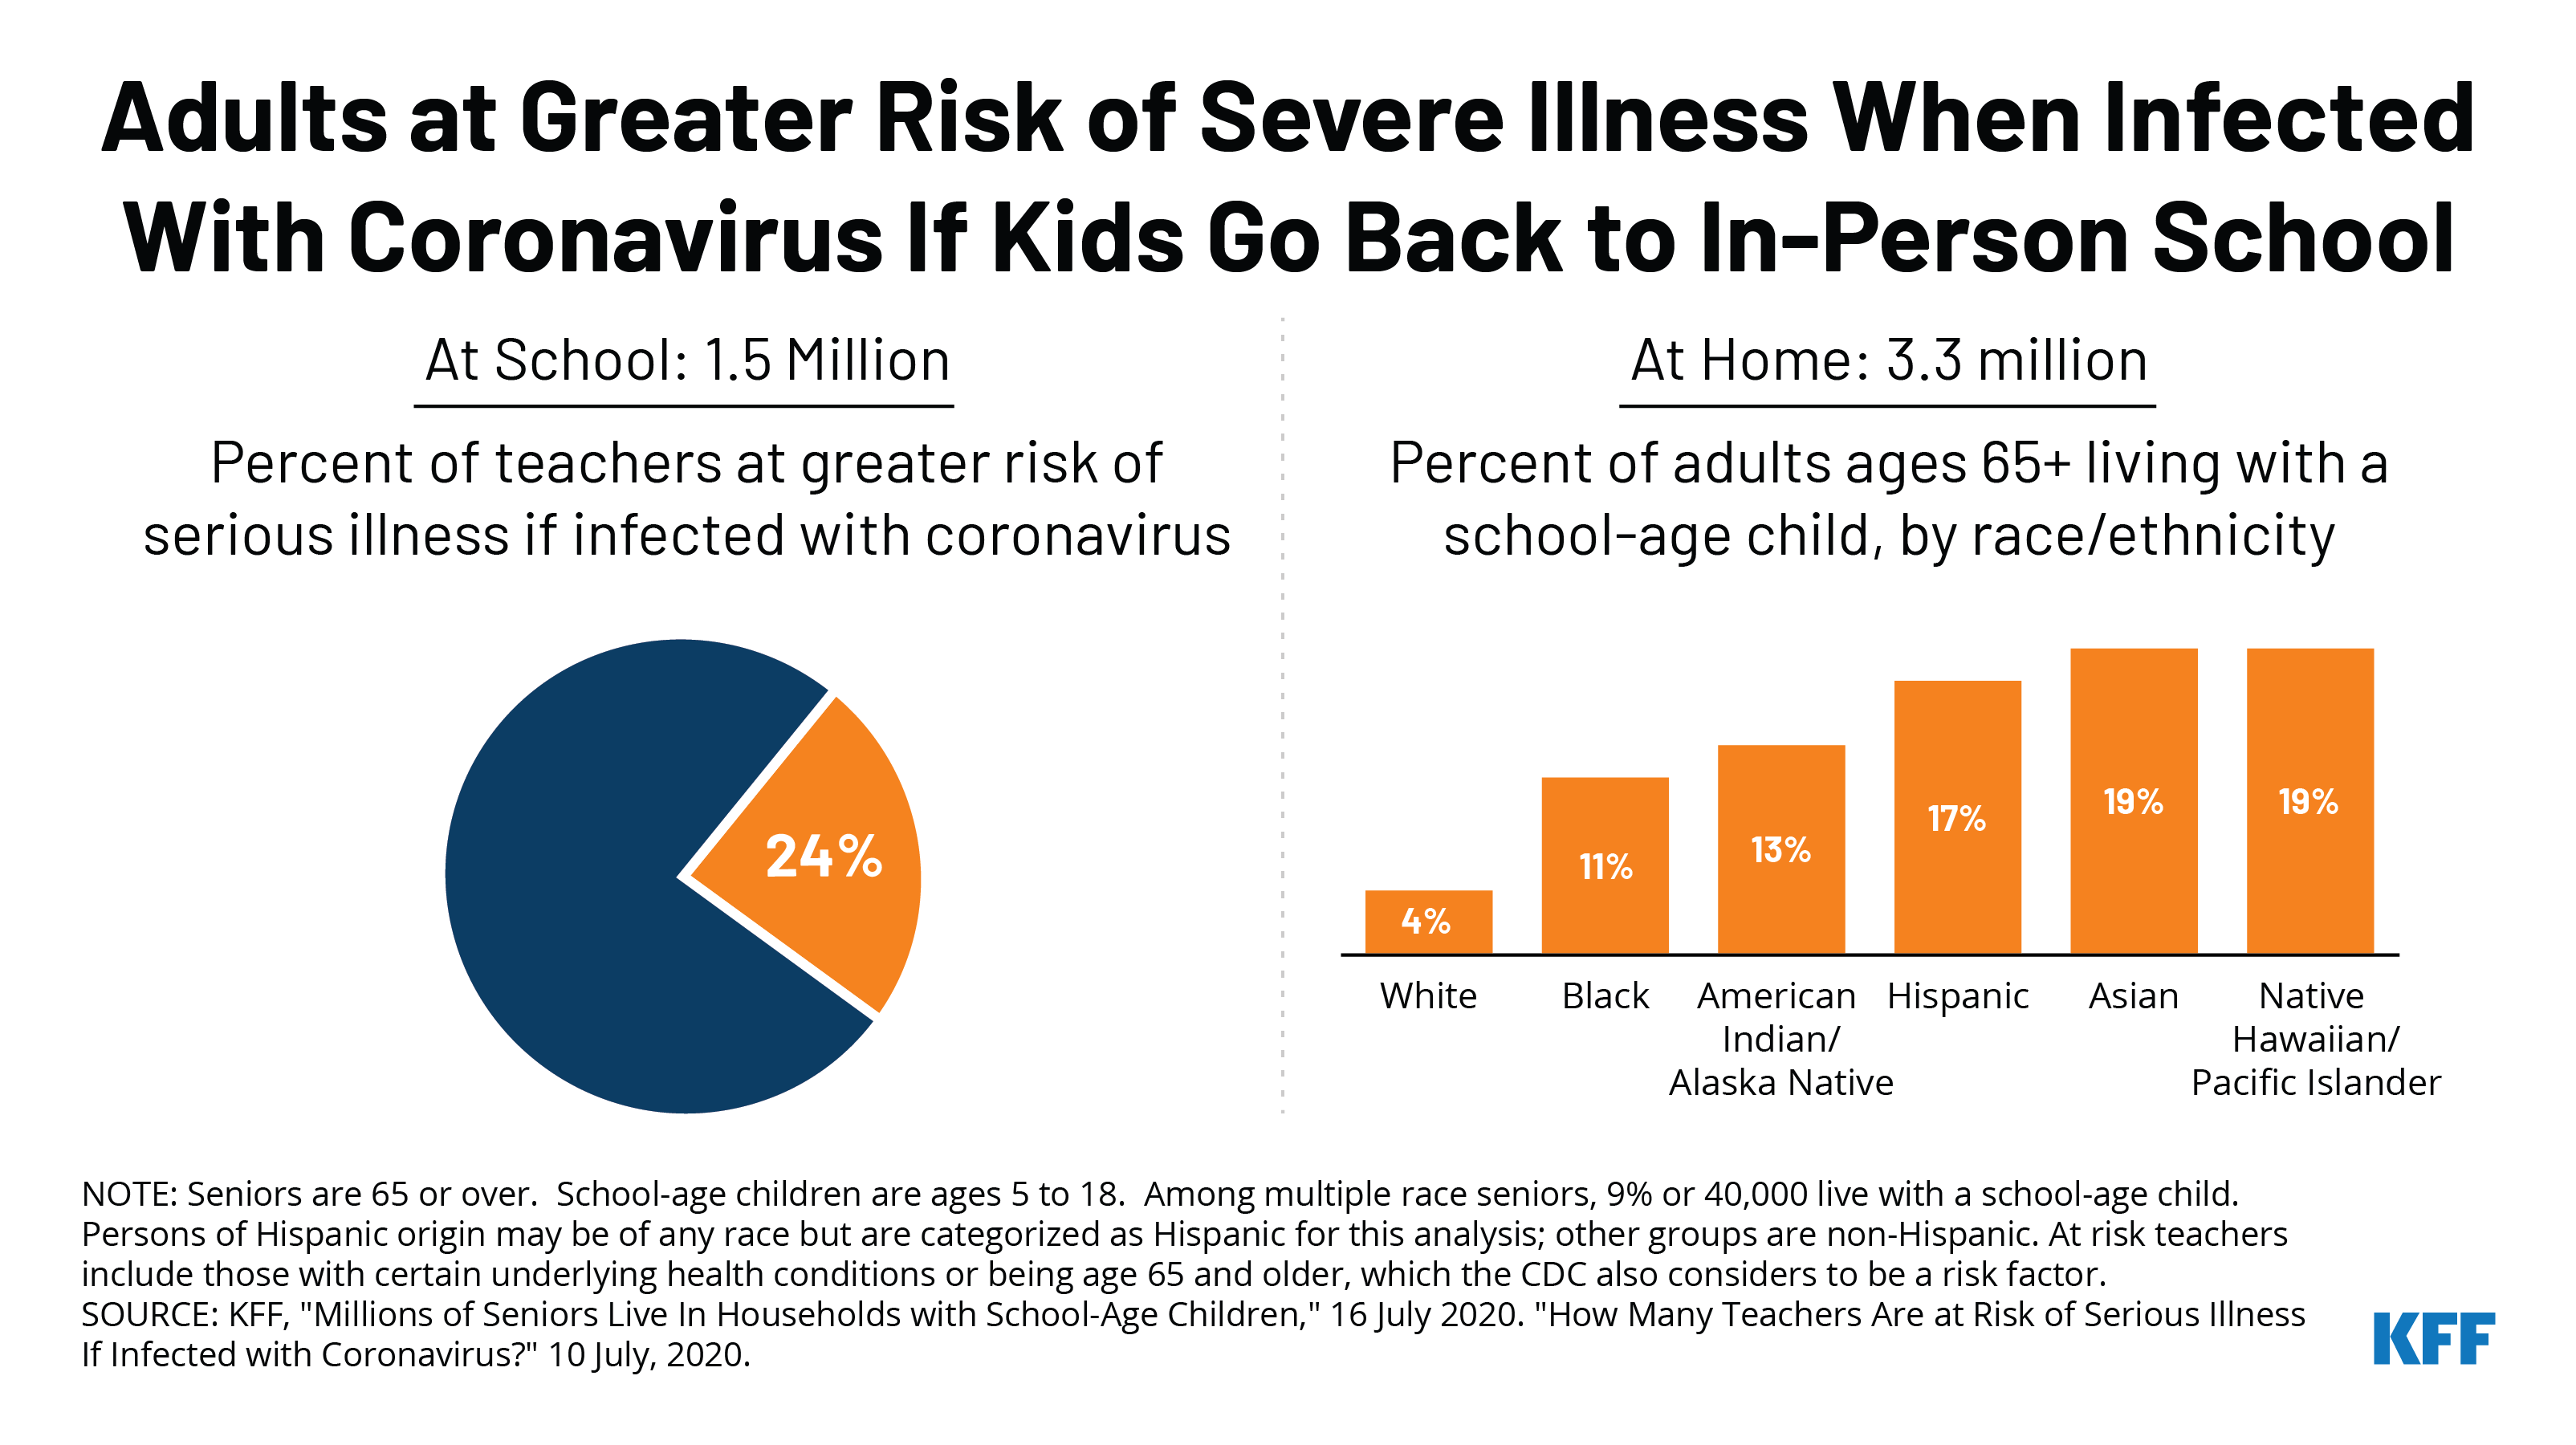
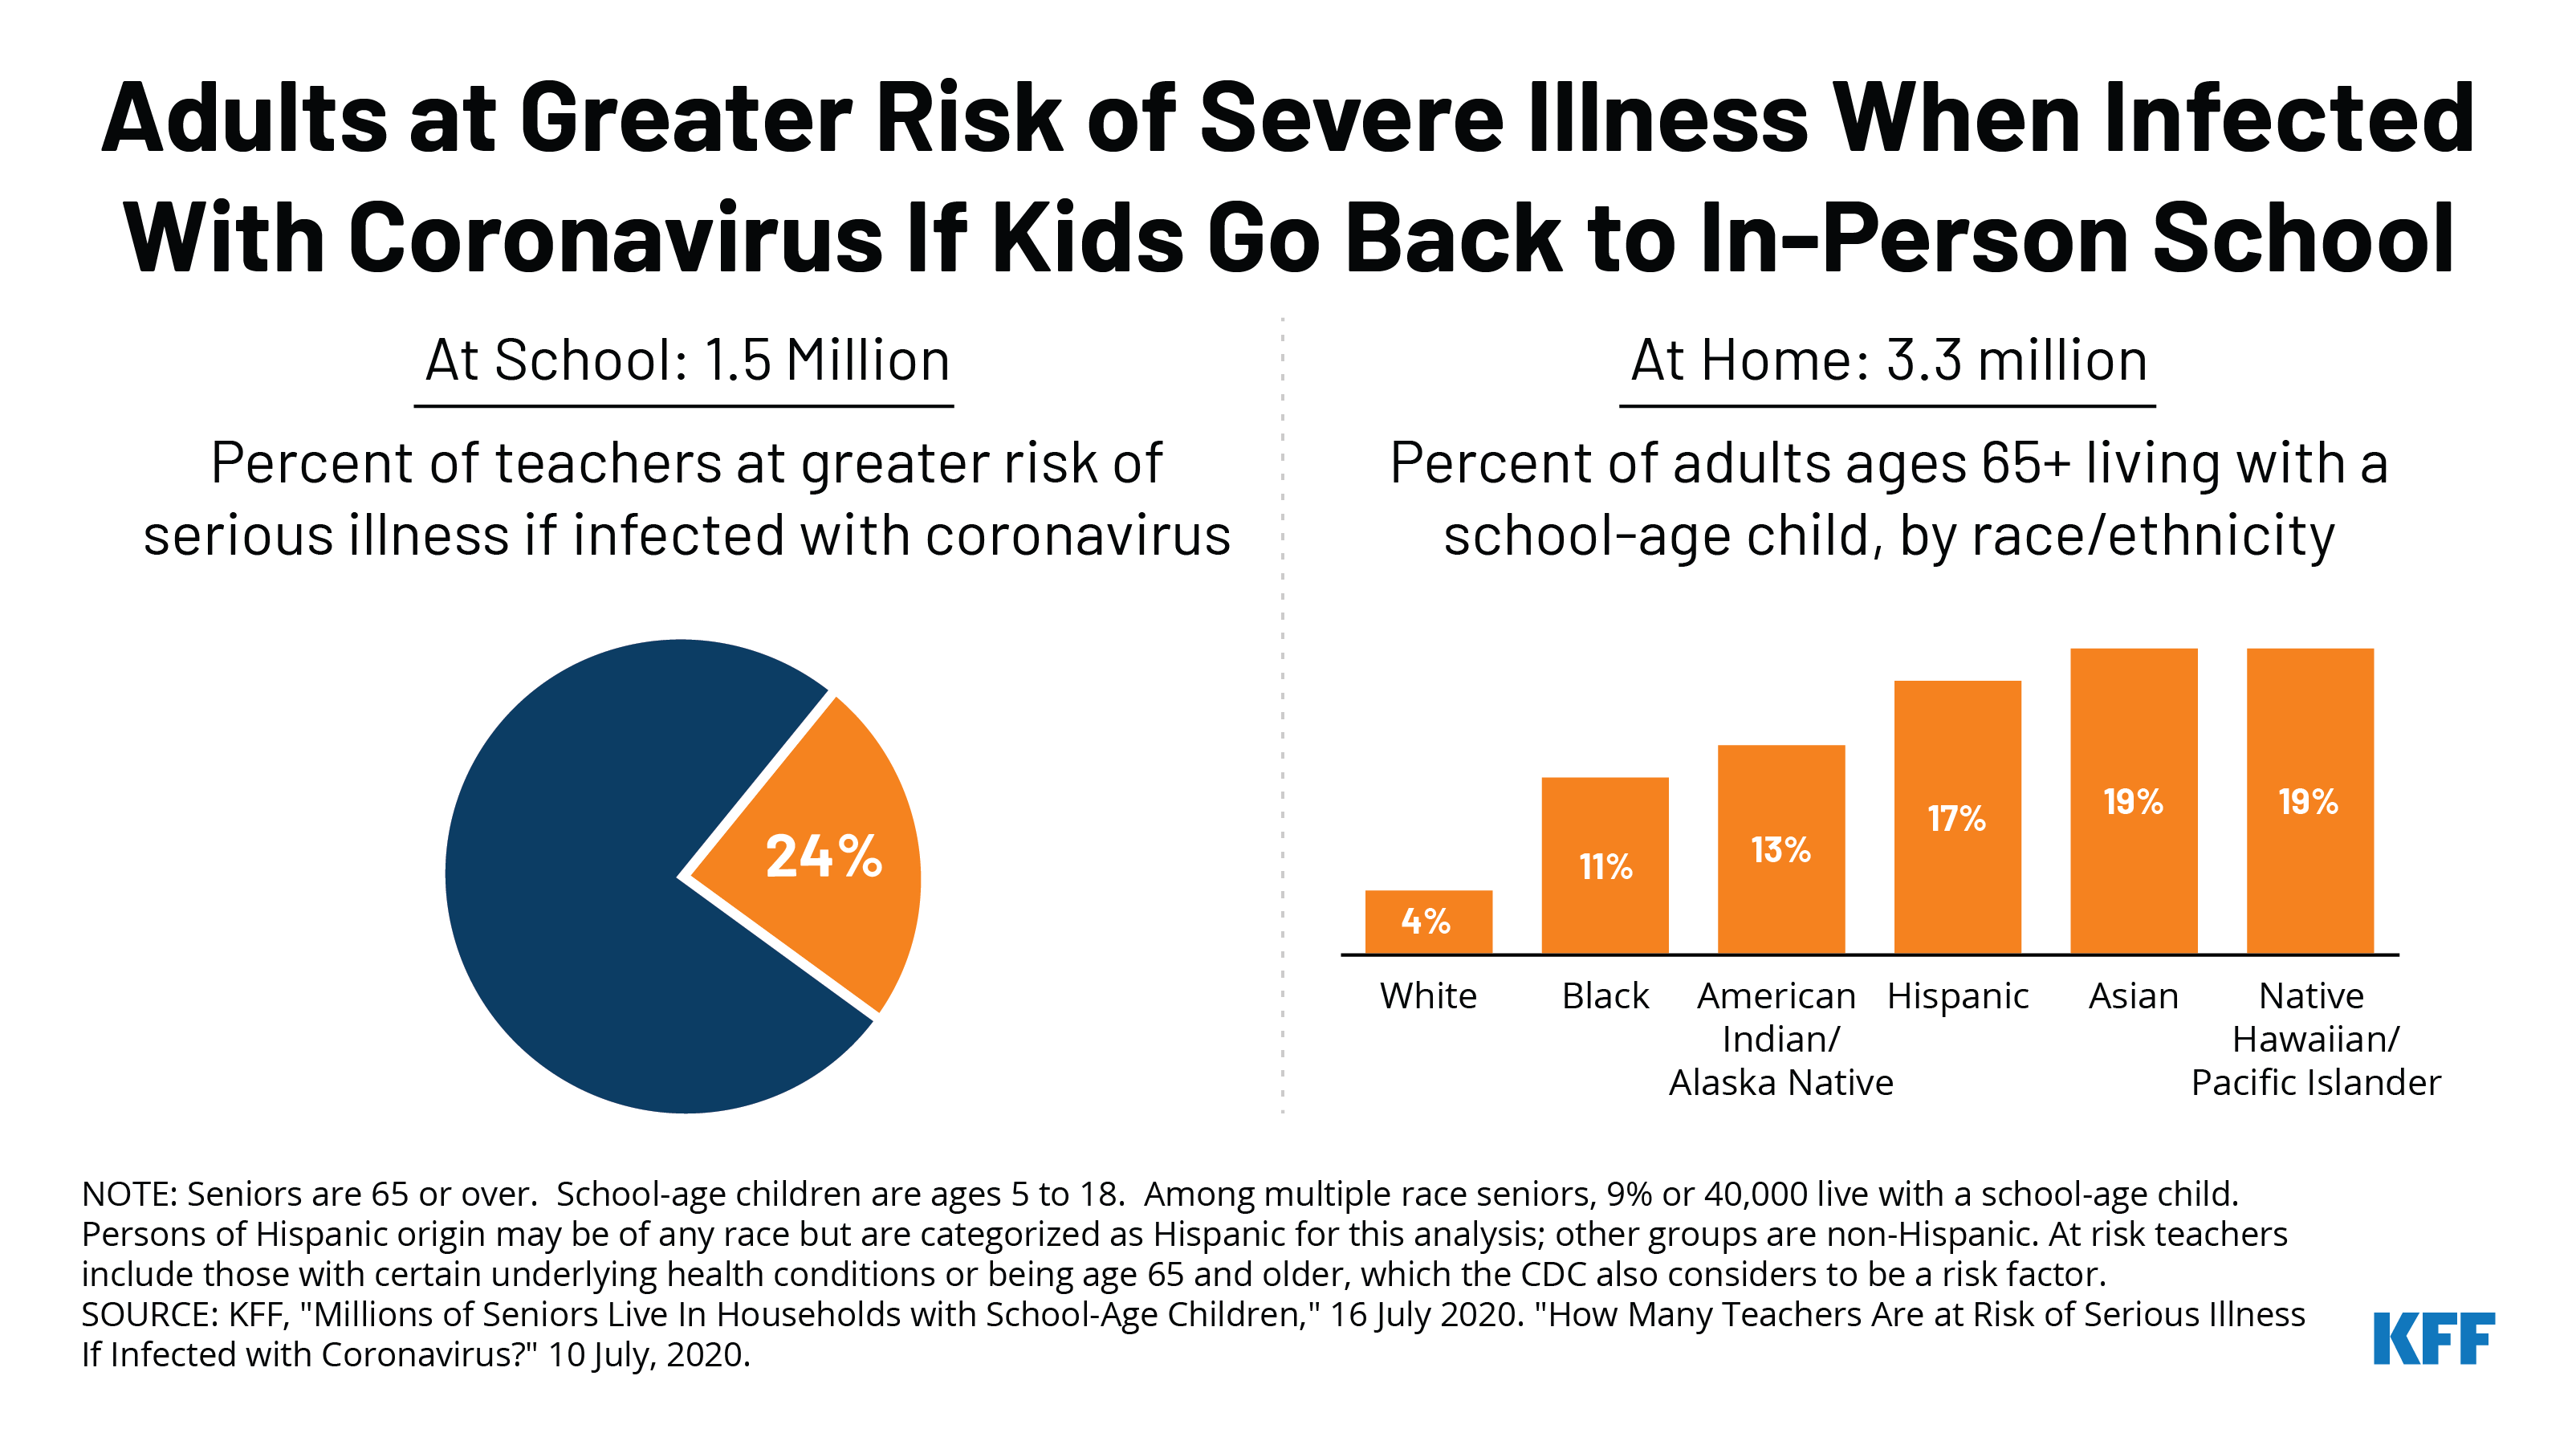
While children are at less risk for serious illness from COVID-19, teachers and other adult staff in schools face a higher risk. One KFF analysis finds about 1.5 million teachers (24% of all teachers) are either age 65 years or older or have health conditions that place them at higher risk of serious illness if they contract COVID-19. The CDC has noted that those 65 years or older are among those at greater risk of becoming severely ill from COVID-19.

But school isn’t the only risk factor to consider. A second KFF analysis this week finds that over 3 million adults age 65 or older live in households with school-aged children. The data also show that older people of color are significantly more likely to live with a school-aged child compared to White people.

Adults at risk of serious illness from coronavirus if kids go back to school in person

Here are the latest coronavirus stats from KFF’s tracking resources:

Global Cases and Deaths: Total cases worldwide approached 14 million between July 10 and July 16 – with an increase of approximately 1.5 million new confirmed cases. There were also approximately 35,000 new confirmed deaths worldwide between July 10 and July 16, bringing the total to nearly 590,000 confirmed deaths.

U.S. Cases and Deaths: Total confirmed cases in the U.S. surpassed 3.5 million this week. There was an approximate increase of 450,000 confirmed cases between July 10 and July 16. Over 5,000 confirmed deaths in the past week brought the total to over 138,000 confirmed deaths in the U.S.

U.S. Tests: There have been over 43 million total COVID-19 tests with results in the U.S. In the past 7 days, 1.6% of the total U.S. population was tested.

Race/Ethnicity Data: Black individuals made up a higher share of cases/deaths compared to their share of the population in 30 of 48 states reporting cases and 33 of 44 states reporting deaths. In 6 states (KS, WI, MO, MI, TN, and IL) the share of COVID-19 related deaths among Black people was at least two times higher than their share of the total population. Hispanic individuals made up a higher share of cases compared to their share of the total population in 37 of 45 states reporting cases. In 7 states (KY, TN, IA, WI, NE, SD, and MN), Hispanic peoples’ share of cases was more than 4 times their share of the population. COVID-19 continues to have a sharp, disproportionate impact on American Indian/Alaska Native as well as Asian people in some states.

Adults at Higher Risk of Serious Illness if Infected with Coronavirus: 38% of all U.S. adults are at risk of serious illness if infected with coronavirus (92,560,223 total) due to their age (65 and over) or pre-existing medical condition. Of those at higher risk, 45% are under age 65 and at increased risk of serious illness if infected with coronavirus due to their existing medical condition such as such as heart disease, diabetes, lung disease, uncontrolled asthma or obesity. Among nonelderly adults — low-income, American Indian/Alaska Native & Black adults have a higher risk of serious illness if infected with coronavirus. In both cases – for race and household income – the higher risk of serious illness if infected with coronavirus is chiefly due to a higher prevalence of underlying health conditions and longstanding disparities in health care and other socio-economic factors.

State Reports of Long-Term Care Facility Cases and Deaths Related to COVID-19 (Includes Washington D.C.)

  • Data Reporting Status: 47 states are reporting COVID-19 data in long-term care facilities, 4 states are not reporting
  • Long-term care facilities with known cases: 11,644 (across 44 states)
  • Cases in long-term care facilities: 283,973 (across 43 states)
  • Deaths in long-term care facilities: 56,143 (in 42 states)
  • Long-term care facilities as a share of total state cases: 12% (across 43 states)
  • Long-term care facility deaths as a share of total state deaths: 44% (across 42 states)

State Social Distancing Actions (includes Washington D.C.):

  • Status of reopening: Proceeding in 23 states, paused in 7 states, new restrictions in 14 states, reopened in 7 states
  • Stay At Home Order: Original stay at home order in 1 state, stay at home order eased or lifted in 44 states, no action in 6 states
  • Mandatory Quarantine for Travelers: Original traveler quarantine mandate in place in 9 states, new traveler quarantine mandate in place in 3 states, traveler quarantine mandate eased or lifted in 16 states, no action in 23 states
  • Non-Essential Business Closures: Some or all non-essential businesses permitted to reopen (some with reduced capacity) in 43 states, new business closures or limits in 3 states, no action in 5 states
  • Large Gatherings Ban: Original gathering ban/limit in place in 5 states, gathering/ban limit expanded or lifted in 39 states, new gathering/ban limit in place in 6 states, no action in 1 state
  • Restaurant Limits: Restaurants reopened to dine-in service in 46 states, newly closed to dine-in service in 1 state, new capacity limits in 3 states, no action in 1 state
  • Bar Closures: Closed in 9 states, reopened in 31 states, newly closed in 9 states, new service limits in 2 states
  • Face Covering Requirement: Required for general public in 26 states, required for certain employees in 16 states, allows local officials to require them for general public in 5 states, no action in 6 states
  • Primary Election Postponement: Postponement in 15 states, no postponement in 36 states
  • Emergency Declaration: There are emergency declarations in all 51 states.

State COVID-19 Health Policy Actions (Includes Washington D.C.)

  • Waive Cost Sharing for COVID-19 Treatment: 3 states require, state-insurer agreement in 3 states; no action in 45 states
  • Free Cost Vaccine When Available: 9 states require, state-insurer agreement in 1 state, no action in 41 states
  • States Requires Waiver of Prior Authorization Requirements: For COVID-19 testing only in 5 states, for COVID-19 testing and treatment in 6 states, no action in 40 states
  • Early Prescription Refills: State requires in 16 states, expired requirements in 2 states, no action in 33 states
  • Premium Payment Grace Period: Grace period extended for all policies in 2 states, grace period extended for COVID-19 diagnosis/impacts only in 4 states, expired in 10 states, no action in 35 states
  • Marketplace Special Enrollment Period: Marketplace special enrollment period still active in 5 states, ended in 8 states, no special enrollment period in 39 states
  • Paid Sick Leave: 13 states enacted, 2 proposed, no action in 36 states

State Actions on Telehealth (Includes Washington D.C.)

  • New Requirements for Coverage of Telehealth Services: Parity with in-person services in 6 states, broad coverage of telehealth services in 6 states, limited coverage of telehealth services in 6 states, no action in 33 states
  • Waiving or Limiting Cost-Sharing for Telehealth Services: Waived for COVID-19 services only in 7 states, waived or limited for all services in 8 states, expired in 1 state, no action in 35 states
  • Reimbursement Parity for Telehealth and In-Person Services: Required for all services in 17 states, no action in 34 states
  • Require Expanded Options for Delivery of Telehealth Services: Yes in 35 states, for behavioral health services only in 1 state, no action in 15 states

Approved Medicaid State Actions to Address COVID-19 (Includes Washington D.C.)

  • Approved Section 1115 Waivers to Address COVID-19: 4 states (HI, NC, NH, WA) have approved waivers
  • Approved Section 1135 Waivers: 51 states have approved waivers
  • Approved 1915 (c) Appendix K Waivers: 50 states have approved waivers
  • Approved State Plan Amendments (SPAs): 47 states have temporary changes approved under Medicaid or CHIP disaster relief SPAs, 1 state has an approved traditional SPA
  • Other State-Reported Medicaid Administrative Actions: 51 states report taking other administrative actions in their Medicaid programs to address COVID-19

The latest KFF COVID-19 resources:

  • Updated: Limitations of the Program for Uninsured COVID-19 Patients Raise Concerns (Coronavirus Policy Watch)
  • Millions of Seniors Live In Households with School-Age Children (News Release, Issue Brief)
  • How Many Teachers Are at Risk of Serious Illness If Infected with Coronavirus? (News Release, Issue Brief)
  • Data Note: Growth in Medicaid MCO Enrollment during the COVID-19 Pandemic (Data Note)
  • COVID-19 Test Prices and Payment Policy (News Release, Issue Brief)
  • Updated: How Could the Price of Remdesivir Impact Medicare Spending for COVID-19 Patients? (Issue Brief)
  • Updated: COVID-19 Coronavirus Tracker – Updated as of July 17 (Interactive)
  • Updated: State Data and Policy Actions to Address Coronavirus (Interactive)
  • Updated: Medicaid Emergency Authority Tracker: Approved State Actions to Address COVID-19 (Issue Brief)
  • U.N. Raises COVID-19 Appeal To $10.3B; International Community Must Do More To Address Pandemic, Reach SDGs, U.N. Officials Say (KFF Daily Global Health Policy Report)

The latest KHN COVID-19 stories:

  • A Coronavirus Vaccine: Where Does It Stand? (KHN, PolitiFact)
  • Disease-Carrying Mosquitoes Fly Free as Health Departments Focus on Coronavirus (KHN, AP)
  • Why Doctors Keep Monitoring Kids Who Recover From Mysterious COVID-Linked Illness (KHN, NPR)
  • As Coronavirus Patients Skew Younger, Tracing Task Seems All But Impossible (CHL)
  • KHN’s ‘What the Health?’: The Trump Administration’s War on Fauci (KHN)
  • Lost on the Frontline (KHN, The Guardian)
  • Montana Rodeo Goes On, Bucking Fears on Fort Peck Reservation (KHN, Daily Beast)
  • Next Showdown in Congress: Protecting Workers vs. Protecting Employers in the Pandemic (KHN)
  • Families of Health Workers Killed by COVID Fight for Denied Workers’ Comp Benefits (KHN, Daily Beast)
  • Conspiracy Theories Aside, Here’s What Contact Tracers Really Do (KHN, NPR)
  • California School Districts Grope for Sensible Reopening Plans (KHN)
  • You Can See Friends and Relatives During the Pandemic Surge — But Do It Carefully (KHN)
  • Lost on the Frontline (KHN, The Guardian)
  • States Allow In-Person Nursing Home Visits As Families Charge Residents Die ‘Of Broken Hearts’ (KHN, CNN)
News Release

More Than 3 Million People Age 65 or Older Live with School-Age Children, and Could Be at Heightened Risk of COVID-19 Infection if Children Bring the Virus Home from School

Older People of Color are More Likely to Live with a School-Age Child Compared to Their White Counterparts

Published: Jul 16, 2020

About 3.3 million adults age 65 or older live in a household with school-age children, a factor that state and local officials may want to take into account when deciding when and how fully to re-open schools this fall, a new KFF analysis finds.

These older adults, who represent roughly six percent of all seniors in the U.S., live with 4.1 million school age children, who comprise about seven percent of all kids ages 5 to 18, the analysis finds. The data also show that older people of color are significantly more likely to live with a school-age child compared to their White counterparts.

All of this matters because, according to the Centers for Disease Control and Prevention, older people are among those at greater risk of becoming severely ill if they get infected with the novel coronavirus, as are people of all ages with serious medical conditions such as heart disease, diabetes, lung disease, asthma and obesity. One concern state and local officials are weighing is that children – who evidence so far indicates are at lower risk of infection with COVID-19, are much less likely to die and generally present with milder symptoms — may become infected at school and carry the virus back home, potentially infecting others in their household.

There have been reports of community spread of the virus in recent months in settings such as day cares, summer camps and college campuses. To the extent that the virus may spread in schools, too, older adults of color bear a disproportionate share of the risk of becoming infected by school children bringing the virus home.

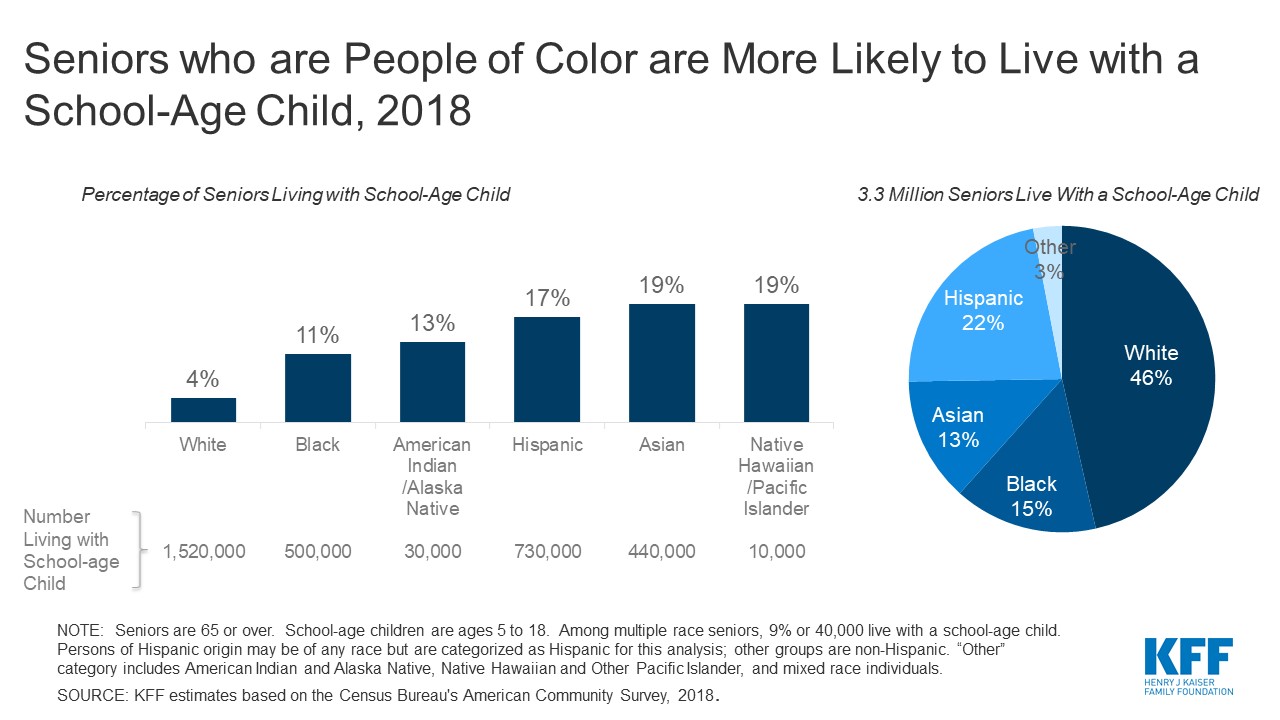
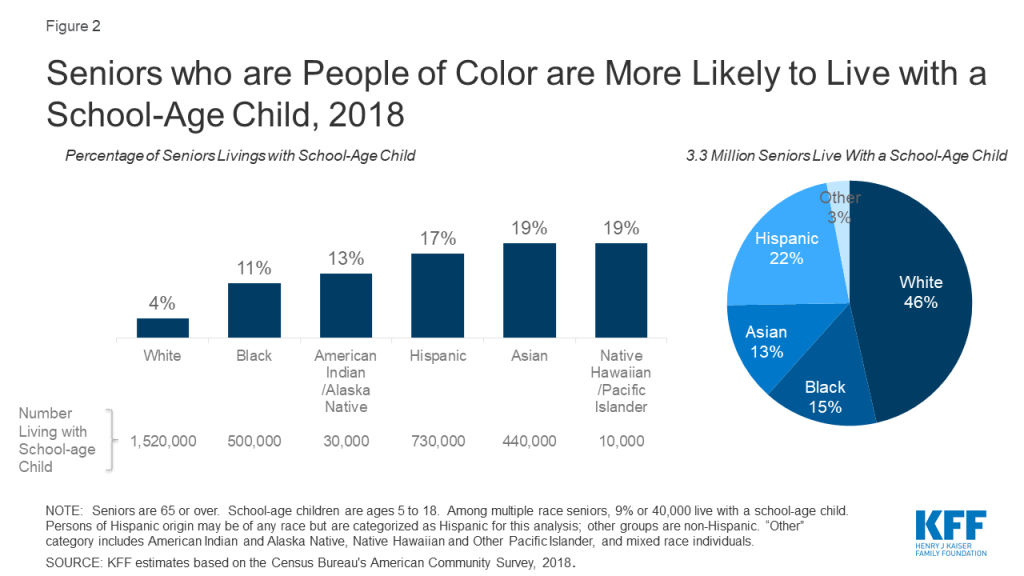
Nearly one in five (19%) Asian and Native Hawaiian or Other Pacific Islander older adults live with a school-age child, as do 17 percent of Hispanic older adults, 13 percent of American Indian or Alaska Native older adults, and over one in ten (11%) Black older adults. In contrast, four percent of older White adults lives with a school-age child.

Even as concerns about equity in education factor into decisions about reopening schools, the potential spread of the virus from school children to older adults could exacerbate the well-documented racial disparities in the broader impacts of COVID-19, in which communities of color have accounted for a disproportionate share of cases and deaths.

For more KFF data and analyses concerning COVID-19, including a recent analysis about share of teachers at higher risk of serious illness from the virus, visit kff.org.

Millions of Seniors Live In Households with School-Age Children

Published: Jul 16, 2020

There are many factors that state and local officials, as well as individual schools or school systems, are likely to consider as they decide when and how to reopen in the upcoming school year. One set of issues involves the myriad of practical considerations needed to keep students, teachers and others who work at schools safe, particularly those who may be at higher risk of severe illness if they become infected with coronavirus. Doing so is challenging, however, given the concentration of students and teachers in relatively tight spaces, limited budgets to cover additional expenses for personal protective equipment (PPE) and physical space reconfiguration, along with the difficulty in enforcing social distancing and safe habits among school-age children. For these reasons, there is a concern that transmission will occur in schools, potentially placing students and teachers at risk. Our prior analysis shows one in four teachers are at-risk of becoming seriously ill if they contract COVID19. So far, the effects of opening schools in other countries has been mixed.

Another concern is that children may become infected at school and carry the virus back to their homes, potentially infecting others in their household. It is still unclear how frequently children transmit the virus to others. While experts believe children are not the main source of infection in communities, transmission from children does occur. Evidence so far indicates that children are at a lower risk of infection, present with milder symptoms, and are much less likely to die from the infection compared to older adults, but they still could present a risk to others in their household, especially in households with people at higher risk, such as older adults and others with pre-existing conditions. To better understand how big this group might be, we used data by state on family composition to analyze the number of older adults with at least one school-age child at home.

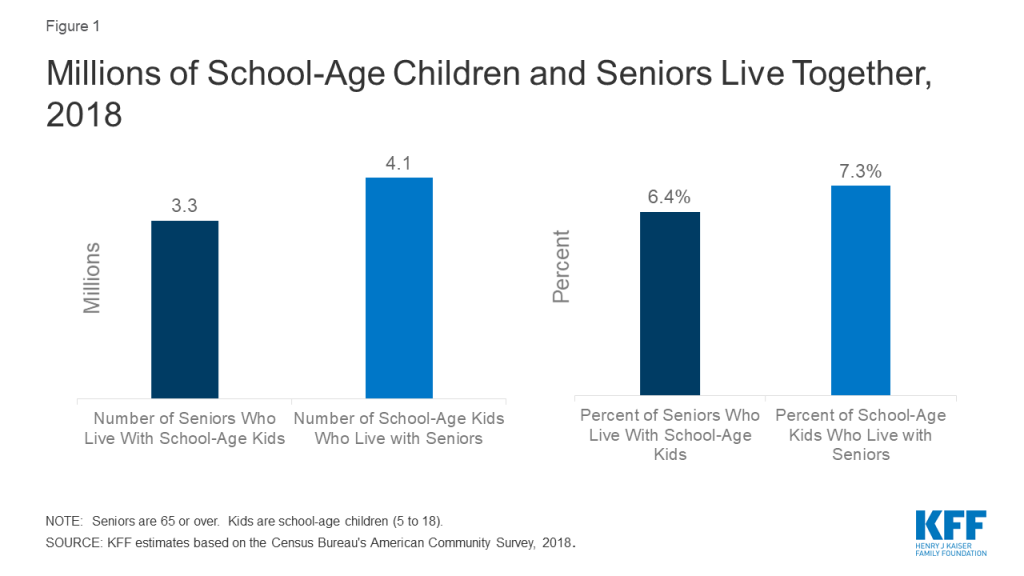
Our analysis finds about 6% of people age 65 or older, or about 3.3 million people, lived in a household with a school-age child (ages 5-18) in 2018 (Figure 1).  Looking the other way, 4.1 million school-age children, about 7% of those between the ages of 5 and 18, live in a household with someone 65 or over.

Figure 1: Millions of School-Age Children and Seniors Live Together, 2018

While nearly half of older adults living with a school-age child are White, older people of color are significantly more likely to live with a school-age child compared to their White counterparts. Nearly one in five (19%) Asian and Native Hawaiian or Other Pacific Islander older adults live with a school-age child, as do 17% of Hispanic older adults, 13% of American Indian or Alaska Native older adults, and over one in ten (11%) Black older adults. In contrast, 4% of older White adults lives with a school-age child. COVID19 already has disproportionately affected people of color, and if schools become a source of infection, older people of color would be at increased risk of exposure through school- age children.

Figure 2: Seniors who are People of Color are More Likely to Live with a School-Age Child, 2018

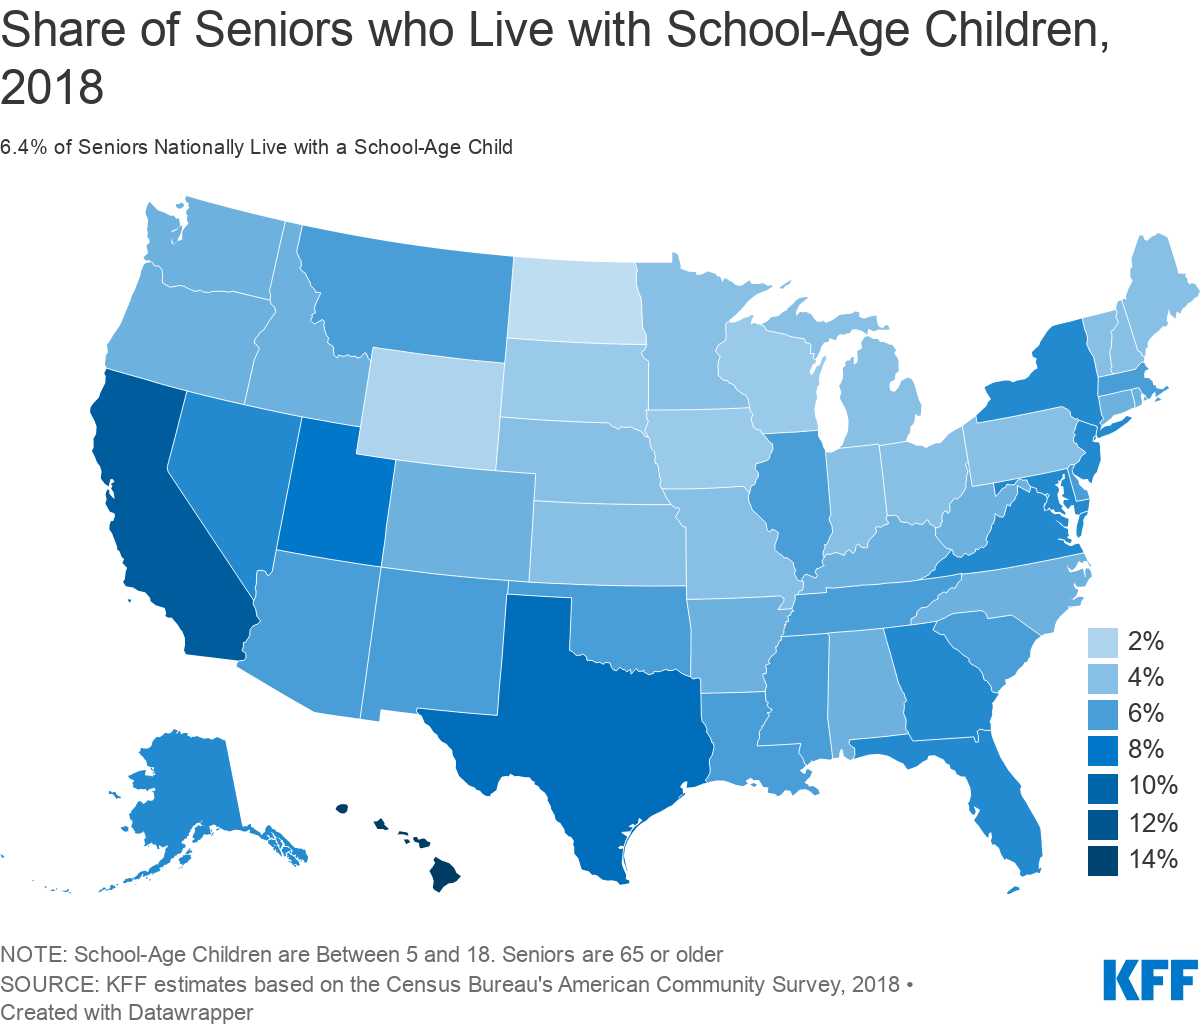
There is considerable variation in the share of older adults living with a school age child across the country (Figure 3), California, Texas, and Florida each have relatively large numbers of seniors who cohabitated with a school-age child (590, 321 and 279 thousand respectively) (Table 1). The highest share is in Hawaii, where 15% of seniors live with a school-age child, and 20% of school-age children lives with an adult age 65 or older.


The risk posed by COVID-19 to older family members is just one of the many factors that state and local officials will need to consider as they develop plans to safely reopen schools, but as we’ve shown here, these decisions could affect several million older adults. In addition, these decisions are likely to disproportionately affect older people of color who are more likely than older White adults to live in households with a school-age child.

Table 1: The Share of School-Age Children and Seniors Living Together, by State, 2018
StateNumber of Seniors Livings with School-Age KidsNumber of SeniorsShare of Seniors living With School-Age KidsNumber of School-Age Kids Living with SeniorsNumber of School-Age KidsShare of School-Age Kids Living with Seniors
U.S. Total3,282,00051,121,0006%4,133,00056,643,0007%
Alabama44,000811,0005%54,000850,0006%
Alaska6,00085,0007%8,000142,0006%
Arizona77,0001,246,0006%104,0001,280,0008%
Arkansas25,000489,0005%31,000543,0006%
California590,0005,577,00011%707,0006,929,00010%
Colorado43,000795,0005%56,000996,0006%
Connecticut30,000591,0005%35,000589,0006%
Delaware11,000178,0006%11,000153,0007%
District Of Columbia5,00083,0006%7,00085,0008%
Florida279,0004,294,0007%305,0003,285,0009%
Georgia113,0001,426,0008%145,0001,976,0007%
Hawaii39,000258,00015%46,000227,00020%
Idaho14,000276,0005%18,000351,0005%
Illinois117,0001,926,0006%162,0002,218,0007%
Indiana44,0001,015,0004%62,0001,205,0005%
Iowa13,000518,0003%18,000560,0003%
Kansas16,000442,0004%21,000545,0004%
Kentucky34,000711,0005%43,000758,0006%
Louisiana43,000700,0006%59,000847,0007%
Maine11,000268,0004%15,000191,0008%
Maryland66,000906,0007%88,0001,026,0009%
Massachusetts64,0001,103,0006%85,0001,062,0008%
Michigan66,0001,676,0004%82,0001,673,0005%
Minnesota33,000857,0004%45,000990,0005%
Mississippi28,000461,0006%41,000561,0007%
Missouri39,0001,001,0004%52,0001,046,0005%
Montana12,000198,0006%16,000173,0009%
Nebraska10,000292,0004%11,000363,0003%
Nevada34,000474,0007%40,000527,0008%
New Hampshire10,000237,0004%14,000204,0007%
New Jersey101,0001,403,0007%134,0001,517,0009%
New Mexico20,000364,0006%26,000382,0007%
New York227,0003,114,0007%291,0003,077,0009%
North Carolina88,0001,648,0005%120,0001,799,0007%
North Dakota1,000110,0001%3,000127,0002%
Ohio82,0001,926,0004%101,0001,985,0005%
Oklahoma34,000598,0006%42,000736,0006%
Oregon35,000729,0005%47,000673,0007%
Pennsylvania96,0002,251,0004%126,0002,039,0006%
Rhode Island8,000175,0005%10,000154,0007%
South Carolina49,000881,0006%65,000868,0008%
South Dakota4,000139,0003%7,000160,0005%
Tennessee67,0001,075,0006%84,0001,165,0007%
Texas321,0003,511,0009%406,0005,727,0007%
Utah27,000343,0008%34,000721,0005%
Vermont5,000119,0004%7,00090,0008%
Virginia90,0001,296,0007%109,0001,444,0008%
Washington62,0001,143,0005%77,0001,261,0006%
West Virginia16,000353,0005%24,000283,0009%
Wisconsin26,000956,0003%35,000983,0004%
Wyoming2,00095,0002%5,000102,0005%
NOTE: Seniors are 65 or over. School-age kids are 5 to 18. Counts are rounded to the nearest 1,000.
SOURCE: KFF estimates based on the Census Bureau’s American Community Survey, 2018.

Methods

This analysis is based on KFF analysis of the 2018 American Community Survey (ACS), 1-year file. The ACS includes a 1% sample of the US population. There are over 511,000 observations for those between 5 and 18, representing 57 million people. There are over 611,000 observations for those 65 or older, representing 51 million people. Throughout the brief, individuals of Hispanic origin may be any race, but are classified as Hispanic for this analysis; all other groups are limited to non-Hispanic individuals.

News Release

Analysis Finds List Prices for COVID-19 Tests Range from $20 to $850 At Large Hospitals Nationwide

Published: Jul 15, 2020

A new KFF analysis of what large hospitals nationwide charge for out-of-network COVID-19 tests show a wide range of publicly posted prices — from $20 to $850 for a single test. In many cases, the prices exceed what Medicare pays for COVID testing, which is either $51 or $100 depending on the test.

Federal law now requires private insurers, Medicare and Medicaid to cover COVID-19 tests without any cost to the patient and provides funding to support free testing for some people without health insurance, though it does not guarantee access to no-cost tests for the uninsured. Those laws ensure that most people will not have to pay out of pocket for COVID tests, though limits to the federal requirements mean that some people with and without health insurance could receive bills for COVID-19 tests.

The analysis finds:

  • The median price for a COVID-19 was $127, and about half of hospitals price their tests between $100 and $199. About one in five price their tests at more than $200.
  • Some hospitals list a discounted rate for self-pay individuals, which range from $36 to $180. Other hospitals indicate that uninsured or self-pay individuals could receive free or discounted care through their financial assistance programs.
  • Prices also vary for COVID-19 antibody tests, which are not used to diagnose active infections, from $35 to $300 at hospitals that list their prices.

The analysis set out to examine publicly posted prices at the two largest hospitals in each state and the District of Columbia. Although federal law requires hospitals to make COVID-19 prices publicly available on their websites, prices could only be found for 78 of the 102 hospitals examined. The prices reflect what they would charge for out-of-network services. Data on the negotiated rates for in-network services is not available.

How Could the Price of Remdesivir Impact Medicare Spending for COVID-19 Patients?

Authors: Juliette Cubanski, Karyn Schwartz, and Tricia Neuman
Published: Jul 14, 2020

As COVID-19 cases and hospitalizations continue to surge, Gilead has announced that it will charge most payers $3,120 for a five-day inpatient course of treatment with the anti-viral drug remdesivir and a lower price of $2,340 for government purchasers in the U.S. Remdesivir is not a cure for COVID-19, but it has been recommended for the treatment of hospitalized patients with severe COVID-19, based on preliminary evidence suggesting that it may shorten recovery time. Gilead donated the first 120,000 treatment courses of remdesivir, and the federal government has announced it will be distributing 500,000 additional treatment courses of the drug to hospitals through September 2020 at the $3,120 price.

The lower price for remdesivir that is available for government purchasers will not be paid by Medicare. That price is reserved for entities buying directly from the federal government, which includes the Department of Veteran’s Affairs (VA), the Department of Defense, the Public Health Service, and the Coast Guard, which buy drugs directly from the federal government and get price discounts that are required by law. But unlike these other governmental entities, Medicare does not purchase prescription drugs directly for its beneficiaries.

Prescription drugs are reimbursed differently under Medicare Parts A, B and D. The cost of drugs that are administered in inpatient settings covered under Part A is included in Medicare payments to hospitals for each patient stay. Under Part B, Medicare reimburses providers for infused medicines that they purchase directly and administer on an outpatient basis, including many cancer treatments. The vast majority of spending on prescription drugs used by Medicare beneficiaries is through private prescription drug plans that contract with Medicare under the Medicare Part D program. Part D covers retail prescription drugs filled at a pharmacy, typically in pill form but sometimes injected by patients themselves.

Remdesivir is expected to be covered under Medicare Part A, which pays for inpatient care, because the drug was administered on an inpatient basis in clinical trials. In this brief, we discuss how drugs provided in inpatient hospital settings are covered and reimbursed for beneficiaries in traditional Medicare under current law.

How Are Drugs Covered and Reimbursed Under Medicare Part A?

In traditional Medicare, Part A covers inpatient hospitalizations and eligible stays in skilled nursing facilities (SNF). Any drugs that Medicare beneficiaries use during an inpatient stay in a hospital are reimbursed through Part A. Instead of reimbursing providers for those drugs directly, as is done for outpatient infusions covered through Part B, Medicare typically reimburses hospitals a fixed amount for all services received by each patient. Those fixed-amount payments are based on diagnosis-related groups (DRGs) – a payment that includes the cost of any medicines a patient receives during the inpatient stay, as well as costs associated with other treatments and services.

Each DRG has a payment weight assigned based on the average resources required to treat Medicare patients for a set of included conditions. Those weights are then adjusted for hospital-based factors such as local labor costs and case mix, as well as patient-specific factors such as severity and comorbidities. Hospitals that treat a higher share of low-income Medicare and Medicaid patients receive increased reimbursements, as do teaching hospitals. Medicare also makes additional so-called “outlier” payments to reimburse hospitals for cases that are particularly costly.

In some cases, Medicare payments to the hospital are increased for beneficiaries who receive a qualifying new technology, which could mean a new treatment modality, device, or drug. Because DRG payment rates are calculated annually and are based on previous Medicare claims, this can create a lag of two to three years before new technologies are factored into DRG payments. To address that lag, Congress created the “new technology add-on payment,” which is a temporary additional payment for hospitals using qualifying new technologies. In order to qualify for an add-on payment, the new technology is evaluated on several factors, including whether the technology significantly improves clinical outcomes for the Medicare population as compared to other available treatments.

A recent example of a new technology that qualified for an add-on payment is chimeric antigen receptor (CAR) T-cell therapy treatment for cancer. The CAR-T therapies currently on the market are made by Novartis and Gilead’s subsidiary Kite and cost between $373,000 and $475,000 for the treatment itself, with additional costs related to the hospital stay. The new technology payment for these medicines was originally set at $186,500 and was later increased to $242,450. In May 2020, CMS proposed a separate DRG for CAR-T therapies because the period when the treatments are eligible for the new technology add-on payment is set to expire later this year.

The process for applying for a new technology add-on payment takes time. Applications were due in the Fall of 2019 for an add-on payment for 2021. These new technology add-on payments do not need to be offset by other spending reductions, so they can increase overall Medicare spending. At the time Gilead made its pricing announcement, the company did not say if it was planning to ask for an add-on payment.

How Will Hospitals Obtain Remdesivir for Medicare and Other Patients?

According to the federal government’s agreement with Gilead, initial doses of remdesivir will be distributed to hospitals at the $3,120 price. This arrangement is unconventional but reflects the unique challenges associated with ensuring access to remdesivir while supplies of the treatment are constrained. More typically, hospitals purchase inpatient and outpatient medicines through group purchasing organizations (GPOs), which make bulk purchases of prescription drugs, devices and other items for many hospitals at one time. GPOs can often negotiate discounts on drugs, but their ability to negotiate significant discounts for a given drug may be limited if there are no competing products on the market. If new and effective COVID-19 drug treatments enter the market at a later date – or if drugs currently on the market for other purposes are shown to be effective alternatives to remdesivir for COVID-19 treatment – that could increase GPO leverage to obtain discounts for remdesivir in the future or shift utilization to lower cost therapies.

What Are the Implications of the Price of Remdesivir?

Currently, there are a range of DRG payments that hospitals can receive for Medicare COVID-19 patients, depending on a given patient’s principal and secondary diagnoses. According to recently-released Medicare claims data for COVID-19 patients, the average Medicare payment per hospitalization for patients in traditional Medicare is $23,000. For the most severely ill patients who are on a ventilator for more than four days, reimbursement is estimated to be about $40,000. These amounts include a temporary 20% increase in inpatient reimbursement for COVID-19, which was authorized by the Coronavirus Aid, Relief, and Economic Security (CARES) Act and will last for the duration of the COVID-19 public health emergency.

Assuming no add-on payment or modification of these DRG payments, the price of remdesivir accounts for roughly 8% to 13% of total Medicare payments for DRGs associated with COVID-19. Because the DRG covers both prescription drug costs and other costs of a hospitalization, whether hospitals experience net savings or costs from using remdesivir for any given patient depends in part on the cost of other treatments provided to that patient and whether the use of remdesivir might yield savings through fewer inpatient days or lower utilization of other inpatient services.

The direct cost impact of remdesivir for Medicare, at least in the short term, is limited to spending under traditional Medicare, which covers two-thirds of Medicare beneficiaries. The other one-third of beneficiaries are enrolled in Medicare Advantage plans, which receive capitated payments from the federal government to provide all services covered under Parts A. Medicare Advantage plans negotiate prices directly with providers and the amount of those payments will not change in the near term to account for a newly approved medicine. There is some evidence that Medicare Advantage plans typically pay rates that are similar to payments under traditional Medicare. If Medicare rates per DRG increase under traditional Medicare, they may do the same under Medicare Advantage.

The price of remdesivir is only one side of the total Medicare spending equation. There is also great uncertainty about quantity, i.e., how many Medicare patients will receive the drug? Quantity depends on several factors that cannot yet be measured or known precisely, including how widely the coronavirus continues to spread, how many beneficiaries are infected and become seriously ill enough to require hospitalization, which types of patients receive the drug, duration of treatment, and whether treatment protocols change in the future in a way that modifies who gets the drug, in which setting, and how much is used.

How Does the Price of Remdesivir Affect Beneficiary Out-of-Pocket Costs?

For Medicare beneficiaries with COVID-19 who receive remdesivir during an inpatient stay, the price of drug treatment is not a factor in their costs. What patients pay for inpatient hospital stays is generally unrelated to the cost of any services they receive. Traditional Medicare beneficiaries pay a $1,408 deductible in 2020 and daily copays for extended stays; Medicare Advantage enrollees typically pay a flat amount for each hospital stay and/or day, and most Medicare Advantage plans have waived cost-sharing for COVID-19 treatment. If spending on remdesivir leads to higher Part A spending in the future, there could eventually be some impact on traditional Medicare beneficiaries’ out-of-pocket costs for Part A, because increases in Medicare’s Part A deductible and copays are based on percentage increases in payment rates to hospitals.

Conclusion

While the out-of-pocket cost to Medicare COVID-19 patients will not change under any current or future pricing scenario for remdesivir as long as it is provided as part of an inpatient hospital stay, the drug’s price matters to public programs and private payers. Based on the current $3,120 price of remdesivir for hospitals, it is uncertain whether, over time, Medicare’s current reimbursement for hospitalized COVID-19 patients will be appropriate to fully cover the cost of remdesivir for all patients who need it.
House Appropriations Committee Approves FY 2021 Health and Human Services (HHS) Appropriations Bill

Published: Jul 14, 2020

The House Appropriations Committee approved the FY 2021 Labor, Health and Human Services, and Education (LHHS) appropriations bill (and accompanying report) on July 13, 2020. The LHHS appropriations bill includes funding for U.S. global health programs provided to the Centers for Disease Control and Prevention (CDC) and some funding for global health research activities provided to the National Institutes of Health (NIH). The bill also includes emergency funding for COVID-19 response efforts. Key highlights are as follows (see Table 1 for additional detail on global health funding and Table 2 for additional detail on emergency funding for COVID-19):

  • Funding provided to CDC for global health totaled $572.8 million, a slight increase of $2 million (0.4%) above the FY 2020 enacted level ($570.8 million) and $40.6 million (8%) above the President’s FY 2021 request ($532.2 million). This includes:
    • $128.4 million for global HIV/AIDS, matching the FY 2020 enacted level and $58.9 million (85%) above the FY 2021 Request ($69.5 million).
    • $9.2 million for global tuberculosis (TB), $2 million (27%) above the FY 2020 enacted and FY 2021 Request levels ($7.2 million).
    • $226 million for global immunization, matching the FY 2020 enacted level and $20 million (10%) above the FY 2021 Request ($206 million). Within this total are the following:
      • Funding for polio totals $176 million, matching the FY 2020 enacted level and $11 million (7%) above the FY 2021 Request ($165 million).
      • Funding for CDC’s other global vaccines/measles program totals $50 million, matching the FY 2020 enacted level and $9 million (22%) above the FY 2021 Request ($41 million).
    • $26 million for parasitic diseases and malaria, matching the FY 2020 enacted level and $1.5 million (6%) above the FY 2021 Request ($24.5 million).
    • $183.2 million for the global public health protection program, which includes funding for global health security, matching the FY 2020 enacted level and -$41.8 million (-19%) below the FY 2021 Request ($225 million). [1]
    • Funding for the Fogarty International Center (FIC) at NIH totaled $86.5 million, a $5.7 million (7%) increase above the FY 2020 enacted level ($80.8 million) and $12.9 million (18%) above the FY 2021 Request ($73.5 million).
    • Emergency funding for COVID-19 response efforts totaled $24.5 billion, of which $1 billion was for global disease detection and emergency response at CDC. See Table 2 for detailed funding on non-global-health funding.

Resources:

  • FY2020 Labor, Health and Human Services, and Education Appropriations Bill
  • FY2020 Labor, Health and Human Services, and Education Appropriations Report

Table 1 (.xls) below compares global health funding in the FY 2021 House LHHS appropriations bill to the FY 2020 enacted funding amounts as outlined in the “Consolidated Appropriations Act, 2020” (P.L. 116-94; KFF summary here) and the President’s FY 2021 request (KFF summary here). Table 2 provides a summary of emergency funding in the FY 2021 House LHHS appropriations bill.

Table 1: KFF Analysis of FY21 House Appropriations for Global Health
Department / Agency / AreaFY20 Enacted(millions)FY21Requesti(millions)FY21House(millions)Difference(millions)
FY21 House– FY20 EnactedFY21 House – FY21 Request
Health & Human Services (HHS)
Centers for Disease Control & Prevention (CDC) – Total Global Health$570.8$532.2$572.8$2 (0.4%)$40.6 (7.6%)
Global HIV/AIDS$128.4$69.5$128.4$0(0%)$58.9(84.7%)
Global Tuberculosisi$7.2$7.2$9.2$2(27.4%)$2(27.4%)
Global Immunization$226.0$206.0$226.0$0(0%)$20(9.7%)
Polio$176.0$165.0$176.0$0(0%)$11(6.7%)
Other Global Vaccines/Measles$50.0$41.0$50.0$0(0%)$9(22%)
Parasitic Diseases$26.0$24.5$26.0$0(0%)$1.5(6.3%)
Global Public Health Protectionii$183.2$225.0$183.2$0(0%)$-41.8(-18.6%)
Global Disease Detection and Emergency Response$173.4Not specifiedNot yet known – –
of which Global Health Security (GHS)$125.0$175.0Not yet known – –
Global Public Health Capacity Development$9.8Not specifiedNot yet known – –
National Institutes of Health (NIH) – Total Global HealthNot yet knownNot yet knownNot yet known – –
HIV/AIDSNot yet knownNot yet knownNot yet known – –
Malaria$208.0Not yet knownNot yet known – –
Fogarty International Center (FIC)$80.8$73.5$86.5$5.7(7.1%)$12.9(17.6%)
Notes:
i – In FY20, the administration proposed to formally transfer $7.2 million from the “HIV/AIDS, Viral Hepatitis, STI and TB Prevention” account to “Global Tuberculosis” activities under “Global Health Programs” at CDC. The FY20 conference agreement formalizes this transfer.
ii –  The full breakdown in funding for “Global Public Health Protection,” which includes “Global Disease Detection and Emergency Response,” “Global Health Security,” and “Global Public Health Capacity” is not yet known for the House FY21 bill.
Table 2: KFF Analysis of Emergency Funding in  House FY21 LHHS Appropriations Bill
Department / Agency / AreaFY21House(millions)
Total Funding$24,425.00
CDC-Wide Activities$9,000.00
State and Local Public Health Departments$2,000.00
State and Local Public Health Laboratories$1,000.00
Global Disease Detection and Emergency Response$1,000.00
Vaccination Campaigns$4,000.00
Public Health Data Modernization Initiative$400.00
Public Health Workforce$200.00
Infectious Disease Rapid Response Reserve Fund$400.00
Tribes, Tribal Organizations, Urban Indian Health Organizations, or Health Service Providers to Tribesi$150.00
NIH – Office of the Directorii$5,000.00
Public Health and Social Services Emergency Fund$4,500.00
BARDA – Advanced Research and Development and Advanced Manufacturing of Vaccines and Therapeutics$3,500.00
BARDA – Vaccine Facility Enhancements$500.00
BARDA – Advanced Research and Development of Antibiotics$500.00
Public Health Emergency Fund$5,000.00
State Unemployment Insurance and Employment Service Operationsiii$925.00
Notes:
i – The FY21 House bill text states that “of the amount made available under this heading for specified programs, not less than $150,000,000 shall be allocated to Tribes, Tribal organizations, urban Indian health organizations, or health service providers to Tribes.” This amount is not in addition to the other amounts listed under CDC-wide activities.
ii – The FY21 House bill text states that these funds may be used to offset the costs related to reductions in laboratory productivity resulting from interruptions or shutdowns of research activity in FY20.
iii – The FY21 House report states that the bill “provides contingency funding for increased workloads that States may face in the administration of UI. The Committee recommendation includes bill language so that, during fiscal year 2021, for every 100,000 increase in the total average weekly insured unemployment (AWIU) above 1,728,000, an additional $28,600,000 shall be made available to States from the Unemployment Trust Fund. Under current economic conditions, the Congressional Budget Office estimates that this will result in an additional $925,000,000 to flow to States.”

[1] Funding for “Global Public Health Protection,” includes “Global Disease Detection and Emergency Response,” “Global Health Security,” and “Global Public Health Capacity”. The full breakdown among areas is not yet known for the House FY21 bill.