KFF designs, conducts and analyzes original public opinion and survey research on Americans’ attitudes, knowledge, and experiences with the health care system to help amplify the public’s voice in major national debates.
A new resource gives an overview of intimate partner violence (IPV) in the US, discusses the populations most impacted, and insurance coverage of IPV screening, counseling, and referral services.
The Affordable Care Act (ACA) changed access to coverage and services for people who have experienced IPV. The ACA requires private plans and Medicaid expansion programs to cover preventative screening for IPV. Many providers have started to incorporate IPV screening and intervention into their practice, but few women are screened for IPV in health care settings.
Despite improved coverage for IPV screening, there are several challenges to implementing IPV screenings in health care settings, including ensuring patient privacy, mandatory reporting laws, and time constraints during appointments. The brief also provides case studies of providers who are trying to better implement IPV care into their practice in response to these barriers.
The brief calls attention to populations at higher risk for IPV, including women living with HIV. In addition to this new brief, KFF also has updated a brief that highlights the link between HIV and IPV for women, and reviews key policy changes that attempt to address the intersection of these issues. Greater Than AIDS, KFF’s national public information campaign, also has a series of informational videos of women telling their stories about living with HIV and overcoming IPV.
Intimate partner violence (IPV), defined as sexual violence, stalking, physical violence, and psychological aggression perpetrated by an intimate partner, affects nearly a third of all Americans at some point in their lives. Although IPV affects men and women of all ages, women, particularly young women and women of color experience IPV at higher rates. An estimated 6.5 million women in the U.S. experience contact sexual violence, physical violence, or stalking by an intimate partner in a single year. People who are victimized by their partners are more likely to experience health problems and both the Centers for Disease Control (CDC) and U.S. Preventive Services Task Force (USPSTF) have identified IPV has a significant public health issue in the US. Evidence supports the role that clinicians have in assisting women who have experienced IPV and reducing adverse outcomes. The USPSTF and the Women Preventive Services Initiative (WPSI) sponsored by Health Resources and Services Administration (HRSA) both recommend that clinicians screen women for violence. As a result, the Affordable Care Act (ACA) required private plans and Medicaid expansion programs to reimburse clinicians when they provide IPV screening and brief intervention services to women as part of their preventive care, at no additional cost to women. This factsheet reviews the prevalence and consequences of IPV and discusses insurance coverage of and access to IPV screening, counseling, and referral services for women in the US.
Table 1: Key Terms and Definitions
Term
Definition
Intimate Partner
A romantic or sexual partner and includes spouses, boyfriends, girlfriends, people with whom they dated, were seeing, or “hooked up.”
Contact Sexual Violence
A combined measure that includes rape, being made to penetrate someone else, sexual coercion, and unwanted sexual contact.
Stalking
Involves a pattern of harassing or threatening tactics used by a perpetrator that is both unwanted and causes fear or safety concerns in the victim.
Physical Violence
Includes a range of behaviors from slapping, pushing or shoving to severe acts that include hit with a fist or something hard, kicked, hurt by pulling hair, slammed against something, tried to hurt by choking or suffocating, beaten, burned on purpose, used a knife or gun.
Psychological Aggression
Includes expressive aggression (such as name calling, insulting or humiliating an intimate partner) and coercive control, which includes behaviors that are intended to monitor and control or threaten an intimate partner.
Reproductive Coercion
Includes forced or coerced sex, sabotage of contraception, or the forcible control of reproductive health by an abusive partner. Reproductive coercion can take the form of hiding, withholding, or destroying a partner’s contraceptives, breaking, poking holes in, or removing a condom in an attempt to promote pregnancy, and threats or acts of violence forcing a victim to have an abortion or carry a pregnancy to term.
The term “intimate partner violence” is often used interchangeably with the term “domestic violence” (DV). IPV occurs across all demographics, but some groups experience higher rates. Most statistics on IPV incidence and prevalence are based on self-report. Many women are hesitant to report IPV for a variety of reasons, including financial dependence on a partner or fear of further abuse. Victims’ characteristics, such as cultural background, socio-economic status, or age, can also shape how they are affected by or speak about IPV. For example, IPV is especially stigmatized in Asian-Pacific Islander communities, so cultural and linguistic differences with providers can lead to lower reported numbers of violence. Therefore, published data may undercount actual incidence, but the National Intimate Partner and Sexual Violence Survey (NISVS) is a population-based, anonymous, random digital dial phone survey and has been ongoing since 2010.
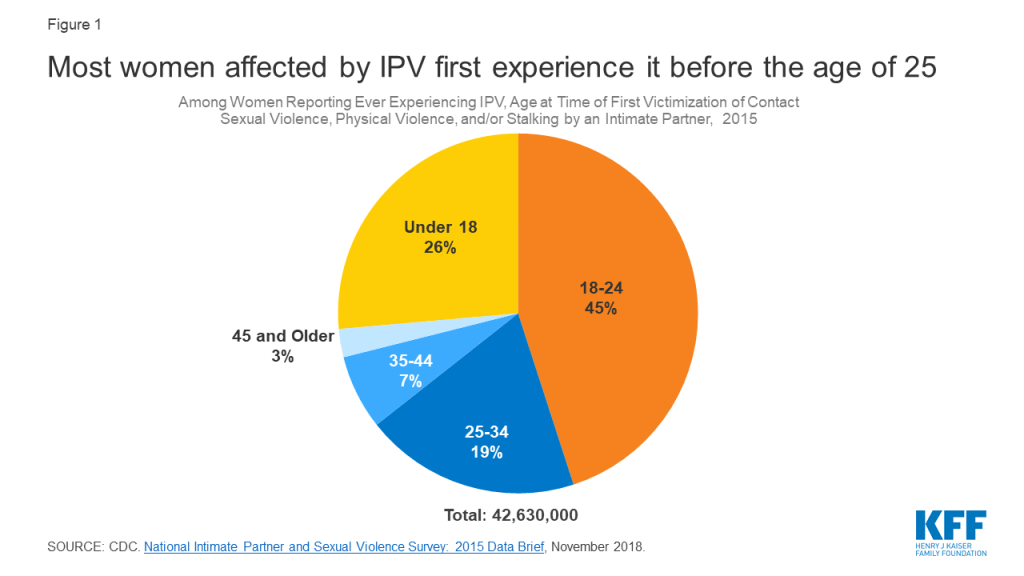
Young Women: IPV affects millions of women in the US of all ages, but nearly three quarters of all victims first experience IPV before the age of 25, with an estimated 11.6 million women experiencing their first victimization between the ages and 11 and 17 (Figure 1).
Figure 1: Most women affected by IPV first experience it before the age of 25
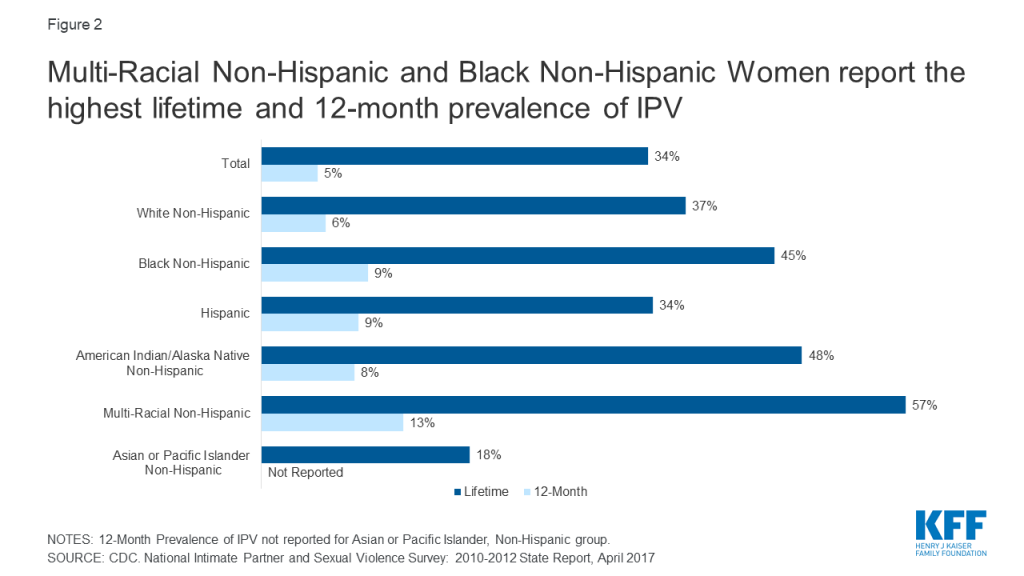
Women of color: Around half of all Non-Hispanic Black, American Indian/Alaska Native women, and Multi-Racial women have experienced IPV at some point in their lives (Figure 2). While women of all economic backgrounds can and do experience IPV, some studies show that as social class increases, risk of victimization decreases.
Figure 2: Multi-Racial Non-Hispanic and Black Non-Hispanic Women report the highest lifetime and 12-month prevalence of IPV
Women with disabilities: Women with disabilities, like women without disabilities, experience physical, sexual, and emotional violence; however, they also experience disability-specific forms (such as interference in taking medications or accessing care) of violence by an intimate partner or caretaker. In one study, women with physical health impairments were 22% more likely than women without disabilities to experience IPV; in the same study, women with mental health impairments were 67% more likely to experience IPV than their nondisabled counterparts. Overall, an estimated 26% of HIV-positive people experience IPV, but this share more than doubles to 55% amongst HIV-positive women.
LGBTQ Individuals: Four in ten (40%) of Gay/Lesbian women and six in ten (60%) Bisexual women report victimization, compared to 35% among heterosexual women.1 Studies of lifetime prevalence of IPV among transgender people range from 31% to 50%, showing similar, if not higher rates of occurrence than other sexual minorities.
Women in the military: A 2013 Department of Veteran Affairs (VA) study found a high prevalence of 12-month IPV perpetration and victimization among active duty service members, at 22% and 30% respectively. Among women Veterans, the prevalence of lifetime IPV victimization is 35%.
Women with substance Abuse Disorder: Studies have found that anywhere from 31% to 67% of women entering substance abuse treatment or methadone clinics have experienced IPV within the last year, and nearly 90% had experienced IPV within their lifetimes. Other studies have found that women who have been abused by an intimate partner are more likely to use or become dependent on substances: one study found a quarter (26%) among those experiencing IPV, compared to 5% in those who had not experienced IPV.
Pregnancy: Research has found that between 3%-9% of pregnant women are estimated to have experienced IPV during pregnancy, which can have a multitude of negative consequences for both women and babies. Pregnant women that have experienced IPV are likely to experience peri-partum depression, obstetric complications, preterm birth, low-birth weight infants, and perinatal death.2 Furthermore, research suggests that many women experience violence in the year leading up to pregnancy.3 Pregnancy offers multiple opportunities for screening and identification of IPV. Research has found that screening multiple times during the course of pregnancy results in higher identification rates than a single screen at the initial prenatal visit. A study of women who have had multiple abortions found that a history of physical or sexual abuse was associated with repeat abortion: this is also an opportunity for screening.
Reproductive coercion is a form of IPV that can include forcible control of reproductive health by an abusive partner. For example, approximately 10.3 million women have reported that an intimate partner has refused to use a condom, or tried to get them pregnant when they did not want to be pregnant.
Estimates of lifetime and 12-month exposure to IPV vary across the states, although the reasons for this variation are not well understood. Rhode Island sees the lowest percent of women experiencing contact sexual violence, physical violence, or stalking victimization by intimate partner at an estimated 4.2%, while South Carolina sees the highest, at 10.6% (Appendix Table 1). A CDC study showed that a higher prevalence of IPV was shown for women who were young, not White, unmarried, had less than 12 years of education, received Medicaid, or had unintended or stressful pregnancies. States that have a larger population of women with these characteristics are likely to see higher rates of IPV prevalence.
What are the Consequences of IPV?
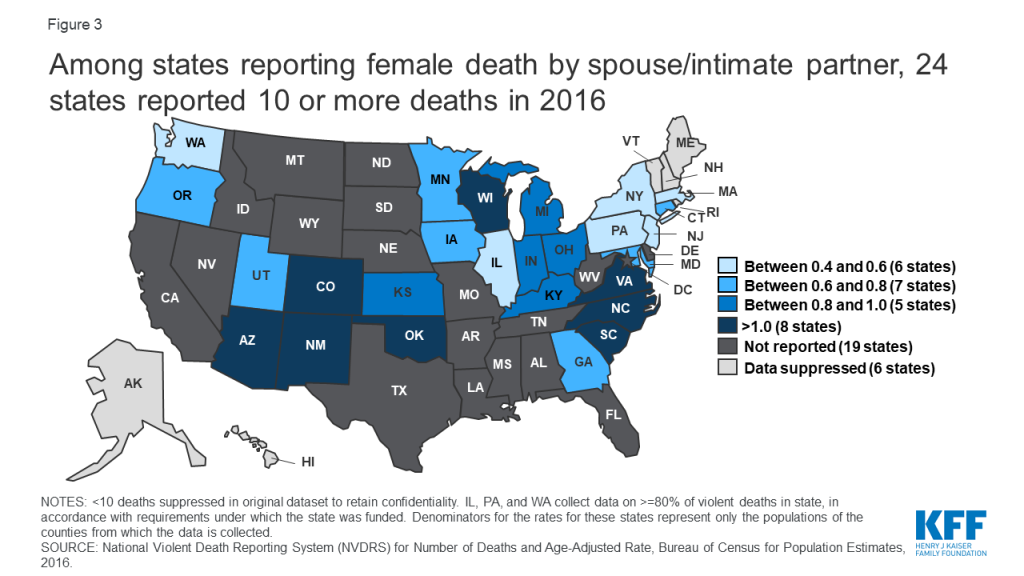
Several major medical and public health organizations, along with the CDC and USPSTF identify IPV as a significant public health issue. Four in ten (41%) of all female survivors experience physical injury related to IPV. Approximately 55% of all female homicide victims in the US are killed by an intimate partner. 31 states report their violent deaths in the Non-National Violent Death Reporting System (NVDRS); of those, 8 states have a rate higher than 1 death by a spouse or partner per 100,000 women: Arizona, New Mexico, Colorado, Oklahoma, Wisconsin, Virginia, North Carolina, and South Carolina (Figure 3).
Figure 3: Among states reporting female death by spouse/intimate partner, 24 states reported 10 or more deaths in 2016
Among women who have experienced IPV in their lifetimes, 69% reported at least one IPV-related impact including safety concerns, PTSD symptoms, injury, missing work or school, needing medical care, becoming pregnant, or contracting a sexually transmitted infection. Many also reported needing assistance with housing, legal advice, and victim advocacy. Among women who experienced IPV in the past 12 months, 55% reported to have experienced one of these IPV-related impacts.4
People who have experienced IPV are more likely to report experiencing negative health outcomes, such as chronic pain, asthma, difficulty sleeping, frequent headaches, gastrointestinal disorders and increased risk of chronic conditions such as arthritis, stroke and cardiovascular disease.5 A study of Adverse Childhood Experiences found that there is a strong relationship between exposure to child maltreatment and household dysfunction (such as witnessing IPV) and many of the leading causes of death in adults: IPV not only raises health risks for the survivor, but children, who are secondary survivors.
It is estimated that the lifetime economic cost of IPV to the US population is $3.6 trillion, with a lifetime per-victim cost of $103,767 for women and $23,414 for men. This number is estimated to include medical costs, lost productivity, criminal justice costs, and other costs, such as victim property loss. Beyond the cost to the overall population, there are costs directly to the victim of IPV, such as medical care or mental health services.
Coverage for IPV Screening and Intervention
The Affordable Care Act (ACA) changed access to coverage and services to people who have experienced IPV, by both providing new protections and in requiring coverage of specific support services. Prior to the ACA, non-group health insurers could deny coverage based on pre-existing conditions, which could include conditions arising out of acts of domestic violence, such as post-traumatic stress disorder and sexually transmitted infections.6 In the years leading up to the passage of the ACA, some states did not prohibit insurance companies from considering IPV as an underwriting criterion.
Additionally, victims of IPV may also be eligible for a Special Enrollment Period (SEP) in the federal marketplace (and in state marketplaces at the state’s discretion), permitting them to enroll for coverage outside of the specified open enrollment window. The ACA requires all private plans and Medicaid expansion programs to reimburse providers when they provide the preventive services recommended by USPSTF and the WPSI, without cost-sharing for the patient.7
Research shows that the implementation of routine inquiry or screening for IPV in healthcare settings can identify those experiencing IPV and survivors of past IPV, increase access to resources, reduce abuse, and improve clinical and social outcomes.8 Both USPSTF and WPSI recommend screening women for intimate partner violence. The WPSI recommendation is broader and states that clinicians should screen adolescents and adult women of all ages for intimate partner violence annually, while the USPSTF recommendation is limited to women of reproductive age. In addition, other professional organizations, including the American College of Obstetricians and Gynecologists (ACOG) and the American Academy of Pediatrics (AAP),9 also recommend that providers conduct intimate partner violence screenings.
Table 2: Recommendations for Screening of Interpersonal Violence Covered by Private Plans and Medicaid Expansion Programs
Organization
Recommendation
U.S. Preventive Services Task Force (USPSTF)
The USPSTF recommends that clinicians screen for intimate partner violence (IPV) in women of reproductive age and provide or refer women who screen positive to ongoing support services.
Health Resources and Services Administration (HRSA)
The Women’s Preventive Services Initiative recommends screening adolescents and women for interpersonal and domestic violence at least annually and, when needed, providing or referring for initial intervention services. Interpersonal and domestic violence includes physical violence, sexual violence, stalking and psychological aggression (including coercion), reproductive coercion, neglect, and the threat of violence, abuse, or both. Intervention services include, but are not limited to, counseling, education, harm reduction strategies, and referral to appropriate supportive services.
Clinicians can choose from several instruments to screen for whether a woman has experienced IPV within the last year within a primary care setting (Appendix Table 2). Most screening tools include questions about current physical violence, psychological aggression, and feeling threatened or afraid. Some cover sexual violence and stalking (Figure 4).
Figure 4: More than 3 in 10 women experience contact sexual violence, physical violence, and/or stalking by an intimate partner in their lifetime
Another approach recommended by Futures Without Violence is Universal Education and Empowerment, in which clinicians talk with all patients about healthy and unhealthy relationships and the health effects of violence, and offer the opportunity for disclosure.
The ACOG recommendation outlines that IPV be screened for privately during new patient visits, annual examinations, initial prenatal visits, each trimester of pregnancy, and the postpartum checkup, while AAP (Bright Futures) recommends that IPV is discussed with mothers at prenatal, newborn, 1-month, 9-month, and 4-year visits.
Interventions and Counseling
The WPSI and USPSTF recommendations state that women who screen positive for IPV be provided or referred to ongoing support services. Most interventions include referral to mental health, social services, local and national IPV advocacy organizations, which can provide safety planning, counseling, cognitive behavioral therapy, and other ongoing support. Other intervention resources include the brief Danger Assessment Tool (Appendix Table 3) to assess the risk for severe violence and an interactive decision aid to facilitate safety planning, myPlan, which is available as a mobile app and website.
Some of these patient resources are hotlines that the patient can call or text (Appendix Table 4). Another option is for clinicians to refer patients to their local DV advocates or mental health services.10 A systematic review of IPV interventions in primary care settings found that 76% of all interventions resulted in at least one statistically significant benefit, whether it be use of IPV resources, safety planning, improvement of health, or reductions in violence. Women receiving an intervention were found to be 60% more likely to end a relationship because it felt unhealthy or unsafe.11
What are the Challenges to Screening?
Although several years have passed since the initial recommendation for provider screening of IPV, adoption has been slow. In 2017 only 27% of women reported having discussed IPV with their provider recently (Figure 5). Low-income women, women on Medicaid, and Black or Latina women were most likely to have discussed DV than their counterparts.
Figure 5: Approximately one quarter of women have discussed domestic violence with their provider recently, but rates are higher among Black and Latina women and those with Medicaid
Ensuring privacy is one of the challenges to providers having these conversations with patients, who may not feel safe discussing IPV because their partner or someone else has accompanied them to their visit. Women who experience IPV are unlikely to disclose to a provider in front of their partner, friends, or family. To address this, clinics and providers can have a policy that patients will have at least some private time with their provider during the visit.12 The studies cited in the USPSTF recommendations only included women who could be separated from their partners at the screening phase, intervention phase, or both.
Mandatory reporting laws for IPV differs between states, but most have laws which require the reporting of specified injuries, or use of weapons. However, some clinicians feel that these reporting requirements impinge provider-patient confidentiality and may actually make patients less likely to disclose information. If a disclosure falls under a state’s reporting laws, the provider must submit an injury report to law enforcement or that state’s specified entity.13 Suspected abuse of a minor is required for reporting in all states. Futures Without Violence recommends a provider disclose their limits of confidentiality before beginning an IPV screening.
Other frequently reported barriers include personal discomfort with the issue or lack of knowledge about IPV or institutional policies. 14 Studies show that implementing a universal workflow, training, and screening protocols in an existing program might alleviate some of these barriers. 15,16,17 Some providers have reported that time constraints keep them from building patient rapport, which could lead to a positive IPV disclosure. Including nurses, nursing assistants, and other non-physician staff in screening protocols could help relieve some of the issues with time constraints.18,19
Other challenges include a fear that patients will be offended by being screened, misconception regarding a patient’s risk of IPV, or not realizing that domestic violence is a significant problem for their patient populations. 20,21 Studies have found that interdisciplinary methods of formal education, in-service training, and continuing education can assuage personal perceptions and feelings about domestic violence.22
Examples of Implementation
Despite the challenges, there are several examples of successful implementation in different settings. A systematic review of 17 programs that evaluated IPV screening found that programs that included a comprehensive approach and institutional support were effective in increasing IPV screening and disclosure rates. Effective screening protocols, initial and ongoing training, and immediate access/referrals to onsite or offsite support services helped to improve provider screening.23 Establishing provider relationships with community agencies in training sessions was found to raise the comfort level of staff, in both screening and in referring to services. Of note, HRSA is implementing a multi-year strategic framework to improve the response of health care systems to IPV.
There are multiple examples of health systems that have implemented both routine screening as well as intervention mechanisms to support, including at the Veterans Health Administration (Case Study 1: Veterans Affairs), and the not-for-profit integrated health system Kaiser Permanente (KP) (Case Study 2: Kaiser Permanente).
Case Study 1: Veterans Affairs
In May 2012, the U.S. Department of Veterans Affairs (VA) chartered an IPV task force, which would develop a national plan for the VA to implement a trauma informed care approach. In its Plan for Implementation of the DV/IPV Assistance Program, the Veterans Health Administration (VHA). These recommendations included expanding screening, prevention, and intervention services for men and women veterans, introducing an employee assistance program for those experiencing IPV, changing the language clinicians use to speak about IPV, and interventions for individuals who commit IPV. After pilot testing the plan in select sites, as of January 2019, the VHA requires all VA medical centers (VAMCs) to implement and maintain the program.
A 2019 study of 11 VAMCs found several successful clinical practices that were implemented through the program. These included the use of screening tools for primary IPV screening and secondary risk assessment, resource provision, community partnerships, and co-location of mental health resources. While VAMCs faced some of the same challenges as other providers discussed above, the study was able to identify facilitators to combat these challenges, such as engaging IPV champions. The VA Office of Research and Development is currently conducting longer studies to understand how intervention can help improve health outcomes.
SOURCES: Veterans Health Administration, Directive 1198: Intimate Partner Violence Assistance Program, January 2019.
Case Study 2: Kaiser Permanente
Since 2001, Kaiser Permanente Northern California,(KP) a large integrated health care organization that is not associated with KFF, has been implementing a “systems model” approach to improving screening and response to IPV and IPV identification has significantly increased. This comprehensive approach leverages the entire healthcare environment, and is comprised of five:
1) visible messaging for patients throughout the healthcare setting;2) private, routine clinician inquiry (with intervention and referral for positive screens);3) services by behavioral health clinicians for mental health needs and safety planning;4) partnerships with IPV advocacy organizations for crisis response and ongoing support and legal services; and5) oversight by local medical center leadership.
As part of integrating IPV screening and intervention into clinical care settings, KP uses health information technology, including tools in the electronic health record, to support clinician inquiry, intervention, documentation, and referral as well as patient privacy. Diagnostic information does not appear on visit summaries, bills, or patient portals. Performance improvement methods using de-identified databases help sustain and guide progress across clinical departments and medical centers.
While earlier studies of the effectiveness of the IPV screening and intervention tended to focus on outcomes such as increased screening provided by clinicians, increased awareness of the medical facility as a resource for IPV related issues, and increased member satisfaction, there has been a recent push on studying the effects of intervention. One study interviewing women with a past or current history of IPV found that survivors placed emphasis on interventions that protected safety, privacy, and autonomy, such as interventions that did not require IPV disclosure. Another analysis of women’s perceptions of appropriate interventions also found that women were looking for nonjudgmental, nondirective, and individually tailored interventions. In both the cases of the VA and KP, there is emphasis placed on the success of interventions implemented after screening is complete.
Looking Forward
With nearly 8 million women in the US experiencing IPV annually, and nearly 45 million over the course of their lifetimes, IPV poses a significant, multi-faceted public health problem. One important component of both reducing violence and the health burdens of that violence is the role of health care providers in early detection and treatment of IPV. USPSTF and WPSI highlight studies that found lower rates of IPV in women who underwent screening and intervention.24 Furthermore, given the complex nature of IPV and the wide range of its health consequences, more providers are striving to develop IPV screening and intervention services that align with related efforts in the health care system, including providing trauma-informed care, addressing the role of social determinants of health, and improving access to mental health and addiction services.
As a result of the ACA’s preventive services coverage requirement, IPV screening is covered under most private health plans and Medicaid expansion groups. The ACA also made policy changes related to IPV, including protecting coverage access for people with pre-existing conditions and offering them special enrollment periods.
In addition to coverage, the USPSTF and WPSI recommendations imply that screening and counseling should be standard practice. As states expand Medicaid or more people become privately insured, more become eligible for coverage of these screening and counseling services, which could play an important role in reducing IPV victimization. In addition to coverage for screening, more providers are implementing interventions to connect patients to services. These efforts, along with continued education and awareness about IPV and expanded resources could improve outcomes and reduce the burden of violence experienced by millions of women in the US.
The authors thank Brigid McCaw MD, MPH, MS, FACP for her helpful review and input on this brief.
Appendices
Appendix Table 1: 12 Month and Lifetime Prevalence of Contact Sexual Violence, Physical Violence, and/or Stalking Victimization by Intimate Partner, U.S. Women 2010-2012 Estimates
1. Have you ever been emotionally or physically abused by your partner or someone important to you?
Dichotomous scale, clinician administered survey; scores range from 0-5, with any positive response considered a positive screen.
32-93%; 55-99%
2. Within the last year, have you been hit, slapped, kicked or otherwise physically hurt by someone?
3. (If applicable): Since you’ve been pregnant, have you been slapped, kicked or otherwise physically hurt by someone?
4. Within the last year, has anyone forced you to have sexual activities? (circle all that apply): husband, ex-husband, boyfriend, stranger, other, multiple.
5. Are you afraid of your partner or anyone you listed above?
U.S. Congress. United States Code, Title XXVII, The Public Health Service Act. Enacted October 2009. ↩︎
Affordable Care Act (ACA) requires coverage of services recommended by USPSTF as well as women’s preventive services recommended by HRSA, which currently contracts with WPSI to make recommendations. ↩︎
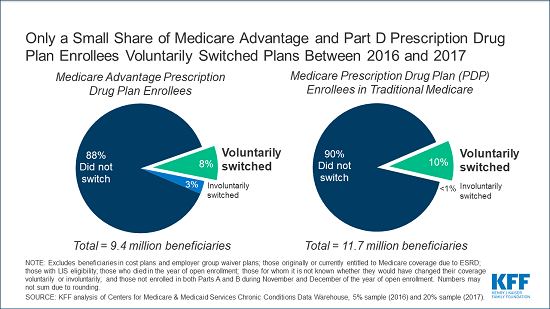
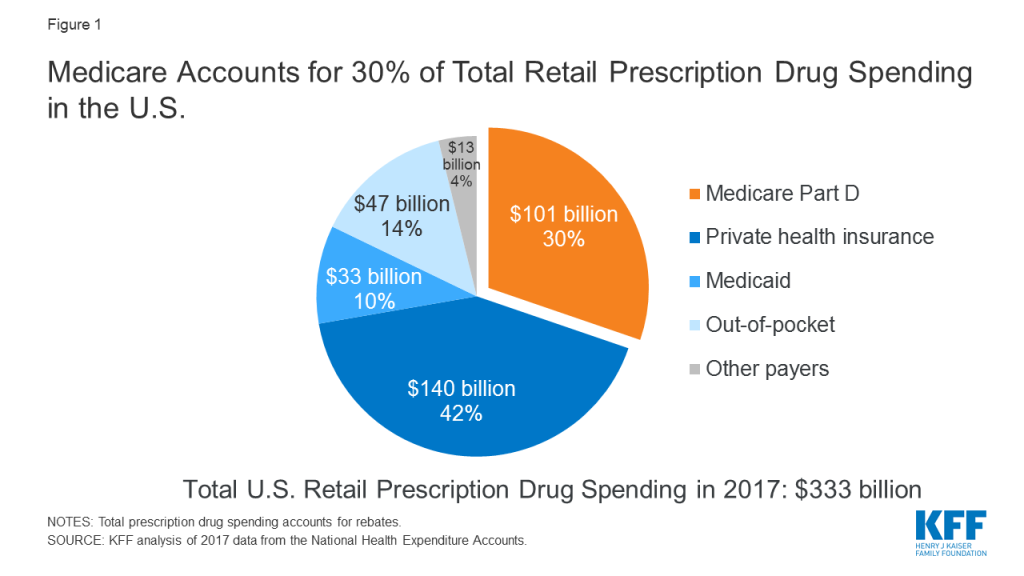
A new KFF analysis finds that a relatively small share of people with Medicare Advantage or stand-alone Medicare Part D prescription drug coverage voluntarily switch plans during Medicare’s open enrollment period, which runs annually from Oct. 15 to Dec. 7.
With less than a week remaining for beneficiaries to make their selections, shopping around among plans is important, since plans can vary significantly and change from year to year, which can have a large impact on enrollees’ coverage and costs.
The analysis finds that, among beneficiaries without low-income subsidies, 8 percent of those in Medicare Advantage plans with prescription drug coverage voluntarily switched to another plan during the 2016 open enrollment period for the 2017 plan year. Similarly, only 10 percent of beneficiaries without low-income subsidies in Part D stand-alone drug plans voluntarily switched to another plan during the 2016 open enrollment period.
The data reflect a longstanding pattern where a substantial majority of Medicare’s private plan enrollees don’t choose to switch plans in any given year. During each of the open enrollment periods between 2007 and 2016, the share of enrollees without low-income subsidies voluntarily switching plans for the coming year ranged between 6 and 11 percent for people in Medicare Advantage drug plans, and between 10 and 13 percent among those in stand-alone drug plans.
According to an analysis of data from the Centers for Medicare & Medicaid Services (CMS), one-third of Medicare beneficiaries living in the community said it was very difficult or somewhat difficult to compare Medicare options in 2017, while nearly half said they rarely or never review or compare their Medicare options.
Low rates of plan switching could indicate that many beneficiaries are generally satisfied with their current plan. Another explanation could be that many beneficiaries may find the process of comparing plans too challenging, are unaware of open enrollment, or have limited confidence in their ability to choose a better plan.
CMS encourages beneficiaries to shop around for plans each year to potentially save money or get new benefits. This is valuable advice, because private plans can vary significantly in premiums, deductibles and other cost sharing, provider and pharmacy networks, and drugs covered, among other features.
Women in the United States experience high rates of violence and trauma, including physical, sexual, and emotional abuse. Women with HIV, who represent about a quarter of all people living with HIV in the U.S., are disproportionally affected.1,2,3 Intimate partner violence (IPV), a term often used interchangeably with domestic violence (DV), in particular, has been shown to be associated with increased risk for HIV among women, as well as poorer treatment outcomes for those already diagnosed.4,5 In addition, it has been suggested that women are at greater risk of experiencing violence upon disclosure of their HIV status to partners.6
Given the role that IPV plays in HIV risk, transmission, and care and treatment, decreasing the prevalence of IPV and mitigating its effects is an important part of addressing the HIV epidemic among women in the United States. Policy changes, including those related to health care and coverage, represent one mechanism for addressing the intersection of HIV and IPV. After highlighting key statistics about IPV generally as well as the link between HIV and IPV, this brief will review key policy changes and initiatives that attempt to address these challenges.
Table 1: Key Terms and Definitions
Term
Definition
Intimate Partner
A romantic or sexual partner, including spouses, boyfriends, girlfriends, people with whom an individual dated, were seeing, or “hooked up.”
Contact Sexual Violence
A combined measure that includes rape, being made to penetrate someone else, sexual coercion, and unwanted sexual contact.
Stalking
Involves a pattern of harassing or threatening tactics used by a perpetrator that is both unwanted and causes fear or safety concerns in the victim.
Physical Violence
Includes a range of behaviors from slapping, pushing or shoving to severe acts that include being hit with a fist or something hard, kicked, hurt by pulling hair, slammed against something, hurt by choking or suffocating, beaten, burned on purpose, or assaulted with a weapon.
Psychological Aggression
Includes expressive aggression (such as name calling, insulting or humiliating an intimate partner) and coercive control, which includes behaviors that are intended to monitor and control or threaten an intimate partner, including through digital technologies.
Reproductive Coercion
Includes forced or coerced sex, sabotage of contraception, or the forcible control of reproductive health by an abusive partner. Reproductive coercion can take the form of hiding, withholding, or destroying a partner’s contraceptives, and threats or acts of violence forcing a victim to have an abortion or carry a pregnancy to term.
Women in the United States experience high levels of violence, including sexual violence, across their lifetimes, with the most recent data indicating that approximately 44% of US women report ever having experienced unwanted sexual contact.7 Moreover, an estimated 36% of US women report ever having experienced contact sexual violence, physical violence, or stalking by an intimate partner in their lifetime.8
Figure 1: Experience of Intimate Partner Violence and Women, Overall and with HIV
While IPV can and does occur among all groups, some groups face higher rates of violence. 57% of Multi-Racial Non-Hispanic women, 48% of American Indian/Alaska Native Non-Hispanic Women, and 45% of Black Non-Hispanic Women report facing IPV in their lifetimes (and those shares are likely to be under reported due to a variety of factors).9 Social class, LGBTQ identification, and disability status are also associated with higher rates of IPV. 10,11,12
Overall, an estimated 26% of HIV-positive people are estimated to have experienced physically violence by a romantic or sexual partner and 17% are estimated to have been “threatened with harm or physically forced to have unwanted vaginal, anal, or oral sex”13 ; Among HIV positive women, IPV is even more prevalent, reported by 55% of women living with HIV.14 In addition to the traumatic impact IPV has on all women, the experience of trauma and violence is also associated with poor treatment outcomes and higher transmission risk among HIV positive women.15,16
In many cases, the factors that put women at risk for contracting HIV are similar to those that make them vulnerable to experiencing trauma and IPV. Women in violent relationships are at a four times greater risk for contracting STIs, including HIV, than women in non-violent relationships and women who experience IPV are more likely to report risk factors for HIV.17 A nationally representative study found 20% of HIV positive women had experienced violence by a partner or someone important to them since their diagnosis and of these, with half perceiving that violence to be directly related to their HIV serostatus.18 Indeed, these experiences are interrelated and can become a cycle of violence, HIV risk, and HIV infection (see Figure 2). In this cycle, women who experience IPV are at increased susceptibility for contracting HIV and HIV positive women are at greater risk of experiencing IPV.19,20
Figure 2: Cycle of Violence, HIV Risk, and HIV Infection/Transmission
Key Policies Addressing Intimate Partner Violence: The ACA and Beyond
Several key policy changes have occurred in recent years that either directly or indirectly address IPV among women with HIV, particularly changes ushered in by the Affordable Care Act (ACA).
Policy Changes Under the ACA
The ACA, signed into law in 2010, expanded access to affordable health coverage and reduced the number of uninsured Americans through the creation of federal and state health insurance marketplaces and by expanding the Medicaid program, as well as through other reforms. In addition, there are several provisions that are specifically designed to protect individuals who have experienced IPV, including those with HIV. These include explicit protections in the law, as well as policy enacted through regulatory interpretation and guidance.
The elimination of pre-existing condition exclusions and premium rate setting based on health status, such as HIV, and other factors, including whether someone is a survivor of IPV. Prior to the ACA, non-group private health insurers could deny coverage based on pre-existing conditions, which could include conditions arising out of acts of domestic violence, such as post-traumatic stress disorder and sexually transmitted infections.21,22 While some states enacted comprehensive IPV related anti-discrimination insurance protections, not all did so. Under the ACA, pre-existing condition exclusions are prohibited and rates are permitted to vary only by age, geographic location, and smoking status. This provision is important for HIV positive domestic violence survivors who in the past could have faced denials or higher rates based on experience of IPV (or use of related health services), their gender, or their HIV status. However, individuals with non-ACA compliant plans, such as short-term limited duration (STLD) plans may be turned down for coverage or charged more if they have a health condition such as HIV or have a history of experiencing IPV (or using health services related to IPV experience).23
Coverage of a range of no-cost preventive services for women including screening and counseling for IPV. Under the ACA, screening and counseling for IPV is a preventive service that must be covered without cost-sharing by most insurers, including most private health plans and all Medicaid expansion programs, in states that have expanded. While, there is no requirement that traditional state Medicaid programs provide no-cost IPV screenings as part of the state benefit package, they are encouraged to do so – if states choose to cover a suite of preventive services, they can seek a 1% increase in their federal matching rate for those services. As of June 2019, 15 states have elected this opportunity.24 Screening might occur during a routine office visit or well-woman exam and might entail a provider asking a patient about their current and past relationships. The Women’s Preventive Services Initiative (WPSI) recommends counseling if IPV/DV is disclosed, which can consist of assessing the patient’s safety, referring to mental health services, and providing linkage to support services and resources (Appendix Table 1).25 HIV screening and pre-exposure prophylaxis (PrEP), an HIV prevention medication (starting 2021), are also covered preventive services.
Allowance for married survivors of IPV to file taxes separately from their spouse and claim a premium tax credit. To help make insurance coverage more affordable, the ACA provides advanced premium tax credits to individuals between 100% and 400% of the federal poverty level who purchase private insurance through state and federal exchanges. Per the ACA, a married individual needs to file taxes jointly with their spouse to be eligible for premium tax credits which can help make health insurance coverage purchased through a marketplace more affordable. The Department of Treasury and Internal Revenue Service (IRS) issued guidance and subsequent regulations in April and July of 2014 that permit a survivor of IPV living apart from their spouse at the time of tax filing and unable to file a joint return, to claim a premium tax credit while using a married filing separately tax status for up to three consecutive years.26 Allowing survivors to file using this tax status and still obtain premium tax credits is designed to protect them from having to interact with an abuser at tax time while still being able to access insurance subsidies.
Special Enrollment Period for survivors of IPV. While enrollment in private health plans through the insurance marketplaces must typically occur during a specific open enrollment period in most cases, there are exceptions. Individuals experiencing certain qualifying events, such as a marriage, divorce, or birth of a child, may be granted a Special Enrollment Period (SEP) and permitted to enroll outside of the specified open enrollment window. In 2014, a limited 2-month SEP was created for spousal victims of IPV and their dependents and in 2015 the SEP was extended to include any member of a household who is a victim of intimate partner violence.27 The SEP applies to federally facilitated marketplaces; state-run marketplaces may optionally provide SEPs related to experience of IPV.
Non-grandfathered plans in the individual and small group markets and Medicaid expansion programs now cover mental health and substance use disorder services as one of ten “essential health benefit” categories. The ACA requires that individual and small group plans, sold both inside and outside the health insurance marketplaces, as well as Medicaid expansion plans, provide ten categories of essential health benefits including among others: ambulatory services; hospitalization; prescription drugs; and of note in this instance, mental health and substance use disorder services. Prior to this requirement, it was estimated that about one-third of those enrolled in individual market products lacked coverage for substance use services and about one in five were without coverage for mental health services.28 In addition, the ACA applies Mental Health Parity and Addiction Equity Act of 2008 standards to the individual and small group insurance markets which means that these services must now be covered at parity with medical and surgical benefits. Numerous studies have observed an association between IPV and an array of mental health conditions, including Post Traumatic Stress Disorder (PTSD), depression, and anxiety, among others.29,30 People with HIV experience mental health and substance misuse comorbidities at higher rates than the population overall.31,32,33 Similarly, the rate of substance misuse among women experiencing IPV is 26%, compared to 5% among those not experiencing.34 Access to mental health and substance use services, therefore, is an important component of comprehensive health coverage for many people living with HIV and particularly for those dealing with current or past IPV and trauma.
Maternal and child home visitation program includes focus on domestic violence. A 2013 study of 260 HIV positive women with a mean age of 46, found that 86% of those surveyed were mothers and 31% had children living at home.35 Given that a large share of women with HIV are likely to be parents and that women with HIV are disproportionately affected by IPV, home visits that include opportunities to address domestic violence could be particularly important for this population. The ACA established the Maternal, Infant, and Early Childhood Home Visiting (MIECHV) program, a grant program that provides states with resources to respond to the needs of children and families in at risk communities and includes specific opportunities to address domestic violence. The ACA provided the first five years of funding for the program. Participating states are required to demonstrate an improvement in 4 of 6 benchmarks, one of which is a reduction in crime or domestic violence with its performance measure being screening for IPV. In 2018, 82% of MIECHV caregivers were screened for IPV, up from 74% in 2017.36 In February 2018, the Program was allocated $400 million per year through fiscal year 2022 and in September 2018, 56 states, territories, and nonprofit organizations were awarded grants totaling approximately $361 million through the program.37
Federal grant program to support pregnant teens and women, including those experiencing domestic and sexual violence, established under the Pregnancy Assistance Fund. The ACA also established a competitive grant program for states and tribes to support pregnant and parenting teens and women, allowing states to use funds to provide intervention and support services to pregnant women who are victims of domestic, sexual violence or stalking. The fund is also available to support the provision of assistance and training related to these issues for federal, state, local and other partners. In FY18, 25 grantees were awarded a total of $25 million. Of these, addressing domestic or interpersonal violence is specifically included in the project description provided on HHS.gov for six grantees.38
Other Policy Initiatives
In addition to ACA-related changes, several other policy initiatives could also help address the intersection of HIV and IPV, including:
Reauthorization of The Violence Against Women Act.39 The Violence Against Women Act, first signed in 1994, dedicated over $1.5 billion in funding towards the investigation and prosecution of violent crimes against women and towards “victim’s services,” including, rape crisis centers, battered women’s shelters, and other sexual assault or domestic violence programs. These services are often the resources recommended by providers to those who screen positively for IPV (Appendix Table 1) VAWA has been reauthorized several times, most recently in 2013. The last authorization lapsed and expired in December of 2018. As of August 2019, the Violence Against Women Reauthorization Act of 2019 had been passed by the House, and is awaiting vote by the Senate.
The National HIV/AIDS Strategy. The National HIV/AIDS Strategy (NHAS), unveiled in 2010 under President Obama and updated in 2015 through 2020, has goals of reducing new HIV infections, increasing access to care and improving health outcomes for those living with HIV, reducing HIV-related disparities and health inequities, and achieving a more coordinated national response to the HIV epidemic. In order to reduce new HIV infections, NHAS recommends a combination of evidence-based approaches, including supporting and strengthening patient-centered IPV screening and linkage to services (housing, education, employment) for those who screen positively. To address the challenge posed by IPV for accessing and adhering to stable care, the NHAS suggests that a trauma-informed approach to care, which seeks to minimize the chances of re-traumatizing those who are trying to heal, may be applicable in an HIV care setting. The Trump administration is currently working on an updated version of the NHAS but it is not yet known whether addressing IPV will feature in the strategy.
“Ending the HIV Epidemic” Initiative In February of 2019, President Trump announced a new initiative with the goal of ending the HIV epidemic in the United States within 10 years.40 The Ending the HIV Epidemic proposal requests $291 million in the FY 2020 budget to begin the multiyear initiative. Although the plan does not specifically outline funding for those experiencing IPV or those with HIV at risk for IPV, the plan does aim to reduce new infections by 90% by 2030. Substantial localized planning will occur within the 48 counties, 7 states, Washington, D.C., and San Juan, Puerto Rico targeted in year one of the initiative. It is possible that addressing IPV as part of “ending HIV” strategy will feature to varying degrees across jurisdictions which will be charged with developing their own plans to reach the initiative’s goals.
Funding to address the intersection of IPV & HIV among women.41 In December 2019, the Health and Human Services’ (HHS) Office on Women’s Health (OWH) awarded new funding to community based organizations to “provide a community-level focus on the prevention of, screening for, and response to IPV and its intersection with HIV infection.” Awards totaling $3.1 million were provided to four organizations, each located in one of the jurisdictions prioritized in the Ending the HIV Epidemic initiative: University of Texas Southwestern Medical Center in Dallas, TX, University of North Texas Health Science Center in Fort Worth, TX, The Center for Women and Families, , in Louisville, KY, and the Institute of Women and Ethnic Studies, in New Orleans, LA.
Funding to provide HIV positive domestic violence survivors with housing. As part of a demonstration project, in 2016 the Departments of Justice and Housing and Urban Development awarded $9.2 million to eight local programs to provide stable housing to HIV positive survivors of domestic violence in an effort to prevent homelessness.42
Looking Ahead
Addressing trauma and violence experienced by women with and at risk for HIV aims to provide care and support in the immediate term, but in the longer term, may also be an important contribution in combating the HIV epidemic. Key policy changes, including those ushered in by the ACA and other opportunities outlined above, provide important vehicles for targeted interventions to address IPV in HIV positive and at risk women.
Despite these policy changes, several challenges remain. With respect to screening and counseling for IPV, as with all preventive services, coverage does not necessarily equate with uptake by consumers or with the service being offered by providers. Inclusion of IPV/DV screening as a reimbursable service and the associated federal and advisory body recommendations may drive up some provision of the intervention but additional efforts may be necessary to generate more widespread provider led screenings. A 2017 study found that just 27% of reproductive age women have discussed IPV with a provider recently, demonstrating that these screenings are still relatively rare.43 (See Women’s Preventive Services Initiative (WPSI) for a compilation of IPV screening tools.) In addition, maintaining confidentiality for women seeking violence-related care can sometime be a challenge and create barriers to access. Private insurance plans typically send an Explanation of Benefits (EOB) that documents provided services to the principal policy holder which may deter women from accessing services. In addition, mandated reporting of IPV in many states, including requirements for providers to file police reports or reports with a public health department or other state entity, may also deter women from seeking services.44 Beyond these challenges related to IPV more generally, there is also a need to raise awareness among providers and women at risk for and living with HIV about the interrelatedness between HIV and intimate partner violence.
Finally, as states make different policy decisions, particularly around the ACA, opportunities for enrollees vary across the nation. For example, whether states with state based marketplaces decided to implement the SEP for victims of IPV discussed above is one such policy decision. Additionally, states are still making decisions about whether to expand their Medicaid program to all those below 138% of the Federal Poverty Level (currently 37 states (including DC) have expanded), and this has significant implications for access to coverage for low-income individuals. Given that multiple studies have demonstrated that HIV and IPV both trend with poverty, access to Medicaid expansion, including the associated IPV screening, could play a particularly important role for these populations.45 In addition, access to services, varies by coverage and as noted, IPV screening is not a required covered service for those in traditional Medicaid.
Key provisions under the ACA as well as other policy developments discussed above could present significant opportunities to address IPV, for both women living with HIV as well as those at risk. At the same time, efforts to eliminate all or parts of the ACA could remove many of these protections.
Appendix
Appendix Table 1: Resources for Addressing Intimate Partner Violence
E. L. Machtinger, J. E. Haberer, T. C. Wilson, and D. S. Weiss. Recent Trauma is Associated with Antiretroviral Failure and HIV Transmission Risk Behavior Among HIV-Positive Women and Female-Identified Transgenders, AIDS and Behavior. 16:8(2012): 2160–2170. ↩︎
A.C. Gielen, K.A. McDonnell, J. G. Burke, and P. O’Campo. Women’s Lives After an HIV-Positive Diagnosis: Disclosure and Violence. Maternal and Child Health Journal. 4:2(2000):111-119. ↩︎
E. L. Machtinger, T. C. Wilson, J. E. Haberer, and D. S. Weiss, Psychological Trauma and PTSD in HIV-Positive Women: A Meta-Analysis, AIDS and Behavior. 16:8(2012): 2091-2100. ↩︎
R. A. C. Siemieniuk, et al. The Clinical Implications of High Rates of Intimate Partner Violence Against HIV-Positive Women. JAIDS: Journal of Acquired Immune Deficiency Syndromes. 64:1(2013): 32-38. ↩︎
E. L. Machtinger, J. E. Haberer, T. C. Wilson, and D. S. Weiss. Recent Trauma is Associated with Antiretroviral Failure and HIV Transmission Risk Behavior Among HIV-Positive Women and Female-Identified Transgenders, AIDS and Behavior. 16:8(2012): 2160–2170. ↩︎
S. Zierler, et al. “Violence Victimization After HIV Infection in a U.S. Probability Sample of Adult Patients in Primary Care.” American Journal of Public Health. 90:2(2000): 208-215. ↩︎
E. L. Machtinger, T. C. Wilson, J. E. Haberer, and D. S. Weiss. “Psychological Trauma and PTSD in HIV-Positive Women: A Meta-Analysis.” AIDS and Behavior. 16:8(2012): 2091-2100. ↩︎
M. Okuda, et al, Mental Health of Victims of Intimate Partner Violence: Results From a National Epidemiologic Survey, Psychiatric Services. 62:8 (2011),959-62. ↩︎
G. Dillon, R. Hussain, D. Loxton, and S. Rahman, Mental and Physical Health and Intimate Partner Violence Against Women: A Review of the Literature, International Journal of Family Medicine, vol.2013. ↩︎
E. L. Machtinger, T. C. Wilson, J. E. Haberer, and D. S. Weiss, Psychological Trauma and PTSD in HIV-Positive Women: A Meta-Analysis, AIDS and Behavior. 16:8(2012): 2091-2100. ↩︎
The latest partnership survey from the Kaiser Family Foundation and The Washington Post examines the public’s views, awareness, and preferences related to climate change. The poll assesses the public’s belief in whether human activity is causing the climate to change, as well as levels of concern and support for policy solutions to address climate change. It also probes the public’s willingness to accept the types of trade-offs that are associated with policy solutions, and finds that there are limits to public support and engagement on this issue. A companion survey of U.S. teens explores how this age group views the issue of climate change and its potential impact on their generation.
This survey is the 34th in a series of surveys dating back to 1995 that have been conducted as a part of The Washington Post/Kaiser Family Foundation Survey Project.
The latest partnership survey from the Kaiser Family Foundation and The Washington Post examines the public’s views, awareness, and preferences related to climate change. Like surveys conducted by other organizations, our poll finds high levels of concern and support for policy solutions to address climate change. In this poll, we also probed the public’s willingness to accept the types of trade-offs that are inevitably associated with policy solutions, and find that there are limits to public support and engagement on this issue. The poll finds that eight in ten U.S. adults believe that human activity is causing changes to the world’s climate, and two-thirds think the U.S. government is doing too little to reduce greenhouse gas emissions. Yet while many see climate change as an urgent issue, most are not discussing it often with their family and friends, and most are not willing to make personal sacrifices such as paying higher taxes at the gas pump or on their electric bills. While majorities of Democrats, Republicans, and independents agree that human-caused climate change is happening, there are large divisions in how partisans view the urgency of the issue and potential solutions.
1 in 4 Americans donated money to charity or otherwise acted to express their climate change views. 1 in 4 teens took part in a climate-change protest, rally or school walkout, or otherwise engaged on the issue. More in new @KFF/@WashingtonPost poll
The survey also included a sample of U.S. teens ages 13-17, and finds that most teens view climate change as an important issue. However, rather than standing out as a singularly important issue for teens, it is one of many issues they view as important. About one quarter of teens report engaging politically on the issue of climate change (by participating in a protest or school walk-out, or contacting a government official), but teens are less likely than adults to say they regularly discuss the topic with friends.
This survey is the 34th in a series of surveys dating back to 1995 that have been conducted as a part of The Washington Post/Kaiser Family Foundation Survey Project.
Key Findings
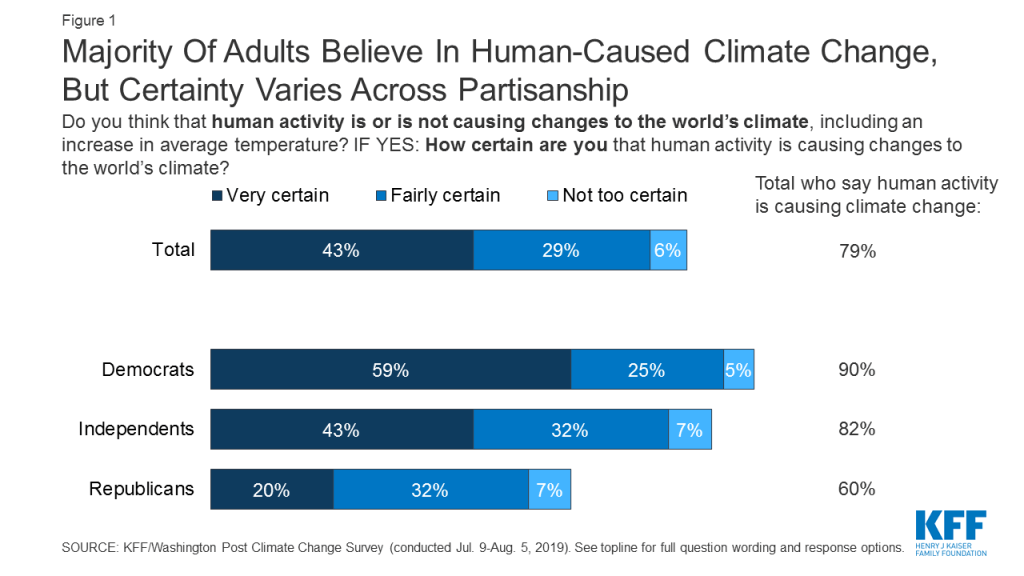
Majorities of U.S. adults across parties believe human-caused climate change is happening, but Republicans are much more doubtful about the seriousness of the problem. Large majorities of Democrats (90%) and independents (82%) and a solid majority of Republicans (60%) agree that human activity is causing changes to the world’s climate, including an increase in average temperature. However, Democrats and independents are much more likely to be firm in their beliefs: 59% of Democrats and 43% of independents say they are very certain that human activity is causing climate change, compared to one in five Republicans. Moreover, a majority (56%) of Republicans say that when it comes to what is said in the news, the seriousness of global warming and climate change is generally exaggerated, while most Democrats say the seriousness of the problem is generally correct (48%) or generally underestimated (46%).
Figure 1: Majority Of Adults Believe In Human-Caused Climate Change, But Certainty Varies Across Partisanship
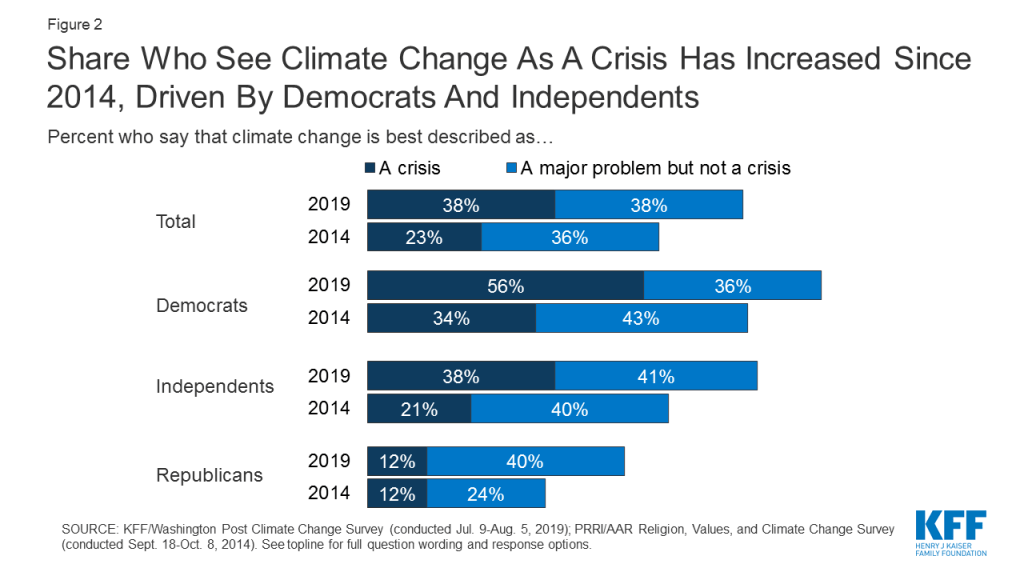
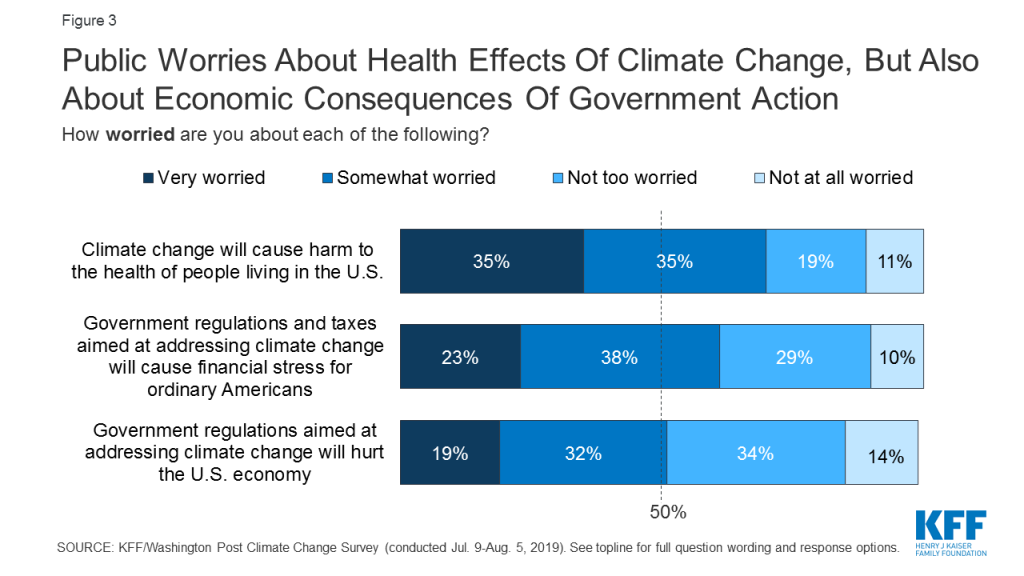
There are signs of increasing urgency around climate change, but also skepticism of government intervention. Thirty-eight percent of the public now calls climate change a “crisis,” up from 23% in a PRRI poll from 2014, driven by an increase among Democrats and independents. About half (52%) think that people need to act within the next 10 years to prevent the worst effects of climate change, or that it is already too late. Seven in ten are worried that climate change will cause harm to the health of people living in the U.S., and majorities say that businesses and corporations (72%), the U.S. government (67%), energy companies (65%), and their state government (60%) are doing too little to reduce greenhouse gas emissions. Despite this apparent sense of urgency and desire for action, people are skeptical of government intervention. Six in ten are worried that government regulations and taxes aimed at addressing climate change will cause financial stress for ordinary Americans, and about half (51%) are worried such government intervention will hurt the U.S. economy.
Figure 2: Share Who See Climate Change As A Crisis Has Increased Since 2014, Driven By Democrats And IndependentsFigure 3: Public Worries About Health Effects Of Climate Change, But Also About Economic Consequences Of Government Action
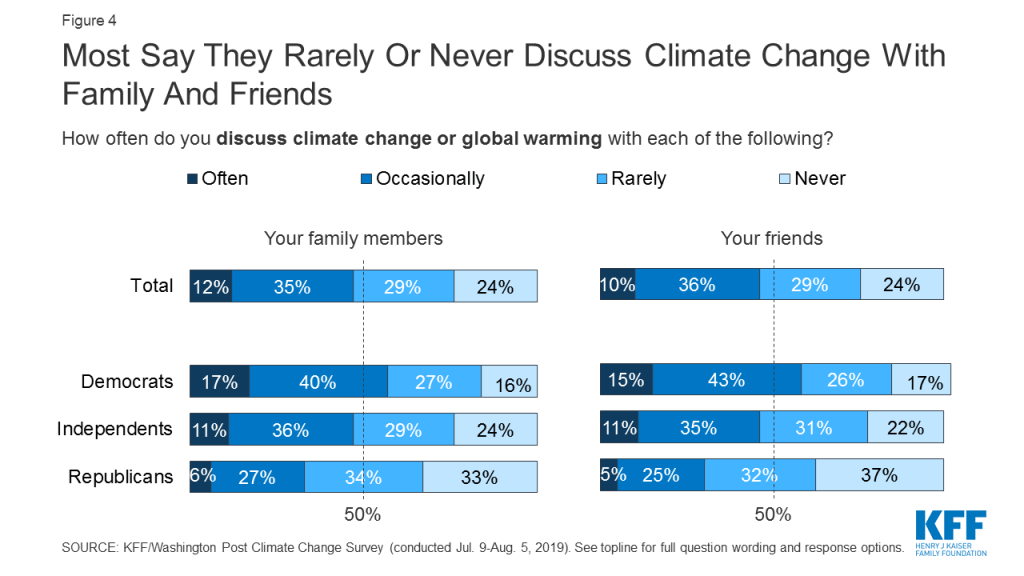
Climate change is not a frequent subject of dinner table conversations for most Americans, and few adults report any political engagement on the issue. About half of adults say they rarely or never discuss climate change with their family members (53%) or friends (54%), and just about one in ten say they often discuss the topic with either group (12% and 10%, respectively). Small shares say they have donated money to a charity working to address climate change (17%), contacted a government official (12%), or participated in a protest, rally, or other event (9%) to express their views on climate change.
Figure 4: Most Say They Rarely Or Never Discuss Climate Change With Family And Friends
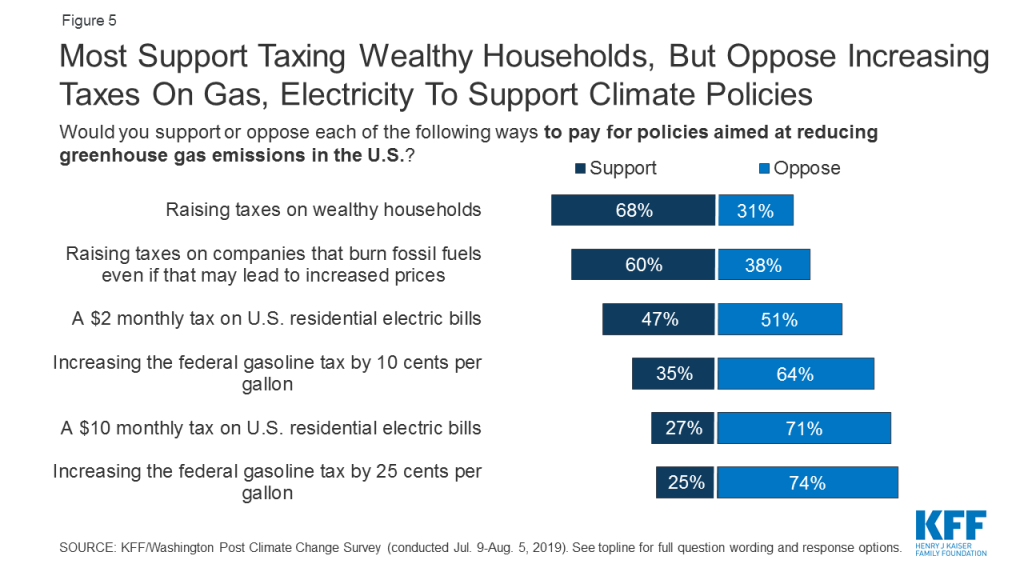
Few U.S. adults are willing to make personal sacrifices in the form of higher gas or electricity taxes in order to address climate change. Fewer than four in ten adults (37%) think that reducing the negative effects of global warming and climate change will require major sacrifices from ordinary Americans, while a plurality (48%) think it will require minor sacrifices and 14% say it won’t require much sacrifice at all. Majorities are willing to support raising taxes on wealthy households (68%) and on companies that burn fossil fuels, even if it may lead to increased electricity and transportation prices (60%), as ways to pay for policies aimed at reducing U.S. greenhouse gas emissions. But when it comes to taxes that are likely to hit consumers’ pocketbooks, support is much lower. About half (51%) oppose a $2 monthly tax on U.S. residential electric bills, and seven in ten (71%) are opposed to such a tax at the $10 a month level. Similarly, majorities oppose increasing the federal gasoline tax by 10 cents or 25 cents per gallon (64% and 74%, respectively). There are partisan divisions, but even majorities of Democrats oppose a $10 monthly electricity tax (60%) and a 25-cent per gallon gasoline tax (63%).
Figure 5: Most Support Taxing Wealthy Households, But Oppose Increasing Taxes On Gas, Electricity To Support Climate Policies
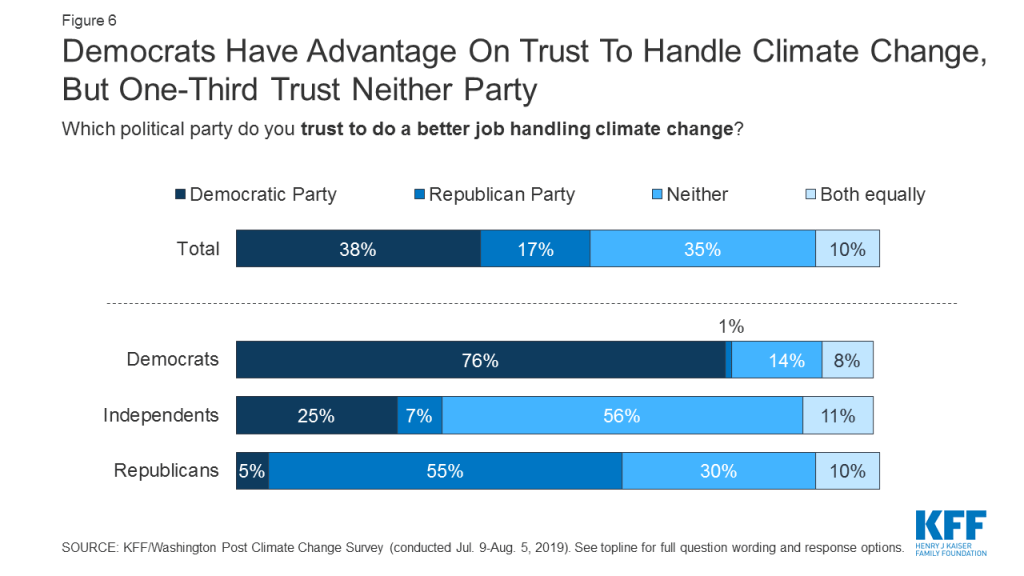
Democrats have an edge over Republicans when it comes to the issue of climate change, though majorities say both parties are doing too little. Democrats have a 21-percentage point advantage over Republicans in trust to handle climate change (38% vs. 17%), though a substantial 35% of the public say they trust neither party. Notably, majorities say that President Trump (66%), the Republican Party (69%), and the Democratic Party (56%) are doing too little to reduce greenhouse gas emissions. Two-thirds (67%) disapprove of President Trump’s handling of climate change (his lowest rating out of six issues tested), and a similar share (66%) disapprove of his plan to roll back fuel efficiency standards put in place by the Obama administration.
Figure 6: Democrats Have Advantage On Trust To Handle Climate Change, But One-Third Trust Neither Party
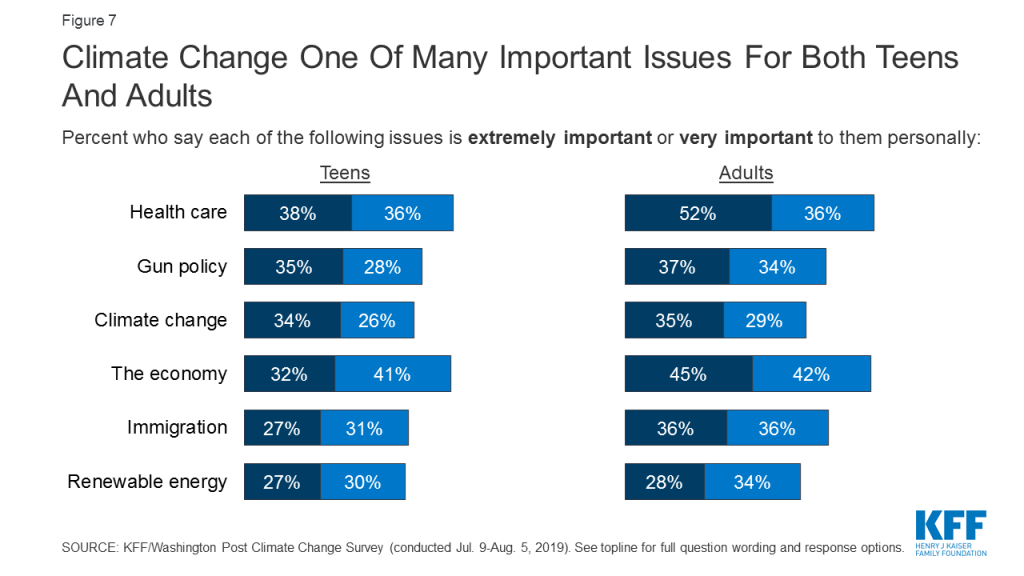
While most U.S. teens see climate change as an important issue, it does not stand out as a singular defining issue for their generation. Like adults, a large majority of teens (86%) believe that human-caused climate change is happening, though just under half (46%) are very certain. Six in ten teenagers (61%) say the issue of climate change is very or extremely important to them personally, making it one of many issues that teens view as important. Notably, about a third of teens (34%) say climate change is an extremely important issue, but rather than standing out as the top issue for teens, climate change ranks similarly to health care (38%), gun policy (35%), and the economy (32%). Teens (39%) and young adults ages 18-29 (43%) are about 10 percentage points more likely than adults ages 30 and older to say climate change will cause a great deal of harm to people in their generation. But like adults, teens are more likely to see climate change as a problem affecting future generations rather than their own (63% of teens and 60% of adults say future generations will be harmed a great deal).
Figure 7: Climate Change One Of Many Important Issues For Both Teens And Adults
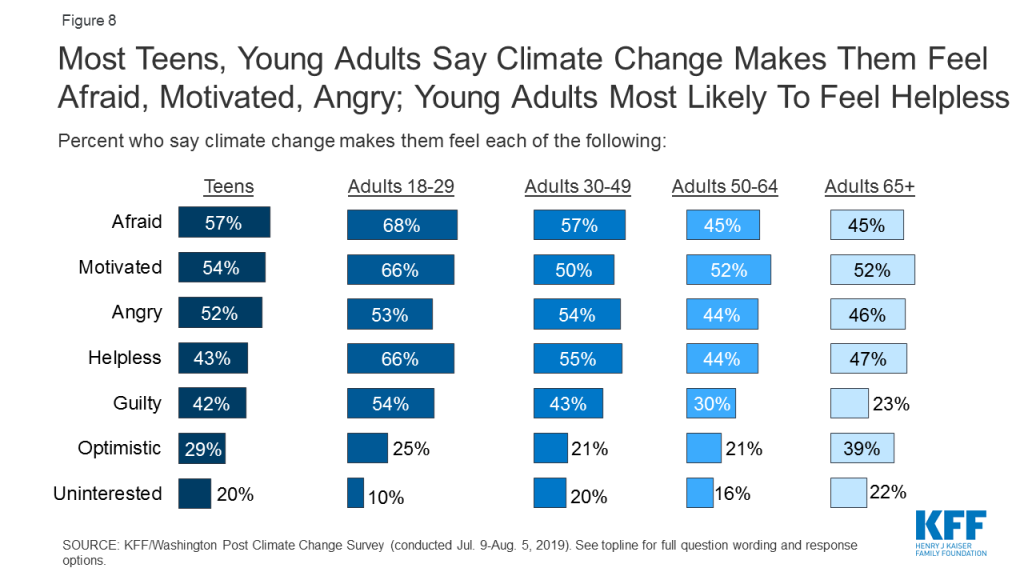
The issue of climate change evokes a variety of emotions for teens, though young adults are even more likely than teens to say they feel afraid, motivated, helpless, and guilty. Majorities of teens say the issue of climate change makes them feel “afraid” (57%), “motivated” (54%), and “angry” (52%). About four in ten (43%) say they feel “helpless” (vs. 53% of adults), while a smaller share (29%) say they feel “optimistic.” Young adults ages 18-29 are the age group most likely to express a variety of emotions when it comes to climate change, including “afraid” (68%), “motivated” (66%), “helpless” (66%), and “guilty” (54%). Like adults, most teens say they rarely or never discuss climate change with their family. Moreover, teens are 8 percentage points less likely than adults to say they at least occasionally discuss the issue with friends (38% vs. 46%).
Figure 8: Most Teens, Young Adults Say Climate Change Makes Them Feel Afraid, Motivated, Angry; Young Adults Most Likely To Feel Helpless
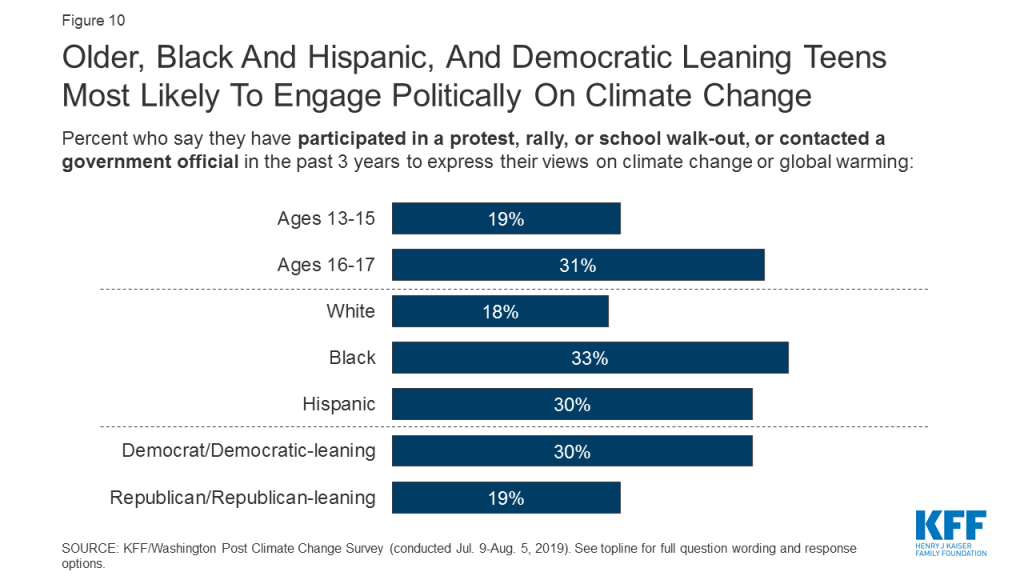
Most teens feel they can make a difference when it comes to climate change, and about a quarter report engaging politically on the issue. Almost two-thirds of teens who believe in human-caused climate change (55% of all teens) say they feel that there are things they can do personally to make a difference when it comes to reducing the effects of climate change. About four in ten teens (41%) say they have taken action to reduce their own carbon footprint. In addition, about one-quarter report engaging in some type of political action in the past 3 years to express their views on climate change; this includes 15% who say they’ve participated in a school walk-out, 13% who have participated in a protest or rally, and 12% who have contacted a government official. Some groups of teens are more likely than others to report engaging in political action around climate change, including those who are Black (33%) or Hispanic (30%), older teens ages 16-17 (31%), and those who identify as Democrats or lean Democratic (30%).
Figure 9: About One In Four Teens Say They Have Taken Some Action To Express Their Views On Climate Change In Past Three Years
Hispanic teens (and to a lesser extent, Black teens) stand out as particularly concerned and particularly active on the issue of climate change. In addition to being more likely to engage in political action, Black (37%) and Hispanic (41%) teens are more likely than White teens (24%) to think people need to act within the next year or two in order to prevent the worst effects of climate change. Hispanic teens (44%) are also more likely than White (32%) or Black (25%) teens to say climate change is an extremely important issue to them personally. Furthermore, Hispanic teens are more likely than White teens to say the issue makes them feel afraid (65% vs. 53%), angry (61% vs. 48%), guilty (51% vs. 38%), and helpless (50% vs. 39%).
Figure 10: Older, Black And Hispanic, And Democratic Leaning Teens Most Likely To Engage Politically On Climate Change
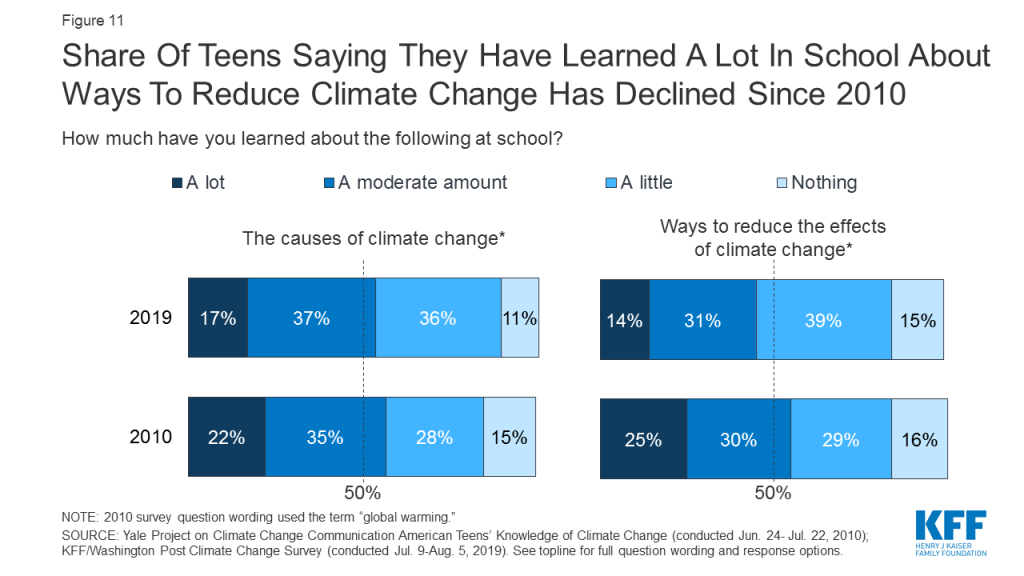
About half of teens say they have learned about the causes of climate change in school, yet some misconceptions about major contributors to climate change remain. Fifty-four percent of teens say they have learned at least a moderate amount about the causes of climate change in school, while 46% say they have learned about ways to reduce the effects of climate change. The share saying they have learned “a lot” about ways to reduce the effects of climate change has decreased somewhat since a similar survey of teens conducted in 2010 (from 25% to 14%). Six in ten teens recognize deforestation (62%), cars and trucks (62%), and burning fossil fuels for heat and electricity (61%) as major contributors to climate change, while fewer recognize airplane travel (30%) and cattle farming (18%) as major contributors. At the same time, about four in ten teens (39%) mistakenly believe that “the sun getting hotter” is a major contributor to climate change, and one in five think volcanic eruptions are a major contributor.
Figure 11: Share Of Teens Saying They Have Learned A Lot In School About Ways To Reduce Climate Change Has Declined Since 2010
Views On The Green New Deal
In February 2019, Representative Alexandria Ocasio-Cortez of New York and Senator Edward J. Markey of Massachusetts introduced the Green New Deal resolution calling on the federal government to dramatically reduce fossil fuel use and guarantee clean energy jobs. The survey finds that few Americans are familiar with the Green New Deal, though Republicans are more likely to have heard about it than Democrats. While the public likes many of the proposal’s goals, they oppose the increase in federal spending that would likely be needed to support them.
The Green New Deal is largely unknown to the public, with just about one in five saying they have heard a great deal (7%) or a good amount (15%) about the proposal. Republicans (33%) are twice as likely as Democrats (16%) to say they’ve heard at least a good amount, suggesting that anti-Green New Deal messaging has gotten more exposure than supportive messaging at this point.
Figure 1: Most Have Heard Little To Nothing About The Green New Deal
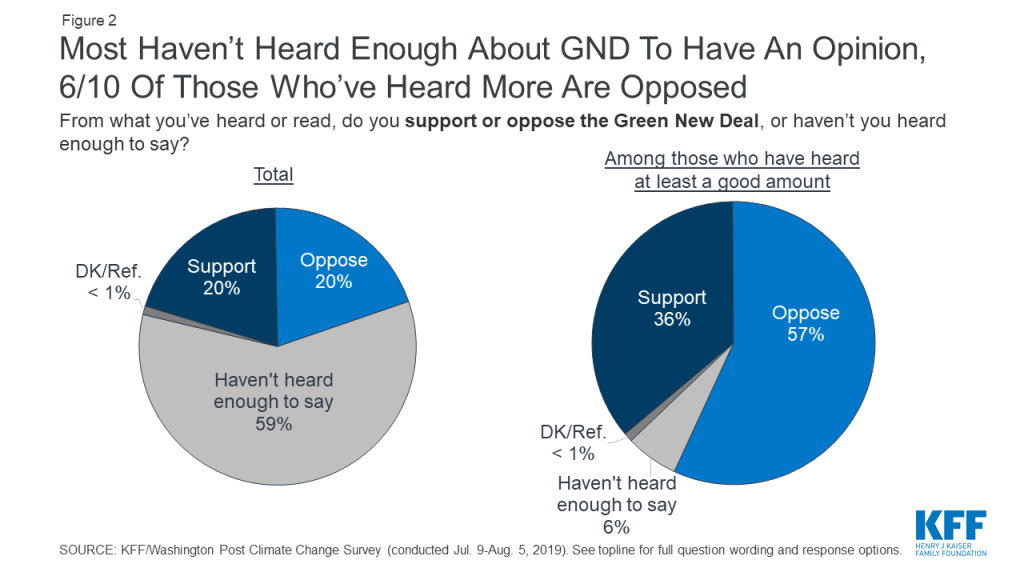
Six in ten adults (59%) say they haven’t heard enough to have an opinion of the Green New Deal, but among those who’ve heard at least a good amount, nearly six in ten are opposed.
Figure 2: Most Haven’t Heard Enough About GND To Have An Opinion, 6/10 Of Those Who’ve Heard More Are Opposed
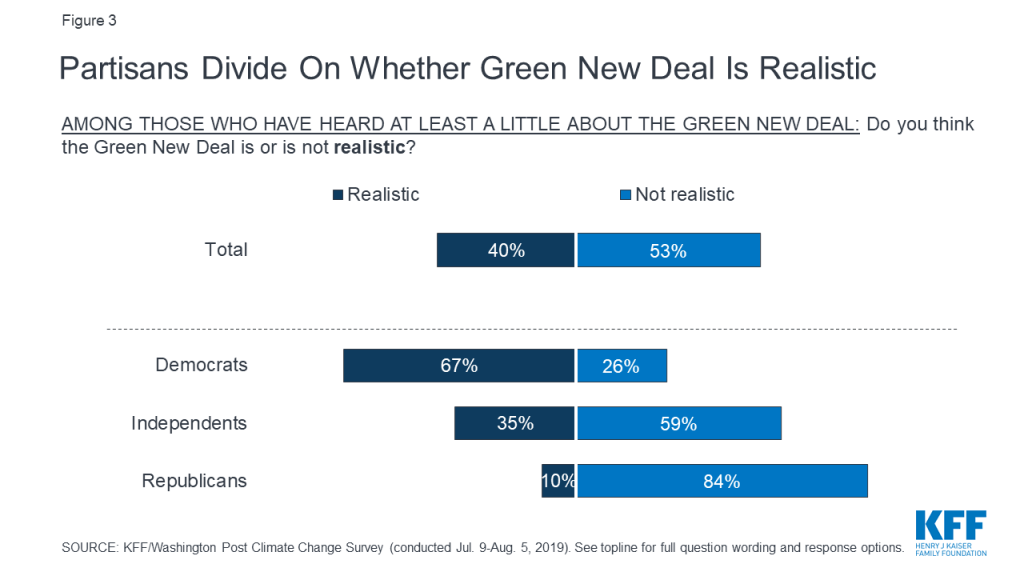
Among those who’ve heard at least a little about the Green New Deal proposal, four in ten say it’s realistic and just over half (53%) say it’s not realistic, including 26% of Democrats, 59% of independents, and 84% of Republicans.
Figure 3: Partisans Divide On Whether Green New Deal Is Realistic
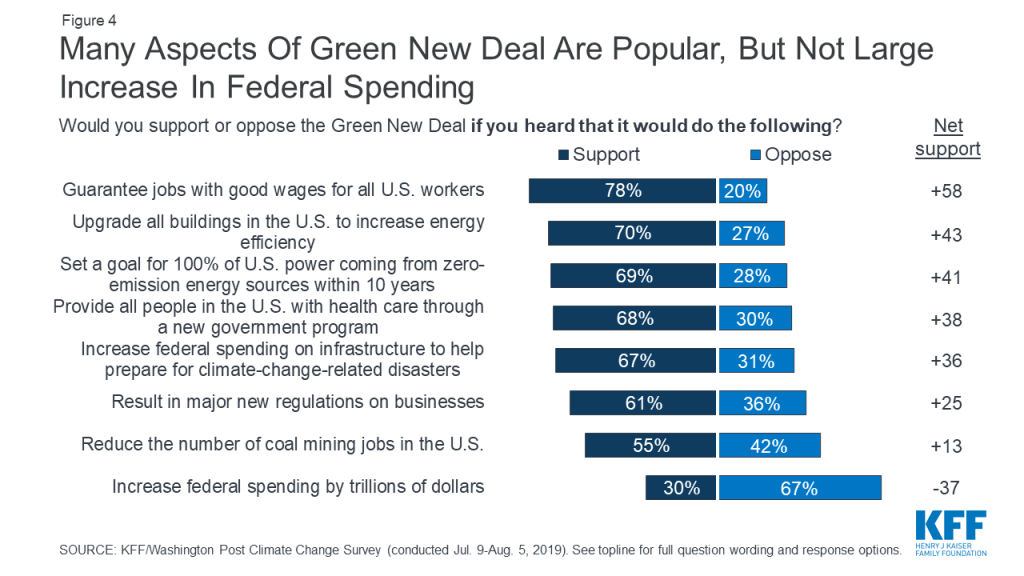
Substantial majorities of the public say they would support the Green New Deal if they heard it would guarantee jobs with good wages for all U.S. workers (78%), upgrade all buildings in the U.S. to increase energy efficiency (70%), set a goal for 100% of U.S. power coming from zero-emission energy sources within ten years (69%), provide all people in the U.S. with health care through a new government program (68%), and increase federal spending on infrastructure to help communities prepare for climate change-related disasters (67%). Yet support drops to just 30% if the proposal would increase federal spending by trillions of dollars.
Figure 4: Many Aspects Of Green New Deal Are Popular, But Not Large Increase In Federal Spending
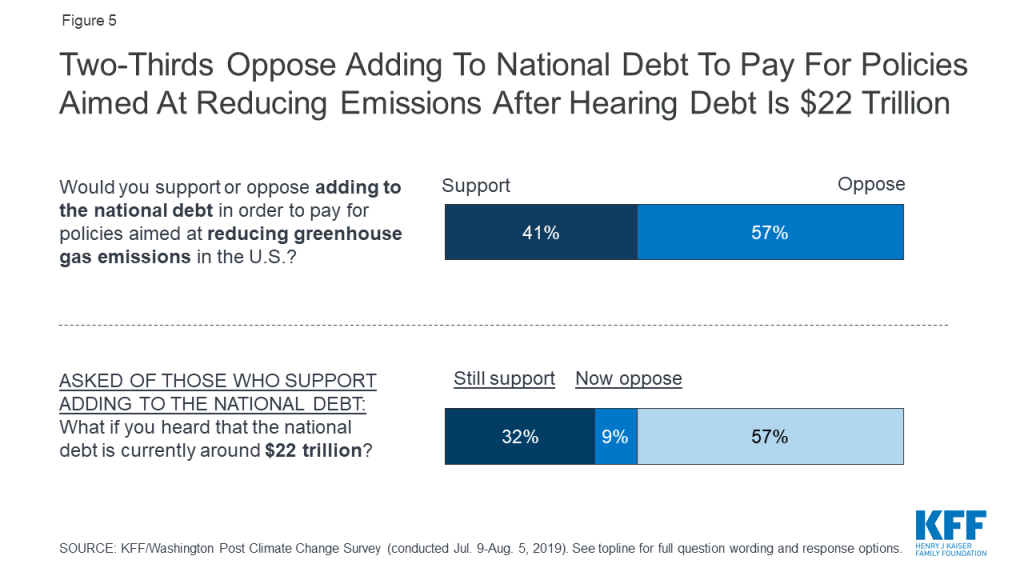
There does not appear to be an appetite among the public for increasing the national debt in order to pay for climate-related policies such as the Green New Deal. Nearly six in ten (57%) say they oppose adding to the national debt in order to pay for policies aimed at reducing greenhouse gas emissions in the U.S., rising to 66% when initial supporters are told that the debt currently stands at around $22 trillion.
Figure 5: Two-Thirds Oppose Adding To National Debt To Pay For Policies Aimed At Reducing Emissions After Hearing Debt Is $22 Trillion
Politics And Regional Differences
Many previous surveys have found that Americans’ views on climate change divide along partisan lines. In this survey, we explore how those divisions relate to political preferences, and also how partisanship interacts with people’s views of the role of climate change in extreme weather events. This section takes advantage of a unique element of this survey: the oversample of people living in several regions of the U.S. that have experienced extreme weather events like hurricanes, flooding, drought, and wildfires over the past several years.
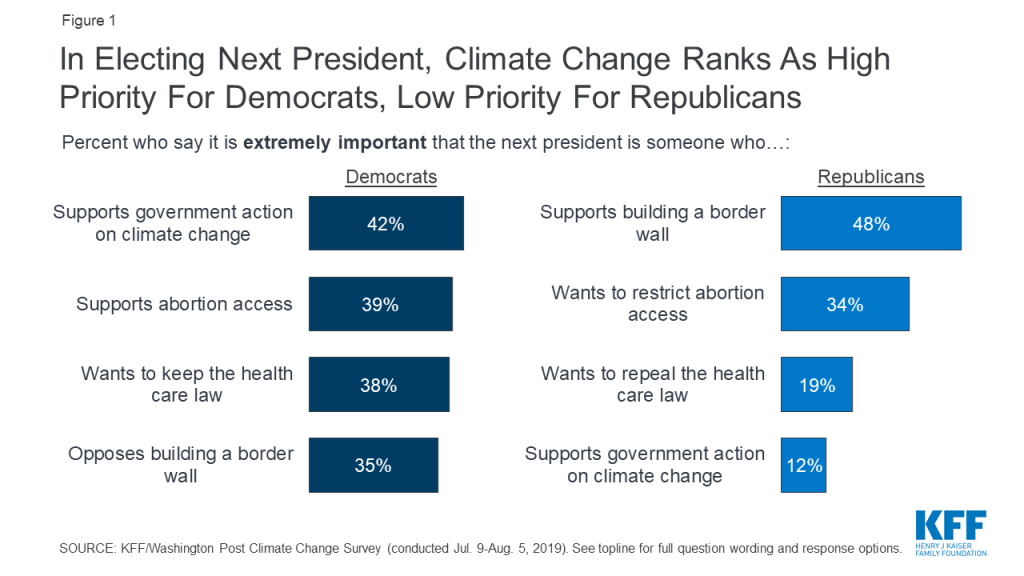
Majorities across parties say they want the next president to support government action on climate change, but it’s a much lower priority for Republicans than for Democrats. Large majorities of Democrats (91%) and independents (79%), and even a slim majority of Republicans (53%), say that they would like the next president to be someone who favors government action on climate change, suggesting that President Trump’s position on the issue is out of step with the mainstream. However, while 42% of Democrats see this as an extremely important issue to their vote – putting it on par with issues like abortion access (39%) and preserving the ACA (38%) – just 12% of Republicans say the same, ranking it far behind issues like support for a border wall (48%) and restricting abortion access (34%).
Figure 1: In Electing Next President, Climate Change Ranks As High Priority For Democrats, Low Priority For Republicans
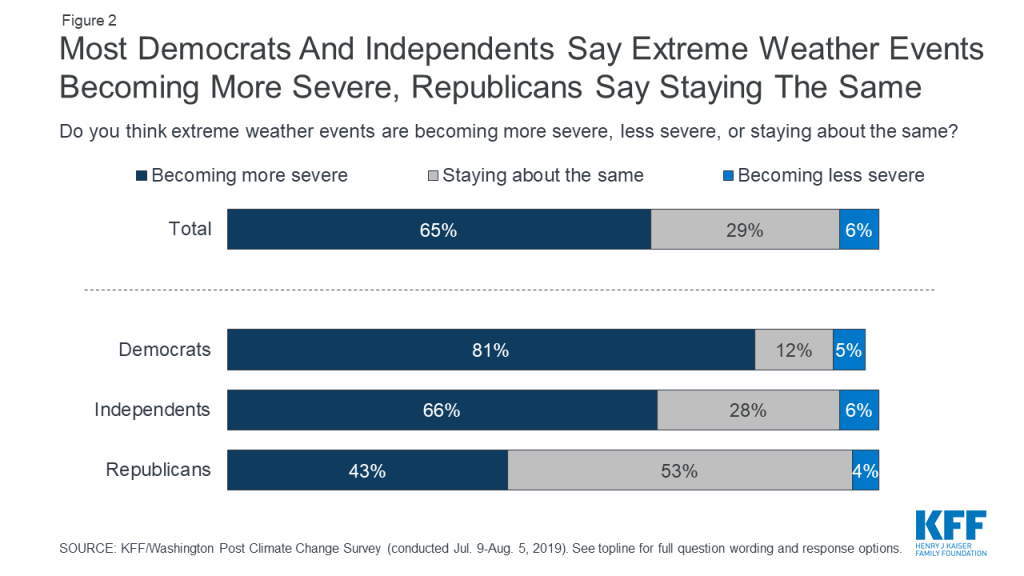
Nationally and across regions, Democrats and Republicans have very different views of severe weather events in their area and the role climate change plays. Nationwide, about two-thirds (65%) of adults think extreme weather events are becoming more severe, but this masks a massive partisan difference, with Democrats almost twice as likely as Republicans to believe this is the case (81% vs. 43%).
Figure 2: Most Democrats And Independents Say Extreme Weather Events Becoming More Severe, Republicans Say Staying The Same
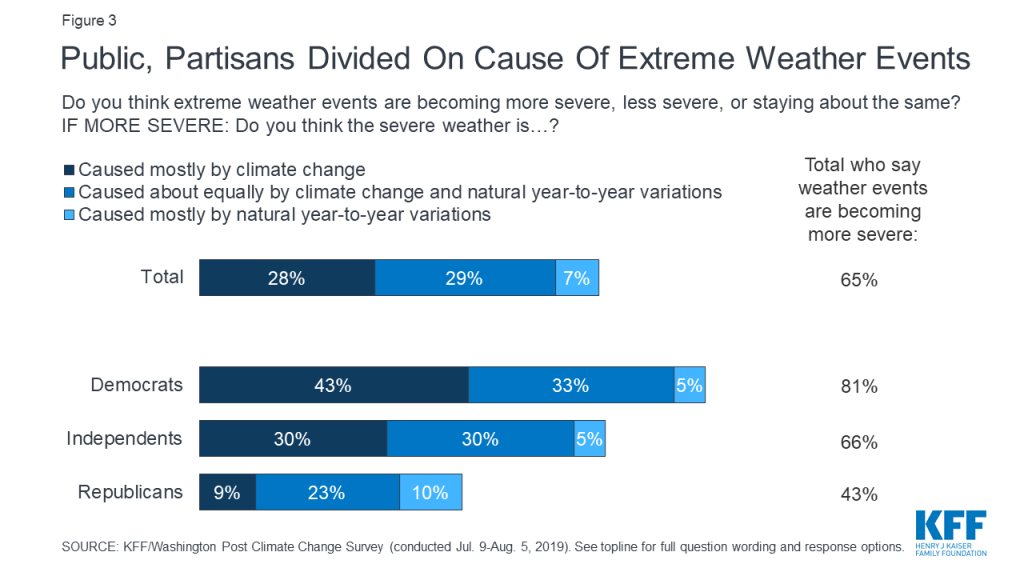
The partisan divide on views of extreme weather is even starker when looking at the share who believe weather is becoming more severe and that climate change is mostly to blame: 43% of Democrats versus 9% of Republicans think this is true.
Figure 3: Public, Partisans Divided On Cause Of Extreme Weather Events
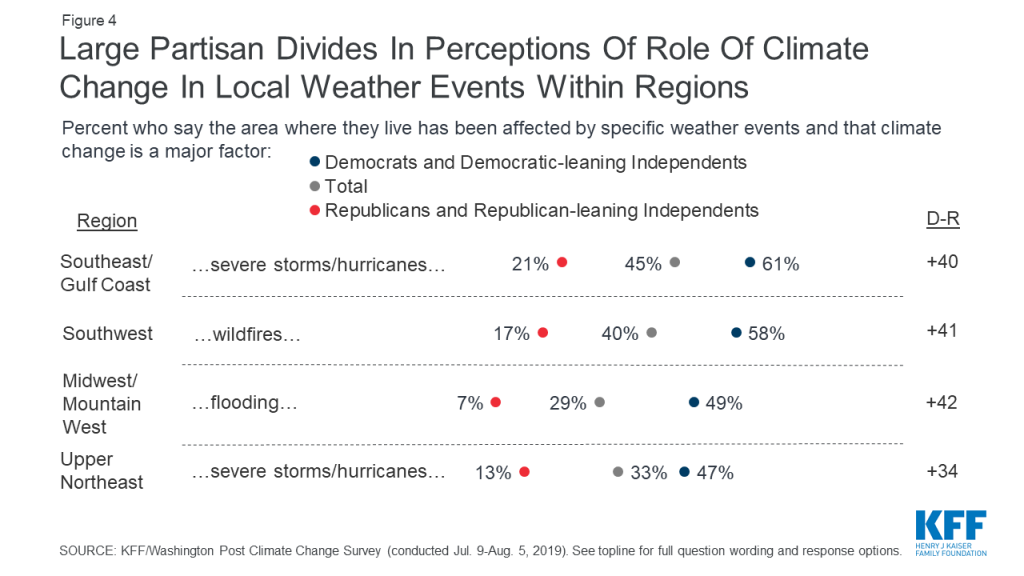
Partisan gaps also exist in perceptions of extreme weather in one’s own local area. When drilling down into regions that have been hard hit by extreme weather events, there are huge partisan gaps in attitudes about climate change’s role in these events. For example, in the Southwest, 58% of Democrats and Democrat-leaning independents versus just 17% of Republicans and Republican-leaning independents say that the area where they live has experienced wildfires in the past 5 years and that climate change is a major factor causing these fires. Similarly, in the Southeast/Gulf Coast region, those who identify as or lean Democrat are about three times as likely as Republican-leaners to say climate change is a major factor contributing to severe storms such as hurricanes in their area in the past 5 years (61% vs. 21%)1 .
Figure 4: Large Partisan Divides In Perceptions Of Role Of Climate Change In Local Weather Events Within Regions
Knowledge And Actions
What does the public understand about the major contributors to climate change, and what actions do they report taking to reduce their own carbon footprints?
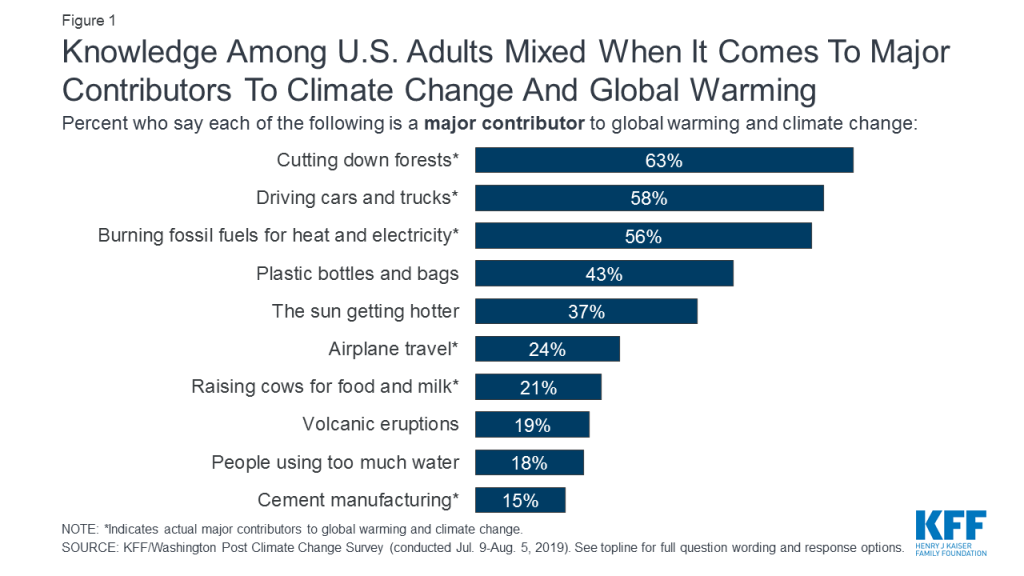
Most adults have a pretty good gauge on the major contributors to climate change, but some misperceptions exist. Majorities of the public recognize deforestation (63%), automobiles (58%), and burning fossil fuels for heat and electricity (56%) as major causes of climate change. Fewer recognize the major contribution of airplane travel (24%), cattle farming (21%), and cement manufacturing (15%). On the other hand, 43% think that plastic bottles and bags are a major contributor to climate change, when in fact they play more of a minor role compared to other factors. Substantial shares think other non-related factors such as “the sun getting hotter” (37%), volcanic eruptions (19%), and water usage (18%) are major contributors.
Figure 1: Knowledge Among U.S. Adults Mixed When It Comes To Major Contributors To Climate Change And Global Warming
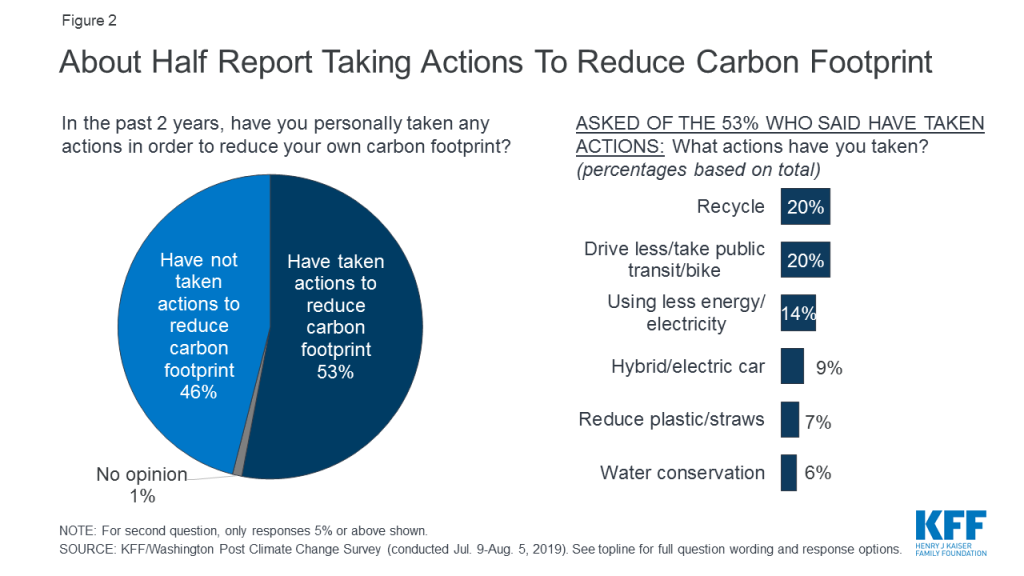
About half of adults say they have taken action to reduce their own carbon footprint, with a range of actions reported. About half (53%) of U.S. adults say they have taken actions to reduce their own carbon footprint in the past 2 years. Some of the actions people report taking target the major contributors of climate change: 20% report driving less, 14% use less electricity at home, 9% use a more fuel-efficient car, and 3% purchase electricity from a renewable source. However, some report actions that, while good for the environment, are less likely to make a major dent in climate change: 20% say they recycle, 7% reduce plastic use, 6% mention conserving water, and 4% mention using reusable items like bags, containers, and straws.
Figure 2: About Half Report Taking Actions To Reduce Carbon Footprint
Methodology
The Washington Post-Kaiser Family Foundation Survey Project is a partnership combining survey research and reporting to better inform the public. The Post-KFF Climate Change Survey, the 34th in the series, was conducted with a probability-based sample of 2,293 adults ages 18 and over and 629 teens between the ages of 13 and 17. Interviews were administered online and by telephone from July 9 through August 5, 2019 in English and Spanish.
NORC at the University of Chicago conducted sampling, interviewing, and tabulation for the survey using the AmeriSpeak Panel, a representative panel of adults age 18 and over living in the United States. AmeriSpeak Panel members are recruited through probability sampling methods using the NORC National Sample Frame, an address-based sampling frame. Panel members who do not have internet access complete surveys via telephone, and internet users complete surveys via the web (for the current study, 303 adults and 8 teens completed via phone; 1,990 adults and 621 teens via web). In order to allow for separate regional analysis, adult panelists living in the following regions were selected at disproportionately higher rates: Southwest (Arizona, New Mexico, Nevada, Utah, Colorado); Upper Mountain West/Midwest (Minnesota, North Dakota, South Dakota, Montana, Idaho); New England (Maine, New Hampshire, Vermont, Massachusetts, Connecticut, Rhode Island); and Southeast (Florida, Georgia, South Carolina, North Carolina, Alabama, Mississippi, Louisiana, Texas gulf coast counties: Orange, Jefferson, Chambers, Galveston, Harris, Brazoria, Matagorda, Jackson, Calhoun, Victoria, Refugio, Aransas, San Patricio, Nueces, Kleberg, Kenedy, Willacy, Cameron).
Fully enrolled teens (i.e., those for whom NORC has obtained parent consent, teen assent, and a complete teen profile) were eligible for sampling and recruitment from NORC’s AmeriSpeak Teen Panel, a probability-based panel of teens recruited via parents in the AmeriSpeak adult panel.
The combined results for teens and adults have been adjusted to weight oversampled geographic areas back to their accurate share of the adult population and to account for systematic nonresponse along known population parameters.
For adults, the first weighting stage made adjustments to account for the regional oversampling and for differential nonresponse to the survey screening interview. In the second weighting stage, the sample was adjusted to match known demographic distributions of the U.S. population using the following parameters: age, sex, education, race/ethnicity, and Census Division. Interviews in the oversampled regions were also weighted to match demographics within those regions. Region-level population benchmarks were obtained from the U.S. Census Bureau’s American Fact Finder for race/ethnicity and from the U.S. Census Bureau’s 2017 American Community Survey (ACS) for all other benchmarks.
The teen sample was weighted using a similar procedure, except that there was no regional oversampling for the teen sample so no oversample adjustment was needed. Demographic benchmarks for teens were obtained from the 2017 ACS for age, sex, parents’ highest education, race/ethnicity, and Census Division.
The margin of sampling error including the design effect for the full sample is plus or minus 3 percentage points for adults and 5 percentage points for teens. All statistical tests of significance account for the effect of weighting. For results based on other subgroups, the margin of sampling error may be higher. Sample sizes and margins of sampling error for other subgroups are available by request. Note that sampling error is only one of many potential sources of error in this or any other public opinion poll.
This questionnaire was administered with the exact questions in the exact order as appears in this document; question numbering may not be sequential. If a question was asked of a reduced base of the sample, a parenthetical preceding the question identifies the group asked.
The Kaiser Family Foundation and The Washington Post paid for the survey and representatives of The Washington Post and the Kaiser Family Foundation worked together to develop the survey questionnaire and analyze the results. Each organization bears the sole responsibility for the work that appears under its name. The project team from the Kaiser Family Foundation included: Mollyann Brodie, Ph.D., Liz Hamel, Lunna Lopes, and Cailey Muñana. The project team from The Washington Post included: Scott Clement and Emily Guskin. Both The Washington Post and the Kaiser Family Foundation Public Opinion and Survey Research team are charter members of the Transparency Initiative of the American Association for Public Opinion Research.
Endnotes
Southwest includes California, Arizona, New Mexico, Nevada, Utah, and Colorado. Upper Mountain West/Midwest includes Minnesota, North Dakota, South Dakota, Montana, Idaho. Upper Northeast includes Maine, New Hampshire, Vermont, Massachusetts, Connecticut, Rhode Island, New York, and New Jersey. Southeast includes Florida, Georgia, South Carolina, North Carolina, Alabama, Mississippi, Louisiana, and the gulf coast counties of Texas (Orange, Jefferson, Chambers, Galveston, Harris, Brazoria, Matagorda, Jackson, Calhoun, Victoria, Refugio, Aransas, San Patricio, Nueces, Kleberg, Kenedy, Willacy, and Cameron counties). ↩︎
The affordability of prescription drugs is a pressing concern for many Americans, with broad agreement across the political spectrum that lowering prescription drug costs should be a top priority for Congress. The Trump Administration has put forward several proposals to address high and rising drug prices. Virtually all of the 2020 presidential candidates support efforts to lower drug prices1 , and key Congressional committees have marked-up legislation. Many of these proposals would directly affect prescription drug spending under Medicare, which accounts for 30 percent of national retail spending on drugs and nearly $1 out of every $5 in total Medicare spending (Figure 1).
Figure 1: Medicare Accounts for 30% of Total Retail Prescription Drug Spending in the U.S.
Prescription drugs are an important component of health care for Medicare beneficiaries, which includes more than 60 million older adults and people with long-term disabilities. The majority of Medicare prescription drug spending is for drugs covered under Part D, the outpatient prescription drug benefit. Medicare Part B also covers drugs that are administered to patients in physician offices and other outpatient settings.
This brief describes proposed and recent changes to control Medicare drug spending and lower beneficiaries’ out-of-pocket drug costs. We include proposals from the Trump Administration and legislation introduced during the 116th Congress, including legislation passed out of the Senate Finance Committee, and legislation recently introduced by Speaker Pelosi and adopted by the committees of jurisdiction in the House (H.R. 3). We review the implications of these changes for various stakeholders and explain their estimated effects on Medicare and beneficiary spending, to the extent such effects are known, based primarily on estimates from the Congressional Budget Office (CBO).
The brief focuses on drug pricing proposals related to Medicare specifically, rather than broader proposals that are not solely focused on Medicare, including those related to drug importation, expediting generic drug availability, patents, and price transparency.2 While we have made every effort to include the most recent proposals pertaining to Medicare drug costs, policy discussions are evolving rapidly. This brief will be updated as necessary in the future.
Overview of Proposed and Recent Changes
Proposed Changes
Allow the government to negotiate drug prices
Modify the Medicare Part D benefit design
Establish an out-of-pocket spending limit and reallocate liability for catastrophic costs
Exclude manufacturer discounts from the calculation of “TrOOP”
Cap increases in Medicare drug prices to the rate of inflation
Require rebates for Part D drugs with price increases faster than inflation
Establish an inflation limit on Part B drug reimbursement growth
Use international reference pricing for drugs covered by Medicare
Make other modifications to payments for drugs covered under Part B
Modify rebates under Part D
Eliminate rebates under Part D (withdrawn by the Administration in July 2019)
Share rebates with plan sponsors and/or beneficiaries
Move coverage of some drugs from Part B to Part D
Improve coverage for low-income Part D enrollees
Eliminate cost sharing for generics for low-income subsidy enrollees
Expand eligibility for low-income subsidies
Recent Changes
Allow Medicare Advantage plans to require step therapy for Part B drugs
Modify coverage requirements for drugs in Part D protected classes
Require Part D plan sponsors to use real-time benefit tools
Under the Medicare Modernization Act of 2003 (MMA), which established the Medicare Part D drug benefit, the federal government is prohibited from engaging in price negotiation or price setting on behalf of Medicare Part D beneficiaries. The MMA includes language known as the “noninterference” clause, which stipulates that the Secretary of Health and Human Services (HHS) “may not interfere with the negotiations between drug manufacturers and pharmacies and PDP sponsors, and may not require a particular formulary or institute a price structure for the reimbursement of covered Part D drugs.” This is in contrast to how drug prices are established by other federal programs. For example, there is a statutory requirement for mandatory drug price rebates in Medicaid, and, in the Department of Veteran Affairs (VA), a drug manufacturer may not charge more than the lowest price paid by any private sector purchaser.
In the years since the enactment of the MMA, lawmakers have introduced legislation to allow Medicare to negotiate drug prices, with the goal of lowering Part D program spending and enrollees’ out-of-pocket costs. Recent public opinion polls show strong and bipartisan support for allowing the federal government to negotiate drug prices in Medicare. During the 116th Congress, several members of Congress have introduced bills that would grant the Secretary authority to negotiate drug prices for Medicare Part D. Some are stand-alone bills, while others are incorporated in broader health reform legislation, including Medicare-for-all, public plan options, and Medicare buy-in proposals. Several Democratic presidential candidates have also endorsed this approach.
This summary focuses on five bills where the primary (or sole) purpose is to allow the Secretary to negotiate drug prices:
H.R. 3, “Elijah E. Cummings Lower Drug Costs Now Act,” introduced by Speaker Pelosi and sponsored by Representatives Frank Pallone (D-NJ), Richard Neal (D-MA), and Bobby Scott (D-VA), the respective Chairmen of House Committees Energy & Commerce, Ways & Means, and Education & Labor (as passed out of Committees in October 2019)
H.R. 1046/S. 377, “Medicare Negotiation and Competitive Licensing Act,” sponsored by Representative Lloyd Doggett (D-TX) in the House and Senator Sherrod Brown (D-OH) in the Senate
H.R. 448/S. 99, ”Medicare Drug Price Negotiation Act,” sponsored by the late Representative Elijah Cummings (D-MD) in the House and Senator Bernie Sanders (I-VT) in the Senate
S. 62, “Empowering Medicare Seniors to Negotiate Drug Prices Act,” sponsored by Senator Amy Klobuchar (D-MN)3
H.R. 275, ”Medicare Prescription Drug Price Negotiation Act,” sponsored by Representative Peter Welch (D-VT)
While these bills seek to achieve the same overall goal of reducing drug prices by allowing the federal government to negotiate prices with drug manufacturers in Medicare, they take different approaches to achieve that end. The proposals vary in terms of how much direction is given to the Secretary regarding the negotiation process itself; whether any criteria are offered for which drugs and how many shall be negotiated; the factors to be considered in determining a negotiated price; provisions that aim to give the Secretary greater leverage to secure price concessions from drug manufacturers; and provisions that may apply in the event of unsuccessful negotiations.
The Pelosi legislation (H.R. 3) amends the non-interference clause under current law by adding an exception that allows for the price negotiation process established by the legislation. The negotiation process outlined in H.R. 3 would apply to a minimum of 25 and up to 250 brand-name drugs lacking generic or biosimilar competitors (including insulin), and would prioritize the 125 drugs with the highest Medicare Part D spending and 125 drugs with the highest spending in the U.S. (net of rebates). The minimum number of drugs subject to negotiation increases from 25 in the first year (2023) to 30 between 2028 and 2032 and 35 in 2033. Newly-approved drugs with prices at or above median household income may also be subject to negotiation, based on projected spending. The proposal establishes an upper limit for the negotiated price equal to 120% of the Average International Market (AIM) price paid by six economically prosperous countries (Australia, Canada, France, Germany, Japan, and the United Kingdom), and the negotiated price applies to both Medicare and commercial payers in group and individual markets. None of the other proposals explicitly mention an upper limit on the negotiated price, nor do they extend the Part D negotiated price to other payers. H.R. 3 imposes financial penalties on drug companies that do not comply with the negotiating process as well as in the event that negotiations fail. For example, manufacturers that fail to negotiate with the Secretary would face an escalating excise tax on the previous year’s gross sales of the drug in question, starting at 65% and increasing by 10% every quarter to a maximum of 95%.
The proposals introduced by Doggett/Brown (H.R. 1046/S. 377) and Cummings/Sanders (H.R. 448/S.99) call for much broader negotiations by the Secretary on behalf of Part D enrollees without defining how many drugs would be subject to negotiation, if not all Part D covered drugs. The Cummings/Sanders proposal also directs the HHS Secretary to establish a Part D formulary, a practice used by private plans in negotiating price discounts with manufacturers (not included in H.R. 3). In the event of unsuccessful negotiation between the Secretary and manufacturers, the Doggett/Brown proposal authorizes the Secretary to circumvent a manufacturer’s exclusivity rights and issue a competitive license to another manufacturer to produce a generic or biosimilar version of the drug for sale to Part D plans. The Cummings/Sanders proposal would use the lowest available price in either other federal programs or other specified countries as a fallback for the negotiated price in the event that negotiations between the Secretary and manufacturers are unsuccessful.
The legislation sponsored by Klobuchar (S. 62) and Welch (H.R. 275) simply strikes the non-interference clause, and in the case of the Welch bill, requires the Secretary to negotiate Part D drug prices, but neither proposal specifies further conditions or circumstances under which the negotiation should occur or fallback approaches in the event of unsuccessful negotiations.
The Senate Finance Committee considered an amendment to its drug pricing legislation that would have allowed the HHS Secretary to negotiate drug prices, but the amendment did not pass (12 ayes; 16 nays). The Trump Administration has not introduced its own proposal allowing HHS to negotiate drug prices in Medicare Part D, although President Trump endorsed this idea during his candidacy. (For more detail on Medicare drug price negotiation proposals, see What’s the Latest on Medicare Drug Price Negotiations?)
Budget Effects
In an October 2019 letter to Chairman Pallone, CBO provided a preliminary estimate of the effects of the drug price negotiation provisions of H.R. 3 on Medicare spending. CBO estimates the drug price negotiation provisions in H.R. 3 would achieve $345 billion in Medicare savings over the period between 2023 (the first year in which maximum fair prices would be used in Part D) and 2029. In its analysis of H.R 3, CBO indicates that the provision to levy an excise tax on drug companies that do not enter into negotiations or agree to the maximum fair price provides the Secretary with needed leverage to achieve lower drug prices and federal savings. CBO has not yet estimated the effects of H.R. 3 on private health plans, nor the effect of the negotiation provisions on out-of-pocket costs and premiums for Medicare Part D enrollees. (For more detail on CBO’s assessments of Medicare drug negotiation, see What’s the Latest on Medicare Drug Price Negotiations?)
This estimate represents a significant departure from prior estimates. In its initial assessments of the Medicare drug price negotiation concept in 2004 and 2007, CBO said that repealing the non-interference clause and allowing price negotiations between the Secretary and drug manufacturers would yield negligible savings, primarily because the Secretary would have insufficient leverage to secure price concessions; in May 2019, CBO reaffirmed its previous conclusions.
In contrast to H.R. 3 which applies pressure on drug manufacturers by imposing financial penalties on drug manufacturers that fail to negotiate with the Secretary, the Doggett/Brown bill relies instead on competitive licensing, and the Cummings/Sanders bill uses prices in other federal programs and other countries as a fallback. The degree to which these various approaches are effective in securing lower prices from drug manufacturers would have significant implications for Medicare program savings and for Medicare beneficiaries’ out-of-pocket drug costs. CBO has not yet estimated the potential savings attributable to the other bills discussed above.
Effects on Beneficiaries
In its analysis of drug price negotiation under H.R. 3, CBO expects that the lower drug prices resulting from this policy would lead to lower beneficiary premiums and cost-sharing (though CBO did not quantify the magnitude of this decrease). CBO also expects that this policy would lead to higher use of prescription drugs due to lower rates of medication non-adherence because of cost concerns. With greater medication adherence, CBO predicts this policy would lead to improved health outcomes for many beneficiaries, which would result in lower utilization and spending for other Medicare-covered services. In addition, people with private group and individual insurance would also likely see their drug costs decrease because the legislation requires manufacturers to offer the lower negotiated price to private payers or pay a civil monetary penalty.
Other Implications
CBO expects that this policy would lower revenues for drug manufacturers and lead to higher drug prices in other countries. CBO estimates that the loss in revenue for drug manufacturers would lead to lead to 8 to 15 fewer drugs coming to market over the next 10 years, of the approximately 300 drugs expected to be approved during this period. The decrease in the development of new drugs could negatively impact some beneficiaries, but CBO notes it is difficult to determine the type of drugs that would be affected and what their impact would be an overall health. For example, CBO did not specify whether these drugs would be breakthrough therapies or similar to treatments that are currently available.
The Medicare Part D standard benefit includes several phases, including a deductible, an initial benefit period, a coverage gap, and catastrophic coverage. Across these different benefit phases, the allocation of costs paid by Part D enrollees, plans, drug manufacturers, and Medicare varies.
Under the current structure of Part D, when enrollees reach the coverage gap benefit phase, they pay 25 percent of drug costs for brand-name drugs, plan sponsors pay 5 percent, and drug manufacturers provide a 70 percent price discount. The value of this discount counts towards the calculation of an enrollee’s “true out-of-pocket spending” (TrOOP), the amount used to determine when catastrophic coverage begins (at $6,350 in annual out-of-pocket spending in 2020, equivalent to an estimated $9,719 in total spending). Once enrollees pass through the coverage gap benefit phase and reach the catastrophic coverage phase, they pay 5 percent of their total drug costs, plans pay 15 percent, and Medicare pays 80 percent. The Medicare portion of catastrophic coverage costs, known as reinsurance, limits the financial risk for Part D plan sponsors associated with higher-cost enrollees.
In recent years, policymakers have expressed concerns about the absence of a hard cap on out-of-pocket spending for Part D enrollees, a significant increase in Medicare reinsurance spending, and the allocation of financial responsibility for drug costs among plan sponsors, pharmaceutical companies, the Medicare program, and Part D enrollees. The Trump Administration’s FY 2020 Budget, the Senate Finance Committee legislation, and H.R. 3 all include provisions to address this concern, with some differences.
Establish an out-of-pocket spending limit and reallocate liability for catastrophic costs
In its FY 2020 budget, the Administration proposed establishing an out-of-pocket spending limit in Part D by phasing down beneficiary coinsurance in the catastrophic phase from 5 percent to 0 percent (i.e., no cost sharing) over four years, beginning in 2020.4 The Administration’s proposal to add an out-of-pocket spending limit is paired with another proposal that would increase Part D plans’ share of catastrophic coverage costs from 15 percent to 80 percent, and decrease Medicare’s share from 80 percent to 20 percent.5,6
The Senate Finance Committee’s drug pricing legislation that was voted out of committee includes a provision to establish a cap on out-of-pocket spending and reallocate costs in the catastrophic phase. The cap on beneficiary out-of-pocket spending is initially set at $3,100 in 2022. For costs above the catastrophic threshold, the proposal reduces Medicare reinsurance payments from 80 percent to 20 percent, increases plans’ share from 15 to 60 percent, and requires drug manufacturers to pay 20 percent, instead of providing discounts in the coverage gap, which would be phased out. The proposed changes to the Medicare benefit design would be phased in over a three-year period, from 2022 to 2024.7
The drug price legislation introduced by Speaker Pelosi and voted out of three committees (H.R. 3) includes a provision to place a cap on out-of-pocket drug spending and reallocate liability for costs above the catastrophic threshold, but at somewhat different levels than the related provision in the Senate Finance Committee legislation. The cap on beneficiary out-of-pocket spending is initially set at $2,000 in 2022. For costs above the catastrophic threshold, the proposal reduces Medicare reinsurance payments from 80 percent to 20 percent, increases plans’ share from 15 to 50 percent, and requires drug manufacturers to pay 30 percent, instead of providing discounts in the coverage gap, which would be phased out. (Figure 2) Manufacturers would also be required to pay 10 percent of the costs in the initial coverage gap phase.8 As amended, H.R. 3 also includes a provision that would allow enrollees who reach the out-of-pocket cap of $2,000 in one prescription to smooth out their drug costs over the course of the year.
Figure 2: Comparison of Proposals to Modify the Allocation of Catastrophic Coverage Costs Under Medicare Part D
Budget Effects
Because the Administration’s FY 2020 budget combines proposals to add an out-of-pocket spending limit to Part D and reallocate costs for catastrophic coverage, the budget effects of these proposals are estimated together. According to CBO, these proposals are expected to decrease Medicare spending by $1.8 billion over 10 years. Estimated savings would be generated by shifting reinsurance costs from Medicare to plan sponsors. It is expected this shift would give plans stronger incentives to lower costs.
In contrast to CBO, the Administration estimates that its proposals would increase federal spending by $14.0 billion over 10 years. Spending could increase under these proposals if federal savings that result from reducing Medicare reinsurance payments do not offset higher spending from adding an out-of-pocket spending limit. Neither the CBO nor the Administration’s estimate included the budget impact on beneficiaries.
According to CBO’s preliminary estimate, the Senate Finance Committee’s Part D benefit redesign proposal would generate savings of $34.6 billion for Medicare over 10 years (2020-2029). Estimated Medicare savings are greater under the Senate Finance proposal than under the Administration’s proposal because both Part D plans and drug companies would have financial incentives to lower costs. Requiring drug companies to pay a portion of costs above the catastrophic threshold (20% in the Senate Finance Committee proposal) could create incentives for manufacturers to lower the price of specialty and other high-priced drugs. Requiring plans to pick up a larger share of costs above the catastrophic threshold (60% in the Senate Finance Committee proposal) is likely to create stronger incentives for plans to manage costs throughout all phases of the benefit.
There is no CBO score yet available for the H.R. 3 provisions related to Part D benefit restructuring.
Effects on Beneficiaries
Adding an out-of-pocket spending limit in Part D would provide substantial savings for beneficiaries who have high drug costs. In 2017, over one million Part D enrollees had out-of-pocket spending in the catastrophic phase (Figure 3). Beneficiaries with out-of-pocket spending above the catastrophic threshold may be taking one high-cost drug, for conditions such as cancer, multiple sclerosis and Hepatitis C, or multiple relatively expensive drugs.
Figure 3: In 2015, 2016 and 2017, 1 Million Medicare Part D Enrollees Had High Out-of-Pocket Drug Costs (Above the Catastrophic Threshold)—More Than Twice the Number in 2007
All three of these proposals – the Trump Administration’s, the Senate Finance Committee’s and H.R.3 – would limit the financial exposure of Medicare beneficiaries, though as noted above, CBO has not estimated the effects of an out-of-pocket limit by itself.
In its preliminary analysis, CBO estimates that the Senate Finance Committee’s benefit redesign proposal, which includes an out-of-pocket spending limit among other features, would reduce beneficiary spending on cost sharing by $20 billion and premiums by almost $1 billion over the 10-year period. There is no similar estimate yet available from CBO for H.R. 3, although presumably the effects would be within the same range for both proposals.
Proposals that shift more financial risk to plan sponsors and pharmaceutical companies by increasing their share of costs in the catastrophic phase could also affect beneficiaries. Plans would have stronger incentives to control costs and minimize their liability by, for example, attempting to negotiate lower drug prices with pharmaceutical companies. Plans would also have stronger incentives to steer beneficiaries toward lower-cost medications, which could lower beneficiaries out-of-pocket costs. At the same time, plans may impose new formulary restrictions and cost management tools, which could potentially affect beneficiaries’ access to needed medications. It is also possible that plans could increase Part D premiums to offset the additional costs they incur above the catastrophic threshold, although the CBO’s preliminary estimate indicates that the effects of this proposal, on its own, would have only a modest impact on premiums.
Exclude Manufacturer Discounts from the Calculation of “TrOOP”
The Administration has proposed changing the calculation of enrollees’ out-of-pocket costs (TrOOP) to exclude the value of the manufacturer price discount on brand-name drugs filled in the coverage gap benefit phase. Under current law, the value of the discount is included in the calculation of out-of-pocket spending, which means that Part D enrollees move through the coverage gap benefit phase more rapidly and qualify for catastrophic coverage sooner than they otherwise would. The Administration’s rationale for this proposal is to “correct the misaligned incentive” that currently exists for plans when enrollees use more costly drugs and reach the catastrophic coverage phase sooner, because plans’ liability for costs during that phase is relatively low.
The Medicare Payment Advisory Commission (MedPAC) has also recommended this change in conjunction with adding an out-of-pocket limit to Part D and reducing Medicare’s reinsurance payments above the catastrophic threshold as described above. Some policymakers have suggested pairing the change in the calculation of TrOOP with one that would lower the catastrophic threshold so that beneficiaries are held harmless in terms of their total annual out-of-pocket liability (since removing the manufacturer discount from the TrOOP calculation would increase beneficiary out-of-pocket spending, as discussed below).
The Senate Finance Committee’s drug pricing legislation does not explicitly address the TrOOP calculation. However, because the coverage gap phase would be eliminated and there no longer would be a manufacturer discount in that phase, this would effectively change the TrOOP calculation. H.R. 3 sunsets the existing coverage gap discount program and the provision that the current manufacturer discount counts towards TrOOP, and does not include a requirement that the new 10 percent discount below the catastrophic coverage threshold would count towards TrOOP.
Budget Effects
CBO estimates that the Administration’s FY 2020 budget proposal to change the calculation of TrOOP by excluding the value of the manufacturer discount would reduce Medicare spending by $73.2 billion over 10 years. The CBO score indicates that plan costs would decrease substantially and enrollees would be responsible for the out-of-pocket costs in the coverage gap benefit phase leading to fewer enrollees progressing through the coverage gap benefit phase and into catastrophic coverage, and fewer enrollees ultimately reaching the catastrophic phase.
Effects on Beneficiaries
Under the Administration’s proposal, Part D enrollees would face higher out-of-pocket costs before reaching the out-of-pocket limit if the value of the manufacturer discount is excluded from the TrOOP calculation, and would progress through the coverage gap benefit phase at a slower pace. This would result in fewer enrollees incurring out-of-pocket costs that exceed the catastrophic threshold, which means that fewer would benefit from an out-of-pocket limit. However, if the out-of-pocket limit was lowered, as is proposed under the Senate Finance Committee legislation and under H.R. 3, beneficiaries might not incur higher out-of-pocket costs.
Higher out-of-pocket costs could lead to a decrease in medication adherence, as well as lower utilization. In its estimate of H.R. 3, CBO noted that improved adherence would lead to improved health outcomes and lower spending for other Medicare-covered services. If plan costs decrease as a result of changing the TrOOP calculation, plan premiums and Medicare spending on premium subsidies could also decrease. However, for people with high drug costs, the increase in out-of-pocket spending associated with the change in the TrOOP calculation would likely exceed the level of savings they would receive in the form of lower premiums.
Cap Increases in Medicare Drug Prices to the Rate of Inflation
For the past decade, annual price increases on brand-name drugs have far outpaced the rate of inflation.9 To address these concerns, the Administration and members of Congress are considering proposals to place a cap on annual price increases for drugs covered under Medicare at the rate of inflation (Consumer Price Index for All Urban Consumers, or CPI-U), or require manufacturers to pay a rebate to Medicare if their prices increase faster than the inflation rate. The Medicaid program has a similar policy in place whereby manufacturers are required to provide a rebate to the Medicaid program if the price of a prescription drug increases faster than the rate of inflation. In the case of the Trump Administration, the policy is limited to Part B drugs only whereas the Congressional proposals apply more broadly to Parts B and D.
Require Rebates for Part D Drugs with Price Increases Faster than Inflation
The Senate Finance Committee legislation includes a provision to require manufacturers of Part D drugs and biologics to pay a rebate to Medicare if prices increase faster than inflation. (The Committee voted down an amendment to strike this provision by a tie vote, 14-14.) The Committee proposal would only apply to brand-name drugs covered under Part D, and would measure price changes based on the list price (wholesale acquisition cost). Manufactures would have 30 days to pay the requisite rebate or would face a civil monetary penalty of the original rebate amount plus 25 percent. The measurement of price changes would look back to July 1, 2019, and the proposal would take effect January 1, 2022.
H.R. 3 includes a similar provision that requires manufacturers to pay a rebate if Medicare drug prices increase faster than the rate of inflation. Under this proposal, any manufacturer that increases the price of Part D drugs faster than the rate of inflation would be required to pay the difference in the form of a rebate to Medicare. However, unlike the Senate Finance Committee’s proposal, H.R. 3 would apply to all drugs, not just brand and biologics, and would use the average manufacturer price to measure drug prices, not the wholesale acquisition cost. Manufacturers that do not pay the requisite rebate amount within 30 days would be required to pay a penalty equal to 125 percent of the original rebate amount. H.R. 3 would measure price changes going back to January 1, 2016 (compared to 2019 in the Senate Finance Committee legislation), and the proposal would take effect in 2022. (See below for a discussion of the Part B drug rebate provisions included in the Senate Finance Committee and H.R. 3.)
Budget Effects
According to its preliminary estimate, CBO expects the Senate Finance Committee’s proposal would achieve $57.5 billion in Medicare savings over 10 years (2020-2029).
There is no CBO score yet available for the Part D rebate provision in H.R. 3.
Effects on Beneficiaries
In its preliminary analysis, CBO estimates that the Senate Finance Committee’s inflation rebate proposal would reduce beneficiaries’ spending on cost sharing by $5 billion and premiums by $5 billion over the 10-year period. (CBO has not yet provided a similar estimate for this provision in H.R. 3.) Requiring manufacturers to pay an inflation rebate to Medicare if their Part D drug prices increase faster than inflation could be expected to slow the growth in beneficiaries’ out-of-pocket drug costs over time if manufacturers limit price increases to the rate of inflation. It could also help beneficiaries better anticipate their out-of-pocket costs from one year to the next. If the inflation rebate proposal helps to limit the growth in Part D drug prices, it could also lower Part D plan sponsor costs, which could lower Part D premiums for enrollees.
The inflation rebate provisions in the Senate Finance Committee legislation and H.R. 3, on their own, would not automatically reduce drug prices from their current levels and would not automatically lead to lower out-of-pocket spending by enrollees. However, under both proposals, there is the potential for manufacturers to respond to the rebate requirement by lowering drug prices to the level they would have been if they had only increased at the rate of inflation. For example, under H.R. 3, this could lower out-of-pocket costs for beneficiaries who take drugs that have increased faster than the rate of inflation since 2016, if their costs are calculated based on the drug’s price (as under coinsurance). However, manufacturers may instead choose to pay the required rebate instead of reducing prices from their current levels.
Under both of these proposals, drug manufacturers may respond to the inflation rebate by increasing launch prices, which could result in some beneficiaries paying higher prices for new drugs, and potentially lead to higher costs for other payers and privately-insured patients. While plans have the ability to negotiate with companies and can refuse to cover drugs with very high launch prices, they may have less leverage in some instances, such as when there are no therapeutic alternatives available. It has also been argued that requiring inflation rebates could stifle innovation, which could affect access to new therapies. (These arguments apply similarly to the Part B inflation rebate proposal discussed below.)
Establish an inflation limit on Part B drug reimbursement growth
Medicare covers a more limited set of prescription drugs under Part B than under Part D, which are typically administered in outpatient settings such as physicians’ offices and hospital outpatient departments. These drugs are generally used in the treatment of serious illnesses such as cancer, multiple sclerosis, and other high-cost conditions. For most Part B drugs, providers are reimbursed based on the average sales price (ASP) of a given drug plus a 6 percent add-on payment. (Under the budget sequester, payments to providers for Part B drugs were reduced, resulting in a net payment of ASP plus 4.3 percent beginning in April 2013.) Both the Trump Administration and MedPAC have expressed concern that the current payment system creates incentives that contribute to higher Part B drug costs due to lack of price competition for certain drugs and because physician reimbursement is higher for higher-priced drugs.
As one of several modifications to payments for Part B drugs, the Administration has proposed placing an inflation-adjusted limit on payment for Part B drugs by capping the growth of the ASP payment rate for Part B drugs at the rate of inflation.10 Drugs would be paid either at the current ASP payment rate or at the inflation-adjusted ASP payment rate, whichever is lower. (For a discussion of the Administration’s other Part B drug payment proposals, see Use International Reference Pricing for Drugs Covered by Medicare and Make Other Modifications to Payments for Part B Drugs below.)
The Senate Finance Committee includes an inflation rebate proposal for Part B drugs, similar to the approach for Part D discussed above. If the average sales price for single source drugs and biologics (though not biosimilars), covered under Part B increase faster than the rate of inflation, manufacturers would be required to pay the difference in the form of a rebate to Medicare. Manufacturers that do not to pay the rebate within 30 days would face a monetary penalty equal to 125 percent of the rebate amount. Manufacturers that fail to pay the monetary penalty would not receive any payment for that drug under Part B until the penalty is paid. The measurement of price increases would look back to July 1, 2019, and would take effect on January 1, 2021.
The provision in H.R. 3 to establish an inflation rebate for Part B drugs is similar to the provision in the Sentence Finance Committee legislation. If the average sales price for single source drugs, biologics, as well as biosimilars, covered under Part B increase faster than the rate of inflation, manufacturers would be required to pay the difference in the form of a rebate to Medicare. Manufacturers that do not to pay the rebate within 30 days would face a monetary penalty equal to 125 percent of the rebate amount. However, unlike the Senate Finance Committee proposal, there is no provision that prevents payment for Part B drugs until the penalty is paid. The measurement of price increases would look back to January 1, 2016 (compared to 2019 in the Senate Finance Committee legislation), and the proposal would be implemented on July 1, 2021.
Budget Effects
CBO stated there was not enough detail to score the Administration’s proposal to limit Part B drug price growth to the rate of inflation. The Administration also did not estimate its potential budget impact.
In its preliminary estimate, CBO projects that the Senate Finance Committee’s inflation rebate proposal for Part B drugs would decrease Medicare spending by $10.7 billion over 10 years (2020-2029).
There is no CBO score yet available for the Part B rebate proposal in H.R. 3.
Effects on Beneficiaries
The underlying price of drugs covered under Part B affects beneficiary out-of-pocket spending because beneficiaries are required to pay 20 percent coinsurance for Part B drugs. Unlike most health insurance coverage, traditional Medicare does not have an annual cap on out-of-pocket spending, although many beneficiaries currently have a limit on their out-of-pocket costs, either through a supplemental policy that covers cost sharing, (such as Medigap), or if they are enrolled in Medicare Advantage plans, which are required to have an out-of-pocket limit.
Capping growth of Part B drug reimbursement to the rate of inflation could slow the growth in beneficiaries’ out-of-pocket costs for Part B drugs and lead to greater stability over time. Lower overall drugs costs could also result in lower Part B premiums and lower premiums for supplemental coverage that pays Part B cost sharing. This proposal would not directly lower the current high cost of many Part B drugs, however, but as mentioned previously in relation to the Part D inflation rebate proposal, manufacturers may choose to limit the increase in drug prices below the rate of inflation, to avoid paying a rebate. Limiting the increase in Medicare’s payments for drugs to the rate of inflation may lead companies to launch drugs at higher prices, which could increase costs for some beneficiaries. CBO’s estimate of the Senate Finance Committee proposal did not project the effects of the Part B inflation rebate on Part B premiums.
Use International Reference Pricing for Drugs Covered by Medicare
Many studies have shown that the United States pays more for drugs than other developed countries, on average.11 Several proposals have been introduced to align drug prices in the United States more closely with drug prices in other countries in order to lower drug costs. The Trump Administration has suggested using international reference pricing specifically for Part B drugs, while some Congressional proposals apply more broadly, including, but not limited to, drugs covered by Medicare.
In an advanced notice of proposed rulemaking (ANPRM), the Administration proposed to test a series of new approaches for reimbursing Part B drugs, one of which is sometimes referred to as the international price index (IPI) model.12,13 Under the IPI model, Part B drug payments would be based on an international reference price instead of ASP, except in situations where ASP is lower. The target prices would be derived from an international price index, which would be phased in over a five-year time period. The IPI model would be tested and its effectiveness evaluated using a randomized design in geographic areas that comprise 50 percent of Part B spending. Medicare would aim to reduce Part B drug payments to 126 percent of what other countries pay, compared to 180 percent currently.14 The Senate Finance Committee voted on an amendment to prevent implementation of this model, but it narrowly failed by a tie vote.
There are several Congressional proposals that would use international reference prices to limit prescription drug prices both for Medicare Part B and Part D and for other payers. Under one proposal introduced by Senator Bernie Sanders (I-VT), the price of brand-name drugs would be limited to the median price in Canada, France, the United Kingdom, Germany, and Japan; if companies’ drug prices exceeded this amount, the government would waive the companies’ patent and exclusivity rights for those drugs and allow other manufacturers to produce them.15 Under another proposal introduced by Senator Rick Scott (R-FL), drug manufacturers would be prohibited from charging a higher list price for both brand-name and generic drugs than they do in Canada, France, the United Kingdom, Germany, or Japan. As mentioned previously, H.R. 3 would use international reference pricing to set an upper limit on Medicare prices for drugs that have been selected for negotiation by the HHS Secretary, not to exceed 120 percent of the average price in up to six specified countries – Australia, Canada, France, Germany, Japan, and the United Kingdom.
Budget Effects
The Administration estimates that its proposed IPI model for Part B drug reimbursement would reduce federal Medicare spending by $17.9 billion over five years (2020-2025). There are many uncertainties around this estimate, however, and behavioral responses by a variety of stakeholders, including beneficiaries, manufacturers, and providers, would significantly affect the model’s financial effects. The Administration noted in the ANPRM that its estimate is likely to change. CBO has not scored the Administration’s proposal, nor any of the international reference pricing proposals that would apply more broadly.
Effects on Beneficiaries
The Administration estimates that Medicare beneficiaries could save $3.4 billion over five years under its Part B international reference pricing proposal due to decreased coinsurance that would result from lower list prices. However, some have indicated that not all beneficiaries would experience savings because many have supplemental insurance (Medigap, retiree health benefits, and Medicaid) that covers cost sharing for Part B drugs. Reduced prices for Part B drugs may lead to lower Part B costs overall, which could lead to a reduction in Part B premiums and premiums for supplemental coverage, along with a decrease in Medicaid spending on behalf of dually eligible beneficiaries who take Part B drugs. This proposal would not affect drug costs and spending under Medicare Part D.
Under broader international reference pricing proposals, Medicare beneficiaries could experience cost savings due to lower costs under Parts B and D. This could take the form of lower cost sharing for drugs covered under both Part B (if beneficiaries do not have supplemental coverage that covers cost sharing) and Part D, particularly for non-preferred drugs where beneficiaries could pay up to 50 percent of the cost of a specialty drug as well as above the catastrophic threshold where beneficiaries pay 5 percent of drug costs. Lower drug prices overall could also reduce Part B costs, which would reduce Part B premiums, as well as lower Part D plan costs, which could result in lower Part D premiums.
Other Implications
The Administration’s rationale for the IPI proposal is to “cut down on foreign governments’ freeriding,” by “securing for the American people a share of the price concessions that drug makers voluntarily give to other countries.” Analysis by the Administration’s Office of the Assistant Secretary for Planning (ASPE) showed that, for the 27 highest-cost Part B drugs, acquisition costs in the United States were 1.8 times higher than those in 16 other developed countries. However, some question the assertion that using international benchmark prices would reduce costs, arguing that pharmaceutical companies may simply refuse to sell a drug at the new target price, and Medicare would have little recourse with regard to enforcement due to its coverage requirements. Drug manufacturers may also find ways to adjust foreign prices that could undercut savings on U.S. drug prices.16
Similar issues would arise for the international reference pricing proposals that apply broadly (not limited to Part B only). Without some sort of enforcement mechanism, manufacturers may refuse to comply with these rules to sell a drug at a new lower price, and Medicare would still be required to cover the drug. At the same time, if manufacturers face a financial penalty for non-compliance, such as a tax or loss of exclusivity rights, they may have a strong incentive to increase prices in other countries to avoid serious financial losses. These tactics may ultimately lead to lower-than-anticipated savings.
Make Other Modifications to Payments for Part B Drugs
In addition to the Part D drug payment proposals outlined above, the Administration, the Senate Finance Committee, and other policymakers have proposed other modifications to payments for Part B drugs that aim to lower beneficiary out-of-pocket costs, decrease Part B drug spending, and address incentives within the current payment system that may lead to utilization of more expensive drugs even when less expensive alternatives are available.17 (H.R 3 does not include any other provisions related to Part B drug payment changes aside from the inflation rebate provision.)
The Administration’s ANPRM includes a provision to eliminate the ASP percentage-based add-on payments to physicians under Part B. As mentioned previously, under budget sequestration, providers are currently reimbursed at ASP plus a 4.3 percent add-on, rather than ASP plus 6 percent.18 The ANPRM provision would effectively raise the add-on payment back to the full 6 percent, but would change the form of reimbursement for the add-on payment to a fixed payment amount for physician-administered drugs, instead of the 6 percent add-on. This add-on payment would not vary with the underlying price of the drug, unlike the current ASP plus 6 percent payment.19
In its drug pricing legislation, the Senate Finance Committee proposed a number of changes to the Part B drug payment system. While these provisions differ in their specifics from the Administration’s proposals, they are designed to achieve similar goals. For example, in order to mitigate the financial incentive for physicians to prescribe higher-priced drugs, the Committee proposed to establish a maximum add-on payment of $1,000 for drugs, biologics, and biosimilars; currently there is no limit to the add-on payment amount that providers can receive. The legislation also includes a number of provisions that would modify how ASP is calculated, which are designed to reduce excess payments for Part B drugs by Medicare. For example, the Committee proposed to require manufacturers to exclude the value of coupons from the calculation of ASP; presently, manufacturers are not required to exclude the value of coupons or certain price concessions they provide to patients in the calculation of ASP, which results in higher Medicare reimbursements for Part B drugs.
Budget Effects
According to the Administration’s estimate for the ANPRM, the proposed changes to physician payments for Part B drugs would increase Medicare spending by $1.6 billion because payments to physicians under the proposed system of fixed amounts for the add-on payment would increase from the current add-on payment based on ASP plus 4.3 percent.
In its preliminary estimate, CBO projects that the Senate Finance Committee’s proposed changes to Part B drug payments would generate savings of $2.2 billion for Medicare over 10 years (2020-2029) (in addition to the $10.7 billion in projected savings from the Part B drug inflation rebate). The largest component of this estimate is the provision to exclude the value of coupons from ASP (estimated savings of $1.45 billion over 10 years), due to the reduction in Medicare payments for Part B drugs associated with lower ASP amounts.
Effects on Beneficiaries
All of these proposals aim to lower Part B drug prices, reduce excess payments that drive up Part B drug and program costs, and eliminate incentives for providers to prescribe higher-priced drugs. If payments to providers are disconnected from the price of drugs they administer, and if patients receive lower-priced drugs as a result, then beneficiaries’ out-of-pocket costs would be lower. Coinsurance would also be lower if the value of ASP for specific drugs declines. As discussed previously, however, Medicare beneficiaries with supplemental insurance may not experience a direct cost reduction because their Part B coinsurance is covered. At the same time, lower overall Part B costs due to reduced Part B drug prices could also lower Part B premiums for all beneficiaries.
Currently, section 14 of the Medicare and Medicaid Patient and Program Protection Act of 1987 requires the Health and Human Services Office of Inspector General (OIG) to establish “safe harbors”, which exempts certain business or payment practices from criminal penalties under the federal Anti-Kickback Statute. One of the safe harbor practices protected by the OIG rule are rebate payments made by drug manufacturers to pharmacy benefit managers (PBMs) and health plan sponsors. Under the current drug pricing system, pharmaceutical companies offer rebates to PBMs in exchange for preferred formulary placement of their drug over their competitors’ products, which helps to lower Part D plan and program costs.20 These rebates produce lower net drug prices for payers which enables them to offer lower premiums in turn. Rebates do not directly lower out-of-pocket costs for Part D enrollees, however, because any rebates negotiated for the drugs they take are not passed on at the point of sale.
Eliminate Rebates under Part D (withdrawn by administration in July 2019)
Under the Trump Administration’s February 2019 proposed rule, which was withdrawn in July 2019, rebate payments by drug manufacturers to PBMs, Medicare Part D plan sponsors, and Medicaid managed care organization (MCO) plan sponsors would have been excluded from the safe harbor protections. The rule also proposed two new safe harbor protections: one which would have allowed drug manufacturers to provide discounts that would apply to beneficiaries’ point of sale purchases, and another which would have authorized fixed fee arrangements for certain services between drug manufacturers and PBMs.
Budget Effects
According to CBO, this proposal would have increased federal Medicare spending by $177 billion over 10 years, due to increases in federal subsidies for premiums and for low-income cost sharing. Similarly, OACT estimated this proposal would have increased federal Medicare spending by $196 billion over 10 years (2020-2029).21 Both CBO and OACT assumed that with the elimination of rebates, pharmaceutical manufacturers would alter their pricing and rebate strategies. With the loss of rebate revenue, plans may have raised their premiums, which would have led to increased premium subsidies paid by the federal government, resulting in greater overall costs for the Medicare program. Others noted the possibility that varied stakeholder responses to the proposal could have potentially led to increases or decreases in overall federal spending that were impossible to predict.22
Effects on Beneficiaries
According to CBO, Part D premiums were likely to rise under this proposal, based on the assumption that bids from Part D plans would increase in the absence of rebates. OACT projected that the majority of beneficiaries would have seen an increase in their total out-of-pocket spending and premium costs of $58 billion over 10 years.
Both CBO and OACT predicted that a small group of beneficiaries who use drugs with significant manufacturer rebates might have seen a decline in their overall out-of-pocket spending due to decreased cost sharing at the point of sale. Lower out-of-pocket costs under this proposal could have led to increased medication adherence for affected beneficiaries and potentially could have reduced the incidence of costly, emergent medical events.23 However, premiums would have modestly increased for all beneficiaries, driving up total spending for most people covered by Medicare.
If manufacturers did not offer rebates at the point of the sale as large as the ones they currently offer to PBMs and plan sponsors, savings for beneficiaries who use the specific drugs that currently have substantial rebates would have been lower than estimated. Additionally, beneficiaries who do not use drugs that have significant manufacturer rebates would not have benefited from this proposal (and would have incurred higher Part D premiums). According to one industry-funded analysis, only 36 percent of brand drugs overall have manufacturer rebates, which indicates that many beneficiaries would not have seen savings.24
Other Implications
The Administration’s rationale for eliminating rebates was to better align incentives in order to “curb list price increases, reduce financial burdens on beneficiaries, lower or increase Federal expenditures, and improve transparency.” Eliminating rebates may have also altered other features of Part D formulary design, such as existing incentives for plans or PBMs to give preferred formulary placement to higher-cost drugs with higher associated rebates and/or provide less favorable coverage of lower-cost products that have low or no rebates.25 Those in support of the rebate proposal argued that it would have prevented PBMs from favoring high-cost drugs with high list prices, incentivized manufacturers to lower list prices in exchange for better formulary placement, and encouraged savings to be passed on to the consumer at the point of sale.26
There was much uncertainty over whether eliminating rebates in Part D would have the intended effect or instead result in both higher Part D premiums and higher out-of-pocket spending for beneficiaries and increased spending for the federal government. Some critics of the proposal contended that it did not create any incentives for manufacturers to lower list prices, particularly if rebates in the commercial market were still allowed, which may have left beneficiaries paying as much or more out of pocket without PBMs negotiating on their behalf.27 CBO likewise stated that it did not expect manufacturers to lower list prices as a result of this proposal. Some skeptics also questioned whether the proposed safe harbor to allow certain fixed fee arrangements between drug companies and PBMs would have had unintended effects, as plans and manufacturers adopted alternative arrangements that may have formed a de facto system of rebates.
Share Rebates with Part D Plan Sponsors and/or Beneficiaries
Rather than eliminate rebates entirely, some policymakers have proposed to require that PBMs share rebates with Part D plan sponsors and/or enrollees. One Congressional proposal introduced by Senator Ron Wyden (D-OR), would require a minimum percentage of rebates to be passed through to plan sponsors and patients. In its FY 2019 budget, the Administration included a proposal to pass at least one-third of all rebates and price concessions to enrollees at the point of sale, but the proposed rule to remove the safe harbor for rebates (which was withdrawn) superseded that approach.28
Budget Effects
CBO has not scored these proposals.
Effects on Beneficiaries
Proposals to share rebates with plan sponsors and/or patients have the potential to lower out-of-pocket costs for Part D enrollees, since cost sharing would be based on a lower price. However, manufacturers and plan sponsors could potentially take compensatory actions to lower the overall rebate amount, in which case savings to beneficiaries would be reduced.
In its FY 2020 budget, the Administration proposed authorizing the HHS Secretary to shift coverage of certain drugs currently covered under Part B to Part D, beginning in 2020, subject to a determination that savings could be gained from shifting from the ASP plus 6 percent reimbursement under Part B to negotiated pricing under Part D. The Secretary would not use this authority if doing so would limit patient access to a drug or if beneficiary cost sharing would increase. In order for this proposal to be implemented, a new billing mechanism may need to be established between Part D plans and Part B prescribers. The rationale for this proposal is to “allow HHS to leverage Part D plans’ negotiating power to bring down prices and lower patient out-of-pocket costs.”
The Senate Finance Committee legislation also has a provision that requires MedPAC to produce a report that analyzes the effects of shifting coverage of some Part B drugs to Part D. The report would look at the impact of this shift on program spending and beneficiary cost sharing as well as the feasibility and policy implications of such an approach.
Budget Effects
CBO stated it lacked sufficient detail to score this proposal, and the Administration did not produce a budget estimate.
Effects on Beneficiaries
This proposal could lead to lower out-of-pocket costs for beneficiaries if Part D plan sponsors are able to negotiate lower prices for drugs that are currently covered under Part B. In addition, beneficiaries with Medigap might see a reduction in their premiums, because Medigap would no longer be covering the 20 percent coinsurance for these drugs under Part B.
Under current law, Medicare beneficiaries with low incomes and modest assets are eligible to receive subsidies to help cover their Part D monthly premiums and cost-sharing amounts through the Part D Low-Income Subsidy (LIS) program. Some beneficiaries automatically qualify for the LIS, while those who do not can apply and will qualify for full subsidies if their income falls below 135 percent of the federal poverty level (FPL) ($16,862 individuals/$22,829 couples in 2019) and their assets do not exceed $9,230 ($14,600 if married). Those with incomes at or below 150 percent FPL ($18,735 individuals/$25,365 couples in 2019) and assets between $9,230 and $14,390 ($14,600 and $28,720 if married) qualify for partial subsidies.29
LIS enrollees currently pay low cost-sharing amounts for brand-name and generic drugs. Enrollees receiving full subsidies pay $1.25 for generics and $3.80 for brands in 2019, and those receiving partial subsidies pay $3.40 and $8.50, respectively. Because the cost differential between brands and generics is relatively small, there is some concern that LIS enrollees do not face a strong financial incentive to use generic drugs. This may result in higher costs for LIS enrollees who use brands when generics are available, as well as higher costs for Medicare, which subsidizes a large portion of cost sharing for LIS beneficiaries.
Eliminate Cost Sharing for Generics for LOW-INCOME SUBSIDY ENROLLEES
Under a provision in H.R. 3, cost sharing for generic drugs, including multiple source drugs, would be eliminated for Part D LIS enrollees, beginning plan year 2021. A proposal in the Administration’s FY 2020 budget would also eliminate cost sharing for generic drugs for Part D LIS enrollees, including for preferred multisource drugs and biosimilars, beginning in 2020. A similar proposal was recently introduced in Congress by Representative Joe Cunningham (D-SC1), and MedPAC recommended a similar change in 2016.
Budget Effects
For FY 2020, CBO estimates that eliminating cost sharing for generic drugs would increase federal spending by $23 billion over 10 years. By contrast, the Trump Administration estimates this proposal would reduce federal spending by $930 million over 10 years. CBO’s estimate suggests that higher spending could result from reducing LIS cost sharing for generic drugs, including for relatively expensive biosimilars, which could, in turn, lead to higher utilization of these drugs and, as a result, higher Medicare payments to plans on behalf of LIS enrollees. However, the Administration’s estimate suggests that eliminating cost sharing for generics and biosimilars may cause LIS enrollees to substitute generics for brands, which would reduce the amount of Medicare cost-sharing subsidies for LIS enrollees.
There is no CBO score yet available for eliminating cost sharing for generics as part of H.R. 3.
Effects on Beneficiaries
Eliminating cost sharing for generic drugs for LIS enrollees would create a stronger financial incentive to use generics, and would reduce out-of-pocket costs for LIS enrollees who take generic drugs and for those who are able to switch from brands to generics. Eliminating cost sharing would also ensure better access to needed drugs and less prescription abandonment. At the same time, unnecessary use of certain medications may increase due to the elimination of cost sharing.
expand Eligibility for Low-Income Subsidies
Beneficiaries who are dually eligible for Medicare and Medicaid automatically receive Part D Low-Income Subsidies. However, the rate of LIS take-up by eligible beneficiaries who are not automatically enrolled has historically been low, causing concern with regard to low-income beneficiaries who may not enroll due to eligibility requirements or application difficulties.30
H.R. 3 includes a provision to institute automatic enrollment into the LIS program for all adults who reach age 65 and have incomes up to 200 percent of poverty who are enrolled in Medicaid. Furthermore, the proposal would broaden LIS eligibility requirements for low-income Part D enrollees by eliminating the asset test by increasing the income eligibility thresholds. Part D enrollees with incomes up to 200 percent FPL would be eligible for partial subsidies and enrollees with incomes up to 150 percent FPL would be eligible for full subsidies beginning for plan year 2022.31 A similar Congressional proposal introduced by Senator Bob Casey (D-PA) would also broaden LIS eligibility requirements for low-income Part D enrollees by eliminating the asset test and by extending full LIS benefits to Part D enrollees with incomes up to 200 percent.32 Neither the Trump Administration nor the Senate Finance Committee have proposed expanding eligibility for low-income subsidies.
Budget Effects
CBO has not scored these proposals.
Effects on Beneficiaries
Establishing automatic enrollment, expanding eligibility for full and partial subsidies under the LIS program and eliminating the asset test would increase the number of low-income people on Medicare who qualify for premium and cost-sharing assistance under Part D, and lower out-of-pocket costs for beneficiaries who currently qualify for partial subsidies. Instituting automatic enrollment would reduce the government’s administrative burden for documenting eligibility, and eliminating the asset test would help more low-income beneficiaries qualify for LIS benefits. Furthermore, an increase in the number of people who qualify for premium and cost-sharing assistance may lead to higher drug utilization and increased medication adherence, due to lower out-of-pocket costs for beneficiaries.
Allow Medicare Advantage Plans to Require Step Therapy for Part B Drugs
Under CMS guidance in effect until August 2018, Medicare Advantage plans were not authorized to use utilization management tools such as step therapy for Part B drugs, unless these tools were allowed under traditional Medicare. CMS rescinded this guidance in August 2018. CMS recently finalized regulations that allow Medicare Advantage plans to use utilization management tools such as step therapy and prior authorization for Part B drugs, subject to certain rules.
According to CMS, these tools will enable Medicare Advantage plans to better manage and negotiate the price of Part B drugs, which will bring down costs for the Medicare program and beneficiaries. Certain safeguards would be established, such as changing the determination and appeals time frame to align with Part D rules; requiring Medicare Advantage plans to use Pharmacy and Therapeutics (P&T) committees to review and approve step therapy, similar to Part D; including disclosure requirements in plan documents; and instituting policies and procedures to inform various stakeholders about the requirements. The new step therapy rules will apply only to new prescriptions rather than existing prescriptions for Part B enrollees. Most rules will be in effect beginning January 1, 2020 (though some amendments will take effect starting January 1, 2021), but the guidance applies to plan year 2019.
Budget Effects
According to the Administration’s estimates, Medicare will see a net savings of $1.9 billion over 10 years (2020-2029), which consists of gross savings of $1.91 billion and gross costs of $11.2 million due to increased beneficiary appeals. The Administration calculates that the use of step therapy will yield savings of 1.6 percent on Part B drugs due to increased use of less costly biosimilars, which are clinically equivalent to biologics, and will generate more favorable rebates for drugs with adequate competition. This proposal has not been scored by CBO.
Effects on Beneficiaries
According to the Administration’s estimates, Medicare beneficiaries will save $62 million under this proposal. Broader use of utilization management tools could lead to lower out-of-pocket costs for Medicare Advantage enrollees who take Part B drugs, if beneficiaries are able to substitute lower-cost medications for more costly ones. However, this proposal could also create barriers to medication access and could lead to administrative hassles. Step therapy and prior authorization could be burdensome for beneficiaries who may first have to try a number of drugs before they can take the one that is most effective for them, which could lead to preventable side effects, as well as poorer health outcomes due to delays in receiving optimal treatment. Furthermore, step therapy could lead to increased coverage appeals by beneficiaries who disagree with plan coverage decisions, and may lead to access issues for patients who are ultimately denied coverage for specific drugs. In response to these and other concerns, the Administration pointed to safeguards included in the final rule, which the Administration contends are adequate to ensure that these policies do not impede needed access to care.
Modify Coverage Requirements for Drugs in Part D Protected Classes
Under current program regulations, Part D plans are required to cover all or substantially all drugs in six protected classes (anticonvulsants, antidepressants, antineoplastics, antipsychotics, antiretrovirals, and immunosuppressants for the treatment of transplant rejection). Although the protected classes were originally created to smooth the transition from Medicaid to Medicare Part D for beneficiaries with these conditions when the latter program first started, the protected classes have been affirmed by Congress at various junctures since their launch in recognition of the unique challenges faced by beneficiaries diagnosed with the particular medical and mental health problems that protected class drugs are intended to treat.
While this policy has largely achieved its purpose, the Administration has suggested that the “essentially open coverage” of certain drug categories under the protected classes policy may lead to overutilization of these drugs and limit Part D plans’ ability to use tools that can bring down the costs of prescription drugs, including negotiating rebates. Currently, only 13 percent of protected class drugs have manufacturer rebates, according to one industry-funded analysis.33 Rebate information is proprietary and therefore drug-specific rebate data is not publicly available.
The Administration recently finalized a rule addressing coverage requirements for the protected classes. Under the final rule, the Administration codified an existing policy that allows for the broader use of prior authorization and step therapy for protected class drugs in five of the six protected classes (excluding antiretroviral medications) and in the case of new prescriptions only. The rule also gives plans greater authority to use utilization management tools, including indication-based formulary design, for drugs in five of the six protected classes. The rule did not finalize changes that would have allowed broader use of prior authorization and step therapy without distinguishing between new starts and existing therapies, as is currently permitted for other drug categories and classes. These changes will take effect on January 1, 2020.
The Administration proposed, but did not finalize, other changes that would have allowed plans to exclude some protected class drugs from their formularies under specific circumstances, including: 1) if the drug is a new formulation of a protected class drug, even if the older formulation is no longer on the market, or 2) if the price of a drug increases beyond the rate of inflation based on the CPI-U.
Budget Effects
The Administration did not project the net budget effect of changes included in the final rule.
Effects on Beneficiaries
Proponents in favor of coverage restrictions for protected class drugs contend that the proposal would have resulted in lower costs for patients, because plans could get greater discounts on covered drugs. However, in comments submitted in response to the proposed rule, patient advocates, pharmaceutical companies, and others expressed concern that the proposed changes would reduce patients’ access to needed medications, disrupt ongoing therapy, and create an unintended incentive for manufacturers to launch new drugs at higher prices. In response, the Administration modified the first provision on step therapy to apply to new prescriptions only, and did not finalize provisions that would have allowed some protected class drugs to be excluded from formularies. By codifying existing policy, Medicare beneficiaries who use protected class drugs will retain current access to these medications.
Require Part D Plan Sponsors to Use Real-Time Benefit Tools
Under the MMA, prescription drug plan sponsors are required to adopt Part D electronic prescribing (eRx) standards. However, there is no requirement that prescribers utilize eRx tools. Prescribers that choose to use these tools must comply with the National Council for Prescription Drug Programs (NCPDP) SCRIPT standards, which allows prescribers to transmit information electronically, and the NCPDP Formulary and Benefits standards (F&B), which enable prescribers to view plan formularies. However, neither of these standards provides prescribers with real-time cost or coverage information for individual patients at the point of prescribing.
The Administration recently finalized a rule that would require Part D plan sponsors to adopt real-time benefit tools (RTBTs) that can be integrated with at least one prescriber’s eRx or electronic health record (EHR), to provide real-time, complete, and accurate patient-specific formulary and benefit information to prescribers. RTBTs could enable prescribers and patients together, at the point of prescribing, to determine the most suitable treatment based on clinical appropriateness, coverage, and cost. This rule requires plans to begin implementing RTBTs by January 1, 2021, though many plans have already implemented RTBTs voluntarily. There are also congressional proposals that establish more detailed requirements for the information to be included in this real-time benefit data, including a proposal in the Senate Finance Committee legislation.
Budget Effects
While there is no official budget estimate, the Administration states in the final rule that RTBTs will not be costly to implement, and that Medicare and beneficiaries will experience savings due to the use of lower-cost prescription drugs.
Effects on Beneficiaries
The Administration contends that the adoption of RTBTs will increase price and coverage transparency that will ultimately lower beneficiary out-of-pocket costs and improve medication adherence. Because RTBTs will enable prescribers to see beneficiary-specific Medicare Part D plan formularies and cost information at the point of prescribing, including formulary alternatives or utilization management data, prescribers and patients could collaborate to select a lower-cost treatment option. With research showing a positive association between higher patient cost sharing for medications and decreased medication adherence, RTBTs could also potentially lead to better medication adherence and better clinical outcomes for patients, according to the Administration. However, because there is no industry standard for RTBTs, it may be challenging to integrate these tools with various EHR or eRx systems, which could limit their efficacy. Furthermore, while successfully integrated RTBTs might give providers a real-time look at their patients’ Part D formularies, the lowest-cost treatment may not always be the optimal treatment option for a patient, suggesting that this tool’s impact may vary based on individual patient needs.
With drug prices on the rise and strong bipartisan public support for various policy approaches to lower drug costs, the Trump Administration and Congress have put forth a variety of proposals to address this issue, including several that would affect Medicare and beneficiary spending on prescription drugs. Many Democratic presidential candidates have also endorsed proposals to rein in drug spending. While there is interest among federal policymakers and candidates to restrain drug prices generally, there is particular interest in focusing on Medicare because of the wide range of policy levers available and the effect on the federal budget.
Under most of the proposals discussed in this brief, Medicare beneficiaries would likely see changes in their out-of-pocket costs, premiums, and access to medications, although the extent of these changes would vary depending on the proposal. These proposals would also have potentially wide-ranging effects on Medicare spending overall, which would depend greatly on the details specified in any final proposal and how stakeholders respond. Many of these proposals face strong opposition from the pharmaceutical industry, which has argued that proposals to reduce drug prices would adversely affect patients’ access to needed medications and dampen incentives for innovation by reducing revenue used to fund research and development. Furthermore, implementing some of these proposals in conjunction with others could produce interaction and spillover effects that may not be reflected in current estimates.
Going forward, it will be important to assess the implications and tradeoffs associated with each of these proposals on Medicare program spending, Medicare beneficiaries’ drug costs and coverage, and other stakeholders. While the prospects for these proposals are unclear, public concern over the affordability of prescription drugs suggests that the subject is unlikely to fade from the policy agenda in the near future.
This work was supported in part by Arnold Ventures.We value our funders. KFF maintains full editorial control over all of its policy analysis, polling, and journalism activities.
The authors acknowledge Jack Hoadley for his helpful comments on a draft of this paper.
Senator Klobuchar is also a co-sponsor of S. 377, “Medicare Negotiation and Competitive Licensing Act”. ↩︎
Ron Wyden (D-OR) has introduced a proposal that would eliminate cost sharing above the catastrophic threshold, but would fully implement this change in 2020 instead of a phased-in approach. See S.475, “The RxCap Act of 2019,” available at https://www.congress.gov/116/bills/s475/BILLS-116s475is.pdf↩︎
The Administration’s Center for Medicare & Medicaid Innovation (CMMI) is also moving forward with a model that would modify reinsurance under Part D to create stronger incentives for plans to reduce costs. The model keeps the current catastrophic phase coverage allocation in the Medicare Part D benefit design (which cannot be modified without a change in law) with the same liability (5 percent for enrollees, 15 percent for plans, 80 percent for Medicare), but tests an approach where plans that choose to participate take on two-sided risk. Based on a plan’s federal reinsurance expenditures, CMS will make performance-based payments to plans that experience savings, but plans will also be subject to a penalty for any reinsurance spending above its target benchmark. The model is scheduled to begin January 2020. ↩︎
The Medicare Payment Advisory Commission (MedPAC) also recently proposed a restructured standard benefit design similar in nature to the Senate Finance Committee and House proposals, but without specifying threshold amounts or what share of liability each payer would bear for catastrophic costs.
Under the current structure of the Part D benefit, brand manufacturers provide discounts in the coverage gap benefit phase of 70 percent, while beneficiaries’ out-of-pocket costs in the coverage gap benefit phase are 25 percent, and plans’ share is 5 percent. The MedPAC approach proposes eliminating the coverage gap benefit phase altogether and applying the manufacturer discount to the catastrophic phase, also called a “cap discount”.
The American Action Forum also has a proposal that would change plan liability in the catastrophic phase, including increasing liability for plans and manufacturers during this phase: https://www.americanactionforum.org/print/?url=https://www.americanactionforum.org/research/redesigning-medicare-part-d-realign-incentives-1/↩︎
Congressmen Horsford and Horn have introduced a stand-alone version of the Medicare Part D redesign and out-of-pocket cap that are described in H.R.3. See H.R. 4649, “Capping Drug Costs for Seniors Act of 2019,” available at https://www.congress.gov/116/bills/hr4649/BILLS-116hr4649ih.pdf↩︎
The Administration has also indicated it may issue an executive order related to international reference pricing. The executive order reportedly may include a “favored nations” policy, which would require that the U.S. pay the lowest price on pharmaceuticals available to other developed nations. It is unclear how this proposal differs or overlaps with the international price index model. See https://www.nytimes.com/2019/07/05/upshot/trump-drug-prices-executive-order.html. Additionally, it has been reported that there will be an executive order that will use the method laid out in the IPI, but apply it even more broadly, to Part D drugs. This approach may be delayed depending on the outcome of Senate Finance Committee legislation. See https://www.nytimes.com/reuters/2019/07/24/world/europe/24reuters-usa-drugpricing-exclusive.html?wpisrc=nl_health202&wpmm=1↩︎
Many proposals under discussion would apply some type of enforcement mechanism to ensure pharmaceutical manufacturers comply with new drug pricing rules. For example. if manufacturers continue to sell drugs above the average price in comparable OECD countries, these companies would be significantly taxed; these taxes would then be provided as rebates to consumers. For an example of this approach, see https://kamalaharris.org/drug-costs/↩︎
One Congressional proposal introduced by Representative Richard Neal (D-MA) aims to lower Part B drug spending by requiring drug manufacturers to report prices used to calculate certain payment rates for Part B drugs. The proposal would effectively lower the reimbursement for some Part B drugs from a WAC-based payment rate to an ASP-based payment rate. Under current law, when certain ASP information is unavailable, such as when a new drug comes to market, Medicare payments are based on the wholesale acquisition cost (WAC), which is generally higher than the ASP. CBO estimates that this would produce $1.7 billion in savings for the Medicare program over 10 years (2020-2029). See H.R.2113, “The Prescription Drug STAR Act,” available at https://www.congress.gov/116/bills/hr2113/BILLS-116hr2113ih.pdf↩︎
The Administration has also proposed establishing a competitive acquisition program (CAP)-like approach for procuring drugs as an alternative to the current system under which physicians “buy and bill” for drugs. Under this new approach, physicians could contract directly with private sector vendors who would procure medications directly and supply them to providers.
The original competitive acquisition program (CAP) was established as part of the MMA and operated from July 1, 2006 to December 31, 2008, but had limited success due to low vendor participation. In its rationale for including a new CAP proposal, the Administration has stated that, “a CAP-like approach with improvements, particularly in regards to onsite availability of drugs, could potentially address concerns about the financial burdens associated with furnishing Part B drugs and their rising costs, and address challenges experienced in the CAP.” ↩︎
Since 2006, rebates from drug companies to Part D plan sponsors have more than doubled, and now account for 21.8 percent of Part D costs. This is an overall average across all brand and generic drugs, including drugs for which rebates are not negotiated. CMS does not make drug-specific rebate data publicly available, because this information is considered proprietary. ↩︎
CBO and OACT also estimated the impact on Medicare Part B, the Medicaid program, and the private health insurance market. CBO projects this proposal would not have a significant effect on Part B spending. OACT examined Part B drugs that are also covered under Medicare Part D that receive significant rebates and estimates this plan will generate about $0.5 billion in savings in Part B. For Medicaid, CBO estimates it would cost the federal government $7 billion, while OACT estimates the proposal is expected to cost the federal government $1.7 billion and states $0.2 billion. CBO expects there would be little impact on this on the private health insurance market, while OACT estimates the proposal would save about $1 billion in this market over 10 years. ↩︎
In addition to the OACT estimate, the Office of the Assistant Secretary for Planning and Evaluation (ASPE) commissioned two studies on the impacts of ending rebate payments in their current form under the Part D program: Milliman, Inc., “Impact of Potential Changes to the Treatment of Manufacturer Rebates,” January 31, 2019, available at https://aspe.hhs.gov/system/files/pdf/260591/MillimanReportImpactPartDRebateReform.pdf and Wakely Consulting Group, “Estimates of the Impact on Beneficiaries, CMS, and Drug Manufacturers in CY2020 of Eliminating Rebates for Reduced List Prices at Point-of-Sale For the Part D Program,” August 30, 2018, available at https://aspe.hhs.gov/system/files/pdf/260591/WakelyImpactAllPartiesManufacturerRebatesPointSale.pdf↩︎
Leah L. Zullig, Bradi B. Granger, Helene Vilme, Megan M. Oakes, and Hayden B. Bosworth, “Potential Impact of Pharmaceutical Industry Rebates on Medication Adherence,” Am J Manag Care, May 2019. ↩︎
As an example of this coverage dynamic, the drug Repatha, used to treat high cholesterol, was highlighted at a recent Senate Finance Committee hearing. Repatha has a high list price with a correspondingly high rebate. The manufacturer has since produced an equivalent version of the drug at lower price, but one major PBM requires prior authorization for this less expensive version because the manufacturer offers a much higher rebate for the more expensive one. ↩︎
In a recent proposed rule, the Administration sought information on redefining the “negotiated price” of drugs patients pay at the point of sale. Currently, these “negotiated prices” do not include pharmacy price concessions or manufacturer rebates. The Administration was considering including pharmacy price concessions in the definition of “negotiated price” to lower patients’ out-of-pocket costs, but it has not moved forward with any changes at this time. ↩︎
H.R. 3 includes other provisions that affect the LIS, including a provision that would not count certain retirement accounts as income for the purposes of determining eligibility under the Medicare Part D low-income subsidy (LIS) program. ↩︎
Following the implementation of the Affordable Care Act (ACA) Medicaid expansion to low-income adults in 2014, there were large increases in Medicaid and CHIP enrollment across states that built on steady progress covering children over the past decade. These increases reflected enrollment among newly eligible adults in states that implemented the expansion as well as enrollment among previously eligible adults and children due to enhanced outreach and enrollment efforts and updated enrollment procedures associated with the ACA. However, enrollment began declining in 2018 and continued to decline in 2019, reversing this trend. This fact sheet provides analysis of recent enrollment trends in Medicaid and CHIP and discusses potential factors contributing to the enrollment decline and its implications for coverage rates. It is based on Kaiser Family Foundation analysis of the Centers for Medicare and Medicaid Services (CMS) Performance Indicator Project Data.1 The enrollment counts include full-benefit individuals of all ages enrolled in Medicaid and CHIP for each month, including those with retroactive, conditional, and presumptive eligibility.
Enrollment Changes December 2017-July 2019
Between December 2017 and July 2019, there was a net decline in total Medicaid and CHIP of 1.9 million people or -2.6%, from 74.3 to 72.4 million enrollees (Figure 1 and Table 1). This reflected an enrollment decrease of 1.7 million or -2.2% between December 2017 to December 2018, and a continued decline of 265,000 or -0.4% from December 2018 to July 2019. While the rate of decline slowed in 2019, the data are not fully comparable to 2018 because they represent partial year data. Total enrollment for both children and adults declined across the 48 states able to report separate data for children and adults for the time period examined:
Enrollment for children fell by about a 1.1 million or -3.0%, from 35.7 million in December 2017 to 34.7 million in July 2019. This included a decrease of 751,000 or -2.1% between December 2017 to December 2018, and a continued decline of 321,000 or -0.9% between December 2018 and July 2019.
Enrollment for adults fell by 750,000 or -2.1%, from 35.0 million in December 2017 to 34.3 million in July 2019. This included a decrease of 736,000 or -2.1% between December 2017 and December 2018, and a continued decline of 15,000 or <-1.0% between December 2018 and July 2019.
Figure 1: Total Medicaid and CHIP Enrollment Declined by 1.9 Million Individuals Between December 2017-July 2019
A total of 36 states, including the District of Columbia, had enrollment decreases between December 2017 and July 2019. About a third of states (15) had enrollment decreases of at least -5% between December 2017 and July 2019. States with the largest decreases included Missouri (-13.1%), Idaho (-10.8%), Wyoming (-8.5%), Ohio (-7.3%), and Illinois (-7.2%) (Figures 2 and 3). Enrollment remained flat or increased in 15 states, with the largest percent increases in Virginia (30.0%), Alaska (11.4%), and Iowa (4.4%). Virginia implemented the ACA Medicaid expansion to adults in January 2019, which accounts for its large growth in enrollment. Alaska also had a later implementation of its Medicaid expansion and is processing a backlog of applications, factors which may be contributing to its enrollment increase.2
Among the 48 states able to report separate data for children, between December 2017 and July 2019, there were enrollment declines for children in 36 states, and 34 states had enrollment decreases for adults. States with the largest percent enrollment decreases for children included Missouri (-16.1%), Idaho (-13.2%), and Utah (-9.7%). The largest percent enrollment decreases for adults were in Arkansas (-11.0%), Illinois (-8.9%), and Ohio (-8.7%). The largest percent increases for children occurred in Virginia (7.4%), Alaska (7.2%), and Iowa (4.1%), and, for adults, the largest percent increases were in Virginia (74.7%), Utah (30.2%), and Alaska (14.9%).
Total enrollment as of July 2019 remains 28% higher compared to states’ pre-ACA monthly average enrollment in the 49 states reporting data for both periods. However, July 2019 enrollment fell below pre-ACA monthly average enrollment levels in six states: Wyoming (-17.2%), Vermont (-4.1%), Kansas (-2.1%), Missouri (-1.7%), Oklahoma (-0.9%), and Texas (-0.02%).
Factors Contributing to Enrollment Declines
The enrollment declines observed since December 2017 reverse a previous trend of Medicaid and CHIP enrollment increases and raise questions about whether they reflect a growing number of individuals becoming uninsured or transitioning to other coverage.
Some of the decrease may reflect individuals moving to other coverage as a result of increases in income or changes in employment amid the improving economy. However, gains in employment may not necessarily translate into increases in employer-sponsored insurance (ESI). Lower-income workers are less likely to have an offer of ESI through their job and, even if an offer is available, it may not be affordable. A portion of the decline may also reflect some states catching up on redeterminations after having delayed them for a period of time as they implemented new systems under the ACA. Once states re-start renewals after a period of delay, they experience a drop-off in enrollment as they process renewals that had been in suspended status and determine some people are no longer eligible.
Survey data show a rise in the uninsured rate between 2017 and 2018, driven by decreases in Medicaid and CHIP coverage, suggesting that some individuals being disenrolled are becoming uninsured.3Experiences in some states suggest that some eligible people may be losing coverage due to barriers maintaining coverage associated with renewal processes and periodic eligibility checks.4 Although states have implemented updated and more automated renewal processes under the ACA and some have taken up options to reduce churn or people moving on and off the program over short periods of time, eligible individuals may still face barriers to maintaining coverage.5 For example, eligible individuals remain at risk for losing coverage if they do not receive or understand notices or forms requesting additional information to verify eligibility or do not respond to requests within required timeframes. Individuals may not understand or receive notices due to language or literacy challenges or if they have unstable housing arrangements or move frequently. Moreover, the growing use of periodic data checks by states may increase coverage gaps or churn, causing people to move on and off of coverage due to a temporary small increase in income, for example, from overtime or seasonal work.
CMS’s heightened focus on reducing errors in eligibility determinations could have trade-offs that make it more difficult for eligible people to obtain and maintain Medicaid coverage. CMS has increased its focus on beneficiary eligibility determinations as part of program integrity efforts, and indicated plans to change eligibility rules and tighten standards for eligibility verification to reduce improper payment rates associated with eligibility errors.6,7 These errors do not necessarily reflect fraud and abuse. HHS notes that the majority of these errors are due to instances where information required for eligibility determination was missing from state systems and/or states did not follow the appropriate process for determining beneficiary eligibility, and that they do not necessarily mean that a person was ineligible for the program. For example, a person could have been eligible but lacked proper documentation of eligibility or the person could have been placed in an incorrect eligibility category. Increased documentation and verification requirements could reduce instances of ineligible people being enrolled in the program and other eligibility errors, but result in greater enrollment barriers for people who are eligible for the program at the same time. The modernized enrollment and renewal processes established under the ACA were designed based on prior research and evidence that frequent documentation requirements serve as an enrollment barrier for eligible families.8
Other factors may also be leading to fall offs in Medicaid and CHIP coverage among individuals who remain eligible for the program. For example, the administration has reduced funds to support outreach and enrollment assistance, which is often an important for getting and keeping eligible families enrolled in coverage.9 Moreover, a growing body of research indicates that the shifting immigration policy environment may be deterring some families from enrolling themselves or their children in coverage or continuing coverage at renewal.10,11
Figure 3: Percent Change in Total Monthly Medicaid and CHIP Enrollment from December 2017 – July 2019
Table 1: Total Monthly Enrollment in Medicaid and CHIP, December 2017 to July 2019
>
Table 2: Total Monthly Child Enrollment in Medicaid and CHIP, December 2017 to July 2019
>
Table 3: Total Monthly Adult Enrollment in Medicaid and CHIP, December 2017 to July 2019
>
The data consists of monthly reports submitted by all 50 states and the District of Columbia on applications, eligibility, and enrollment activity. The enrollment counts include full-benefit individuals enrolled in Medicaid and CHIP for each month, including those with retroactive, conditional, and presumptive eligibility. Limited-benefit enrollees such as those with emergency Medicaid, family planning-only coverage and limited benefit dual eligible individuals are excluded. Centers for Medicare and Medicaid Services, “Medicaid & CHIP Monthly Applications, Eligibility Determinations, and Enrollment Reports: January 2014 – February 2019 (preliminary)”, Centers for Medicare and Medicaid Services, (May 10, 2019), https://www.medicaid.gov/medicaid/program-information/medicaid-and-chip-enrollmentdata/monthly-reports/index.html↩︎
Two Medicaid-Related Initiatives That Help Promote Long-Term Care at Home and in the Community, Rather Than in Institutions, Are Set To Expire at the End of December
All States and Washington D.C. Currently Utilize One or Both Initiatives
Two initiatives that for years have helped shift Medicaid enrollees away from nursing homes in favor of long-term care at home and in the community face year-end deadlines that could undercut that trend, according to two new KFF issue briefs. While there does not appear to be substantive disagreement over the initiatives like there is with many other federal health programs, their expiration is coming at a time when Congress is engaged in a contentious budget debate with other competing demands.
Funding for Medicaid’s Money Follows the Person (MFP) demonstration, which has served more than 90,000 people in 44 states since 2007, is set to expire on December 31. The program provides states with enhanced federal matching funds for services and supports needed to help seniors and people with disabilities transition from institutional care to community-based care.
Absent a reauthorization by Congress, KFF surveys show that nine of the 44 states will have exhausted their current funds by the end of this year, and the vast majority of the remaining states expect to run out of money for the program during 2020. Fifteen states report a range of services, activities and staff positions that they expect to discontinue, including services such as community case management, housing relocation assistance and family caregiver training.
The second brief examines the implications of a pending change to “spousal impoverishment” rules in Medicaid that allow married couples to protect a portion of their income and assets should one spouse seek Medicaid coverage for long-term care, so that the other spouse still has adequate resources to meet their needs. A provision of the Affordable Care Act that requires state Medicaid programs to apply such rules to home and community-based long-term care is set to expire at the end of December.
That could tip the balance of financial incentives toward institutional care, to which the rules would still apply, and affect the efforts that states have made through waivers to expand access to home and community-based services (HCBS), the brief explains. Following a decades-long shift, the majority of Medicaid long-term services and supports spending now goes toward HCBS instead of institutional care. Medicaid spent $167 billion on long-term services and supports in 2016, with 57 percent on HCBS.
If Congress does not extend the ACA provision, states would still have the option to continue applying the spousal impoverishment rule to at least some enrollees in HCBS. However, a KFF survey finds that at least 14 states expect the expiration of the ACA provision to have an effect on Medicaid enrollees who are receiving such services.
Medicaid’s Money Follows the Person (MFP) demonstration provides states with enhanced federal matching funds for services and supports to help seniors and people with disabilities move from institutions to the community. Over 90,000 people have participated in MFP from 2007 through June 2018.
With a short-term funding extension set to expire on December 31, 2019, MFP’s future remains uncertain for the 44 states participating in the program, without a longer-term reauthorization by Congress. Twenty percent of MFP states will have exhausted their current funds by the end of 2019, and the vast majority of the remaining states expect to do so during 2020.
Over one-third of MFP states identified a range of services that they expect to discontinue if federal funding expires, with community transition services most often cited. States also expect that they will not be able to maintain staff and activities focused on enrollee outreach and community housing, which are financed with enhanced federal matching funds.
Medicaid’s Money Follows the Person (MFP) demonstration has helped seniors and people with disabilities move from institutions to the community by providing enhanced federal matching funds to states since 2007.1 The program operates in 44 states (Figure 1 and Table 1), and has served over 90,000 people as of June 2018.2 Box 1 below provides more information about the MFP population, services, and financing. MFP seeks to reduce the Medicaid program’s institutional bias, which exists because nursing facility services must be covered, while most home and community-based services (HCBS) are provided at state option. The program is credited with helping many states establish formal institution to community transition programs that did not previously exist by enabling them to develop the necessary service and provider infrastructure.3 It also has been a catalyst for states to develop housing-related activities as states have used MFP funds to offer housing-related services and hire housing specialists to help beneficiaries locate affordable accessible housing, which is routinely cited as a major barrier to transitions.4
Figure 1: Money Follows the Person (MFP) Program Funding Status by State, 2019
With a short-term funding extension set to expire on December 31, 2019, MFP’s future remains uncertain without a longer-term reauthorization by Congress. MFP is a federal grant program created as part of the Deficit Reduction Act of 2005, and subsequently extended by the Affordable Care Act, with total funding increased to $4 billion.5 Although states were set to fully phase-out their MFP programs in federal fiscal year 2020, Congress has provided $254.5 million in additional funds in three short-term extensions of the program through December 2019.6 This issue brief highlights new data about the status of states’ MFP funding and the services and activities that would be affected if the program is not reauthorized. The brief draws on data from the Kaiser Family Foundation’s most recent 50-state Medicaid home and community-based services (HCBS) survey and 50-state Medicaid budget survey.
Figure 2: State MFP programs have transitioned more than 90,000 institutional residents back to the community
Box 1: MFP Enrollees, Services, and Financing
Over 90,000 people have moved from institutions to the community with support provided by MFP from 2007 through June 2018. Over 80 percent of MFP enrollees are people with physical, mental health, or adult-onset cognitive disabilities, and less than 20 percent are people with intellectual or developmental disabilities (I/DD) (Figure 2). While people with mental health disabilities comprise a small share of all MFP enrollees, states increasingly have focused on meeting this population’s typically greater needs as MFP programs became more established. One study shows a 77 percent increase in cumulative transitions for people with mental health disabilities in less than two years (1,790 in 2013 to 3,174 in mid-2015).7
MFP’s enhanced matching funds are available for HCBS to support beneficiaries during their first year in the community, after residing in an institution for more than 90 consecutive days. States receive an enhanced matching rate (within a range of 75% to 90%8 ) during the first year that an enrollee lives in the community for Medicaid HCBS that are covered through the state plan benefit package or a waiver. These services typically include personal care, adult day health, case management, homemaker, habilitative, and respite. States also receive the enhanced matching rate for “demonstration services,” which are additional HCBS provided during the enrollee’s first year in the community and in a manner or amount not otherwise available to Medicaid enrollees, such as transition coordination services or additional personal care hours. Enhanced matching funds are drawn down from the state’s MFP grant. From 2007 through 2016, states were awarded MFP grants ranging from nearly $6 million in South Dakota to nearly $400 million in Texas.9 Through MFP, states also provide services to help beneficiaries overcome barriers to returning to community living after residing in an institution for an extended period. These “supplemental services,” such as security and utility deposits and household set up costs, are not necessarily long-term care in nature and are reimbursed at the state’s regular matching rate.
States must use their enhanced matching funds for initiatives to shift their long-term care spending in favor of HCBS over institutional care. The activities most frequently financed by enhanced matching funds include expanding HCBS waiver capacity, providing access to transition services, improving access to affordable accessible housing, engaging in outreach, training direct care workers and medical providers, developing enrollee needs assessments, and supporting administrative data and tracking systems.10
Key Findings
Twenty percent (9 of 44) of MFP states will have exhausted their current funds by the end of 2019, and the vast majority of the remaining states expect to do so during 2020. Seven states (KS, LA, MA, MI, SD, TN, and WA) already have exhausted their MFP funds, and two more (AR and DE) expect to do so by December 2019 (Figure 1 and Table 1). Thirty-four states report they have not yet expended all of their MFP funds, although the vast majority of this group anticipates that their current funding will be exhausted during 2020.11
Over one-third (15 of 44) of MFP states identified a range of services and other program activities and staff positions that they expect to discontinue if federal funding expires (Table 1). Community transition services were most often cited as being at risk of discontinuing once MFP funds are exhausted. Other services that states expect to discontinue include community case management, housing relocation assistance, and family caregiver training. Program staff positions and activities that states expect to discontinue without additional federal funding include outreach specialists, housing specialists, and training for care coordinators and providers, among other activities. States use their enhanced matching funds to finance initiatives to expand HCBS, as described in Box 1 above, and may not be able to continue these activities if federal funding is lost.
Just over one-quarter (12 of 44) of MFP states already have added new services to existing HCBS waivers in anticipation of federal funding expiring (Table 1). These include 12 waivers serving seniors and people with physical disabilities, 11 waivers serving people with I/DD, three waivers serving people with brain injuries, and one waiver serving people with mental health disabilities. All of these states have added transition services (CO, DE, GA, ID, IN, MA, ND, OH, SD, VA, WA, and WV) to support individuals in the community up to a year after leaving an institution. In addition, Michigan has a Section 1915 (i) HCBS state plan amendment awaiting CMS approval to add transition services for seniors and adults with physical disabilities to replace MFP funding. Several states added other services to their waivers in addition to transition services. For example, Colorado added life skills training, home delivered meals, and peer mentorship to six waivers, Massachusetts added orientation and mobility services, Ohio added community integration services, and Washington added goods and services.
Eight states report plans to add new services to an existing HCBS waiver in anticipation of MFP funds expiring (Table 1). Among these states, four already have added some services to an existing waiver (described in the prior paragraph, GA, ID, IN, OH) and also now plan to add other services, while four states are making these plans for the first time (IA, NE, NJ, SC). Georgia plans to add transition services to its two waivers that do not already include these services. Iowa plans to add three new services, including crisis response, behavioral programming, and mental health outreach, to its waiver serving people with I/DD. Nebraska is exploring adding tenancy services to its waiver serving seniors and adults with physical disabilities. South Carolina plans to add expanded goods and services and transition coordination services to three waivers serving people with HIV/AIDS, seniors, and people with physical disabilities. Ohio is planning to add coaching support services and community integration support services to two waivers serving seniors and people with physical disabilities. NJ is seeking to expand community transition services to add one-time clothing purchase and one-time pantry stocking.
Looking Ahead
With the help of MFP enhanced federal matching funds, states have invested in building and maintaining their transition programs, serving over 90,000 seniors and people with disabilities who have received the services and supports to move from institutions to the community. The national MFP evaluation found that enrollees experienced significant increases in quality of life measures after leaving an institution, and these increases were sustained two years after moving to the community.12 HHS’s report to Congress on MFP noted that “any dollar value placed on these improvements would not adequately reflect what it means for people with significant disabilities when they can live in and contribute to their local communities.”13
The national MFP evaluation found that some individuals would not have transitioned without MFP. After five years of program operation, about 25 percent of older adult MFP enrollees and half of those with I/DD in 17 states would have remained institutionalized without MFP.14 Additionally, MFP enrollees were less likely to return to an institution compared to those who transitioned without MFP.15 Other research has found declines in nursing home occupancy rates and reductions in the number of nursing home residents who never expect to return to the community in states with “robust” MFP programs compared to states without MFP or with a “minimal” program.16 All of these findings show that MFP has contributed to tipping the balance of long-term services and supports (LTSS) spending, with spending on HCBS surpassing spending on institutional care for the first time in 2013, and comprising 57% of total Medicaid LTSS spending as of 2016.17 MFP also has helped states control per enrollee spending, as providing enrollees with HCBS typically costs less than institutional care.18 The national MFP evaluation found that state Medicaid programs realized $978 million in savings during the first year after transition for MFP enrollees through 2013, though all of these savings could not be attributed to MFP. 19
MFP’s future remains uncertain, with current funding exhausted by the end of 2019 in 20 percent of MFP states and most of the remaining states expecting to run out of funds during 2020. While some states have added certain HCBS funded by MFP to other Medicaid authorities in anticipation of the funding expiration, over one-third of MFP states report that some HCBS funded by MFP as well as staff positions to support transitions, such as outreach and housing coordinators, are at risk of ending when federal funding for the program expires. While MFP has contributed to state progress in rebalancing LTSS to date, support would need to be ongoing for states to maintain this progress, especially as the demand for LTSS is expected to grow as the population ages. States continue to report that lack of access to affordable and accessible housing and an inadequate supply of direct care workers are major barriers to serving more people in the community. While there are always competing demands on federal budget funding that could disrupt MFP, there is not a substantive debate over it as there is with many other health programs. However, if Congress does not reauthorize MFP, it could hinder state efforts to help beneficiaries move from institutions to the community.
Table 1: States’ Money Follows the Person (MFP) Program Funding and Future Plans
State
Has MFP Program
Exhausted MFP Funds
Plans to discontinue MFP services and/or program activities if federal funding not reauthorized
Already added MFP services to existing waiver
Plans to add MFP services to existing waiver
Alabama
X
Alaska
N/A
Arizona
N/A
Arkansas
X
X
California
X
X
Colorado
X
X
X
Connecticut
X
Delaware
X
X
DC
X
Florida
N/A
Georgia
X
X
X
Hawaii
X
Idaho
X
X
X
Illinois
X
X
Indiana
X
X
X
Iowa
X
X
Kansas
X
X
Kentucky
X
Louisiana
X
X
X
Maine
X
Maryland
X
NR
Massachusetts
X
X
X
Michigan
X
X
X
*
Minnesota
X
Mississippi
X
TBD
Missouri
X
X
Montana
X
X
Nebraska
X
X
Nevada
X
X
New Hampshire
X
New Jersey
X
X
New Mexico
N/A
New York
X
X
North Carolina
X
North Dakota
X
X
Ohio
X
X
X
Oklahoma
X
X
Oregon**
N/A
Pennsylvania
X
Rhode Island
X
South Carolina
X
X
X
South Dakota
X
X
X
Tennessee
X
X
X
Texas
X
Utah
N/A
Vermont
X
TBD
Virginia
X
X
X
Washington
X
X
X
West Virginia
X
X
X
Wisconsin
X
Wyoming
N/A
TOTAL:
44
7
15
12
8
NOTES: N/A = not applicable. NR = no response to survey question. TBD = state’s plans to be determined. HCBS waivers include § 1915 (c) and § 1115. *Additionally, MI is adding services to a § 1915 (i) state plan amendment. **OR discontinued its MFP program in 2010.SOURCES: KFF survey of Medicaid officials in 50 states and DC conducted by HMA, Oct. 2019; KFF Medicaid HCBS Program Survey, FY 2018.
Endnotes
To qualify for MFP, individuals must reside in an institution for more than 90 consecutive days and move to a house, apartment, or group home with less than four residents. ↩︎
The MFP enhanced federal matching rate is determined by subtracting the state’s regular matching rate from 100%, dividing the result in half, and then adding that number of percentage points to the state’s regular matching rate. The MFP enhanced matching rate is capped at 90%. ↩︎
The majority of MFP states consistently reported per enrollee spending for MFP enrollees receiving HCBS to be lower than those in institutions, and no state reported that institutional costs were lower than HCBS in KFF surveys of MFP states in 2008, 2010, 2011, 2012, 2013, and 2015. A couple of states using capitated managed care reported that HCBS and institutional costs were comparable due to a blended capitation rate. KFF, Money Follows the Person: A 2015 State Survey of Transitions, Services, and Costs (Oct. 2015). ↩︎