News Release

Analysis Finds 14 Million Medicare Part D and Large Employer Plan Enrollees Used Mail-Order Pharmacies Pre-Pandemic, Top Drugs Filled Were to Treat Chronic Conditions

Published: Aug 20, 2020

With questions being raised about potential delays in U.S. Postal Service delivery, a new KFF data note estimates 14 million enrollees in Medicare Part D and large employer plans relied on mail-order pharmacies for at least one prescription in 2018, with a total of over 170 million prescriptions fulfilled.

The use of mail-order pharmacies has been rising in recent years as patients have often been incentivized or mandated to use mail service for convenience and potential cost savings. This year’s COVID-19 pandemic has further boosted the use of mail-order pharmacies as government officials imposed stay-at-home orders and people stocked up on prescriptions.

The analysis finds that drugs for cardiovascular conditions made up half of the top ten drugs fulfilled by mail order for both Medicare Part D and large employer plan enrollees. More generally, drugs to treat chronic physical conditions and depression were among the most filled mail order prescriptions in both types of markets analyzed. Among large employer enrollees, 10% of all oral contraceptive prescriptions were filled via mail-order pharmacy, placing them in the top ten.

Mail Delays Could Affect Mail-Order Prescriptions for Millions of Medicare Part D and Large Employer Plan Enrollees

Published: Aug 20, 2020

Data Note

In July, the new Postmaster General instituted changes in the operation of the U.S. Postal Service that could result in delays in mail delivery. More recently, the post office has suspended these changes until after the November election. Prior to the announcement that he was postponing these changes, the Postmaster General had warned states of the possibility that mail-in ballots requested close to state deadlines would not be received in time to be counted in November’s election. Changes to the Postal Service’s delivery standards have potential implications that extend beyond those for the election.

Potential mail service delays could also be a concern for people who receive prescription drugs from mail-order pharmacies. In 2019, sales of mail-order prescriptions in the U.S. totaled nearly $145 billion (excluding rebates), with residents of some states more likely than others to use mail-order pharmacies. Mail service delays could affect a relatively large number of people in the midst of the COVID-19 pandemic. Data from the first seven months of 2020 shows that use of mail order increased by up to 20% over 2019 levels in the early weeks of the pandemic as patients stocked up on prescriptions and avoided retail settings, but as of late July, mail-order use is up only slightly compared to the same period last year. Getting prescriptions through mail-order pharmacies can offer convenience and cost savings to patients. Many large group plan enrollees choose to fill prescriptions at reduced cost through the mail, while others are only able to fill scripts at a mail-order pharmacy.

To understand who may be most affected by delays in the delivery of prescription drugs, we analyzed use of mail order in Medicare Part D and large group employer plans, and identified the therapeutic classes and specific drugs with the highest volume of fills by mail-order pharmacies in each market.

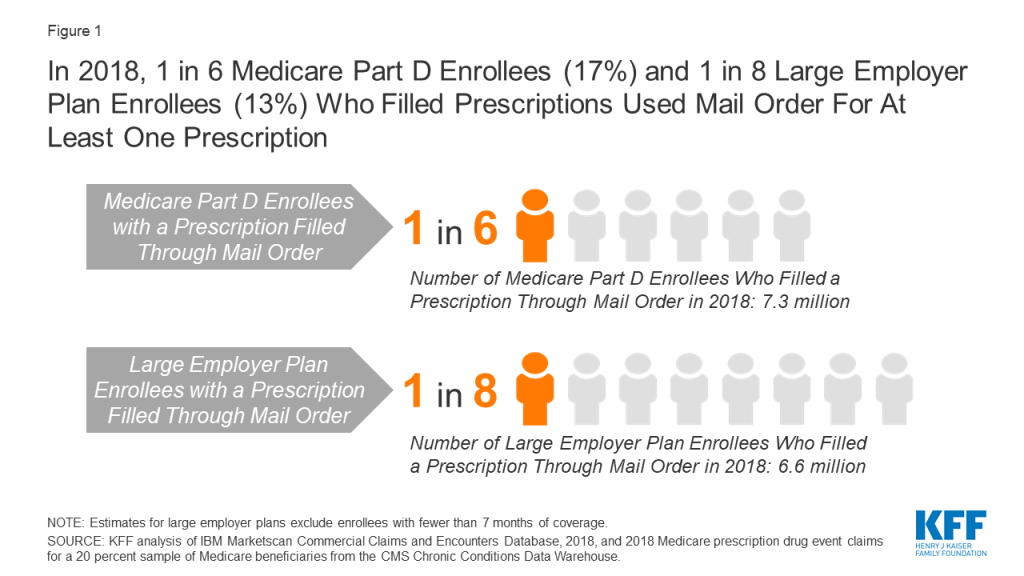
Based on 2018 data that predates the pandemic, 17% of Medicare Part D beneficiaries (7.3 million) and 13% of large employer plan enrollees (6.6 million) with prescription use had at least one prescription delivered from a mail-order pharmacy (Figure 1). Of the 157 million people who had employer coverage in 2018, 82 million were covered by an employer with 1,000 or more employees. In total, Medicare Part D beneficiaries and enrollees in large group employer plans filled 8% and 9% of prescriptions by mail order, accounting for 115 million and 58 million prescription fills respectively (Table 1). These estimates do not take into account mail-order use by people with other sources of coverage, including Medicaid, Marketplace plans, small-group enrollees, or the Veterans Administration.

Figure 1: In 2018, 1 in 6 Medicare Part D Enrollees (17%) and 1 in 8 Large Employer Plan Enrollees (13%) Who Filled Prescriptions Used Mail Order For At Least One Prescription

Across both Medicare Part D and large group employer plans, cardiovascular agents made up five of the top 10 therapeutic classes in terms of mail-order prescription fills in 2018 (Table 1). In each population, antihyperlipidemic drugs to aid in lowering cholesterol had the largest number of prescriptions filled by a mail-order pharmacy. Among Medicare Part D beneficiaries, 14% of antihyperlipidemic drugs were filled by mail (16.5 million prescriptions), while 20% of drugs in this class were filled by mail by large employer plan enrollees (6.7 million prescriptions).

Among large employer enrollees, oral contraceptives were among the top 10 therapeutic classes with prescriptions filled by mail order. In 2018, 10% percent of oral contraceptive prescriptions (2.4 million) filled by enrollees in a large group plan were filled by a mail-order pharmacy. Other classes that rank in the top 10 for mail-order prescriptions include certain diabetes medications, with 15% of prescriptions (2.5 million) for large employer enrollees and 11% of prescriptions (4.7 million) for Medicare Part D enrollees filled by mail order in 2018, and antidepressants, with 10% of prescriptions (5.7 million) for large employer enrollees and 7% of prescriptions (6.5 million) for Medicare Part D enrollees filled by mail order in 2018.

The top 10 drugs by volume of prescriptions filled by mail order in 2018 were the same for Medicare Part D and large employer plans, though the rankings vary slightly, and include several medications to treat high cholesterol and hypertension (Table 2). Among Medicare Part D enrollees, atorvastatin, which is used to treat high cholesterol, had the highest volume of mail-order fills (6.6 million, or 13% of all prescriptions for this product in 2018); among enrollees in large employer plans, levothyroxine sodium, which treats hypothyroidism, had the highest volume of mail-order fills (3.1 million, 16%).

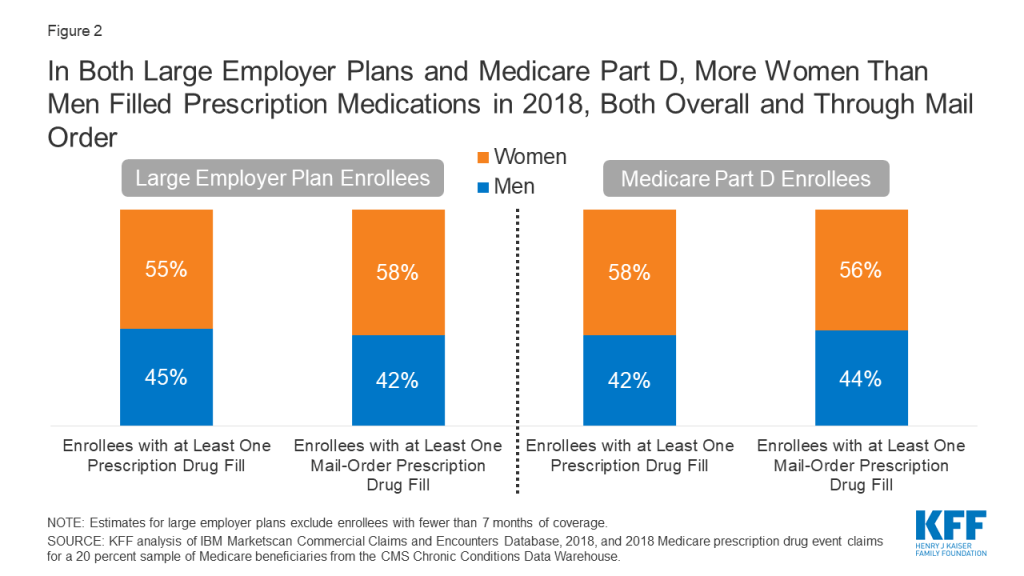
More women than men in both large employer plans and Medicare Part D filled prescription drugs and received at least one mail-order prescription drug in 2018 (Figure 2). Stratifying by age among individuals in large employer plans, among reproductive age individuals (ages 15 to 43) in large employer plans, a higher share of women than men had at least one mail-order prescription drug claim (11% for women in this age group versus 7% for men), which is partially driven by mail-order use for contraception. There were no differences by gender in the percentage of those who have at least one mail-order prescription among children ages 0-14 or individuals ages 44 to 64 (3% and 22% respectively).

Figure 2: In Both Large Employer Plans and Medicare Part D, More Women Than Men Filled Prescription Medications in 2018, Both Overall and Through Mail Order

Drugs used to treat chronic conditions, including hypothyroidism, high cholesterol, hypertension, and type 2 diabetes, are among the prescriptions most commonly filled by mail order for Medicare Part D enrollees and large employer plan enrollees, whether measured by therapeutic class or product. Therefore, delays in delivery due to changes to the operations of the U.S. Postal Service could lead to negative health consequences if it compromises patients’ ability to adhere to their medication regimens.

Tables

Table 1: Top 10 Therapeutic Classes Filled by Mail Order in Medicare Part D and Large Employer Plans,by Volume of Prescriptions, 2018
Therapeutic classTherapeutic groupNumber of prescriptions filled by mail orderNumber of enrollees with mail-order prescriptionAmong all prescriptions filled within therapeutic class, share filled by mail order
Medicare Part D
TOTAL, all classes114,888,2007,293,6357.8%
  Antihyperlipidemic Drugs, NECCardiovascular Agents16,517,5654,449,52014.1%
  Cardiac, Beta BlockersCardiovascular Agents8,923,5452,552,12011.6%
  Cardiac, ACE InhibitorsCardiovascular Agents6,934,9751,974,12012.8%
  Psychotherapeutics, AntidepressantsCentral Nervous System6,534,3951,659,3456.9%
  Cardiac, Calcium ChannelCardiovascular Agents6,453,3801,873,32511.3%
  Cardiac Drugs, NECCardiovascular Agents6,021,1951,717,62013.2%
  Thyroit/Antithyroid, Thyroid/HormonesHormones & Synthetic Substitutes5,803,4101,561,60512.4%
  Gastrointestinal Drug Misc, NECGastrointestinal Drugs5,642,4201,700,5809.7%
  Antidiabetic Agents, MiscHormones & Synthetic Substitutes4,693,6301,280,35510.8%
  Misc Therapeutic Agents, NEC*Misc Therapeutic Agents2,984,960741,87011.7%
Large Employer Plans
TOTAL, all classes58,076,5116,552,5689.1%
  Antihyperlipidemic Drugs, NECCardiovascular Agents6,743,9341,807,41520.1%
  Psychotherapeutics, AntidepressantsCentral Nervous System5,723,7191,466,37610.3%
  Thyroid/Antithyroid, Thyroid HormonesHormones & Synthetic Substitutes3,409,575897,76815.9%
  Cardiac, ACE InhibitorsCardiovascular Agents3,185,892922,54915.6%
  Cardiac, Beta BlockersCardiovascular Agents2,680,792780,26815.5%
  Cardiac Drugs. NECCardiovascular Agents2,574,019747,70816.1%
  Antidiabetic Agents, MiscHormones & Synthetic Substitutes2,512,233665,01415.0%
  Contraceptive, Oral Comb, NECHormones & Synthetic Substitutes2,411,000683,44510.3%
  Gastrointestinal Drugs Misc, NECGastrointestinal Drugs2,335,366711,48513.1%
  Cardiac, Calcium ChannelCardiovascular Agents2,043,871604,57814.5%
NOTE: NEC is not elsewhere classified. Estimates for large employer plans exclude enrollees with fewer than 7 months of coverage. *Less than 1% of prescriptions in the “Misc Therapeutic Agents, NEC” class are categorized in the “Respiratory Tract Agents” therapeutic group.SOURCE: KFF analysis of IBM Marketscan Commercial Claims and Encounters Database, 2018, and 2018 Medicare prescription drug event claims for a 20 percent sample of Medicare beneficiaries from the CMS Chronic Conditions Data Warehouse.
Table 2: Top 10 Drug Products Filled by Mail Order in Medicare Part D and Large Employer Plans, by Volume of Prescriptions, 2018
Drug productNumber of prescriptions filled by mail orderNumber of enrollees with mail-order prescriptionAmong all prescriptions filled for drug product, share filled by mail orderIndicationCommon brand names
Medicare Part D
Atorvastatin calcium6,636,7651,967,55513.0%high cholesterolLipitor
Levothyroxine sodium5,698,6301,548,50012.5%hypothyroidismLevothroid, Levoxyl, Synthroid, Unithroid
Amlodipine besylate4,581,6751,350,76011.2%hypertensionKaterzia, Norvasc
Lisinopril4,353,8651,265,54011.7%hypertensionPrinivil, Zestril
Simvastatin3,776,1251,089,48516.1%high cholesterolZocor
Metformin HCL3,696,3851,104,53512.2%type 2 diabetesGlucophage
Omeprazole3,264,8101,004,74011.3%acid reflux, ulcers, heart burnPrilosec
Losartan potassium3,120,395949,99512.6%hypertensionCozaar
Metoprolol succinate2,992,240880,12012.8%hypertension, angina, heart failureKapspargo Sprinkle, Toprol XL
Hydrochlorothiazide2,288,360690,80513.4%hypertensionMicrozide
Large Employer Plans
Levothyroxine sodium3,072,413837,58116.3%hypothyroidismLevothroid, Levoxyl, Synthroid, Unithroid
Atorvastatin calcium2,858,703864,83318.9%high cholesterolLipitor
Lisinopril2,067,537608,62515.2%hypertensionPrinivil, Zestril
Metformin HCL1,762,022544,08915.5%type 2 diabetesGlucophage
Amlodipine besylate1,349,224407,71713.6%hypertensionKaterzia, Norvasc
Simvastatin1,196,826348,01423.1%high cholesterolZocor
Losartan potassium1,117,641348,87015.3%hypertensionCozaar
Omeprazole1,077,168339,34313.4%acid reflux, ulcers, heart burnPrilosec
Metoprolol succinate965,373281,24916.2%hypertension, angina, heart failureKapspargo Sprinkle, Toprol XL
Hydrochlorothiazide939,555287,64614.6%hypertensionMicrozide
NOTE: Estimates for large employer plans exclude enrollees with fewer than 7 months of coverage. Includes all prescriptions for products containing the specified generic name. Does not reflect combination products that include the active ingredient. Each of the top 10 drugs are available generically. The “common brand names” field is provided as an example of branded versions, though these do not account for all of the mail-order fills for any of these top 10 drug products.SOURCE: KFF analysis of IBM Marketscan Commercial Claims and Encounters Database, 2018, and 2018 Medicare prescription drug event claims for a 20 percent sample of Medicare beneficiaries from the CMS Chronic Conditions Data Warehouse.

Methods

For the analysis of large employer plans, we analyzed a sample of medical claims obtained from the 2018 IBM Health Analytics MarketScan Commercial Claims and Encounters Database, which contains claims information provided by large employer plans. We only included claims for people under the age of 65, as people over the age of 65 are typically on Medicare. This analysis used claims for almost 18 million people representing about 22% of the 82 million people in the large group market in 2018. Seventy percent of larger group enrollees who were enrolled for more than six months had at least one prescription drug claim in the year. Weights were applied to match counts in the Current Population Survey for enrollees at firms of 1,000 or more workers by sex, age and state. Weights were trimmed at eight times the interquartile range.

For the analysis of Medicare Part D, we used the 2018 Medicare Part D prescription drug event (PDE) claims data from the Centers for Medicare & Medicaid Services (CMS) Chronic Conditions Data Warehouse (CCW) for a 20 percent sample of Medicare beneficiaries. The analysis was limited to enrollees who filled a prescription in 2018, which equaled 42.9 million enrollees out of 46.1 million total (93.1%).

For both datasets, MarketScan’s Red Book was used to classify drugs by generic id and the therapeutic/pharmacologic category of the drug product. Drug spending paid for by someone other than an enrollee’s insurer, drugs administered in an inpatient setting, or not classified under the controlled substance act were excluded. Each prescription drug claim was counted as a single prescription regardless of the quantity or strength of that prescription. Drugs were grouped by the generic drug name, which may include multiple brands, but treats combination products separately.

To identify prescriptions filled by a mail-order pharmacy, we used the field indicating the type of pharmacy that filled the prescription. It is not possible to determine the method by which the prescription was subsequently mailed, and thus the totals here reflect prescriptions delivered via the U.S. Postal Service, as well as those delivered by other services, such as FedEx or UPS. In the Part D claims, specialty pharmacy claims are reported separately from mail-order pharmacy claims, although in some cases, specialty pharmacies may ship directly to patients; our analysis does not count these prescriptions as mail order because we are unable to identify them as such.

News Release

Analysis: Many Private Insurers Offer Financial Relief for COVID-19 Treatment, but Cost-Sharing Waivers Are Expiring

Published: Aug 20, 2020

A new analysis finds that most people with individual or fully-insured group market coverage are in plans that waived cost-sharing for COVID-19 treatment, though many of those waivers are set to expire in the coming months.

About 88% – nearly nine in ten – enrollees in the individual and fully-insured group markets are covered by plans that have taken action to limit out-of-pocket costs for patients undergoing treatment for COVID-19 since the start of the pandemic. However, after accounting for waivers that have already expired (20%) or are scheduled to expire by the end of September (16%), just over half of enrollees in these plans will still be eligible for waived cost-sharing in October and beyond.

The estimates do not include the 61% of group market enrollees in self-insured plans through their employers. While many people with job-based health insurance may be covered by private insurers that are waiving cost-sharing for COVID-19 treatment, if their plan is self-insured, their employer can opt out extending cost-sharing and other financial relief to employees.

While emergency federal legislation has made COVID-19 testing available at no cost to most people, there is no federally mandated limit on out-of-pocket costs for COVID-19 treatment. KFF estimates that an inpatient admission for COVID-19 treatment could generate more than $1,300 in out-of-pocket costs for a person in a large employer-sponsored plan and costs could be much higher for people who are severely sick; the average costs that enrollees in individual and small group market plans can expect to pay may also be higher, given that these plans typically have higher deductibles. Additionally, enrollees in plans that waive cost-sharing for COVID-19 treatment may still be responsible for costs associated with the use of out-of-network providers or services.

The brief also finds that a smaller number of enrollees (23%) in individual and fully-insured group market plans are eligible for some form of premium relief amid the pandemic, including premium credits or reductions, grace periods for premium payment, and/or expedited Medical Loss Ratio (MLR) rebates.

A related analysis examines steps private insurers have taken expand the use of telemedicine during the pandemic, including waived cost-sharing for plan enrollees.

The issue brief is available on the Peterson-KFF Health System Tracker, an online information hub dedicated to monitoring and assessing the performance of the U.S. health system.

Health and Financial Risks for Noncitizen Immigrants due to the COVID-19 Pandemic

Published: Aug 18, 2020

Summary

The COVID-19 pandemic has taken a disproportionate toll on some groups of individuals, including lower income individuals and people of color. One group who faces risks and challenges associated with the pandemic is the nearly 22 million noncitizen immigrants living in the U.S. today. Non-citizen immigrants were already facing a range of challenges prior to the pandemic, including increased fear and uncertainty due to shifting immigration policy that was leading some to turn away from accessing programs and services. As virus hotspots have risen in the Southern and Western regions of the country, with reports of increases in towns along the U.S.-Mexico border, understanding the risks and challenges facing noncitizen immigrants is of increasing importance. This brief analyzes key characteristics of noncitizen immigrants to examine the health and economic risks they face amid the pandemic. It finds:

  • Noncitizen immigrants are more likely to live in large households and in urban areas compared to citizens. Overall, 33% of noncitizen immigrants live in a household with more than four people compared to 21% of citizens. Noncitizens also are more likely than citizens are to live in an urban area (96% vs. 86%).
  • There are nearly 13 million noncitizen immigrant workers who make up 8% of the overall workforce and are concentrated in jobs that cannot be done virtually. Nearly one in four (23%) noncitizen workers are in the construction and restaurant and food services industries. Occupations that employ the largest numbers of noncitizen workers include construction laborers, cooks, janitors and building cleaners, agricultural workers, and maids and housekeepers, where they also account for a high share of all workers.
  • Noncitizen workers are more likely to rely on public transportation to commute to their job and to be low-income compared to their citizen counterparts. Nearly one in four (24%) noncitizen workers rely on public transportation or carpools to commute to their job compared to 12% of citizen workers. They also are twice as likely live in a low-income household compared to citizen workers (36% vs. 18%).
  • Noncitizen immigrants are significantly more likely to be uninsured than citizens. Among the nonelderly population, 33% of noncitizen immigrants are uninsured compared to 9% of citizens.

Taken together, noncitizen immigrants’ living, working, and commuting situations increase their risk for exposure to coronavirus. They are more likely to live in larger households in densely populated areas that make social distancing challenging. Moreover, because many noncitizens workers are employed in jobs that cannot be done from home and have lower incomes, many cannot afford to stay home to limit risk of exposure and/or if they are sick. Their lower incomes and work in service industries that have experienced cutbacks amid the pandemic also increase their risks of experiencing financial hardship. Noncitizen immigrants also may have difficulty accessing testing and treatment due to their higher uninsured rate and immigration-related fears. Although noncitizen immigrants face increased risks associated with the pandemic, restrictions limit immigrants’ eligibility for federal health and financial relief provided in response to COVID-19. Further, those who are eligible for assistance may be reluctant to access services or supports due to immigration-related fears. The extent to which COVID-19 response efforts address challenges facing immigrant families has implications for immigrant families as well as the health and economic stability of the broader population, particularly given the role immigrants play in the nation’s workforce.

Issue Brief

Overview of Noncitizen Immigrants

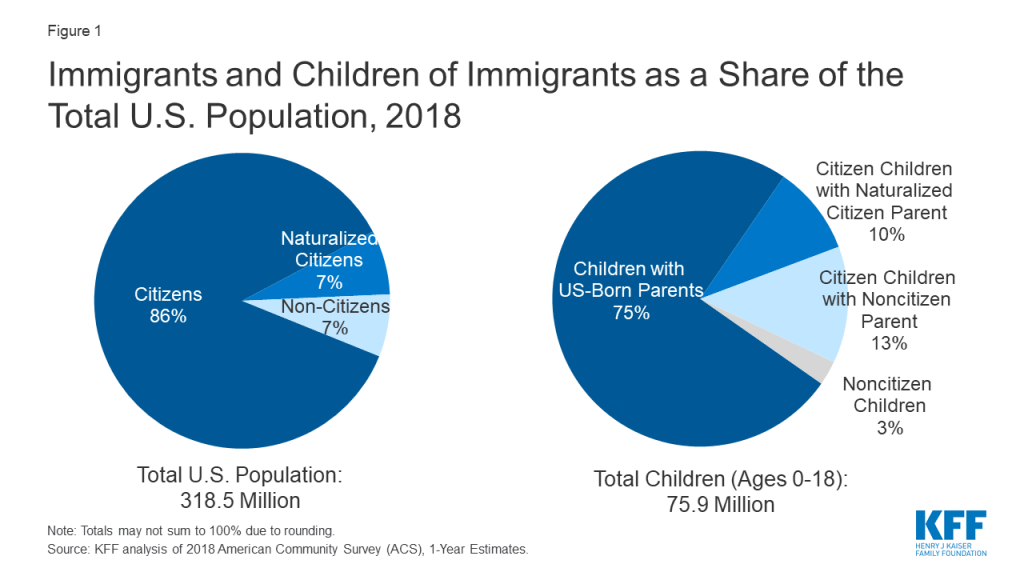
As of 2018, there were nearly 22 million noncitizen immigrants living in the United States, making up roughly 7% of the total population (Figure 1). Noncitizens include lawfully present and undocumented immigrants. Many individuals live in mixed status families that may include lawfully present immigrants, undocumented immigrants, and/or citizens. Over two-thirds (67%) of noncitizens lived in a household (which may include their family or unrelated household members) with a citizen. While there are few noncitizen children overall, about 10 million or nearly 13% of citizen children have a noncitizen parent.

Figure 1: Immigrants and Children of Immigrants as a Share of the Total U.S. Population, 2018

Key Characteristics of Noncitizen Immigrants

This analysis presents data on the living situations, employment and commuting patterns, income, and health insurance for noncitizen immigrants prior to the COVID-19 pandemic. It is based on KFF analysis of 2018 American Community Survey data (see Methods for more details.) Although these data show characteristics of noncitizen immigrants prior to the pandemic, they provide insight into the health and financial risks they face associated with the pandemic.

Living Situations

Non-citizen immigrants are more likely than citizens to live in larger households and urban areas, potentially increasing their risk of exposure to the virus. Overall, 33% of noncitizen immigrants live in a household with more than four people compared to 21% of citizens, and 8% nonelderly noncitizen immigrants live with someone aged 65 or over. Noncitizens also are more likely than citizens are to live in an urban area (96% vs. 86%).

Employment, Commuting, and Income

The nearly 13 million noncitizen workers, who make up 8% of the overall workforce, are concentrated in jobs that generally cannot be done virtually. Nearly one in four (23%) noncitizen workers are in the construction and restaurant and food services industries (Figure 2).

Figure 2: Distribution of Noncitizen Immigrant Workers by Industry, 2018

Occupations that employ the largest numbers of noncitizen workers include construction laborers, cooks, janitors and building cleaners, agricultural workers, and maids and housekeepers, where they also account for a high share of all workers. For example, they account for over four in ten agricultural workers (42%), 30% of maids and housekeepers, one in five (20%) cooks, and 16% of janitors and building cleaners (Figure 3). Noncitizen workers also contribute to the health care workforce. They make up 5% of workers in the health care industry and up to 10% of all aides and personal care workers and direct contact support workers in home health care and nursing and residential care facilities.

Figure 3: Share of Workers who Are Noncitizen Immigrants in Top Five Occupations Held by Noncitizen Workers, 2018

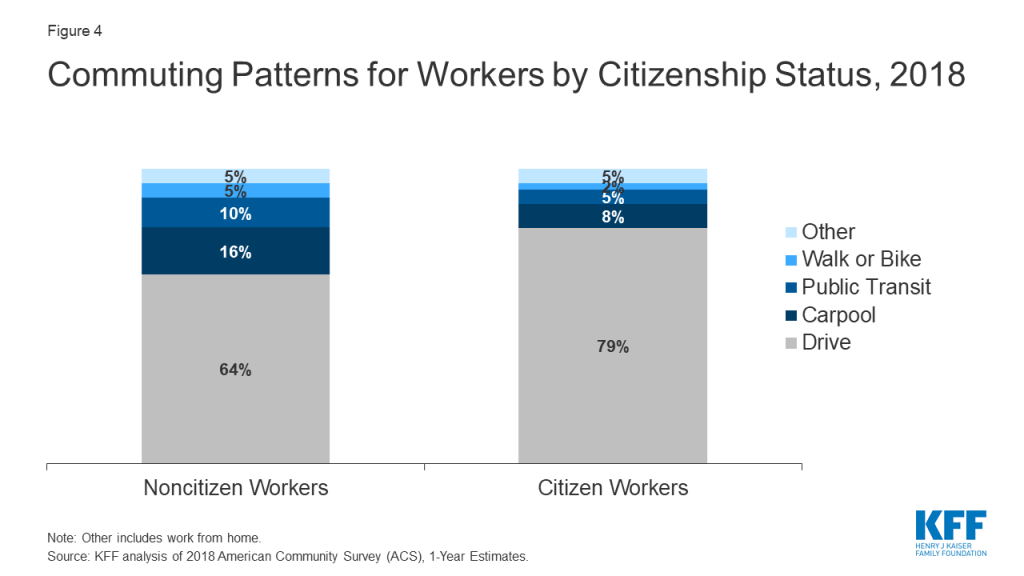
Prior to the pandemic, noncitizen workers were more likely than citizen workers to rely on public transportation or carpools to commute to their job (Figure 4). Noncitizens were less likely to drive alone to work compared to citizen workers (64% vs 79%) and were twice as likely as their citizen counterparts were to carpool (16% vs. 8%) and use public transit (10% vs. 5%).

Figure 4: Commuting Patterns for Workers by Citizenship Status, 2018

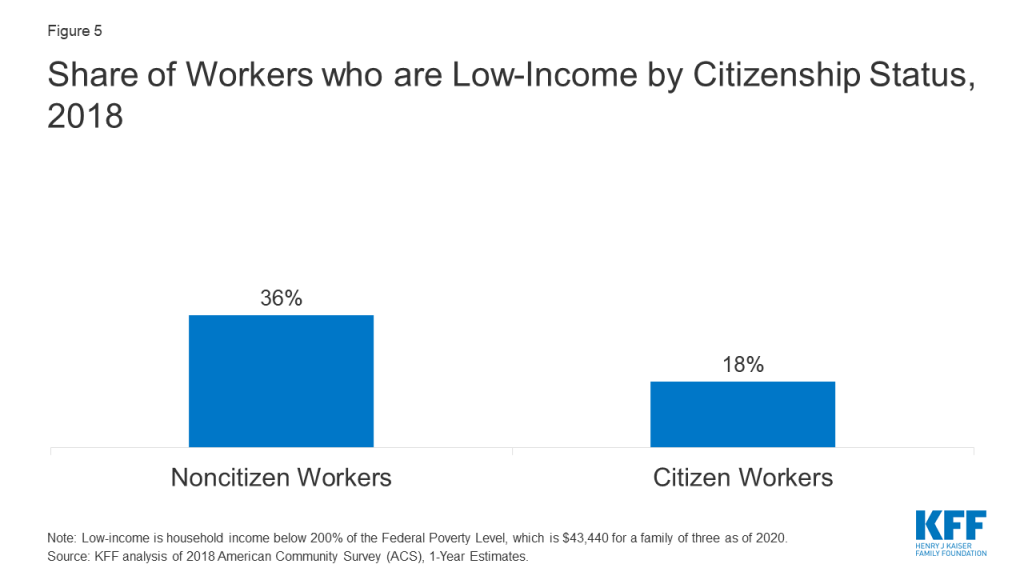
Noncitizen workers twice as likely to be low-income (household income below 200% of the federal poverty level or $43,400 for a family of three as of 2020) compared to their citizen counterparts (36% vs. 18%) (Figure 5).

Figure 5: Share of Workers who are Low-Income by Citizenship Status, 2018

Health Insurance

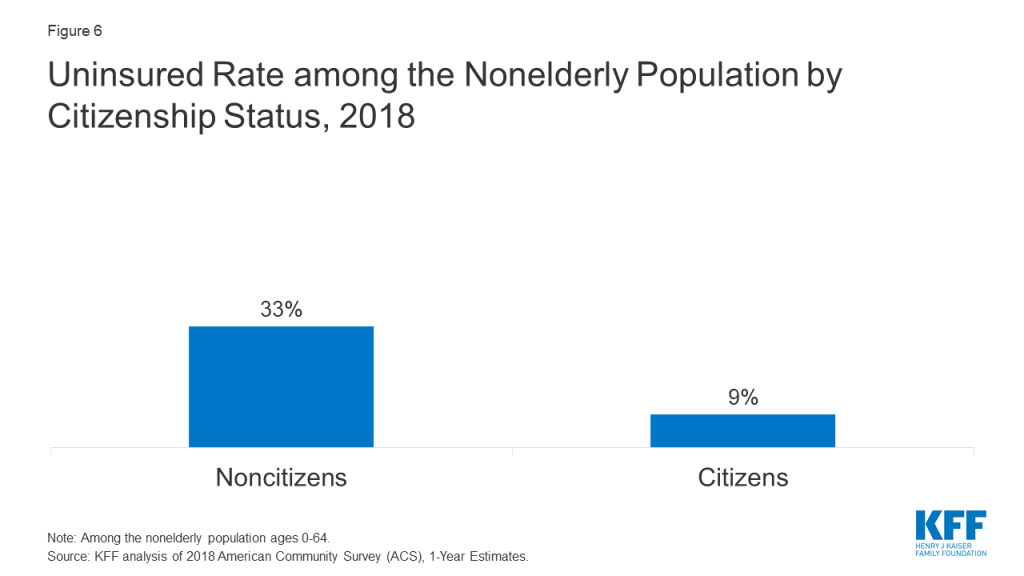
Noncitizen immigrants are significantly more likely than citizens to be uninsured. Among the nonelderly population, 33% of noncitizen immigrants are uninsured compared to 9% of citizens (Figure 6).

Figure 6: Uninsured Rate among the Nonelderly Population by Citizenship Status, 2018

Implications

Taken together, noncitizen immigrants’ living, working, and commuting situations make them more likely to be at risk for exposure to coronavirus. They are more likely to live in larger households in densely populated areas that make social distancing challenging. Moreover, because many noncitizens workers are employed in jobs that cannot be done from home and have lower incomes, many may put themselves at risk of exposure to coronavirus because they cannot afford to stay home and miss work. Noncitizen workers may also face increased risk of exposure due to their reliance on public transportation and carpools. Although data on infections and deaths among immigrants are limited, there have been outbreaks among workers in meatpacking plants and farmworkers, which include high shares of immigrant workers. Moreover, reports indicate that outbreaks are spiking along the U.S.-Mexico border, where large numbers of immigrants live.

Noncitizen immigrants also face increased risks of financial difficulties due to economic impacts of the pandemic. Noncitizen workers are at risk for job cutbacks because many are working in service industries, such as restaurants and food services. Other analysis finds that initial job losses amid the pandemic have been particularly high among immigrants. Given their low incomes, job loss could lead to significant financial pressures for them and their families, including increased difficulty paying for basic needs. Analysis has found that Hispanic adults in families with noncitizens are experiencing higher rates of negative employment impacts because of the pandemic than families where all members are citizens, and that they were more likely to report experiencing hardships such as food insecurity or not being able to pay their full rent or mortgage on time.

Noncitizens immigrants may face increased barriers to accessing testing or treatment due to higher uninsured rates. Immigrants are on average younger and healthier compared to citizens, meaning they face relatively lower risk of experiencing serious illness if infected with coronavirus. However, because they face increased barriers accessing health care, they may have greater challenges accessing testing and treatment that could lead them to delay or forgo seeking care. Research shows that uninsured individuals are less likely to have a usual source of care and more likely to delay or go without care compared to those with insurance. The number of uninsured individuals, including immigrants, is expected to increase as people lose jobs and job-based health coverage due to the pandemic.

Although noncitizen immigrants face increased risks associated with the pandemic, restrictions limit immigrants’ eligibility for federal health and financial relief provided in response to COVID-19.

  • Health coverage and testing and treatment. Under existing rules, eligibility for Medicaid and the Children’s Health Insurance Program (CHIP) is generally limited to lawfully present immigrants who have had lawful status for at least five years, meaning that many recent lawfully present immigrants are ineligible to enroll. Lawfully present immigrants are eligible for Marketplace coverage regardless of their length of time in the country. Undocumented immigrants are not eligible to enroll in Medicaid or CHIP or to purchase coverage through the Affordable Care Act (ACA) Marketplaces. The Families First Act as amended by the Coronavirus Aid, Relief, and Economic Security (CARES) provides a new optional Medicaid category that states can adopt to provide free coronavirus testing to uninsured individuals. However, it does not change the existing immigrant eligibility restrictions for Medicaid, and, as such, does not extend to recent lawfully present and undocumented immigrants. A portion of the $100 billion in federal funding directed to providers under the CARES Act will go to hospitals for treating uninsured patients regardless of immigration status, but how this may affect immigrant access will depend on how the funding is allocated.
  • Financial assistance. The CARES Act provides financial assistance to individuals through a recovery rebate, but it is limited to people filing taxes with Social Security Numbers. Both an individual filer and his or her spouse must have a valid Social Security Number if filing jointly. Other analysis estimates that this requirement excludes 15.4 million people from receiving the rebate. Immigrants generally may qualify for regular unemployment insurance if they are work-authorized at the time they file for unemployment insurance and remain authorized during the period they receive unemployment. However, that leaves undocumented immigrants without access to unemployment support even if they were employed.
  • Some states and localities have taken steps to fill in the gaps in assistance available to immigrant families. For example, as of August 12, 2020, 13 states have expanded Emergency Medicaid to cover COVID-related testing or treatment. Emergency Medicaid provides payments to states for emergency services made on behalf of individuals who are otherwise eligible for Medicaid but for their immigration status. In addition, some states and localities have established financial relief funds to assist immigrants who do not qualify for federal resources.

Growing fear and uncertainty among individuals in immigrant families may also lead to some individuals avoiding accessing services or assistance even if they are eligible for them. Immigration policy changes and enhanced immigration enforcement efforts over the past several years have led to growing fear and uncertainty among immigrant families that are leading some to avoid seeking services, including health care, and/or enrolling in public programs, including health coverage through Medicaid and the Children’s Health Insurance Program (CHIP). These include recent changes to public charge policy that would prevent individuals from obtaining a green card or entry into the U.S. if they are determined likely to use certain public programs, including Medicaid. U.S. Citizenship and Immigration Services (USCIS) posted an alert clarifying that it will not consider testing, treatment, or preventive care (including vaccines if a vaccine becomes available) related to COVID-19 as part of public charge determinations. In addition, Immigration and Customs Enforcement (ICE) has reiterated that, consistent with its existing sensitive locations policy, it will not carry out enforcement operations at or near health care facilities, except in the most extraordinary circumstances. However, families may still be fearful of accessing services or assistance if they are uncertain about current policies.

In sum, noncitizen immigrants face an array of risks and challenges associated with the pandemic. However, they have more limited access to federal support and assistance. The extent to which COVID-19 response efforts address challenges facing immigrant families has implications for immigrant families as well as the health and economic stability of the broader population, particularly given the role immigrants play in the nation’s workforce.

Methods

This analysis is based on a KFF analysis of the 2018 American Community Survey (ACS), 1-year file. The ACS includes a 1% sample of the US population, the subset used here includes over 160,000 non-citizen observations. Industry and Occupation definitions are defined within ACS using the 2018 SOC and the 2017 NAICS – for more information see here. We define workers as adults (18+) who earned at least $1,000 during the year. Metro and non-metro areas are defined by the USDA Economic Research Service.

The ACS asks respondents about their health insurance coverage at the time of the survey. Respondents may report having more than one type of coverage; however, individuals are sorted into only one category of insurance coverage.

News Release

A Review of Multiple Analyses Documents Persistent Racial Disparities in COVID-19

Published: Aug 17, 2020

A KFF review of a wide range of studies finds a consistent pattern that people of color are bearing a disproportionate burden of COVID-19 cases, deaths, and hospitalizations, and that they may face increased barriers to access testing. These disparities, brought to the fore in the pandemic, mirror and compound longstanding underlying disparities in health and health care in the U.S. that stem from structural and systemic barriers across sectors, including racism and discrimination. Other analyses also suggest that the COVID-19 pandemic is taking a larger economic toll on people of color.

Racial Disparities in COVID-19: Key Findings from Available Data and Analysis, as well as other KFF work related to racial disparities and the pandemic, can be found at kff.org.

Racial Disparities in COVID-19: Key Findings from Available Data and Analysis

Authors: Samantha Artiga, Bradley Corallo, and Olivia Pham
Published: Aug 17, 2020

Summary

Over the course of the COVID-19 pandemic, there has been a growing focus on its disproportionate impacts on people of color, particularly as availability of data to understand racial disparities has increased. This brief summarizes key findings from data and analyses examining COVID-19 related cases, deaths, hospitalizations, and testing by race and ethnicity as of early August 2020 to provide increased insight into these disparities. Key findings include the following:

Multiple analyses of available federal, state, and local data show that people of color are experiencing a disproportionate burden of COVID-19 cases and deaths. They show particularly large disparities in cases and deaths for Black and American Indian and Alaska Native (AIAN) people and widespread disparities in cases among Hispanic people compared to their White counterparts. For example, KFF analysis of state reported data showed that, as of August 3, 2020, Black individuals accounted for more cases and deaths relative to their share of the population in 30 of 49 states reporting cases and 34 of 44 states reporting deaths. Other analysis of state-reported data finds that, as of August 4, the COVID-19 related death rate among Black people was over twice as high as the rate for White people, while the mortality rate for AIAN people was nearly two times that of White people. Data also reveal disparities for Asian and Native Hawaiian and Pacific Islander (NHOPI) individuals in certain areas and show a sharp, recent rise in mortality rates for NHOPI and Hispanic people. Analyses further find that disparities in COVID-19 related deaths persist across age groups and that people of color experience more deaths among younger people relative to White individuals. There is limited data and research to understand of impacts for subgroups, such as immigrants, who may be at increased risk.

Data show that Black, Hispanic, and AIAN people are at increased risk of hospitalization due to COVID-19. For example, data from Coronavirus Disease 2019-Associated Hospitalization Surveillance Network (COVID-NET) show that, from March through July 18, 2020, age-adjusted hospitalization rates due to COVID-19 for Black, Hispanic, and AIAN people were roughly five times higher than that of White people. Several studies using health system data also point to a higher risk of hospitalization for Black and Hispanic patients. Reflecting these higher hospitalization rates, analyses show that people of color make up a disproportionate share of COVID-19 hospitalizations relative to their share of the population or total hospital visits.

Studies find racial/ethnic disparities in COVID-19 among Medicare beneficiaries, nursing home facilities, pregnant women, and children. Preliminary Medicare COVID-19 data show that Black, Hispanic, and AIAN Medicare beneficiaries had higher rates of infection and hospitalization compared to White beneficiaries. Analysis finds that nursing homes where a higher share of residents are people of color are more likely to report a COVID-19 case. Studies also find disproportionate shares of infection among Hispanic and Black pregnant women and a higher risk of hospitalization among Black and Hispanic children.

Data to understand variation in testing by race/ethnicity remains very limited but suggest people of color may face increased barriers to testing. Very few states report testing data by race/ethnicity. Data on testing within community health centers analyzed by KFF show that people of color represented more than half of all people tested (57%) and confirmed cases (56%) at health centers, and that Hispanic patients made up a higher share of positive tests compared to their share of total tested patients. Analyses suggest that testing sites in and near predominantly Black and Hispanic neighborhoods are likely to face greater demand than those near predominantly White areas, which could contribute to longer wait times, and the share of people of color in an area is associated with an increase in travel time to a testing site. One study also found that, in New York City, more tests were performed in neighborhoods with a higher share of White residents, while the highest shares of positive tests were in neighborhoods with more people of color and lower socioeconomic measures. Reporting on testing site locations in Texas suggests that testing sites are disproportionately located in areas with larger shares of White residents.

Together, these data show that people of color are bearing a disproportionate burden of COVID-19 cases, deaths, and hospitalizations and that they may face increased barriers to access testing. Other analyses also suggest that the COVID-19 pandemic is taking a larger economic toll on people of color. These disparities in COVID-19 reflect and compound longstanding underlying social, economic, and health inequities that stem from structural and systemic barriers across sectors, including racism and discrimination. For example, prior to the pandemic, people of color had higher rates of health conditions, were more likely to be uninsured and face barriers to accessing health care, and were more likely to have lower incomes and face financial challenges. These underlying disparities put people of color at increased risk for exposure to the virus, experiencing serious illness if they are infected, and facing barriers to accessing testing and treatment.

The health and economic impacts of COVID-19 could further widen racial disparities at a time when there is a growing focus on and call for racial justice and health equity. Overall, the findings highlight the importance of considering how COVID-19 relief and response efforts will address inequities, including in decisions related to distribution of treatments and vaccines once they become available. Prioritizing equity will be key for addressing the current gaps in COVID-19 and health care more broadly and preventing widening of disparities in the future.

Issue Brief

Data on COVID-19 by Race/Ethnicity

At the outset of the COVID-19 pandemic, limited data were available on cases, hospitalization, deaths, and testing disaggregated by race/ethnicity, constraining the ability to understand its effects across communities and to target response and relief efforts. Availability of this data has increased over time and, along with it, there has been a growing body of analyses examining race-associated differences in the impacts of the virus. As of August 2020, nearly all states were reporting COVID-19 related cases and/or deaths by race and/or ethnicity. Following early state reporting of these data, the Centers for Disease Control and Prevention (CDC) began reporting hospitalizations, cases, and deaths by race/ethnicity, and the Centers for Medicare and Medicaid Services (CMS) and Health Resources and Services Administration (HRSA) began reporting limited data. (See Appendix A for a list of federal sources of COVID-19 data by race/ethnicity). Beyond these state and federal data sources, health systems and health insurers may also collect data, but these data typically are not publicly accessible.

While data have improved over time, they continue to have significant gaps and limitations. For example, some states only report either cases or deaths, states use different race/ethnicity categories, states vary in which racial/ethnic groups for which they report data, and some states have high shares of cases with unknown race/ethnicity. The federally reported data provide more standardized race/ethnicity categorizations but still have limitations, including high shares of cases with unknown race/ethnicity as well as lack of state-level data for some measures and inconsistencies that limit comparability of data across states. The federal data on hospitalizations represent a subset of 250 acute care hospitals in 14 states that are part of the Coronavirus Disease 2019-Associated Hospitalization Surveillance Network (COVID-NET). As of early August, data on testing by race/ethnicity remain very limited, with only six states reporting testing by race/ethnicity. In addition, because people of color may be at greater risk for exposure due to their jobs or living circumstances, data on testing rates alone cannot necessarily identify disparities. Data are available for tests conducted at community health centers, which primarily serve low-income patients and communities of color, though the data are not representative of a state’s population and are based on rapid response surveys.

Key Findings on COVID-19 by Race/Ethnicity

Below is a summary of key findings from data and analyses that examine reported COVID-19 cases, deaths, hospitalizations, and testing by race and ethnicity available as of early August 2020.1  (See Appendix B for a list of analysis referenced in this brief.) To collect relevant analyses, we conducted keyword searches of websites for government, research, and policy organizations that publish health-related research; media; and PubMed. While we tried to be comprehensive in our inclusion of studies and findings on this topic, it is possible that we omitted some relevant studies or findings. Moreover, because work in this area is continually developing and growing, research that is more recent may be available that this summary does not reflect.

Cases and Deaths

Multiple analyses of available federal, state, and local data show that people of color are experiencing a disproportionate burden of COVID-19 cases and deaths. They show particularly large disparities in cases and deaths for Black and AIAN people and widespread disparities in cases among Hispanic people compared to their White counterparts. Data also reveal disparities for Asian and NHOPI individuals in certain areas and show a sharp recent rise in mortality rates for NHOPI and Hispanic people. There is limited data and research to understand of impacts for subgroups, such as immigrants, who may be at increased risk.

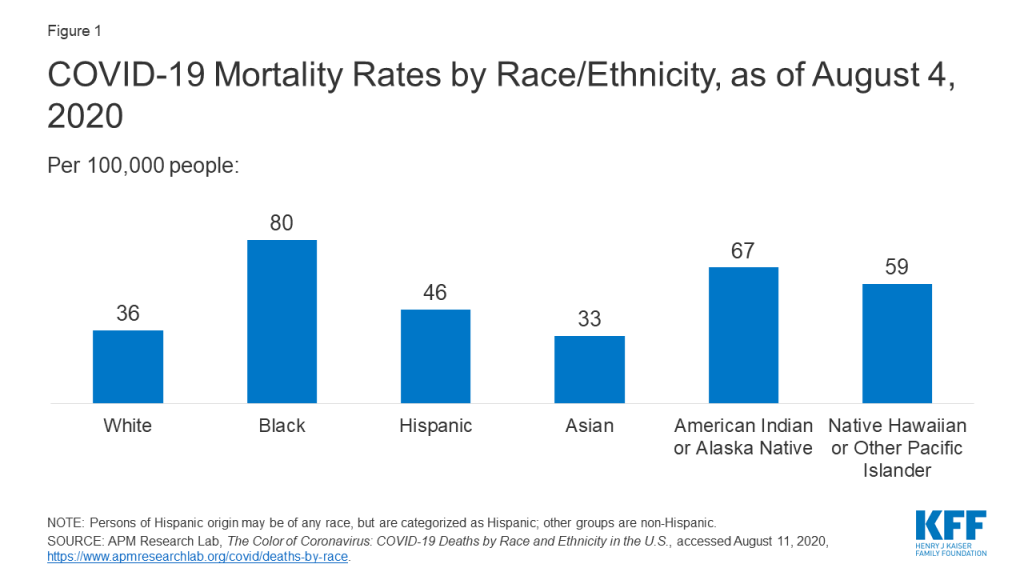
  • People of color are experiencing significantly higher rates of infections and deaths compared to White individuals. For example, analysis of state-reported data finds that, as of August 4, COVID-19 related death rates among Black people were over twice as high as the rate for White people, while the mortality rate for AIAN people was nearly two times that of White people (Figure 1). These data also show a sharp recent rise in mortality rates for NHOPI and Hispanic people. Reporting based on county-level data found that Black and Hispanic people are nearly three times as likely to contract COVID-19 and nearly two times as likely to die from COVID-19. It also found several areas where AIAN individuals were significantly more likely to be infected compared to White people as well as some higher risk of infection among Asian people. Other data show that, in states with large numbers of NHOPI people, they have higher infection rates compared to other racial and ethnic groups, and that Asian people are experiencing a higher case fatality rate than average in a number of areas across the country. Further, a study using data from a health system in the Baltimore-Washington DC region found that Hispanics had a higher infection rate compared to other groups.
Figure 1: COVID-19 Mortality Rates by Race/Ethnicity, as of August 4, 2020
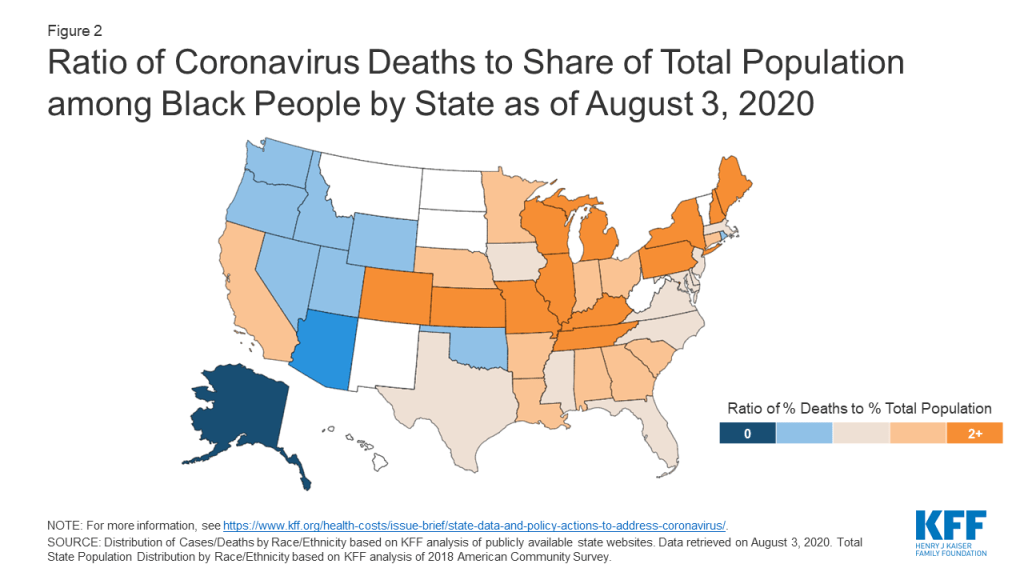
  • Disparities for Black and Hispanic people are widespread across the country. For example, KFF analysis of state reported data showed that, as of August 3, 2020, Black individuals accounted for more cases and deaths relative to their share of the population in 30 of 49 states reporting cases and 34 of 44 states reporting deaths (Figure 2). Hispanic people made up a higher share of cases and deaths compared to their share of the total population in 35 of 45 states reporting cases and 10 of 44 states reporting deaths. County-level data also suggest that disparities in infection rates for Black and Hispanic people are widespread across counties. The state and county-level data also point to stark disparities for AIAN and Asian people but in a more limited number of areas.
Figure 2: Ratio of Coronavirus Deaths to Share of Total Population among Black People by State as of August 3, 2020
  • County-level analysis finds that cases and deaths are concentrated in areas with higher shares of Black and Hispanic residents. One study of nationwide county-level data found that higher shares of Black people living in a county are associated with increased shares of COVID-19 cases and deaths in the county, as well as a positive correlation between the share of Asian residents and the county infection and mortality rate. Other analysis finds that, as of April, 97% of disproportionately Black counties (with a greater share of Black residents compared to the U.S. average) reported a case and 49% reported a death versus 81% and 28%, respectively, for other counties. These disparities persisted after adjusting for county-level characteristics such as percent of the population older than 65, unemployment, health insurance coverage status, comorbidities, days since first case of diagnosis, and urbanicity. Overall, the roughly 20% of U.S. counties that are disproportionately Black accounted for 52% of COVID-19 diagnoses and 58% of deaths nationally during the first several months of the U.S. epidemic. In addition, another analysis finds that, as of August 3, 8 of the 20 counties with the highest level of deaths per capita are predominantly Black, and three of the five counties with the highest per capita death rates are predominantly Black. Similarly, a study of ten major metropolitan areas found that counties with larger shares of Latino residents have disproportionate shares of cases. Additional work finds that, among both counties with higher median county-level income and lower median county-level income, higher shares of people of color were associated with higher rates of infection and death compared to counties that have higher shares of White residents (>81%).

Disparities in COVID-19 deaths for people of color persist across age groups, and people of color experience more deaths among younger people relative to White individuals. Researchers examining federally reported data find increased risk of death due to COVID-19 among Black, Hispanic, AIAN, and Asian and Pacific Islander people as compared to their White counterparts across age groups, with particularly large disparities among younger adults age 25-54. The study also found that Black and Hispanic populations lost more years of total potential life due to COVID-19 compared to the White population, even though the White population is three to four times larger. Other analysis finds that disparities in deaths widen for all groups of color after adjusting for age. CDC analysis of data for roughly 11,000 COVID-19 deaths in 16 public health jurisdictions found that over one in three (35%) deaths among Hispanic people and 30% of deaths among people of color were among those under age 65, compared to 13% of deaths among White people. Additionally, the median age of individuals dying from COVID-19 was 9 to 10 years younger among people of color.

Hospitalizations

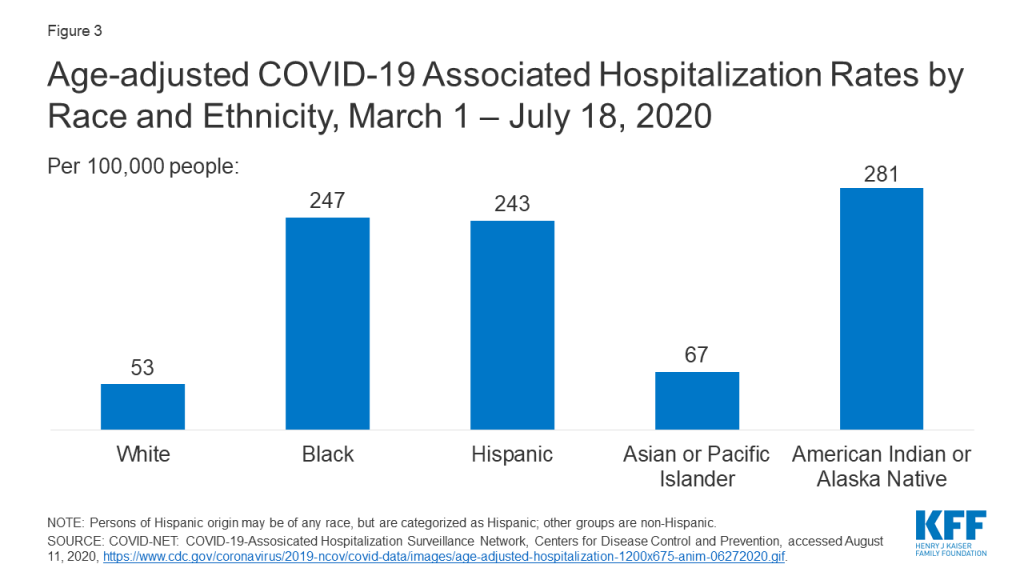
Black and Hispanic people have higher hospitalization rates compared to their White counterparts. Data from COVID-NET show that, from March 1 through July 18, age-adjusted hospitalization rates due to COVID-19 for Black, Hispanic, and AIAN people were each roughly 5 times higher than that of White people (Figure 3). Another analysis of patients at a large hospital system in Boston who tested positive for COVID-19 found that a higher proportion of Hispanic patients were hospitalized compared to Black or White patients, particularly among those under age 60. In contrast, a study of patients tested at a health system in the Baltimore-Washington DC found a higher positivity rate among Latino patients but a lower hospital admission rate among Latino patients who tested positive. Latino patients who were hospitalized were younger, more likely to be male, and had fewer comorbidities compared to White or Black patients. Studies using data from an academic health system in Atlanta, Georgia, a large health system in California, and a health system in Chicago all find that Black patients are at higher risk for hospitalization. Reflecting these higher rates, several studies also found that people of color make up a disproportionate share of COVID-19 hospitalizations relative to their share of the population or total hospital visits. For example, earlier data from COVID-NET based on 580 hospitalizations as of March 2020 show that Black people accounted for more hospitalized COVID-19 patients compared to their share of the population in the area studied (33% vs. 18%). A study using data from a large health system in Louisiana found that Black people accounted for over three-quarters of patients who were hospitalized with COVID-19 (77%) and over 71% of in-hospital deaths, compared to just 31% of the total patient population.

Figure 3: Age-adjusted COVID-19 Associated Hospitalization Rates by Race and Ethnicity, March 1 – July 18, 2020

Disparities among Specific Populations

Studies also find racial/ethnic disparities in COVID-19 cases and/or deaths among Medicare beneficiaries, nursing facilities, pregnant women, and children.

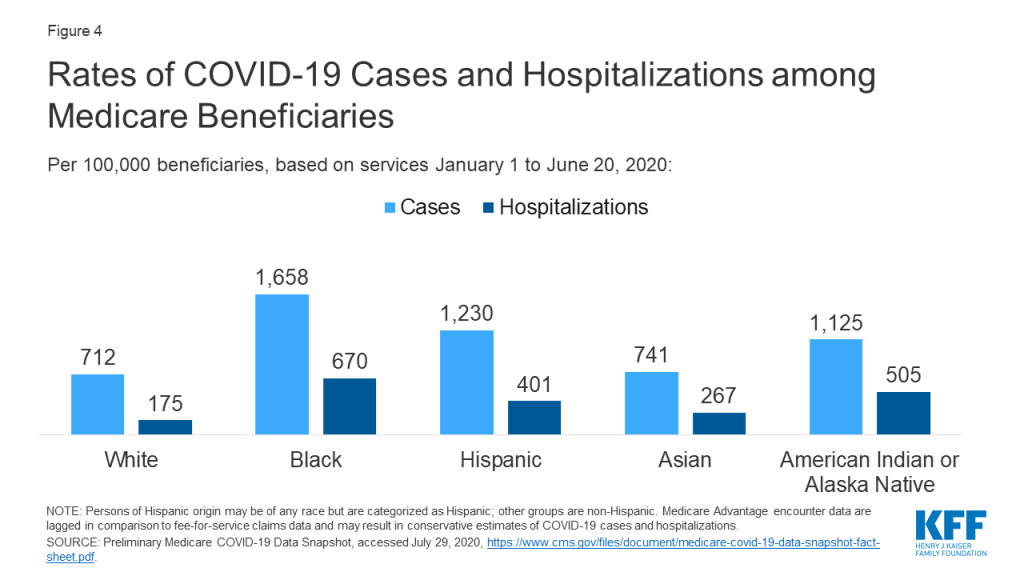
  • Preliminary Medicare claims and encounter data based on services from January 1 through June 20, 2020 show higher rates of infection and hospitalization due to COVID-19 among Black, Hispanic, and AIAN Medicare beneficiaries compared to White beneficiaries (Figure 4).
Figure 4: Rates of COVID-19 Cases and Hospitalizations among Medicare Beneficiaries
  • Analysis of nursing home facilities found that having a greater share of Black residents was associated with increased probability of having a COVID-19 case. Other reporting also has found that nursing homes where a higher share of residents are people of color are more likely to report a COVID-19 case.
  • One study found that Hispanic and Black pregnant women accounted for a disproportionate share of confirmed cases relative to their share of women who gave birth in 2019 (46% vs. 24% and 22% vs 15%, respectively).
  • CDC analysis of COVID-19 hospitalization data from 14 states found that, although the overall COVID-19 associated hospitalization rate for children is low, hospitalization rates for Hispanic and Black children were nearly eight times and five times higher than the rate for White children, respectively. Early data from a COVID-19 clinic in Chicago also suggest that Black children are at higher risk of infection. Similarly, a study of children tested at a pediatric community-based free testing site found that Black and Hispanic children had higher rates of infection, that these differences persisted after controlling for age, sex, and median family income, and that positivity rates among Hispanic children increased over time.

Testing

Data to understand variation in testing by race/ethnicity remains very limited. Very few states (5 as of July 2020) report testing data by race/ethnicity. Data on testing within community health centers show that people of color represented more than half of all people tested (57%) and confirmed cases (56%) at health centers, and that Hispanic patients made up a higher share of positive tests compared to their share of total tested patients. Reporting on testing site locations suggests that testing sites in and near predominantly Black and Hispanic neighborhoods are likely to face greater demand than those near predominantly White areas, which could contribute to longer wait times. Other research finds that the share of people of color in an area is associated with an increase in travel time to a testing site. Similarly, analysis of data from New York City found that more tests were performed in neighborhoods with higher shares of White residents, but that the highest proportion of positive tests were in neighborhoods with more people of color and lower socioeconomic measures. Reporting on testing site locations in Texas found that in four of the six largest cities testing sites are disproportionately located in census tracts where the share of White residents is greater than the city median.

Looking ahead

Together, these data show that people of color are bearing a disproportionate burden of COVID-19 cases, deaths, and hospitalizations and that they may face increased barriers to access testing. Other analyses also suggest that the COVID-19 pandemic is taking a larger economic toll on people of color. These disparities in COVID-19 reflect and compound longstanding underlying social, economic, and health inequities that stem from structural and systemic barriers across sectors, including racism and discrimination. Researchers across the studies suggest that these underlying disparities put people of color at increased risk for exposure to the virus, experiencing serious illness if they are infected, and facing barriers to accessing testing and treatment. For example, their living and employment situations make it more difficult to social distance, as they are more likely to work in jobs that cannot be done at home, more likely to use public transportation, and more likely to live in larger households. Variation in access to testing, delays in seeking care due to lack of insurance and other access barriers, as well as higher rates of underlying health conditions may contribute to more serious illness among individuals if they are infected and individuals being in more serious condition when they do seek care, which could contribute to higher rates of hospitalization and death.

While these data and analysis provide important insights into the disparate impacts of COVID-19, there remain significant data gaps and limitations that point to the importance of continued efforts to increase the availability of COVID-19 data by race and ethnicity. Data on testing may grow as, under the CARES Act and guidance from HHS, all laboratories or other facilities performing COVID-19 testing must report data to HHS and “make every reasonable effort” to collect and report demographic data, including race/ethnicity, starting August 1. However, continued efforts will be required to provide for timely, complete, and comparable data that allow for better understanding of COVID-19 impacts overall and particularly for smaller population groups, such as AIAN and NHOPI individuals as well as among ethnic groups. These data are key for understanding impacts across communities, guiding response and relief efforts, and providing for equitable access to treatments and vaccines as they are developed.

The health and economic impacts of COVID-19 could further widen racial/ethnic disparities at a time when there is a growing focus on and call for racial justice and health equity. Overall, the findings highlight the importance of considering how COVID-19 relief and response efforts will address inequities, including in decisions related to distribution of treatments and vaccines once they become available. Prioritizing equity will be key for addressing the current gaps in COVID-19 and health care more broadly and preventing widening of disparities in the future.

Appendix

Appendix A

Table 1: Federal Data Sources on COVID-19 and Race/Ethnicity
SourceTitleDescriptionLevel
Public Data from the Federal Government
CDCCDC COVID Data TrackerProvides information on cases and deaths by race/ethnicity. Race/ethnicity data can also be stratified by age group (updated daily).National
CDCProvisional Death Counts for Coronavirus Disease (COVID-19)Contains multiple data sets from the National Vital Statistics System’s COVID-19 Surveillance Data Files, including provisional death counts by race/ethnicity and deaths involving coronavirus by race/ethnicity and age (race data updated weekly).State and National
CDCCOVID-NET: COVID-19 Laboratory-Confirmed HospitalizationsSummary of COVID-19 hospitalizations. In addition to race/ethnicity, figures are stratified by multiple demographic characteristics (updated biweekly).National
CMSPreliminary Medicare COVID-19 Data SnapshotCounts of Medicare beneficiaries of COVID-19 cases and hospitalizations by several measures, including race/ethnicity at the national level (updated monthly).State and National
HRSAHealth Center COVID-19 SurveyRapid response survey of community health centers on a range of issues related to COVID-19, included testing data by race/ethnicity (updated weekly).State and National

Appendix B: References

KFF (Kaiser Family Foundation), State Data and Policy Actions to Address Coronavirus, COVID-19 Confirmed Cases and Deaths by Race/Ethnicity as of August 3, 2020, accessed August 11, 2020, https://www.kff.org/health-costs/issue-brief/state-data-and-policy-actions-to-address-coronavirus/.

The COVID Tracking Project, The COVID Racial Data Tracker, accessed August 11, 2020, https://covidtracking.com/race.

APM Research Lab, The Color of Coronavirus: COVID-19 Deaths by Race and Ethnicity in the U.S., (August 5, 2020), accessed August 11, 2020, https://www.apmresearchlab.org/covid/deaths-by-race.

The COVID Tracking Project, The COVID Racial Data Tracker, accessed August 11, 2020, https://covidtracking.com/race.

KFF (Kaiser Family Foundation), State Data and Policy Actions to Address Coronavirus, COVID-19 Confirmed Cases and Deaths by Race/Ethnicity as of August 3, 2020, accessed August 11, 2020, available at https://www.kff.org/health-costs/issue-brief/state-data-and-policy-actions-to-address-coronavirus/.

L. Kim, M. Whitaker. A. O’Halloran, et al., “Hospitalization Rates and Characteristics of Children Aged <18 Years Hospitalized with Laboratory-Confirmed COVID-19 — COVID-NET, 14 States, March 1–July 25, 2020,” Morbidity and Mortality Weekly Report ePub 7 (August 2020), available at https://www.cdc.gov/mmwr/volumes/69/wr/mm6932e3.htm?s#F2_down.

Monika K. Goyal, et al, “Racial/Ethnic and Socioeconomic Disparities of SARS-CoV-2 Infection Among Children, Pediatrics, Vol 16, Issue 2 (August 2020), accessed August 11, 2020, available at https://pediatrics.aappublications.org/content/early/2020/08/03/peds.2020-009951.

Centers for Disease Control and Prevention, Age-adjusted COVID-19-associated hospitalization rates by race and ethnicity, accessed August 11, 2020, https://www.cdc.gov/coronavirus/2019-ncov/covid-data/images/July-28_Race_Ethnicity_COVIDNet.jpg.

Centers for Medicare & Medicaid Services, Preliminary Medicare COVID-19 Data Snapshot, accessed August 11, 2020, https://www.cms.gov/research-statistics-data-systems/preliminary-medicare-covid-19-data-snapshot.

Samrachana Adhikari, Nicholas P. Pantaleo, and Justin M. Feldman, “Assessment of Community-Level Disparities in Coronavirus Disease 2019 (COVID-19) Infections and Deaths in Large Metropolitan Areas, Jama Network Open (July 28, 2020), accessed August 11, 2020, available at https://jamanetwork.com/journals/jamanetworkopen/fullarticle/2768723.

Carlos E. Rodriguez-Diaz et al., “Risk for COVID-19 infection and death among Latinos in the United States: Examining heterogeneity in transmission dynamics”, Annals of Epidemiology (July 23, 2020), accessed August 11, 2020, available at https://www.sciencedirect.com/science/article/pii/S1047279720302672#figs1.

Soo Rin Kim et al., “Which Cities Have The Biggest Racial Gaps In COVID-19 Testing Access?” FiveThirtyEight, July 22, 2020, https://fivethirtyeight.com/features/white-neighborhoods-have-more-access-to-covid-19-testing-sites/.

J.M. Wortham, J.T. Lee, S. Althomsons et al., “Characteristics of Persons Who Died with COVID-19 — United States, February 12–May 18, 2020”, Morbidity and Mortality Weekly Report 69, no. 28 (July 17, 2020), accessed August 11, 2020, available at https://www.cdc.gov/mmwr/volumes/69/wr/mm6928e1.htm.

Brandon W. Yan et al., “Asian Americans Facing High COVID-19 Case Fatality”, Health Affairs (July 13, 2020), https://www.healthaffairs.org/do/10.1377/hblog20200708.894552/full/.

Heather E. Hsu et al., “Race/Ethnicity, Underlying Medical Conditions, Homelessness, and Hospitalization Status of Adult Patients with COVID-19 at an Urban Safety-Net Medical Center – Boston, Massachusetts, 2020”, Morbidity and Mortality Weekly Report 69 no. 27 (July 10, 2020), available at https://pubmed.ncbi.nlm.nih.gov/32644981/.

Ayodeji Adegunsoye, I. Bauer Ventura , and V.M. Liarski, “Association of Black Race with Outcomes in COVID-19 Disease: A Retrospective Cohort Study”, Annals of the American Thoracic Society (July 9, 2020), available at https://www.atsjournals.org/doi/abs/10.1513/AnnalsATS.202006-583RL.

Richard A. Oppel Jr. et al., “The Fullest Look Yet at the Racial Inequity of Coronavirus”, The New York Times, July 5, 2020, accessed August 11, 2020, https://www.nytimes.com/interactive/2020/07/05/us/coronavirus-latinos-african-americans-cdc-data.html.

David R. Holgrave et al., “Assessing racial and ethnic disparities using a COVID-19 outcomes continuum for New York State”, Annals of Epidemiology 48 (June 29, 2020), available at https://doi.org/10.1016/j.annepidem.2020.06.010.

Marie E. Killerby et al. “Characteristics Associated with Hospitalization Among Patients with COVID-19 — Metropolitan Atlanta, Georgia, March–April 2020”, Morbidity and Mortality Weekly Report 69, no. 25 (June 26, 2020), available at https://www.cdc.gov/mmwr/volumes/69/wr/mm6925e1.htm.

Sascha Ellington et al., “Characteristics of Women of Reproductive Age with Laboratory-Confirmed SARS-CoV-2 Infection by Pregnancy Status — United States, January 22–June 7, 2020”, Morbidity and Mortality Weekly Report 69 no. 25 (June 26, 2020): 769–775, available at https://www.cdc.gov/mmwr/volumes/69/wr/mm6925a1.htm.

Eboni G. Pricey-Haywood et al., “Hospitalization and Mortality among Black Patients and White Patients with Covid-19”, New England Journal of Medicine 382, no. 26 (June 25, 2020), available at https://www.nejm.org/doi/full/10.1056/NEJMsa2011686.

Wil Libermann-Cribbin et al., “Disparities in COVID-19 Testing and Positivity in New York City”, American Journal of Preventive Medicine (June 25, 2020), available at 10.1016/j.amepre.2020.06.005.

Diego A. Martinez et al., “SARS-CoV-2 Positivity Rate for Latinos in the Baltimore–Washington, DC Region”, Journal of the American Medical Association 324 no. 4 (June 13, 2020), available at 10.1001/jama.2020.11374.

Bassett MT, Chen JT and Krieger N, “The Unequal toll of COVID-19 Mortality by Age in the United States: Quantifying Racial/Ethnic Disparities”, Working Paper Series 19, no.3 (June 12, 2020), Harvard Center for Population and Development Studies, available at https://cdn1.sph.harvard.edu/wp-content/uploads/sites/1266/2020/06/20_Bassett-Chen-Krieger_COVID-19_plus_age_working-paper_0612_Vol-19_No-3_with-cover.pdf.

Hannah R. Abrams et al., “Characteristics of U.S. Nursing Homes with COVID ‐19 Cases”, Journal of the American Geriatrics Society, (June 2, 2020), available at https://doi.org/10.1111/jgs.16661.

Sindhura Bandi, M.Z. Nevid, M. Mahdavinia, “African American children are at higher risk of COVID‐19 infection”, Pediatric Allergy and Immunology (May 29, 2020), available at https://doi.org/10.1111/pai.13298.

Sean McMinn et al. “In Large Texas Cities, Access To Coronavirus Testing May Depend On Where You Live”, NPR, May 27, 2020, accessed August 11, 2020, https://www.npr.org/sections/health-shots/2020/05/27/862215848/across-texas-black-and-hispanic-neighborhoods-have-fewer-coronavirus-testing-sit.

Kristen M.J. Azar et al., “Disparities In Outcomes Among COVID-19 Patients In A Large Health Care System In California”, Health Affairs 39, no. 7 (May 21, 2020), accessed August 11, 2020, available at https://www.healthaffairs.org/doi/10.1377/hlthaff.2020.00598.

Robert Gebeloff et al., “The Striking Racial Divide in How Covid-19 Has Hit Nursing Homes”, The New York Times, May 21, 2020, accessed July 8, 2020, https://www.nytimes.com/article/coronavirus-nursing-homes-racial-disparity.html.

Uma V Mahajan and Margaret Larkins-Pettigrew, “Racial demographics and COVID-19 confirmed cases and deaths: a correlational analysis of 2886 US counties”, Journal of Public Health (May 21, 2020), available at 10.1093/pubmed/fdaa070.

Bradley Corallo and Jennifer Tolbert, Impact of Coronavirus on Community Health Centers, (Washington, DC, KFF, May 20, 2020), accessed August 11, 2020, available at https://www.kff.org/coronavirus-covid-19/issue-brief/impact-of-coronavirus-on-community-health-centers/

Benjamin Rader et al., “Geographic access to United States SARS-CoV-2 testing sites highlights healthcare disparities and may bias transmission estimates”, Journal of Travel Medicine (May 15, 2020), available at https://doi.org/10.1093/jtm/taaa076.

Gregorio A. Millett et al., “Assessing Differential Impacts of COVID-19 on Black Communities”, Annals of Epidemiology 47 (May 14, 2020), available at https://doi.org/10.1016/j.annepidem.2020.05.003.

Joseph Keawe‘aimoku Kaholokula et al., “COVID-19 Special Column: COVID-19 Hits Native Hawaiian and Pacific Islander Communities the Hardest”, Hawai’i Journal of Health & Social Welfare, 29 no. 5 (May 1, 2020), available at https://www.ncbi.nlm.nih.gov/pmc/articles/PMC7226312/#.

Shikha Garg et al. “Hospitalization Rates and Characteristics of Patients Hospitalized with Laboratory-Confirmed Coronavirus Disease 2019 — COVID-NET, 14 States, March 1–30, 2020”, Morbidity and Mortality Weekly Report 69, no. 15 (April 17, 2020), available at https://www.cdc.gov/mmwr/volumes/69/wr/mm6915e3.htm.
Endnotes

  1. Studies that estimated cases or deaths were excluded. ↩︎

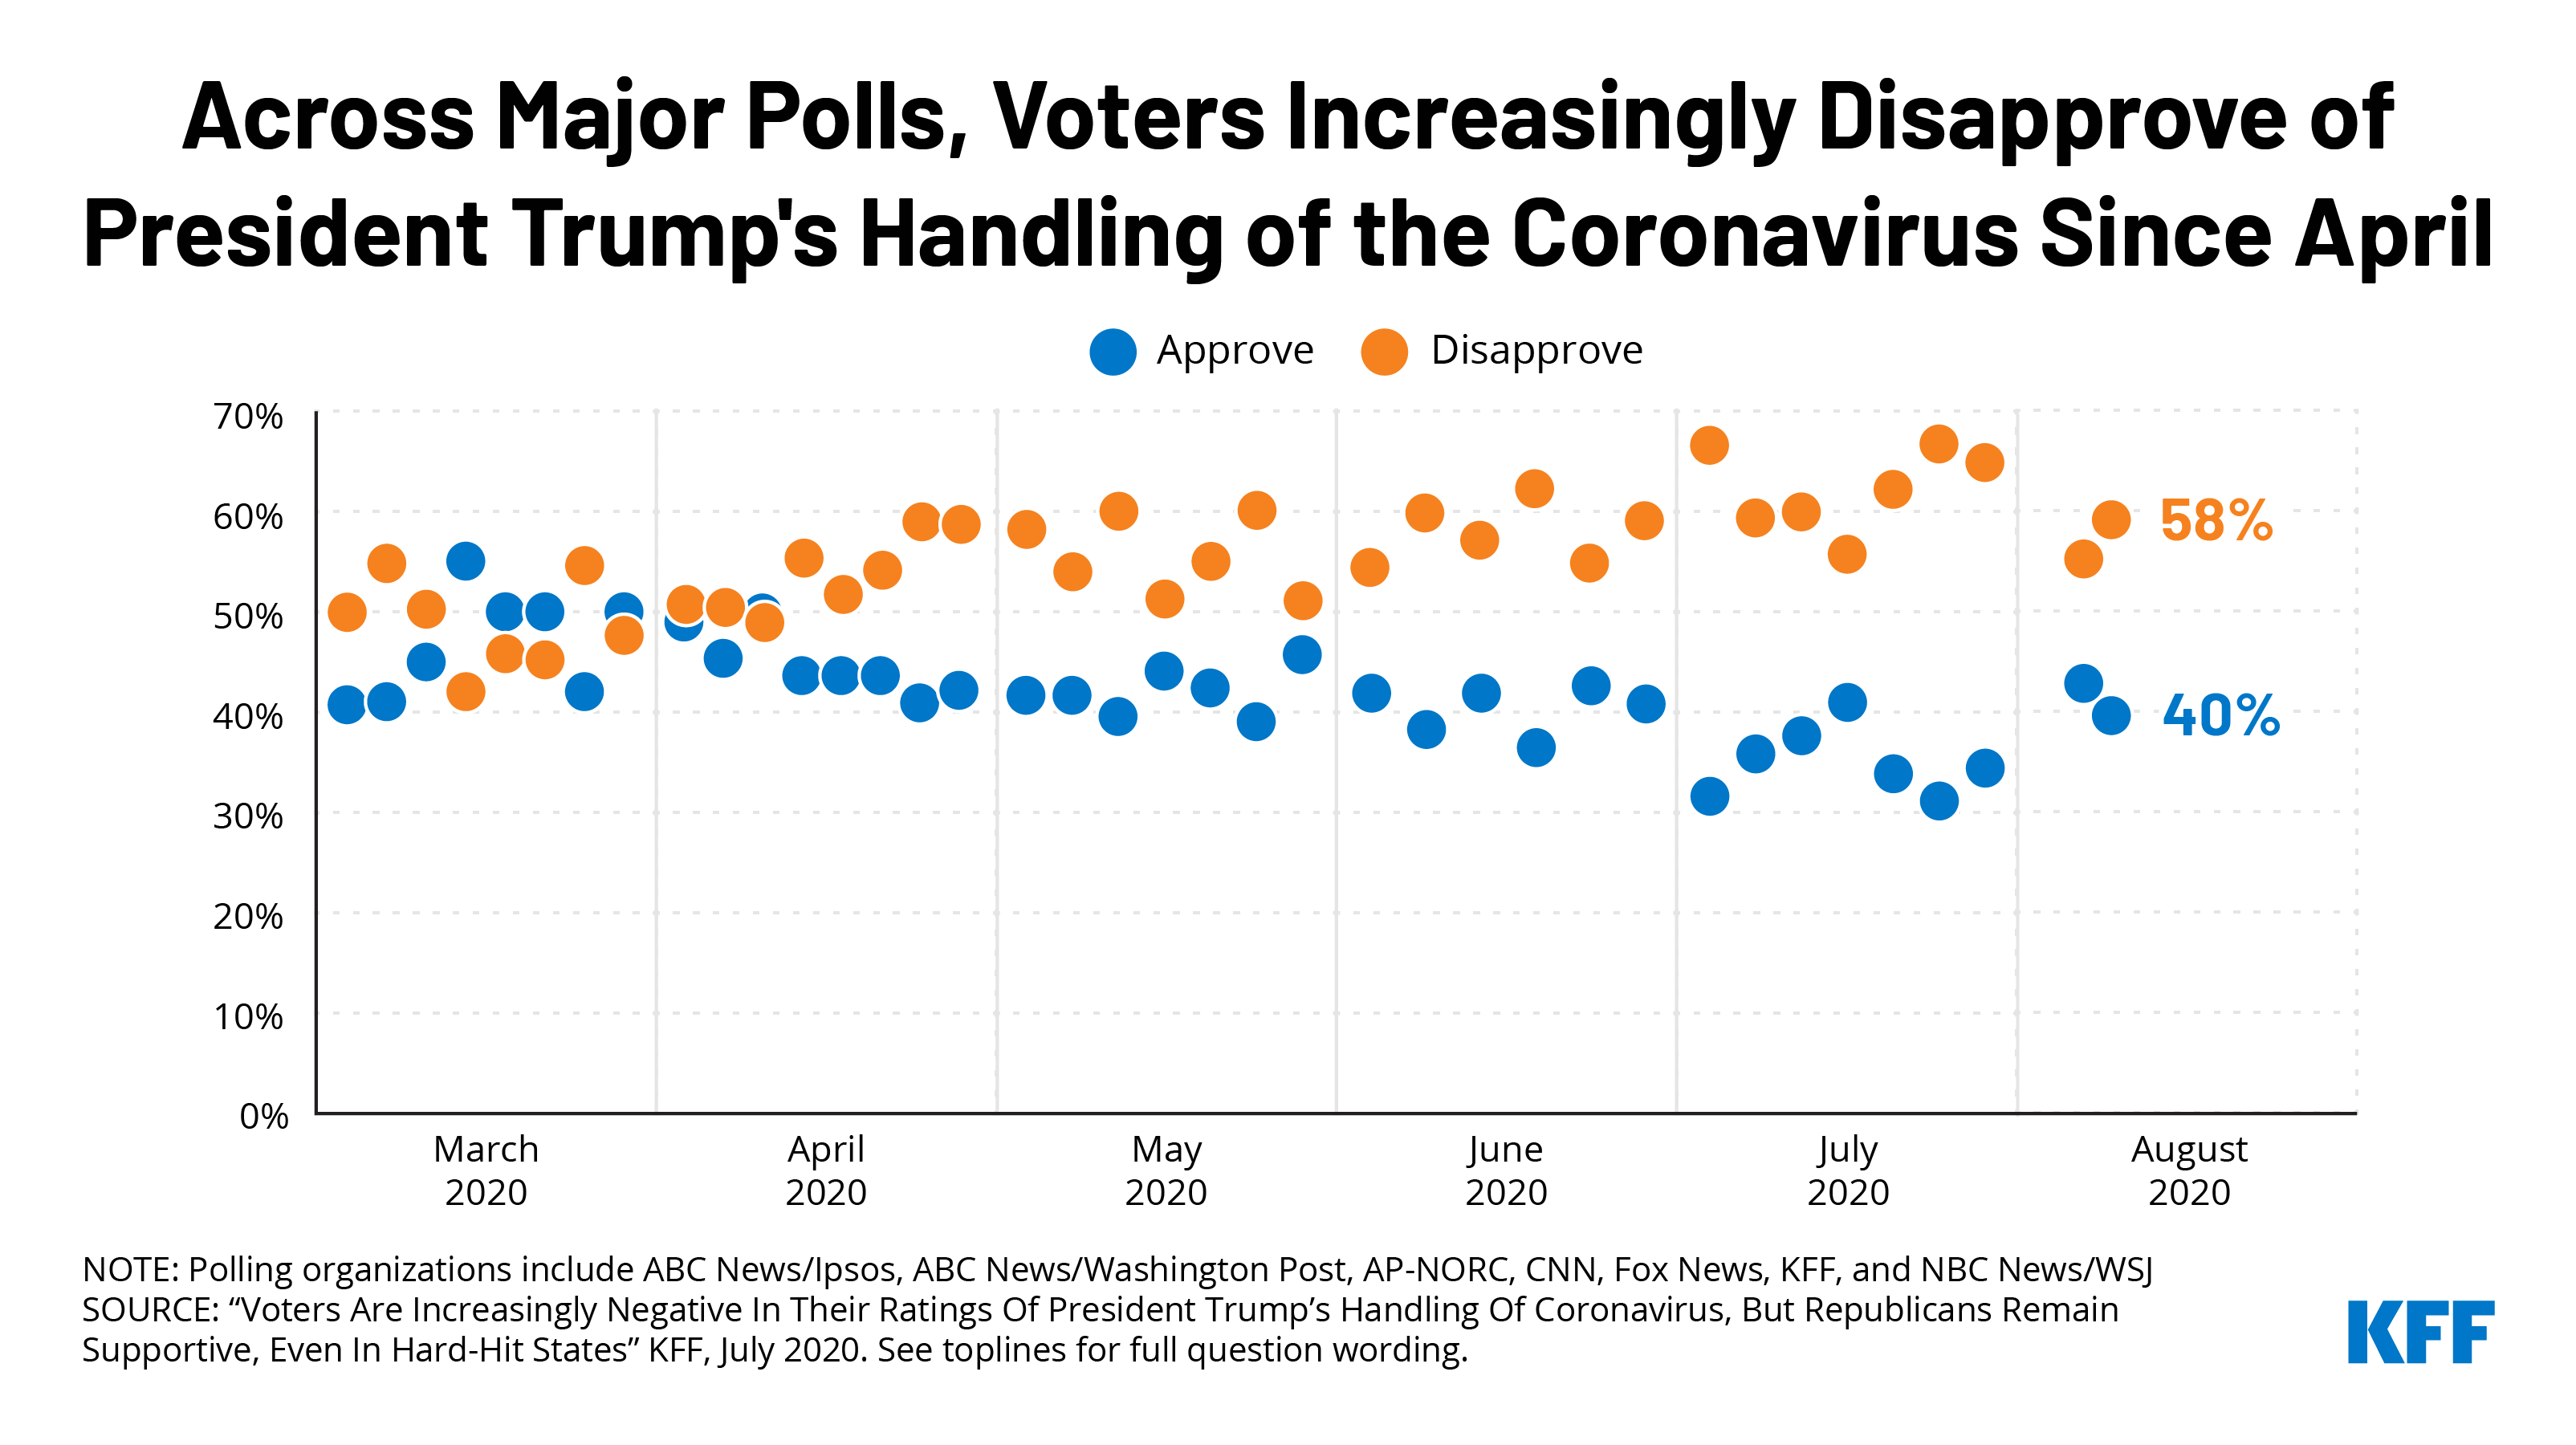
As the country struggles to get a handle on the coronavirus pandemic and prepares for the 2020 election, this analysis finds that, while voters are increasingly negative in their evaluations of President Trump’s handling of the pandemic, he continues to garner strong support among Republican voters – even those living in areas disproportionately impacted by the virus. (more…)

Voters Are Souring on President Trump’s Handling of Coronavirus, with Implications for November

Published: Aug 17, 2020

As the country struggles to get a handle on the coronavirus pandemic and prepares for the 2020 election, this analysis finds that, while voters are increasingly negative in their evaluations of President Trump’s handling of the pandemic, he continues to garner strong support among Republican voters – even those living in areas disproportionately impacted by the virus. (more…)

As the country struggles to get a handle on the coronavirus pandemic and prepares for the 2020 election, this analysis finds that, while voters are increasingly negative in their evaluations of President Trump’s handling of the pandemic, he continues to garner strong support among Republican voters – even those living in areas disproportionately impacted by the virus. (more…)

Community Health Centers and Medication-Assisted Treatment for Opioid Use Disorder

Authors: Bradley Corallo, Jennifer Tolbert, Jessica Sharac, Anne Markus, and Sara Rosenbaum
Published: Aug 14, 2020

Executive Summary

In the midst of the coronavirus pandemic, emerging evidence suggests drug overdoses, including opioid overdoses, are increasing.1 ,2  As safety net primary care providers, community health centers play a significant role in efforts to address the ongoing opioid crisis and have become a major source of medication-assisted treatment (MAT), the standard of care for those with opioid use disorder (OUD). It is unclear whether health centers have the capacity to meet increasing demand due to the pandemic. This issue brief presents findings from a 2019 survey of community health centers on activities related to the prevention and treatment of OUD, with a focus on MAT, to assess services and capacity prior to the recent surge in need. Key findings include:

  • As of 2019, an increasing share of health centers were providing MAT services. Nearly two-thirds of health centers (64%) reported offering MAT onsite, up from 48% in 2018. Health centers in Medicaid expansion states were more likely than those in non-expansion states to provide MAT onsite in 2019 (70% vs. 50%).
  • Most health centers that provide MAT offer multiple treatment options for patients experiencing OUD. The majority (65%) of health centers with a MAT program offered at least two out of three available MAT medications for OUD, with buprenorphine (89%) and naltrexone (69%) most commonly offered. To ensure a continuum of care for OUD patients seeking treatment, health centers refer to a variety of providers; however, health centers with a MAT program are more likely than those without MAT onsite to refer patients to more intensive providers like residential treatment programs (71% vs. 46%), inpatient detox programs (69% vs. 50%), and partial hospitalization programs (36% vs. 22%).
  • Health centers face many challenges meeting the high demand for OUD treatment. Despite increasing MAT services and treatment options from 2018, nearly half (47%) of health centers reported that they did not have the capacity to treat all patients seeking MAT. Among health centers that attempted to refer patients for MAT services, 66% said they face provider shortages in their community when doing so.

Targeted federal grants from 2016 to 2019 helped health centers to bolster MAT programs and establish new ones, although health centers continue to rely heavily on Medicaid to sustain MAT programs and services long-term. However, the high cost of providing MAT services remains a barrier in Medicaid expansion and non-expansion states alike, and these barriers will likely remain even as the coronavirus pandemic poses new challenges for health centers’ finances and capacity to provide OUD services.

Issue Brief

Introduction

As the country struggles to respond to the coronavirus pandemic, emerging evidence suggests drug overdoses are increasing sharply, with an estimated 18% increase in overdoses since the start of stay-at-home orders in March through May 2020.3  The increase in overdoses is driven in part by the isolation, stigma, economic turmoil, and disruption in access to health care services caused by coronavirus.4 ,5  Many of these overdoses are also related to the ongoing opioid crisis, which affects roughly two million Americans with opioid use disorder (OUD) and was linked to over 50,000 opioid overdose deaths in 2019.6 ,7  Even prior to the coronavirus pandemic, access to OUD treatment was limited—only one in five people experiencing OUD received addiction treatment in 2018.8  Existing gaps in OUD treatment services have likely been exacerbated by the current crisis.

Community health centers play a significant role in addressing the opioid crisis as community-based primary care providers with the capacity to screen, treat, refer, and provide supportive services such as case management to patients experiencing OUD. Increasingly, health centers are providing medication-assisted treatment (MAT), which is considered to be the standard of care for OUD treatment.9  MAT includes treatment with one of three medications (methadone, naltrexone, and buprenorphine) along with counseling.10  Health centers primarily serve low-income populations who may otherwise have difficulty accessing affordable health care. Residents of the medically underserved communities in which health centers operate, including those experiencing OUD, are disproportionately uninsured, enrolled in Medicaid, or earn less than 200% of the federal poverty level.11 

Between 2016 and 2019, the Health Resources and Services Administration (HRSA) awarded more than $1.4 billion in federal grants12 ,13 ,14 ,15 ,16  to enable health centers to expand access to mental health and substance use disorder (SUD) services. Health centers used these grants to increase staff, to improve the integration of behavioral health and primary care, and to expand delivery of MAT.17  National data show that health centers increased their mental health and SUD staff by 51% from 2016-2019,18  with the vast majority (95%) of health centers offering mental health and/or SUD services onsite in 2018 (the latest year these data are available).19  Currently, health centers are eligible for a number of other federal grants to mitigate the steep revenue losses due to the coronavirus pandemic,20  although these grants are meant to support health center capacity generally or to provide COVID-19 testing, rather than targeting OUD services specifically. Given the considerable federal investment in health centers to combat the opioid crisis as well as the increasing need for OUD services during the pandemic, it is important to understand health centers’ capacity to deliver MAT and the barriers they continue to face in providing OUD services.

This brief presents findings from a survey of health centers conducted in 2019, focusing on questions that examine community health centers’ provision of MAT services and capacity. Where possible, we highlight one-year trends from a 2018 community health center survey. We also highlight differences across health centers in Medicaid expansion and non-expansion states when the differences are significant. While the findings reflect health center responses before the coronavirus pandemic, they provide important context for understanding the issues health centers faced in providing MAT services prior to the pandemic and challenges that will likely persist following the pandemic’s resolution.

Treating Patients with Opioid Use Disorder

Over seven in ten health centers (71%) reported an increase in the number of patients with OUD from 2018 to 2019. Similar shares of health centers reported an increase in the number of patients with prescription OUD (62%) and nonprescription OUD, such as fentanyl or heroin (65%, Figure 1). These findings are generally consistent with provisional data on opioid overdose deaths in the U.S. that show an increase for 2019.21  The growth in health center patients experiencing OUD was likely due to a variety of factors, including new patients with OUD seeking care, improved screening practices to identify patients experiencing OUD, or an improved capacity at health centers to provide OUD services to more patients.

Figure 1: Share of Health Centers Reporting an Increase in the Number of Patients with Opioid Use Disorder in the Past Year

There was substantial growth in the number of health centers providing onsite MAT services from 2018 to 2019, particularly in Medicaid expansion states. Nearly two-thirds of health centers (64%) reported that they provide MAT medications, up from 48% in 2018, and the vast majority of these (87%) provide counseling as well. Health centers in Medicaid expansion states were more likely than those in non-expansion states to provide onsite MAT services (70% vs. 50%, Figure 2). The difference in MAT availability may be attributable to a greater OUD prevalence in Medicaid expansion states, which experienced an opioid-involved death rate of 16.1 per 100,000 population in 2018 (the latest year these data are available), compared to 11.4 per 100,000 in non-expansion states.22  However, the difference in MAT availability is also likely related to increased revenue for OUD services in expansion states, since the Medicaid program reaches many of the adults most at risk for OUD. Other research has demonstrated a connection between Medicaid expansion and health center capacity.23 ,24  At the same time, the availability of grant funding since 2016 has helped to ensure that health centers in both expansion and non-expansion states have been able to expand mental health and SUD services.

Figure 2: Share of Health Centers Providing MAT Medications by State Medicaid Expansion Status, 2018 & 2019

Most health centers that provide MAT services offer more than one medication, which gives providers options to meet patients’ needs. Among health centers that reported providing MAT, 60% offer two MAT drugs and 4% offer all three, while roughly one-third (35%) offer only one MAT drug (Figure 3). The most widely available drug is buprenorphine, with 89% of health centers that provide MAT medications reporting they provide it. A slightly smaller share (69%) reported offering naltrexone, and only 7% of health centers providing MAT medications reported offering methadone. Facilities must be certified as opioid treatment programs (OTPs) in order to dispense methadone, while buprenorphine and naltrexone can be prescribed in any setting where providers have a Drug Abuse Treatment Act of 2000 (DATA) waiver from the federal government.25  Currently, all state Medicaid programs cover buprenorphine and naltrexone, although only 41 state programs cover methadone.26  As part of a broader initiative to combat the opioid crisis, the SUPPORT Act, signed into law in 2018, will require all state Medicaid programs to cover all three MAT medications, counseling services, and behavioral therapy from October 2020 through September 2025,27 ,28  although providers will still need to be certified OTPs to dispense methadone.

Figure 3: Health Centers’ Provision of MAT Medications

Health centers with a MAT program are more likely than those without to refer patients to services across the continuum of care for OUD. Depending on patients’ needs, OUD treatment may require services other than MAT. Some may require less intensive care such as recovery coaches or peer mentors. Others experiencing OUD may require more intensive services such as partial hospitalization programs, residential treatment programs, and inpatient detox programs. Health centers with MAT programs are more likely than health centers without a program to refer to providers offering specific services that are generally unavailable in health centers or other primary care settings, such as partial hospitalization and residential treatment programs (Figure 4). In contrast, health centers without a MAT program are more likely to refer to outpatient providers who could offer MAT, including health departments, certified behavioral health clinics, opioid treatment programs, and some primary care clinics. Relatively few health centers (7%) do not make any referrals for patients with OUD, and it is unclear whether the few that make no referrals do so because there is no perceived need for referrals or because there is a lack of OUD treatment providers in the community that accept Medicaid and uninsured patients, among other plausible explanations.

Figure 4: Share of Health Centers Referring OUD Patients to Selected Providers by Provision of Onsite MAT Services

Roughly half of health centers (55%) distribute naloxone, an opioid overdose reversal drug. Even though naloxone is different from medications used in MAT for addiction, the continued, high rates of opioid overdose deaths have made naloxone (brand names include Narcan and Evzio) a critical tool in minimizing fatalities due to the opioid crisis, especially as suspected overdoses have risen during the coronavirus pandemic. Health centers in Medicaid expansion states were more likely to report providing naloxone than those in non-expansion states (60% vs. 43%, Figure 5), which could reflect underlying pharmacy policy, such as availability of naloxone without prior authorization, in these states.29 

Figure 5: Share of Health Centers that Distribute Naloxone by State Medicaid Expansion Status

Treatment Capacity Challenges

Health centers faced many challenges in meeting the high demand for treatment among their patients with OUD even before the recent surge in need. Nearly half (47%) of health centers operating a MAT program reported that they do not have the capacity to treat all patients seeking MAT (Figure 6). However, fewer health centers reported capacity issues in 2019 compared to 2018, when 63% of health centers operating a MAT program reported that they could not provide MAT services to all patients in need. Nearly seven in ten (68%) health centers that offer MAT services did not provide them at all sites, a rate that was stable between 2018 and 2019. Nearly three-quarters (74%) of all health centers (whether they provide MAT onsite or not) reported they refer patients for MAT services to other providers in the community. Among those health centers, two-thirds (66%) reported facing provider shortages when they attempted to refer patients, which was similar to the 68% reported in 2018.

Figure 6: Share of Health Centers Reporting MAT Capacity Challenges, 2018 & 2019

Health centers with a MAT program cited a lack of physical space and high costs as top barriers to operating their programs. Nearly three in ten (29%) health centers with a MAT program reported that a lack of physical space was a barrier to operating their MAT program, which generally requires dedicated counseling space (for individual or group sessions) in addition to visits for prescriptions (Figure 7). Additionally, over a quarter (27%) of health centers with a MAT program said high costs hindered MAT program operations. Health centers in non-expansion states were more likely than health centers in expansion states to cite high costs (40% vs. 23%) and high numbers of uninsured patients (41% vs. 16%) as barriers to operating a MAT program (Appendix A Table 1). While federal grants have helped to increase the number of health centers providing MAT, those grants do not seem to be covering all operating expenses. Health centers in Medicaid expansion states appear to benefit from greater Medicaid enrollment, which results in payment for MAT program expenses that can make their programs sustainable, although high costs are still a significant barrier in both expansion and non-expansion states alike.

Figure 7: Reported Barriers to Operating a MAT Program Among Health Centers Providing MAT Onsite

Health centers without a MAT program cited provider concerns as a top barrier to establishing a MAT program. Limited skills and/or confidence among providers to provide MAT services was the most common barrier (42%) to establishing a MAT program reported by health centers without a program, underscoring limited resources, capacity, or availability for provider training and technical assistance (Figure 8). Additionally, these health centers reported provider concerns about diversion – where patients transfer prescribed MAT medications to others – as a common barrier (33%). The second-most common barrier (37%) reported by health centers without a MAT program was a lack of physical space (Appendix A Table 2). This problem persists for health centers with or without a MAT program, as many health centers face the common challenge of balancing limited resources with patient needs. For example, 18% of health centers without a MAT program reported that either OUD was not a significant problem at their health center and/or their health center leadership have not identified OUD as a priority area of focus, likely reflecting the wide range of health needs in the communities in which health centers operate.

Figure 8: Reported Barriers to Establishing a MAT Program Among Health Centers that do not Provide MAT Onsite

Looking Ahead

As a nationwide resource of community-based, safety net primary care providers, health centers play a key role in combatting the ongoing opioid crisis, especially as new reports show increases in suspected drug overdoses during the coronavirus pandemic. The majority of health centers provide MAT services to address the treatment needs of patients with OUD, and many health centers also distribute naloxone for opioid overdose reversal. Because of the broader coverage of patients and treatment services in Medicaid expansion states, health centers in expansion states appear to be better equipped to address demand for OUD services, including by providing MAT onsite and distributing naloxone. Although SUD service expansion grants helped to establish new MAT programs and bolster existing services, these grants do not fully address the ongoing, long-term costs associated with operating a MAT program, and health centers still reported challenges recruiting providers even with grant funding. While health centers in Medicaid expansion states were less likely than those in non-expansion states to cite costs as a barrier to operating MAT programs, costs still remain a barrier for many health centers, regardless of their state’s expansion status.

Health centers will face ongoing challenges in meeting demand for OUD treatment, including many new challenges caused by the social and economic disruptions from the coronavirus pandemic that were not captured in this survey. Health centers have had to fundamentally revamp their service delivery model due to social distancing measures, demand for testing services, and drops in patient visits, while at the same time facing revenue declines, temporary site closures, and a shrinking workforce.30  In response, health centers have increased the use of telehealth as some states have eased restrictions on e-prescribing MAT medications. However, access to MAT treatment remains limited in some areas and returning to normal operations will be difficult for the foreseeable future and even after a coronavirus vaccine allows life to return to some normalcy. Given the role that health centers play in delivering MAT services, particularly in areas with the greatest accessibility barriers, their ability to continue providing these services during the pandemic and after will influence broader efforts to address the opioid crisis.

Methods

Methods

The 2019 Survey of Community Health Centers was jointly conducted by KFF and the Geiger Gibson/RCHN Community Health Foundation Research Collaborative at George Washington University’s Milken Institute School of Public Health. The survey was administered in partnership with the National Association of Community Health Centers (NACHC). The survey was fielded from May to July 2019 and was emailed to 1,342 CEOs of federally-funded health centers in the 50 states and the District of Columbia (DC) identified in the 2017 Uniform Data System (UDS). The response rate was 38%, with 511 responses from 49 states and DC.

The survey data were weighted using 2017 UDS variables for total health center patients, the percentage of their patients reported as racial/ethnic minorities, and total revenue per patient. Survey findings are presented for all responding health centers and responses were analyzed using chi-squared tests to compare responses between health centers in Medicaid expansion and non-expansion states. State Medicaid expansion status was assigned as of the survey fielding period. The authors also analyzed responses with a focus on urban and rural differences, but decided to exclude these findings due to relatively few meaningful differences and for brevity.

This brief was prepared by Bradley Corallo and Jennifer Tolbert of KFF and Jessica Sharac, Anne Markus, and Sara Rosenbaum of the Geiger Gibson/RCHN Community Health Foundation Research Collaborative at the George Washington University.

Additional funding support for this brief was provided to the George Washington University by the RCHN Community Health Foundation.

Appendix

Appendix A

Table 1: Barriers to Operating a MAT Program Among Health Centers Providing MAT Onsite
Barriers to Operating a MAT ProgramAll Health Centers with a MAT ProgramHealth Centers in Medicaid Expansion StatesHealth Centers in Non-Expansion States
Lack of physical space for MAT program29%29%29%
High costs to provide MAT27%23%*40%
It is difficult to fit in the frequent appointments required for patients to receive their MAT medications23%22%24%
Our providers have limited skills and/or confidence to provide MAT22%21%23%
Many of our patients with opioid use disorder are uninsured and we would not be reimbursed for providing MAT services22%16%*41%
We do not face any barriers in operating our MAT program21%24%13%
Our providers have concerns about diversion of MAT medications20%18%26%
Cumbersome administrative requirements serve as a deterrent to providing MAT14%13%16%
Our health center is not able to provide the psychosocial and behavioral therapy components of MAT7%7%4%
Other barrier to establishing or expanding a MAT program25%25%24%
NOTE: *Significantly different from health centers in non-expansion states (p<.01).SOURCE: GW/KFF 2019 Health Center Survey.
Table 2: Barriers to Establishing a MAT Program  Among Health Centers that do not Provide MAT Onsite
Barriers to Establishing a MAT ProgramAll Health Centers without a MAT Program
Our providers have limited skills and/or confidence to provide MAT42%
Lack of physical space for MAT program37%
Our providers have concerns about diversion of MAT medications33%
High costs to provide MAT30%
Cumbersome administrative requirements serve as a deterrent to providing MAT28%
Many of our patients with opioid use disorder are uninsured and we would not be reimbursed for providing MAT services22%
Our health center is not able to provide the psychosocial and behavioral therapy components of MAT17%
It is difficult to fit in the frequent appointments required for patients to receive their MAT medications15%
Opioid use disorder is not a significant problem at our health center so we do not need to establish a MAT program14%
Our leadership and/or providers prefer an abstinence-focused model to address opioid use disorder8%
Health center leadership have not identified opioid use disorder as a priority area of focus7%
Other barrier to establishing a MAT program23%
NOTE: Comparisons for health centers without onsite MAT services in Medicaid expansion and non-expansion states are not shown because there are no significant differences at the p <.05 level.SOURCE: GW/KFF 2019 Health Center Survey.

Appendix B

2019 Survey of Community Health Centers

(All other questions released separately)


Q18.    Looking back on the past year, has your health center seen an increase in patients:

With prescription opioid use disorder? [Yes, No, Don’t Know]

With nonprescription opioid use disorder? [Yes, No, Don’t Know]


Q19.    Does your health center provide medication-assisted treatment (MAT) medications for opioid use disorder on-site? [Respondents who selected “no” skipped to question 23.]

Yes, we provide MAT medications and opioid use disorder counseling on-site.

Yes, we provide MAT medications on-site, but not opioid use disorder counseling.

No, we do not provide MAT medications on-site.


Q20.    Does your health center provide on-site MAT services at all of your health center’s sites or only at some sites?

All sites

Only some sites


Q21.    Please indicate if your health center provides the following medications for opioid use disorder.

Methadone [Yes, No, Don’t Know]

Buprenorphine (brand names include Suboxone, Zubsolv, and Subutex) [Yes, No, Don’t Know]

Naltrexone (brand names include Vivitrol and ReVia) [Yes, No, Don’t Know]


Q22.    Does your health center currently have the capacity to treat on-site all patients who seek MAT serviced for opioid use disorder?

Yes, we have capacity to treat all patients who seek MAT services

No, we do not have capacity to treat all patients who seek MAT services

Don’t know


Q23.    Does your health center face provider shortages when attempting to refer patients elsewhere for MAT services?

We do not attempt to make referrals

Yes, we face provider shortages when trying to refer

No, we do not face provider shortages when trying to refer

Don’t know


Q24.    Does your health center refer patients with opioid use disorder to any of the following providers, programs, or community based organizations to create a continuum of care for recovery services? (Check all that apply).

No, we do not refer patients to other providers, programs, or organizations (if so, please do not select other options)

Certified community behavioral health clinics

Opioid treatment programs

Health departments

Inpatient detoxification programs

Residential treatment programs

Partial hospitalization programs

Recovery coaches or peer mentors

Other providers, programs, or organizations (please specify)


Q25.    Does your health center face any of the following barriers to establishing or operating a medication-assisted treatment (MAT) program? (Check all that apply).

No, opioid use disorder is not a significant problem at our health center so we do not need to establish a MAT program

Health center leadership have not identified opioid use disorder as a priority area of focus

Our leadership and/or providers prefer an abstinence-focused model to address opioid use disorder

Our providers have limited skills and/or confidence to provide MAT

Our providers have concerns about diversion of MAT medications

Our health center is not able to provide the psychosocial and behavioral therapy components of MAT

Cumbersome administrative requirements serve as a deterrent to providing MAT

Many of our patients with opioid use disorder are uninsured and we would not be reimbursed for providing MAT services

High costs to provide MAT

It is difficult to fit in the frequent appointments required for patients to receive their MAT medications

Lack of physical space for MAT program

We do not face any barriers in operating our MAT program

Other barrier to establishing or expanding a MAT program (please specify)


Q26.    Does your health center distribute naloxone (Narcan or Evzio) for opioid overdose reversals?

Yes

No

Don’t know

Endnotes

  1. Ehley, B. (June 29, 2020). Pandemic unleashes a spike in overdose deaths. Politico. Retrieved from https://www.politico.com/news/2020/06/29/pandemic-unleashes-a-spike-in-overdose-deaths-345183 (accessed July 17, 2020). ↩︎
  2. Alter, A. and Yeager, C. (June 2020). COVID-19 Impact on US National Overdose Crisis. Overdose Detection Mapping Application Program. Retrieved from: http://www.odmap.org/Content/docs/news/2020/ODMAP-Report-June-2020.pdf (accessed July 17, 2020). ↩︎
  3. Ibid. ↩︎
  4. Alter, A. and Yeager, C. (May 13, 2020). The Consequences of COVID-19 Overdose Epidemic. Overdose Detection Mapping Application Program. Retrieved from: http://odmap.org/Content/docs/news/2020/ODMAP-Report-May-2020.pdf (accessed July 17, 2020). ↩︎
  5. Wan, W. and Long, H. (July 1, 2020). ‘Cries for help’: Drug overdoses are soaring during the coronavirus pandemic. Washington Post. Retrieved from https://www.washingtonpost.com/health/2020/07/01/coronavirus-drug-overdose/ (accessed July 17, 2020). ↩︎
  6. Substance Abuse and Mental Health Services Administration. (2019). Key substance use and mental health indicators in the United States: Results from the 2018 National Survey on Drug Use and Health (HHS Publication No. PEP19-5068, NSDUH Series H-54). Rockville, MD: Center for Behavioral Health Statistics and Quality, Substance Abuse and Mental Health Services Administration. Retrieved from http://www.samhsa.gov/data/report/2018-nsduh-annual-national-report (accessed February 11, 2020). ↩︎
  7. Ahmad, F. B., Rossen, L.M., and Sutton, P. (2020). Provisional Drug Overdose Death Counts. National Center for Health Statistics. Retrieved from: https://www.cdc.gov/nchs/nvss/vsrr/drug-overdose-data.htm (accessed July 17, 2020). ↩︎
  8. Substance Abuse and Mental Health Services Administration. (2019). Key substance use and mental health indicators in the United States: Results from the 2018 National Survey on Drug Use and Health (HHS Publication No. PEP19-5068, NSDUH Series H-54). Rockville, MD: Center for Behavioral Health Statistics and Quality, Substance Abuse and Mental Health Services Administration. Retrieved from http://www.samhsa.gov/data/report/2018-nsduh-annual-national-report (accessed February 11, 2020). Note: Treatment refers to services provided by specialty providers as defined in NSDUH, which includes “substance use treatment at a hospital (only as an inpatient), a drug or alcohol rehabilitation facility (as an inpatient or outpatient), or a mental health center. This NSDUH definition historically has not considered emergency rooms, private doctors’ offices, prisons or jails, and self-help groups to be specialty substance use treatment facilities.” ↩︎
  9. Substance Abuse and Mental Health Services Administration. “Medication and Counseling Treatment.” Retrieved from https://www.samhsa.gov/medication-assisted-treatment/treatment (accessed February 11, 2020). ↩︎
  10. Substance Abuse and Mental Health Services Administration. “Medication-Assisted Treatment.” Retrieved from https://www.samhsa.gov/medication-assisted-treatment (accessed February 11, 2020). ↩︎
  11. Orgera, K. & Tolbert, J. (2019). The Opioid Epidemic and Medicaid’s Role in Facilitating Access to Treatment. Kaiser Family Foundation. Retrieved from https://modern.kff.org/medicaid/issue-brief/the-opioid-epidemic-and-medicaids-role-in-facilitating-access-to-treatment/ (accessed August 4, 2020). ↩︎
  12. Office of the Associate Administrator, Bureau of Primary Health Care, Health Resources and Services Administration. Email communication with the authors, March 3, 2020. ↩︎
  13. U.S. Dept. of Health and Human Services Press Office. “HHS Awards $94 Million to Health Center to Help Treat the Prescription Opioid Abuse and Heroin Epidemic in America.” Retrieved from https://www.hhs.gov/hepatitis/blog/2016/03/17/hhs-awards-94-million-to-health-centers-to-help-treat-the-prescription-opioid-abuse-and-heroin-epidemic-in-america.html (accessed February 26, 2020). ↩︎
  14. Bureau of Primary Health Care. “Fiscal Year 2017 Access Increase in Mental Health and Substance Abuse (AIMS) Awards.” Health Resources and Services Administration. Retrieved from https://bphc.hrsa.gov/programopportunities/fundingopportunities/aims/fy2017awards/index.html (accessed February 26, 2020). ↩︎
  15. Bureau of Primary Health Care. “Fiscal Year 2018 Expanding Access to Quality Substance Use Disorder and Mental Health Services (SUD-MH) Awards.” Health Resources and Services Administration. Retrieved from https://bphc.hrsa.gov/programopportunities/fundingopportunities/sud-mh/fy2018awards/index.html (accessed February 26, 2020). ↩︎
  16. Bureau of Primary Health Care. “FY 2019 Integrated Behavioral Health Services (IBHS) Awards.” Health Resources and Services Administration. Retrieved from https://bphc.hrsa.gov/program-opportunities/funding-opportunities/behavioral-health/awards (accessed February 26, 2020). ↩︎
  17. Substance Abuse and Mental Health Services Administration. “Medication and Counseling Treatment.” Retrieved from https://www.samhsa.gov/medication-assisted-treatment/treatment (accessed February 11, 2020). ↩︎
  18. Bureau of Primary Health Care. 2016-2019 Uniform Data System. Health Resources and Services Administration. Retrieved from https://bphc.hrsa.gov/uds/datacenter.aspx and https://bphc.hrsa.gov/uds2016/datacenter.aspx?q=t5&year=2016&state=&fd= (accessed August 13, 2020). ↩︎
  19. National Association of Community Health Centers. (2020). Community Health Center Chartbook. Figure 5-10. Retrieved from https://www.nachc.org/wp-content/uploads/2020/01/Chartbook-2020-Final.pdf (accessed August 4, 2020). ↩︎
  20. Corallo, B. & Tolbert, J. Impact of Coronavirus on Community Health Centers. Kaiser Family Foundation. Retrieved from https://modern.kff.org/coronavirus-covid-19/issue-brief/impact-of-coronavirus-on-community-health-centers/ (accessed July 17, 2020). ↩︎
  21. Ahmad, F. B., Rossen, L.M., and Sutton, P. (2020). Provisional Drug Overdose Death Counts. National Center for Health Statistics. Retrieved from: https://www.cdc.gov/nchs/nvss/vsrr/drug-overdose-data.htm (accessed July 17, 2020). ↩︎
  22. KFF analysis of Centers for Disease Control and Prevention (CDC), National Center for Health Statistics. Multiple Cause of Death 2018 on CDC WONDER Online Database, released in 2020. Note: Data are from the Multiple Cause of Death Files, 1999-2018, as compiled from data provided by the 57 vital statistics jurisdiction through the Vital Statistics Cooperative Program. Retrieved from: https://wonder.cdc.gov/mcd.html (accessed August 13, 2020). Drug overdose deaths were classified using the International Classification of Disease, Tenth Revision (ICD-10), based on the ICD-10 underlying cause-of-death codes X40–44 (unintentional), X60–64 (suicide), X85 (homicide), or Y10–Y14 (undetermined intent). Among the deaths with drug overdose as the underlying cause, the type of opioid involved is indicated by the following ICD-10 multiple cause-of-death codes: opioids (T40.0, T40.1, T40.2, T40.3, T40.4, or T40.6); natural and semisynthetic opioids (T40.2); methadone (T40.3); synthetic opioids, other than methadone (T40.4); and heroin (T40.1). Death rates are deaths per 100,000 population (crude). ↩︎
  23. Rosenbaum, S., Tolbert, J., Sharac, J., Shin, P., Gunsalus, R. & Zur, J. (2018). Community Health Centers: Growing Importance in a Changing Health Care System. Kaiser Family Foundation. Retrieved from https://modern.kff.org/medicaid/issue-brief/community-health-centers-growing-importance-in-a-changing-health-care-system/ (accessed July 17, 2020). ↩︎
  24. Rosenbaum, S., Sharac, J., Shin, P & Tolbert, J. (2019). Community Health Center Financing: The Role of Medicaid and Section 330 Grant Funding Explained. Kaiser Family Foundation. Retrieved from https://modern.kff.org/medicaid/issue-brief/community-health-center-financing-the-role-of-medicaid-and-section-330-grant-funding-explained/ (accessed August 4, 2020). ↩︎
  25. Substance Abuse and Mental Health Services Administration. “Medication-Assisted Treatment.” Retrieved from https://www.samhsa.gov/medication-assisted-treatment (accessed February 11, 2020). ↩︎
  26. Kaiser Family Foundation. (2019). Medicaid’s Role in the Opioid Epidemic. Retrieved from https://modern.kff.org/infographic/medicaids-role-in-addressing-opioid-epidemic/ (accessed August 4, 2020). ↩︎
  27. Gifford et al. (2019). A View from the States: Key Medicaid Policy Changes: Results from a 50-State Medicaid Budget Survey for State Fiscal Years 2019 and 2020. Kaiser Family Foundation. Retrieved from https://modern.kff.org/medicaid/report/a-view-from-the-states-key-medicaid-policy-changes-results-from-a-50-state-medicaid-budget-survey-for-state-fiscal-years-2019-and-2020/ (accessed August 4, 2020). ↩︎
  28. Musumeci M. & Tolbert, J. (2019). Federal Legislation to Address the Opioid Crisis: Medicaid Provisions in the SUPPORT Act. Kaiser Family Foundation. Retrieved from https://modern.kff.org/medicaid/issue-brief/federal-legislation-to-address-the-opioid-crisis-medicaid-provisions-in-the-support-act/ (accessed August 4, 2020). ↩︎
  29. Kaiser Family Foundation. Medicaid Behavioral Health Services Database. Retrieved from https://modern.kff.org/data-collection/medicaid-behavioral-health-services-database/ (accessed March 2, 2020). ↩︎
  30. Corallo, B. & Tolbert, J. Impact of Coronavirus on Community Health Centers. Kaiser Family Foundation. Retrieved from https://modern.kff.org/coronavirus-covid-19/issue-brief/impact-of-coronavirus-on-community-health-centers/ (accessed July 17, 2020). ↩︎

This Week in Coronavirus: August 7 to August 13

Published: Aug 14, 2020

Every Friday we recap the past week in the coronavirus pandemic from our tracking, policy analysis, polling, and journalism.

This week worldwide cases surpassed the 20 million mark and United States’ cases surpassed 5 million with over 167,000 deaths.

An update to our state reports of long-term care facility cases and deaths show that the pandemic has not abated in these facilities, as the number of hot spot states has consistently hovered at 32 this week.

Here are the updates to coronavirus stats from KFF’s tracking resources:

Global Cases and Deaths: Total cases worldwide approached 21 million between August 7 and August 13 – with an increase of approximately 1.8 million new confirmed cases. There were also approximately 40,700 new confirmed deaths worldwide during the period, bringing the total to nearly 755,600 confirmed deaths.

U.S. Cases and Deaths: Total confirmed cases in the U.S. surpassed 5.2 million this week. There was an approximate increase of 365,300 confirmed cases between August 7 and August 13. About 7,000 confirmed deaths in the past week brought the total to over 167,000 confirmed deaths in the U.S.

• Data Reporting Status: 47 states are reporting COVID-19 data in long-term care facilities, 4 states are not reporting• Long-term care facilities with known cases: 15,213 (across 45 states)• Cases in long-term care facilities: 375,261 (across 44 states)• Deaths in long-term care facilities: 67,112 (in 45 states)• Long-term care facility cases as a share of total state cases: 19% (across 44 states)• Long-term care facility deaths as a share of total state deaths: 43% (across 45 states)

State Social Distancing Actions (includes Washington D.C.) that went into effect this week:

• Face Mask Requirements- New requirements: NH• Social Distancing Measures- Extended: TX, UT, MN, SC- Paused: No states- Rolled back: KY- New restrictions: AK, HI, MA

The latest KFF COVID-19 resources:

  • Food Insecurity and Health: Addressing Food Needs for Medicaid Enrollees as Part of COVID-19 Response Efforts (Issue Brief)
  • Updated: State Action to Limit Abortion Access During the COVID-19 Pandemic (Issue Brief)
  • Updated: COVID-19 Coronavirus Tracker – Updated as of August 13 (Interactive)
  • Updated: State Data and Policy Actions to Address Coronavirus (Interactive)

The latest KHN COVID-19 stories:

  • New Interactive Database by KFF’s Kaiser Health News and Guardian US Reveals More Than 900 Health Care Workers Have Died in the Fight Against COVID-19 in the U.S. (News Release, KHN, The Guardian)
  • Exclusive: Over 900 Health Workers Have Died of COVID-19. And the Toll Is Rising. (KHN, The Guardian)
  • Behind The Byline: The Count — And the Toll (KHN)
  • Nurses and Doctors Sick With COVID Feel Pressured to Get Back to Work (KHN)
  • Public Health Officials Are Quitting or Getting Fired in Throes of Pandemic (KHN, AP)
  • Business Is Booming for Dialysis Giant Fresenius. It Took a $137M Bailout Anyway. (KHN, Washington Post)
  • Without Federal Protections, Farm Workers Risk Coronavirus Infection to Harvest Crops (KHN, NPR)
  • Turning Anger Into Action: Minority Students Analyze COVID Data on Racial Disparities (CHL)
  • In Health-Conscious Marin County, Virus Runs Rampant Among ‘Essential’ Latino Workers (KHN, Los Angeles Times)
  • Bereaved Families Are ‘the Secondary Victims of COVID-19’ (KHN, CNN)
  • Amid COVID Chaos, California Legislators Fight for Major Health Care Bills (KHN)
  • Primary Care Doctors Look at Payment Overhaul After Pandemic Disruption (KHN, Fortune)
  • ‘An Arm and a Leg’: Financial Self-Defense School Is Now in Session (KHN)
  • COVID Data Failures Create Pressure for Public Health System Overhaul (KHN, USA Today)
  • Dying Young: The Health Care Workers in Their 20s Killed by COVID-19‘ (KHN, The Guardian)
  • Is This When I Drop Dead?’ Two Doctors Report From the COVID Front Lines (KHN, The Guardian)
  • Back to Life: COVID Lung Transplant Survivor Tells Her Story (KHN, NPR)
  • Contact Tracers in Massachusetts Might Order Milk or Help With Rent. Here’s Why. (KHN, NPR)
  • Listen: Will Telemedicine Outlast the Pandemic? (KHN)