Health and Financial Risks for Noncitizen Immigrants due to the COVID-19 Pandemic

Published: Aug 18, 2020

Summary

The COVID-19 pandemic has taken a disproportionate toll on some groups of individuals, including lower income individuals and people of color. One group who faces risks and challenges associated with the pandemic is the nearly 22 million noncitizen immigrants living in the U.S. today. Non-citizen immigrants were already facing a range of challenges prior to the pandemic, including increased fear and uncertainty due to shifting immigration policy that was leading some to turn away from accessing programs and services. As virus hotspots have risen in the Southern and Western regions of the country, with reports of increases in towns along the U.S.-Mexico border, understanding the risks and challenges facing noncitizen immigrants is of increasing importance. This brief analyzes key characteristics of noncitizen immigrants to examine the health and economic risks they face amid the pandemic. It finds:

  • Noncitizen immigrants are more likely to live in large households and in urban areas compared to citizens. Overall, 33% of noncitizen immigrants live in a household with more than four people compared to 21% of citizens. Noncitizens also are more likely than citizens are to live in an urban area (96% vs. 86%).
  • There are nearly 13 million noncitizen immigrant workers who make up 8% of the overall workforce and are concentrated in jobs that cannot be done virtually. Nearly one in four (23%) noncitizen workers are in the construction and restaurant and food services industries. Occupations that employ the largest numbers of noncitizen workers include construction laborers, cooks, janitors and building cleaners, agricultural workers, and maids and housekeepers, where they also account for a high share of all workers.
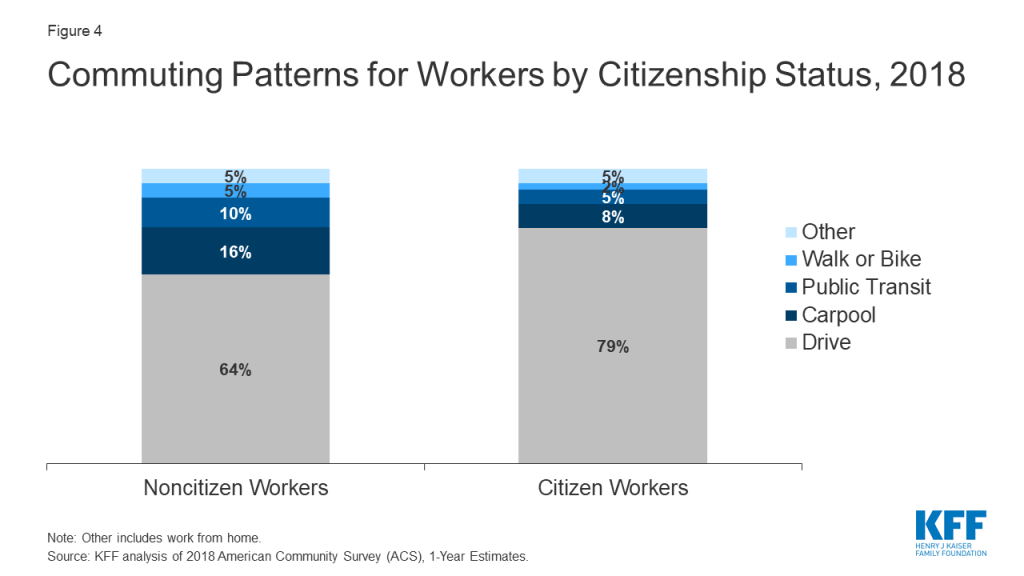
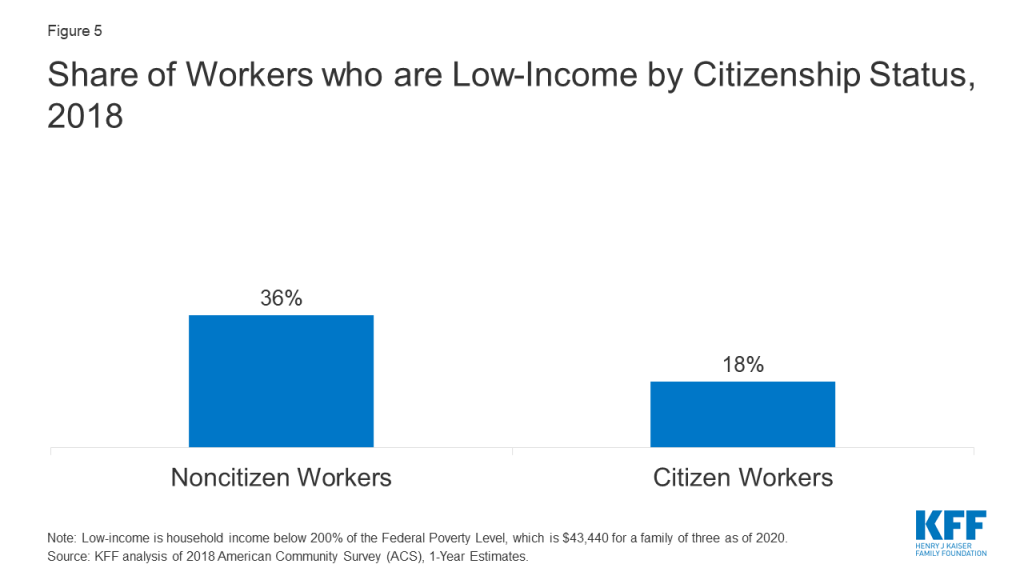
  • Noncitizen workers are more likely to rely on public transportation to commute to their job and to be low-income compared to their citizen counterparts. Nearly one in four (24%) noncitizen workers rely on public transportation or carpools to commute to their job compared to 12% of citizen workers. They also are twice as likely live in a low-income household compared to citizen workers (36% vs. 18%).
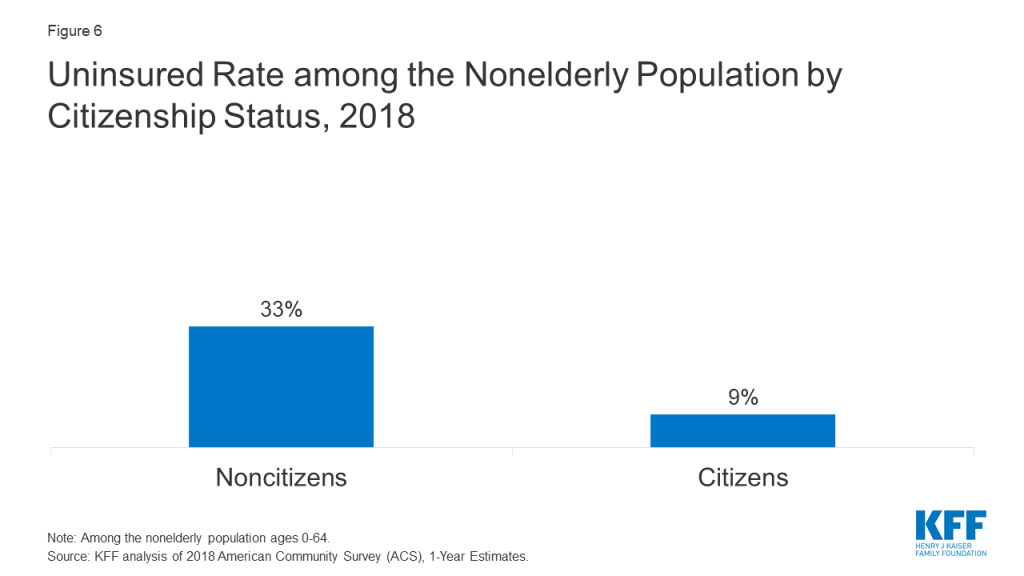
  • Noncitizen immigrants are significantly more likely to be uninsured than citizens. Among the nonelderly population, 33% of noncitizen immigrants are uninsured compared to 9% of citizens.

Taken together, noncitizen immigrants’ living, working, and commuting situations increase their risk for exposure to coronavirus. They are more likely to live in larger households in densely populated areas that make social distancing challenging. Moreover, because many noncitizens workers are employed in jobs that cannot be done from home and have lower incomes, many cannot afford to stay home to limit risk of exposure and/or if they are sick. Their lower incomes and work in service industries that have experienced cutbacks amid the pandemic also increase their risks of experiencing financial hardship. Noncitizen immigrants also may have difficulty accessing testing and treatment due to their higher uninsured rate and immigration-related fears. Although noncitizen immigrants face increased risks associated with the pandemic, restrictions limit immigrants’ eligibility for federal health and financial relief provided in response to COVID-19. Further, those who are eligible for assistance may be reluctant to access services or supports due to immigration-related fears. The extent to which COVID-19 response efforts address challenges facing immigrant families has implications for immigrant families as well as the health and economic stability of the broader population, particularly given the role immigrants play in the nation’s workforce.

Issue Brief

Overview of Noncitizen Immigrants

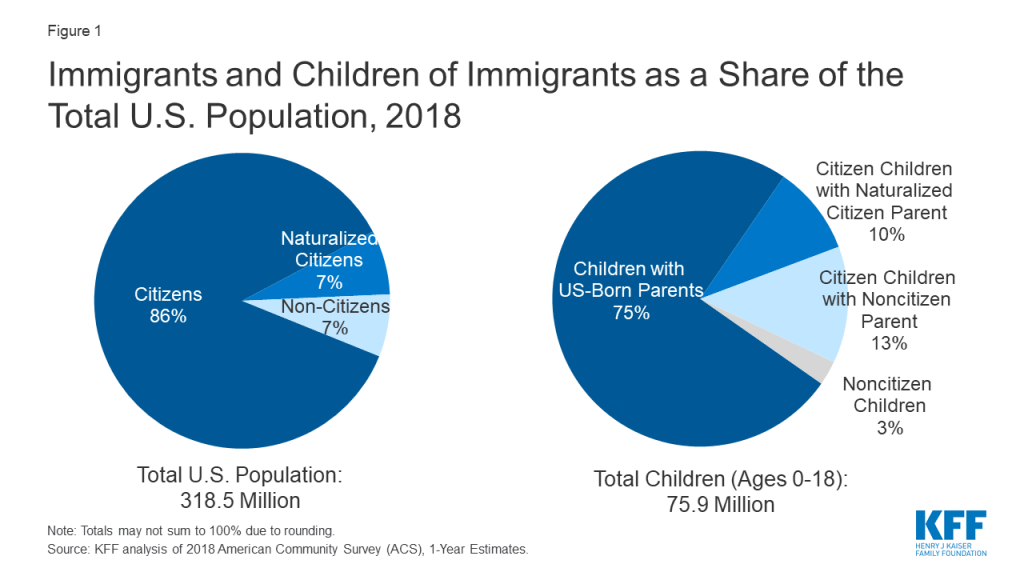
As of 2018, there were nearly 22 million noncitizen immigrants living in the United States, making up roughly 7% of the total population (Figure 1). Noncitizens include lawfully present and undocumented immigrants. Many individuals live in mixed status families that may include lawfully present immigrants, undocumented immigrants, and/or citizens. Over two-thirds (67%) of noncitizens lived in a household (which may include their family or unrelated household members) with a citizen. While there are few noncitizen children overall, about 10 million or nearly 13% of citizen children have a noncitizen parent.

Figure 1: Immigrants and Children of Immigrants as a Share of the Total U.S. Population, 2018

Key Characteristics of Noncitizen Immigrants

This analysis presents data on the living situations, employment and commuting patterns, income, and health insurance for noncitizen immigrants prior to the COVID-19 pandemic. It is based on KFF analysis of 2018 American Community Survey data (see Methods for more details.) Although these data show characteristics of noncitizen immigrants prior to the pandemic, they provide insight into the health and financial risks they face associated with the pandemic.

Living Situations

Non-citizen immigrants are more likely than citizens to live in larger households and urban areas, potentially increasing their risk of exposure to the virus. Overall, 33% of noncitizen immigrants live in a household with more than four people compared to 21% of citizens, and 8% nonelderly noncitizen immigrants live with someone aged 65 or over. Noncitizens also are more likely than citizens are to live in an urban area (96% vs. 86%).

Employment, Commuting, and Income

The nearly 13 million noncitizen workers, who make up 8% of the overall workforce, are concentrated in jobs that generally cannot be done virtually. Nearly one in four (23%) noncitizen workers are in the construction and restaurant and food services industries (Figure 2).

Figure 2: Distribution of Noncitizen Immigrant Workers by Industry, 2018

Occupations that employ the largest numbers of noncitizen workers include construction laborers, cooks, janitors and building cleaners, agricultural workers, and maids and housekeepers, where they also account for a high share of all workers. For example, they account for over four in ten agricultural workers (42%), 30% of maids and housekeepers, one in five (20%) cooks, and 16% of janitors and building cleaners (Figure 3). Noncitizen workers also contribute to the health care workforce. They make up 5% of workers in the health care industry and up to 10% of all aides and personal care workers and direct contact support workers in home health care and nursing and residential care facilities.

Figure 3: Share of Workers who Are Noncitizen Immigrants in Top Five Occupations Held by Noncitizen Workers, 2018

Prior to the pandemic, noncitizen workers were more likely than citizen workers to rely on public transportation or carpools to commute to their job (Figure 4). Noncitizens were less likely to drive alone to work compared to citizen workers (64% vs 79%) and were twice as likely as their citizen counterparts were to carpool (16% vs. 8%) and use public transit (10% vs. 5%).

Figure 4: Commuting Patterns for Workers by Citizenship Status, 2018

Noncitizen workers twice as likely to be low-income (household income below 200% of the federal poverty level or $43,400 for a family of three as of 2020) compared to their citizen counterparts (36% vs. 18%) (Figure 5).

Figure 5: Share of Workers who are Low-Income by Citizenship Status, 2018

Health Insurance

Noncitizen immigrants are significantly more likely than citizens to be uninsured. Among the nonelderly population, 33% of noncitizen immigrants are uninsured compared to 9% of citizens (Figure 6).

Figure 6: Uninsured Rate among the Nonelderly Population by Citizenship Status, 2018

Implications

Taken together, noncitizen immigrants’ living, working, and commuting situations make them more likely to be at risk for exposure to coronavirus. They are more likely to live in larger households in densely populated areas that make social distancing challenging. Moreover, because many noncitizens workers are employed in jobs that cannot be done from home and have lower incomes, many may put themselves at risk of exposure to coronavirus because they cannot afford to stay home and miss work. Noncitizen workers may also face increased risk of exposure due to their reliance on public transportation and carpools. Although data on infections and deaths among immigrants are limited, there have been outbreaks among workers in meatpacking plants and farmworkers, which include high shares of immigrant workers. Moreover, reports indicate that outbreaks are spiking along the U.S.-Mexico border, where large numbers of immigrants live.

Noncitizen immigrants also face increased risks of financial difficulties due to economic impacts of the pandemic. Noncitizen workers are at risk for job cutbacks because many are working in service industries, such as restaurants and food services. Other analysis finds that initial job losses amid the pandemic have been particularly high among immigrants. Given their low incomes, job loss could lead to significant financial pressures for them and their families, including increased difficulty paying for basic needs. Analysis has found that Hispanic adults in families with noncitizens are experiencing higher rates of negative employment impacts because of the pandemic than families where all members are citizens, and that they were more likely to report experiencing hardships such as food insecurity or not being able to pay their full rent or mortgage on time.

Noncitizens immigrants may face increased barriers to accessing testing or treatment due to higher uninsured rates. Immigrants are on average younger and healthier compared to citizens, meaning they face relatively lower risk of experiencing serious illness if infected with coronavirus. However, because they face increased barriers accessing health care, they may have greater challenges accessing testing and treatment that could lead them to delay or forgo seeking care. Research shows that uninsured individuals are less likely to have a usual source of care and more likely to delay or go without care compared to those with insurance. The number of uninsured individuals, including immigrants, is expected to increase as people lose jobs and job-based health coverage due to the pandemic.

Although noncitizen immigrants face increased risks associated with the pandemic, restrictions limit immigrants’ eligibility for federal health and financial relief provided in response to COVID-19.

  • Health coverage and testing and treatment. Under existing rules, eligibility for Medicaid and the Children’s Health Insurance Program (CHIP) is generally limited to lawfully present immigrants who have had lawful status for at least five years, meaning that many recent lawfully present immigrants are ineligible to enroll. Lawfully present immigrants are eligible for Marketplace coverage regardless of their length of time in the country. Undocumented immigrants are not eligible to enroll in Medicaid or CHIP or to purchase coverage through the Affordable Care Act (ACA) Marketplaces. The Families First Act as amended by the Coronavirus Aid, Relief, and Economic Security (CARES) provides a new optional Medicaid category that states can adopt to provide free coronavirus testing to uninsured individuals. However, it does not change the existing immigrant eligibility restrictions for Medicaid, and, as such, does not extend to recent lawfully present and undocumented immigrants. A portion of the $100 billion in federal funding directed to providers under the CARES Act will go to hospitals for treating uninsured patients regardless of immigration status, but how this may affect immigrant access will depend on how the funding is allocated.
  • Financial assistance. The CARES Act provides financial assistance to individuals through a recovery rebate, but it is limited to people filing taxes with Social Security Numbers. Both an individual filer and his or her spouse must have a valid Social Security Number if filing jointly. Other analysis estimates that this requirement excludes 15.4 million people from receiving the rebate. Immigrants generally may qualify for regular unemployment insurance if they are work-authorized at the time they file for unemployment insurance and remain authorized during the period they receive unemployment. However, that leaves undocumented immigrants without access to unemployment support even if they were employed.
  • Some states and localities have taken steps to fill in the gaps in assistance available to immigrant families. For example, as of August 12, 2020, 13 states have expanded Emergency Medicaid to cover COVID-related testing or treatment. Emergency Medicaid provides payments to states for emergency services made on behalf of individuals who are otherwise eligible for Medicaid but for their immigration status. In addition, some states and localities have established financial relief funds to assist immigrants who do not qualify for federal resources.

Growing fear and uncertainty among individuals in immigrant families may also lead to some individuals avoiding accessing services or assistance even if they are eligible for them. Immigration policy changes and enhanced immigration enforcement efforts over the past several years have led to growing fear and uncertainty among immigrant families that are leading some to avoid seeking services, including health care, and/or enrolling in public programs, including health coverage through Medicaid and the Children’s Health Insurance Program (CHIP). These include recent changes to public charge policy that would prevent individuals from obtaining a green card or entry into the U.S. if they are determined likely to use certain public programs, including Medicaid. U.S. Citizenship and Immigration Services (USCIS) posted an alert clarifying that it will not consider testing, treatment, or preventive care (including vaccines if a vaccine becomes available) related to COVID-19 as part of public charge determinations. In addition, Immigration and Customs Enforcement (ICE) has reiterated that, consistent with its existing sensitive locations policy, it will not carry out enforcement operations at or near health care facilities, except in the most extraordinary circumstances. However, families may still be fearful of accessing services or assistance if they are uncertain about current policies.

In sum, noncitizen immigrants face an array of risks and challenges associated with the pandemic. However, they have more limited access to federal support and assistance. The extent to which COVID-19 response efforts address challenges facing immigrant families has implications for immigrant families as well as the health and economic stability of the broader population, particularly given the role immigrants play in the nation’s workforce.

Methods

This analysis is based on a KFF analysis of the 2018 American Community Survey (ACS), 1-year file. The ACS includes a 1% sample of the US population, the subset used here includes over 160,000 non-citizen observations. Industry and Occupation definitions are defined within ACS using the 2018 SOC and the 2017 NAICS – for more information see here. We define workers as adults (18+) who earned at least $1,000 during the year. Metro and non-metro areas are defined by the USDA Economic Research Service.

The ACS asks respondents about their health insurance coverage at the time of the survey. Respondents may report having more than one type of coverage; however, individuals are sorted into only one category of insurance coverage.

News Release

A Review of Multiple Analyses Documents Persistent Racial Disparities in COVID-19

Published: Aug 17, 2020

A KFF review of a wide range of studies finds a consistent pattern that people of color are bearing a disproportionate burden of COVID-19 cases, deaths, and hospitalizations, and that they may face increased barriers to access testing. These disparities, brought to the fore in the pandemic, mirror and compound longstanding underlying disparities in health and health care in the U.S. that stem from structural and systemic barriers across sectors, including racism and discrimination. Other analyses also suggest that the COVID-19 pandemic is taking a larger economic toll on people of color.

Racial Disparities in COVID-19: Key Findings from Available Data and Analysis, as well as other KFF work related to racial disparities and the pandemic, can be found at kff.org.

Racial Disparities in COVID-19: Key Findings from Available Data and Analysis

Authors: Samantha Artiga, Bradley Corallo, and Olivia Pham
Published: Aug 17, 2020

Summary

Over the course of the COVID-19 pandemic, there has been a growing focus on its disproportionate impacts on people of color, particularly as availability of data to understand racial disparities has increased. This brief summarizes key findings from data and analyses examining COVID-19 related cases, deaths, hospitalizations, and testing by race and ethnicity as of early August 2020 to provide increased insight into these disparities. Key findings include the following:

Multiple analyses of available federal, state, and local data show that people of color are experiencing a disproportionate burden of COVID-19 cases and deaths. They show particularly large disparities in cases and deaths for Black and American Indian and Alaska Native (AIAN) people and widespread disparities in cases among Hispanic people compared to their White counterparts. For example, KFF analysis of state reported data showed that, as of August 3, 2020, Black individuals accounted for more cases and deaths relative to their share of the population in 30 of 49 states reporting cases and 34 of 44 states reporting deaths. Other analysis of state-reported data finds that, as of August 4, the COVID-19 related death rate among Black people was over twice as high as the rate for White people, while the mortality rate for AIAN people was nearly two times that of White people. Data also reveal disparities for Asian and Native Hawaiian and Pacific Islander (NHOPI) individuals in certain areas and show a sharp, recent rise in mortality rates for NHOPI and Hispanic people. Analyses further find that disparities in COVID-19 related deaths persist across age groups and that people of color experience more deaths among younger people relative to White individuals. There is limited data and research to understand of impacts for subgroups, such as immigrants, who may be at increased risk.

Data show that Black, Hispanic, and AIAN people are at increased risk of hospitalization due to COVID-19. For example, data from Coronavirus Disease 2019-Associated Hospitalization Surveillance Network (COVID-NET) show that, from March through July 18, 2020, age-adjusted hospitalization rates due to COVID-19 for Black, Hispanic, and AIAN people were roughly five times higher than that of White people. Several studies using health system data also point to a higher risk of hospitalization for Black and Hispanic patients. Reflecting these higher hospitalization rates, analyses show that people of color make up a disproportionate share of COVID-19 hospitalizations relative to their share of the population or total hospital visits.

Studies find racial/ethnic disparities in COVID-19 among Medicare beneficiaries, nursing home facilities, pregnant women, and children. Preliminary Medicare COVID-19 data show that Black, Hispanic, and AIAN Medicare beneficiaries had higher rates of infection and hospitalization compared to White beneficiaries. Analysis finds that nursing homes where a higher share of residents are people of color are more likely to report a COVID-19 case. Studies also find disproportionate shares of infection among Hispanic and Black pregnant women and a higher risk of hospitalization among Black and Hispanic children.

Data to understand variation in testing by race/ethnicity remains very limited but suggest people of color may face increased barriers to testing. Very few states report testing data by race/ethnicity. Data on testing within community health centers analyzed by KFF show that people of color represented more than half of all people tested (57%) and confirmed cases (56%) at health centers, and that Hispanic patients made up a higher share of positive tests compared to their share of total tested patients. Analyses suggest that testing sites in and near predominantly Black and Hispanic neighborhoods are likely to face greater demand than those near predominantly White areas, which could contribute to longer wait times, and the share of people of color in an area is associated with an increase in travel time to a testing site. One study also found that, in New York City, more tests were performed in neighborhoods with a higher share of White residents, while the highest shares of positive tests were in neighborhoods with more people of color and lower socioeconomic measures. Reporting on testing site locations in Texas suggests that testing sites are disproportionately located in areas with larger shares of White residents.

Together, these data show that people of color are bearing a disproportionate burden of COVID-19 cases, deaths, and hospitalizations and that they may face increased barriers to access testing. Other analyses also suggest that the COVID-19 pandemic is taking a larger economic toll on people of color. These disparities in COVID-19 reflect and compound longstanding underlying social, economic, and health inequities that stem from structural and systemic barriers across sectors, including racism and discrimination. For example, prior to the pandemic, people of color had higher rates of health conditions, were more likely to be uninsured and face barriers to accessing health care, and were more likely to have lower incomes and face financial challenges. These underlying disparities put people of color at increased risk for exposure to the virus, experiencing serious illness if they are infected, and facing barriers to accessing testing and treatment.

The health and economic impacts of COVID-19 could further widen racial disparities at a time when there is a growing focus on and call for racial justice and health equity. Overall, the findings highlight the importance of considering how COVID-19 relief and response efforts will address inequities, including in decisions related to distribution of treatments and vaccines once they become available. Prioritizing equity will be key for addressing the current gaps in COVID-19 and health care more broadly and preventing widening of disparities in the future.

Issue Brief

Data on COVID-19 by Race/Ethnicity

At the outset of the COVID-19 pandemic, limited data were available on cases, hospitalization, deaths, and testing disaggregated by race/ethnicity, constraining the ability to understand its effects across communities and to target response and relief efforts. Availability of this data has increased over time and, along with it, there has been a growing body of analyses examining race-associated differences in the impacts of the virus. As of August 2020, nearly all states were reporting COVID-19 related cases and/or deaths by race and/or ethnicity. Following early state reporting of these data, the Centers for Disease Control and Prevention (CDC) began reporting hospitalizations, cases, and deaths by race/ethnicity, and the Centers for Medicare and Medicaid Services (CMS) and Health Resources and Services Administration (HRSA) began reporting limited data. (See Appendix A for a list of federal sources of COVID-19 data by race/ethnicity). Beyond these state and federal data sources, health systems and health insurers may also collect data, but these data typically are not publicly accessible.

While data have improved over time, they continue to have significant gaps and limitations. For example, some states only report either cases or deaths, states use different race/ethnicity categories, states vary in which racial/ethnic groups for which they report data, and some states have high shares of cases with unknown race/ethnicity. The federally reported data provide more standardized race/ethnicity categorizations but still have limitations, including high shares of cases with unknown race/ethnicity as well as lack of state-level data for some measures and inconsistencies that limit comparability of data across states. The federal data on hospitalizations represent a subset of 250 acute care hospitals in 14 states that are part of the Coronavirus Disease 2019-Associated Hospitalization Surveillance Network (COVID-NET). As of early August, data on testing by race/ethnicity remain very limited, with only six states reporting testing by race/ethnicity. In addition, because people of color may be at greater risk for exposure due to their jobs or living circumstances, data on testing rates alone cannot necessarily identify disparities. Data are available for tests conducted at community health centers, which primarily serve low-income patients and communities of color, though the data are not representative of a state’s population and are based on rapid response surveys.

Key Findings on COVID-19 by Race/Ethnicity

Below is a summary of key findings from data and analyses that examine reported COVID-19 cases, deaths, hospitalizations, and testing by race and ethnicity available as of early August 2020.1  (See Appendix B for a list of analysis referenced in this brief.) To collect relevant analyses, we conducted keyword searches of websites for government, research, and policy organizations that publish health-related research; media; and PubMed. While we tried to be comprehensive in our inclusion of studies and findings on this topic, it is possible that we omitted some relevant studies or findings. Moreover, because work in this area is continually developing and growing, research that is more recent may be available that this summary does not reflect.

Cases and Deaths

Multiple analyses of available federal, state, and local data show that people of color are experiencing a disproportionate burden of COVID-19 cases and deaths. They show particularly large disparities in cases and deaths for Black and AIAN people and widespread disparities in cases among Hispanic people compared to their White counterparts. Data also reveal disparities for Asian and NHOPI individuals in certain areas and show a sharp recent rise in mortality rates for NHOPI and Hispanic people. There is limited data and research to understand of impacts for subgroups, such as immigrants, who may be at increased risk.

  • People of color are experiencing significantly higher rates of infections and deaths compared to White individuals. For example, analysis of state-reported data finds that, as of August 4, COVID-19 related death rates among Black people were over twice as high as the rate for White people, while the mortality rate for AIAN people was nearly two times that of White people (Figure 1). These data also show a sharp recent rise in mortality rates for NHOPI and Hispanic people. Reporting based on county-level data found that Black and Hispanic people are nearly three times as likely to contract COVID-19 and nearly two times as likely to die from COVID-19. It also found several areas where AIAN individuals were significantly more likely to be infected compared to White people as well as some higher risk of infection among Asian people. Other data show that, in states with large numbers of NHOPI people, they have higher infection rates compared to other racial and ethnic groups, and that Asian people are experiencing a higher case fatality rate than average in a number of areas across the country. Further, a study using data from a health system in the Baltimore-Washington DC region found that Hispanics had a higher infection rate compared to other groups.
Figure 1: COVID-19 Mortality Rates by Race/Ethnicity, as of August 4, 2020
  • Disparities for Black and Hispanic people are widespread across the country. For example, KFF analysis of state reported data showed that, as of August 3, 2020, Black individuals accounted for more cases and deaths relative to their share of the population in 30 of 49 states reporting cases and 34 of 44 states reporting deaths (Figure 2). Hispanic people made up a higher share of cases and deaths compared to their share of the total population in 35 of 45 states reporting cases and 10 of 44 states reporting deaths. County-level data also suggest that disparities in infection rates for Black and Hispanic people are widespread across counties. The state and county-level data also point to stark disparities for AIAN and Asian people but in a more limited number of areas.
Figure 2: Ratio of Coronavirus Deaths to Share of Total Population among Black People by State as of August 3, 2020
  • County-level analysis finds that cases and deaths are concentrated in areas with higher shares of Black and Hispanic residents. One study of nationwide county-level data found that higher shares of Black people living in a county are associated with increased shares of COVID-19 cases and deaths in the county, as well as a positive correlation between the share of Asian residents and the county infection and mortality rate. Other analysis finds that, as of April, 97% of disproportionately Black counties (with a greater share of Black residents compared to the U.S. average) reported a case and 49% reported a death versus 81% and 28%, respectively, for other counties. These disparities persisted after adjusting for county-level characteristics such as percent of the population older than 65, unemployment, health insurance coverage status, comorbidities, days since first case of diagnosis, and urbanicity. Overall, the roughly 20% of U.S. counties that are disproportionately Black accounted for 52% of COVID-19 diagnoses and 58% of deaths nationally during the first several months of the U.S. epidemic. In addition, another analysis finds that, as of August 3, 8 of the 20 counties with the highest level of deaths per capita are predominantly Black, and three of the five counties with the highest per capita death rates are predominantly Black. Similarly, a study of ten major metropolitan areas found that counties with larger shares of Latino residents have disproportionate shares of cases. Additional work finds that, among both counties with higher median county-level income and lower median county-level income, higher shares of people of color were associated with higher rates of infection and death compared to counties that have higher shares of White residents (>81%).

Disparities in COVID-19 deaths for people of color persist across age groups, and people of color experience more deaths among younger people relative to White individuals. Researchers examining federally reported data find increased risk of death due to COVID-19 among Black, Hispanic, AIAN, and Asian and Pacific Islander people as compared to their White counterparts across age groups, with particularly large disparities among younger adults age 25-54. The study also found that Black and Hispanic populations lost more years of total potential life due to COVID-19 compared to the White population, even though the White population is three to four times larger. Other analysis finds that disparities in deaths widen for all groups of color after adjusting for age. CDC analysis of data for roughly 11,000 COVID-19 deaths in 16 public health jurisdictions found that over one in three (35%) deaths among Hispanic people and 30% of deaths among people of color were among those under age 65, compared to 13% of deaths among White people. Additionally, the median age of individuals dying from COVID-19 was 9 to 10 years younger among people of color.

Hospitalizations

Black and Hispanic people have higher hospitalization rates compared to their White counterparts. Data from COVID-NET show that, from March 1 through July 18, age-adjusted hospitalization rates due to COVID-19 for Black, Hispanic, and AIAN people were each roughly 5 times higher than that of White people (Figure 3). Another analysis of patients at a large hospital system in Boston who tested positive for COVID-19 found that a higher proportion of Hispanic patients were hospitalized compared to Black or White patients, particularly among those under age 60. In contrast, a study of patients tested at a health system in the Baltimore-Washington DC found a higher positivity rate among Latino patients but a lower hospital admission rate among Latino patients who tested positive. Latino patients who were hospitalized were younger, more likely to be male, and had fewer comorbidities compared to White or Black patients. Studies using data from an academic health system in Atlanta, Georgia, a large health system in California, and a health system in Chicago all find that Black patients are at higher risk for hospitalization. Reflecting these higher rates, several studies also found that people of color make up a disproportionate share of COVID-19 hospitalizations relative to their share of the population or total hospital visits. For example, earlier data from COVID-NET based on 580 hospitalizations as of March 2020 show that Black people accounted for more hospitalized COVID-19 patients compared to their share of the population in the area studied (33% vs. 18%). A study using data from a large health system in Louisiana found that Black people accounted for over three-quarters of patients who were hospitalized with COVID-19 (77%) and over 71% of in-hospital deaths, compared to just 31% of the total patient population.

Figure 3: Age-adjusted COVID-19 Associated Hospitalization Rates by Race and Ethnicity, March 1 – July 18, 2020

Disparities among Specific Populations

Studies also find racial/ethnic disparities in COVID-19 cases and/or deaths among Medicare beneficiaries, nursing facilities, pregnant women, and children.

  • Preliminary Medicare claims and encounter data based on services from January 1 through June 20, 2020 show higher rates of infection and hospitalization due to COVID-19 among Black, Hispanic, and AIAN Medicare beneficiaries compared to White beneficiaries (Figure 4).
Figure 4: Rates of COVID-19 Cases and Hospitalizations among Medicare Beneficiaries
  • Analysis of nursing home facilities found that having a greater share of Black residents was associated with increased probability of having a COVID-19 case. Other reporting also has found that nursing homes where a higher share of residents are people of color are more likely to report a COVID-19 case.
  • One study found that Hispanic and Black pregnant women accounted for a disproportionate share of confirmed cases relative to their share of women who gave birth in 2019 (46% vs. 24% and 22% vs 15%, respectively).
  • CDC analysis of COVID-19 hospitalization data from 14 states found that, although the overall COVID-19 associated hospitalization rate for children is low, hospitalization rates for Hispanic and Black children were nearly eight times and five times higher than the rate for White children, respectively. Early data from a COVID-19 clinic in Chicago also suggest that Black children are at higher risk of infection. Similarly, a study of children tested at a pediatric community-based free testing site found that Black and Hispanic children had higher rates of infection, that these differences persisted after controlling for age, sex, and median family income, and that positivity rates among Hispanic children increased over time.

Testing

Data to understand variation in testing by race/ethnicity remains very limited. Very few states (5 as of July 2020) report testing data by race/ethnicity. Data on testing within community health centers show that people of color represented more than half of all people tested (57%) and confirmed cases (56%) at health centers, and that Hispanic patients made up a higher share of positive tests compared to their share of total tested patients. Reporting on testing site locations suggests that testing sites in and near predominantly Black and Hispanic neighborhoods are likely to face greater demand than those near predominantly White areas, which could contribute to longer wait times. Other research finds that the share of people of color in an area is associated with an increase in travel time to a testing site. Similarly, analysis of data from New York City found that more tests were performed in neighborhoods with higher shares of White residents, but that the highest proportion of positive tests were in neighborhoods with more people of color and lower socioeconomic measures. Reporting on testing site locations in Texas found that in four of the six largest cities testing sites are disproportionately located in census tracts where the share of White residents is greater than the city median.

Looking ahead

Together, these data show that people of color are bearing a disproportionate burden of COVID-19 cases, deaths, and hospitalizations and that they may face increased barriers to access testing. Other analyses also suggest that the COVID-19 pandemic is taking a larger economic toll on people of color. These disparities in COVID-19 reflect and compound longstanding underlying social, economic, and health inequities that stem from structural and systemic barriers across sectors, including racism and discrimination. Researchers across the studies suggest that these underlying disparities put people of color at increased risk for exposure to the virus, experiencing serious illness if they are infected, and facing barriers to accessing testing and treatment. For example, their living and employment situations make it more difficult to social distance, as they are more likely to work in jobs that cannot be done at home, more likely to use public transportation, and more likely to live in larger households. Variation in access to testing, delays in seeking care due to lack of insurance and other access barriers, as well as higher rates of underlying health conditions may contribute to more serious illness among individuals if they are infected and individuals being in more serious condition when they do seek care, which could contribute to higher rates of hospitalization and death.

While these data and analysis provide important insights into the disparate impacts of COVID-19, there remain significant data gaps and limitations that point to the importance of continued efforts to increase the availability of COVID-19 data by race and ethnicity. Data on testing may grow as, under the CARES Act and guidance from HHS, all laboratories or other facilities performing COVID-19 testing must report data to HHS and “make every reasonable effort” to collect and report demographic data, including race/ethnicity, starting August 1. However, continued efforts will be required to provide for timely, complete, and comparable data that allow for better understanding of COVID-19 impacts overall and particularly for smaller population groups, such as AIAN and NHOPI individuals as well as among ethnic groups. These data are key for understanding impacts across communities, guiding response and relief efforts, and providing for equitable access to treatments and vaccines as they are developed.

The health and economic impacts of COVID-19 could further widen racial/ethnic disparities at a time when there is a growing focus on and call for racial justice and health equity. Overall, the findings highlight the importance of considering how COVID-19 relief and response efforts will address inequities, including in decisions related to distribution of treatments and vaccines once they become available. Prioritizing equity will be key for addressing the current gaps in COVID-19 and health care more broadly and preventing widening of disparities in the future.

Appendix

Appendix A

Table 1: Federal Data Sources on COVID-19 and Race/Ethnicity
SourceTitleDescriptionLevel
Public Data from the Federal Government
CDCCDC COVID Data TrackerProvides information on cases and deaths by race/ethnicity. Race/ethnicity data can also be stratified by age group (updated daily).National
CDCProvisional Death Counts for Coronavirus Disease (COVID-19)Contains multiple data sets from the National Vital Statistics System’s COVID-19 Surveillance Data Files, including provisional death counts by race/ethnicity and deaths involving coronavirus by race/ethnicity and age (race data updated weekly).State and National
CDCCOVID-NET: COVID-19 Laboratory-Confirmed HospitalizationsSummary of COVID-19 hospitalizations. In addition to race/ethnicity, figures are stratified by multiple demographic characteristics (updated biweekly).National
CMSPreliminary Medicare COVID-19 Data SnapshotCounts of Medicare beneficiaries of COVID-19 cases and hospitalizations by several measures, including race/ethnicity at the national level (updated monthly).State and National
HRSAHealth Center COVID-19 SurveyRapid response survey of community health centers on a range of issues related to COVID-19, included testing data by race/ethnicity (updated weekly).State and National

Appendix B: References

KFF (Kaiser Family Foundation), State Data and Policy Actions to Address Coronavirus, COVID-19 Confirmed Cases and Deaths by Race/Ethnicity as of August 3, 2020, accessed August 11, 2020, https://www.kff.org/health-costs/issue-brief/state-data-and-policy-actions-to-address-coronavirus/.

The COVID Tracking Project, The COVID Racial Data Tracker, accessed August 11, 2020, https://covidtracking.com/race.

APM Research Lab, The Color of Coronavirus: COVID-19 Deaths by Race and Ethnicity in the U.S., (August 5, 2020), accessed August 11, 2020, https://www.apmresearchlab.org/covid/deaths-by-race.

The COVID Tracking Project, The COVID Racial Data Tracker, accessed August 11, 2020, https://covidtracking.com/race.

KFF (Kaiser Family Foundation), State Data and Policy Actions to Address Coronavirus, COVID-19 Confirmed Cases and Deaths by Race/Ethnicity as of August 3, 2020, accessed August 11, 2020, available at https://www.kff.org/health-costs/issue-brief/state-data-and-policy-actions-to-address-coronavirus/.

L. Kim, M. Whitaker. A. O’Halloran, et al., “Hospitalization Rates and Characteristics of Children Aged <18 Years Hospitalized with Laboratory-Confirmed COVID-19 — COVID-NET, 14 States, March 1–July 25, 2020,” Morbidity and Mortality Weekly Report ePub 7 (August 2020), available at https://www.cdc.gov/mmwr/volumes/69/wr/mm6932e3.htm?s#F2_down.

Monika K. Goyal, et al, “Racial/Ethnic and Socioeconomic Disparities of SARS-CoV-2 Infection Among Children, Pediatrics, Vol 16, Issue 2 (August 2020), accessed August 11, 2020, available at https://pediatrics.aappublications.org/content/early/2020/08/03/peds.2020-009951.

Centers for Disease Control and Prevention, Age-adjusted COVID-19-associated hospitalization rates by race and ethnicity, accessed August 11, 2020, https://www.cdc.gov/coronavirus/2019-ncov/covid-data/images/July-28_Race_Ethnicity_COVIDNet.jpg.

Centers for Medicare & Medicaid Services, Preliminary Medicare COVID-19 Data Snapshot, accessed August 11, 2020, https://www.cms.gov/research-statistics-data-systems/preliminary-medicare-covid-19-data-snapshot.

Samrachana Adhikari, Nicholas P. Pantaleo, and Justin M. Feldman, “Assessment of Community-Level Disparities in Coronavirus Disease 2019 (COVID-19) Infections and Deaths in Large Metropolitan Areas, Jama Network Open (July 28, 2020), accessed August 11, 2020, available at https://jamanetwork.com/journals/jamanetworkopen/fullarticle/2768723.

Carlos E. Rodriguez-Diaz et al., “Risk for COVID-19 infection and death among Latinos in the United States: Examining heterogeneity in transmission dynamics”, Annals of Epidemiology (July 23, 2020), accessed August 11, 2020, available at https://www.sciencedirect.com/science/article/pii/S1047279720302672#figs1.

Soo Rin Kim et al., “Which Cities Have The Biggest Racial Gaps In COVID-19 Testing Access?” FiveThirtyEight, July 22, 2020, https://fivethirtyeight.com/features/white-neighborhoods-have-more-access-to-covid-19-testing-sites/.

J.M. Wortham, J.T. Lee, S. Althomsons et al., “Characteristics of Persons Who Died with COVID-19 — United States, February 12–May 18, 2020”, Morbidity and Mortality Weekly Report 69, no. 28 (July 17, 2020), accessed August 11, 2020, available at https://www.cdc.gov/mmwr/volumes/69/wr/mm6928e1.htm.

Brandon W. Yan et al., “Asian Americans Facing High COVID-19 Case Fatality”, Health Affairs (July 13, 2020), https://www.healthaffairs.org/do/10.1377/hblog20200708.894552/full/.

Heather E. Hsu et al., “Race/Ethnicity, Underlying Medical Conditions, Homelessness, and Hospitalization Status of Adult Patients with COVID-19 at an Urban Safety-Net Medical Center – Boston, Massachusetts, 2020”, Morbidity and Mortality Weekly Report 69 no. 27 (July 10, 2020), available at https://pubmed.ncbi.nlm.nih.gov/32644981/.

Ayodeji Adegunsoye, I. Bauer Ventura , and V.M. Liarski, “Association of Black Race with Outcomes in COVID-19 Disease: A Retrospective Cohort Study”, Annals of the American Thoracic Society (July 9, 2020), available at https://www.atsjournals.org/doi/abs/10.1513/AnnalsATS.202006-583RL.

Richard A. Oppel Jr. et al., “The Fullest Look Yet at the Racial Inequity of Coronavirus”, The New York Times, July 5, 2020, accessed August 11, 2020, https://www.nytimes.com/interactive/2020/07/05/us/coronavirus-latinos-african-americans-cdc-data.html.

David R. Holgrave et al., “Assessing racial and ethnic disparities using a COVID-19 outcomes continuum for New York State”, Annals of Epidemiology 48 (June 29, 2020), available at https://doi.org/10.1016/j.annepidem.2020.06.010.

Marie E. Killerby et al. “Characteristics Associated with Hospitalization Among Patients with COVID-19 — Metropolitan Atlanta, Georgia, March–April 2020”, Morbidity and Mortality Weekly Report 69, no. 25 (June 26, 2020), available at https://www.cdc.gov/mmwr/volumes/69/wr/mm6925e1.htm.

Sascha Ellington et al., “Characteristics of Women of Reproductive Age with Laboratory-Confirmed SARS-CoV-2 Infection by Pregnancy Status — United States, January 22–June 7, 2020”, Morbidity and Mortality Weekly Report 69 no. 25 (June 26, 2020): 769–775, available at https://www.cdc.gov/mmwr/volumes/69/wr/mm6925a1.htm.

Eboni G. Pricey-Haywood et al., “Hospitalization and Mortality among Black Patients and White Patients with Covid-19”, New England Journal of Medicine 382, no. 26 (June 25, 2020), available at https://www.nejm.org/doi/full/10.1056/NEJMsa2011686.

Wil Libermann-Cribbin et al., “Disparities in COVID-19 Testing and Positivity in New York City”, American Journal of Preventive Medicine (June 25, 2020), available at 10.1016/j.amepre.2020.06.005.

Diego A. Martinez et al., “SARS-CoV-2 Positivity Rate for Latinos in the Baltimore–Washington, DC Region”, Journal of the American Medical Association 324 no. 4 (June 13, 2020), available at 10.1001/jama.2020.11374.

Bassett MT, Chen JT and Krieger N, “The Unequal toll of COVID-19 Mortality by Age in the United States: Quantifying Racial/Ethnic Disparities”, Working Paper Series 19, no.3 (June 12, 2020), Harvard Center for Population and Development Studies, available at https://cdn1.sph.harvard.edu/wp-content/uploads/sites/1266/2020/06/20_Bassett-Chen-Krieger_COVID-19_plus_age_working-paper_0612_Vol-19_No-3_with-cover.pdf.

Hannah R. Abrams et al., “Characteristics of U.S. Nursing Homes with COVID ‐19 Cases”, Journal of the American Geriatrics Society, (June 2, 2020), available at https://doi.org/10.1111/jgs.16661.

Sindhura Bandi, M.Z. Nevid, M. Mahdavinia, “African American children are at higher risk of COVID‐19 infection”, Pediatric Allergy and Immunology (May 29, 2020), available at https://doi.org/10.1111/pai.13298.

Sean McMinn et al. “In Large Texas Cities, Access To Coronavirus Testing May Depend On Where You Live”, NPR, May 27, 2020, accessed August 11, 2020, https://www.npr.org/sections/health-shots/2020/05/27/862215848/across-texas-black-and-hispanic-neighborhoods-have-fewer-coronavirus-testing-sit.

Kristen M.J. Azar et al., “Disparities In Outcomes Among COVID-19 Patients In A Large Health Care System In California”, Health Affairs 39, no. 7 (May 21, 2020), accessed August 11, 2020, available at https://www.healthaffairs.org/doi/10.1377/hlthaff.2020.00598.

Robert Gebeloff et al., “The Striking Racial Divide in How Covid-19 Has Hit Nursing Homes”, The New York Times, May 21, 2020, accessed July 8, 2020, https://www.nytimes.com/article/coronavirus-nursing-homes-racial-disparity.html.

Uma V Mahajan and Margaret Larkins-Pettigrew, “Racial demographics and COVID-19 confirmed cases and deaths: a correlational analysis of 2886 US counties”, Journal of Public Health (May 21, 2020), available at 10.1093/pubmed/fdaa070.

Bradley Corallo and Jennifer Tolbert, Impact of Coronavirus on Community Health Centers, (Washington, DC, KFF, May 20, 2020), accessed August 11, 2020, available at https://www.kff.org/coronavirus-covid-19/issue-brief/impact-of-coronavirus-on-community-health-centers/

Benjamin Rader et al., “Geographic access to United States SARS-CoV-2 testing sites highlights healthcare disparities and may bias transmission estimates”, Journal of Travel Medicine (May 15, 2020), available at https://doi.org/10.1093/jtm/taaa076.

Gregorio A. Millett et al., “Assessing Differential Impacts of COVID-19 on Black Communities”, Annals of Epidemiology 47 (May 14, 2020), available at https://doi.org/10.1016/j.annepidem.2020.05.003.

Joseph Keawe‘aimoku Kaholokula et al., “COVID-19 Special Column: COVID-19 Hits Native Hawaiian and Pacific Islander Communities the Hardest”, Hawai’i Journal of Health & Social Welfare, 29 no. 5 (May 1, 2020), available at https://www.ncbi.nlm.nih.gov/pmc/articles/PMC7226312/#.

Shikha Garg et al. “Hospitalization Rates and Characteristics of Patients Hospitalized with Laboratory-Confirmed Coronavirus Disease 2019 — COVID-NET, 14 States, March 1–30, 2020”, Morbidity and Mortality Weekly Report 69, no. 15 (April 17, 2020), available at https://www.cdc.gov/mmwr/volumes/69/wr/mm6915e3.htm.

Endnotes

  1. Studies that estimated cases or deaths were excluded. ↩︎

As the country struggles to get a handle on the coronavirus pandemic and prepares for the 2020 election, this analysis finds that, while voters are increasingly negative in their evaluations of President Trump’s handling of the pandemic, he continues to garner strong support among Republican voters – even those living in areas disproportionately impacted by the virus. (more…)

Voters Are Souring on President Trump’s Handling of Coronavirus, with Implications for November

Published: Aug 17, 2020

As the country struggles to get a handle on the coronavirus pandemic and prepares for the 2020 election, this analysis finds that, while voters are increasingly negative in their evaluations of President Trump’s handling of the pandemic, he continues to garner strong support among Republican voters – even those living in areas disproportionately impacted by the virus. (more…)

As the country struggles to get a handle on the coronavirus pandemic and prepares for the 2020 election, this analysis finds that, while voters are increasingly negative in their evaluations of President Trump’s handling of the pandemic, he continues to garner strong support among Republican voters – even those living in areas disproportionately impacted by the virus. (more…)

Community Health Centers and Medication-Assisted Treatment for Opioid Use Disorder

Authors: Bradley Corallo, Jennifer Tolbert, Jessica Sharac, Anne Markus, and Sara Rosenbaum
Published: Aug 14, 2020

Executive Summary

In the midst of the coronavirus pandemic, emerging evidence suggests drug overdoses, including opioid overdoses, are increasing.1 ,2  As safety net primary care providers, community health centers play a significant role in efforts to address the ongoing opioid crisis and have become a major source of medication-assisted treatment (MAT), the standard of care for those with opioid use disorder (OUD). It is unclear whether health centers have the capacity to meet increasing demand due to the pandemic. This issue brief presents findings from a 2019 survey of community health centers on activities related to the prevention and treatment of OUD, with a focus on MAT, to assess services and capacity prior to the recent surge in need. Key findings include:

  • As of 2019, an increasing share of health centers were providing MAT services. Nearly two-thirds of health centers (64%) reported offering MAT onsite, up from 48% in 2018. Health centers in Medicaid expansion states were more likely than those in non-expansion states to provide MAT onsite in 2019 (70% vs. 50%).
  • Most health centers that provide MAT offer multiple treatment options for patients experiencing OUD. The majority (65%) of health centers with a MAT program offered at least two out of three available MAT medications for OUD, with buprenorphine (89%) and naltrexone (69%) most commonly offered. To ensure a continuum of care for OUD patients seeking treatment, health centers refer to a variety of providers; however, health centers with a MAT program are more likely than those without MAT onsite to refer patients to more intensive providers like residential treatment programs (71% vs. 46%), inpatient detox programs (69% vs. 50%), and partial hospitalization programs (36% vs. 22%).
  • Health centers face many challenges meeting the high demand for OUD treatment. Despite increasing MAT services and treatment options from 2018, nearly half (47%) of health centers reported that they did not have the capacity to treat all patients seeking MAT. Among health centers that attempted to refer patients for MAT services, 66% said they face provider shortages in their community when doing so.

Targeted federal grants from 2016 to 2019 helped health centers to bolster MAT programs and establish new ones, although health centers continue to rely heavily on Medicaid to sustain MAT programs and services long-term. However, the high cost of providing MAT services remains a barrier in Medicaid expansion and non-expansion states alike, and these barriers will likely remain even as the coronavirus pandemic poses new challenges for health centers’ finances and capacity to provide OUD services.

Issue Brief

Introduction

As the country struggles to respond to the coronavirus pandemic, emerging evidence suggests drug overdoses are increasing sharply, with an estimated 18% increase in overdoses since the start of stay-at-home orders in March through May 2020.3  The increase in overdoses is driven in part by the isolation, stigma, economic turmoil, and disruption in access to health care services caused by coronavirus.4 ,5  Many of these overdoses are also related to the ongoing opioid crisis, which affects roughly two million Americans with opioid use disorder (OUD) and was linked to over 50,000 opioid overdose deaths in 2019.6 ,7  Even prior to the coronavirus pandemic, access to OUD treatment was limited—only one in five people experiencing OUD received addiction treatment in 2018.8  Existing gaps in OUD treatment services have likely been exacerbated by the current crisis.

Community health centers play a significant role in addressing the opioid crisis as community-based primary care providers with the capacity to screen, treat, refer, and provide supportive services such as case management to patients experiencing OUD. Increasingly, health centers are providing medication-assisted treatment (MAT), which is considered to be the standard of care for OUD treatment.9  MAT includes treatment with one of three medications (methadone, naltrexone, and buprenorphine) along with counseling.10  Health centers primarily serve low-income populations who may otherwise have difficulty accessing affordable health care. Residents of the medically underserved communities in which health centers operate, including those experiencing OUD, are disproportionately uninsured, enrolled in Medicaid, or earn less than 200% of the federal poverty level.11 

Between 2016 and 2019, the Health Resources and Services Administration (HRSA) awarded more than $1.4 billion in federal grants12 ,13 ,14 ,15 ,16  to enable health centers to expand access to mental health and substance use disorder (SUD) services. Health centers used these grants to increase staff, to improve the integration of behavioral health and primary care, and to expand delivery of MAT.17  National data show that health centers increased their mental health and SUD staff by 51% from 2016-2019,18  with the vast majority (95%) of health centers offering mental health and/or SUD services onsite in 2018 (the latest year these data are available).19  Currently, health centers are eligible for a number of other federal grants to mitigate the steep revenue losses due to the coronavirus pandemic,20  although these grants are meant to support health center capacity generally or to provide COVID-19 testing, rather than targeting OUD services specifically. Given the considerable federal investment in health centers to combat the opioid crisis as well as the increasing need for OUD services during the pandemic, it is important to understand health centers’ capacity to deliver MAT and the barriers they continue to face in providing OUD services.

This brief presents findings from a survey of health centers conducted in 2019, focusing on questions that examine community health centers’ provision of MAT services and capacity. Where possible, we highlight one-year trends from a 2018 community health center survey. We also highlight differences across health centers in Medicaid expansion and non-expansion states when the differences are significant. While the findings reflect health center responses before the coronavirus pandemic, they provide important context for understanding the issues health centers faced in providing MAT services prior to the pandemic and challenges that will likely persist following the pandemic’s resolution.

Treating Patients with Opioid Use Disorder

Over seven in ten health centers (71%) reported an increase in the number of patients with OUD from 2018 to 2019. Similar shares of health centers reported an increase in the number of patients with prescription OUD (62%) and nonprescription OUD, such as fentanyl or heroin (65%, Figure 1). These findings are generally consistent with provisional data on opioid overdose deaths in the U.S. that show an increase for 2019.21  The growth in health center patients experiencing OUD was likely due to a variety of factors, including new patients with OUD seeking care, improved screening practices to identify patients experiencing OUD, or an improved capacity at health centers to provide OUD services to more patients.

Figure 1: Share of Health Centers Reporting an Increase in the Number of Patients with Opioid Use Disorder in the Past Year

There was substantial growth in the number of health centers providing onsite MAT services from 2018 to 2019, particularly in Medicaid expansion states. Nearly two-thirds of health centers (64%) reported that they provide MAT medications, up from 48% in 2018, and the vast majority of these (87%) provide counseling as well. Health centers in Medicaid expansion states were more likely than those in non-expansion states to provide onsite MAT services (70% vs. 50%, Figure 2). The difference in MAT availability may be attributable to a greater OUD prevalence in Medicaid expansion states, which experienced an opioid-involved death rate of 16.1 per 100,000 population in 2018 (the latest year these data are available), compared to 11.4 per 100,000 in non-expansion states.22  However, the difference in MAT availability is also likely related to increased revenue for OUD services in expansion states, since the Medicaid program reaches many of the adults most at risk for OUD. Other research has demonstrated a connection between Medicaid expansion and health center capacity.23 ,24  At the same time, the availability of grant funding since 2016 has helped to ensure that health centers in both expansion and non-expansion states have been able to expand mental health and SUD services.

Figure 2: Share of Health Centers Providing MAT Medications by State Medicaid Expansion Status, 2018 & 2019

Most health centers that provide MAT services offer more than one medication, which gives providers options to meet patients’ needs. Among health centers that reported providing MAT, 60% offer two MAT drugs and 4% offer all three, while roughly one-third (35%) offer only one MAT drug (Figure 3). The most widely available drug is buprenorphine, with 89% of health centers that provide MAT medications reporting they provide it. A slightly smaller share (69%) reported offering naltrexone, and only 7% of health centers providing MAT medications reported offering methadone. Facilities must be certified as opioid treatment programs (OTPs) in order to dispense methadone, while buprenorphine and naltrexone can be prescribed in any setting where providers have a Drug Abuse Treatment Act of 2000 (DATA) waiver from the federal government.25  Currently, all state Medicaid programs cover buprenorphine and naltrexone, although only 41 state programs cover methadone.26  As part of a broader initiative to combat the opioid crisis, the SUPPORT Act, signed into law in 2018, will require all state Medicaid programs to cover all three MAT medications, counseling services, and behavioral therapy from October 2020 through September 2025,27 ,28  although providers will still need to be certified OTPs to dispense methadone.

Figure 3: Health Centers’ Provision of MAT Medications

Health centers with a MAT program are more likely than those without to refer patients to services across the continuum of care for OUD. Depending on patients’ needs, OUD treatment may require services other than MAT. Some may require less intensive care such as recovery coaches or peer mentors. Others experiencing OUD may require more intensive services such as partial hospitalization programs, residential treatment programs, and inpatient detox programs. Health centers with MAT programs are more likely than health centers without a program to refer to providers offering specific services that are generally unavailable in health centers or other primary care settings, such as partial hospitalization and residential treatment programs (Figure 4). In contrast, health centers without a MAT program are more likely to refer to outpatient providers who could offer MAT, including health departments, certified behavioral health clinics, opioid treatment programs, and some primary care clinics. Relatively few health centers (7%) do not make any referrals for patients with OUD, and it is unclear whether the few that make no referrals do so because there is no perceived need for referrals or because there is a lack of OUD treatment providers in the community that accept Medicaid and uninsured patients, among other plausible explanations.

Figure 4: Share of Health Centers Referring OUD Patients to Selected Providers by Provision of Onsite MAT Services

Roughly half of health centers (55%) distribute naloxone, an opioid overdose reversal drug. Even though naloxone is different from medications used in MAT for addiction, the continued, high rates of opioid overdose deaths have made naloxone (brand names include Narcan and Evzio) a critical tool in minimizing fatalities due to the opioid crisis, especially as suspected overdoses have risen during the coronavirus pandemic. Health centers in Medicaid expansion states were more likely to report providing naloxone than those in non-expansion states (60% vs. 43%, Figure 5), which could reflect underlying pharmacy policy, such as availability of naloxone without prior authorization, in these states.29 

Figure 5: Share of Health Centers that Distribute Naloxone by State Medicaid Expansion Status

Treatment Capacity Challenges

Health centers faced many challenges in meeting the high demand for treatment among their patients with OUD even before the recent surge in need. Nearly half (47%) of health centers operating a MAT program reported that they do not have the capacity to treat all patients seeking MAT (Figure 6). However, fewer health centers reported capacity issues in 2019 compared to 2018, when 63% of health centers operating a MAT program reported that they could not provide MAT services to all patients in need. Nearly seven in ten (68%) health centers that offer MAT services did not provide them at all sites, a rate that was stable between 2018 and 2019. Nearly three-quarters (74%) of all health centers (whether they provide MAT onsite or not) reported they refer patients for MAT services to other providers in the community. Among those health centers, two-thirds (66%) reported facing provider shortages when they attempted to refer patients, which was similar to the 68% reported in 2018.

Figure 6: Share of Health Centers Reporting MAT Capacity Challenges, 2018 & 2019

Health centers with a MAT program cited a lack of physical space and high costs as top barriers to operating their programs. Nearly three in ten (29%) health centers with a MAT program reported that a lack of physical space was a barrier to operating their MAT program, which generally requires dedicated counseling space (for individual or group sessions) in addition to visits for prescriptions (Figure 7). Additionally, over a quarter (27%) of health centers with a MAT program said high costs hindered MAT program operations. Health centers in non-expansion states were more likely than health centers in expansion states to cite high costs (40% vs. 23%) and high numbers of uninsured patients (41% vs. 16%) as barriers to operating a MAT program (Appendix A Table 1). While federal grants have helped to increase the number of health centers providing MAT, those grants do not seem to be covering all operating expenses. Health centers in Medicaid expansion states appear to benefit from greater Medicaid enrollment, which results in payment for MAT program expenses that can make their programs sustainable, although high costs are still a significant barrier in both expansion and non-expansion states alike.

Figure 7: Reported Barriers to Operating a MAT Program Among Health Centers Providing MAT Onsite

Health centers without a MAT program cited provider concerns as a top barrier to establishing a MAT program. Limited skills and/or confidence among providers to provide MAT services was the most common barrier (42%) to establishing a MAT program reported by health centers without a program, underscoring limited resources, capacity, or availability for provider training and technical assistance (Figure 8). Additionally, these health centers reported provider concerns about diversion – where patients transfer prescribed MAT medications to others – as a common barrier (33%). The second-most common barrier (37%) reported by health centers without a MAT program was a lack of physical space (Appendix A Table 2). This problem persists for health centers with or without a MAT program, as many health centers face the common challenge of balancing limited resources with patient needs. For example, 18% of health centers without a MAT program reported that either OUD was not a significant problem at their health center and/or their health center leadership have not identified OUD as a priority area of focus, likely reflecting the wide range of health needs in the communities in which health centers operate.

Figure 8: Reported Barriers to Establishing a MAT Program Among Health Centers that do not Provide MAT Onsite

Looking Ahead

As a nationwide resource of community-based, safety net primary care providers, health centers play a key role in combatting the ongoing opioid crisis, especially as new reports show increases in suspected drug overdoses during the coronavirus pandemic. The majority of health centers provide MAT services to address the treatment needs of patients with OUD, and many health centers also distribute naloxone for opioid overdose reversal. Because of the broader coverage of patients and treatment services in Medicaid expansion states, health centers in expansion states appear to be better equipped to address demand for OUD services, including by providing MAT onsite and distributing naloxone. Although SUD service expansion grants helped to establish new MAT programs and bolster existing services, these grants do not fully address the ongoing, long-term costs associated with operating a MAT program, and health centers still reported challenges recruiting providers even with grant funding. While health centers in Medicaid expansion states were less likely than those in non-expansion states to cite costs as a barrier to operating MAT programs, costs still remain a barrier for many health centers, regardless of their state’s expansion status.

Health centers will face ongoing challenges in meeting demand for OUD treatment, including many new challenges caused by the social and economic disruptions from the coronavirus pandemic that were not captured in this survey. Health centers have had to fundamentally revamp their service delivery model due to social distancing measures, demand for testing services, and drops in patient visits, while at the same time facing revenue declines, temporary site closures, and a shrinking workforce.30  In response, health centers have increased the use of telehealth as some states have eased restrictions on e-prescribing MAT medications. However, access to MAT treatment remains limited in some areas and returning to normal operations will be difficult for the foreseeable future and even after a coronavirus vaccine allows life to return to some normalcy. Given the role that health centers play in delivering MAT services, particularly in areas with the greatest accessibility barriers, their ability to continue providing these services during the pandemic and after will influence broader efforts to address the opioid crisis.

Methods

Methods

The 2019 Survey of Community Health Centers was jointly conducted by KFF and the Geiger Gibson/RCHN Community Health Foundation Research Collaborative at George Washington University’s Milken Institute School of Public Health. The survey was administered in partnership with the National Association of Community Health Centers (NACHC). The survey was fielded from May to July 2019 and was emailed to 1,342 CEOs of federally-funded health centers in the 50 states and the District of Columbia (DC) identified in the 2017 Uniform Data System (UDS). The response rate was 38%, with 511 responses from 49 states and DC.

The survey data were weighted using 2017 UDS variables for total health center patients, the percentage of their patients reported as racial/ethnic minorities, and total revenue per patient. Survey findings are presented for all responding health centers and responses were analyzed using chi-squared tests to compare responses between health centers in Medicaid expansion and non-expansion states. State Medicaid expansion status was assigned as of the survey fielding period. The authors also analyzed responses with a focus on urban and rural differences, but decided to exclude these findings due to relatively few meaningful differences and for brevity.

This brief was prepared by Bradley Corallo and Jennifer Tolbert of KFF and Jessica Sharac, Anne Markus, and Sara Rosenbaum of the Geiger Gibson/RCHN Community Health Foundation Research Collaborative at the George Washington University.

Additional funding support for this brief was provided to the George Washington University by the RCHN Community Health Foundation.

Appendix

Appendix A

Table 1: Barriers to Operating a MAT Program Among Health Centers Providing MAT Onsite
Barriers to Operating a MAT ProgramAll Health Centers with a MAT ProgramHealth Centers in Medicaid Expansion StatesHealth Centers in Non-Expansion States
Lack of physical space for MAT program29%29%29%
High costs to provide MAT27%23%*40%
It is difficult to fit in the frequent appointments required for patients to receive their MAT medications23%22%24%
Our providers have limited skills and/or confidence to provide MAT22%21%23%
Many of our patients with opioid use disorder are uninsured and we would not be reimbursed for providing MAT services22%16%*41%
We do not face any barriers in operating our MAT program21%24%13%
Our providers have concerns about diversion of MAT medications20%18%26%
Cumbersome administrative requirements serve as a deterrent to providing MAT14%13%16%
Our health center is not able to provide the psychosocial and behavioral therapy components of MAT7%7%4%
Other barrier to establishing or expanding a MAT program25%25%24%
NOTE: *Significantly different from health centers in non-expansion states (p<.01).SOURCE: GW/KFF 2019 Health Center Survey.
Table 2: Barriers to Establishing a MAT Program  Among Health Centers that do not Provide MAT Onsite
Barriers to Establishing a MAT ProgramAll Health Centers without a MAT Program
Our providers have limited skills and/or confidence to provide MAT42%
Lack of physical space for MAT program37%
Our providers have concerns about diversion of MAT medications33%
High costs to provide MAT30%
Cumbersome administrative requirements serve as a deterrent to providing MAT28%
Many of our patients with opioid use disorder are uninsured and we would not be reimbursed for providing MAT services22%
Our health center is not able to provide the psychosocial and behavioral therapy components of MAT17%
It is difficult to fit in the frequent appointments required for patients to receive their MAT medications15%
Opioid use disorder is not a significant problem at our health center so we do not need to establish a MAT program14%
Our leadership and/or providers prefer an abstinence-focused model to address opioid use disorder8%
Health center leadership have not identified opioid use disorder as a priority area of focus7%
Other barrier to establishing a MAT program23%
NOTE: Comparisons for health centers without onsite MAT services in Medicaid expansion and non-expansion states are not shown because there are no significant differences at the p <.05 level.SOURCE: GW/KFF 2019 Health Center Survey.

Appendix B

2019 Survey of Community Health Centers

(All other questions released separately)


Q18.    Looking back on the past year, has your health center seen an increase in patients:

With prescription opioid use disorder? [Yes, No, Don’t Know]

With nonprescription opioid use disorder? [Yes, No, Don’t Know]


Q19.    Does your health center provide medication-assisted treatment (MAT) medications for opioid use disorder on-site? [Respondents who selected “no” skipped to question 23.]

Yes, we provide MAT medications and opioid use disorder counseling on-site.

Yes, we provide MAT medications on-site, but not opioid use disorder counseling.

No, we do not provide MAT medications on-site.


Q20.    Does your health center provide on-site MAT services at all of your health center’s sites or only at some sites?

All sites

Only some sites


Q21.    Please indicate if your health center provides the following medications for opioid use disorder.

Methadone [Yes, No, Don’t Know]

Buprenorphine (brand names include Suboxone, Zubsolv, and Subutex) [Yes, No, Don’t Know]

Naltrexone (brand names include Vivitrol and ReVia) [Yes, No, Don’t Know]


Q22.    Does your health center currently have the capacity to treat on-site all patients who seek MAT serviced for opioid use disorder?

Yes, we have capacity to treat all patients who seek MAT services

No, we do not have capacity to treat all patients who seek MAT services

Don’t know


Q23.    Does your health center face provider shortages when attempting to refer patients elsewhere for MAT services?

We do not attempt to make referrals

Yes, we face provider shortages when trying to refer

No, we do not face provider shortages when trying to refer

Don’t know


Q24.    Does your health center refer patients with opioid use disorder to any of the following providers, programs, or community based organizations to create a continuum of care for recovery services? (Check all that apply).

No, we do not refer patients to other providers, programs, or organizations (if so, please do not select other options)

Certified community behavioral health clinics

Opioid treatment programs

Health departments

Inpatient detoxification programs

Residential treatment programs

Partial hospitalization programs

Recovery coaches or peer mentors

Other providers, programs, or organizations (please specify)


Q25.    Does your health center face any of the following barriers to establishing or operating a medication-assisted treatment (MAT) program? (Check all that apply).

No, opioid use disorder is not a significant problem at our health center so we do not need to establish a MAT program

Health center leadership have not identified opioid use disorder as a priority area of focus

Our leadership and/or providers prefer an abstinence-focused model to address opioid use disorder

Our providers have limited skills and/or confidence to provide MAT

Our providers have concerns about diversion of MAT medications

Our health center is not able to provide the psychosocial and behavioral therapy components of MAT

Cumbersome administrative requirements serve as a deterrent to providing MAT

Many of our patients with opioid use disorder are uninsured and we would not be reimbursed for providing MAT services

High costs to provide MAT

It is difficult to fit in the frequent appointments required for patients to receive their MAT medications

Lack of physical space for MAT program

We do not face any barriers in operating our MAT program

Other barrier to establishing or expanding a MAT program (please specify)


Q26.    Does your health center distribute naloxone (Narcan or Evzio) for opioid overdose reversals?

Yes

No

Don’t know

Endnotes

  1. Ehley, B. (June 29, 2020). Pandemic unleashes a spike in overdose deaths. Politico. Retrieved from https://www.politico.com/news/2020/06/29/pandemic-unleashes-a-spike-in-overdose-deaths-345183 (accessed July 17, 2020). ↩︎
  2. Alter, A. and Yeager, C. (June 2020). COVID-19 Impact on US National Overdose Crisis. Overdose Detection Mapping Application Program. Retrieved from: http://www.odmap.org/Content/docs/news/2020/ODMAP-Report-June-2020.pdf (accessed July 17, 2020). ↩︎
  3. Ibid. ↩︎
  4. Alter, A. and Yeager, C. (May 13, 2020). The Consequences of COVID-19 Overdose Epidemic. Overdose Detection Mapping Application Program. Retrieved from: http://odmap.org/Content/docs/news/2020/ODMAP-Report-May-2020.pdf (accessed July 17, 2020). ↩︎
  5. Wan, W. and Long, H. (July 1, 2020). ‘Cries for help’: Drug overdoses are soaring during the coronavirus pandemic. Washington Post. Retrieved from https://www.washingtonpost.com/health/2020/07/01/coronavirus-drug-overdose/ (accessed July 17, 2020). ↩︎
  6. Substance Abuse and Mental Health Services Administration. (2019). Key substance use and mental health indicators in the United States: Results from the 2018 National Survey on Drug Use and Health (HHS Publication No. PEP19-5068, NSDUH Series H-54). Rockville, MD: Center for Behavioral Health Statistics and Quality, Substance Abuse and Mental Health Services Administration. Retrieved from http://www.samhsa.gov/data/report/2018-nsduh-annual-national-report (accessed February 11, 2020). ↩︎
  7. Ahmad, F. B., Rossen, L.M., and Sutton, P. (2020). Provisional Drug Overdose Death Counts. National Center for Health Statistics. Retrieved from: https://www.cdc.gov/nchs/nvss/vsrr/drug-overdose-data.htm (accessed July 17, 2020). ↩︎
  8. Substance Abuse and Mental Health Services Administration. (2019). Key substance use and mental health indicators in the United States: Results from the 2018 National Survey on Drug Use and Health (HHS Publication No. PEP19-5068, NSDUH Series H-54). Rockville, MD: Center for Behavioral Health Statistics and Quality, Substance Abuse and Mental Health Services Administration. Retrieved from http://www.samhsa.gov/data/report/2018-nsduh-annual-national-report (accessed February 11, 2020). Note: Treatment refers to services provided by specialty providers as defined in NSDUH, which includes “substance use treatment at a hospital (only as an inpatient), a drug or alcohol rehabilitation facility (as an inpatient or outpatient), or a mental health center. This NSDUH definition historically has not considered emergency rooms, private doctors’ offices, prisons or jails, and self-help groups to be specialty substance use treatment facilities.” ↩︎
  9. Substance Abuse and Mental Health Services Administration. “Medication and Counseling Treatment.” Retrieved from https://www.samhsa.gov/medication-assisted-treatment/treatment (accessed February 11, 2020). ↩︎
  10. Substance Abuse and Mental Health Services Administration. “Medication-Assisted Treatment.” Retrieved from https://www.samhsa.gov/medication-assisted-treatment (accessed February 11, 2020). ↩︎
  11. Orgera, K. & Tolbert, J. (2019). The Opioid Epidemic and Medicaid’s Role in Facilitating Access to Treatment. Kaiser Family Foundation. Retrieved from https://modern.kff.org/medicaid/issue-brief/the-opioid-epidemic-and-medicaids-role-in-facilitating-access-to-treatment/ (accessed August 4, 2020). ↩︎
  12. Office of the Associate Administrator, Bureau of Primary Health Care, Health Resources and Services Administration. Email communication with the authors, March 3, 2020. ↩︎
  13. U.S. Dept. of Health and Human Services Press Office. “HHS Awards $94 Million to Health Center to Help Treat the Prescription Opioid Abuse and Heroin Epidemic in America.” Retrieved from https://www.hhs.gov/hepatitis/blog/2016/03/17/hhs-awards-94-million-to-health-centers-to-help-treat-the-prescription-opioid-abuse-and-heroin-epidemic-in-america.html (accessed February 26, 2020). ↩︎
  14. Bureau of Primary Health Care. “Fiscal Year 2017 Access Increase in Mental Health and Substance Abuse (AIMS) Awards.” Health Resources and Services Administration. Retrieved from https://bphc.hrsa.gov/programopportunities/fundingopportunities/aims/fy2017awards/index.html (accessed February 26, 2020). ↩︎
  15. Bureau of Primary Health Care. “Fiscal Year 2018 Expanding Access to Quality Substance Use Disorder and Mental Health Services (SUD-MH) Awards.” Health Resources and Services Administration. Retrieved from https://bphc.hrsa.gov/programopportunities/fundingopportunities/sud-mh/fy2018awards/index.html (accessed February 26, 2020). ↩︎
  16. Bureau of Primary Health Care. “FY 2019 Integrated Behavioral Health Services (IBHS) Awards.” Health Resources and Services Administration. Retrieved from https://bphc.hrsa.gov/program-opportunities/funding-opportunities/behavioral-health/awards (accessed February 26, 2020). ↩︎
  17. Substance Abuse and Mental Health Services Administration. “Medication and Counseling Treatment.” Retrieved from https://www.samhsa.gov/medication-assisted-treatment/treatment (accessed February 11, 2020). ↩︎
  18. Bureau of Primary Health Care. 2016-2019 Uniform Data System. Health Resources and Services Administration. Retrieved from https://bphc.hrsa.gov/uds/datacenter.aspx and https://bphc.hrsa.gov/uds2016/datacenter.aspx?q=t5&year=2016&state=&fd= (accessed August 13, 2020). ↩︎
  19. National Association of Community Health Centers. (2020). Community Health Center Chartbook. Figure 5-10. Retrieved from https://www.nachc.org/wp-content/uploads/2020/01/Chartbook-2020-Final.pdf (accessed August 4, 2020). ↩︎
  20. Corallo, B. & Tolbert, J. Impact of Coronavirus on Community Health Centers. Kaiser Family Foundation. Retrieved from https://modern.kff.org/coronavirus-covid-19/issue-brief/impact-of-coronavirus-on-community-health-centers/ (accessed July 17, 2020). ↩︎
  21. Ahmad, F. B., Rossen, L.M., and Sutton, P. (2020). Provisional Drug Overdose Death Counts. National Center for Health Statistics. Retrieved from: https://www.cdc.gov/nchs/nvss/vsrr/drug-overdose-data.htm (accessed July 17, 2020). ↩︎
  22. KFF analysis of Centers for Disease Control and Prevention (CDC), National Center for Health Statistics. Multiple Cause of Death 2018 on CDC WONDER Online Database, released in 2020. Note: Data are from the Multiple Cause of Death Files, 1999-2018, as compiled from data provided by the 57 vital statistics jurisdiction through the Vital Statistics Cooperative Program. Retrieved from: https://wonder.cdc.gov/mcd.html (accessed August 13, 2020). Drug overdose deaths were classified using the International Classification of Disease, Tenth Revision (ICD-10), based on the ICD-10 underlying cause-of-death codes X40–44 (unintentional), X60–64 (suicide), X85 (homicide), or Y10–Y14 (undetermined intent). Among the deaths with drug overdose as the underlying cause, the type of opioid involved is indicated by the following ICD-10 multiple cause-of-death codes: opioids (T40.0, T40.1, T40.2, T40.3, T40.4, or T40.6); natural and semisynthetic opioids (T40.2); methadone (T40.3); synthetic opioids, other than methadone (T40.4); and heroin (T40.1). Death rates are deaths per 100,000 population (crude). ↩︎
  23. Rosenbaum, S., Tolbert, J., Sharac, J., Shin, P., Gunsalus, R. & Zur, J. (2018). Community Health Centers: Growing Importance in a Changing Health Care System. Kaiser Family Foundation. Retrieved from https://modern.kff.org/medicaid/issue-brief/community-health-centers-growing-importance-in-a-changing-health-care-system/ (accessed July 17, 2020). ↩︎
  24. Rosenbaum, S., Sharac, J., Shin, P & Tolbert, J. (2019). Community Health Center Financing: The Role of Medicaid and Section 330 Grant Funding Explained. Kaiser Family Foundation. Retrieved from https://modern.kff.org/medicaid/issue-brief/community-health-center-financing-the-role-of-medicaid-and-section-330-grant-funding-explained/ (accessed August 4, 2020). ↩︎
  25. Substance Abuse and Mental Health Services Administration. “Medication-Assisted Treatment.” Retrieved from https://www.samhsa.gov/medication-assisted-treatment (accessed February 11, 2020). ↩︎
  26. Kaiser Family Foundation. (2019). Medicaid’s Role in the Opioid Epidemic. Retrieved from https://modern.kff.org/infographic/medicaids-role-in-addressing-opioid-epidemic/ (accessed August 4, 2020). ↩︎
  27. Gifford et al. (2019). A View from the States: Key Medicaid Policy Changes: Results from a 50-State Medicaid Budget Survey for State Fiscal Years 2019 and 2020. Kaiser Family Foundation. Retrieved from https://modern.kff.org/medicaid/report/a-view-from-the-states-key-medicaid-policy-changes-results-from-a-50-state-medicaid-budget-survey-for-state-fiscal-years-2019-and-2020/ (accessed August 4, 2020). ↩︎
  28. Musumeci M. & Tolbert, J. (2019). Federal Legislation to Address the Opioid Crisis: Medicaid Provisions in the SUPPORT Act. Kaiser Family Foundation. Retrieved from https://modern.kff.org/medicaid/issue-brief/federal-legislation-to-address-the-opioid-crisis-medicaid-provisions-in-the-support-act/ (accessed August 4, 2020). ↩︎
  29. Kaiser Family Foundation. Medicaid Behavioral Health Services Database. Retrieved from https://modern.kff.org/data-collection/medicaid-behavioral-health-services-database/ (accessed March 2, 2020). ↩︎
  30. Corallo, B. & Tolbert, J. Impact of Coronavirus on Community Health Centers. Kaiser Family Foundation. Retrieved from https://modern.kff.org/coronavirus-covid-19/issue-brief/impact-of-coronavirus-on-community-health-centers/ (accessed July 17, 2020). ↩︎

This Week in Coronavirus: August 7 to August 13

Published: Aug 14, 2020

Every Friday we recap the past week in the coronavirus pandemic from our tracking, policy analysis, polling, and journalism.

This week worldwide cases surpassed the 20 million mark and United States’ cases surpassed 5 million with over 167,000 deaths.

An update to our state reports of long-term care facility cases and deaths show that the pandemic has not abated in these facilities, as the number of hot spot states has consistently hovered at 32 this week.

Here are the updates to coronavirus stats from KFF’s tracking resources:

Global Cases and Deaths: Total cases worldwide approached 21 million between August 7 and August 13 – with an increase of approximately 1.8 million new confirmed cases. There were also approximately 40,700 new confirmed deaths worldwide during the period, bringing the total to nearly 755,600 confirmed deaths.

U.S. Cases and Deaths: Total confirmed cases in the U.S. surpassed 5.2 million this week. There was an approximate increase of 365,300 confirmed cases between August 7 and August 13. About 7,000 confirmed deaths in the past week brought the total to over 167,000 confirmed deaths in the U.S.

• Data Reporting Status: 47 states are reporting COVID-19 data in long-term care facilities, 4 states are not reporting• Long-term care facilities with known cases: 15,213 (across 45 states)• Cases in long-term care facilities: 375,261 (across 44 states)• Deaths in long-term care facilities: 67,112 (in 45 states)• Long-term care facility cases as a share of total state cases: 19% (across 44 states)• Long-term care facility deaths as a share of total state deaths: 43% (across 45 states)

State Social Distancing Actions (includes Washington D.C.) that went into effect this week:

• Face Mask Requirements- New requirements: NH• Social Distancing Measures- Extended: TX, UT, MN, SC- Paused: No states- Rolled back: KY- New restrictions: AK, HI, MA

The latest KFF COVID-19 resources:

  • Food Insecurity and Health: Addressing Food Needs for Medicaid Enrollees as Part of COVID-19 Response Efforts (Issue Brief)
  • Updated: State Action to Limit Abortion Access During the COVID-19 Pandemic (Issue Brief)
  • Updated: COVID-19 Coronavirus Tracker – Updated as of August 13 (Interactive)
  • Updated: State Data and Policy Actions to Address Coronavirus (Interactive)

The latest KHN COVID-19 stories:

  • New Interactive Database by KFF’s Kaiser Health News and Guardian US Reveals More Than 900 Health Care Workers Have Died in the Fight Against COVID-19 in the U.S. (News Release, KHN, The Guardian)
  • Exclusive: Over 900 Health Workers Have Died of COVID-19. And the Toll Is Rising. (KHN, The Guardian)
  • Behind The Byline: The Count — And the Toll (KHN)
  • Nurses and Doctors Sick With COVID Feel Pressured to Get Back to Work (KHN)
  • Public Health Officials Are Quitting or Getting Fired in Throes of Pandemic (KHN, AP)
  • Business Is Booming for Dialysis Giant Fresenius. It Took a $137M Bailout Anyway. (KHN, Washington Post)
  • Without Federal Protections, Farm Workers Risk Coronavirus Infection to Harvest Crops (KHN, NPR)
  • Turning Anger Into Action: Minority Students Analyze COVID Data on Racial Disparities (CHL)
  • In Health-Conscious Marin County, Virus Runs Rampant Among ‘Essential’ Latino Workers (KHN, Los Angeles Times)
  • Bereaved Families Are ‘the Secondary Victims of COVID-19’ (KHN, CNN)
  • Amid COVID Chaos, California Legislators Fight for Major Health Care Bills (KHN)
  • Primary Care Doctors Look at Payment Overhaul After Pandemic Disruption (KHN, Fortune)
  • ‘An Arm and a Leg’: Financial Self-Defense School Is Now in Session (KHN)
  • COVID Data Failures Create Pressure for Public Health System Overhaul (KHN, USA Today)
  • Dying Young: The Health Care Workers in Their 20s Killed by COVID-19‘ (KHN, The Guardian)
  • Is This When I Drop Dead?’ Two Doctors Report From the COVID Front Lines (KHN, The Guardian)
  • Back to Life: COVID Lung Transplant Survivor Tells Her Story (KHN, NPR)
  • Contact Tracers in Massachusetts Might Order Milk or Help With Rent. Here’s Why. (KHN, NPR)
  • Listen: Will Telemedicine Outlast the Pandemic? (KHN)

Food Insecurity and Health: Addressing Food Needs for Medicaid Enrollees as Part of COVID-19 Response Efforts

Authors: Cornelia Hall, Samantha Artiga, Kendal Orgera, and Rachel Garfield
Published: Aug 14, 2020

Executive Summary

In addition to the widespread deaths and illnesses directly attributable to the coronavirus, the COVID-19 pandemic is having deep economic impacts that have spurred growing levels of food insecurity. Recent data from the Census Bureau indicates that 45% of adults reported their households did not always have enough of the type of food wanted during the week ending July 21. More than one in ten (12%) reported sometimes or often not having enough food to eat, and this rate rose to 21% among households earning less than $50,000 per year. As the health insurance program for low-income children and many adults, Medicaid reaches many people who may be facing food insecurity and could be a potential vehicle to address this growing problem, especially because of the strong association between food security and health. This brief provides an overview of food insecurity among Medicaid enrollees during the COVID-19 pandemic, examines participation in federal nutrition assistance programs by Medicaid enrollees, and identifies potential actions to address food insecurity among Medicaid enrollees as needs grow in response to the COVID-19 pandemic. It finds:

  • Recent data indicates that access to food is a challenge for many Medicaid enrollees during the pandemic. Among Medicaid adults, 20% reported food insufficiency (sometimes or often not having enough to eat) in the week ending March 13, 2020, and 23% reported food insufficiency in the week ending July 21, 2020. Problems accessing food are persistent, with the majority (65%) of Medicaid enrollees reporting food insufficiency in March also doing so in July.
  • Despite significant overlap between program income eligibility limits, less than half (47%) of all Medicaid enrollees were enrolled in the Supplemental Nutrition Assistance Program (SNAP) in 2018. Similarly, only about half (54%) of young children (below age five) enrolled in Medicaid were enrolled in the Special Supplemental Nutrition Program for Women, Infants, and Children (WIC) in 2018. Recent data on food insufficiency during the pandemic shows that few (24%) Medicaid adults who said their household sometimes or often did not have enough to eat in the past week reported their households receiving free groceries or meals, with most of those who did report doing so saying they were through a food pantry or bank. In mid-July 2020, half (50%) of Medicaid adults reporting food insufficiency said they were not at all confident their household would be able to afford the kinds of foods they need over the next month.
  • At this time of heightened need, Medicaid can play a role in connecting people to nutrition assistance programs by building on initiatives that were underway prior to the pandemic. Medicaid programs can coordinate eligibility and enrollment systems and processes with nutrition assistance programs. They can also help connect enrollees with food resources more directly, such as by screening enrollees for food needs and directing them to community resources.

Issue Brief

Introduction

One area of growing need due to the COVID-19 pandemic is access to food. Many people are facing increased challenges accessing food as they lose jobs and income, and many children have lost access to meals through schools due to their closure. Recent data from the Census Bureau indicates that 45% of adults reported their households did not always have enough of the type of food wanted during the week ending July 21; 12% reported food insufficiency, or sometimes or often not having enough food to eat, up from 9% for this group in March 2020. The majority of people reporting food insufficiency say it is due to inability to afford food, versus inability to go out to get food or lack of supply of food. At the same time, community food resources are facing higher levels of need, as 98% of food banks have reported an increase in demand, at an average increase of 63%.1  Food insufficiency is particularly high among lower-income people, with 21% of adults in households earning less than $50,000 per year reporting sometimes or often not having enough food in the past week.

As the health insurance program for over 70 million low-income children and adults, Medicaid reaches many people who may be facing food insecurity. Prior to the pandemic, the Trump administration was planning to make changes to SNAP that were expected to lead to large falloffs in enrollment among adults.2  Similarly, the federal government had enhanced program integrity efforts within Medicaid, which contributed to pre-pandemic enrollment declines among eligible individuals due to increased barriers to maintaining coverage. In response to the pandemic, however, the federal government has taken temporary actions to preserve enrollment in both programs, and some states have taken action to expand access to assistance. Given the strong association between food security and health, Medicaid can play a role in helping to connect people to food assistance during this time of growing need by building on initiatives that were in place prior to the pandemic.

This brief provides an overview of food insufficiency3  among Medicaid enrollees during to the COVID-19 pandemic, examines participation in nutrition assistance programs by Medicaid enrollees, and discusses how Medicaid can help address growing food needs among enrollees. The analysis is based on KFF analysis of 2018 National Health Interview Survey data as well as recent data from the Census Bureau’s Household Pulse Survey.

Food Insecurity among Medicaid Enrollees

Recent data indicates that access to food is a challenge for many Medicaid enrollees during the pandemic.4  Among Medicaid adults, 20% reported their household faced food insufficiency (sometimes or often not having enough to eat) in the week ending March 13, 2020, and 23% reported food insufficiency in the week ending July 21, 2020. Food insufficiency is persistent, with the majority (65%) of Medicaid enrollees reporting food insufficiency in March also doing so in July. Enrollees who are Hispanic and Black reported higher rates (27% and 25%, respectively) of food insufficiency than White enrollees (21%), as did enrollees with incomes less than $25,000 in 2019 (29% compared to 12% with incomes $50,000 or more) and people in fair or poor health (31% compared to 13% of those with excellent or very good health status) (Figure 1). Women reported higher rates of food insufficiency than men (24% versus 21%) as did younger adults (26% among those age 18-34 or 35-54 compared to 14% among those age 65 and older) (Appendix Table 1). Earlier polling from KFF found similar disparities by race and income in trouble affording food and other household expenses during the pandemic.

Figure 1: Food Insufficiency among Medicaid Enrollees during the Coronavirus Pandemic

Access to Food Supports among Medicaid Enrollees

Participation in nutrition assistance programs has positive impacts on nutrition, food security, health care utilization, and health outcomes. A large body of research finds that participation in federal nutrition assistance programs reduces food insecurity and is associated with improvements in health.5 ,6 ,7 ,8 ,9 ,10 ,11 ,12 ,13 ,14 ,15  The largest federal nutrition assistance programs include SNAP, WIC, and the National School Lunch and Breakfast Programs, which provide financial assistance for food or meals to individuals who meet income and other eligibility requirements (Appendix A). Beyond these programs, state-funded organizations, community-based nonprofits, religious organizations, and charities play an important role in meeting immediate food needs, often providing assistance through food banks and food pantries.16 ,17 ,18  Research further shows that participation in Medicaid and Medicaid expansion are associated with increased food security.19 ,20 

There is significant overlap in eligibility requirements for Medicaid and federal nutrition assistance programs. For example, the minimum income eligibility limit for Medicaid is 138% FPL ($16,588 for one individual in 2020) for children, pregnant women, and parents and other adults in states that have implemented the ACA Medicaid expansion to adults, and most states have higher income limits for pregnant women and children (Appendix A). The income eligibility limit for SNAP is 130% FPL gross monthly income and 100% FPL net monthly income, though definitions of income and household composition rules differ somewhat between SNAP and Medicaid. Similarly, for WIC, states can set gross income limits between 100% and 185% FPL for pregnant and postpartum women, infants, and young children whom a health professional has identified as being at nutrition risk.

Despite significant overlap between program income eligibility limits, less than half (47%) of all Medicaid enrollees were enrolled in SNAP in 2018.21  Medicaid enrollees’ participation in SNAP also varies by income, race/ethnicity, and health status, with relatively higher rates of participation among lower-income enrollees, Black and AIAN enrollees, and enrollees with fair or poor health status (Figure 2, Appendix Table 2). Similarly, only about half (54%) of young children (below age five) enrolled in Medicaid are enrolled in WIC. Enrollment in food support programs is lower among Medicaid enrollees who are food insecure (30% for SNAP, 23% for WIC), reflecting unmet need for food support.

Figure 2: Share of Medicaid Enrollees Enrolled in SNAP by Income, Race/Ethnicity, and Health Status Prior to the Pandemic

Recent data show limited use of informal food support systems among Medicaid enrollees facing food insufficiency. In the week ending July 21, few (24%) Medicaid adults who faced food insufficiency reported their households received free groceries or meals, with those who did report doing so saying they were most likely to get help through a food pantry or bank (14%) or through schools or other programs aimed at children (11%) (respondents could name more than one source). In mid-July 2020, half (50%) of Medicaid adults reporting food insufficiency said they were not at all confident their household would be able to afford the kinds of foods they need over the next month.

How Medicaid Programs Can Help Address Growing Food Needs

In response to the pandemic, the federal government has taken action to preserve enrollment in nutrition assistance programs and has increased funding for food assistance, while some states have adopted options to increase access to food assistance. Prior to the pandemic, the Trump administration was planning changes to SNAP that were expected to lead to large falloffs in enrollment among adults.22  A court injunction temporarily suspended implementation of the new rules, which were scheduled to go into effect on April 1, 2020. In addition, the Families First Coronavirus Response Act of 2020 temporarily and partially suspends the time limit on SNAP benefits for recipients who are not working and provides an additional $500 million for WIC. The subsequent Coronavirus Aid, Relief, and Economic Security (CARES) Act appropriates a total of $15.8 billion for SNAP and $8.8 billion for school meals through September 30, 2021. In addition, many states have taken up options to expand access to food assistance, such as by providing emergency supplemental benefits,23  piloting online use of SNAP benefits,24  providing electronic SNAP benefits equivalent to the value of free breakfast and lunch while schools are closed,25  and serving meals for pick up at school sites or delivering them to students’ homes.26 

Research shows a strong connection between food security and health, leading some Medicaid programs or health plans to focus on this issue. People with food insecurity are more likely to report poor health and to have multiple chronic conditions.27 ,28 ,29 ,30  There is a particularly well-established association between food security and health for children. Children in food-insecure households are more likely to suffer from conditions such as birth defects, anemia, cognitive difficulties, asthma, and behavioral problems.31 ,32  Early exposure to food insecurity is also linked to long-term negative health outcomes for children.33  Furthermore, food insecurity is associated with higher rates of health care utilization and health care costs, including increased rates of physician encounters and office visits, emergency department visits, hospitalizations, and prescription drug expenditures.34 

Some Medicaid programs or plans are focusing on eligibility and enrollment for food support programs. Medicaid programs are facilitating coordination of enrollment processes and systems between Medicaid and nutrition assistance programs. For example, just over half of states (26) allow individuals to apply for Medicaid and SNAP through a single online application,35  and almost half of states (24) make eligibility determinations for Medicaid and SNAP through a single shared system.36  Other mechanisms allow states to use eligibility findings from Medicaid to support nutrition assistance program eligibility determinations and vice versa.37  Even in states without such integration or data sharing, eligibility and enrollment staff for Medicaid or food programs can help refer individuals to the other, which may be particularly important during the pandemic, as many individuals experiencing need may not have previous experience with these assistance programs.

In addition to eligibility and enrollment efforts, Medicaid programs are connecting enrollees with food resources more directly. Prior to the pandemic, initiatives within Medicaid were being developed to screen enrollees for food needs and refer them to community-based organizations (CBOs) and other local food resources. In recent pre-pandemic surveys, about half of state Medicaid agencies reported non-managed care initiatives to screen and refer patients for social needs, while 91% of managed care organizations (MCOs) reported working with CBOs to link members to needed social services. While Medicaid generally cannot pay directly for food costs, some states have waivers that allow them to provide direct meal assistance to target populations and/or provide support for enrollees’ non-medical health needs.38  In addition, some MCOs provide direct food assistance using limited financial flexibilities provided in Medicaid or with their own resources.39  States may be able to build on such approaches as part of their pandemic response efforts to address residents’ growing health, social, and economic needs.

Conclusion

As the United States grapples with the widespread impacts of the global COVID-19 pandemic, Americans face health threats not only from the virus but also from economic impacts that may lead to growing levels of food insecurity. Reflecting the strong association between food security and health, disruptions to food access that arise from job loss, school closures, and rising food prices may have negative impacts on health and children’s health outcomes in particular. Food insecurity was already more prevalent among Medicaid enrollees than the general population prior to the pandemic, primarily reflecting their lower incomes. Moreover, among Medicaid enrollees, Black and Hispanic individuals are more likely to experience food insufficiency, pointing to the importance of addressing food security as part of broader efforts to advance racial and ethnic health equity.

The federal government and states have taken actions to preserve enrollment in and expand access to food assistance. State Medicaid programs can help address growing food insecurity through outreach and enrollment efforts and by connecting enrollees to food resources by building directly on initiatives that were in place prior to the pandemic. While together these actions may help address growing food needs, some immigrants remain excluded from nutrition assistance programs and Medicaid, and current food assistance resources may not be adequate to address need. Moreover, many recent federal and state actions are temporary and tied to the public health emergency period, while the economic effects of the pandemic could last far longer than the health crisis itself.

Appendix

Appendix A: Overview of Major Federal Nutrition Assistance Programs

SNAP is the largest federal nutrition assistance program, with approximately 35.7 million people in 18 million households participating in the program in FY 2019.40  SNAP provides monthly benefits to help eligible low-income households purchase food at authorized grocery stores and other food outlets.

WIC operates through federal grants to states to support access to supplemental foods, health care referrals, and nutrition education for low-income, nutritionally at-risk pregnant, postpartum, and breastfeeding women; infants; and children up to age five. WIC benefits can take the form of vouchers for purchase of authorized items at qualifying food stores, nutrition and breastfeeding education, health screenings, and immunization screening and referral.41  WIC participants may also receive a monthly “food package” tailored to nutrition needs. In 2019, approximately 6.4 million women, infants, and children participated in WIC.42 

National School Meal Programs. The National School Lunch Program (NSLP) and the School Breakfast Program (SBP) operate in public and nonprofit private schools as well as residential childcare institutions. All meals served under the programs receive federal subsidies, and free or reduced-price lunches and breakfasts are available to qualifying low-income students. In 2019, over 4.8 billion lunches were served to 29.6 million children,43  and over 2.4 billion breakfasts were served to nearly 14.8 million children under these programs.44 

Table 1: Income Eligibility Standards for Medicaid and Federal Nutrition Assistance Programs
ProgramIncome Eligibility LimitNotes
MedicaidMinimum 138% FPL for children, pregnant women, and parents and other adults in states that have implemented the ACA Medicaid expansion.Most states have higher income eligibility limits for pregnant women and children.

Eligibility for parents and other adults is very limited in states that have not adopted the ACA Medicaid expansion.

SNAP130% FPL gross monthly AND 100% FPL net monthlyHouseholds with an elderly/disabled member are only required to meet the net income limit.

Work requirements, with some exceptions, and resource limits also apply.

WICStates can set gross income limits between 100% FPL and 185% FPL for pregnant and postpartum women, infants, and young children.Individuals must also be identified by a health professional as being at nutrition risk.
School Meal Programs130% FPL gross monthly income for free school meals

185% FPL gross monthly income for reduced-price school meals

Appendix B: Tables

Appendix Table 1: Household Food Sufficiency among Adult Medicaid Enrollees, by Characteristic, July 16-July 21, 2020
Enough Food to Eat in Past 7 DaysSometimes/Often Not Enough Foodto Eat in Past 7 Days
Overall77%23%*
Age
  18-3474%26%*
  35-5474%26%*
  55-6483%17%*
  65+^86%14%
Sex
  Male^79%21%
  Female76%24%*
Race/Ethnicity
  White^79%21%
  Black75%25%*
  Hispanic73%27%*
  Asian81%19%
  Other80%20%
Income
  <$25,00071%29%*
  $25,000 – <$50,00079%21%*
  $50,000+^88%12%
Self-Reported Health Status
  Excellent/Very Good^87%13%
  Good78%22%*
  Fair/Poor69%31%*
NOTE: * Indicates statistically significant difference from the reference group (indicated with ^) at the p<0.05 level. Persons of Hispanic origin may be of any race but are categorized as Hispanic for this analysis; other groups are non-Hispanic. Food insufficiency is defined as sometimes or often not having enough to eat.SOURCE: KFF analysis of Week 12 of the Household Pulse Survey Public Use File (July 16-July 21).
Appendix Table 2: Participation in Nutrition Support Programs among Medicaid Enrollees Prior to the Coronavirus Pandemic,by Characteristic, 2018
Family Receipt of Nutrition Support
SNAPWIC
Overall47%25%
Age
  0 to 549%51% *
  6 to 1848%17% *
  19 to 3443%26% *
  35 to 6449%12%
  65+^46%8%
Sex
  Male^46%25%
  Female49%24%
Race/Ethnicity
  White^46%20%
  Black56% *27% *
  Hispanic46%29% *
  Asian26%15%
  AIAN61% *36% *
  Other64%26%
Income (% of FPL)
  <100% FPL68% *31% *
  100-200% FPL40% *24% *
  200%+ FPL^21%14%
Region
  Northeast47% *20% *
  Midwest51%23%
  South^54%27%
  West38% *25%
Self-Reported Health Status
  Excellent/Very Good^43%27%
  Good50% *24%
  Fair/Poor59% *15% *
NOTE: * Indicates statistically significant difference from the reference group (indicated with ^) at the p<0.05 level. N/A: Point estimates do not meet minimum standards for statistical reliability. SNAP is the Supplemental Nutrition Assistance Program and WIC is the Special Supplemental Nutrition Program for Women, Infants, and Children. AIAN refers to American Indians and Alaska Natives. Persons of Hispanic origin may be of any race but are categorized as Hispanic for this analysis; other groups are non-Hispanic. The US Census Bureau’s poverty threshold for a family with two adults and one child was $20,212 in 2018.SOURCE: KFF analysis of 2018 National Health Interview Survey.

Endnotes

  1. Gita Rampersad presentation. NIHCM webinar, “Food Insecurity & Growing Concerns During COVID-19” (May 11, 2020), https://www.nihcm.org/events/upcoming-events/event/food-insecurity-growing-concerns-during-covid-19. ↩︎
  2. District of Columbia v. U.S. Department of Agriculture, No. 20-119, Order (D.D.C. March 13, 2013), https://oag.dc.gov/sites/default/files/2020-03/Order-Granting-Motion-PI-SNAP-ABAWD-Rule.pdf. ↩︎
  3. The standard USDA definition for food-insecure households measures whether, at some point during the year, the household had difficulty providing enough food for all of their members due to a lack of resources. Within this group, some are further considered having “very low food security,” meaning that normal eating patterns of one or more household members were disrupted and food intake was reduced at times during the year because they had insufficient money or other resources for food. However, food insufficiency is defined using the Household Pulse Survey where respondents report sometimes or often not having enough food to eat in the past week. ↩︎
  4. Prior to the coronavirus pandemic, over one in five (22%) Medicaid enrollees experienced low food security in 2018, including 10% who reported very low food security. (KFF analysis of 2018 National Health Interview Survey) ↩︎
  5. Caroline Ratcliffe, et al. How Much Does the Supplemental Nutrition Assistance Program Reduce Food Insecurity? Am J Agric Econ 2011; 93(4): 1082-98, https://www.ncbi.nlm.nih.gov/pmc/articles/PMC4154696/. ↩︎
  6. Diane Whitmore Schanenbach and Betsy Thorn. Food Support Programs and Their Impacts on Very Young Children. Health Affairs (Bethesda, MD: March 2019): https://www.healthaffairs.org/do/10.1377/hpb20190301.863688/full/. ↩︎
  7. Craig Gundersen and James Ziliak. Food Insecurity and Health Outcomes. Health Affairs (Bethesda, MD: Nov. 2015): 34(11), https://www.healthaffairs.org/doi/10.1377/hlthaff.2015.0645. ↩︎
  8. Food and Nutrition Service, Office of Policy Support. Supplemental Nutrition Assistance Program Food Security Survey: Impacts of Urbanicity and Food Access on Food Security (Summary) (Washington, DC: USDA, March 2014), https://fns-prod.azureedge.net/sites/default/files/SNAPFS_Summary.pdf. ↩︎
  9. Seth A. Berkowitz, et al. Participation and Health Care Expenditures among Low-Income Adults. JAMA Intern Med 2017; 177(11): 1642-49, https://jamanetwork.com/journals/jamainternalmedicine/fullarticle/2653910. ↩︎
  10. Food Research & Action Center. The Role of the Supplemental Nutrition Assistance Program in Improving Health and Well-Being (Washington, DC: Dec. 2017), https://frac.org/wp-content/uploads/hunger-health-role-snap-improving-health-well-being.pdf. ↩︎
  11. Tim Bersak and Lyudmyla Sonchak. The Impact of WIC on Infant Immunizations and Health Care Utilization. Health Serv Res 2018 Aug; 53(Suppl Suppl 1): 2952-69, https://www.ncbi.nlm.nih.gov/pmc/articles/PMC6056598/. ↩︎
  12. USDA Food and Nutrition Service. “About WIC – How WIC Helps,” https://www.fns.usda.gov/wic/about-wic-how-wic-helps, accessed June 30, 2020. ↩︎
  13. Silvie Colman, et al. Effects of the Special Supplemental Nutrition Program for Women, Infants, and Children (WIC): A Review of Recent Research. Special Nutrition Programs Report Number WIC-12-WM (Alexandria, VA: USDA Food and Nutrition Service, Office of Research and Analysis, Jan. 2012), https://fns-prod.azureedge.net/sites/default/files/WICMedicaidLitRev.pdf. ↩︎
  14. Maureen M. Black, et al. WIC Participation and Attenuation of Stress-Related Child Health Risks of Household Food Insecurity and Caregiver Depressive Symptoms. Arch Pediatr Adolesc Med 2012; 166(5): 444-51, https://jamanetwork.com/journals/jamapediatrics/fullarticle/1151633. ↩︎
  15. Katherine Ralston, et al. Children’s Food Security and USDA Child Nutrition Programs. Economic Information Bulletin No. 174 (Washington, DC: U.S. Department of Agriculture, June 2017), https://www.ers.usda.gov/webdocs/publications/84003/eib-174.pdf?v=0. ↩︎
  16. Chantelle Bazerghi, et al. The Role of Food Banks in Addressing Food Insecurity: A Systematic Review. J Community Health 2016; 41: 732-40, https://link.springer.com/article/10.1007%2Fs10900-015-0147-5. ↩︎
  17. Julie Worthington & James Mabli. Emergency Pantry Use Among SNAP Households with Children (Princeton, NJ: Mathematica Policy Research, April 2017), https://www.mathematica.org/download-media?MediaItemId=%7B78C51BB4-8659-4D3A-A6D0-D83C20E8EB5F%7D. ↩︎
  18. Feeding America. Food Banks: Hunger’s New Staple. A Report on Visitation and Characteristics of Food Pantry Clients in the United States in 2009 (Chicago, IL: Feeding America, 2011), https://www.feedingamerica.org/sites/default/files/research/hungers-new-staple/hungers-new-staple-full-report.pdf. ↩︎
  19. Shilpa Londhe, et al. Medicaid Expansion in Social Context: Examining Relationships Between Medicaid Enrollment and County-Level Food Insecurity. J Health Care Poor Underserved 2019; 30(2): 532-46, https://www.ncbi.nlm.nih.gov/pubmed/31130536. ↩︎
  20. Gracie Himmelstein. Effect of the Affordable Care Act’s Medicaid Expansion on Food Security, 2010-2016. Am J Public Health 2019; 109(9): 1243-48, https://ajph.aphapublications.org/doi/10.2105/AJPH.2019.305168. ↩︎
  21. Data from 2018 may under-estimate or over-estimate SNAP enrollment and participation. Nationally, data indicates that SNAP enrollment declined by 2.7 people from FY2018 to FY20. However, recent data shows an uptick in enrollment between March and April 2020, returning total enrollment to levels close to 2018. https://fns-prod.azureedge.net/sites/default/files/resource-files/34SNAPmonthly-7.pdf. ↩︎
  22. District of Columbia v. U.S. Department of Agriculture, No. 20-119, Order (D.D.C. March 13, 2013), https://oag.dc.gov/sites/default/files/2020-03/Order-Granting-Motion-PI-SNAP-ABAWD-Rule.pdf. ↩︎
  23. USDA Food and Nutrition Service. “SNAP COVID-19 Emergency Allotments Guidance” (updated June 16, 2020), https://www.fns.usda.gov/snap/covid-19-emergency-allotments-guidance, accessed June 30, 2020. ↩︎
  24. USDA Food and Nutrition Service. “FNS Launches the Online Purchasing Pilot” (updated June 23, 2020), https://www.fns.usda.gov/snap/online-purchasing-pilot, accessed June 30, 2020. ↩︎
  25. USDA Food and Nutrition Service. “State Guidance on Coronavirus Pandemic EBT (P-EBT)” (updated June 2, 2020), https://www.fns.usda.gov/snap/state-guidance-coronavirus-pandemic-ebt-pebt; accessed June 30, 2020; USDA Food and Nutrition Service, “Memorandum: State Plan for Pandemic EBT (P-EBT)” (March 20, 2020), https://fns-prod.azureedge.net/sites/default/files/resource-files/SNAP-CN-COVID-PEBTGuidance.pdf. ↩︎
  26. USDA Food and Nutrition Service. “COVID-19 Congregate Meal Waivers & Q&As on Summer Meal Delivery Using Existing Authority” (updated April 4, 2020), https://www.fns.usda.gov/sfsp/covid-19/covid-19-meal-delivery, accessed June 30, 2020. ↩︎
  27. Christian A. Gregory and Alisha Coleman-Jensen, Food Insecurity, Chronic Disease, and Health Among Working-Age Adults. Economic Research Report No. 235 (Washington, DC: U.S. Department of Agriculture, July 2017), https://nopren.org/wp-content/uploads/2017/08/ERS-Report-Food-Insecurity-Chronic-Disease-and-Health-Among-Working-Age-Adults.pdf. ↩︎
  28. Janice E. Stuff, et al. Household Food Insecurity is Associated with Adult Health Status. J Nutr 2004; 134(9): 2330-35, https://www.ncbi.nlm.nih.gov/pubmed/15333724. ↩︎
  29. Christian A. Gregory and Alisha Coleman-Jensen, Food Insecurity, Chronic Disease, and Health Among Working-Age Adults (Washington, DC: U.S. Department of Agriculture Economic Research Report No. 235, July 2017), https://nopren.org/wp-content/uploads/2017/08/ERS-Report-Food-Insecurity-Chronic-Disease-and-Health-Among-Working-Age-Adults.pdf. ↩︎
  30. Hilary K. Seligman, et al. Food Insecurity is Associated with Diabetes Mellitus: Results from the National Health Examination and Nutrition Examination Survey (NHANES) 1999-2002. J Gen Intern Med 2007; 22(7): 1018-23, https://www.ncbi.nlm.nih.gov/pubmed/17436030. ↩︎
  31. Christian A. Gregory and Alisha Coleman-Jensen, Food Insecurity, Chronic Disease, and Health Among Working-Age Adults. Economic Research Report No. 235 (Washington, DC: U.S. Department of Agriculture, July 2017), https://nopren.org/wp-content/uploads/2017/08/ERS-Report-Food-Insecurity-Chronic-Disease-and-Health-Among-Working-Age-Adults.pdf. ↩︎
  32. Craig Gundersen and James Ziliak. Food Insecurity and Health Outcomes. Health Affairs (Bethesda, MD: Nov. 2015): 34(11), https://www.healthaffairs.org/doi/10.1377/hlthaff.2015.0645. ↩︎
  33. Christian A. Gregory and Alisha Coleman-Jensen, Food Insecurity, Chronic Disease, and Health Among Working-Age Adults. Economic Research Report No. 235 (Washington, DC: U.S. Department of Agriculture, July 2017), https://nopren.org/wp-content/uploads/2017/08/ERS-Report-Food-Insecurity-Chronic-Disease-and-Health-Among-Working-Age-Adults.pdf. ↩︎
  34. Food Research & Action Center. The Impact of Poverty, Food Insecurity, and Poor Nutrition on Health and Well-Being (Washington, DC: Dec. 2017), https://frac.org/wp-content/uploads/hunger-health-impact-poverty-food-insecurity-health-well-being.pdf. ↩︎
  35. KFF. “Medicaid and CHIP Eligibility, Enrollment, and Cost Sharing Policies as of January 2020: Findings from a 50-State Survey” (March 26, 2020), https://modern.kff.org/coronavirus-covid-19/report/medicaid-and-chip-eligibility-enrollment-and-cost-sharing-policies-as-of-january-2020-findings-from-a-50-state-survey/. ↩︎
  36. Ibid. ↩︎
  37. Under “Express Lane Eligibility” (ELE), Medicaid and CHIP agencies can rely on eligibility findings from other programs, including SNAP, NSLP, and WIC, to identify, enroll, and renew coverage for children. Beyond ELE, states also have a targeted enrollment strategy option that allows them to use SNAP gross income determinations to support Medicaid income eligibility determinations at enrollment and renewal for certain individuals. Unlike ELE, this strategy does not permit states to automatically enroll or renew individuals in Medicaid based on SNAP data. Eligibility findings from Medicaid can also support enrollment in nutrition assistance programs. Under “adjunctive eligibility,” states can use Medicaid enrollment information to establish income eligibility for WIC applicants who already receive Medicaid, SNAP, or TANF, without additional income documentation. In addition, states and school districts can use income data from Medicaid files to identify students eligible for free and reduced-price meals without requiring them to submit a separate application for a school meal application to determine their income eligibility. See: Center for Medicare & Medicaid Services, Center for Medicaid and State Operations. SHO #10-003, CHIPRA #14 (Feb. 4, 2010), https://www.medicaid.gov/sites/default/files/Federal-Policy-Guidance/downloads/SHO10003.PDF; see also: Randy Alison Aussenberg and Julia Kortrey. A Primer on WIC: The Special Supplemental Nutrition Program for Women, Infants, and Children. (Washington, DC: Congressional Research Service, July 21, 2015), https://fas.org/sgp/crs/misc/R44115.pdf. ↩︎
  38. Medicaid may cover home-delivered meals for eligible individuals under Section 1915(i) or 1915(c) HCBS waivers,[xxxviii] but states generally cannot otherwise receive federal Medicaid funds for direct food provision. ↩︎
  39. Under federal Medicaid managed care rules, MCOs may have flexibility to pay for non-medical services through “in-lieu-of” authority and/or offer “value-added” services. “In-lieu-of” services are substitutes for covered services, count as medical costs in a plan’s medical loss ratio, and may qualify as covered services for capitation rate setting. “Value-added” services are extra services outside of covered contract services and do not qualify as covered services for the purposes of capitation rate setting, leaving plans to pay for them out of profits. ↩︎
  40. SNAP data is a monthly average and excludes NC from January 2018 through November 2019. See: USDA Food and Nutrition Service. “Supplemental Nutrition Assistance Program” (data as of July 10, 2020), https://fns-prod.azureedge.net/sites/default/files/resource-files/SNAPsummary-7.pdf, accessed August 5, 2020. ↩︎
  41. USDA. The Special Supplemental Nutrition Assistance Program for Women, Infants and Children (WIC Program) (Washington, DC: USDA), https://fns-prod.azureedge.net/sites/default/files/wic/wic-fact-sheet.pdf, accessed June 30, 2020. ↩︎
  42. WIC data reflect a 12-month average and are current as of July 10, 2020. See: USDA Food and Nutrition Service. “WIC Program Participation and Costs” (data as of July 10, 2020), https://fns-prod.azureedge.net/sites/default/files/resource-files/wisummary-7.pdf, accessed August 5, 2020. ↩︎
  43. National School Lunch Program data reflect a nine-month average and are current as of July 10, 2020. See: USDA Food and Nutrition Service. “National School Lunch Program: Participation and Lunches Served” (data as of July 10, 2020), https://fns-prod.azureedge.net/sites/default/files/resource-files/slsummar-7.pdf, accessed August 5, 2020. ↩︎
  44. School Breakfast Program data reflect a nine-month average and are current as of July 10, 2020. See: USDA Food and Nutrition Service. “School Breakfast Program Participation and Meals Served” (data as of July 10, 2020), https://fns-prod.azureedge.net/sites/default/files/resource-files/sbsummar-7.pdf, accessed August 5, 2020.   ↩︎
News Release

New Interactive Database by KFF’s Kaiser Health News and Guardian US Reveals More Than 900 Health Care Workers Have Died in the Fight Against COVID-19 in the U.S.

Many Were Unable to Access Adequate Personal Protective Equipment, and People of Color Account for a Disproportionate Share of Deaths Among Those Profiled So Far

Published: Aug 11, 2020

A new interactive database from KFF’s Kaiser Health News (KHN) and Guardian US reveals that many of the more than 900 U.S. health care workers who have died in the fight against COVID-19 worked in facilities with shortages of protective equipment such as gowns, masks, gloves and face shields. People of color and nurses account for a disproportionate share of deaths among those profiled so far.

The two news organizations have identified 922 workers who likely died of COVID-19 after helping patients during the pandemic, and have published profiles of 167 workers whose deaths have been confirmed as part of the “Lost on the Frontline” reporting project, which began this spring. The project aims to document the life of every health care worker who falls victim to the virus and shine a light on the workings — and failings — of the U.S. health care system during a global pandemic.

The interactive tool — the nation’s most comprehensive independent database of health care workers who have lost their lives — can be searched by factors such as race and ethnicity, age, occupation, location and whether the workers had adequate access to protective gear. The database is freely available to help local news organizations profile workers in their communities who have lost their lives fighting the pandemic. The profiles include medical professionals like doctors, nurses and paramedics, and others working at hospitals, nursing homes and other medical facilities, including aides, administrative employees, and cleaning and maintenance staff.

Key themes have emerged from the lives and deaths of the 167 workers whose profiles are in the database so far, including:

  • At least 52 (31%) had inadequate personal protective equipment (PPE).
  • At least 103 (62%) were identified as people of color.
  • Sixty-four (38%) were nurses, the largest single group, but the total also includes physicians, pharmacists, first responders and hospital technicians, among others.
  • Ages ranged from 20 to 80, with 21 people (13%) under 40, including eight (5%) under 30. Seventy-seven people — or 46% — were 60 or older.
  • At least 53 workers (32%) were born outside the U.S., including 25 (15%) from the Philippines.

Exclusive stories by the project reporters have revealed that many health care workers are using surgical masks that are far less effective and have put them in jeopardy. Emails obtained via a public records request showed that federal and state officials were aware in late February of dire shortages of PPE. Medical workers began to resort to parking-lot deals and DIY projects to get protective gear themselves.

Last month, KHN reported that health workers who contracted the coronavirus and their families are now struggling to access death benefits and workers’ compensation. The Guardian today examines health care workers under age 30 who died from COVID-19.

Information about health care workers is crowdsourced from family, friends and colleagues of fallen health care workers, as well as reported through traditional means. The project is an independent and comprehensive source of information about these workers, the importance of which is underscored by the recent Trump administration decision to divert hospitals’ data about COVID-19 cases away from the Centers for Disease Control to the federal Department of Health and Human Services.

KHN and the Guardian are calling for family members, friends and colleagues of health workers to share information, photos and stories about their loved ones and co-workers who died on the front lines via this form.

KHN and the Guardian invite news organizations across the country to partner in the effort. All content from the series is available free to other news organizations to republish.

About KFF and KHN

Filling the need for trusted information on national health issues, KFF (Kaiser Family Foundation) is a nonprofit organization based in San Francisco. KHN (Kaiser Health News) is a nonprofit news service covering health issues. KHN is an editorially independent program of KFF and, along with Policy Analysis and Polling, is one of the three major operating programs of KFF. KFF is not affiliated with Kaiser Permanente.

About Guardian News & Media

Guardian US is renowned for its Pulitzer Prize-winning investigation into widespread secret surveillance by the National Security Agency, and for other award-winning work, including The Paradise Papers. Guardian US has bureaus in New York, Washington, New Orleans and Oakland, California, covering the climate crisis, politics, race and immigration, gender, national security and more.

Guardian News & Media (GNM), publisher of theguardian.com, is one of the largest English-speaking newspaper websites in the world. Since launching its U.S. and Australian digital editions in 2011 and 2013, respectively, traffic from outside of the U.K. now represents over two-thirds of The Guardian’s total digital audience.

Health Affairs Article: Medicare Part D Plans Rarely Cover Brand-Name Drugs When Generics Are Available

Authors: Stacie B. Dusetzina, Juliette Cubanski, Leonce Nshuti, Sarah True, Jack Hoadley, Drew Roberts, and Tricia Neuman
Published: Aug 10, 2020

In 2019, an estimated forty-five million Medicare beneficiaries enrolled in one of the program’s Part D prescription drug plans. Recent news reports and other evidence suggest that Medicare Part D plans may be encouraging the use of brand-name drugs instead of generics.

In an article in Health Affairs, KFF’s Juliette Cubanski, Sarah True and Tricia Neuman, and several other co-authors, explore how often brand-name drugs receive favorable formulary inclusion relative to generics by studying Medicare Part D formularies between  2012-19 for all Part D stand-alone prescription plans and Medicare Advantage prescription drug plans.  They find that generic-only coverage has increased over time – 84 percent of all product-plan combinations covered the generic and excluded the brand name drug in 2019, an increase from 69 percent in 2012. Brand-only coverage was rare, occurring for less than 1 percent of all plan-product combinations in 2019.

They also found that, among the formularies that covered both brands and generics in 2019, generics were on the same cost-sharing tier or on a lower tier than brands in 99 percent of observations. According to the authors, most Part D plan formularies are designed to encourage the use of generics rather than their brand name counterparts.  They recommend that policy makers continue to monitor Part D formulary coverage patterns to ensure consistent and generous coverage for generic drugs.