Food Insecurity and Health: Addressing Food Needs for Medicaid Enrollees as Part of COVID-19 Response Efforts
Executive Summary
In addition to the widespread deaths and illnesses directly attributable to the coronavirus, the COVID-19 pandemic is having deep economic impacts that have spurred growing levels of food insecurity. Recent data from the Census Bureau indicates that 45% of adults reported their households did not always have enough of the type of food wanted during the week ending July 21. More than one in ten (12%) reported sometimes or often not having enough food to eat, and this rate rose to 21% among households earning less than $50,000 per year. As the health insurance program for low-income children and many adults, Medicaid reaches many people who may be facing food insecurity and could be a potential vehicle to address this growing problem, especially because of the strong association between food security and health. This brief provides an overview of food insecurity among Medicaid enrollees during the COVID-19 pandemic, examines participation in federal nutrition assistance programs by Medicaid enrollees, and identifies potential actions to address food insecurity among Medicaid enrollees as needs grow in response to the COVID-19 pandemic. It finds:
- Recent data indicates that access to food is a challenge for many Medicaid enrollees during the pandemic. Among Medicaid adults, 20% reported food insufficiency (sometimes or often not having enough to eat) in the week ending March 13, 2020, and 23% reported food insufficiency in the week ending July 21, 2020. Problems accessing food are persistent, with the majority (65%) of Medicaid enrollees reporting food insufficiency in March also doing so in July.
- Despite significant overlap between program income eligibility limits, less than half (47%) of all Medicaid enrollees were enrolled in the Supplemental Nutrition Assistance Program (SNAP) in 2018. Similarly, only about half (54%) of young children (below age five) enrolled in Medicaid were enrolled in the Special Supplemental Nutrition Program for Women, Infants, and Children (WIC) in 2018. Recent data on food insufficiency during the pandemic shows that few (24%) Medicaid adults who said their household sometimes or often did not have enough to eat in the past week reported their households receiving free groceries or meals, with most of those who did report doing so saying they were through a food pantry or bank. In mid-July 2020, half (50%) of Medicaid adults reporting food insufficiency said they were not at all confident their household would be able to afford the kinds of foods they need over the next month.
- At this time of heightened need, Medicaid can play a role in connecting people to nutrition assistance programs by building on initiatives that were underway prior to the pandemic. Medicaid programs can coordinate eligibility and enrollment systems and processes with nutrition assistance programs. They can also help connect enrollees with food resources more directly, such as by screening enrollees for food needs and directing them to community resources.
Issue Brief
Introduction
One area of growing need due to the COVID-19 pandemic is access to food. Many people are facing increased challenges accessing food as they lose jobs and income, and many children have lost access to meals through schools due to their closure. Recent data from the Census Bureau indicates that 45% of adults reported their households did not always have enough of the type of food wanted during the week ending July 21; 12% reported food insufficiency, or sometimes or often not having enough food to eat, up from 9% for this group in March 2020. The majority of people reporting food insufficiency say it is due to inability to afford food, versus inability to go out to get food or lack of supply of food. At the same time, community food resources are facing higher levels of need, as 98% of food banks have reported an increase in demand, at an average increase of 63%.1 Food insufficiency is particularly high among lower-income people, with 21% of adults in households earning less than $50,000 per year reporting sometimes or often not having enough food in the past week.
As the health insurance program for over 70 million low-income children and adults, Medicaid reaches many people who may be facing food insecurity. Prior to the pandemic, the Trump administration was planning to make changes to SNAP that were expected to lead to large falloffs in enrollment among adults.2 Similarly, the federal government had enhanced program integrity efforts within Medicaid, which contributed to pre-pandemic enrollment declines among eligible individuals due to increased barriers to maintaining coverage. In response to the pandemic, however, the federal government has taken temporary actions to preserve enrollment in both programs, and some states have taken action to expand access to assistance. Given the strong association between food security and health, Medicaid can play a role in helping to connect people to food assistance during this time of growing need by building on initiatives that were in place prior to the pandemic.
This brief provides an overview of food insufficiency3 among Medicaid enrollees during to the COVID-19 pandemic, examines participation in nutrition assistance programs by Medicaid enrollees, and discusses how Medicaid can help address growing food needs among enrollees. The analysis is based on KFF analysis of 2018 National Health Interview Survey data as well as recent data from the Census Bureau’s Household Pulse Survey.
Food Insecurity among Medicaid Enrollees
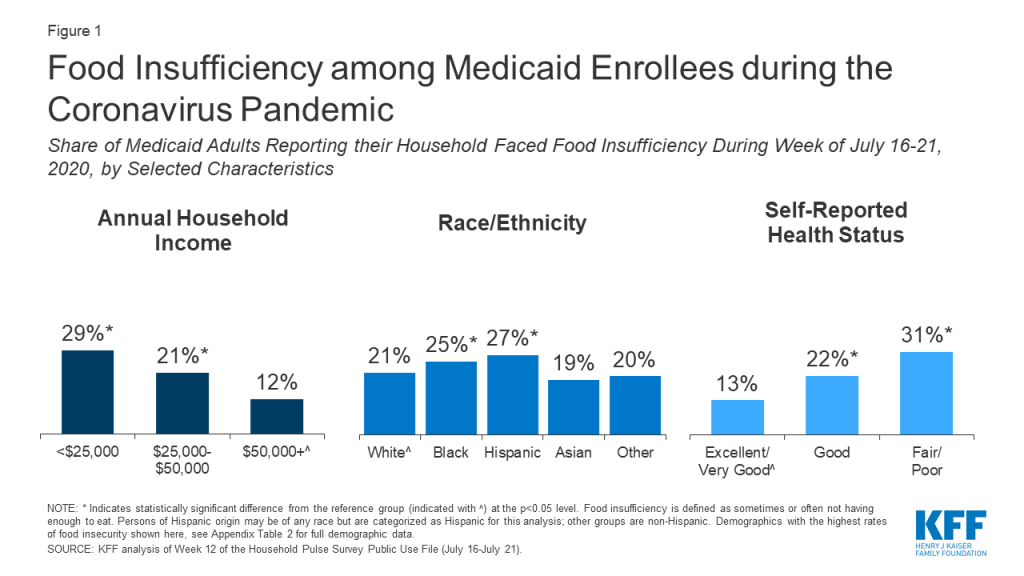
Recent data indicates that access to food is a challenge for many Medicaid enrollees during the pandemic.4 Among Medicaid adults, 20% reported their household faced food insufficiency (sometimes or often not having enough to eat) in the week ending March 13, 2020, and 23% reported food insufficiency in the week ending July 21, 2020. Food insufficiency is persistent, with the majority (65%) of Medicaid enrollees reporting food insufficiency in March also doing so in July. Enrollees who are Hispanic and Black reported higher rates (27% and 25%, respectively) of food insufficiency than White enrollees (21%), as did enrollees with incomes less than $25,000 in 2019 (29% compared to 12% with incomes $50,000 or more) and people in fair or poor health (31% compared to 13% of those with excellent or very good health status) (Figure 1). Women reported higher rates of food insufficiency than men (24% versus 21%) as did younger adults (26% among those age 18-34 or 35-54 compared to 14% among those age 65 and older) (Appendix Table 1). Earlier polling from KFF found similar disparities by race and income in trouble affording food and other household expenses during the pandemic.
Access to Food Supports among Medicaid Enrollees
Participation in nutrition assistance programs has positive impacts on nutrition, food security, health care utilization, and health outcomes. A large body of research finds that participation in federal nutrition assistance programs reduces food insecurity and is associated with improvements in health.5 ,6 ,7 ,8 ,9 ,10 ,11 ,12 ,13 ,14 ,15 The largest federal nutrition assistance programs include SNAP, WIC, and the National School Lunch and Breakfast Programs, which provide financial assistance for food or meals to individuals who meet income and other eligibility requirements (Appendix A). Beyond these programs, state-funded organizations, community-based nonprofits, religious organizations, and charities play an important role in meeting immediate food needs, often providing assistance through food banks and food pantries.16 ,17 ,18 Research further shows that participation in Medicaid and Medicaid expansion are associated with increased food security.19 ,20
There is significant overlap in eligibility requirements for Medicaid and federal nutrition assistance programs. For example, the minimum income eligibility limit for Medicaid is 138% FPL ($16,588 for one individual in 2020) for children, pregnant women, and parents and other adults in states that have implemented the ACA Medicaid expansion to adults, and most states have higher income limits for pregnant women and children (Appendix A). The income eligibility limit for SNAP is 130% FPL gross monthly income and 100% FPL net monthly income, though definitions of income and household composition rules differ somewhat between SNAP and Medicaid. Similarly, for WIC, states can set gross income limits between 100% and 185% FPL for pregnant and postpartum women, infants, and young children whom a health professional has identified as being at nutrition risk.
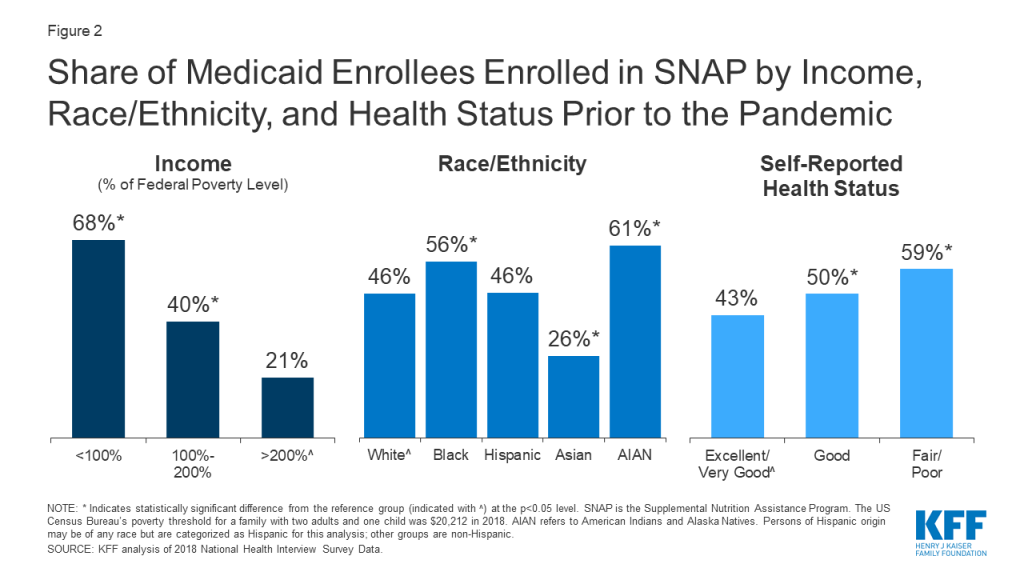
Despite significant overlap between program income eligibility limits, less than half (47%) of all Medicaid enrollees were enrolled in SNAP in 2018.21 Medicaid enrollees’ participation in SNAP also varies by income, race/ethnicity, and health status, with relatively higher rates of participation among lower-income enrollees, Black and AIAN enrollees, and enrollees with fair or poor health status (Figure 2, Appendix Table 2). Similarly, only about half (54%) of young children (below age five) enrolled in Medicaid are enrolled in WIC. Enrollment in food support programs is lower among Medicaid enrollees who are food insecure (30% for SNAP, 23% for WIC), reflecting unmet need for food support.
Recent data show limited use of informal food support systems among Medicaid enrollees facing food insufficiency. In the week ending July 21, few (24%) Medicaid adults who faced food insufficiency reported their households received free groceries or meals, with those who did report doing so saying they were most likely to get help through a food pantry or bank (14%) or through schools or other programs aimed at children (11%) (respondents could name more than one source). In mid-July 2020, half (50%) of Medicaid adults reporting food insufficiency said they were not at all confident their household would be able to afford the kinds of foods they need over the next month.
How Medicaid Programs Can Help Address Growing Food Needs
In response to the pandemic, the federal government has taken action to preserve enrollment in nutrition assistance programs and has increased funding for food assistance, while some states have adopted options to increase access to food assistance. Prior to the pandemic, the Trump administration was planning changes to SNAP that were expected to lead to large falloffs in enrollment among adults.22 A court injunction temporarily suspended implementation of the new rules, which were scheduled to go into effect on April 1, 2020. In addition, the Families First Coronavirus Response Act of 2020 temporarily and partially suspends the time limit on SNAP benefits for recipients who are not working and provides an additional $500 million for WIC. The subsequent Coronavirus Aid, Relief, and Economic Security (CARES) Act appropriates a total of $15.8 billion for SNAP and $8.8 billion for school meals through September 30, 2021. In addition, many states have taken up options to expand access to food assistance, such as by providing emergency supplemental benefits,23 piloting online use of SNAP benefits,24 providing electronic SNAP benefits equivalent to the value of free breakfast and lunch while schools are closed,25 and serving meals for pick up at school sites or delivering them to students’ homes.26
Research shows a strong connection between food security and health, leading some Medicaid programs or health plans to focus on this issue. People with food insecurity are more likely to report poor health and to have multiple chronic conditions.27 ,28 ,29 ,30 There is a particularly well-established association between food security and health for children. Children in food-insecure households are more likely to suffer from conditions such as birth defects, anemia, cognitive difficulties, asthma, and behavioral problems.31 ,32 Early exposure to food insecurity is also linked to long-term negative health outcomes for children.33 Furthermore, food insecurity is associated with higher rates of health care utilization and health care costs, including increased rates of physician encounters and office visits, emergency department visits, hospitalizations, and prescription drug expenditures.34
Some Medicaid programs or plans are focusing on eligibility and enrollment for food support programs. Medicaid programs are facilitating coordination of enrollment processes and systems between Medicaid and nutrition assistance programs. For example, just over half of states (26) allow individuals to apply for Medicaid and SNAP through a single online application,35 and almost half of states (24) make eligibility determinations for Medicaid and SNAP through a single shared system.36 Other mechanisms allow states to use eligibility findings from Medicaid to support nutrition assistance program eligibility determinations and vice versa.37 Even in states without such integration or data sharing, eligibility and enrollment staff for Medicaid or food programs can help refer individuals to the other, which may be particularly important during the pandemic, as many individuals experiencing need may not have previous experience with these assistance programs.
In addition to eligibility and enrollment efforts, Medicaid programs are connecting enrollees with food resources more directly. Prior to the pandemic, initiatives within Medicaid were being developed to screen enrollees for food needs and refer them to community-based organizations (CBOs) and other local food resources. In recent pre-pandemic surveys, about half of state Medicaid agencies reported non-managed care initiatives to screen and refer patients for social needs, while 91% of managed care organizations (MCOs) reported working with CBOs to link members to needed social services. While Medicaid generally cannot pay directly for food costs, some states have waivers that allow them to provide direct meal assistance to target populations and/or provide support for enrollees’ non-medical health needs.38 In addition, some MCOs provide direct food assistance using limited financial flexibilities provided in Medicaid or with their own resources.39 States may be able to build on such approaches as part of their pandemic response efforts to address residents’ growing health, social, and economic needs.
Conclusion
As the United States grapples with the widespread impacts of the global COVID-19 pandemic, Americans face health threats not only from the virus but also from economic impacts that may lead to growing levels of food insecurity. Reflecting the strong association between food security and health, disruptions to food access that arise from job loss, school closures, and rising food prices may have negative impacts on health and children’s health outcomes in particular. Food insecurity was already more prevalent among Medicaid enrollees than the general population prior to the pandemic, primarily reflecting their lower incomes. Moreover, among Medicaid enrollees, Black and Hispanic individuals are more likely to experience food insufficiency, pointing to the importance of addressing food security as part of broader efforts to advance racial and ethnic health equity.
The federal government and states have taken actions to preserve enrollment in and expand access to food assistance. State Medicaid programs can help address growing food insecurity through outreach and enrollment efforts and by connecting enrollees to food resources by building directly on initiatives that were in place prior to the pandemic. While together these actions may help address growing food needs, some immigrants remain excluded from nutrition assistance programs and Medicaid, and current food assistance resources may not be adequate to address need. Moreover, many recent federal and state actions are temporary and tied to the public health emergency period, while the economic effects of the pandemic could last far longer than the health crisis itself.
Appendix
Appendix A: Overview of Major Federal Nutrition Assistance Programs
SNAP is the largest federal nutrition assistance program, with approximately 35.7 million people in 18 million households participating in the program in FY 2019.40 SNAP provides monthly benefits to help eligible low-income households purchase food at authorized grocery stores and other food outlets.
WIC operates through federal grants to states to support access to supplemental foods, health care referrals, and nutrition education for low-income, nutritionally at-risk pregnant, postpartum, and breastfeeding women; infants; and children up to age five. WIC benefits can take the form of vouchers for purchase of authorized items at qualifying food stores, nutrition and breastfeeding education, health screenings, and immunization screening and referral.41 WIC participants may also receive a monthly “food package” tailored to nutrition needs. In 2019, approximately 6.4 million women, infants, and children participated in WIC.42
National School Meal Programs. The National School Lunch Program (NSLP) and the School Breakfast Program (SBP) operate in public and nonprofit private schools as well as residential childcare institutions. All meals served under the programs receive federal subsidies, and free or reduced-price lunches and breakfasts are available to qualifying low-income students. In 2019, over 4.8 billion lunches were served to 29.6 million children,43 and over 2.4 billion breakfasts were served to nearly 14.8 million children under these programs.44
| Table 1: Income Eligibility Standards for Medicaid and Federal Nutrition Assistance Programs | ||
| Program | Income Eligibility Limit | Notes |
| Medicaid | Minimum 138% FPL for children, pregnant women, and parents and other adults in states that have implemented the ACA Medicaid expansion. | Most states have higher income eligibility limits for pregnant women and children. Eligibility for parents and other adults is very limited in states that have not adopted the ACA Medicaid expansion. |
| SNAP | 130% FPL gross monthly AND 100% FPL net monthly | Households with an elderly/disabled member are only required to meet the net income limit. Work requirements, with some exceptions, and resource limits also apply. |
| WIC | States can set gross income limits between 100% FPL and 185% FPL for pregnant and postpartum women, infants, and young children. | Individuals must also be identified by a health professional as being at nutrition risk. |
| School Meal Programs | 130% FPL gross monthly income for free school meals 185% FPL gross monthly income for reduced-price school meals | |
Appendix B: Tables
| Appendix Table 1: Household Food Sufficiency among Adult Medicaid Enrollees, by Characteristic, July 16-July 21, 2020 | ||
| Enough Food to Eat in Past 7 Days | Sometimes/Often Not Enough Foodto Eat in Past 7 Days | |
| Overall | 77% | 23%* |
| Age | ||
| 18-34 | 74% | 26%* |
| 35-54 | 74% | 26%* |
| 55-64 | 83% | 17%* |
| 65+^ | 86% | 14% |
| Sex | ||
| Male^ | 79% | 21% |
| Female | 76% | 24%* |
| Race/Ethnicity | ||
| White^ | 79% | 21% |
| Black | 75% | 25%* |
| Hispanic | 73% | 27%* |
| Asian | 81% | 19% |
| Other | 80% | 20% |
| Income | ||
| <$25,000 | 71% | 29%* |
| $25,000 – <$50,000 | 79% | 21%* |
| $50,000+^ | 88% | 12% |
| Self-Reported Health Status | ||
| Excellent/Very Good^ | 87% | 13% |
| Good | 78% | 22%* |
| Fair/Poor | 69% | 31%* |
| NOTE: * Indicates statistically significant difference from the reference group (indicated with ^) at the p<0.05 level. Persons of Hispanic origin may be of any race but are categorized as Hispanic for this analysis; other groups are non-Hispanic. Food insufficiency is defined as sometimes or often not having enough to eat.SOURCE: KFF analysis of Week 12 of the Household Pulse Survey Public Use File (July 16-July 21). | ||
| Appendix Table 2: Participation in Nutrition Support Programs among Medicaid Enrollees Prior to the Coronavirus Pandemic,by Characteristic, 2018 | ||
| Family Receipt of Nutrition Support | ||
| SNAP | WIC | |
| Overall | 47% | 25% |
| Age | ||
| 0 to 5 | 49% | 51% * |
| 6 to 18 | 48% | 17% * |
| 19 to 34 | 43% | 26% * |
| 35 to 64 | 49% | 12% |
| 65+^ | 46% | 8% |
| Sex | ||
| Male^ | 46% | 25% |
| Female | 49% | 24% |
| Race/Ethnicity | ||
| White^ | 46% | 20% |
| Black | 56% * | 27% * |
| Hispanic | 46% | 29% * |
| Asian | 26% | 15% |
| AIAN | 61% * | 36% * |
| Other | 64% | 26% |
| Income (% of FPL) | ||
| <100% FPL | 68% * | 31% * |
| 100-200% FPL | 40% * | 24% * |
| 200%+ FPL^ | 21% | 14% |
| Region | ||
| Northeast | 47% * | 20% * |
| Midwest | 51% | 23% |
| South^ | 54% | 27% |
| West | 38% * | 25% |
| Self-Reported Health Status | ||
| Excellent/Very Good^ | 43% | 27% |
| Good | 50% * | 24% |
| Fair/Poor | 59% * | 15% * |
| NOTE: * Indicates statistically significant difference from the reference group (indicated with ^) at the p<0.05 level. N/A: Point estimates do not meet minimum standards for statistical reliability. SNAP is the Supplemental Nutrition Assistance Program and WIC is the Special Supplemental Nutrition Program for Women, Infants, and Children. AIAN refers to American Indians and Alaska Natives. Persons of Hispanic origin may be of any race but are categorized as Hispanic for this analysis; other groups are non-Hispanic. The US Census Bureau’s poverty threshold for a family with two adults and one child was $20,212 in 2018.SOURCE: KFF analysis of 2018 National Health Interview Survey. | ||
Endnotes
- Gita Rampersad presentation. NIHCM webinar, “Food Insecurity & Growing Concerns During COVID-19” (May 11, 2020), https://www.nihcm.org/events/upcoming-events/event/food-insecurity-growing-concerns-during-covid-19. ↩︎
- District of Columbia v. U.S. Department of Agriculture, No. 20-119, Order (D.D.C. March 13, 2013), https://oag.dc.gov/sites/default/files/2020-03/Order-Granting-Motion-PI-SNAP-ABAWD-Rule.pdf. ↩︎
- The standard USDA definition for food-insecure households measures whether, at some point during the year, the household had difficulty providing enough food for all of their members due to a lack of resources. Within this group, some are further considered having “very low food security,” meaning that normal eating patterns of one or more household members were disrupted and food intake was reduced at times during the year because they had insufficient money or other resources for food. However, food insufficiency is defined using the Household Pulse Survey where respondents report sometimes or often not having enough food to eat in the past week. ↩︎
- Prior to the coronavirus pandemic, over one in five (22%) Medicaid enrollees experienced low food security in 2018, including 10% who reported very low food security. (KFF analysis of 2018 National Health Interview Survey) ↩︎
- Caroline Ratcliffe, et al. How Much Does the Supplemental Nutrition Assistance Program Reduce Food Insecurity? Am J Agric Econ 2011; 93(4): 1082-98, https://www.ncbi.nlm.nih.gov/pmc/articles/PMC4154696/. ↩︎
- Diane Whitmore Schanenbach and Betsy Thorn. Food Support Programs and Their Impacts on Very Young Children. Health Affairs (Bethesda, MD: March 2019): https://www.healthaffairs.org/do/10.1377/hpb20190301.863688/full/. ↩︎
- Craig Gundersen and James Ziliak. Food Insecurity and Health Outcomes. Health Affairs (Bethesda, MD: Nov. 2015): 34(11), https://www.healthaffairs.org/doi/10.1377/hlthaff.2015.0645. ↩︎
- Food and Nutrition Service, Office of Policy Support. Supplemental Nutrition Assistance Program Food Security Survey: Impacts of Urbanicity and Food Access on Food Security (Summary) (Washington, DC: USDA, March 2014), https://fns-prod.azureedge.net/sites/default/files/SNAPFS_Summary.pdf. ↩︎
- Seth A. Berkowitz, et al. Participation and Health Care Expenditures among Low-Income Adults. JAMA Intern Med 2017; 177(11): 1642-49, https://jamanetwork.com/journals/jamainternalmedicine/fullarticle/2653910. ↩︎
- Food Research & Action Center. The Role of the Supplemental Nutrition Assistance Program in Improving Health and Well-Being (Washington, DC: Dec. 2017), https://frac.org/wp-content/uploads/hunger-health-role-snap-improving-health-well-being.pdf. ↩︎
- Tim Bersak and Lyudmyla Sonchak. The Impact of WIC on Infant Immunizations and Health Care Utilization. Health Serv Res 2018 Aug; 53(Suppl Suppl 1): 2952-69, https://www.ncbi.nlm.nih.gov/pmc/articles/PMC6056598/. ↩︎
- USDA Food and Nutrition Service. “About WIC – How WIC Helps,” https://www.fns.usda.gov/wic/about-wic-how-wic-helps, accessed June 30, 2020. ↩︎
- Silvie Colman, et al. Effects of the Special Supplemental Nutrition Program for Women, Infants, and Children (WIC): A Review of Recent Research. Special Nutrition Programs Report Number WIC-12-WM (Alexandria, VA: USDA Food and Nutrition Service, Office of Research and Analysis, Jan. 2012), https://fns-prod.azureedge.net/sites/default/files/WICMedicaidLitRev.pdf. ↩︎
- Maureen M. Black, et al. WIC Participation and Attenuation of Stress-Related Child Health Risks of Household Food Insecurity and Caregiver Depressive Symptoms. Arch Pediatr Adolesc Med 2012; 166(5): 444-51, https://jamanetwork.com/journals/jamapediatrics/fullarticle/1151633. ↩︎
- Katherine Ralston, et al. Children’s Food Security and USDA Child Nutrition Programs. Economic Information Bulletin No. 174 (Washington, DC: U.S. Department of Agriculture, June 2017), https://www.ers.usda.gov/webdocs/publications/84003/eib-174.pdf?v=0. ↩︎
- Chantelle Bazerghi, et al. The Role of Food Banks in Addressing Food Insecurity: A Systematic Review. J Community Health 2016; 41: 732-40, https://link.springer.com/article/10.1007%2Fs10900-015-0147-5. ↩︎
- Julie Worthington & James Mabli. Emergency Pantry Use Among SNAP Households with Children (Princeton, NJ: Mathematica Policy Research, April 2017), https://www.mathematica.org/download-media?MediaItemId=%7B78C51BB4-8659-4D3A-A6D0-D83C20E8EB5F%7D. ↩︎
- Feeding America. Food Banks: Hunger’s New Staple. A Report on Visitation and Characteristics of Food Pantry Clients in the United States in 2009 (Chicago, IL: Feeding America, 2011), https://www.feedingamerica.org/sites/default/files/research/hungers-new-staple/hungers-new-staple-full-report.pdf. ↩︎
- Shilpa Londhe, et al. Medicaid Expansion in Social Context: Examining Relationships Between Medicaid Enrollment and County-Level Food Insecurity. J Health Care Poor Underserved 2019; 30(2): 532-46, https://www.ncbi.nlm.nih.gov/pubmed/31130536. ↩︎
- Gracie Himmelstein. Effect of the Affordable Care Act’s Medicaid Expansion on Food Security, 2010-2016. Am J Public Health 2019; 109(9): 1243-48, https://ajph.aphapublications.org/doi/10.2105/AJPH.2019.305168. ↩︎
- Data from 2018 may under-estimate or over-estimate SNAP enrollment and participation. Nationally, data indicates that SNAP enrollment declined by 2.7 people from FY2018 to FY20. However, recent data shows an uptick in enrollment between March and April 2020, returning total enrollment to levels close to 2018. https://fns-prod.azureedge.net/sites/default/files/resource-files/34SNAPmonthly-7.pdf. ↩︎
- District of Columbia v. U.S. Department of Agriculture, No. 20-119, Order (D.D.C. March 13, 2013), https://oag.dc.gov/sites/default/files/2020-03/Order-Granting-Motion-PI-SNAP-ABAWD-Rule.pdf. ↩︎
- USDA Food and Nutrition Service. “SNAP COVID-19 Emergency Allotments Guidance” (updated June 16, 2020), https://www.fns.usda.gov/snap/covid-19-emergency-allotments-guidance, accessed June 30, 2020. ↩︎
- USDA Food and Nutrition Service. “FNS Launches the Online Purchasing Pilot” (updated June 23, 2020), https://www.fns.usda.gov/snap/online-purchasing-pilot, accessed June 30, 2020. ↩︎
- USDA Food and Nutrition Service. “State Guidance on Coronavirus Pandemic EBT (P-EBT)” (updated June 2, 2020), https://www.fns.usda.gov/snap/state-guidance-coronavirus-pandemic-ebt-pebt; accessed June 30, 2020; USDA Food and Nutrition Service, “Memorandum: State Plan for Pandemic EBT (P-EBT)” (March 20, 2020), https://fns-prod.azureedge.net/sites/default/files/resource-files/SNAP-CN-COVID-PEBTGuidance.pdf. ↩︎
- USDA Food and Nutrition Service. “COVID-19 Congregate Meal Waivers & Q&As on Summer Meal Delivery Using Existing Authority” (updated April 4, 2020), https://www.fns.usda.gov/sfsp/covid-19/covid-19-meal-delivery, accessed June 30, 2020. ↩︎
- Christian A. Gregory and Alisha Coleman-Jensen, Food Insecurity, Chronic Disease, and Health Among Working-Age Adults. Economic Research Report No. 235 (Washington, DC: U.S. Department of Agriculture, July 2017), https://nopren.org/wp-content/uploads/2017/08/ERS-Report-Food-Insecurity-Chronic-Disease-and-Health-Among-Working-Age-Adults.pdf. ↩︎
- Janice E. Stuff, et al. Household Food Insecurity is Associated with Adult Health Status. J Nutr 2004; 134(9): 2330-35, https://www.ncbi.nlm.nih.gov/pubmed/15333724. ↩︎
- Christian A. Gregory and Alisha Coleman-Jensen, Food Insecurity, Chronic Disease, and Health Among Working-Age Adults (Washington, DC: U.S. Department of Agriculture Economic Research Report No. 235, July 2017), https://nopren.org/wp-content/uploads/2017/08/ERS-Report-Food-Insecurity-Chronic-Disease-and-Health-Among-Working-Age-Adults.pdf. ↩︎
- Hilary K. Seligman, et al. Food Insecurity is Associated with Diabetes Mellitus: Results from the National Health Examination and Nutrition Examination Survey (NHANES) 1999-2002. J Gen Intern Med 2007; 22(7): 1018-23, https://www.ncbi.nlm.nih.gov/pubmed/17436030. ↩︎
- Christian A. Gregory and Alisha Coleman-Jensen, Food Insecurity, Chronic Disease, and Health Among Working-Age Adults. Economic Research Report No. 235 (Washington, DC: U.S. Department of Agriculture, July 2017), https://nopren.org/wp-content/uploads/2017/08/ERS-Report-Food-Insecurity-Chronic-Disease-and-Health-Among-Working-Age-Adults.pdf. ↩︎
- Craig Gundersen and James Ziliak. Food Insecurity and Health Outcomes. Health Affairs (Bethesda, MD: Nov. 2015): 34(11), https://www.healthaffairs.org/doi/10.1377/hlthaff.2015.0645. ↩︎
- Christian A. Gregory and Alisha Coleman-Jensen, Food Insecurity, Chronic Disease, and Health Among Working-Age Adults. Economic Research Report No. 235 (Washington, DC: U.S. Department of Agriculture, July 2017), https://nopren.org/wp-content/uploads/2017/08/ERS-Report-Food-Insecurity-Chronic-Disease-and-Health-Among-Working-Age-Adults.pdf. ↩︎
- Food Research & Action Center. The Impact of Poverty, Food Insecurity, and Poor Nutrition on Health and Well-Being (Washington, DC: Dec. 2017), https://frac.org/wp-content/uploads/hunger-health-impact-poverty-food-insecurity-health-well-being.pdf. ↩︎
- KFF. “Medicaid and CHIP Eligibility, Enrollment, and Cost Sharing Policies as of January 2020: Findings from a 50-State Survey” (March 26, 2020), https://modern.kff.org/coronavirus-covid-19/report/medicaid-and-chip-eligibility-enrollment-and-cost-sharing-policies-as-of-january-2020-findings-from-a-50-state-survey/. ↩︎
- Ibid. ↩︎
- Under “Express Lane Eligibility” (ELE), Medicaid and CHIP agencies can rely on eligibility findings from other programs, including SNAP, NSLP, and WIC, to identify, enroll, and renew coverage for children. Beyond ELE, states also have a targeted enrollment strategy option that allows them to use SNAP gross income determinations to support Medicaid income eligibility determinations at enrollment and renewal for certain individuals. Unlike ELE, this strategy does not permit states to automatically enroll or renew individuals in Medicaid based on SNAP data. Eligibility findings from Medicaid can also support enrollment in nutrition assistance programs. Under “adjunctive eligibility,” states can use Medicaid enrollment information to establish income eligibility for WIC applicants who already receive Medicaid, SNAP, or TANF, without additional income documentation. In addition, states and school districts can use income data from Medicaid files to identify students eligible for free and reduced-price meals without requiring them to submit a separate application for a school meal application to determine their income eligibility. See: Center for Medicare & Medicaid Services, Center for Medicaid and State Operations. SHO #10-003, CHIPRA #14 (Feb. 4, 2010), https://www.medicaid.gov/sites/default/files/Federal-Policy-Guidance/downloads/SHO10003.PDF; see also: Randy Alison Aussenberg and Julia Kortrey. A Primer on WIC: The Special Supplemental Nutrition Program for Women, Infants, and Children. (Washington, DC: Congressional Research Service, July 21, 2015), https://fas.org/sgp/crs/misc/R44115.pdf. ↩︎
- Medicaid may cover home-delivered meals for eligible individuals under Section 1915(i) or 1915(c) HCBS waivers,[xxxviii] but states generally cannot otherwise receive federal Medicaid funds for direct food provision. ↩︎
- Under federal Medicaid managed care rules, MCOs may have flexibility to pay for non-medical services through “in-lieu-of” authority and/or offer “value-added” services. “In-lieu-of” services are substitutes for covered services, count as medical costs in a plan’s medical loss ratio, and may qualify as covered services for capitation rate setting. “Value-added” services are extra services outside of covered contract services and do not qualify as covered services for the purposes of capitation rate setting, leaving plans to pay for them out of profits. ↩︎
- SNAP data is a monthly average and excludes NC from January 2018 through November 2019. See: USDA Food and Nutrition Service. “Supplemental Nutrition Assistance Program” (data as of July 10, 2020), https://fns-prod.azureedge.net/sites/default/files/resource-files/SNAPsummary-7.pdf, accessed August 5, 2020. ↩︎
- USDA. The Special Supplemental Nutrition Assistance Program for Women, Infants and Children (WIC Program) (Washington, DC: USDA), https://fns-prod.azureedge.net/sites/default/files/wic/wic-fact-sheet.pdf, accessed June 30, 2020. ↩︎
- WIC data reflect a 12-month average and are current as of July 10, 2020. See: USDA Food and Nutrition Service. “WIC Program Participation and Costs” (data as of July 10, 2020), https://fns-prod.azureedge.net/sites/default/files/resource-files/wisummary-7.pdf, accessed August 5, 2020. ↩︎
- National School Lunch Program data reflect a nine-month average and are current as of July 10, 2020. See: USDA Food and Nutrition Service. “National School Lunch Program: Participation and Lunches Served” (data as of July 10, 2020), https://fns-prod.azureedge.net/sites/default/files/resource-files/slsummar-7.pdf, accessed August 5, 2020. ↩︎
- School Breakfast Program data reflect a nine-month average and are current as of July 10, 2020. See: USDA Food and Nutrition Service. “School Breakfast Program Participation and Meals Served” (data as of July 10, 2020), https://fns-prod.azureedge.net/sites/default/files/resource-files/sbsummar-7.pdf, accessed August 5, 2020. ↩︎