Rebuilding Title X: New Regulations for the Federal Family Planning Program

Published: Nov 3, 2021

On October 4, 2021, the Biden Administration released new final regulations for the federal Title X family planning program. The new regulations replace those issued by the Trump Administration in 2019,  which made significant and well documented changes to the Title X program leading to a significant reduction in the size of the Title X network and the number of low-income and uninsured clients served by the program. This brief presents new state-level data on the status of the Title X network on the eve of the implementation of the new regulations and summarizes the impact of Trump era regulations on the number of clients served and status of participation by clinics across the country.

The Impact of the 2019 Trump Regulations

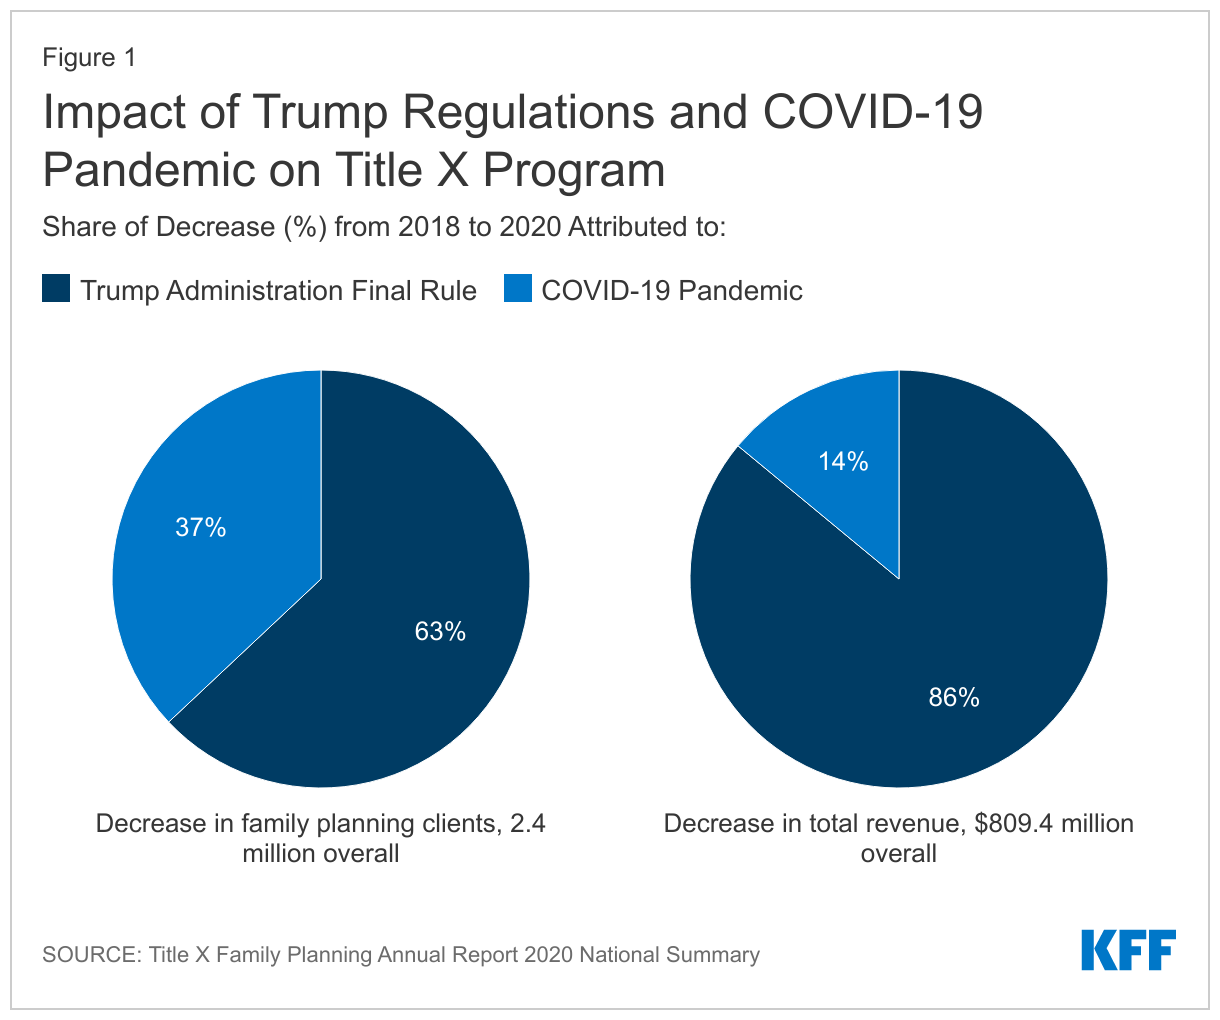
The 2019 Trump Administration regulations substantially diminished the Title X family planning network by disqualifying family planning clinics with co-located abortion services and disallowing the provision of abortion referrals to clients that wanted them. In its 2020 Family Planning Annual Report, the federal Office of Population Affairs (OPA) documented the impact of both the Trump Administration’s regulations and the pandemic on the number of clients they served, as well as the change in the number of grantees and clinic sites from 2018 to 2020 (Table 1). In this two-year period, the number of clients served fell from 3.9 million to 1.5 million people. The report estimated that the Trump Administration’s final rule accounted for nearly two-thirds (63%) of the precipitous reduction in the number of family planning clients served while the COVID-19 pandemic accounted for one third of the falloff (Figure 1).

Table 1: Changes in the Title X Network from 2018 to 2020
201820192020
Clients served3.9 million3.1 million1.5 million
Family planning visits6.5 million4.7 million2.7 million
Grantees (receive funding from HHS OPA)9910075
Sub-recipients (receive funding from grantees and can distribute to clinic sites or provide services themselves)1,1281,060867
Clinic sites (receive funding from grantees or sub-recipients)3,9543,8253,031
SOURCE: Title X Family Planning Annual Report 2020 National Summary
Impact of Trump Regulations and COVID-19 Pandemic on Title X Program

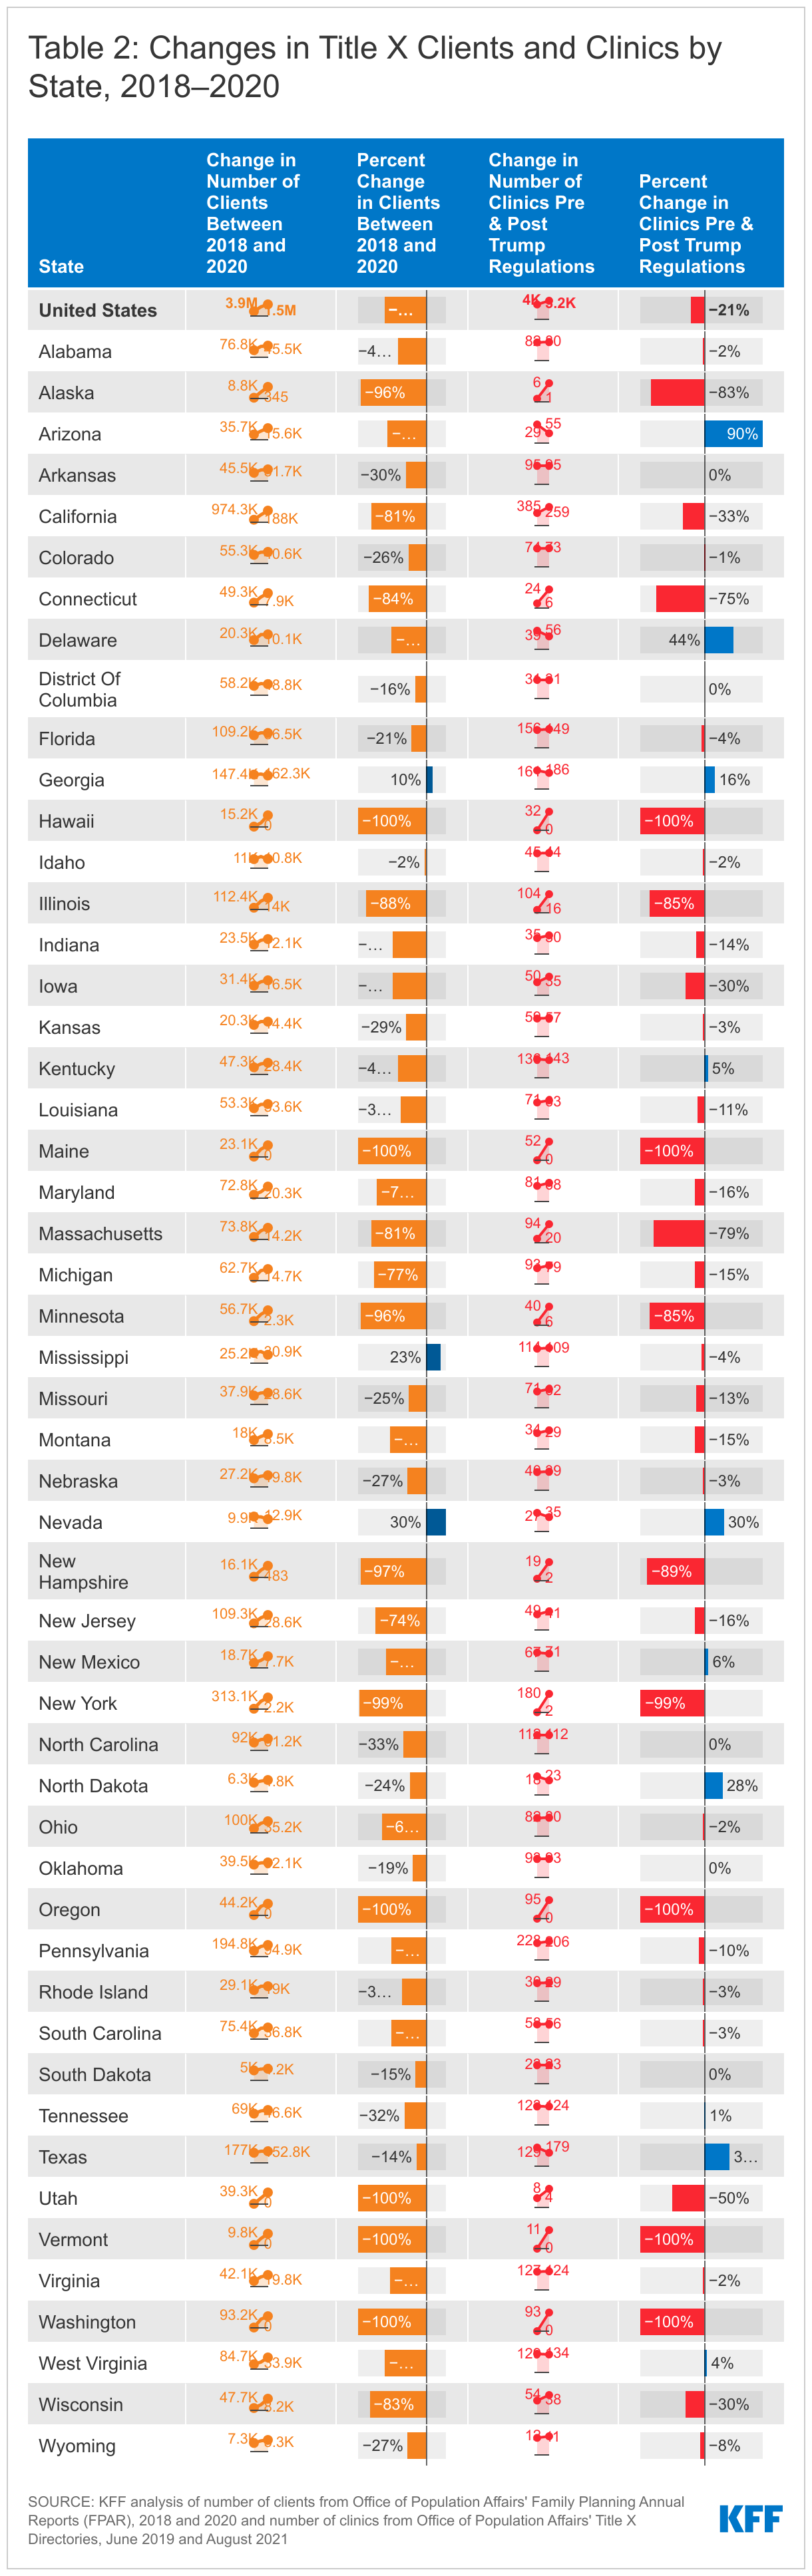
With the large exodus of clinics from the Title X program in summer of 2019, there are still five states without any Title X funded clinic sites: Oregon, Washington, Vermont, Maine, and Hawaii, while New York currently has only two sub-recipient sites (Table 2). Another seven states, including New York, have Title X clinic networks that are currently operating at less than 25% of their original capacity. Based on our analysis of OPA’s Title X Family Planning Directories, 36 states have experienced a decrease in participating Title X clinics from June 2019 to August 2021, while OPA’s Family Planning Annual Reports between 2018 and 2020 show 49 states and DC have seen a reduction in clients ranging from 2%-100%, with a median reduction in clients of 52%.

A small number of entities have rejoined the Title X network in the past year. One of Utah’s two grantees, Utah Navajo Health System, rejoined the Title X program in July 2020 as a sub-recipient under Arizona’s grantee, Arizona Family Health Partnership. Maryland Department of Health rejoined the program in October 2020 after the State of Maryland was granted a permanent injunction against enforcing the 2019 Title X Final Rule. Most of the Planned Parenthood clinics left the Title X Program after the Trump Administration’s Rule became final though few are now in the program, including those in Maryland, Washington D.C., and Missouri.

The Trump Administration Final Rule allowed “non-traditional” Title X grantees to join the network and some of these grantees are no longer part of the program under the Biden Administration. The Trump Administration regulations extended federal family planning funds to organizations that only offered their clients fertility awareness or abstinence options. The new regulations do not qualify them to participate as grantees if they do not offer a broader range of contraception methods to their clients. Notably, the Obria Group, Inc., a Christian organization based in Southern California that did not provide contraceptive services based on religious objections to hormonal contraception, left the Title X program in April 2021. Another Christian-based organization, Beacon Christian Community Health Center, which joined the Title X network as a New York grantee in October 2018, left the Title X program in April 2021 as well. Two of the three new Title X grantees that joined the Title X program under the Trump Administration that are not religiously based, City of El Paso in Texas and Osceola Community Health Services in Florida, remain in the program.

Key Aspects of the Final Biden Administration’s Title X Regulations

The new Biden regulations restore many aspects of the program that were removed through the Trump Administration regulations, including:

  • Allowing co-located abortion services and abortion referrals
  • Requiring clinics that are not able to provide clients with a broad range of family planning methods to provide a prescription or referral to the client if requested
  • Added confidentiality protections for adolescents— clinics may not require consent of a parent or guardian for the provision of services and cannot notify a parent or guardian before or after provision of any services

The regulations have also added new provisions to the program, including:

  • Adding telehealth as an option for providing medical services in addition to in-person care
  • Requiring family planning projects to provide services in a matter that is client-centered, culturally and linguistically appropriate, inclusive, and trauma-informed; protects the dignity of the individual; and ensure equitable and quality service delivery consistent with a nationally recognized standard of care
  • Adding a new funding criterion - the ability of the applicant to advance health equity

The final rules will be effective November 8, 2021, and clinics will once again be able to provide their clients with the care that meets the quality standards established by the CDC and OPA, including providing non-directive pregnancy options counseling with referrals for prenatal care, adoption services, or abortion services and confidential services for adolescents, but it will take time to restore the network of providers. On October 25, 2021, the state of Ohio, joined by 11 other states (AL, AZ, AK, FL, KS, KY, MO, NE, OK, SC, WV), filed a lawsuit in the US District Court for the Southern District of Ohio against HHS  to block the implementation of the Biden Administration’s regulations. These states claim the final regulations violate Section 1008 of the Public Health Service Act that says none of the funds appropriated under Title X can be used in programs where abortion is a method of family planning. The litigants claim that by reinstating the regulations that allow co-located abortion services and require participating providers to offer referrals for abortions to clients who seek them, that HHS is not in compliance with the intent of the law. The States are requesting a ruling as soon as practicable and no later than December 31, 2021. If the Court does not rule before November 8th, the Biden regulations will become effective.

If the final regulations remain in effect, additional funding that can be extended to grantees that left the network is not anticipated until Spring of 2022 after the grant applications due January 11, 2022 are reviewed and approved. Funding will likely be awarded by April 1, 2022. Grantees that are still part of the Title X program can bring clinics back into their network if they have current funding available. Current grantees’ three-year grant cycle ends March 31, 2022.

In response to Texas’ S.B. 8 law banning most abortions, HHS will award additional funding to Texas’ largest Title X grantee to meet an increased demand for emergency contraception and family planning services. OPA is also planning to award an additional $10 million through a new funding opportunity entitled “Funding to Address Dire Need for Family Planning Services” that will provide grants to Title X entities that can demonstrate a need for additional funding for family planning services due to either an influx of clients as a result of Texas’ S.B. 8 abortion ban or some other reason. A second funding opportunity that OPA is planning on releasing will provide $45 million in Spring 2022 to Title X grantees to expand and enhance their telehealth infrastructure and capacity, which will be particularly important given the ongoing COVID-19 pandemic and increased demand for telehealth services.

Looking Forward

The final Biden Administration Title X regulations will make significant changes to sites across the nation and allow clinics like Planned Parenthood, which were formerly disqualified because they have co-located abortion services or provide abortion referrals for individuals who want them, to once again apply for federal support to provide family planning services to low-income and uninsured individuals. These regulations are being challenged by several states by litigation that could take years to resolve. If fully implemented, however, the real impact of the revised regulations will be when federal funds become available to grantees and clinics to rejoin the program and allow more low-income people to receive health services from Title X sites. While many grantees and clinics that left the network are anticipated to resume participation in the safety net program, it remains to be seen whether all those grantees and providers that left the program will apply to return. Some were able to obtain state-level funding to bridge the loss of federal support. These decisions will likely depend on whether states will continue to subsidize their family planning providers or whether additional federal funds will be needed to maintain and strengthen state family planning networks and services in communities that have historically been served by these providers.

Table 2: Changes in Title X Clients and Clinics by State, 2018–2020
News Release

Rebuilding the Title X Family Planning Network Will Take Time, Despite Biden Administration Actions Issuing New Regulations and Additional Funding

Published: Nov 3, 2021

A new KFF analysis highlights state-level data on the status of the Title X family planning program on the eve of the implementation of the new Biden Administration regulations for the program.

To date, five states still have no Title X clinics, and seven states are still operating with less than 25% of their clinic network. Overall, 39 states experienced a drop in the number of participating clinics since 2018. The Trump Administration’s Department of Health and Human Services had issued regulations that essentially disqualified family planning clinics, such as Planned Parenthood, that also provided abortion services from participating in the program and prohibited clinics from offering referrals to abortion providers. These regulations resulted in a dramatic reduction in the number of sites participating and in the number of people served by the program.

The new Biden Administration regulations also include new provisions in addition to restoring many aspects of the program that existed prior to the Trump Administration rule. New provisions also include telehealth as an option for providing medical services, a service option widely used during the COVID-19 pandemic, as well as a focus on advancing health equity.

The final rule will be effective November 8, 2021, with funding for grantees anticipated in Spring 2022. The analysis provides additional information on the new regulations and state by state changes in Title X clients and clinics between 2018-2020.

News Release

A Record 3,834 Medicare Advantage Plans Will be Available in 2022, Up 8 Percent From 2021, While the Number of Medicare Part D Stand-Alone Plans is Decreasing Mainly Due to Firm Consolidations

Published: Nov 2, 2021

A record 3,834 Medicare Advantage plans will be available across the country as alternatives to traditional Medicare for 2022, a new KFF analysis finds. That’s an increase of 8 percent from 2021, and the largest number of plans available in more than a decade.

At the same time, the number of Medicare Part D stand-alone prescription drug plans that will be offered in 2022 is decreasing by 23 percent to 766 plans, primarily the result of firm consolidations leading to fewer plan offerings sponsored by Cigna and Centene, according to another new KFF analysis.

These findings are featured in two briefs released by KFF today that provide an overview of the Medicare Advantage and Medicare Part D marketplace for 2022, including the latest data and key trends over time. Medicare’s open enrollment period began Oct. 15 and runs through Dec. 7.

Medicare Advantage

More than 26 million Medicare beneficiaries – 42 percent of all beneficiaries – are currently in Medicare Advantage plans, which are mostly HMOs and PPOs offered by private insurers that are paid to provide Medicare benefits to enrollees.

In 2022, a typical beneficiary will have 39 plans to choose from in their local market. But the number of Medicare Advantage plans available varies greatly across the country, with an average of 42 plans in metropolitan areas and 25 plans in non-metropolitan areas. In 2022, 25 percent of beneficiaries live in a county where they can choose among 50 Medicare Advantage plans.

Most Medicare Advantage plans (89%) include prescription drug coverage. Fifty-nine percent of these plans do not charge any additional premium beyond Medicare’s standard Part B premium. More than 90 percent of non-group Medicare Advantage plans offer some vision, telehealth, hearing, or dental benefits.

Despite the average beneficiary having access to plans offered by nine different firms, Medicare Advantage enrollment is concentrated in plans operated by UnitedHealthcare, Humana, and Blue Cross Blue Shield affiliates. Together, UnitedHealth and Humana account for 45 percent of Medicare Advantage enrollment in 2021.

Part D

As a result of consolidations in the stand-alone drug plan market, the typical Medicare beneficiary will have a choice of 23 stand-alone drug plans next year, seven fewer than in 2021. Beneficiaries receiving low-income subsidies (LIS) will also have fewer premium-free plan choices in 2022, which could make it more difficult for some enrollees to find a premium-free plan that covers all their prescription medications. In the stand-alone drug plan market, 8 out of 10 enrollees next year are projected to be in stand-alone plans operated by just four firms: CVS Health, Centene, UnitedHealth, and Humana.

The estimated average monthly premium for Medicare Part D stand-alone drug plans is projected to be $43 in 2022, based on current enrollment, while average monthly premiums for the 16 national stand-alone drug plans available in 2022 are projected to range from $7 to $99.

Nearly three-fourths, or 10 million, of the 13.3 million stand-alone drug plan enrollees who don’t qualify for low-income subsidies will have to pay higher premiums next year if they stick with their current plan, and many will also face higher deductibles and cost sharing for covered drugs. While the average weighted monthly PDP premium is increasing by $5 between 2021 and 2022 (from $38 to $43), nearly 4 million non-LIS enrollees (28%) will see a premium increase of $10 or more per month. Substantially fewer non-LIS enrollees (0.2 million, or 2%) will see a premium reduction of the same magnitude.

In addition to these two new analyses, KFF has updated its collection of frequently asked questions about Medicare Open Enrollment to help beneficiaries understand their options during the annual open enrollment period. A recent KFF analysis found that 7 in 10 Medicare beneficiaries say they did not compare their options during a recent open enrollment period. Comparing and choosing among the wide array of Part D plans can be difficult, given that plans differ from each other in multiple ways, beyond premiums, including cost sharing, deductibles, covered drugs, and pharmacy networks. Comparing Medicare Advantage drug plans may be made more difficult by the fact that not only drug coverage varies but also other features, including cost sharing for medical benefits, provider networks, and coverage and costs for supplemental benefits.


Medicare Advantage 2022 Spotlight: First Look

Authors: Meredith Freed, Anthony Damico, and Tricia Neuman
Published: Nov 2, 2021

Data Note

Over the last decade, Medicare Advantage, the private plan alternative to traditional Medicare, has taken on a larger role in the Medicare program. In 2021, more than 26 million Medicare beneficiaries are enrolled in a Medicare Advantage plan. This brief provides an overview of the Medicare Advantage plans that are available for 2022 and key trends over time. (A separate overview of the 2022 Medicare Part D marketplace is also available.)

Plan Offerings in 2022

Number of Plans

Number of Plans Available to Beneficiaries. For 2022, the average Medicare beneficiary has access to 39 Medicare Advantage plans, more than double the number of plans per person in 2017, and the largest number of options available in more than a decade (Figure 1). These numbers exclude employer or union-sponsored group plans, Special Needs Plans (SNPs) and PACE plans, which are only available to select populations.

The average Medicare beneficiary has access to 39 Medicare Advantage plans in 2022, an increase from prior years

Among the 39 Medicare Advantage plans generally available for individual enrollment to the average Medicare beneficiary, 31 of the plans include prescription drug coverage (MA-PDs).

Total Number of Plans. In total, 3,834 Medicare Advantage plans are available nationwide for individual enrollment in 2022 – an 8 percent increase (284 more plans) from 2021 and the largest number of plans available in more than a decade (Figure 2; Appendix Table 1). The vast majority (89 percent) of all Medicare Advantage plans offered include prescription drug coverage in 2022.

More Medicare Advantage plans are available in 2022 than in any other year

HMOs account for about six in ten (59%) of all plans offered in 2022, a slight decline from prior years where they accounted for about two-thirds of all plans offered. The availability of local PPOs has increased rapidly over recent years. In 2022, more than one-third of plans (37%) offered are local PPOs, compared to a quarter in 2018. Between 2021 and 2022, the number of regional PPOs has remained constant, while the number of private fee-for-service plans has continued to decline.

The growth in number of plans varies across states and counties, with the preponderance of the growth occurring in Texas and Florida (41 more and 32 more plans, respectively; data not shown). Alaska has two plan offerings for the first time since 2010. Arkansas has 8 fewer plans available for 2022 than in 2021, while Kentucky has 6 fewer plans, Washington and Ohio each have three fewer plans, and Tennessee has two fewer plans available in 2022 than in 2021.

While many employers and unions also offer Medicare Advantage plans to their retirees, no information about these 2022 plan offerings is made available by CMS to the public during the Medicare open enrollment period because these plans are not available to the general Medicare population.

In 2021, people with end-stage renal disease (ESRD) became eligible to enroll in Medicare Advantage plans. Prior to this change, people with ESRD were not able to enroll in most Medicare Advantage plans, subject to limited exceptions, such as C-SNPs for people with ESRD. In 2021, only about 4,800 Medicare Advantage enrollees were in a C-SNP for people with ESRD.

Availability of Insulin Demonstration Plans. In 2022, beneficiaries in each state will have the option to enroll in a Part D plan participating in an Innovation Center model in which enhanced drug plans cover insulin products for non-LIS enrollees at a monthly copayment of $35 in the deductible, initial coverage, and coverage gap phases of the Part D benefit. In 2022, a total of 2,159 Part D plans will participate in this model, including 1,901 MA-PDs (38% of MA-PDs, including segmented plans).

Special Needs Plans (SNPs). More SNPs are available for 2022 than in any year since they were authorized, increasing from 975 plans in 2021 to 1,156 plans in 2022, a 19 percent increase (Figure 3).

The Number of Special Needs Plans Offered Increased Again for 2022

The rise in SNPs for people who require an institutional-level of care (I-SNPs) has been particularly notable, more than doubling from 83 plans in 2017 to 184 plans in 2022 (an increase of 10 plans since 2021). I-SNPs may be attractive to insurers because they tend to have much lower marketing costs than other plan types since they are often the only available option for people who require an institutional level-of-care, such as those who have been in skilled nursing facilities or nursing homes for 90 days or longer. The number of SNPs for people dually eligible for Medicare and Medicaid (D-SNPs) has also increased sharply over the past five years, nearly doubling from 373 dual SNPs in 2017 to 700 dual SNPs in 2022, suggesting insurers’ continue to be interested in managing the care of this high-need population.

The number of SNPs offered for people with chronic conditions (C-SNPs) is also increasing in 2022 (272 plans), more than doubling from 2017 (122 plans), most of which focus on people with diabetes, heart disease, or lung conditions, as has been the case since the inception of C-SNPs. For 2022, three firms are offering C-SNPs for people with dementia (the same as 2021), four firms are offering C-SNPs for people with mental health conditions (up two from 2021), four firms are offering C-SNPs for people with end-stage renal disease (up one from 2021) and two firms are offering C-SNPs for people with HIV/AIDS (same as 2021).

Variation in the Number of Plans, by Geographic Area. On average, beneficiaries in metropolitan areas can choose from many more Medicare Advantage plans than beneficiaries in non-metropolitan areas (42 plans versus 25 plans, respectively).

In the top 25 counties in terms of plan offerings, beneficiaries can choose from 66 or more Medicare plans, including 14 counties in Ohio and 7 counties in Pennsylvania. Summit County in Ohio offers the most Medicare Advantage plans in 2022, at 82 (Figure 4).

In the 25 counties with the most plans available, Medicare beneficiaries can choose among 66 or more plans

In 5 percent of counties (accounting for 25% of beneficiaries), beneficiaries can choose among more than 50 Medicare Advantage plans, including 51 counties with more than 60 plans (Figure 5). In contrast, in 4 percent of counties (accounting for 1% of beneficiaries), beneficiaries can choose from three or fewer Medicare Advantage plans. The number of counties with no Medicare Advantage plans for 2021 is 65, a slight decrease compared to 2021 (82). For the first time since 2010, two Medicare Advantage plans are being offered in 15 counties in Alaska. Additionally, no Medicare Advantage plans are available in territories other than Puerto Rico. In Puerto Rico, beneficiaries can choose from an average of 26 plans for individual enrollment and an average of 24 D-SNPs.

In 5 percent of counties (accounting for 25% of beneficiaries), beneficiaries can choose among more than 50 Medicare Advantage plans, including 51 counties with more than 60 plans

Access to Medicare Advantage Plans, by Plan Type

As in recent years, virtually all Medicare beneficiaries (99.7%) have access to a Medicare Advantage plan as an alternative to traditional Medicare, including almost all beneficiaries in metropolitan areas (99.99%) and the vast majority of beneficiaries in non-metropolitan areas (98.4%). In non-metropolitan counties, a smaller share of beneficiaries have access to HMOs (91% in non-metropolitan versus 99% in metropolitan counties) or local PPOs (93% in non-metropolitan versus 98% in metropolitan counties), and a slightly larger share of beneficiaries have access to regional PPOs (77% in non-metropolitan counties versus 72% in metropolitan counties).   

Number of Firms

The average Medicare beneficiary is able to choose from plans offered by 9 firms in 2022, one more than in 2021 (Figure 6). Despite most beneficiaries having access to plans operated by several different firms, enrollment is concentrated in plans operated by UnitedHealthcare, Humana, and Blue Cross Blue Shield affiliates. Together, UnitedHealthcare and Humana account for 45 percent of MA enrollment in 2021.

More

More than one-third of beneficiaries (35%) are able to choose from plans offered by 10 or more firms or other sponsors. Sixteen firms are offering Medicare Advantage plans in five counties: Maricopa and Pima counties in Arizona, Fort Bend and Montgomery counties in Texas, and Miami-Dade, Florida. In contrast, in 87 counties, most of which are rural counties with relatively few Medicare beneficiaries (less than 1% of total), only one firm will offer Medicare Advantage plans in 2022. Over the past several years, the number of counties with a single firm offering Medicare Advantage plans has fallen substantially. As recently as 2019, there was a single firm offering plans in nearly 200 counties.

Availability of Plans by Firm and County. UnitedHealthcare and Humana, the two firms with the most Medicare Advantage enrollees in 2021, have large footprints across the country, offering plans in most counties. Humana is offering plans in 85 percent of counties and UnitedHealthcare is offering plans in 74 percent of counties in 2022 (Figure 7). About 9 in 10 (89%) Medicare beneficiaries have access to at least one Humana plan and 90 percent have access to at least one UnitedHealthcare plan.

Interactive DataWrapper Embed

Most major Medicare Advantage firms have also expanded the number of counties where they are offering plans. Humana is offering plans in 2,737 counties in 2022, an increase of 29 from 2021, while UnitedHealthcare is offering plans in 2,377 counties in 2022, an increase of 259 from 2021. Blue Cross Blue Shield Affiliates are offering plans in 2,190 counties in 2022, an increase of 285 plans from 2021. CVS Health is offering plans in 1,840 counties, an increase of 81 counties since 2021; Centene is offering plans in 1,525 counties, an increase of 396 counties; and Cigna is offering plans in 477 counties, an increase of 108 counties. Kaiser Permanente had the smallest growth and is offering plans in 116 counties, an increase of 7 counties.

Multiple Plan Offerings by Firms in the Same County. Many Medicare Advantage firms are also offering more than one plan option in each county. In 585 counties (accounting for 34% of beneficiaries), at least one firm is offering 10 or more plans. In 82 of those counties, two firms are offering 10 or more plans, and in 12 counties, three firms are offering 10 or more plans. Blue Cross Blue Shield Affiliates are offering the most plan options in a county, with 18 different plan options in six counties. Humana is offering the next highest number of plan choices with 14 in five counties, followed by Centene and CVS, which are offering 13 plan options in four counties and two counties, respectively. United Healthcare is offering 10 plan options in two counties.

New Market Entrants and Exits

Medicare Advantage continues to be an attractive market for insurers, with 20 firms entering the market for the first time in 2022, collectively accounting for about 19 percent of the growth in the number of plans available for general enrollment and about 6 percent of the growth in SNPs (Appendix Table 2). Thirteen new entrants are offering HMOs available for individual enrollment. Nine of the new entrants are offering SNPs; seven firms are offering D-SNPs for people dually eligible for Medicaid, one firm is offering a C-SNP for people with select chronic conditions, and one firm is offering an I-SNP.

Three of the new firm entrants are offering plans in Massachusetts, two are offering plans in California, Florida, North Carolina, South Carolina, and Utah, and the remainder are offering plans in at least one of thirteen other states (Arizona, Indiana, Louisiana, Maryland, Michigan, Minnesota, Montana, New Hampshire, North Dakota, South Dakota, Oklahoma, Rhode Island, and Texas).

Seven firms that previously participated in the Medicare Advantage market are not offering plans in 2022. Six of the firms had very low enrollment in 2021, while one firm (Sunrise Advantage Plan) had no enrollment in 2021. Two of the seven exiting firms offered plans in California.

Premiums

The vast majority of Medicare Advantage plans for individual enrollment (89%) will include prescription drug coverage (MA-PDs), and 59 percent of these plans will charge no premium, other than the Part B premium, somewhat higher than 2021 (54 percent). More than nine out of ten beneficiaries (98%) have access to a MA-PD with no monthly premium in 2022. However, in Alaska and Wyoming, beneficiaries do not have access to a zero-premium MA-PD.

In 2021, 65 percent of enrollees in MA-PD plans pay no premium other than the Medicare Part B premium of $148.50 per month. Based on enrollment in March 2021, 15% of enrollees pay at least $50 a month, including 5 percent who pay $100 or more. CMS announced that the average monthly plan premium among all Medicare Advantage enrollees in 2022, including those who pay no premium for their Medicare Advantage plan, is expected to decrease from 2021 to $19 a month.

Extra Benefits

Medicare Advantage plans may provide extra benefits that are not available in traditional Medicare, are considered “primarily health related,” and can use rebate dollars (including bonus payments) to help cover the cost of these extra benefits. Beginning in 2019, CMS expanded the definition of “primarily health related” to allow Medicare Advantage plans to offer additional supplemental benefits. Medicare Advantage plans may also restrict the availability of these extra benefits to certain subgroups of beneficiaries, such as those with diabetes or congestive heart failure, making different benefits available to different enrollees.

Availability of Extra Benefits in Plans for General Enrollment. Historically, the extra benefits offered most often were fitness, dental, vision, and hearing. More than 90% of individual plans offer access to vision, fitness, telehealth, hearing or dental benefits in 2022. Though these benefits are widely available, the scope of specific services varies. For example, a dental benefit may include cleanings only or more comprehensive coverage, often subject to an annual cap on the amount covered by the plan. (Figure 8).

More than 90% of Medicare Advantage plans provide access to vision, fitness, telehealth, hearing, or dental benefits

As of 2020, Medicare Advantage plans have been allowed to include telehealth benefits as part of the basic benefit package – beyond what was allowed under traditional Medicare prior to the COVID-19 public health emergency. These benefits are shown in the figure above, even though their cost are built into the bid, and are not covered by either rebates or supplemental premiums. Additionally, Medicare Advantage plans may offer supplemental telehealth benefits via remote access technologies and/or telemonitoring services, which can be used for those services that do not meet the requirements for coverage under traditional Medicare or the requirements for the telehealth benefits as part of the basic benefit package (such as the requirement of being covered by Medicare Part B when provided in-person). The vast majority (95%) of Medicare Advantage plans are offering telehealth in 2022.

Other extra benefits that are frequently offered for 2022 include over the counter items, such as adhesive or elastic bandages (81%), meal benefits, such as a cooking class, nutrition education, or meal delivery (67%), and transportation benefits (38%). Less than 10 percent of plans provide bathroom safety devices (8%) or telemonitoring services (3%), and support for caregivers of enrollees (3%). This is not an exhaustive list of extra benefits that plans offer, and plans may provide other services such as home-based palliative care, therapeutic massage, and adult day health services, among others.

Access to Extra Benefits. Virtually all Medicare beneficiaries live in a county where at least one Medicare Advantage plan available for general enrollment has some extra benefits not covered by traditional Medicare, with 99% having access to some dental, fitness, vision, and hearing benefits for 2022. The vast majority of beneficiaries also have access to telehealth benefits (99%), over the counter items (99%), a meal benefit (99%), transportation assistance (97%) and but fewer have access to in-home support services (76%) or bathroom safety devices (63%).

Availability of Extra Benefits in Special Needs Plans. SNPs are designed to serve a disproportionately high-need population, and a somewhat larger percentage of SNPs than plans for other Medicare beneficiaries provide their enrollees with over the counter items (93%), transportation benefits (87%) and in-home support services (25%). Similar to plans available for general enrollment, a relatively small share of SNPs provide bathroom safety devices (12%) or telemonitoring services (5%).

Availability of Special Supplemental Benefits for the Chronically Ill (SSBCI). Beginning in 2020, Medicare Advantage plans have also been able to offer extra benefits that are not primarily health related for chronically ill beneficiaries, known as Special Supplemental Benefits for the Chronically Ill (SSBCI). Information on the availability of SSBCI for 2022 has not yet been published by CMS, but we include data on the availability of benefits in 2021.

The vast majority of plans do not yet offer these benefits, but a larger share of SNP plans tend to offer SSBCI benefits than plans for individual enrollment. Some of the most frequently offered SSBCI benefits include food and produce (6.6% for individual plans and 20.5% for SNPs), meals (beyond a limited basis) (6.0% in individual plans and 12.3% for SNPs), and pest control (5.1% for individual plans and 14.6% for SNPs) (Figure 9).

As of 2021, the vast majority of plans do not offer Special Supplemental Benefits for the Chronically Ill (SSBCI)

Discussion

More Medicare Advantage plans are being offered for 2022 than in any other year. Twenty insurers are entering the Medicare Advantage market for the first time, and seven insurers are exiting the market, suggesting that Medicare Advantage remains an attractive, profitable market for insurers. Overall, more than 99 percent of beneficiaries will have access to one or more Medicare Advantage plans in 2022, similar to prior years. With more firms offering SNPs and the number of SNPs rapidly growing, there may be greater focus on how well high-need, vulnerable beneficiaries are being served by Medicare Advantage plans, including SNPs as well as plans for general enrollment. As Medicare Advantage enrollment continues to grow, insurers seem to be responding by offering more plans and choices to the people on Medicare.

Meredith Freed and Tricia Neuman are with KFF.Anthony Damico is an independent consultant.

Methods

This analysis focuses on the Medicare Advantage marketplace in 2022 and trends over time. The analysis includes more than 26 million enrollees in Medicare Advantage plans in 2021.

Data on Medicare Advantage plan availability, enrollment, and premiums were collected from a set of data files released by the Centers for Medicare & Medicaid Services (CMS):

  • Medicare Advantage plan landscape files, released each fall prior to the annual enrollment period
  • Medicare Advantage plan and premium files, released each fall
  • Medicare Advantage plan crosswalk files, released each fall
  • Medicare Advantage contract/plan/state/county level enrollment files, released on a monthly basis
  • Medicare Advantage plan benefit package files, released quarterly
  • Medicare Enrollment Dashboard files, released on a monthly basis

KFF’s plan counts may be lower than those reported by CMS and others because KFF uses overall plan counts and not plan segments. Segments generally permit a Medicare Advantage organization to offer the “same” local plan, but may vary supplemental benefits, premium and cost sharing in different service areas (generally non-overlapping counties).

Appendix

Appendix Table 1: Availability of Medicare Advantage Plans and Insurers, by State, 2022
Appendix Table 2: Entrants and Exiting Insurers in Medicare Advantage Markets, by Plan Type and Plan Locations, 2022

Medicare Part D: A First Look at Medicare Prescription Drug Plans in 2022

Authors: Juliette Cubanski and Anthony Damico
Published: Nov 2, 2021

Issue Brief

During the Medicare open enrollment period from October 15 to December 7 each year, beneficiaries can enroll in a plan that provides Part D prescription drug coverage, either a stand-alone prescription drug plan (PDP) as a supplement to traditional Medicare, or a Medicare Advantage prescription drug plan (MA-PD), which covers all Medicare benefits, including drugs. In 2021, 48 million Medicare beneficiaries, or more than three-quarters (77%) of all Medicare beneficiaries, are enrolled in Medicare Part D plans, with half (50%) enrolled in stand-alone PDPs and the other half (50%) enrolled in Medicare Advantage drug plans. This issue brief provides an overview of the Medicare Part D marketplace in 2022 and key trends over time, focusing primarily on stand-alone PDPs. (A separate overview of the 2022 Medicare Advantage market is also available.) Unless otherwise noted, weighted estimates are based on August enrollment (see Methods box for additional details).

Highlights for 2022

  • The average Medicare beneficiary has a choice of 54 Medicare plans with Part D drug coverage in 2022, including 23 Medicare stand-alone drug plans and 31 Medicare advantage drug plans.
  • A total of 766 Medicare Part D stand-alone prescription drug plans will be offered in 2022, a 23% decrease from 2021, primarily the result of consolidations of PDP offerings sponsored by Cigna and Centene resulting in three fewer PDPs from each firm in each region.
  • The estimated average monthly premium for Medicare Part D stand-alone drug plans is projected to be $43 in 2022, based on current enrollment, while average monthly premiums for the 16 national PDPs are projected to range from $7 to $99 in 2022. Among the 16 national PDPs, average monthly premiums are increasing for 12 PDPs, including 5 PDPs with increases exceeding $10.
  • Most Part D PDP enrollees who remain in the same plan in 2022 will be in a plan with the standard (maximum) $480 deductible.
  • Most PDP enrollees will face much higher cost sharing for brands than for generic drugs, including coinsurance for non-preferred drugs between 40% and 50% (the maximum coinsurance rate allowed for the non-preferred drug tier) in 12 of the 16 national PDPs.
  • In 2022, 198 PDPs will be premium-free for enrollees receiving the Low-Income Subsidy (LIS) (benchmark plans), a smaller number than in any year since Part D started in 2006. The decrease between 2021 and 2022 is due to plan consolidations by Cigna and Centene, which offered benchmark PDPs in 2021 that will not be offered in 2022.

Part D Plan Availability

The Average Medicare Beneficiary Has a Choice of More Than 50 Medicare Plans with Part D Drug Coverage in 2022

The average Medicare beneficiary will have a choice of 23 stand-alone PDPs in 2022, 7 fewer PDP options than in 2021, a 24% decrease (Figure 1). Although the number of PDP options in 2022 is far lower than the peak in 2007 (when there were 56 PDP options, on average), beneficiaries in each state continue to have numerous stand-alone drug plan options.

In 2022, beneficiaries will also have access to 31 MA-PDs, on average, a 15% increase in MA-PD options since 2021. (This average excludes Medicare Advantage plans that do not offer the drug benefit; overall, an average of 39 Medicare Advantage plan options will be available in 2022, excluding plans not available to all beneficiaries, such as Special Needs Plans and group plans).

The Average Medicare Beneficiary Has a Choice of More Than 50 Medicare Plans Offering Drug Coverage in 2022, Including 23 Stand-alone Drug Plans and 31 Medicare Advantage Drug Plans

A Total of 766 Medicare Part D Stand-Alone Prescription Drug Plans Will Be Offered in 2022, a 23% Decrease From 2021 Primarily Due to Plan Consolidations

In 2022, a total of 766 PDPs will be offered by 16 firms in the 34 PDP regions (plus another 10 PDPs in the territories), a decrease of 230 PDPs (-23%) from 2021 (Figure 2). The relatively large decrease in the number of PDPs for 2022 is primarily the result of consolidations of plan offerings sponsored by Cigna and Centene resulting in the market exit of three national PDPs from each firm in each region (all three of Cigna’s Express Scripts PDPs and three of Centene’s six Wellcare PDPs). (Part D sponsors are limited to offering no more than three PDPs in each region.) This accounts for just over 200 PDPs offered in 2021 that will no longer be offered in 2022. Enrollees in these consolidated plans will be automatically switched to other plans offered by the same plan sponsor, although they can choose to switch into a different plan during the annual open enrollment period.

A Total of 766 Medicare Part D Stand-Alone Prescription Drug Plans Will Be Offered in 2022, a 23% Decrease From 2021 Mainly Due to Plan Consolidations

Despite the reduction in PDP availability for 2022, beneficiaries in each state will have a choice of multiple stand-alone PDPs, ranging from 19 PDPs in New York to 27 PDPs in Arizona, plus multiple MA-PDs offered at the local level (Figure 3, Table 1).

Medicare Part D Stand-Alone Prescription Drug Plan Availability in 2022, by State

The number of firms sponsoring stand-alone drug plans has declined steadily over time, from more than 40 firms in 2010 and earlier years, dropping below 25 firms beginning in 2015, and at 16 firms in 2022, is lower than in any other year since Part D started. PDP enrollment is expected to be concentrated in a small number of firms in 2022, as it has been every year. Based on August 2021 enrollment, 8 out of 10 PDP enrollees (80%) in 2022 are projected to be in PDPs operated by just four firms: CVS Health, Centene, UnitedHealth, and Humana. All four firms offer PDPs in all 34 PDP regions in 2022.

Availability of Insulin Demonstration Plans

In 2022, beneficiaries in each state will have the option to enroll in a Part D plan participating in an Innovation Center model in which enhanced drug plans cover insulin products for non-LIS enrollees at a monthly copayment of $35 in the deductible, initial coverage, and coverage gap phases of the Part D benefit. In 2022, a total of 2,159 Part D plans will participate in this model (a 32% increase over 2021, including 258 PDPs (33% of all PDPs) and 1,901 MA-PDs (38% of MA-PDs, including segmented plans). Between 7 and 10 PDPs in each region are participating in the model, in addition to multiple MA-PDs (Table 1). Based on August 2021 enrollment, 45% of non-LIS enrollees are in PDPs that will participate in the insulin model in 2022.

Part D Premiums

Average Monthly Premiums for the 16 National PDPs Are Projected to Range from $7 to $99 in 2022

The estimated national average monthly PDP premium for 2022 is projected to be $43, a 15% increase from $38 in 2021, weighted by August 2021 enrollment (Table 2). It is likely that the actual average weighted premium for 2022, after accounting for enrollment choices by new enrollees and plan changes by current enrollees, will be lower than this estimated average. CMS reported that the average premium for basic Part D coverage offered by PDPs and MA-PDs will be an estimated $33 in 2022. Our premium estimate is higher because it is based on PDPs only (excluding MA-PDs) and includes PDPs offering both basic and enhanced coverage (enhanced plans, which account for 60% of all PDPs in 2022, have higher premiums than basic plans, on average).

PDP premiums will vary widely across plans in 2022, as in previous years. Among the 16 PDPs available nationwide, average premiums will range from a low of $7 per month (or $85 annually) for SilverScript SmartRx to a high of $99 per month (or nearly $1,200 annually) for AARP MedicareRx Preferred (Figure 4, Table 2). In other words, among the 16 national PDPs, there is an $1,100 difference in annual premiums between the highest-premium PDP and the lowest-premium PDP.

Average Monthly Premiums for the 16 National Part D Stand-alone Drug Plans Are Projected to Range from $7 to $99 in 2022

Changes to premiums from 2021 to 2022, averaged across regions and weighted by 2021 enrollment, also vary widely across PDPs, as do the absolute amounts of monthly premiums for 2022. Among the 16 national PDPs, average monthly premiums are increasing for 12 PDPs, including 5 PDPs with increases exceeding $10: Wellcare Medicare Rx Value Plus (+$23, a 52% increase), Cigna Extra Rx (+$21, a 54% increase), Cigna Essential Rx (+$12, a 49% increase), Humana Premier Rx Plan (+$12, an 18% increase), and AARP Medicare Rx Preferred (+$11, a 12% increase).

Monthly premiums are increasing in 2 of the top 3 PDPs by enrollment:

  • The 1.6 million non-LIS enrollees in the largest PDP, CVS Health’s SilverScript Choice (which has a total of 3.4 million enrollees in 2021, including those receiving low-income subsidies) will see a $3 increase (+9%) in their average monthly premium, from $28 in 2021 to $31 in 2022.
  • The 1.6 million non-LIS enrollees in the second largest PDP, AARP MedicareRx Preferred, will see an $11 increase (+12%) in their average monthly premium between 2021 and 2022 from $89 to $99. This is the highest average monthly premium among the national PDPs in 2022. Part D enrollees who have been enrolled in AARP MedicareRx Preferred since 2016 and stay enrolled in 2022 will be paying nearly $40 more than in 2016, when the average monthly premium for this PDP was $61.
  • The 1.6 million non-LIS enrollees in the third largest PDP, Wellcare Value Script, will see a $4 decrease (-25%) in their monthly premium, from $16 in 2021 to $12 in 2022.

Average Monthly Premiums Are Higher for PDPs Offering Enhanced Benefits, Including Insulin at a $35 Monthly Copay, and Lower or No Deductibles

Most Part D stand-alone drug plans in 2022 (60% of PDPs) will offer enhanced benefits for a higher average monthly premium, and most non-LIS PDP enrollees (72%) are enrolled in enhanced plans, based on August 2021 enrollment. Enhanced benefits can include a lower (or no) deductible, reduced cost sharing, or a higher initial coverage limit than under the basic benefit design. The average premium in 2022 for enhanced benefit PDPs is $51, which is 44% higher than the monthly premium for PDPs offering the basic benefit ($35). For the subset of enhanced PDPs participating in the $35 copay insulin model, the average monthly premium ($63) is nearly twice as high as the monthly premium for PDPs that are not participating in the model ($34) (Figure 5).

In 2022, most PDPs (82%) will charge a deductible, including 7 in 10 PDPs (71%) charging the standard (maximum) amount of $480 in 2022. Across all PDPs, the average deductible in 2022 will be $384. The average monthly premium in 2022 for PDPs that charge no deductible is $90, nearly three times the monthly premium for PDPs that charge the standard deductible ($33) and twice as much as the monthly premium for PDPs charging a partial deductible ($45).

Average Monthly Premiums Are Higher for PDPs Offering Enhanced Benefits, Including Insulin at a $35 Monthly Copay, and Lower or No Deductibles

Nearly Three-Fourths of Part D Stand-alone Drug Plan Enrollees Without Low-income Subsidies Will Pay Higher Premiums in 2022 If They Stay in Their Current Plan

Most Part D stand-alone plan enrollees – nearly 10 million of the 13.3 million Part D PDP enrollees who are responsible for paying the entire premium (which excludes Low-Income Subsidy (LIS) recipients) (73%) – will see their monthly premium increase in 2022 if they stay in their same plan, while 3.5 million (27%) will see a premium reduction if they stay in their same plan (Figure 6).

While the average weighted monthly PDP premium is increasing by $5 between 2021 and 2022 (from $38 to $43), nearly 4 million non-LIS enrollees (28%) will see a premium increase of $10 or more per month. Substantially fewer non-LIS enrollees (0.2 million, or 2%) will see a premium reduction of the same magnitude. More than one-third (35%) of non-LIS enrollees (4.7 million) are projected to pay monthly premiums of at least $60 if they stay in their current plans, including 1.3 million (9% of non-LIS enrollees) projected to pay monthly premiums of at least $100. This group includes enrollees in the AARP MedicareRx Preferred PDP in several regions, along with enrollees in several Blue Cross/Blue Shield PDPs and other PDPs that are offered in selected regions but not nationwide.

Nearly Three-Fourths of Part D Stand-alone Drug Plan Enrollees Without Low-income Subsidies Will Pay Higher Premiums in 2022 If They Stay in Their Current Plan

Part D Cost Sharing

Part D Enrollees Pay Much Higher Cost Sharing for Brands and Non-preferred Drugs Than for Generic-Tier Drugs, and a Mix of Copays and Coinsurance for Different Formulary Tiers

In 2022, as in prior years, Part D enrollees will face much higher cost-sharing amounts for brands and non-preferred drugs (which can include both brands and generics) than for drugs on a generic tier, and a mix of copayments and coinsurance for different formulary tiers. The typical five-tier formulary design in Part D includes tiers for preferred generics, generics, preferred brands, non-preferred drugs, and specialty drugs.

Among all PDPs, median standard cost sharing in 2022 is $0 for preferred generics and $5 for generics, $42 for preferred brands (an increase from $40 in 2021), 40% coinsurance for non-preferred drugs (the same as in 2021; the maximum allowed is 50%), and 25% coinsurance for specialty drugs (the same as in 2021; the maximum allowed is 33%) (Figure 7, Table 3).

Figure 7: In 2022, Part D Enrollees Will Pay Much Higher Cost-Sharing Amounts for Brands and Non-preferred Drugs than for Drugs on a Generic Tier, and a Mix of Copays and Coinsurance for Different Formulary Tiers

Plans are implementing a mix of cost-sharing changes for 2022, with both increases and decreases in cost-sharing amounts on various formulary tiers. Of note, however, are cost-sharing increases for non-preferred drugs in 6 of the 16 national PDPs (while decreasing in only 2 of the 16). In 12 of the 16 national PDPs, coinsurance amounts for non-preferred drugs will range from 40% to 50% (the maximum allowed for this tier) in 2022. In addition, enrollees in the top PDP by enrollment, SilverScript Choice, will see their cost sharing for preferred brands shift from a $35 flat copayment to a 17% coinsurance rate, which could mean higher out-of-pocket costs for drugs priced over $206 per 30-day supply, since 17% of this amount or more would exceed the flat $35 copayment. And paying coinsurance rather than flat copayments makes it more difficult to know in advance what actual out-of-pocket costs will be, since that depends on the underlying list price of the drug.

Low-Income Subsidy Plan Availability

In 2022, a Smaller Number of Part D Stand-Alone Drug Plans Will Be Premium-Free to Enrollees Receiving the Low-Income Subsidy (Benchmark Plans) Than in Any Other Year

Through the Part D LIS program, enrollees with low incomes and modest assets are eligible for assistance with Part D plan premiums and cost sharing. As of March 2021, approximately 13 million Part D enrollees are receiving LIS, including 6.8 million (53%) in MA-PDs and 6.0 million (47%) in PDPs.

In 2022, a smaller number of PDPs will be premium-free benchmark plans – that is, PDPs available for no monthly premium to Medicare Part D enrollees receiving the Low-Income Subsidy (LIS) – than in any year since Part D started in 2006, with 198 premium-free benchmark plans, or roughly a quarter of all PDPs in 2022 (Figure 8). The reduction in benchmark plan availability between 2021 and 2022 is the result of plan consolidations by Cigna and Centene; one of Cigna’s Express Scripts PDPs and one of Centene’s Wellcare PDPs that will not be offered in 2022 were benchmark PDPs in all regions in 2021.

In 2022, 198 Part D Stand-Alone Drug Plans Will Be Available Without a Premium to Enrollees Receiving the Low-Income Subsidy (“Benchmark” Plans), a Substantial Reduction from 2021

On average (weighted by Medicare enrollment), LIS beneficiaries have six benchmark plans available to them for 2022, which is about one-fourth the average number of PDP choices available overall and the lowest average number of benchmark plan options in any year since Part D started. All LIS enrollees can select any plan offered in their area, but if they enroll in a non-benchmark plan, they must pay some portion of their chosen plan’s monthly premium. In 2022, 13% of all LIS PDP enrollees who are eligible for premium-free Part D coverage (0.8 million LIS enrollees) will pay Part D premiums averaging $27 per month unless they switch or are reassigned by CMS to premium-free plans.

The number of benchmark plans available in 2022 will vary by region, from four to nine (Table 1). In 2022, 91% of the 6.0 million LIS PDP enrollees are projected to be in PDPs operated by five firms: CVS Health, Centene, Humana, UnitedHealth, and Cigna (based on August 2021 enrollment).

Discussion

Our analysis of the Medicare Part D stand-alone drug plan landscape for 2022 shows that millions of Part D enrollees without low-income subsidies will face premium and other cost increases in 2022 if they stay in their current stand-alone drug plan. There are somewhat fewer stand-alone PDP options available nationwide in 2022, but still dozens of drug plan choices available to beneficiaries in each area during this year’s open enrollment period, including both PDPs (23 plans, on average) and Medicare Advantage drug plans (31 MA-PD plans, on average). There are also fewer benchmark plan options for Part D enrollees receiving Low-Income Subsidies. A narrower set of benchmark plan options could make it more difficult for some LIS enrollees to find a premium-free plan that covers all their prescription medications.

Some Part D stand-alone drug plan enrollees who choose to stay in their current plans may see lower premiums and other costs for their drug coverage, but nearly three-fourths of non-LIS PDP enrollees will face higher premiums if they remain in their current plan, and many will also face higher deductibles and cost sharing for covered drugs. Most Part D PDP enrollees who remain in the same plan in 2022 will be in a plan with the standard (maximum) $480 deductible and will face much higher cost sharing for brands than for generic drugs, including as much as 50% coinsurance for non-preferred drugs. Some beneficiaries could see overall cost savings, including the monthly premium, deductible, and cost sharing, if they switched to a lower-premium plan, while for other beneficiaries, a higher-premium plan might better meet their needs at a lower overall total cost.

Despite these year-to-year changes in plan coverage and costs, as well as changes in beneficiaries’ health needs, other KFF analysis finds that most Medicare beneficiaries did not compare plans during a recent open enrollment period, and most Part D enrollees did not compare the coverage offered by their drug plan to other drug plans. Comparing and choosing among the wide array of Part D plans can be difficult, given that plans differ from each other in multiple ways beyond premiums, including cost sharing, deductibles, covered drugs, and pharmacy networks. Comparing Medicare Advantage drug plans may be made more difficult by the fact that not only drug coverage varies but also other features, including cost sharing for medical benefits, provider networks, and coverage and costs for supplemental benefits. Because Part D plans differ in several ways that can have a significant effect on an enrollee’s access to medications and out-of-pocket drug spending, all Part D enrollees could benefit from the opportunity to compare plans during open enrollment.

Juliette Cubanski is with KFF. Anthony Damico is an independent consultant.

Methods

This analysis focuses on the Medicare Part D stand-alone prescription drug plan marketplace in 2022 and trends over time. The analysis focuses on the 19.5 million enrollees in stand-alone PDPs, as of March 2021. The analysis excludes 21.3 million MA-PD enrollees (non-employer), and another 4.4 million enrollees in employer-group only PDPs and 2.8 million in employer-group only MA-PDs for whom plan premium and benefits data are unavailable.

Data on Part D plan availability, enrollment, and premiums were collected from a set of data files released by the Centers for Medicare & Medicaid Services (CMS):

  • Part D plan landscape files, released each fall prior to the annual enrollment period
  • Part D plan and premium files, released each fall
  • Part D plan crosswalk files, released each fall
  • Part D contract/plan/state/county level enrollment files, released monthly
  • Part D Low-Income Subsidy enrollment files, released each spring
  • Medicare plan benefit package files, released each fall

In this analysis, premium and deductible estimates are weighted by August enrollment unless otherwise noted. Percentage increases are calculated based on non-rounded estimates and in some cases differ from percentages calculated based on rounded estimates presented in the text.

Tables

Table 1: Medicare Part D Stand-alone Prescription Drug Plans, Benchmark Plans, Insulin Model Plans, and Monthly Premiums, 2021 and 2022
Table 2: National Medicare Part D Stand-alone Prescription Drug Plans in 2022
Table 3: Median Standard Cost-Sharing Amounts in National Medicare Part D Stand-alone Prescription Drug Plans, 2021 and 2022
News Release

Dobbs v. Jackson Women’s Health: State Asks Supreme Court to Overturn Roe v. Wade

New KFF Explainer Explores Potential Rulings and Impact

Published: Nov 2, 2021

On December 1, the Supreme Court will hear their first abortion case that could overturn Roe v. Wade, with a solid conservative majority. The case, Thomas E. Dobbs, State Health Officer of the Mississippi Department of Health v. Jackson Women’s Health Organization, involves a Mississippi law banning nearly all abortions over 15 weeks gestational age. Mississippi is asking the Supreme Court to overturn Roe v. Wade, and therefore overturn the constitutional right to abortion that was established in the 1973 decision.

A new KFF assessment explains the origins of the case, addresses the intersections with the litigation that has arisen from S.B. 8, the Texas 6-week abortion ban, and explores the potential outcomes of the Mississippi case and how it could impact access to abortion in states across the nation.

Ten Changes to Watch in Open Enrollment 2022

Author: Karen Pollitz
Published: Oct 29, 2021

Even as the ninth annual Open Enrollment period gets underway, the Affordable Care Act (ACA) Marketplaces continue to evolve and important changes are expected.  Keep an eye on:

1. Open enrollment dates are changing

In most states, the Open Enrollment period will be longer this time.  In recent years, in the HealthCare.gov states, it has lasted only 6 weeks; but now it will run from November 1, 2021 through January 15, 2022.  That said, people should still sign up by December 15 if they want coverage to take effect on January 1.  Signing up later generally means coverage will start February 1. State-run marketplaces have flexibility to hold even longer OE periods and some will do so.

2. Plan choices and premiums will change in 2022

As happens every year, premiums for marketplace plans will change somewhat in 2022.  In HealthCare.gov states, the average benchmark plan premium will be about 3% lower than in 2021, while in some state-based marketplaces, qualified health plan premiums will increase modestly, on average.

In addition, the number of insurers participating in the marketplace will increase in 2022.  In HealthCare.gov states, 32 additional insurers will offer marketplace coverage, bringing the total to 213.  Competition by insurers can sometimes change the so-called benchmark plan (the second-lowest cost silver plan, on which marketplace subsidies are based) if a new silver plan earns this designation in 2022.  On average, consumers in HealthCare.gov states will have a choice of nearly 83 qualified health plans in 2022, compared to an average of 46 plans in 2021.

3. Improved marketplace subsidies continue and will reduce net premiums for most consumers

Expanded marketplace premium subsidies, enacted under the American Rescue Plan Act (ARPA), took effect in 2021 and remain in effect for 2022.  The dollar amount of premium tax credits increased and now fully cover the cost of enrolling in the benchmark silver plan for consumers with income up to 150% FPL.  Before, consumers at 150% FPL had to pay more than 4% of household income for the benchmark plan. For people up to 150% FPL, cost sharing subsidies also substantially reduce deductibles and copays under zero-premium silver plans, making them similar to platinum plans.

ARPA also extended eligibility for premium tax credits to reach people with income over 400% FPL ($51,520 for a single person in 2022, $87,840 for family of 3).  Now these consumers must contribute no more than 8.5% of income toward the benchmark silver plan.  Before, for older consumers, the age-rated premium for benchmark plans could easily cost more than 20% of household income.  ARPA premium tax credit changes are temporary, ending after 2022, although legislation to make them permanent is pending in Congress.

The KFF subsidy calculator helps people estimate the amount of financial assistance based on their age, income, family size, and zip code.

In most states, if enrollees have not updated their application and plan selection for 2022, the marketplace may auto-re-enroll them in their current plan or a similar plan for the coming year.  Over the last three Open Enrollment periods, about 40% of returning marketplace participants were auto-re-enrolled. However, passively renewing can sometimes put consumers at a disadvantage.  For example, if the benchmark plan changes from one year to the next (e.g., due to entrance of new insurers), the dollar value of tax credits, which are tied to the cost of the benchmark plan, can also change.  That means someone now enrolled in the 2021 benchmark plan who is passively renewed could see unexpected monthly premium cost increases if another plan gains benchmark status in 2022 and costs less.

Enrollees who did not take advantage of new ARPA subsidies when those subsidies came online this year could also miss out if they don’t actively renew.  While the marketplace automatically adjusted subsidies for many current enrollees at the end of the COVID-SEP, it could not apply more help to people already in zero-premium bronze plans.  More than 800,000 HealthCare.gov enrollees were in zero-premium bronze plans at the end of Open Enrollment for 2021, and many of them would be better off in silver plans with the new ARPA subsidies.  All marketplace enrollees are encouraged to update their application during Open Enrollment, even if personal circumstances have not changed, so they can see all current plan and financial assistance options. Otherwise, the extended Open Enrollment will leave a short window (until January 15) when consumers can still make changes.

5. People with very low income will have added time to enroll

Starting in 2022, HealthCare.gov will allow enrollment throughout the year for people with income up to 150% of the federal poverty level (or FPL, which is $19,320 per year for a single person in 2022, $32,940 for family of 3).  A new special enrollment opportunity will be offered each month, and as noted above, plan choices will include zero-premium plans with vastly reduced deductibles.  To sign up during the year, people can attest to having 2022 income at or below 150% FPL, then continue with their application.  The marketplace will conduct real-time income verification, as it does for all applicants, and might ask for additional documentation to be submitted within 90 days.  This year, HealthCare.gov will ask for documentation when consumers estimate their 2022 income will be substantially lower (by 50% or $12,000, whichever is greater) than the amount reported on their most recent federal income tax return.

Extended enrollment could benefit millions of people.  At the end of the last Open Enrollment, roughly 1/3 of marketplace participants had income at or below the 150% FPL threshold; and during the recent COVID enrollment opportunity in 2021, 45% of people signing up in HealthCare.gov states (22% in state marketplaces) had incomes at or below this threshold. Open Enrollment remains the best time to sign up for year-long coverage, but the added enrollment opportunities will make it easier for people to sign up for premium-free plans with low cost-sharing throughout the year.

6. More enrollment help will be available

In HealthCare.gov states, funding for Navigators has been restored following years of substantial funding cuts averaging 84%.  Navigators are trained enrollment experts, certified by the marketplace, who provide free help to individuals shopping for marketplace coverage and subsidies, or help signing up for Medicaid and CHIP. Twice as many programs will be available in 2022, with more resources to serve consumers, including extended hours, remote assistance, and language translation services.  The “Find Local Help” link on HealthCare.gov provides contact information and hours of operation for the nearest programs.

7. Three new state-run marketplaces will open

This fall 3 states – Kentucky, Maine, and New Mexico – are launching state-based marketplaces.  Some 173,000 residents of these states already enrolled in plans through HealthCare.gov will have their data transferred to the new state marketplace and receive instructions for accessing their accounts and enrolling in 2022 coverage.

8. New surprise medical bills protection will take effect

Most marketplace plans are HMOs or EPOs with closed provider networks, meaning they generally will not cover non-emergency care from an out-of-network provider; and even when plans do cover out-of-network claims, consumers can face “balance billing” charges in excess of what their plan will pay. That will change next year when a new federal law starts protecting consumers from surprise medical bills.  Beginning January 1, all insurance plans, including marketplace plans, must cover emergency services (other than ground ambulance) at the in-network rate, and out-of-network emergency room facilities and doctors will not be allowed to bill patients more than the in-network cost sharing amount under their plan.  These protections will also apply for non-emergency care received by patients while at in-network hospitals, ambulatory surgery centers, or other facilities.

9. Some recent changes have changed back

This year, it will again be important for consumers to carefully estimate their 2022 income when they apply for marketplace subsidies.  Thanks to a temporary repayment holiday enacted as part of pandemic relief legislation, people who filed their 2020 tax return this spring did not have to repay any excess 2020 premium tax credit; but the repayment requirement is now back in force.  Marketplace consumers who under-estimate their 2022 income risk owing more taxes if they claim excess premium tax credits during the year.  If people do experience a significant change in their 2022 income after they’ve signed up, they should update their marketplace account as soon as possible to avoid receiving excess subsidies.

Another key change this year reversed Trump Administration revisions to the “public charge” rule that would have made it harder for immigrants to enter or stay in the U.S. if they needed public assistance to obtain health coverage.  That action deterred many people from applying for or remaining enrolled in health coverage for fear this could impact their immigration status.  This year the Biden Administration rescinded the Trump Administration changes to the public charge rule.  Now, under current rules, immigration officials will not consider enrollment in Marketplace, CHIP, or Medicaid coverage as part of a public charge test when people apply for a green card.

10. Will New Enrollment Records Be Set?

Marketplace enrollment reached a record high of 12.2 million people as the special COVID enrollment period ended in most states in August 2021.  Affordability gains due to expanded subsidies, as well as outreach and enrollment assistance, likely contributed to this result.  Even so, an October 2021 KFF poll found that only 1 in 4 people who are uninsured or who buy their own health insurance checked to see if they qualified for more help once the ARPA subsidy improvements became available.  Shortly after ARPA’s enactment, KFF estimated nearly 11 million uninsured Americans were eligible for but not enrolled in subsidized marketplace plans, including 1.4 million who became newly eligible for marketplace subsidies.  These uninsured individuals, including those eligible for zero-premium plans, disproportionately have a high school education or less, are Hispanic, young adults, live in rural areas, or lack Internet access at home. It remains to be seen during this next Open Enrollment whether additional time and enrollment help, and expanded financial help yields even more signups.

News Release

Updated Women’s Health State Data: Interactive Dashboard

Published: Oct 28, 2021

Interested in keeping up with the most recent state specific women’s health data and policies? The newly updated and upgraded KFF State Profiles for Women’s Health interactive dashboard offers the latest national and state data and policies women’s health, from health insurance coverage to abortion policy changes.

This easy-to-use visual dashboard allows you to explore a broad range of state-level statistics and policies of importance to women including health status, insurance, and Medicaid coverage, use of preventive services, contraceptive coverage, sexual health, maternal and infant health, and abortion policies. Many indicators also provide state-level information for women of different racial and ethnic groups. Each chart is available for download.

Richer Health Insurance Subsidies Available This ACA Enrollment Season

Authors: Cynthia Cox, Krutika Amin, and Jason Millman
Published: Oct 28, 2021

Many people who come to the Affordable Care Act marketplaces for the 2022 open enrollment period, which begins Nov. 1, may be learning for the first time about new financial assistance available to them. The American Rescue Plan Act (ARPA), the COVID-19 relief package passed in March, broadened eligibility for ACA health insurance subsidies and made the financial aid more generous for those who already qualified.

The size of the new savings varies across income levels. The new ARPA subsidies on average will cover just over a third of the cost of a benchmark plan for someone earning between 400% and 600% of the Federal Poverty Level – a group that was previously ineligible for subsidies. Lower-income marketplace shoppers in a household earning under 150% of FPL will now pay $0 per month for a benchmark plan, with reduced out-of-pocket costs.

Although ARPA subsidies first became available in the spring, our recent poll found just one in four people who are uninsured or buy their own coverage have checked to see if they qualify for the extra help. The enhanced subsidies are set to expire at the end of 2022, but Congress is debating whether to extend them for a longer period or permanently.

Source

How the American Rescue Plan Act Affects Subsidies for Marketplace Shoppers and People Who Are Uninsured

Poll Finding

KFF COVID-19 Vaccine Monitor: October 2021

Published: Oct 28, 2021

Findings

The KFF COVID-19 Vaccine Monitor is an ongoing research project tracking the public’s attitudes and experiences with COVID-19 vaccinations. Using a combination of surveys and qualitative research, this project tracks the dynamic nature of public opinion as vaccine development and distribution unfold, including vaccine confidence and acceptance, information needs, trusted messengers and messages, as well as the public’s experiences with vaccination.

Key Findings

  • With the expected expansion of vaccine authorization to younger age groups in the coming weeks, the latest KFF COVID-19 Vaccine Monitor indicates that vaccine uptake has slowed among 12-17 year-olds, with half of parents saying their teen has gotten vaccinated or will do so right away. About three in ten parents of 5-11 year-olds (27%) are eager to get a vaccine for their younger child as soon as one is authorized, while a third say they will wait a while to see how the vaccine is working. Three in ten parents say they will definitely not get the vaccine for their 12-17 year-old (31%) or their 5-11 year-old (30%).
  • Parents’ main concerns when it comes to vaccinating their younger children ages 5-11 have to do with potential unknown long-term effects and serious side effects of the vaccine, including two-thirds who are concerned the vaccine may affect their child’s future fertility. With talk of possible school vaccine mandates, over half (53%) of parents are worried their child may be required to get vaccinated for COVID-19 even if they don’t want them to. Some parents also express concerns related to access or information-related barriers to vaccination, including larger shares of lower-income parents who are concerned about missing work to deal with children’s vaccinations (51%), having to pay out-of-pocket to get their child vaccinated (45%), not being able to get the vaccine from a trusted place (48%), or having difficulty traveling to a vaccination location (38%).
  • The pace of vaccine uptake also appears to be slowing among adults, with 72% saying they have gotten at least one dose, the same share who said so last month. Partisanship continues to be a sharp dividing line in vaccine attitudes, including among fully vaccinated adults, with nearly four in ten fully vaccinated Republicans saying they are unlikely to get a booster dose when it’s recommended for them.
  • With a rise in vaccine mandates, one in four workers (25%) now say their employer has required them to get the COVID-19 vaccine, up 16 percentage points since June. Half of workers continue to say they do not want their employer to put in place a vaccine requirement. More than a third (37%) of unvaccinated workers (5% of adults overall) say they would leave their job if their employer required them to get a vaccine or get tested weekly, a share that rises to seven in ten unvaccinated workers (9% of all adults) if weekly testing is not an option. Six in ten workers (8% of all adults) also say they would ask for an exemption if presented with such a mandate. Still, while about a quarter of all adults say they know someone who has left a job because of a vaccine requirement, just 5% of unvaccinated workers (1% of all adults) say they have personally done so.
  • With the Delta surge abating in most of the country, the Monitor finds that about half the public has returned to their normal pre-pandemic activities and many expect to engage in regular holiday traditions, including a majority of parents who say their kids will be trick-or-treating this Halloween. Some groups remain more cautious, including Democrats, vaccinated adults, and Hispanic parents, one-third of whom say their children will not be trick-or-treating this year specifically because of concerns about COVID-19.

Parents Attitudes Towards COVID-19 Vaccinations For Children

Pfizer’s announcement in September that their COVID-19 vaccine was shown to be safe and effective for children ages five to eleven in clinical trials seems to have had little impact on parents’ intentions to vaccinate their children in that age group. The KFF COVID-19 Vaccine Monitor finds that about three in ten parents (27%) say they will vaccinate their 5-11 year old child “right away” once a vaccine is authorized for their age group – statistically similar to shares who said the same in September and in July. A third of parents say they will “wait and see” how the vaccine is working before having their 5-11 year old vaccinated while three in ten say they definitely won’t get their 5-11 year old vaccinated (30%) and 5% say they will only do so if their school requires it.

Three In Ten Parents Say They Will Definitely Not Get Their 5 To 11 Year Old Vaccinated

Parents of 5-11 year-olds cite a range of concerns when it comes to vaccinating their children for COVID-19, with safety issues topping of the list. More than seven in ten parents of 5-11 year-olds say they are “very” or “somewhat” concerned that not enough is known about the long-term effects of the COVID-19 vaccine in children (76%) or their child might experience serious side effects from the COVID-19 vaccine (71%). Additionally, two-thirds say they are concerned the vaccine may negatively impact their child’s fertility in the future, despite the CDC stating there is no evidence that the COVID-19 vaccines cause fertility problems.1  With talk of possible school vaccine mandates, over half (53%) of parents are worried their child may be required to get vaccinated for COVID-19 even if they don’t want them to.

Smaller shares of parents express concerns related to access or information-related barriers to vaccination, including about one-third (35%) who are concerned they might need to take time off work to get their child vaccinated or care for them if they experience side effects, one-quarter who are concerned they won’t be able to get their child vaccinated at a trusted place or they might have to pay an out-of-pocket cost, and one in five (19%) who are concerned they may have difficulty traveling to a vaccination location.

Long-Term Effects, Serious Side Effects, And Impacts On Fertility Are Among The Top Concerns Parents Have About Vaccinating Their 5-11 Year Old Child

Notably, parents with household incomes under $50,000 are more likely than those with higher incomes to say they are very or somewhat concerned about issues related to vaccine access, with about half saying they are concerned about taking time off work to take their 5-11 year old to get the vaccine and recover from symptoms (51%), not being able to get the vaccine from a place they trust (48%), or having to pay an out-of-pocket cost to get their child vaccinated (45%). Nearly four in ten lower-income parents they are concerned about difficulty traveling to a place to get their child vaccinated (38%). Few higher-income parents express these same concerns.

Lower Income Parents More Likely To Be Concerned About Taking Time Off To Take Their Child To Get Vaccinated, Traveling To Vaccine Site, And Potential Cost

The latest KFF COVID-19 Vaccine Monitor suggests a slowdown in vaccination uptake among 12 to 17 year-olds with about half of parents of teens (46%) saying their child has received at least one dose of a vaccine, similar to the share who said the same in September (48%). Just 4% of parents say they want to get their 12 to 17 year old vaccinated right away while about one in ten parents (11%) say they want to “wait and see” before getting their teen vaccinated. Notably, three in ten parents (31%) say they definitely will not get their 12 to 17 year old vaccinated.

Nearly Half Of Parents Say Their 12-17 Year Old Has Gotten The Vaccine, Yet About Three In Ten Say They Won't Get Their Teen Vaccinated

With the Delta surge of COVID-19 cases waning, vaccine uptake among adults has slowed considerably. Just over seven in ten (72%) of adults now say they have received at least one dose of the COVID-19 vaccine and another 2% say they will get vaccinated “as soon as possible,” similar to the shares who reported the same in September. Just 5% say they want to “wait and see” before getting vaccinated, a share that has steadily declined since the spring. Sixteen percent of the public say they will definitely not get vaccinated (a share that has held relatively steady since December 2020) and a further 4% say they will only do so if they are required for work, school, or other activities.

One In Five Adults Continue To Say They Will Definitely Not Get The COVID-19 Vaccine Or Will Only Do So If Required

As the Vaccine Monitor has been finding for months, large gaps in self-reported vaccination rates remain across partisanship, age, education, and community type. Across partisans, 90% of Democrats say they have gotten at least one dose compared to 69% of independents and 61% of Republicans. There are also large differences in vaccination rates between college graduates and those without a college degree (83% vs. 67%) and notably, vaccine uptake among rural adults (58%) continues to lag behind those of urban (75%) and suburban (73%) residents. Mirroring the September Vaccine Monitor findings, the gap in vaccination rates across race and ethnic groups has narrowed with similar shares of Black adults (73%), White adults (72%) and Hispanic adults (70%) now reporting having received at least one dose of a COVID-19 vaccine.

Large Gaps In Vaccine Uptake Remain Across Partisans, Educational Attainment, Age, And Community Type

Vaccine Boosters Eligibility And Uptake

In September, the U.S. Food and Drug Administration (FDA) amended the emergency use authorization for the Pfizer COVID-19 vaccine to allow for a booster dose for those who had received their second dose at least six months prior and are either 65 or older, at high risk for severe COVID-19, or in high exposure occupations. The COVID-19 Vaccine Monitor finds that 10% of fully vaccinated adults (7% of all adults) say they have received a booster dose of the COVID-19 vaccine.

More recently, the FDA announced their support for emergency use authorization for booster doses of the Moderna COVID-19 vaccine for those who received their last dose of the vaccine at least six months prior and who are either 65 or older, at high risk for severe COVID-19, or in high exposure occupations. The FDA also authorized a booster dose of the Johnson & Johnson vaccine for adults who received their initial Johnson & Johnson vaccine at least two months prior and also authorized “mix and match” booster doses for approved or authorized vaccines. These more recent developments occurred while the survey was in the field.

There appears to be some uncertainty among fully vaccinated adults around eligibility for a booster dose. Four in ten fully vaccinated adults (40%) say they are unsure whether or not they are eligible for a booster dose. While 21% of fully vaccinated adults ages 65 and older say they have already gotten a booster dose and another 52% believe they are eligible, young adults are more uncertain with two-thirds of fully vaccinated adults ages 18-29 (67%) saying they are unsure if they are eligible for a vaccine.

Four In Ten Fully-Vaccinated Adults Are Unsure About Whether They Are Eligible To Get A COVID-19 Booster Dose

As the FDA booster authorizations and CDC recommendations for eligibility evolve, most fully vaccinated adults say they will definitely (43%) or probably (24%) get a booster once it is recommended for people like them. As we found in September, partisans differ in their intentions to get a booster dose of the vaccine even among fully vaccinated adults, with Democrats more than twice as likely as Republicans to say they’ll “definitely” get one if recommended (55% vs. 26%). Indeed, nearly four in ten (38%) fully vaccinated Republicans say they will probably or definitely not get a booster if the FDA and CDC recommend it for people like them.

Most Fully-Vaccinated Adults Say They Will Get A Booster Dose Of The COVID-19 Vaccine, Though Nearly Four In Ten Republicans Say They Won't

COVID-19 Vaccine Requirements

Across the country, more and more business, universities, and state and local governments are instituting COVID-19 vaccination requirements. In September, President Biden announced a requirement for all federal government employees and contractors to be vaccinated and for employers with 100 or more employees to either require their workers to provide proof of vaccination or regular COVID testing. And recently in California, Governor Gavin Newsom announced that COVID-19 vaccinations will be required for students attending public school once the vaccines are fully approved by the FDA for their age group.

Workers’ Experiences and Preferences

One in four workers (25%) say their employer has required them to get the COVID-19 vaccine, up 16 percentage points since June when just 9% said their employer had required vaccination. Notably, adults with a household income of $90,000 or more are more likely than those with incomes below $40,000 to say their employer has required them to get a COVID-19 vaccine (31% vs. 18%).

While the share saying they are currently subject to an employer vaccine mandate has increased since July, half of all workers say their employer has not required them to get a COVID-19 vaccine and that they do not want their employer to require vaccination, the same share who said this in September. Divisions remain by partisanship and vaccination status, with large majorities of Republicans (72%) and unvaccinated workers (90%) saying they do not want their employer to require employees to get vaccinated whereas most Democrats and vaccinated workers say their employer has either required them to get the vaccine or say they want their employer to impose such a requirement.

A Quarter Of Workers Say Their Employer Has Required Them To Get Vaccinated, While Half Say They Do Not Want A Vaccine Requirement

The Biden Administration’s COVID-19 action plan announced in September included a requirement for larger employers with more than 100 employees to make sure their workers get vaccinated for COVID-19 or require unvaccinated workers to get tested at least weekly and to give workers paid time off to get a COVID-19 vaccine and recover from side effects. While majorities across partisans, race/ethnicity, and income support the requirement for paid time off, there are differences in support for the “vaccination or testing” requirement. More than seven in ten Black (78%) and Hispanic adults (71%) support the federal government requiring larger employers to ensure their employees are vaccinated or providing weekly COVID tests, compared to about half of White adults (49%) who say the same. Similarly, those with household incomes under $40,000 (68%) are more likely than higher income adults to support the federal requirements for larger businesses to mandate vaccination or testing for employees.

When unvaccinated workers are asked what they would do if their employer required them to either get the COVID-19 vaccine or undergo weekly COVID-19 testing, 11% say they would be most likely to get the vaccine, a plurality (46%) say they would opt for weekly testing, and over a third (37%) say they would be likely to leave their job. Among all adults, this translates to 1% who would get the vaccine if faced with an employer mandate and 5% who say they would leave their job. However, if their employer did not offer an option for weekly tested, the share of unvaccinated workers who say they would get the vaccine increases to 17% (2% of all adults) and the share saying they would leave their job increases to 72% (9% of all adults).

More Than A Third Of Unvaccinated Workers Say They Would Leave Their Job If Their Employer Required Vaccination Or Testing, Rising To Seven In Ten If No Testing Option Was Available

About six in ten unvaccinated workers (59%) say they would be likely to apply for an exemption if their employer required them to get the COVID-19 vaccine, including 44% who say they would be “very likely” to do so. Nearly four in ten (38%) say they would be either “very” or “somewhat” unlikely to apply for an exemption. When asked what type of exemption they would apply for, about one in four unvaccinated workers (27%) say they would apply for a religious exemption, one in six (16%) say they would apply for a medical exemption, while the remainder say they would apply for some other kind of exemption, multiple types, or they are unsure.

Despite numerous reports of employees leaving their jobs due to employer-imposed vaccination requirements, only 5% of unvaccinated adults say they have left a job because an employer required them to get vaccinated, accounting for 1% of adults nationwide. A larger share (24%) of all adults say they know someone who has a left a job due to an employer vaccination requirement, with Republicans more than twice as likely as Democrats to say they know someone who has done so (32% vs. 14%).

A Third Of Republicans Say They Know Someone Who Has Left A Job Because Of An Employer Vaccine Mandate

A Return To Normal?

As the holiday season approaches with the COVID-19 Delta variant still present but waning, nearly half of the public say they have either basically returned to normal when it comes to the activities they were doing before the pandemic (43%) or offered that they never really changed their activity level to begin with (6%). A further 35% say they have returned to “doing some, but not all,” of their pre-pandemic activities, and about one in six (15%) say they are still “doing very few of the activities” they did before the pandemic.

Some groups report being more cautious than others in their return to pre-pandemic activities. Most Democrats say they are “doing some, but not all” of the activities they did before the pandemic (44%) or say they are doing few of their pre-pandemic activities (20%), whereas most Republicans say they have “basically returned to normal” (63%) or never changed their activity level during the pandemic (11%). Similarly, vaccinated adults are less likely than their unvaccinated counterparts to say they have “basically returned to normal.” Notably, Black and Hispanic adults (groups that have been particularly hard hit by COVID-19) are more likely than White adults to say they are doing very few of their pre-pandemic activities.

Nearly Half Of The Public, Including Most Republicans And Unvaccinated Adults Are Doing Their Pre-Pandemic Activities

Holiday Plans In The Midst Of A Pandemic

With the holiday season approaching, some adults are still not ready to return to their “normal” holiday activities. About one in six adults (15%) say they will not be traveling for the holidays specifically due to concerns about the pandemic and about one in five (22%) say they will not be attending holiday gatherings with more than ten people this year due to pandemic concerns.

One In Five Adults Say They Won't Be Attending A Large Holiday Gathering Due To Concerns About The Pandemic

Mirroring their more cautious approach to returning to their normal pre-pandemic activities, Democrats (36%) are more than twice as likely as independents (17%) and five times as likely as Republicans (7%) to say they will avoid attending large holiday gatherings due to concerns about the pandemic. Likewise, vaccinated adults are about twice as likely as those who are unvaccinated to say they will not be traveling for the holidays (18% vs. 7%) or attending a holiday gathering with more than ten people (25% vs. 12%) due to concerns about the pandemic.

Democrats And Vaccinated Adults Are More Likely To Report Altered Holiday Plans Due To COVID-19 Concerns

While some people remain hesitant to partake in their usual holiday activities, most parents (56%) say their children will be trick-or-treating for Halloween this year. About one in eight parents say their children will not be doing so due to COVID-19 concerns (about one-quarter say their child will not be trick-or-treating for other reasons). Hispanic parents are about eight times more likely than their White counterparts to say their children will not be trick-or-treating this year because of concerns about COVID-19 (34% vs. 4%). Similarly, nearly three in ten parents who are Democrats or lean towards the Democratic Party say their children will not be going trick-or-treating on Halloween due to concerns about the virus, compared to just 2% of Republican and Republican-leaning parents who say the same. Notably, parents without a college degree (17%) and those with a household income under $40,000 (24%) are more likely than their counterparts with higher educational attainment and income to say their children will not be trick-or-treating this year due to COVID-19 concerns.

Lower Income, Hispanic, And Democratic-Leaning Parents More Likely To Say Kids Won't Be Trick-Or-Treating Due To COVID Concerns

Economic Impact Of The Pandemic

The pandemic continues to impact the public’s economic outlook as majorities see both the spread of COVID-19 (57%) and government restrictions aimed at slowing its spread (55%) as hindering economic growth in their area. While about six in ten Democrats and independents and about half of Republicans say the spread of COVID-19 is holding back economic growth in their area, there are larger partisan differences when it comes to government restrictions aimed at limiting the spread of the virus. About three in four Republicans (76%) say government restrictions are holding back economic growth in their area compared to a third of Democrats and a slight majority of independents (56%) who say the same. Notably, nearly two-thirds of rural residents (64%) say government restrictions aimed at limiting the spread of COVID-19 is holding back economic growth in their area, compared to about half of suburban (55%) and urban (51%) residents.

Majorities Say The Spread Of COVID-19 And The Government Restrictions Aimed At Slowing Its Spread Are Holding Back Economic Growth In Their Area

COVID-19 Treatments

A new pill, created by the pharmaceutical company Merck, provides antiviral support against mild to moderate COVID-19 cases, helping to prevent them from developing into more severe cases. While not yet available to the public, many are hopeful this will help control the impact of the virus among unvaccinated populations. The latest Vaccine Monitor finds that 9% of adults have heard “a lot” about the new COVID-19 pill, 17% “some,” about a quarter (24%) have heard “a little.” Half (49%) say they have not heard anything at all.

Nearly Half Of Adults Have Heard Nothing At All About New Merck COVID-19 Pill

Among those who have heard at least a little about the Merck pill, about half correctly believe it reduces symptoms after infection, compared to 19% who think it prevents COVID-19 infections, and 28% who are unsure what it does. Among those who have heard about the Merck COVID-19 pill, vaccinated adults are more likely to have the correct information about the Merck pill, with 57% believing it reduces symptoms compared to 38% of unvaccinated adults.

About Half Of Adults Who Have Heard Of The Of Merck COVID-19 Pill Know That It Reduces COVID-19 Symptoms After Infection

But the existence of the pill is unlikely to change much in terms of vaccination rates, with nine in ten (89%) of unvaccinated adults who have heard about the Merck pill saying it won’t make a difference in how likely they are to get vaccinated for COVID-19. Few say the pill will make them either “more likely” (5%) or “less likely” (6%) to get the vaccine.

Methodology

This KFF COVID-19 Vaccine Monitor was designed and analyzed by public opinion researchers at the Kaiser Family Foundation (KFF). The survey was conducted October 14-24, 2021, among a nationally representative random digit dial telephone sample of 1,519 adults ages 18 and older (including interviews from 309 Hispanic adults and 305 non-Hispanic Black adults), living in the United States, including Alaska and Hawaii (note: persons without a telephone could not be included in the random selection process). Phone numbers used for this study were randomly generated from cell phone and landline sampling frames, with an overlapping frame design, and disproportionate stratification aimed at reaching Hispanic and non-Hispanic Black respondents as well as those living in areas with high rates of COVID-19 vaccine hesitancy. Stratification was based on incidence of the race/ethnicity subgroups and vaccine hesitancy within each frame. High hesitancy was defined as living in the top 25% of counties as far as the share of the population not intending to get vaccinated based on the U.S. Census Bureau’s Household Pulse Survey.  The sample also included 87 respondents reached by calling back respondents that had previously completed an interview on the KFF Tracking poll at least nine months ago. Another 46 interviews were completed with respondents who had previously completed an interview on the SSRS Omnibus poll (and other RDD polls) and identified as Hispanic (including 23 in Spanish) or non-Hispanic Black (n=62). Computer-assisted telephone interviews conducted by landline (168) and cell phone (1,351, including 1,038 who had no landline telephone) were carried out in English and Spanish by SSRS of Glen Mills, PA. To efficiently obtain a sample of lower-income and non-White respondents, the sample also included an oversample of prepaid (pay-as-you-go) telephone numbers (25% of the cell phone sample consisted of prepaid numbers) Both the random digit dial landline and cell phone samples were provided by Marketing Systems Group (MSG). For the landline sample, respondents were selected by asking for the youngest adult male or female currently at home based on a random rotation. If no one of that gender was available, interviewers asked to speak with the youngest adult of the opposite gender. For the cell phone sample, interviews were conducted with the adult who answered the phone. KFF paid for all costs associated with the survey.

The combined landline and cell phone sample was weighted to balance the sample demographics to match estimates for the national population using data from the Census Bureau’s 2019 U.S. American Community Survey (ACS), on gender, age, education, race, Hispanic origin, and region, within race-groups, along with data from the 2010 Census on population density. The sample was also weighted to match current patterns of telephone use using data from the July-December 2020 National Health Interview Survey The weight takes into account the fact that respondents with both a landline and cell phone have a higher probability of selection in the combined sample and also adjusts for the household size for the landline sample, and design modifications, namely, the oversampling of potentially undocumented respondents and of prepaid cell phone numbers, as well as the likelihood of non-response for the re-contacted sample. All statistical tests of significance account for the effect of weighting.

The margin of sampling error including the design effect for the full sample is plus or minus 3 percentage points. Numbers of respondents and margins of sampling error for key subgroups are shown in the table below. For results based on other subgroups, the margin of sampling error may be higher. Sample sizes and margins of sampling error for other subgroups are available by request. Sampling error is only one of many potential sources of error and there may be other unmeasured error in this or any other public opinion poll. Kaiser Family Foundation public opinion and survey research is a charter member of the Transparency Initiative of the American Association for Public Opinion Research.

This work was supported in part by grants from the Chan Zuckerberg Initiative DAF (an advised fund of Silicon Valley Community Foundation), the Ford Foundation, and the Molina Family Foundation. We value our funders. KFF maintains full editorial control over all of its policy analysis, polling, and journalism activities.

GroupN (unweighted)M.O.S.E.
Total1,519± 3 percentage points
COVID-19 Vaccination Status
Have gotten at least one dose of the COVID-19 vaccine1,090± 4 percentage points
Have not gotten the COVID-19 vaccine406± 6 percentage points
Race/Ethnicity
White, non-Hispanic794± 4 percentage points
Black, non-Hispanic305± 7 percentage points
Hispanic309± 7 percentage points
Party Identification
Democrats460± 6 percentage points
Republicans341± 7 percentage points
Independents475± 6 percentage points
Child Age Groups
Parents or guardians of children under 18393± 6 percentage points
Parents or guardians of children ages 12-17202± 9 percentage points
Parents or guardians of children ages 5-11219± 9 percentage points

Endnotes

  1. COVID-19 Vaccines While Pregnant or Breastfeeding (U.S. Centers for Disease Control and Prevention, June 29, 2021). Accessed October 25, 2021.https://www.cdc.gov/coronavirus/2019-ncov/vaccines/recommendations/pregnancy.html   ↩︎