News Release

“Breakthrough” COVID-19 Hospitalizations Among Fully Vaccinated Patients Occur Most Often among Older Adults and Involve People with Chronic Health Conditions

Compared to Hospitalizations of Unvaccinated Patients, Breakthrough Cases Involve Shorter Stays on Average and Appear More Likely to Be Hospitalized Primarily for Non-COVID Ailments

Published: Dec 15, 2021

“Breakthrough” hospitalizations involving COVID-19 among people who are fully vaccinated against the disease most often affected older adults and people with other chronic health conditions, finds a new analysis of hospital data from June through September by KFF and Epic Research.

More than two-thirds (69%) of breakthrough COVID-19 hospitalizations occurred among people ages 65 and older, who are more likely than younger age groups to have gotten vaccinated. A fifth (21%) of breakthrough hospitalizations occurred among people ages 50-64, while 10% occurred among younger adults.

COVID-19 hospitalizations among people who were not fully vaccinated skew much younger, with about 3 in 10 (30%) involving patients ages 50-64 and 4 in 10 (41%) involving patients under age 50.

The analysis examines data from June to September from Epic’s Cosmos research platform, which includes data for more than 120,000 hospitalizations with a COVID diagnosis during the four-month period. Patients are considered “fully vaccinated” if they received a dose of Johnson & Johnson vaccine or two doses of the Pfizer or Moderna vaccine at least two weeks before they were hospitalized, regardless of whether they were eligible for or received a booster shot.

Compared to those who are unvaccinated, a small share (15%) of hospital admissions for COVID-19 during the four-month period involve people who were fully vaccinated against the disease.

Other findings include:

  • Larger shares of fully vaccinated adults hospitalized with breakthrough COVID-19 had selected chronic conditions including, hypertension, diabetes, heart failure, or chronic obstructive pulmonary disease) compared to those hospitalized with COVID-19 who were not fully vaccinated.
  • Fully vaccinated people who are hospitalized with breakthrough COVID-19 are less likely than those who are not fully vaccinated to have COVID-related complications such as viral pneumonia or respiratory failure, or to receive a ventilator or dexamethasone treatment. This suggests that fully vaccinated patients with COVID-19 diagnoses may be somewhat more likely to be in the hospital primarily for reasons other than COVID-19.
  • Fully vaccinated people with breakthrough infections had shorter hospital stays compared to others in their age group who were not fully vaccinated. For example, among those at least 65 years old with COVID-19, the median stay was 5.6 days for those who were fully vaccinated compared to 6.7 days for those who were unvaccinated or partly vaccinated.

The analysis is available on the Peterson-KFF Health System Tracker, an online information hub dedicated to monitoring and assessing the performance of the U.S. health system

News Release

New Analysis of Historical Rates of Medicaid Enrollment Churn Sheds Light on the Implications for the End of the Continuous Enrollment Requirement Tied to Pandemic Funding

Published: Dec 14, 2021

For more than a year-and-a-half, the continuous enrollment requirement tied to enhanced Medicaid funding during the COVID-19 pandemic has all but halted enrollment “churn,” the temporary loss of coverage in which people disenroll from Medicaid and then re-enroll within a short period of time.

Such disenrollments are expected to resume once the requirement ends and states begin processing Medicaid eligibility redeterminations. Individuals may lose coverage if they are no longer eligible or face barriers during the redetermination process, such as providing required documentation.

A new KFF analysis that examined churn rates before the pandemic finds that about 10 percent of full-benefit Medicaid enrollees experienced a gap in coverage of less than a year. Rates, which varied by state, were higher for children and adults compared to the elderly and people with disabilities. Federal rules and state policy decisions on resuming disenrollments will influence churn rates following the end of the continuous enrollment requirement.

All of this is important context for the debate over the Build Back Better Act (BBBA) in Congress. The House-passed version of the bill includes provisions to phase out the continuous enrollment requirement for Medicaid, with rules that would limit how aggressively states could disenroll people. For example, states could only disenroll individuals who have been enrolled at least 12 consecutive months and must limit eligibility redeterminations to no more than one-twelfth of all enrollees per month through September 2022. States could not disenroll individuals based on returned mail unless there were at least two failed attempts to contact the individual by at least two different methods (e.g., mail and text messages).

The BBBA also would require states to extend 12-month continuous coverage for children in Medicaid and CHIP (currently an option for states) and would require 12-month continuous coverage for postpartum individuals, a change from the current requirement of 60-day postpartum coverage and a temporary option provided to states through the American Rescue Plan Act (ARPA).

For the full analysis about historical rates of Medicaid enrollment churn and a summary of BBBA provisions that would limit a return to churn, visit kff.org.

Medicaid Enrollment Churn and Implications for Continuous Coverage Policies

Authors: Bradley Corallo, Rachel Garfield, Jennifer Tolbert, and Robin Rudowitz
Published: Dec 14, 2021

Issue Brief

Recent policy actions and proposals in Medicaid have renewed focus on the problem of churn, or temporary loss of coverage in which enrollees disenroll and then re-enroll within a short period of time. The Families First Coronavirus Response Act (FFCRA) passed during the coronavirus pandemic requires states to provide continuous coverage to Medicaid enrollees until the end of the month in which the public health emergency (PHE) ends to receive enhanced federal funding. During this time, people did not churn on and off Medicaid, but churn may resurface when the continuous enrollment requirement ends. The Build Back Better reconciliation bill under consideration in Congress would begin to phase out the continuous enrollment requirement and the enhanced match beginning April 1, 2022. Additionally, the bill would require states to provide 12-month continuous coverage for children and for postpartum individuals in Medicaid and the Children’s Health Insurance Program (CHIP), which could reduce churn for those groups. Currently more than half of states already provide 12-month continuous coverage for children on an optional basis.

To help inform the current policy discussion, this brief provides estimates of churn for people enrolled in Medicaid in 2018. We use 2017 and 2019 as look-back and look-ahead years, respectively, so we can examine what happens to people a full year before and after an enrollment date or disenrollment date in 2018. We also provide estimates of churn by eligibility group and compare rates in Medicaid expansion versus non-expansion states. Overall, we find that 10% of full-benefit enrollees have a gap in coverage of less than a year, and rates are higher for children and adults compared to aged and people with disabilities. Churn rates also vary substantially by state, ranging from 5% or less in some states to 15% or more in others. Churn has implications for access to care as well as administrative costs faced by states. Detail on the data and methods underlying this analysis are in the Methods section at the end of the brief.

Background

The temporary loss of Medicaid coverage in which enrollees disenroll and then re-enroll within a short period of time, often referred to as “churn,” occurs for a several reasons. Enrollees may experience short-term changes in income or circumstances that make them temporarily ineligible. Alternatively, some people who remain eligible may face barriers to maintaining coverage due to renewal processes and periodic eligibility checks. Eligible individuals are at risk for losing coverage if they do not receive or understand notices or forms requesting additional information to verify eligibility or do not respond to requests within required timeframes.

Some enrollees may be at higher risk of churn than others. Working individuals whose monthly income fluctuates may be more likely to experience churn in states that have adopted frequent electronic data matches during the year. For example, adult enrollees without disabilities, most of whom are working, may have irregular work hours, overtime, or multiple part-time jobs that can lead to month-to-month changes in income. In contrast, elderly adults and people with disabilities, particularly those who qualify for Supplemental Security Income (SSI), are less likely to experience monthly income changes or other changes in circumstances. Most states conduct data matches on a periodic basis to identify changes in circumstances between annual renewal periods. If the data checks identify changes in income or other factors that affect eligibility and the individual is unable to resolve the discrepancy within the specified timeframe (often limited to within 10 days from the date of the notice), the person can be disenrolled from coverage.

Churn can result in access barriers as well as additional administrative costs. When individuals who remain eligible for coverage are disenrolled, they may experience gaps in coverage that could limit access to care and lead to delays in getting needed care. Research indicates that enrollees who experience fluctuations in coverage are more likely to report difficulties getting medical care and are more likely to end up in the hospital with a preventable condition. In addition, there are administrative costs associated with disenrolling an enrollee and then subsequently processing a new application.

What are the rates of churn in Medicaid?

Among full-benefit beneficiaries enrolled at any point in 2018, 10.3% had a gap in coverage of less than a year. About 4.2% were disenrolled and then re-enrolled within three months and 6.9% within six months (Figure 1).

One In Ten Medicaid/CHIP Enrollees Disenrolled And Then Re-enrolled In Less Than One Year, And Many Of Them Did So In Less Than Six Months.

Rates of churn were higher for children and adults compared to aged adults and people with disabilities (Figure 2). We estimate that 11.2% of full-benefit children and 12.1% of adults were disenrolled and then subsequently re-enrolled within one year. Analysis also shows that rates of churn are higher for enrollees with partial benefit packages, but there are similar churn rates across expansion and non-expansion states (Appendix Table 1). However, there is considerable variation in churn rates across states, with 4 states (HI, AZ, DC, and NC) having 5% of enrollees or fewer disenrolling and then re-enrolling within a year, and 4 states (TX, WI, NH, and PA) having 15% of enrollees or more disenrolling and re-enrolling within a year.

The Highest Churn Rates Were Among Adult Eligibility Groups And Children In Medicaid/CHIP.

The continuous enrollment requirement related to the coronavirus pandemic has all but halted Medicaid churn for the past year and a half, but disenrollments are expected resume once the requirement ends. In part due to the continuous enrollment requirement, Medicaid/CHIP enrollment has increased from February 2020 to May 2021 by 11.5 million (or 16.2%) to 82.8 million individuals. However, when the continuous enrollment requirement ends, states will begin processing renewals and individuals may lose coverage if they are no longer eligible or face barriers during the redetermination process, such as providing required documentation.

The Build Back Better Act (BBBA) that is currently being debated in Congress would phase out the continuous enrollment requirement beginning April 1, 2022. To continue receiving a phased-down enhanced federal match rate, states would be required to follow rules about disenrolling people that could help to reduce rates of churn. For example, states could only disenroll individuals who have been enrolled at least 12 consecutive months and must limit eligibility redeterminations to a set proportion of enrollees each month through September 2022. States could not disenroll individuals based on returned mail unless there were at least two failed attempts to contact the individual through at least two modalities (e.g., mail and text messages). States would also have to report monthly data on call center statistics (average volume, wait times, and abandonment rates) as well as rates of eligibility renewals, redeterminations, and coverage terminations due to changes in circumstances (e.g., increased income) or due to administrative reasons (e.g., failing to provide required documentation).

Prior to the pandemic, some states had adopted policies and processes to reduce churn and promote continuous coverage. For example, as of January 2020, 35 states account for anticipated income changes, such as recurring seasonable employment or a job change, when determining eligibility at renewal. Some states also use projected annual income for the remainder of the calendar year when determining ongoing eligibility at renewal or when an individual has a potential change in circumstances between renewal periods. States can also implement processes that improve communications with enrollees to help prevent them from losing coverage because they do not receive or respond to notices from the state. Such actions include conducting regular data matches with the U.S. Postal Service National Change of Address Database, working with managed care plans and providers to update enrollees’ address information, and calling enrollees or sending email or text notifications when returned mail from a notice sent to an enrollee is received.

The BBBA would require states to implement 12-month continuous coverage for children and postpartum individuals. States have the option to provide 12 months of continuous coverage for children. Under this option, states allow a child to remain enrolled for a full year unless the child ages out of coverage, moves out of state, voluntarily withdraws, or does not make premium payments. As such, 12-month continuous eligibility eliminates coverage gaps due to fluctuations in income over the course of the year. A recent MACPAC analysis found that states with 12-month continuous coverage for children had lower rates of churn among children enrolled in Medicaid and CHIP compared to states without this policy. Currently, 34 states provide 12-month continuous eligibility to at least some children in either Medicaid or CHIP. The Build Back Better Act would require states to extend 12-month continuous coverage for children in Medicaid and CHIP and would also require 12-month continuous coverage for postpartum individuals, a change from the current requirement of 60-day postpartum coverage.

Methods

Data Source and Linkage

Our analysis is based on the Transformed Medicaid Statistical Information System (T-MSIS) Analytic Files (TAF) Research Identifiable Files (RIF). We include beneficiaries who were enrolled at any point in 2018. We use the 2018 Demographic Eligibility (DE) Base file to determine eligibility pathway based on last-best eligibility data. We draw enrollment dates from the 2017-2019 DE Dates files. Our analysis uses enrollment dates from 2017 and 2019 for look-back and look-ahead years, respectively, so that we can examine what happens to enrollees a full year before and after an enrollment start date or disenrollment date in 2018. Data for 2019 are from the preliminary version of the T-MSIS RIF. All other DE Base and DE Dates files are final versions (Release 1).

State Exclusion Criteria

We use 41 states in our analysis. We exclude 10 states (FL, IN, KY, ME, MS, NE, OK, OR, UT, and WY) due to missing or inconsistent data based on state-level information available at the DQ Atlas as well as our own analysis. We relied on data quality assessments from DQ Atlas to exclude states that have a “medium concern”, “high concern”, or “unusable” data quality assessment for: (1) the average monthly Medicaid/CHIP enrollment compared to an external enrollment benchmark (Medicaid/CHIP Performance Indicator Data) (five states (IN, KY, ME, MS, NE)); (2) the average length of enrollment gaps, and (3) the percent of beneficiaries with overlapping Medicaid and S-CHIP enrollment spans (no states were excluded based on measures 2 or 3). We further excluded states based on: (4) the percent of beneficiaries missing an eligibility group code (threshold of >=10%, excluded OR); (5) the percent of beneficiaries with only one enrollment span (threshold of >=99.5, excluded FL, KY, and WY); and (6) the percent of beneficiaries with three or more enrollment spans in a year (threshold of >=5%, excluded OK). Notably, our exclusion criteria for related to the number of enrollment spans in a year are less restrictive than that in the DQ Atlas because we did not want to make assumptions about the number of enrollment spans in our analysis, but did want to remove extreme cases that are the most likely to represent inaccurate enrollment dates.

For analysis that includes restricted benefit enrollees, we further excluded two states (CA and ND) due to large amounts of missing data among restricted benefit enrollees. CA was excluded because roughly 75% of observations coded with restricted benefits in the DE Base file were missing a federal identifier (BENE_ID). ND was excluded due to large amounts of missing enrollment data in the DE Dates files and, after merging the DE Dates and DE Base files, more than half (53%) of restricted benefit enrollees in the DE Base file did not have a matching BENE_ID in the DE Dates file and were dropped from the analysis.

Beneficiary Linking, Eligibility Classification, and Exclusion

We linked individuals across years using BENE_ID, which are unique enrollee identifiers created by the Chronic Conditions Warehouse and are recommended for use when combining data for multiple years. We also use BENE_ID to link the DE Base and DE Dates files. We assigned restricted benefit status and eligibility group code using a last-best approach for 2018, which assigns eligibility based on the most recent eligibility code in 2018. We classified eligibility groups using a hierarchy that first checked if the eligibility group code was missing, then for medically needy eligibility, disability (under age 65), and expansion adult. Any enrollees in the DE Base file that had a non-missing eligibility code and had not been assigned an eligibility group through this hierarchy were then were assigned by age to children (ages 20 and under), adults (ages 21 to 64), and aged (ages 65 and over).

The 2018 DE Base files for 41 states in our analysis contained 82.9 million observations after removing a small number of “dummy” records that represent enrollees who have claims data but no eligibility data provided by the states. We removed observations missing eligibility codes or restricted benefit status codes (624,000 observations), people qualifying through a medically needy pathway (1.7 million observations), people missing a BENE_ID for linking files (3.1 million observations), and people with duplicated BENE_ID (262,000 observations). After merging with the DE Dates files, there were less than 5,000 enrollees who did not have a matching BENE_ID in the DE Dates and DE Base files and were dropped from the final sample. Our final sample included 77.2 million unduplicated enrollees. Of these, 71.3 million were full-benefit enrollees. Our analysis of restricted benefit enrollees included 5.4 million people in the 39 states included in that component of the analysis.

Calculating Churn

The DE Dates files provide a start and end date for every enrollment span in our time period. As noted above, our analysis uses enrollment dates from 2017 and 2019 for look-back and look-ahead years for a more complete picture of churning. Before calculating churn rates, we first merged all overlapping and contiguous enrollment spans for enrollees, which we defined as enrollment spans that are separated by one day or less. For example, if a person has two enrollment spans with an end date and a start date that are one day apart (i.e., the person disenrolled and re-enrolled the next day), we considered these spans to be contiguous and merged them into one enrollment span. After merging overlapping and contiguous spans, we identified enrollment gaps, which we defined as the number of days between two enrollment spans for an enrollee. To be counted as “churn” in our analysis, a person would have had (1) an enrollment gap of 365 days or less and (2) and enrollment gap that started or ended in 2018. For example, a person that disenrolled in 2017 but then re-enrolled within 365 days in 2018 would be included in our churn estimates. Similarly, a person who disenrolled in 2018 and then re-enrolled in less than 365 days would also be counted in our churn estimates. Sensitivity analyses that only included gaps longer than 31 days showed a marginal decrease in churn rates (approximately 1 percentage point); while shorter gaps could reflect data reporting errors, they also could be true disenrollments followed by relatively quick re-enrollment.

Previous studies have estimated Medicaid churn rates at around 10%. There is some variation across studies due to use of different data sources, national versus state-specific estimates, and the focus on different populations (e.g., children versus adults). A recent analysis from MACPAC, which used the same data source but different methods as our analysis found that 8% of Medicaid and CHIP enrollees re-enrolled in coverage within one year of disenrolling. The most significant difference in our methods from MACPAC analysis was that the MACPAC analysis only utilized a look-ahead year, while our analysis includes a look-ahead year and a look-back year. There are other differences in methods from MACPAC’s analysis, but those likely have a smaller impact than the use of a look-back year. Our estimate of a 10% churn rate overall is also similar to estimates of 9% and 11% from studies of churn in specific states.

Appendix

Appendix Table 1: Percent of Medicaid/CHIP Enrollees Who Disenrolled And Then Re-Enrolled Within Varying Time Periods For Various Populations, 2018
Appendix Table 2: Percent of Medicaid/CHIP Enrollees Who Disenrolled And Then Re-Enrolled Within Varying Time Periods by Eligibility Group, 2018

Medicaid Outpatient Prescription Drug Trends During the COVID-19 Pandemic

Published: Dec 14, 2021

Issue Brief

Introduction

The Build Back Better Act (BBBA) includes several prescription drug provisions; while much of the focus has been on Medicare and private insurance, the bill includes a number of provisions with implications for Medicaid prescription drug spending. Before the pandemic, Medicaid outpatient prescription drug utilization, measured in terms of the number of prescriptions, was decreasing while Medicaid gross spending on prescription drugs was increasing. COVID-19 and social distancing practices changed health care needs and utilization, in turn impacting Medicaid prescription drug utilization and spending in 2020. Further, Medicaid enrollment has increased throughout the pandemic, which could influence Medicaid prescription drug trends. This issue brief describes Medicaid prescription drug utilization and spending trends in calendar year 2020 compared to previous years to explore how the pandemic impacted Medicaid prescription drug utilization and spending. This brief builds on a previous KFF analysis of Medicaid prescription drug trends using the most recent data available.

Medicaid outpatient prescription drug utilization decreased during the pandemic. Overall, there were a total of 703.6 million Medicaid outpatient prescriptions in 2020, which is down from 734.1 million prescriptions in 2019 (Figure 1). While outpatient prescription drug utilization started to decline even before the pandemic, the decline from 2019 to 2020 (4.2%) was greater than the decline from 2018 to 2019 (0.8%). Immediately following the onset of the COVID-19 pandemic, Medicaid prescription drug utilization dropped in the second quarter (April – June) of 2020, experiencing a 10.1% decrease in prescription drug utilization compared to the same quarter in 2019 (Figure 2). Utilization was higher in the third and fourth quarters of 2020, but still below 2018 and 2019 levels. This decrease in outpatient drug utilization occurred as Medicaid enrollment increased by 12.5% between February 2020, right before the pandemic began, and December 2020.

Percent Change in Number of Medicaid Outpatient Prescriptions from Previous Year, 2018-2020
Number of Medicaid Outpatient Prescriptions by Quarter, 2018-2020

Prescription drug utilization trends varied across drug groups in 2020. The same drug groups comprise the top ten most prescribed drug groups in 2019 and 2020, but the order changed (Table 1). Among the top ten most prescribed drug groups in 2020, seven experienced declines in utilization and three experienced increases. Drug groups that saw large utilization declines from 2019 to 2020 compared to 2018 to 2019 included antibiotics, allergy immunotherapy and antihistamines, sympathomimetic agents, and adrenals and combinations. Further, analgesics/antipyretics, which include opioids, were declining before the pandemic and continued to decline in 2020. On the other hand, three drug groups, psychotherapeutics, anticonvulsants, and antidiabetic agents, saw increases in drug utilization from 2019 to 2020, which could be due to the routine nature of the drugs that comprise these groups. Psychotherapeutic agents were the most prescribed drug group in 2020 and experienced a 4% increase in utilization, which mirrors national trends and the increase in mental health challenges throughout the pandemic.

Table 1: Top Ten Drug Groups by Number of Medicaid Prescriptions

While utilization declined, Medicaid spending on outpatient prescription drugs before rebates1  increased in 2020. Overall, Medicaid paid $73.4 billion before rebates for outpatient prescription drugs in 2020, which is up from $69.1 billion in 2019 (Figure 3). Medicaid gross spending on prescription drugs increased 9.8% from 2018 to 2019 compared to 6.2% from 2019 to 2020, indicating spending increases may have slowed somewhat due to the pandemic. Immediately following the onset of the COVID-19 pandemic, the second quarter (April – June) of 2020 saw the lowest spending, which mirrors the dip in utilization in the same quarter, though Q2 2020 spending was still above Q2 spending in previous years (Figure 4). Gross spending rebounded and was higher in the third and fourth quarters of 2020 than in the first quarter of 2020.

Percent Change in Gross Spending on Medicaid Outpatient Prescriptions from Previous Year, 2018-2020
Gross Spending on Medicaid Outpatient Prescriptions by Quarter, 2018-2020

Gross Medicaid spending continued to increase for almost all of the most costly drug groups before rebates in 2020. The same drug groups comprise the top ten most costly drug groups before rebates in 2019 and 2020, but the order changed (Table 2). Antivirals were consistently the most costly drug group in Medicaid before rebates from 2015 to 2019, driven by spending for drugs used to treat HIV and hepatitis C drugs; however, antiviral spending declined from 2019 to 2020 and antidiabetic agents became the most costly drug group before rebates in 2020. While not in the top 10 most costly drug groups, respiratory agents, a drug group used to relieve and treat respiratory diseases such as COVID-19, experienced a 61% increase in gross spending and a 44% increase in utilization from 2019 to 2020.2 

Table 2: Top Ten Drug Groups by Gross Medicaid Spending

Despite remaining stable in prior years, net Medicaid prescription drug spending, or spending after rebates, increased in federal fiscal year 2020. While gross Medicaid spending on outpatient prescription drugs increased from 2015 to 2019, rebates also increased during the period, leaving Medicaid net spending in 2019 almost the same as net spending in 2015. However, recent data for the federal fiscal year (FFY) 2020 (October 1, 2019 – September 30, 2020) shows rebates for Medicaid prescription drugs increased by $2.1 billion from FFY 2019 while Medicaid gross spending increased by $3.6 billion, leading to an increase in net Medicaid spending in FFY 2020.3 

Discussion

There are many factors that may have contributed to the decline in prescription drug utilization during the pandemic, including decreases in service utilization, drug adherence, and the diminished spread of illnesses other than COVID-19. Following the onset of the pandemic, there was a drop in emergency department visits, hospital admissions, preventive service utilization, and elective health services. The use of telemedicine increased, but it did not increase enough to make up for the decline in in-person visits. Declines in health care utilization likely led to fewer clinicians writing prescriptions, thus contributing to the decline in Medicaid prescription drug utilization. Additionally, a recent study found US patients were more likely to discontinue use of chronic medications during the pandemic and less likely to begin new medications, signaling changes in drug adherence could have contributed to the decline. Declines across specific drug groups also likely reflects the decline medical service utilization during the pandemic and the impact of COVID-19 mitigation measures. Social distancing lessened the spread of other illnesses, such as the flu, which saw sharp declines in cases and deaths during the pandemic. Antibiotics saw the largest decline (-23%) in utilization from 2019 to 2020 (Table 1), likely due in part to fewer bacterial infections during the pandemic.

Medicaid prescription drug utilization declined at time when Medicaid enrollment was increasing. Administrative data for Medicaid show that after declines in enrollment from 2017 through 2019, total enrollment nationwide began to grow after February 2020, right before the pandemic began. By December 2020, enrollment had increased by 8.9 million, or 12.5%, from actual enrollment in February 2020. The overall number of prescriptions per enrollee per year decreased from approximately ten prescriptions per person in 2019 down to nine in 2020.4 

While prescription drug utilization decreased during the pandemic, Medicaid spending before rebates increased. Overall, 2020 continued with the same utilization and spending trends seen before the pandemic in 2019, but utilization decreased to a larger degree and spending increased to a smaller degree in 2020 compared to 2019. All drug groups in both the top 10 for utilization and gross spending, saw larger growth in their gross spending than in utilization from 2019 to 2020, which contributes to the increase in spending despite declines in utilization overall. Further, increases in gross spending despite decreases in utilization in 2020 may be due in part to decreased use of less costly drugs. For example, antibiotics experienced a 23% decline in use from 2019 to 2020 (Table 1), but antibiotics only made up 2% of gross spending in 2020. Also, despite the pandemic, the number of new drug approvals remained high in 2020, likely contributing to the increase in spending despite decreases in utilization.

Looking Ahead

Medicaid prescription drug policy is likely to remain an issue at both the federal and state levels due to budgetary constraints and the entry of new, high-cost drugs to the market. States remain concerned about specialty and high-cost drugs and report developing strategies and policies to address these drugs. Though much of the focus on the Build Back Better Act (BBBA), recently passed by the House of Representatives and currently being debated in the Senate, has been on Medicare and private insurance prescription drug provisions, the BBBA includes a number of provisions that affect Medicaid prescription drug spending. The BBBA would require retail community pharmacy participation in the National Average Drug Acquisition Cost (NADAC) survey, which could better align pharmacy reimbursement rates with pharmacy actual costs. The BBBA prohibits the implementation of a rule issued by the Trump Administration estimated to increase federal and state Medicaid spending. The rule would have eliminated rebates negotiated between drug manufacturers and pharmacy benefit managers (PBMs) or health plan sponsors in Medicare Part D by eliminating the safe harbor protection under the federal anti-kickback law. The BBBA also proposes to apply the Medicaid Drug Rebate Program to separate state CHIP programs, likely allowing state CHIP programs to receive larger rebates. Lastly, there may be implications for Medicaid prescription drug spending resulting from Medicare proposals in the BBBA that allow the federal government to negotiate prices for some high-cost drugs and implement an inflationary rebate for some drugs under Medicare Part B and Part D.

Appendix

Methodology

This analysis of Medicaid prescription drug utilization and spending trends builds on a previous KFF analysis of Medicaid prescription drug trends using the most recent data available. This analysis uses 2017 through 2020 State Drug Utilization Data (SDUD), downloaded in November 2021, merged with data from IBM Micromedex RED BOOK. The SDUD is publicly available data provided as part of the Medicaid Drug Rebate Program. It provides data on the number of prescriptions, Medicaid spending before rebates, and cost-sharing for rebate-eligible Medicaid outpatient drugs. The RED BOOK data is from September 2021. The use of RED BOOK data does not represent and should not be characterized as a RED BOOK endorsement of any data, findings, or other content presented in this report. The SDUD and the RED BOOK data were merged at the NDC-level to incorporate the therapeutic/pharmacologic category of the product.

Limitations

The SDUD provides spending and utilization data by NDC, quarter, managed care or fee-for-service, and state. It also provides this data summarized for the whole country. CMS has suppressed data cells with fewer than 11 prescriptions, citing the Federal Privacy Act and the HIPAA Privacy Rule. This analysis used the national data because less data is suppressed at the national versus state level.

This analysis uses gross Medicaid spending because rebate data is unavailable to the public at the NDC level. Rebates have a considerable effect on Medicaid drug spending overall, lowering net spending, but this effect varies at the drug level as different drugs receive different rebates. We do include analysis of the Medicaid Budget and Expenditure System’s (MBES) FMR net expenditure data, available for the federal fiscal year, to understand overall Medicaid rebate trends. Additionally, although Medicaid beneficiaries largely self-administer drugs that are prescribed in an outpatient setting, medical practitioners must administer some drugs. Although states are instructed to collect drug rebates on physician-administered outpatient drugs that are not billed as a bundled service, physician-administered drugs subject to a rebate can vary from state to state. Because specialty drugs are often physician-administered, it is possible that the data reflects lower Medicaid spending and utilization of certain drugs of this kind.

Endnotes

  1. Under the Medicaid Drug Rebate Program, manufacturers that want their drugs covered by Medicaid must sign an agreement with the Secretary of Health and Human Services stating that they will rebate a specified portion of the Medicaid payment for the drug to the states, who in turn share the rebates with the federal government. In addition to federal statutory rebates, most states negotiate supplemental rebates. Both statutory and supplemental rebates account for a sizeable share of prescription drug spending, lowering aggregate drug spending by about 55% in 2019. Rebates are not included in this analysis due to lack of data availability (see Appendix for details). While rebates have implications for net Medicaid spending, understanding trends in gross spending and utilization provides important context for pharmacy benefit policy by highlighting underlying cost factors. ↩︎
  2. KFF analysis of 2019-2020 State Drug Utilization Data, November 2021; IBM Micromedex RED BOOK, September 2021. ↩︎
  3. KFF analysis of Medicaid Budget and Expenditure System (MBES) FMR net expenditure data as of September 2021; 2018-2020 State Drug Utilization Data, November 2021; IBM Micromedex RED BOOK, September 2021. ↩︎
  4. KFF analysis of CMS, Medicaid & CHIP: Monthly Application and Eligibility Reports, last updated October 26, 2021; 2019-2020 State Drug Utilization Data, November 2021; IBM Micromedex RED BOOK, September 2021.   ↩︎

Build Back Better Would Change the Ways Low-Income People get Health Insurance

Authors: Cynthia Cox, Jennifer Tolbert, Robin Rudowitz, and Karen Pollitz
Published: Dec 14, 2021

The Build Back Better Act would make a number of changes to the way people get health insurance and how health care is financed, including by temporarily closing the Medicaid coverage gap. Under current law, 2.2 million uninsured people living in the 12 states that have not expanded Medicaid under the Affordable Care Act (ACA) fall into the Medicaid coverage gap, meaning they are generally ineligible for financial assistance to get health coverage.

What are current health coverage options for low-income people?

The ACA expanded health coverage to millions of people, including by expanding Medicaid and creating health insurance Marketplaces with subsidized coverage starting in 2014. The ACA originally intended to expand Medicaid for nearly all adults with incomes below 138% of the poverty level (about $17,770 for a single individual in 2021) and for those with incomes over that level who did not get insurance through work or Medicare to buy health insurance on the Marketplaces with subsidies based on income. However, a 2012 Supreme Court decision effectively made it optional for states to expand Medicaid, and to this day 12 states have not adopted the expansion, leaving many adults (including low-income parents as well as adults without dependent children) without affordable coverage options. Although Wisconsin has not adopted the Medicaid expansion, there is no one in the coverage gap in Wisconsin because the state provides Medicaid to people under 100% of poverty through a waiver.

Under current law, in non-expansion states, non-elderly adults who do not qualify for Medicaid based on disability and who do not have dependent children are not eligible for Medicaid regardless of their income. And, while all Medicaid programs cover parents, the eligibility levels in non-expansion states are very low (the median eligibility level is 40% FPL). Because Marketplace subsidies are only available to those with income above the poverty level, poor adults who are not eligible for Medicaid are also ineligible for subsidized Marketplace coverage, unless they are American Indian or are recent immigrants who would otherwise be eligible for Medicaid.

Adults with incomes over the federal poverty level in non-expansion states are eligible for generous Marketplace subsidies that help with both the monthly premium and deductibles if they are not otherwise eligible for affordable coverage through work or Medicare. The recent COVID-19 relief legislation – the American Rescue Plan Act (ARPA) – increased the amount of financial assistance available to low-income Marketplace enrollees, making those with incomes between 100 and 150% of the poverty level eligible for $0 premium silver plans with very low deductibles. But, the ARPA did not extend these subsidies below the poverty level, meaning the Medicaid coverage gap persists in non-expansion states. The ARPA did however include additional temporary fiscal incentives for states to newly adopt the Medicaid expansion.

How would Build Back Better change health coverage options for low-income people?

If passed, the Build Back Better Act would temporarily close the Medicaid coverage gap by extending Marketplace subsidies below the poverty level in non-expansion states to adults who may not be eligible through a non-expansion pathway. In states that have adopted the expansion, the legislation would increase the federal match rate from 90% to 93% from 2023 through 2025 to encourage states to maintain their expansion status).

In states that do not expand Medicaid, starting in 2022, the ACA Marketplaces subsidies would offer $0 silver plans with reduced cost-sharing. In 2022, people below poverty would have access to 94% actuarial value silver plans with no monthly premium and deductibles typically under $200. (The actuarial value is the share of a typical populations’ costs that are covered by insurance). In 2023 through 2025, silver plan premiums would still be $0, but for those under 138% of poverty, silver plans would have a 99% actuarial value – meaning their plan will have little or no deductible.

Coverage for Low-Income Non-Elderly Adults under the ACA, ARPA, and BBB
IncomeAffordable Care Act(ACA)2014-2020American Rescue Plan Act (ARPA) and ACA

2021-2022

Build Back Better Act (BBB, as proposed) and ACA

2022-2025

Below 100% FPL (not otherwise eligible for Medicaid through non-expansion pathway)*If state expands Medicaid:
  • Medicaid eligible

If state does not expand:

  • Not eligible for financial assistance
If state expands Medicaid:
  • Medicaid eligible

If state does not expand:

  • Not eligible for financial assistance
If state expands Medicaid:
  • Medicaid eligible

If state does not expand:

  • Marketplace eligible (2022-2025)
  • 0% of income for benchmark silver premium (2022-2025)
  • 94% actuarial value first year (2022)
  • 99% actuarial value later years (2023-2025)
100% – 138% FPL (not otherwise eligible for Medicaid through non-expansion pathway)*If state expands Medicaid:
  • Medicaid eligible

If state does not expand:

  • Marketplace eligible
  • About 2% of income for benchmark silver plan premium
  • 94% actuarial value
If state expands Medicaid:
  • Medicaid eligible

If state does not expand:

  • Marketplace eligible
  • 0% of income for benchmark silver plan premium
  • 94% actuarial value
If state expands Medicaid:
  • Medicaid eligible

If state does not expand:

Marketplace eligible

  • 0% of income for benchmark silver plan premium (2022-2025)
  • 94% actuarial value first year (2022)
  • 99% actuarial value later years (2023-2025)
138% – 150% FPL (not otherwise eligible for Medicaid through non-expansion pathway)**
  • Marketplace eligible
  • About 3-4% of income for benchmark silver premium
  • 94% actuarial value
  • Marketplace eligible
  • 0% of income for benchmark silver premium
  • 94% actuarial value
  • Marketplace eligible
  • 0% of income for benchmark silver premium
  • 94% actuarial value
NOTES: *Undocumented immigrants and some legal immigrant adults are not eligible for Medicaid under traditional or expansion pathways. Some pregnant people, parents and people with disabilities may qualify for Medicaid without Medicaid expansion. American Indians and certain immigrants can receive Marketplace subsidies. In 2021, anyone eligible for unemployment insurance was eligible for $0 silver premiums and 94% actuarial value plans. If passed, BBB would extend the special Marketplace subsidy rule for individuals receiving UI benefits for an additional 4 years, through the end of 2025.**If ineligible for affordable employer coverage. BBB modifies the affordability test for employer-sponsored health coverage. The ACA makes people ineligible for Marketplace subsidies if they have an offer of affordable coverage from an employer, currently defined as requiring an employee contribution of no more than 9.61% of household income in 2022. The BBB would reduce this affordability threshold to 8.5% of income, bringing it in line with the maximum contribution required to enroll in the benchmark plan.SOURCE: KFF

How would Marketplace coverage compare to Medicaid expansion?

In addition to lowering out-of-pocket costs, the Build Back Better Act would make other changes to how Marketplace plans work for low-income enrollees to bring the plans closer to Medicaid standards. For years 2024 and 2025, silver plans for individuals with incomes under 138% of poverty would have to cover non-emergency transportation services and family planning services and supplies that are required under state Medicaid plans with no cost sharing. The requirement to file federal tax returns in order to reconcile premium tax credits would also be waived for these new enrollees with income below 138% of the poverty level. And, an offer of employer-sponsored health insurance would not make these new enrollees ineligible for marketplace subsidies.

Low-income enrollees also would not be limited to signing up during the open enrollment period, and could have access to Marketplace coverage year-round. One advantage of using the Marketplace to expand coverage to low-income people is that, if their income rises above 138% of poverty, they can keep the same Marketplace plan and not have to reapply for a different source of coverage, which might mitigate some coverage loss during transitions.

However, there are some disadvantages to Marketplace coverage compared to Medicaid for low-income individuals. While some states require nominal co-payments for certain services, Marketplace coverage under the Build Back Better Act will likely require higher cost sharing for some enrollees than what they would have paid in Medicaid. (While plans with cost sharing subsidies have very low deductibles and copays for most services, coinsurance might apply for key costly services, such as hospitalization, emergency room care, or specialty drugs).

Medicaid requires retroactive coverage for three months prior to application, so Medicaid covers costs incurred during this period. Coverage in marketplace plans will only take effect prospectively, generally on the first day of the month following plan selection. As a result, marketplace plans will not cover health care expenses incurred prior to the effective date of coverage.

Additionally, Marketplace plans, particularly lower cost plans, often have narrow provider networks, which may limit the choice of hospitals or other providers compared to Medicaid, though this will depend on the state and the plans offered on the Marketplace. On the Marketplace, if a low-income enrollee wants to enroll in a plan with more choices of doctors or hospitals, and if such a plan is offered in their area, they may have the option to pay the difference in the monthly premium between the benchmark silver plan and the broader network plan.

Finally, while people in the Medicaid gap will generally qualify for $0 silver plans, the Marketplace tax credit can only be applied to the portion of the premium that is for essential health benefits. If both the lowest-cost and second-lowest-cost (benchmark) silver plans include non-essential health benefits, the enrollee must pay a small monthly amount to cover the non-essential benefit portion of the premium. In about 13% of counties in states using Healthcare.gov, both of the two lowest-cost silver plans include non-essential health benefits in 2022. Low-income enrollees in those counties would otherwise be eligible for $0 premium plans, but may instead have to pay a few dollars per month. If payment is missed, coverage can be terminated.

Looking ahead

While navigating and signing up for health insurance will remain a complicated task for many low-income people, the Build Back Better Act would provide $105 million in additional funding through 2025 for targeted outreach to individuals in the Medicaid coverage gap to inform them of their eligibility for subsidized coverage in the Marketplaces. In addition, the Act directs the federal Marketplace to make no less than an additional $70 million—at least $10 million in FY 2022 and $20 million in each of FY 2023-2025—available to Navigators in non-expansion states to help individuals sign up for coverage. Finally, to facilitate enrollment in coverage, the legislation would allow individuals with income below 138% of poverty to enroll in Marketplace coverage throughout the year.

Seven years after the Medicaid coverage gap was created, passage of the Build Back Better Act would provide affordable, comprehensive coverage, albeit temporarily, to the more than 2 million that are uninsured because their states have chosen not to expand Medicaid. However, the Build Back Better Act’s closure of the Medicaid coverage gap is only temporary, at a cost to the federal government of $57 billion according to the Congressional Budget Office. After the year 2025, if Congress does not act to extend the subsidies, approximately 2.2 million people living in non-expansion states who have incomes under 100% of poverty would fall back into the Medicaid coverage gap unless the state adopts the Medicaid expansion (with the ARPA financial incentive). Similarly, Marketplace-eligible people with incomes between 100-138% of poverty would see their monthly silver plan premiums rise.

News Release

Health Employment Continues Slow Recovery Since the Beginning of the Pandemic

Published: Dec 10, 2021

Unlike past recessions, the health sector saw a big drop in employment in early 2020 similar to other sectors as the COVID-19 pandemic shut down much of the nation’s economy and remains below expected employment levels through November 2021, a new KFF chart collection shows.

The chart collection takes a deep dive into the Bureau of Labor Statistics data to analyze how jobs and wages in the industry shrank and recovered compared to other sectors. Key findings include:

  • After a sharp drop in employment at the beginning of the pandemic, jobs in the health sector began to return in May 2020 but the recovery remains incomplete. In November, employment in the health sector remains 2.7% lower than its peak in February 2020.
  • The number of workers in nursing care and elder care facilities has continued to decline even after other health settings experienced a rebound. As of November, nursing care facilities and elder care facilities employed 15% and 11.1% fewer workers than they did in February 2020.
  • Outside of hospitals, unemployment for men in health care has declined to 2.9% in November from 3.5% in February 2020. By contrast, women in non-hospital health jobs saw an increase in unemployment to 3% in November compared to 2.3% in February 2020.

The chart collection is available through the Peterson-KFF Health System Tracker, an online information hub that monitors and assesses the performance of the U.S. health system.

News Release

Donor Government Funding for International Family Planning Declines After Increasing the Previous Three Years

Published: Dec 10, 2021

A new KFF analysis finds donor government support for global family planning efforts totaled US$1.40 billion in 2020, a decline of US$114 million compared to last year’s level of US$1.52 billion. This decline in donor funding was largely due to the decreased funding from the UK, family planning’s second largest donor after the US.

The UK decline was partly due to the timing of disbursements, but also to the effect of the COVID-19 pandemic on its overall economy since, by law, the UK overseas aid budget is a percentage of gross national income, which declined in 2020. In addition to the UK, three other countries (Demark, Germany, and Norway) also decreased their 2020 funding for family planning.

Three government donors increased their funding in 2020 (Canada, France, and Sweden), while an additional three remained flat (Australia, Netherlands, and the US). Though the US did not increase its funding in 2020, it remains the largest donor to bilateral family planning funding, providing 41% of the total bilateral funding.

The new report also finds donor governments increased their contributions to UNFPA in 2020, rising by more than US$40 million compared to 2019, despite the lack of funding from the US in 2020 due to the Trump Administration’s invoking of the Kemp-Kasten amendment to withhold all support from UNFPA.

Funding remains uncertain amidst the COVID-19 pandemic, but the Biden Administration and current Congress have expressed support for increased family planning funding for 2021.

Results of this analysis are also included in the annual progress report from FP2030, Measurement Report 2021. FP2030 is the successor to FP2020, a global initiative that ran from 2012 to 2020.

Donor Government Funding for Family Planning in 2020

Authors: Adam Wexler, Jennifer Kates, and Eric Lief
Published: Dec 10, 2021

Overview

Overview

This report, Donor Government Funding for Family Planning in 2020, tracks funding levels of the donor governments that collectively provide the bulk of international assistance for family planning activities. The new report provides the latest data available on donor funding disbursements based on data provided by governments. It presents their bilateral assistance to low- and middle-income countries as well as contributions to UNFPA.

December 2021 (.pdf)

Previous versions by publish date:

January 2021 (.pdf)

November 2019 (.pdf)

November 2018 (.pdf)

December 2017 (.pdf)

November 2016 (.pdf)

November 2015 (.pdf)

November 2014 (.pdf)

November 2013 (.pdf)

Key Points

This report provides an analysis of donor government funding to address family planning in low- and middle-income countries in 2020, the most recent year available, as well as trends over time. It is part of an effort by KFF (the Kaiser Family Foundation) to track such funding that began after the London Summit on Family Planning in 2012. Importantly, the current findings largely reflect political funding decisions made before the COVID-19 pandemic and therefore likely precede any major effects on donor government spending for family planning. Key findings include:

  • AFTER THREE YEARS OF INCREASES, DONOR GOVERNMENT FUNDING FOR BILATERAL FAMILY PLANNING DECLINED. In 2020, family planning funding from donor governments totaled US$1.40 billion, a decline of US$114 million compared to the 2019 level (US$1.52 billion).1 
  • THE DECLINE IN 2020 WAS LARGELY DUE TO DECREASED FUNDING FROM U.K., THE WORLD’S SECOND LARGEST DONOR, LARGELY OFFSETTING ITS PRIOR YEAR INCREASE. K. bilateral funding for family planning activities declined by more than US$100 million in 2020. The decline was partly due to the timing of U.K. disbursements (funding increased significantly in 2019, but then returned to near prior year levels in 2020), as well as an overall decline in its ODA due to the effect of COVID-19 on the U.K.’s gross national income (GNI).2 ,3 
  • THREE DONORS INCREASED BILATERAL FUNDING IN 2020 WHILE ALL OTHER DONORS EITHER DECLINED OR REMAINED FLAT. Among the ten donor governments profiled, three increased funding (Canada, France, and Sweden), three remained essentially flat (Australia, Netherlands, and U.S.), and four decreased (Denmark, Germany, Norway, and U.K.); these trends were the same after adjusting for inflation and exchange rate fluctuations, except for the Netherlands, which increased in currency of origin.
  • THE U.S. CONTINUES TO BE THE LARGEST DONOR TO BILATERAL FAMILY PLANNING EFFORTS. The U.S. provided $592.5 million or 42% of total bilateral funding from governments in 2020.4  The U.K. (US$266.5 million, 19%) was the second largest donor, followed by the Netherlands (US$202.3 million, 14%), Sweden (US$129.3 million, 9%), and Canada (US$94.0 million, 7%).
  • DESPITE THE DECLINE IN 2020, FUNDING HAS GENERALLY INCREASED SINCE THE CALL FOR MORE FUNDING MADE AT THE LONDON SUMMIT IN 2012. Funding from donor governments in 2020 was approximately US$215 million above the 2012 level (US$1.2 billion). In 2020, six donor governments provided higher funding than in 2012, including Canada, Denmark, the Netherlands, Norway, Sweden, and the U.K. Since funding from the U.S., the world’s largest donor over the period has been relatively flat, the overall trends have been largely driven by other donors.
  • FUNDING TO UNFPA INCREASED IN 2020, EVEN WITHOUT U.S. SUPPORT. In addition to bilateral funding for family planning, the donor governments profiled provided US$411.7 million in core contributions to UNFPA in 2020, an increase of more than US$40 million compared to 2019 (US$367.6 million).5 ,6  The ranking of donor government support for UNFPA differs from that of their bilateral funding. Germany provided the largest core contribution (US$78.8 million), followed by Sweden (US$65.9 million), Norway (US$55.1 million), the Netherlands (US$36.8 million), and Denmark (US$34.1 million).The U.S. did not provide any funding to UNFPA in 2020 due to the Trump Administration’s invoking of the Kemp-Kasten amendment to withhold funding from UNFPA between 2017 and 2020. The Biden administration has moved to restore funding, expected in 2021.7 
  • FUTURE FUNDING WILL LIKELY DEPEND ON THE IMPACT OF COVID-19 ON COUNTRY BUDGETS AND FAMILY PLANNING SERVICES AS WELL AS CHANGES IN U.S. ADMINISTRATION PRIORITIES. Donor government funding decisions for 2020 were largely determined prior to the COVID-19 pandemic, before most governments saw their GDPs fall. Funding for family planning activities in 2021, which will largely reflect decisions made in 2020, and beyond will depend on the trajectory of the COVID-19 pandemic, particularly vaccination roll-out, but also the continued economic stresses on country budgets (both donor and recipient) as well as changing needs in recipient countries resulting from impacts on family planning services. At the same time, funding from the U.S. may rise as the Biden Administration and current Congress have expressed support for increased funding for family planning activities.

Report

Introduction

This report provides data on donor government funding for family planning activities in low- and middle-income countries in 2020, the most recent year available, as well as trends over time. It is part of an effort by KFF that began after the London Summit on Family Planning in 2012 and includes data from all 30 members of the Organisation for Economic Co-operation and Development (OECD)’s Development Assistance Committee (DAC), as well as non-DAC members where data are available.8  Data are collected directly from donors and supplemented with data from the DAC. Direct data collection was carried out for ten donor governments that account for 98% of total funding for family planning. Both bilateral assistance and core contributions to UNFPA are included. For more detail, see methodology.

Findings

Bilateral Funding

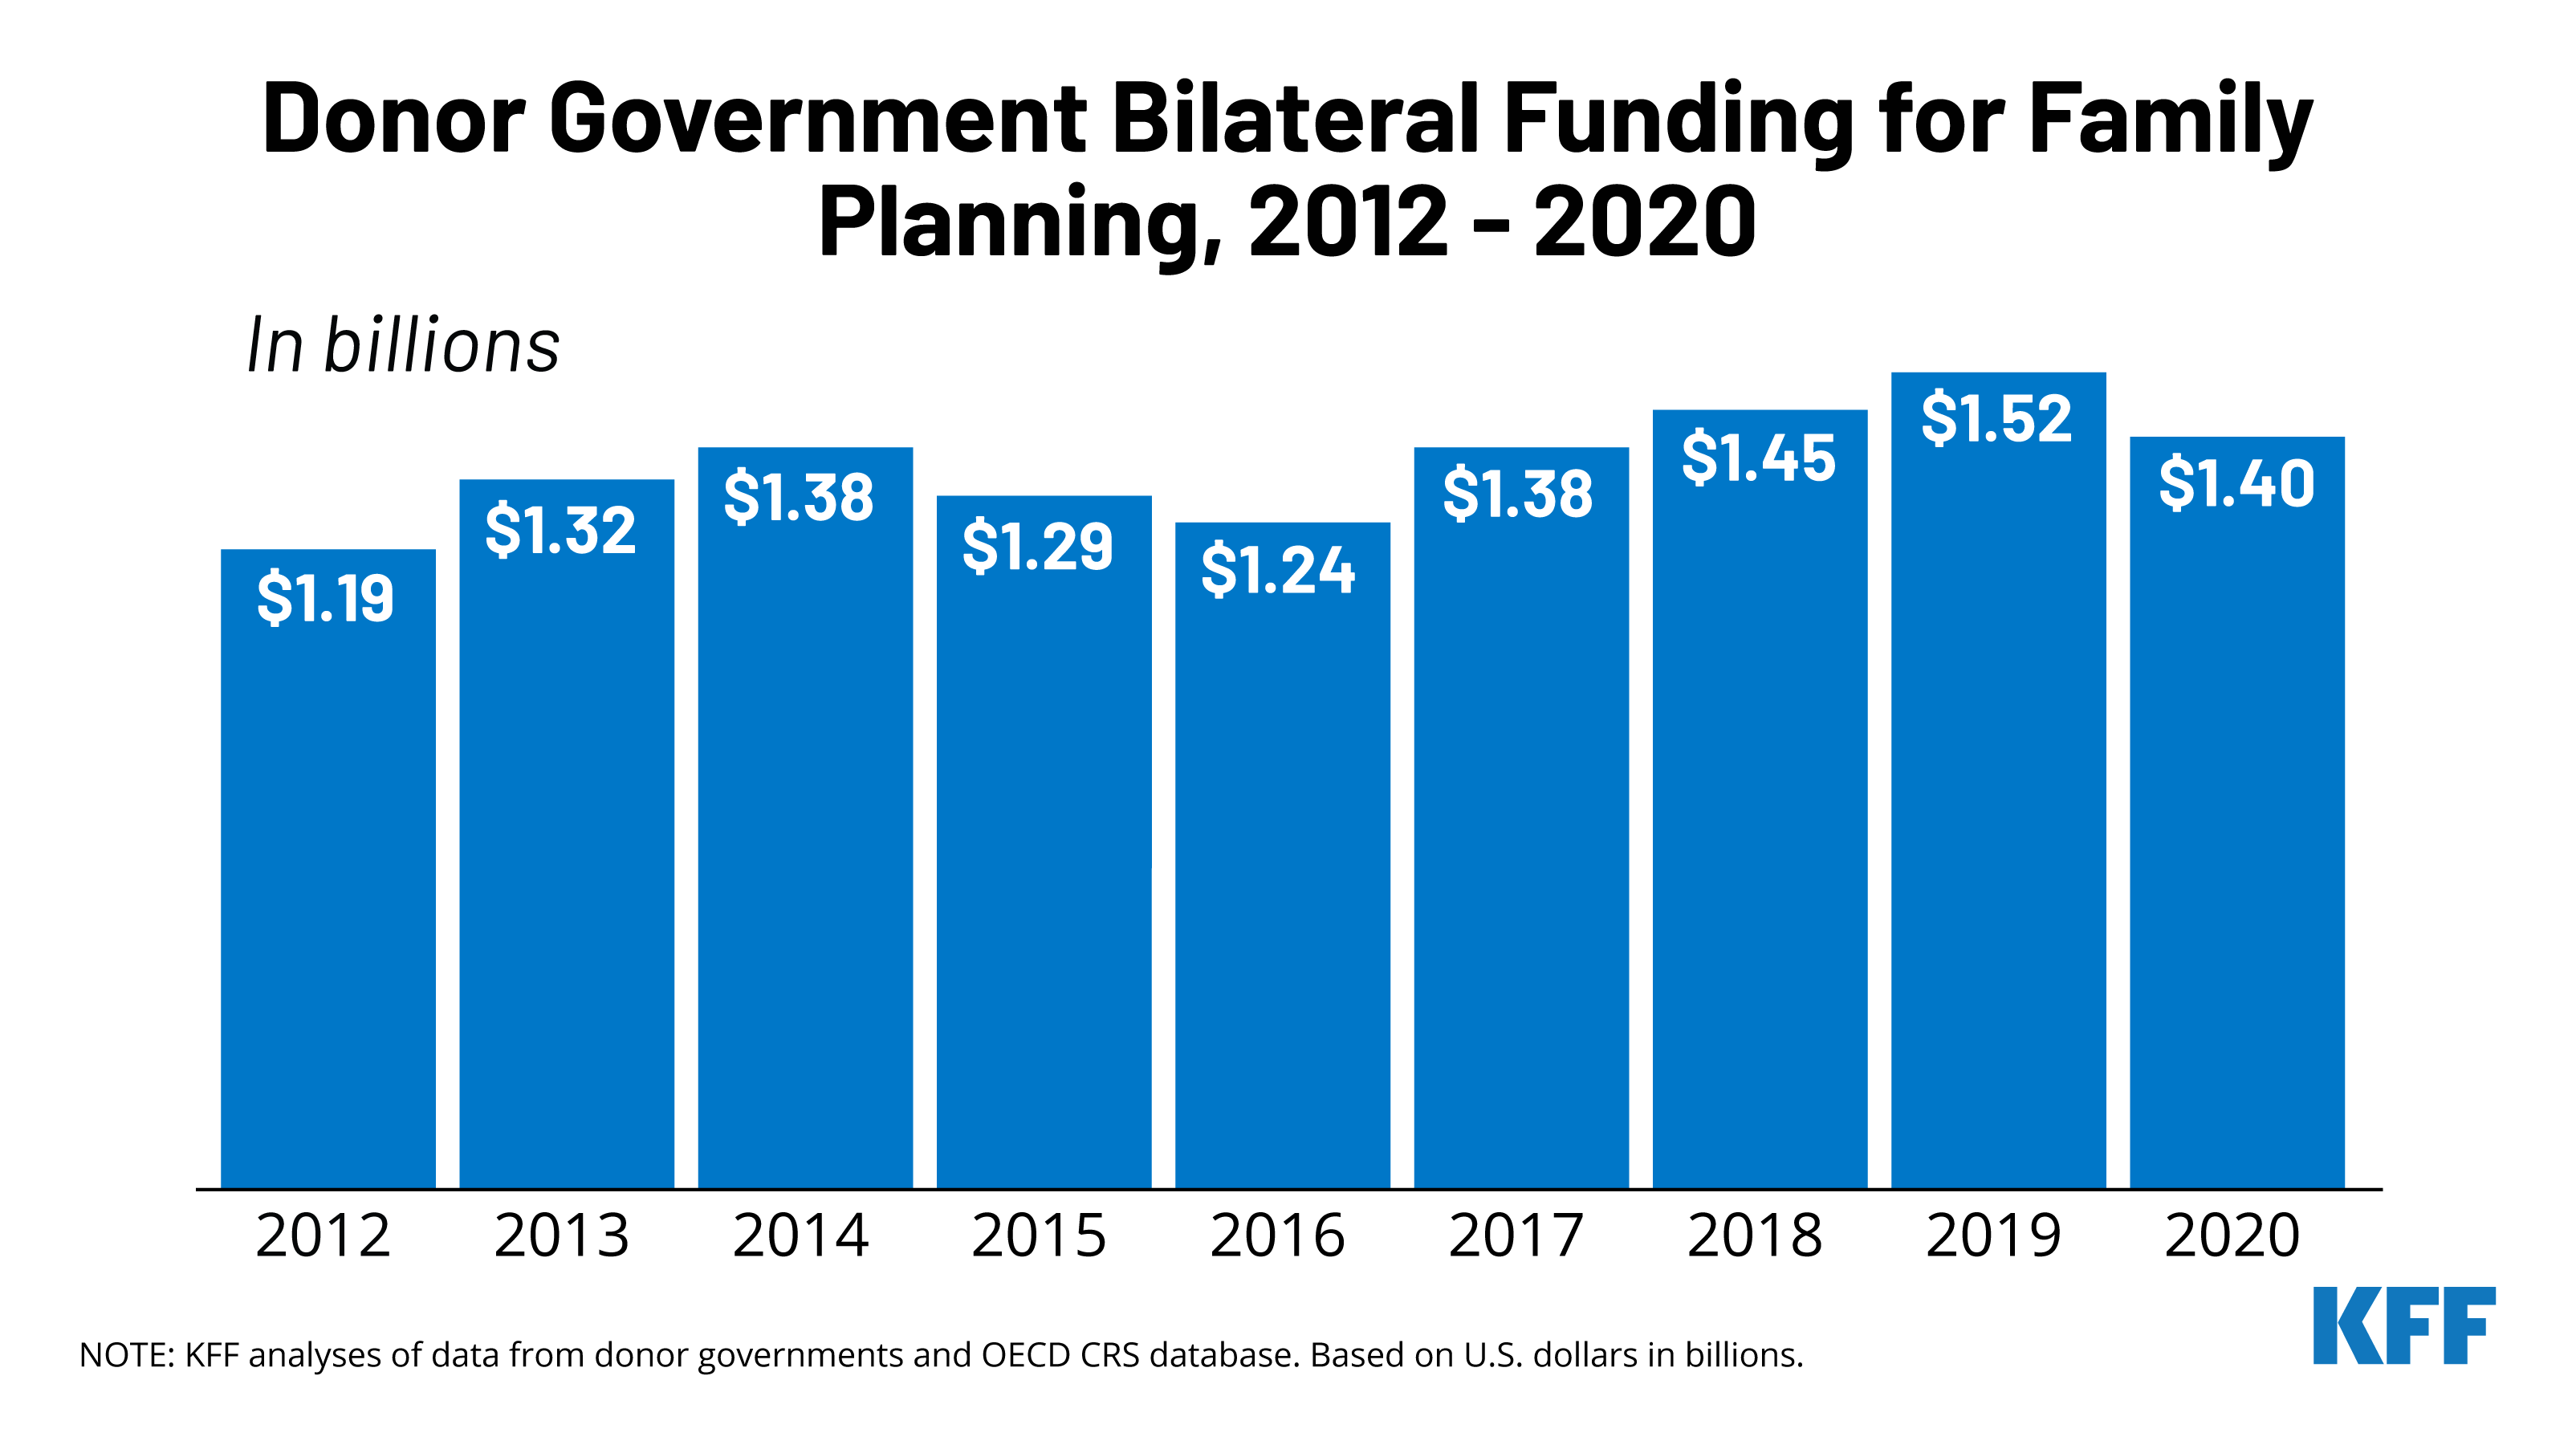
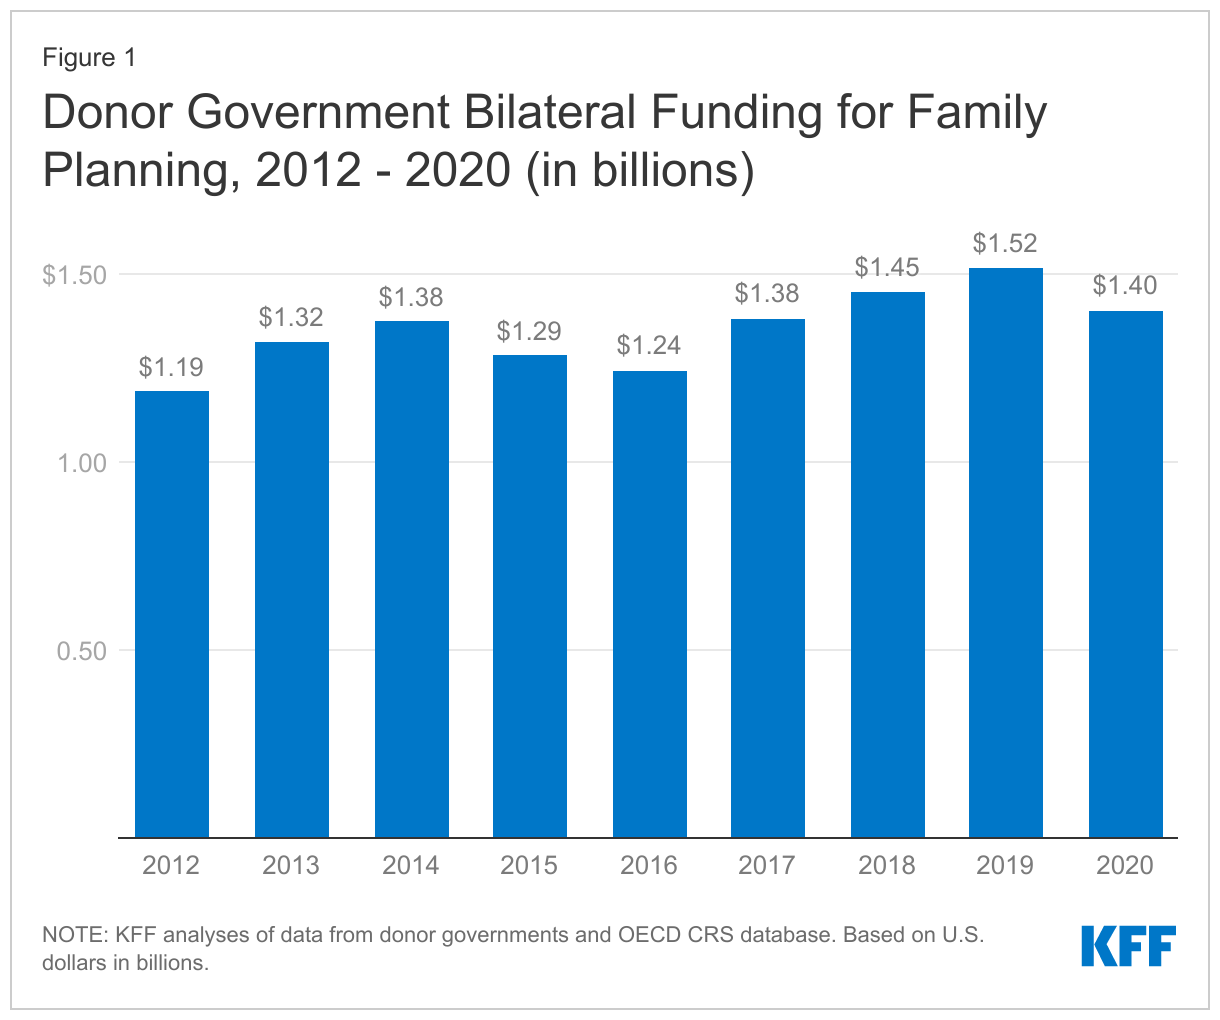
In 2020, donor governments provided US$1.40 billion in bilateral funding for family planning activities (see Figure 1, Table 1, & Appendix), a decline of US$114 million compared to the 2019 level (US$1.52 billion).1 The decline in 2020 followed three years of increases, which, in 2019, resulted in the highest level of funding since the London Summit in 2012.

Donor Government Bilateral Funding for Family Planning, 2012 - 2020 (in billions)
Table 1: Donor Government Bilateral Funding for Family Planning, 2012-2020 (in current US$, millions)

The decline in 2020 was largely due to decreased funding from the U.K., the world’s second largest donor. It is important to note, however, that the U.K. decline was due to a complex set of factors including the timing of disbursements (funding increased significantly in 2019, but then returned to almost prior year levels in 2020) and the overall decline in ODA resulting from the effect of COVID-19 on GNI.2

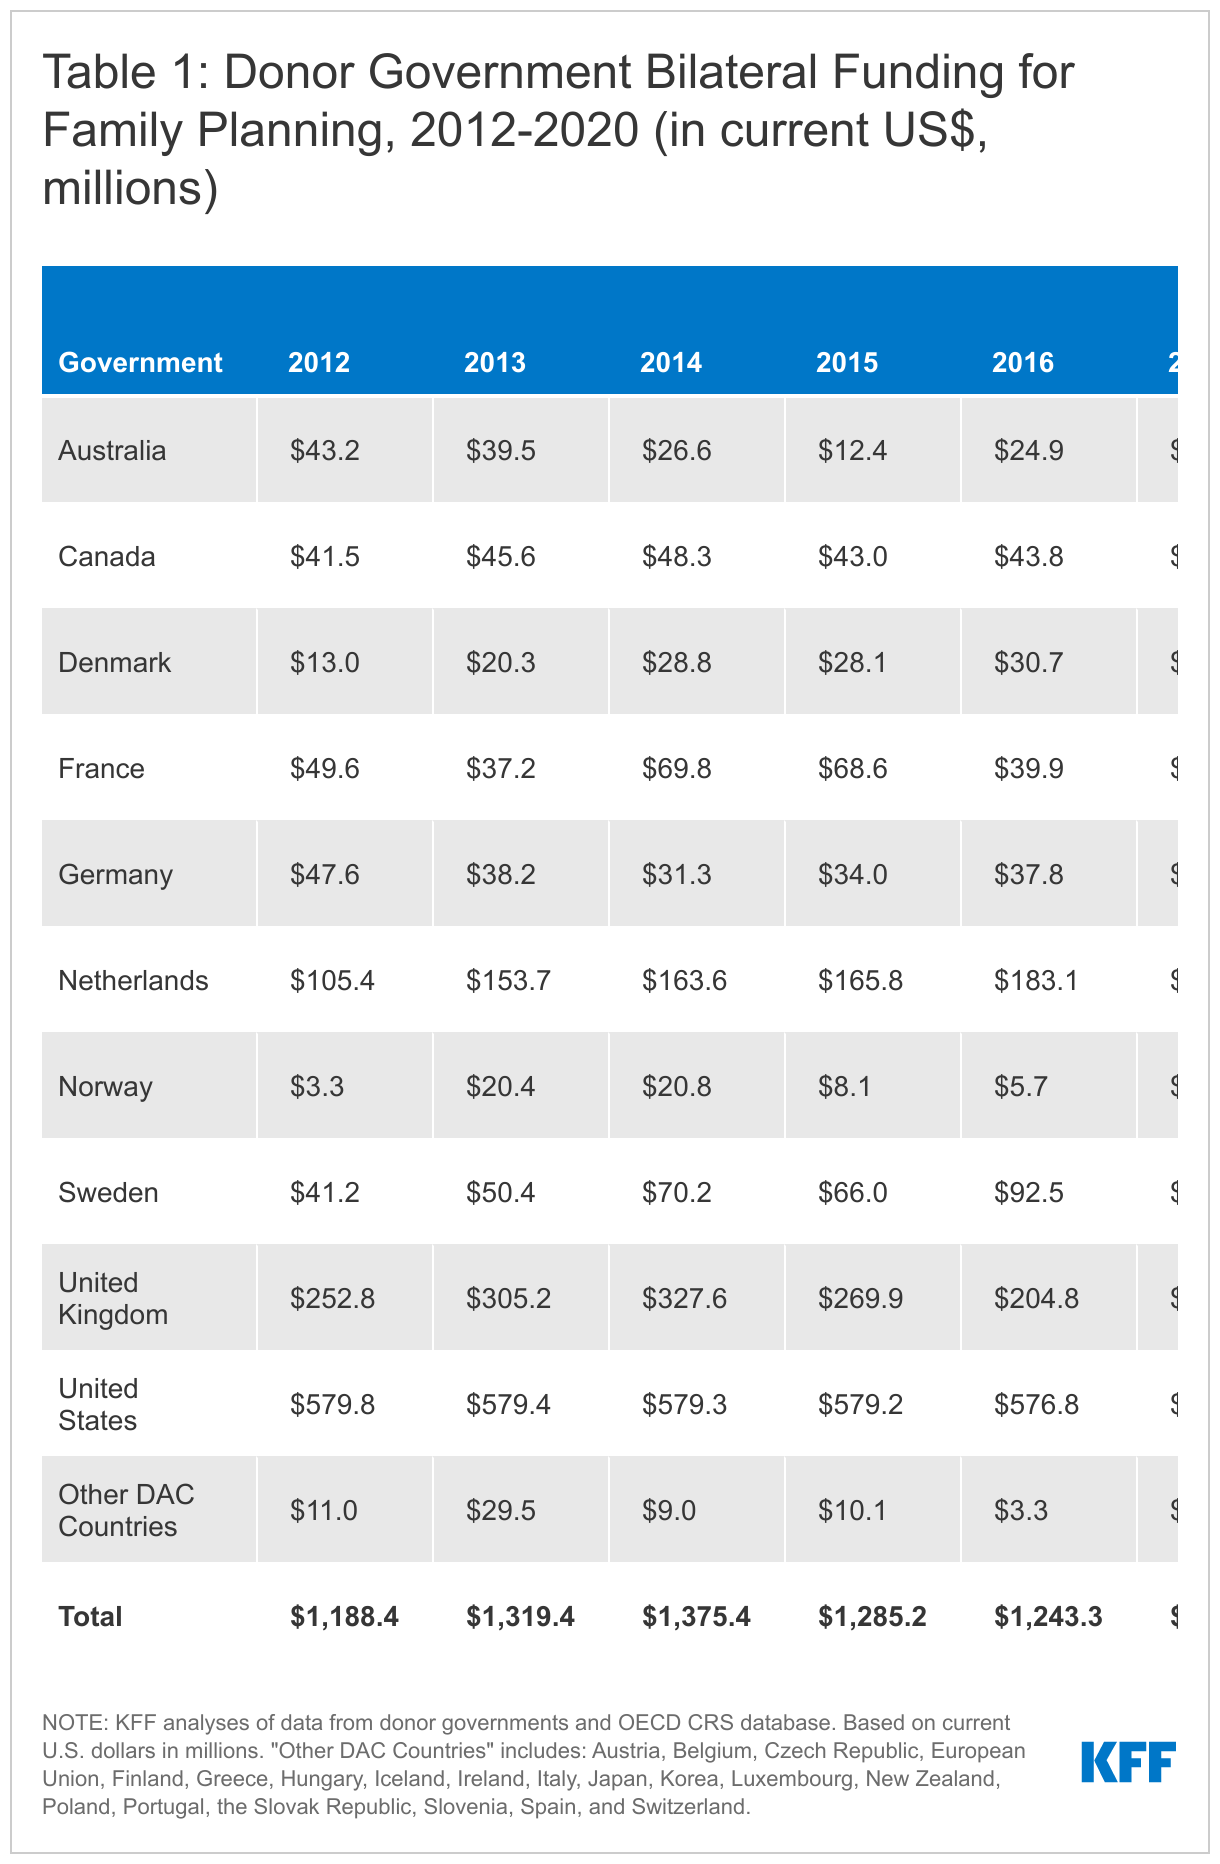
Among the ten donors for which direct data collection was conducted, three increased funding in 2019 (Canada, France, and Sweden), three remained essentially flat (Australia, Netherlands, and U.S.), and four decreased (Denmark, Germany, Norway, and U.K.). These trends were the same after adjusting for inflation and exchange rate fluctuations, except for the Netherlands, which increased in currency of origin.

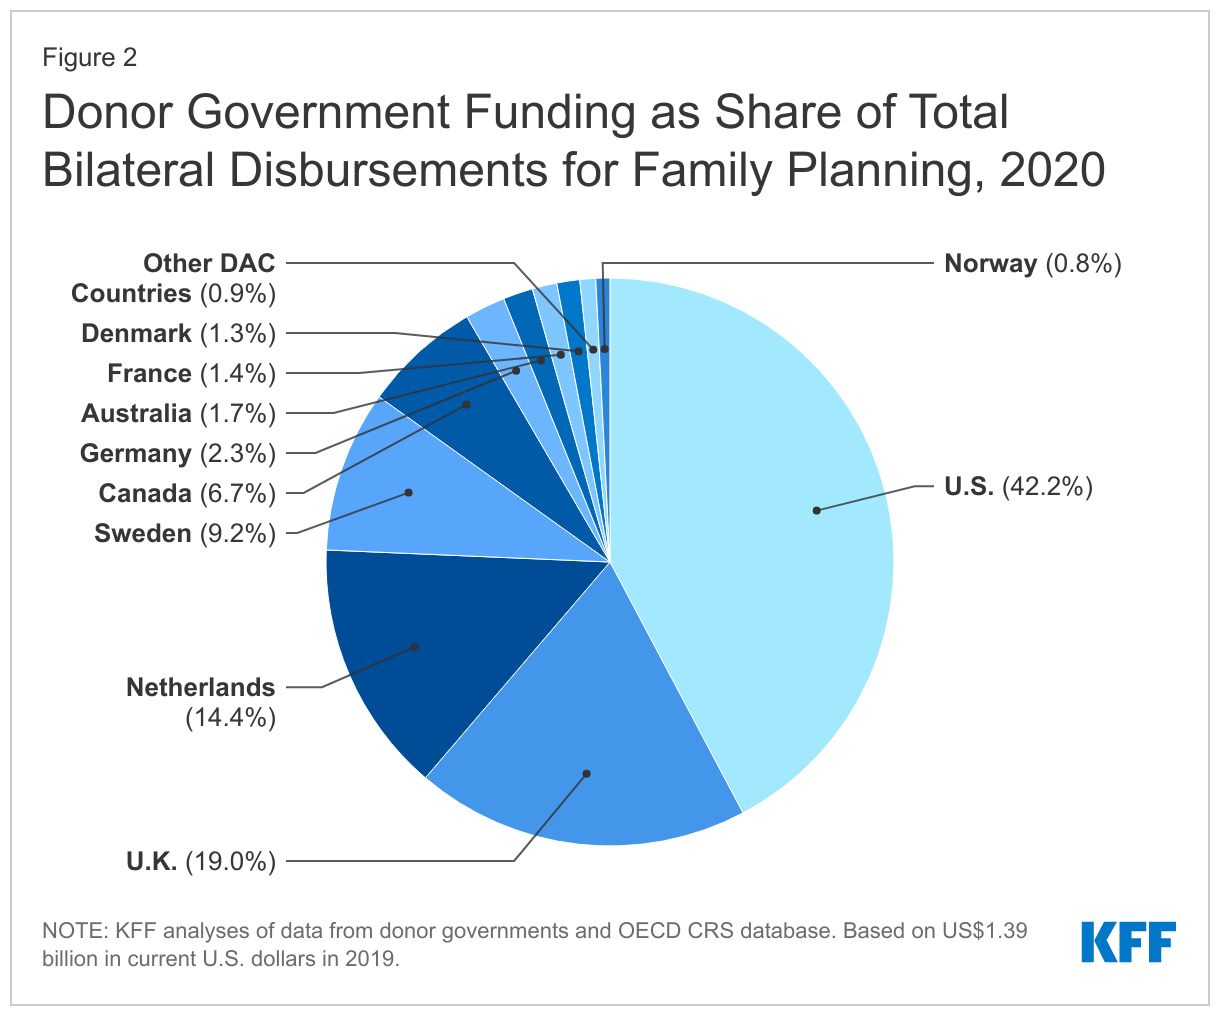
The U.S. was the largest donor to bilateral family planning efforts in 2020, accounting for 42% of donor government funding (see Figure 2). Despite a decline, the U.K. remained the second largest donor (19%) followed by the Netherlands (14%), Sweden (9%), and Canada (7%).

Donor Government Funding as Share of Total Bilateral Disbursements for Family Planning, 2020

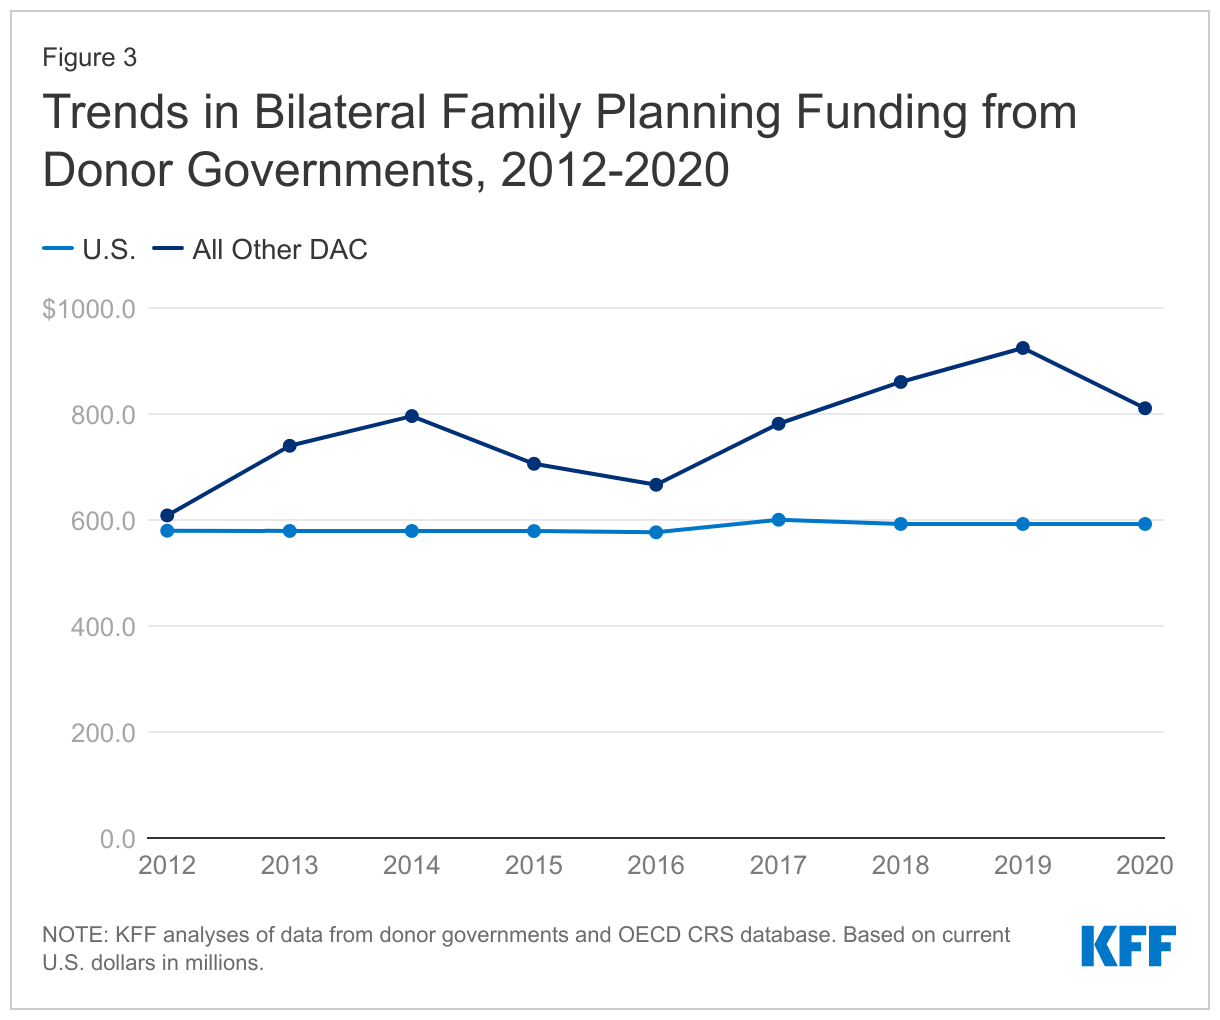
Donor government funding for family planning has generally risen since the London Summit in 2012, although totals have fluctuated over the period. Funding in 2020 (US$1.40 billion) was approximately US$215 million above the 2012 level (US$1.19 billion). In 2020, six donors provided higher funding than in 2012, including Canada, Denmark, the Netherlands, Norway, Sweden, and the U.K. Since funding from the U.S., which has been the largest donor each year over the period, has been relatively flat, the overall trends have largely been driven by the other donors (see Figure 3).

Trends in Bilateral Family Planning Funding from Donor Governments, 2012-2020

Donor Contributions to UNFPA

While the majority of donor government assistance for family planning is provided bilaterally, donors also provide support for family planning activities through contributions to the United Nations Population Fund (UNFPA). Most of UNFPA’s funding is from donor governments, which provide funding in two ways: 1) donor directed or earmarked contributions for specific activities (e.g. donor contributions to the UNFPA Supplies), which are included as part of bilateral funding above; and 2) general contributions to “core” activities that are untied and meant to be used for both programmatic activities (e.g. family planning, population and development, HIV/AIDS, gender, and sexual and reproductive health and rights) and operational support as determined by UNFPA.9 

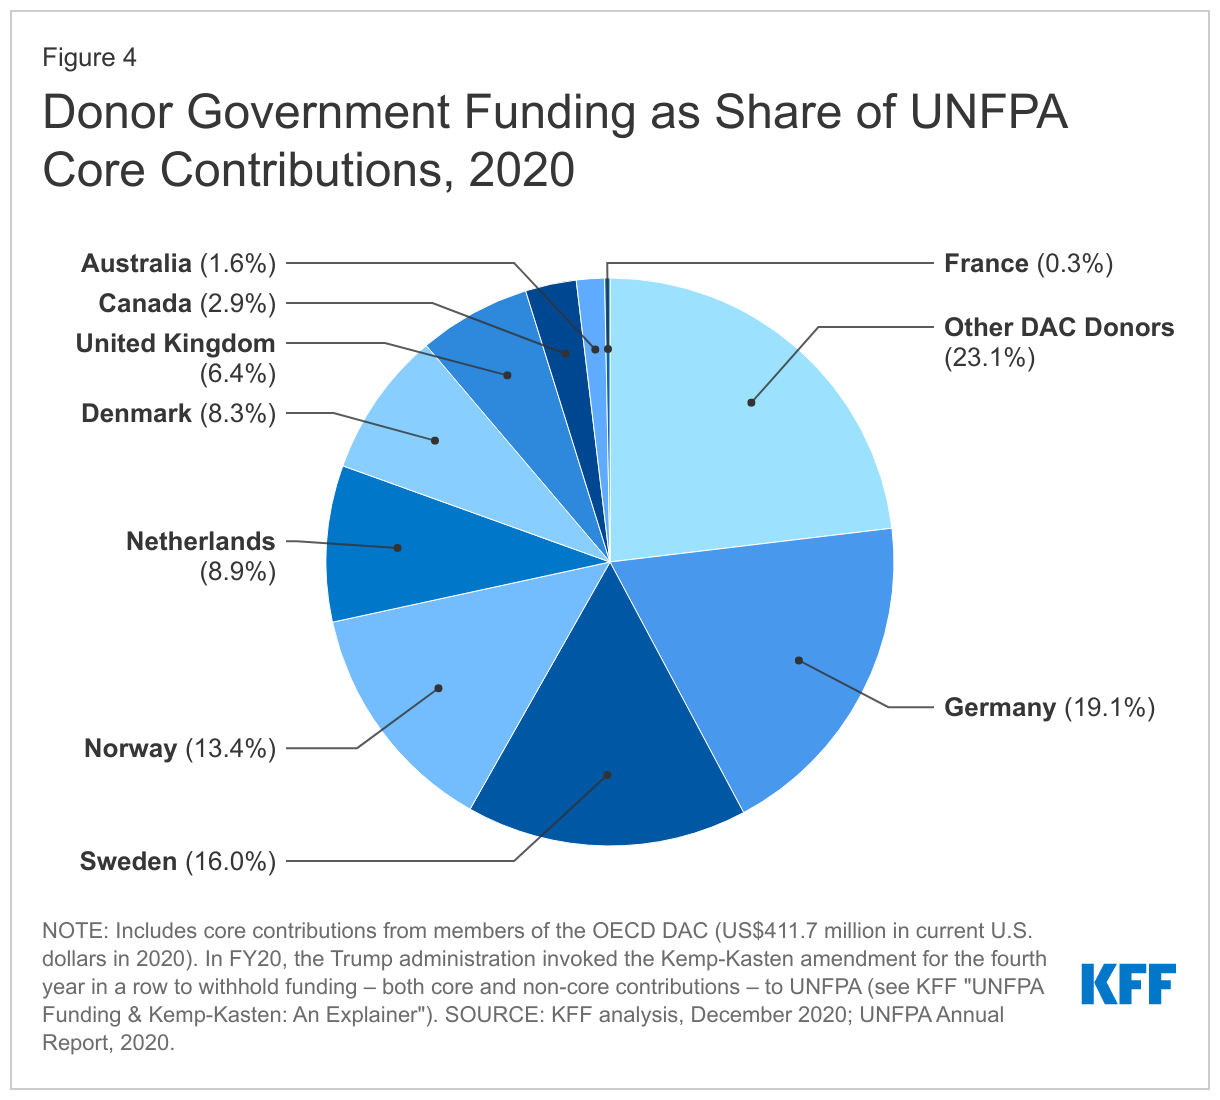
In 2020, the donor governments profiled provided US$411.7 million in core contributions to UNFPA, an increase of more than US$40 million compared to the 2019 level (US$367.6 million). The increase was largely attributable to Germany, which more than doubled its core contribution (from US$37.0 million in 2019 to US$78.8 million in 2020), mostly in support of UNFPA’s efforts to address the impacts of COVID-19.10  In addition to Germany, one other donor increased funding (Sweden), while five remained flat (Australia, Canada, France, the Netherlands, and the U.K.), and two declined (Denmark and Norway); these trends were the same after adjusting for inflation and exchange rate fluctuations, except for Norway, which remained flat in currency of origin.

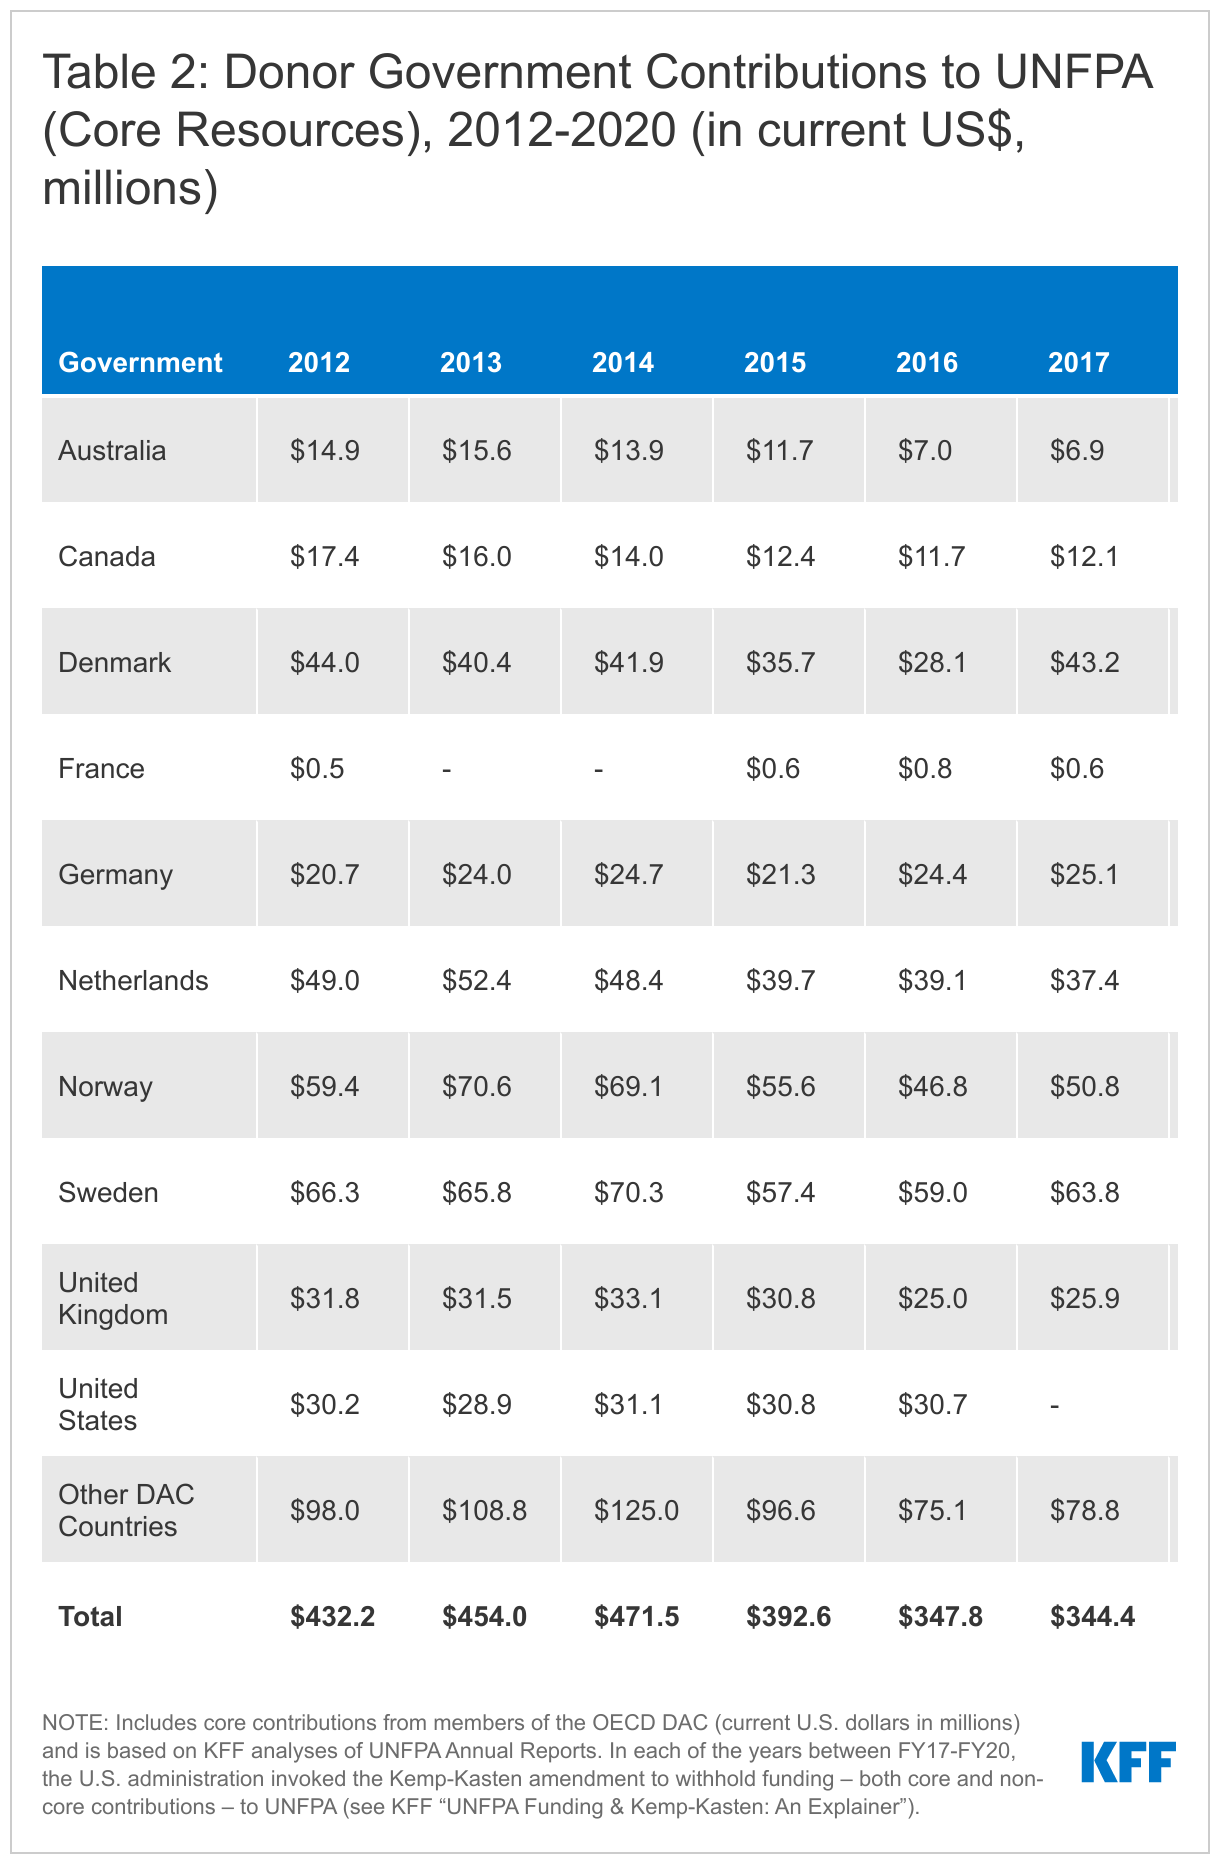
The ranking of donor contributions to UNFPA differs from that of their bilateral family planning funding. Germany provided the largest core contribution to UNFPA in 2020 (US$78.8 million), followed by Sweden (US$65.9 million), Norway (US$55.1 million), the Netherlands (US$36.8 million), and Denmark (US$34.1 million), (see Figure 4 and Table 2). Three donors – Denmark, Germany, and Norway – provided larger contributions to UNFPA’s core resources than their total bilateral funding for family planning.

Due to the Trump administration’s decision to invoke the Kemp-Kasten amendment to withhold funding – both core and non-core - from UNFPA, the U.S. did not provide a contribution to UNFPA between 2017-2020. The Biden Administration has moved to restore funding, which is expected in 2021. Still, these amounts, and historical UNFPA contributions, place the U.S below other donors as the U.S. directs almost all of its support for family planning through bilateral channels.

Donor Government Funding as Share of UNFPA Core Contributions, 2020
Table 2: Donor Government Contributions to UNFPA (Core Resources), 2012-2020 (in current US$, millions)

Looking Ahead

Donor government funding decisions for 2020 largely occurred prior to the COVID-19 pandemic. However, the decline in family planning funding in 2020 was partially due to the impact of COVID-19 on the U.K. GNI. Whether this trend continues for the U.K. or other donor governments in 2021 and beyond will largely depend on the trajectory of the COVID-19 pandemic, particularly the rollout of vaccinations globally, as the pandemic put significant stresses on both donor and recipient country budgets as well as the delivery of family planning services globally.11  At the same time, funding from the U.S. could potentially increase in 2021 as the Biden Administration requested additional resources, and Congress has indicated it may support an increase (although, final funding decisions have not been made). Given that the U.S. is the largest donor to global family planning efforts, any changes would have an outsized impact on the overall amount and trends over time.

Methodology

Bilateral and multilateral data on donor government assistance for family planning (FP) in low- and middle-income countries were collected from multiple sources. The research team collected the latest bilateral assistance data directly for 10 governments: Australia, Canada, Denmark, Germany, France, the Netherlands, Norway, Sweden, the United Kingdom, and the United States during 2021. Data represent the fiscal year 2020 period. Direct data collection from these donors was desirable because they represent the preponderance of donor government assistance for family planning and the latest official statistics – from the Organisation for Economic Co-operation and Development (OECD) Creditor Reporting System (CRS) (see: http://www.oecd.org/dac/stats/data) – which are from 2019 and do not include all forms of international assistance (e.g., funding to countries such as Russia and the Baltic States that are no longer included in the CRS database). In addition, the CRS data may not include certain funding streams provided by donors, such as FP components of mixed-purpose grants to non-governmental organizations. Data for all other OECD DAC member governments – Austria, Belgium, Czech Republic, the European Union, Finland, Greece, Hungary, Iceland, Ireland, Italy, Japan, Korea, Luxembourg, New Zealand, Poland, Portugal, the Slovak Republic, Slovenia, Spain, and Switzerland – which collectively accounted for approximately 2 percent of bilateral family planning disbursements, were obtained from the OECD CRS and are from calendar year 2019.

For purposes of this analysis, funding was counted as family planning if it met the OECD CRS purpose code definition: “Family planning services including counselling; information, education and communication (IEC) activities; delivery of contraceptives; capacity building and training.”  Where it was possible to identify funding amounts, family-planning-related activities funded in the context of other official development assistance sectors (e.g. education, civil society) are included in this analysis. Project-level data were reviewed for Canada, Denmark, France, Germany, the Netherlands, Norway, and Sweden to determine whether all or a portion of the funding could be counted as family planning. Family-planning-specific funding totals for the United States were confirmed through communication with government representatives. Funding attributed to Australia and the United Kingdom is based on a revised Muskoka methodology as agreed upon by donors at the London Summit on Family Planning in 2012. Funding totals presented in this analysis should be considered preliminary estimates based on data provided by representatives of the donor governments who were contacted directly.

It was difficult in some cases to disaggregate bilateral family planning funding from broader population, reproductive and maternal health totals, as the two are sometimes represented as integrated totals. In addition, family-planning-related activities funded in the context of other official development assistance sectors (e.g. education, civil society) have in the past remained largely unidentified. For purposes of this analysis, we worked closely with the largest donors to family planning to identify such family-planning-specific funding where possible. In some cases (e.g. Canada), specific FP percentages were recorded for mixed-purpose projects. In other cases, it was possible to identify FP-specific activities by project titles in languages of origin, notwithstanding less-specific financial coding. In still other cases, detailed project descriptions were analyzed (see Appendix for detailed data table).

Bilateral funding is defined as any earmarked (FP-designated) amount and includes family planning-specific contributions to multilateral organizations (e.g. non-core contributions to UNFPA Supplies). UNFPA contributions from all governments correspond to amounts received during the 2020 calendar year, regardless of which contributor’s fiscal year such disbursements pertain to.

With some exceptions, bilateral assistance data were collected for disbursements. A disbursement is the actual release of funds to, or the purchase of goods or services for, a recipient. Disbursements in any given year may include disbursements of funds committed in prior years and in some cases, not all funds committed during a government fiscal year are disbursed in that year. In addition, a disbursement by a government does not necessarily mean that the funds were provided to a country or other intended end-user. Enacted amounts represent budgetary decisions that funding will be provided, regardless of the time at which actual outlays, or disbursements, occur. In recent years, most governments have converted to cash accounting frameworks, and present budgets for legislative approval accordingly; in such cases, disbursements were used as a proxy for enacted amounts.

For the U.S., funding represents final, Congressional appropriations (firm commitments that will be spent) to the U.S. Agency for International Development (USAID), rather than disbursements, which can fluctuate from year-to-year due to the unique nature of the U.S. budget process (unlike most other donors, U.S. foreign assistance funding may be disbursed over a multi-year period). U.S. totals also include some funding originally appropriated by Congress for UNFPA that is transferred to the USAID family planning & reproductive health (FP/RH) account due to specific provisions in U.S. law including the Kemp-Kasten amendment (see KFF “UNFPA Funding & Kemp-Kasten: An Explainer”). Prior reports presented disbursements. For this report, all prior-year amounts have been changed from disbursements to appropriations. This change in methodology does not alter the overall trend in total funding from donor governments over time.

UNFPA core contributions were obtained from United Nations Executive Board documents. UNFPA estimates of total family planning funding provided from both core and non-core resources were obtained through direct communications with UNFPA representatives. Other than core contributions provided by governments to UNFPA, un-earmarked core contributions to United Nations entities, most of which are membership contributions set by treaty or other formal agreement (e.g., United Nations country membership assessments), are not identified as part of a donor government’s FP assistance even if the multilateral organization in turn directs some of these funds to FP. Rather, these would be considered as FP funding provided by the multilateral organization, and are not considered for purposes of this report.

The fiscal year period varies by country. The U.S. fiscal year runs from October 1-September 30. The Australian fiscal year runs from July 1-June 30. The fiscal years for Canada and the U.K. are April 1-March 31. Denmark, France, Germany, the Netherlands, Norway, and Sweden use the calendar year. The OECD uses the calendar year, so data collected from the CRS for other donor governments reflect January 1-December 31. Most UN agencies use the calendar year and their budgets are biennial.

All data are expressed in US dollars (USD). Where data were provided by governments in their currencies, they were adjusted by average daily exchange rates to obtain a USD equivalent, based on foreign exchange rate historical data available from the U.S. Federal Reserve (see: http://www.federalreserve.gov/) or in some cases from the OECD. Data obtained from UNFPA were already adjusted by UNFPA to represent a USD equivalent based on date of receipts.

Appendix

Appendix: Donor Government Bilateral Disbursements for Family Planning, 2012-2020 (in current US$, millions)

Endnotes

  1. Totals represent funding specifically designated by donor governments for family planning as defined by the OECD DAC (see methodology), and include: standalone family planning projects; family planning-specific contributions to multilateral organizations (e.g., contributions to UNFPA Supplies); and, in some cases, projects that include family planning within broader reproductive health activities. ↩︎
  2. U.K. official development assistance (ODA) is directly tied by law to the gross national income (GNI). Therefore, a decline in the U.K. GNI in 2020 resulted in a subsequent decline in ODA. For more information see “Reduction in the UK’s 0.7 percent ODA target”, June 2021. ↩︎
  3. Direct communication, U.K. Foreign, Commonwealth & Development Office (FCDO). November 2021. ↩︎
  4. This year’s report also includes an update to the methodology for reporting U.S. funding totals (see methodology for more information). ↩︎
  5. Includes core-contributions from members of the OECD DAC only; core contributions from non-DAC donors are not included in this total. ↩︎
  6. UNFPA, “Delivering In A Pandemic: Annual Report 2020”, 2020. See also UNFPA Donor Contributions portal. ↩︎
  7. In 2016, US contributions to UNFPA had totaled US$69 million, including US$30.7 million in core resources and an additional US$38.3 million in non-core resources for other project activities. (See KFF’s “UNFPA Funding & Kemp-Kasten: An Explainer.”). ↩︎
  8. Includes funding from 29 DAC member countries and the European Union (EU). ↩︎
  9. In 2020, UNFPA spent approximately US$451.6 million (42.3% of UNFPA’s total programme expenses) on family planning activities (US$76.6 million from core resources and US$375.0 million from non-core resources). This includes US$297.6 million for family-planning specific activities such as enabling environments for family planning, contraceptives and related supplies, provision of services and family planning systems strengthening, and US$154.0 million for activities with an impact on family planning results in other areas of work under UNFPA’s mandate. Direct communication, UNFPA, October 2021. ↩︎
  10. At this time, it is unclear whether future core contributions from Germany will continue at the 2020 amount. ↩︎
  11. FP2030, “FP2030: Measurement Report, 2021”, December 2021. ↩︎
News Release

The No Surprises Act Begins January 2022: This is What You Can Expect

Published: Dec 10, 2021

The “No Surprises Act,” which establishes new federal protections against most surprise out-of-network medical bills when a patient receives out-of-network services during an emergency visit or from a provider at an in-network hospital without advance notice, will take effect next month. A new KFF brief outlines what to expect in 2022, summarizing key provisions that will be implemented.

Most adults (2 in 3) say they worry about unexpected medical bills and among privately insured patients, about 1 in 5 emergency claims and 1 in 6 in-network hospitalizations include at least one out-of-network bill. The new federal protections will apply to most surprise bills for emergency care, as well as for non-emergency services provided at in-network facilities, potentially helping alleviate this worry.

The No Surprises Act prohibits providers from billing patients more than the applicable in-network cost sharing amount in these situations. Starting in 2022, providers will need to find out patient’s insurance status before submitting the surprise out-of-network bill directly to the health plan. However, patients can give written consent to waive their rights under the No Surprise Act and be billed more by out-of-network providers. It is expected this should only happen in limited circumstances.

The brief also describes procedures to arrive at payment amounts for surprise bills, including use of an independent dispute resolution (IDR) system. Under this system, it is likely that out-of-network payments will be close to the median rate that health plans pay for in-network services, and this would moderate health plan premiums overall. However, suits filed by provider organizations are pending and could result in further regulatory changes or delay implementation of the law.

If a patient receives what they believe is a surprise bill, the new brief highlights protections, and ways to seek help. This is a complex law, with enforcement being conducted in a variety of ways, both by federal and state agencies.

The No Surprises Act allows consumers to appeal disputes over coverage of surprise medical bills to an external reviewer. Another new KFF brief looks at the process for consumer appeal rights under the Affordable Care Act (ACA), which would also be used for surprise bills. Federal law gives consumers the right to appeal health plan claims denials and other adverse decisions, including the incorrect application of cost sharing, although limits apply. This brief describes consumer access to appeals and limits on appeal rights that have been adopted through federal regulations.

Consumer Appeal Rights in Private Health Coverage

Author: Karen Pollitz
Published: Dec 10, 2021

The Affordable Care Act (ACA) requires that all consumers in non-grandfathered health plans have the right to appeal denied claims, first internally to the plan, and then, if the plan upholds its denial, to an independent external reviewer, sometimes called an IRO. Most states had enacted external appeal laws prior to the ACA, but these did not apply to self-insured group health plans which cover most privately insured Americans and which states cannot regulate.

Regulations to implement ACA appeal protections were first published in 2010 requiring that all adverse benefit determinations (such as claims denials or incorrect application of cost-sharing) must be eligible for both internal appeal and external review. The regulation also set content and language access standards for denial notices. However, in response to public comment about possible increased volume and cost of appeals resulting from the ACA, federal appeals standards were substantially modified in 2011, and these changes were made permanent in 2015. As a result, under current federal standards:

  • Only a small percentage of adverse benefit determinations – those decided on the basis of medical necessity or similar clinical judgment – are eligible for external review. Other adverse determinations, including denial of coverage or application of higher cost sharing because a service was provided out of network, are generally not eligible
  • The health plan reviews requests for external review to determine if are eligible
  • The group health plan contracts with and pays the external review entity (as can health insurance companies in states that have not enacted external appeal laws), and
  • Language access standards limit the number of people who must be provided written denial notices in another language if they have limited English proficiency (LEP).

The No Surprises Act (NSA), makes disputes over coverage of surprise medical bills eligible for external review starting in 2022. In addition, pending federal legislation would appropriate new funding for state Consumer Assistance Programs (CAPs), which were established under the ACA to help consumers resolve disputes and file appeals with private health plans. This brief reviews federal appeals standards for private health plans and consumer access to the appeals process.

Most denials are ineligible for external appeal and health plans decide which claims are eligible

The 2010 federal appeals regulation established broad appeal rights for consumers in case of any dispute over how a claim was covered. The regulation stated that all adverse benefit determinations – whether denial or partial payment of a claim or application of in-network vs. out-of-network cost sharing – must be eligible for internal appeal, meaning the consumer has a right to ask the health plan to reconsider any such determination. The 2010 regulation also required that all adverse benefit determinations upheld by the plan would be eligible for independent external review. Transparency data reported by the federal government and states indicate that the health plans tend to uphold most adverse benefit determinations that are internally appealed. By contrast, denials that are externally appealed tend to be overturned. For example, a 2020 report on claims denials and appeals in Maryland shows a 64% reversal rate of denials that were externally appealed.

The scope of claims eligible for external appeal was amended in 2011, limited to only to those denials based on medical necessity or other determination involving clinical judgment. Since then, transparency data reported by the federal government indicate that fewer than 1% of claims denials are on the basis of medical necessity; claims are almost always denied for some other reason, including for example, because the service was provided out of network and so not covered. The 2011 limitation was described as a temporary suspension “intended to give the marketplace time to adjust to providing external review. The Departments believe that, once the market has so adjusted, it will become clear that the benefits of the July 2010 regulation’s broader scope would be likely to justify its costs.” Yet, rules were amended again in 2015 to make permanent this narrowed scope of eligibility for external appeal.

The 2015 amendments also required that upon receiving a request for external appeal, a group health plan must complete a preliminary review to determine whether the claim is eligible. If the plan determines the claim is ineligible, it must notify the consumer why and provide the toll-free number at the U.S. Department of Labor. The regulation does not describe any further recourse for consumers who disagree with the health plan’s determination.

Recent regulations to implement the No Surprises Act added surprise medical bills to the scope of claims eligible for external review, but made no other changes, including to the process under which plans determine eligibility for external review.

Health plans hire the external review entities

External appeals are generally conducted by independent review organizations (IROs). These third-party entities provide objective review of claims disputes, relying on expert medical peer reviewers for medical necessity disputes and on insurance law experts for other contractual coverage disputes. Under state external review laws, a state agency (usually the Insurance Department) contracts with one or more IROs to conduct external appeals. Neither plans nor consumers can select the IRO, and before it is assigned a case, the IRO must certify that it has no material conflicts of interest related to the health plan, patient, or provider. In 2010, the US Department of Health and Human Services (HHS) established a federal external appeals process for insured plans in states that had not adopted ACA appeals standards (currently these include Alabama, Florida, Georgia, Pennsylvania, Texas and Wisconsin). Under the HHS process, the federal government contracts with and pays an IRO to conduct external appeals.

The 2011 regulations, however, codified guidance issued earlier by the US DOL that established a new, so-called “private accredited IRO process” for self-insured group health plans. Under this process, the group health plan contracts with the IRO. To mitigate against bias, plans must contract with at least three accredited IROs and rotate or randomly assign external reviews among them. The 2011 amendments also required that, in states that have not adopted ACA appeals standards, insurers can choose on a case-by-case basis whether to use the HHS external appeals process or the private accredited IRO process. This flexibility also extends to self-insured nonfederal governmental plans, which cover more than 19 million public employees and dependents and which are otherwise regulated by HHS. The federal government does not report data on who uses the HHS external appeals process or how often.

The federal government also does not require group health plans to report information relating to the IROs with which they privately contract, the number of external appeals requested or granted, or the outcomes of appeals. As noted above, HealthCare.gov insurers are required to report summary data on the number of denied claims and appeals under qualified health plans, but do not report information on who conducts external appeals.

Standards for denial notices limit language access and other detail

To be able to appeal a denial or partial denial of a claims, including for example, a surprise medical bill, consumers must first be notified of the adverse benefit determination. Federal regulations set minimum standards for when health plan denial notices (also called explanation-of-benefit notices, or EOBs) must be provided in non-English languages for individuals with limited English proficiency (LEP). Federal rules also set standards for the content of denial notices; both of these standards have changed significantly.

Language access

The ACA requires health plans to provide denial notices in a “culturally and linguistically appropriate manner” explaining the plan action and describing consumers’ appeal rights. The 2010 appeals regulation required that denial notices and notice of appeal rights must be provided in writing in a non-English language to consumers upon request when certain thresholds are met. For large group health plans that cover 100 or more people, the threshold was the lesser of 500 participants or 10% of all plan participants being literate only in the same non-English language. For small group health plans, the threshold was 25% of all plan participants. In the individual market, the threshold was 10% of the population residing in the county being literate only in the same non-English language. In addition, once a consumer did request a written translated notice, plans were required to provide all subsequent notices to that consumer in that language.

The 2011 amendments reduced the threshold percentages for all group or individual health plan to 10% or more of the population residing in the individual’s county being fluent only that that consumer’s non-English language. According to the most recent data released by CMS, this threshold applies in just 266 counties (188 counties across 24 states, plus 78 counties in Puerto Rico), primarily to people literate only in Spanish.  Plans are also required to include “taglines” on the EOB in affected counties – one sentence notices indicating that oral translation services are available from a call center. As a result, for example, if a meat processing plant in South Dakota with 600 employees offers health benefits to its workers, which include 60 employees who speak only Spanish, under the 2010 appeals regulation, that firm would have been required to provide EOBs in Spanish to its LEP workers if they would so request. However, under the 2011 regulations, this standard does not apply because in no South Dakota counties are at least 10% of county residents fluent only in Spanish.

The 2011 regulation also eliminated the requirement for plans to automatically provide translations of subsequent notices; instead, consumers must separately request a translation for each EOB. The reason for these changes cited concerns for cost burdens imposed by the 2010 standards.

Content of denial notices

The 2010 appeals regulation also required that EOBs must include information necessary to identify each claim, including a description of the service, date of service, treating provider, and the specific diagnosis codes (such as ICD-10) and billing codes (such as CPT) associated with each service along with an explanation of the meaning of these codes.

However, citing various concerns related to privacy, interference with the doctor patient relationship, and the cost to health plans and issuers, the 2011 regulations removed the requirement to include billing and diagnosis codes and their meaning on the EOB, though codes must be made available to consumers on request. Coding information can be key to understanding an adverse benefit determination and can sometimes trigger the denial. One study estimates that coding errors may account for 14% of all claims denials by private health plans. In addition, for seriously ill patients whose EOB may contain numerous lines of claims that may be only briefly identified – for example, as “lab test” or “radiology service” – coding detail can make it easier to discern which services were denied or paid incorrectly.

By contrast, regulations implementing the No Surprises Act do require that other types of consumer notices – including consent notices and good faith estimates of charges by out-of-network providers – must contain billing and diagnosis codes for relevant services.

Many consumers need help navigating appeals

In general consumers exercise appeal rights only infrequently. The ACA requires all non-grandfathered health plans to report transparency data on claims denials and appeals. Although this requirement has not been implemented for employer-sponsored plans, marketplace plans report that consumers appeal fewer than two-tenths of one percent of denied claims internally to their health plan. Issuers uphold denials in most internal appeals (about 60%); and less than 3% of denials that are internally appealed make it to external review.

This result is not so surprising considering low rates of health insurance literacy among American consumers, and considering that people who make claims are likely to be sick and so possibly less able to contest insurance problems. Studies also find many consumers don’t understand appeals processes and often don’t know where to turn for help.

Expert help can make a difference. The Affordable Care Act authorized the establishment of state health insurance ombudsman programs, also called Consumer Assistance Programs, or CAPs, to educate the public about their rights and protections under private health plans and to help consumers resolve disputes with their health plans, including filing appeals. The ACA provided initial funding of $30 million for CAPs, and 40 states were awarded CAP grants in 2010. In light of limited funding, most programs were housed in state agencies already engaged in consumer services – departments of insurance, attorney general offices, and state independent health insurance ombudsman agencies. Most CAPs remain in operation, though no further CAP funding has been appropriated since 2010, and several programs have since closed. This year, pending federal legislation would appropriate new funding for CAPs: the Build Back Better Act would appropriate $100 million for CAPs over four years, and the FY 2022 Labor-HHS Appropriations Act would provide $50 million for CAPs in 2022.

The ACA requires all non-grandfathered private health plans to include on the EOB contact information for state CAPs and notice that these agencies can help people file appeals. CAPs help individuals with a range of problems related to denied claims, surprise medical bills, mental health parity concerns, and other areas, often resolving problems and getting denials overturned. Even so, CAPs also acknowledge federal limits to appeal rights and have formally commented that eligibility for external review and other standards promoting access to appeals should be expanded.

Discussion

In addition to expanding eligibility for coverage, the ACA expanded appeal rights to help consumers gain access to covered benefits. Patients-bill-of-rights laws enacted years earlier by many states guaranteed appeal rights – including access to independent external review of disputes over health plan denials – but state laws could not reach most privately insured Americans in group health plans where state regulation is preempted. As a result, federally guaranteed appeal rights are what apply to most privately insured Americans, and these rights are subject to strict limits.

Under current federal rules, only denials on grounds of medical necessity (fewer than 1% of all denials) can be appealed to an independent external reviewer. Starting in 2022 disputes related to surprise medical bills and mental health parity must also be eligible for external review. Federal rules also let group health plans determine whether a denial is eligible for external review. When external appeal is granted, for most privately insured consumers, the claim will be reviewed by entities contracted to the health plan. And consumers with limited English proficiency are only guaranteed the right to receive denial notices in another language if they live in a limited number of US counties and then, only if the translation they seek is in Spanish.

By contrast, the first federal regulation to implement ACA appeals provisions, issued in 2010, provided for more comprehensive protections, but standards were rolled back the following year to give group health plans time to adjust to an anticipated higher volume of appeals that might otherwise be unmanageable and drive up the cost of coverage. Since then, however, transparency data reported by marketplace plans indicate that consumers rarely appeal denied claims internally to their health plan, let alone to external appeal. Broadening eligibility for and simplifying the appeals process could reduce barriers for consumers without necessarily prompting uncontrolled growth in the number of appeals.