Medicaid and CHIP Eligibility and Enrollment Policies as of January 2022: Findings from a 50-State Survey
Executive Summary
Enrollment in Medicaid has grown significantly during the coronavirus pandemic. Provisions in the Families First Coronavirus Response Act (FFCRA) require states to provide continuous coverage for Medicaid enrollees until the end of the month in which the public health emergency (PHE) ends in order to receive enhanced federal funding. Continuous enrollment has helped to preserve coverage and halted Medicaid churn. However, when the PHE ends, states will begin processing redeterminations and millions of people could lose coverage if they are no longer eligible or face administrative barriers despite remaining eligible. Existing state enrollment and renewal procedures, as well as their approaches to the unwinding of the continuous enrollment requirement, will have major implications for Medicaid enrollment and broader coverage.
The 20th annual survey of state Medicaid and Children’s Health Insurance Program (CHIP) officials conducted by KFF and the Georgetown University Center for Children and Families in January 2022 presents a snapshot of actions states are taking to prepare for the lifting of the continuous enrollment requirement, as well as key state Medicaid enrollment and renewal procedures in place during the PHE. The Centers for Medicare and Medicaid Services (CMS) released new guidance on March 3, 2022, which emphasizes promoting continuity of coverage and avoiding inappropriate coverage terminations when the continuous enrollment requirement ends. While this recent guidance was released after the survey was fielded, state responses reported here illustrate how states expect to approach the unwinding of continuous enrollment and what the effects of the new guidance may be.
Plans for the End of the PHE
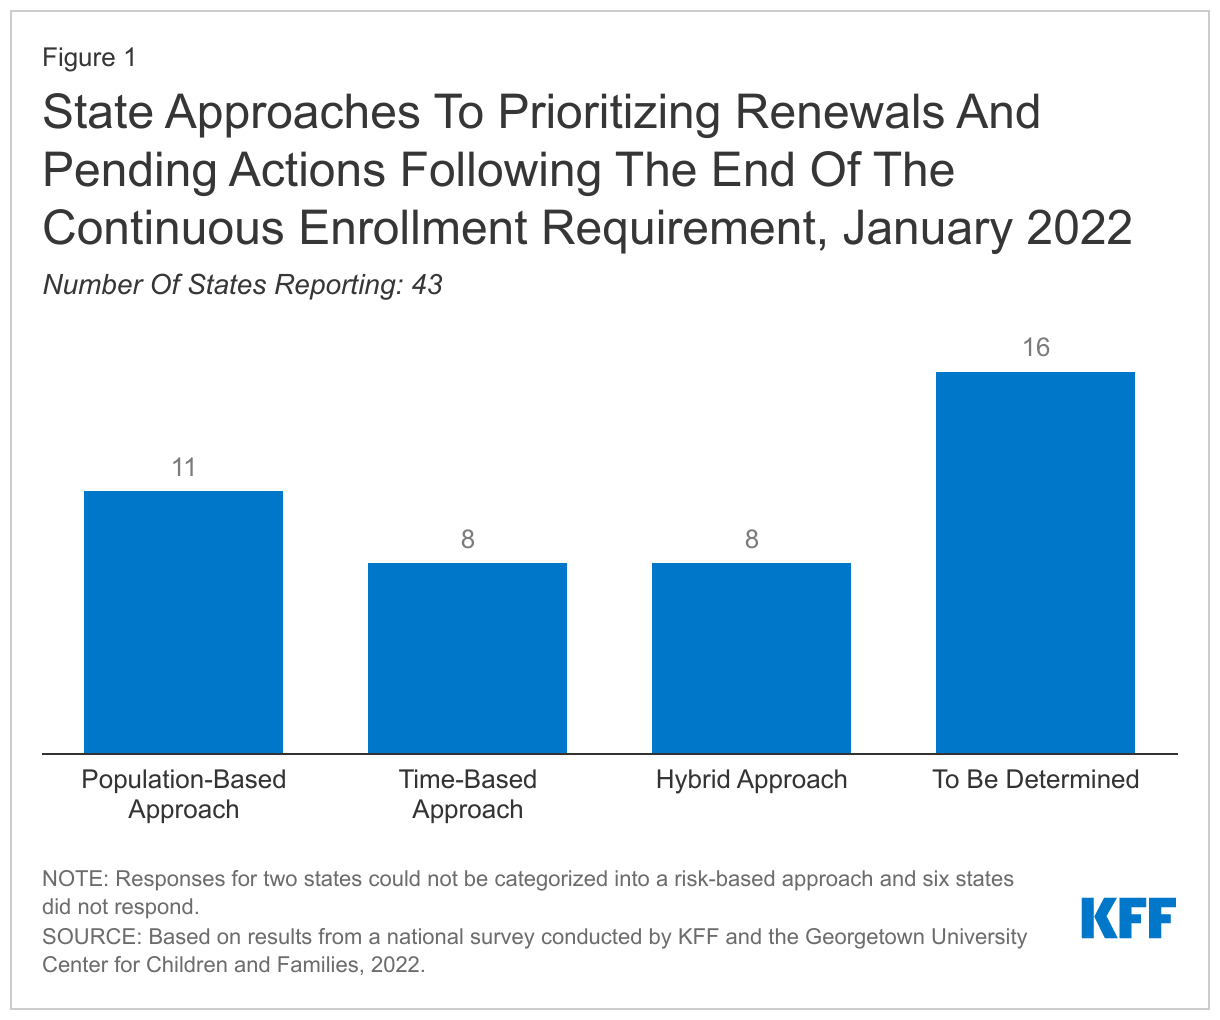
States are required to develop plans for how they will prioritize outstanding eligibility and renewal actions when the continuous coverage requirement is lifted; just over half of states (27) have determined their approach. At the time of the survey, given uncertainty around the timing of the end of the PHE, timing of additional guidance from the CMS, and the future of the Build Back Better Act, it is perhaps not surprising that many states have yet to finalize their plans. However, having plans in place early will allow for better preparation and will enable states to communicate their plans to enrollees and other stakeholders in the state. Among the states with plans, eleven states indicate they will target individuals who appear to be no longer eligible first, while eight states plan to conduct fresh renewals based on the individual’s renewal month, and eight have adopted a combination or hybrid approach. While most states plan to wait until the continuous enrollment requirement is lifted to resume disenrollments, three states have not yet decided whether they will forgo enhanced federal funding and begin disenrollments before the end of the PHE. However, even if states begin disenrollments prior to the end of the PHE, they must still follow the unwinding guidance CMS has issued.
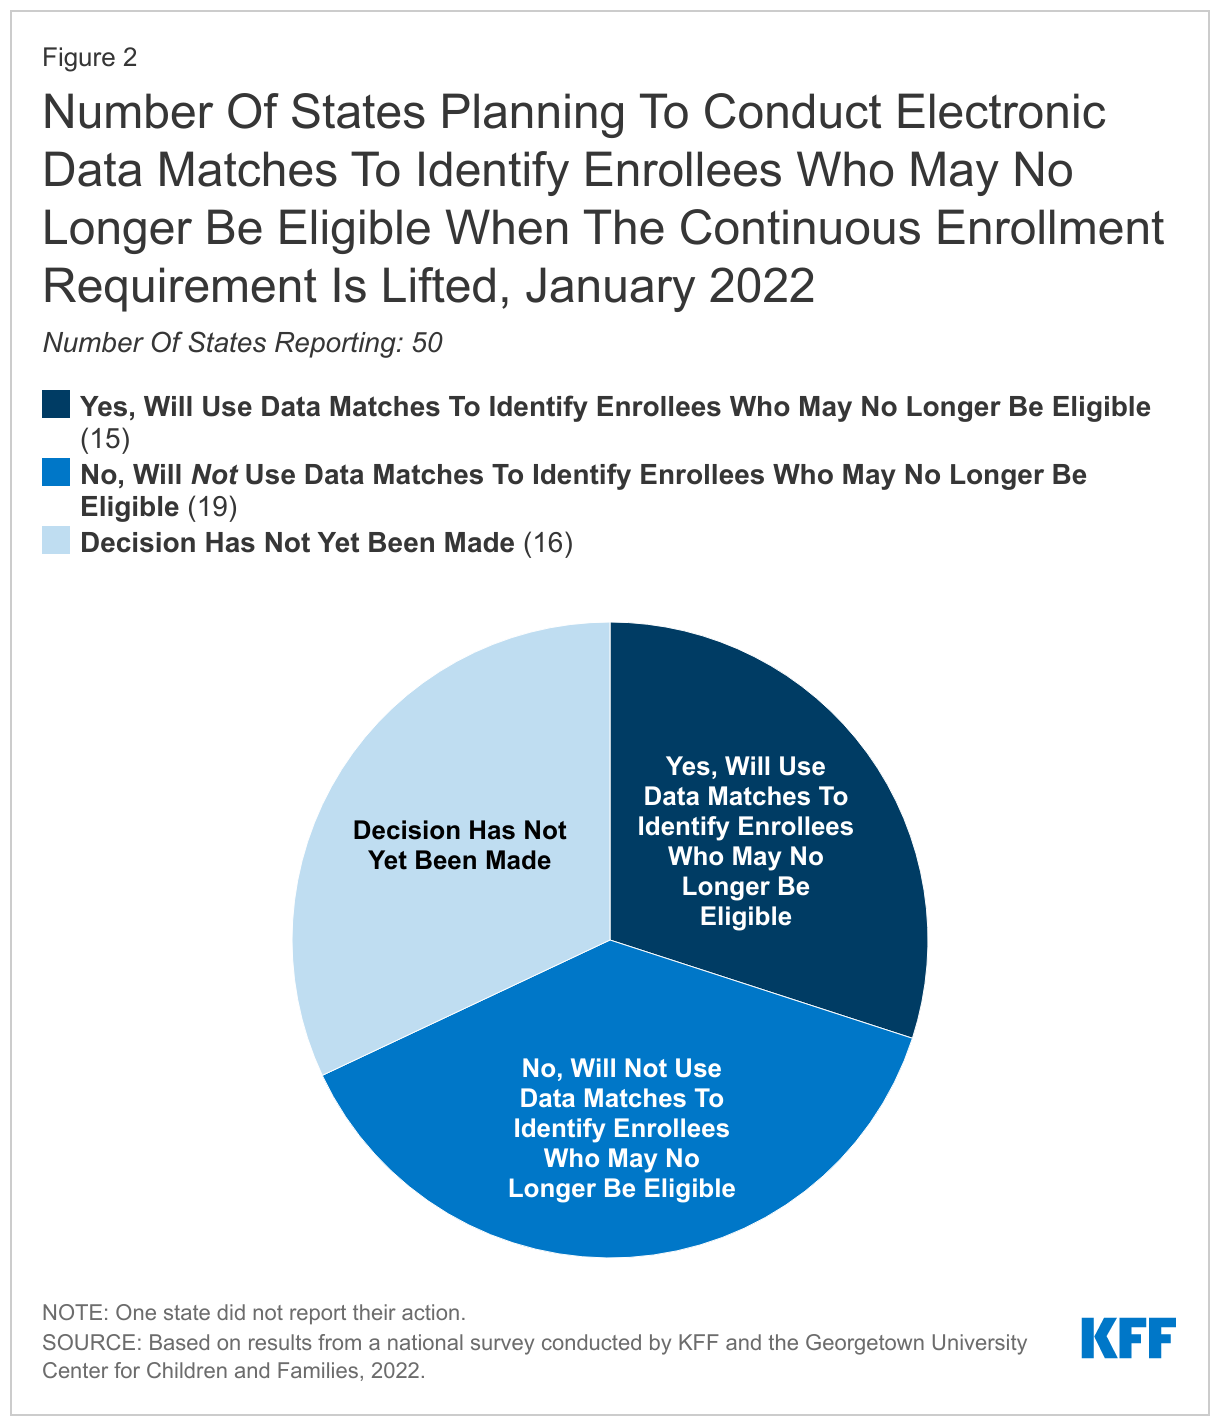
Fifteen states indicate they will conduct electronic data matches to identify and target enrollees for priority action who may no longer be eligible after the continuous enrollment requirement is lifted. States are not required to conduct data matches in between renewal periods. While data matches can identify people who experienced a change in income or circumstance that makes them no longer eligible, broad data searches may also identify inconsistent or inaccurate information that does not impact eligibility and could lead to eligible individuals losing coverage if they do not follow up.
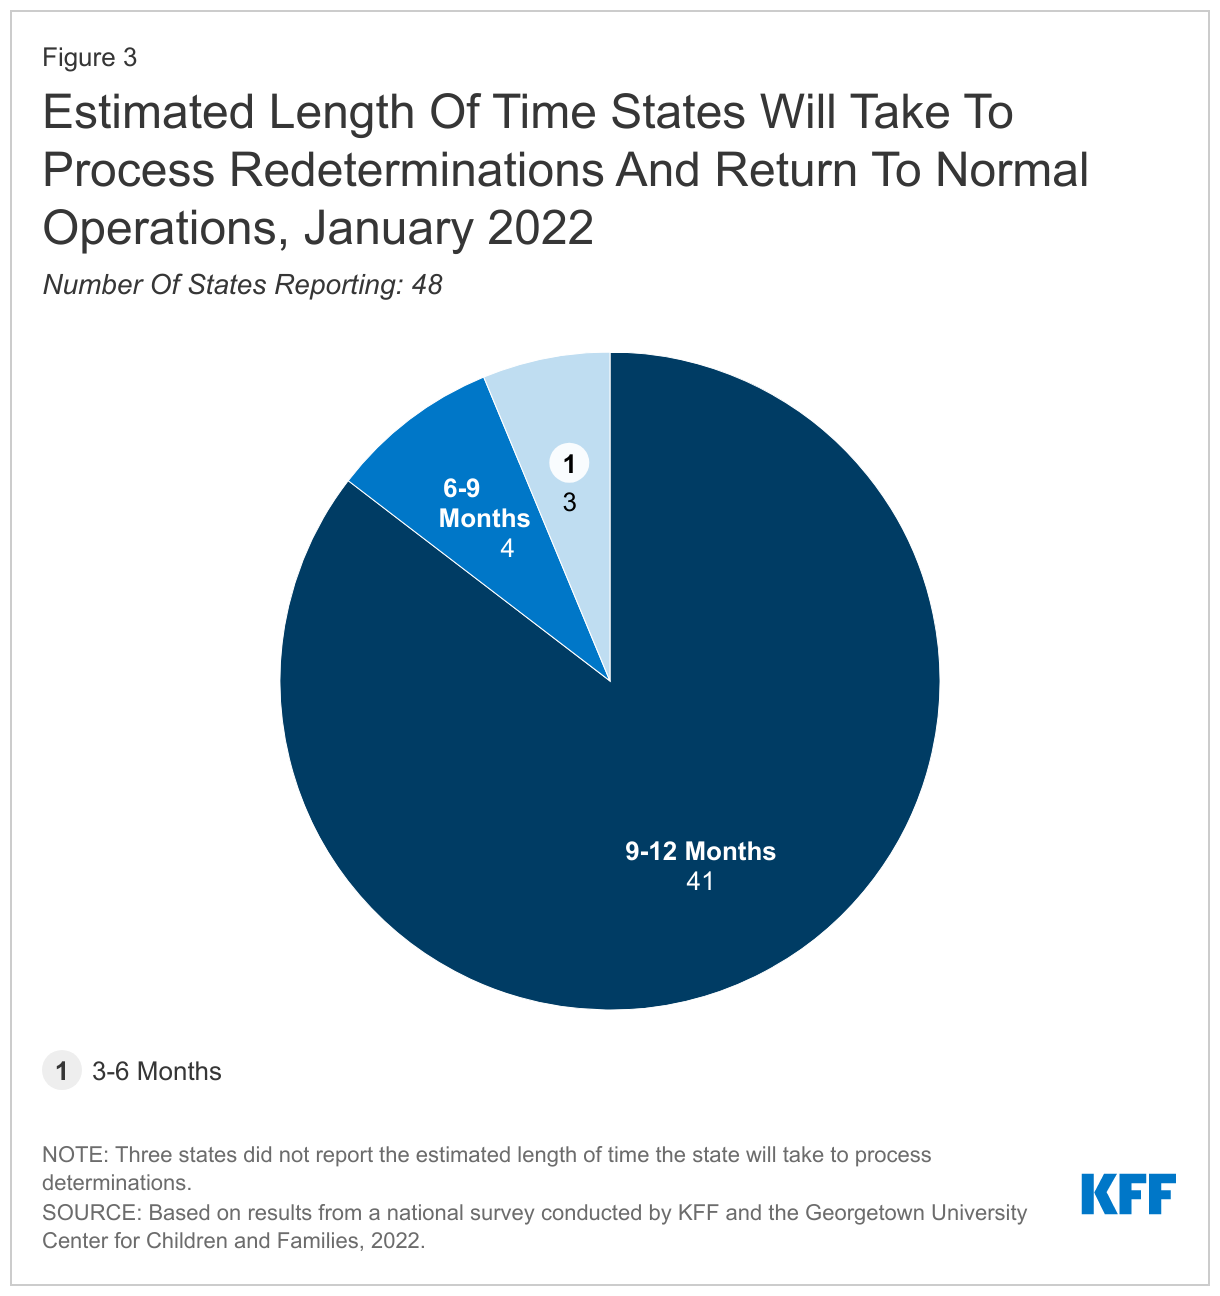
The majority of states (41) plan to take up to a full year to process redeterminations and return to routine operations; however, seven states plan to resume normal operations more quickly. When states resume redeterminations at the end of the PHE, they will need to conduct a fresh review of eligibility based on current circumstances before disenrolling anyone from Medicaid. Current CMS guidance gives states up to 12 months to initiate and 14 months to complete all redeterminations and 41 states indicate they will take at least 9 months and up to the full year. The elimination of the enhanced federal Medicaid matching rate (at the end of the quarter in which the PHE ends) could put fiscal or political pressure on states to move more quickly. The risk of moving quickly is that there will be less time to conduct outreach to enrollees and develop staff capacity to process renewals. CMS encourages states to initiate redetermination on no more than 1/9th of their total caseload each month to minimize this risk.
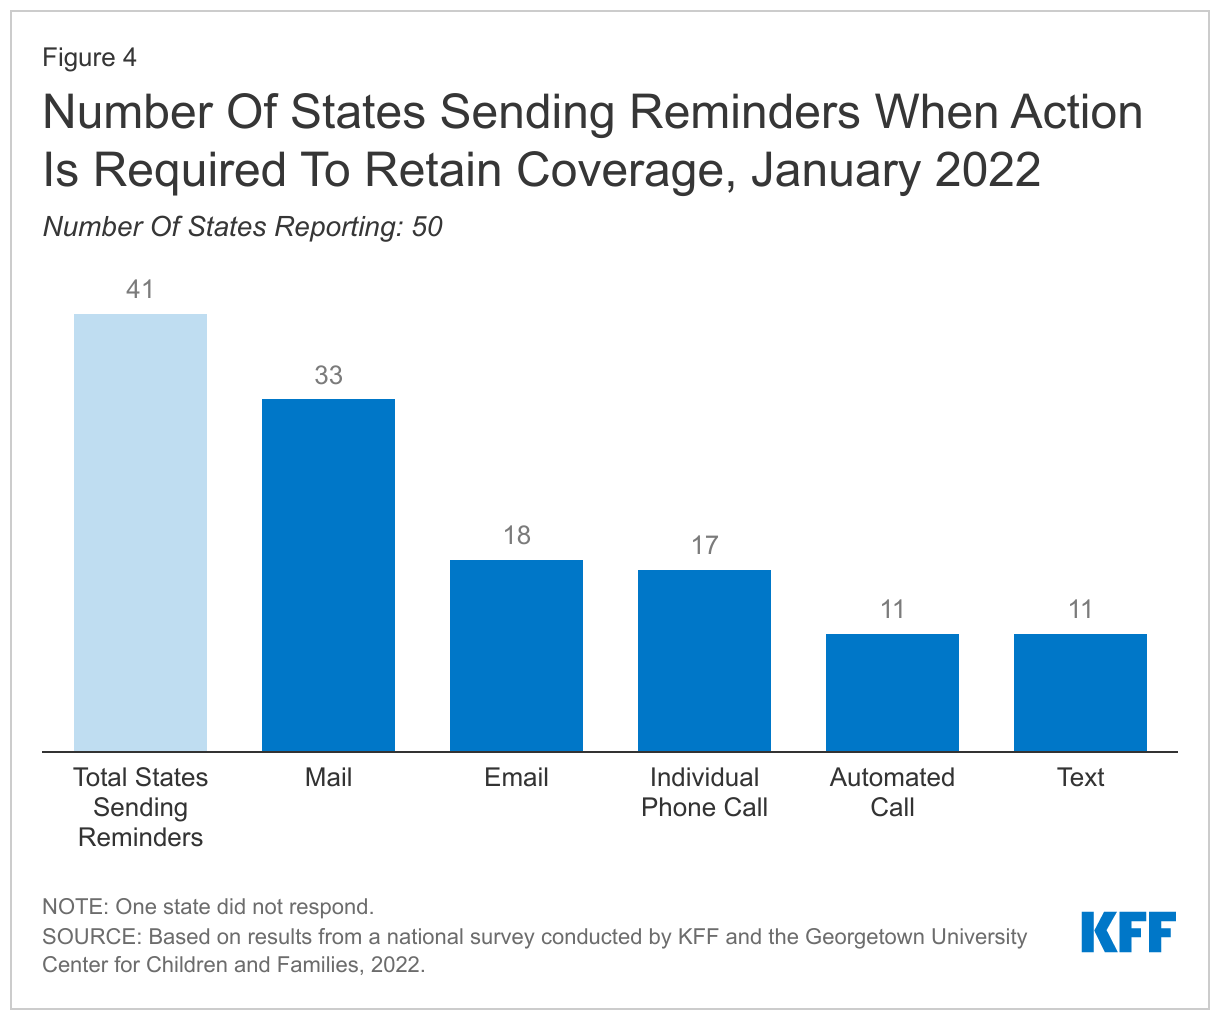
When the continuous enrollment requirement is lifted, a majority of states (41) plan to follow-up with enrollees when action must be taken to avoid a loss of coverage due to missing information. States are not required to follow up with enrollees who do not respond to a renewal request and may simply send a termination notice if no response is received within 30 days. However, sending reminder notices via mail – and also through other communication modes, such as phone, text, and/or email – can increase the response rate to renewal requests and reduce the number of people who remain eligible but are disenrolled at the end of the PHE because they did not respond to a request for information.
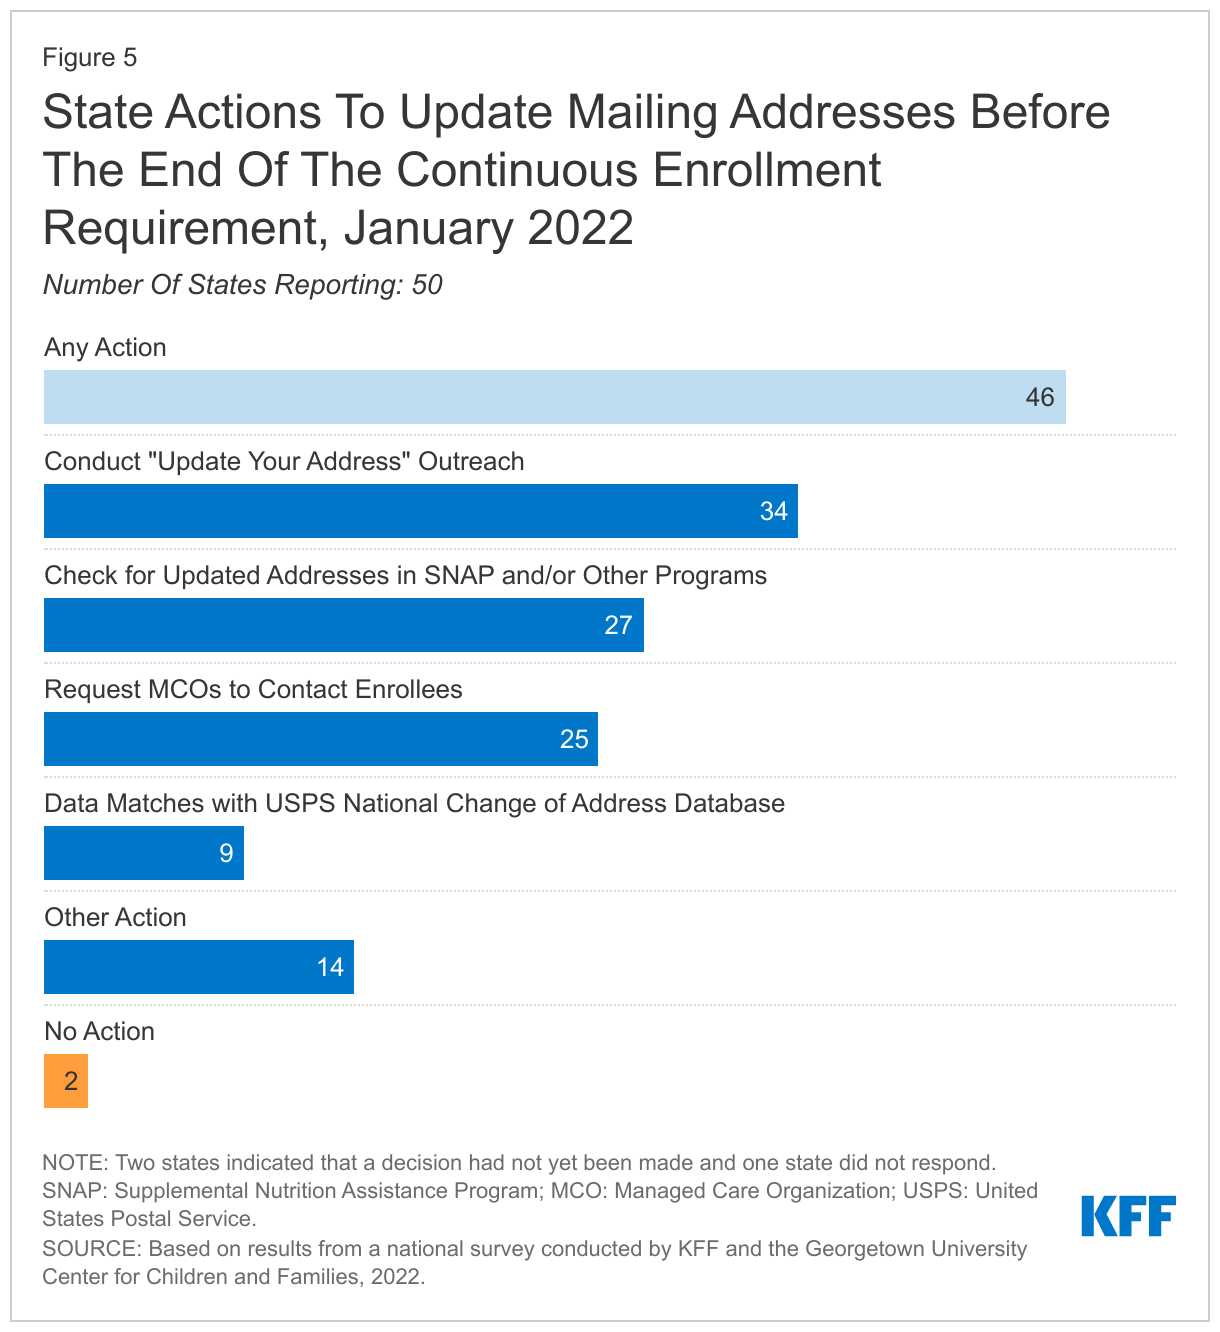
In preparation for the end of the PHE, states are taking steps to update enrollee mailing addresses. The two-year COVID-19 emergency has likely exacerbated longstanding difficulties in reaching enrollees by mail. In response, the vast majority of states (46) are planning actions to update mailing addresses before the end of the PHE, including conducting data matches with the United States Postal Service (USPS) National Change of Address database; working with managed care organizations (MCOs); and conducting outreach campaigns. In addition, 35 states will follow-up on returned mail to attempt to locate an enrollee before terminating coverage.
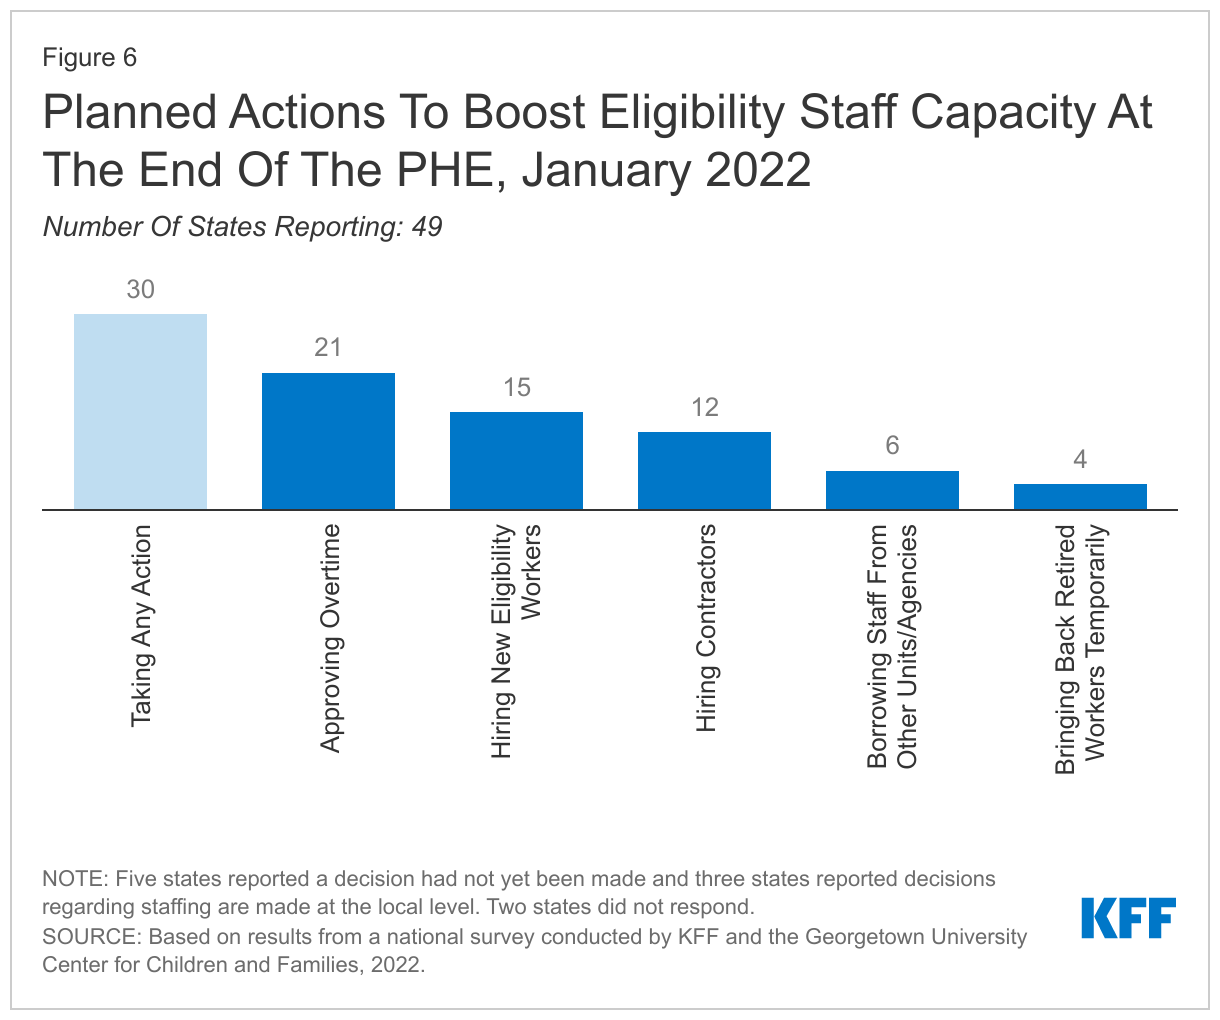
Anticipating the need for additional staff resources at the end of the PHE, 30 states plan to take steps to boost staff capacity. Most states are taking multiple actions that include approving overtime, hiring new eligibility workers or contractors, or borrowing staff from other units or agencies.
Most states are able to report key metrics needed to monitor the unwinding process. Almost all states (50) report they are capable of tracking call center statistics and a majority (41) are able to report the share of disenrollments that were determined ineligible versus disenrollments due to procedural reasons. Having timely and reliable data from states will be needed to monitor the unwinding process and assess whether additional steps should be taken to avoid coverage losses among those who remain eligible. In recent guidance, CMS has indicated it will require states to report monthly data to monitor their progress on unwinding and compliance with current rules, although there is no indication the data will be released publicly.
In 20 states able to report, it is estimated that about 13% of Medicaid enrollees will be disenrolled when the continuous enrollment requirement ends. However, the estimates range widely across reporting states from about 8% to over 30% of total enrollees. Based on available data, most states report that an increase in income will be the primary reason for the disenrollment although several states also expect incomplete renewals or missing documentation will be a primary reason for disenrollment. If these estimates hold true, millions of people will lose Medicaid coverage in the months following the end of the PHE; however, many children will likely be eligible for CHIP and many adults will likely be eligible for Affordable Care Act (ACA) Marketplace or other coverage. Successfully transitioning these individuals into those other coverage options could avoid gaps in coverage and reduce the number who lose coverage altogether and become uninsured.
Enrollment and Renewal Policies During the PHE
Even during the PHE, states continue to streamline application processes and integrate non-MAGI and non-health programs into the system that determines MAGI Medicaid eligibility. In almost all states, applications can be submitted online, by telephone, in person, or by mail. Additionally, nearly all states (48) now offer online accounts for Medicaid and CHIP enrollees that make it easier for individuals to submit and access information about their coverage. States have taken steps to improve the mobile friendliness of their applications and online accounts. All states use electronic data matches from a variety of data sources to verify income eligibility and, as a result, most states (43) can provide eligibility determinations in real time (within 24 hours).
While states cannot disenroll people, as of January 2022, most states (42) report processing ex parte renewals and sending renewal forms (30 states) to reduce backlogs in renewals at the end of the PHE. By continuing ex parte renewals during the PHE, states have been able to renew coverage for 12 months for those who remain eligible. Of the 42 states actively processing ex parte renewals, nearly two-thirds (30 states) are sending renewal forms or requests for documentation when they are unable to confirm ongoing eligibility through electronic data sources, although they may not disenroll anyone during the PHE. By processing ex parte renewals and sending out renewal forms, states will have a smaller backlog of delayed renewals or pending actions when the PHE ends.
Medicaid and CHIP Eligibility
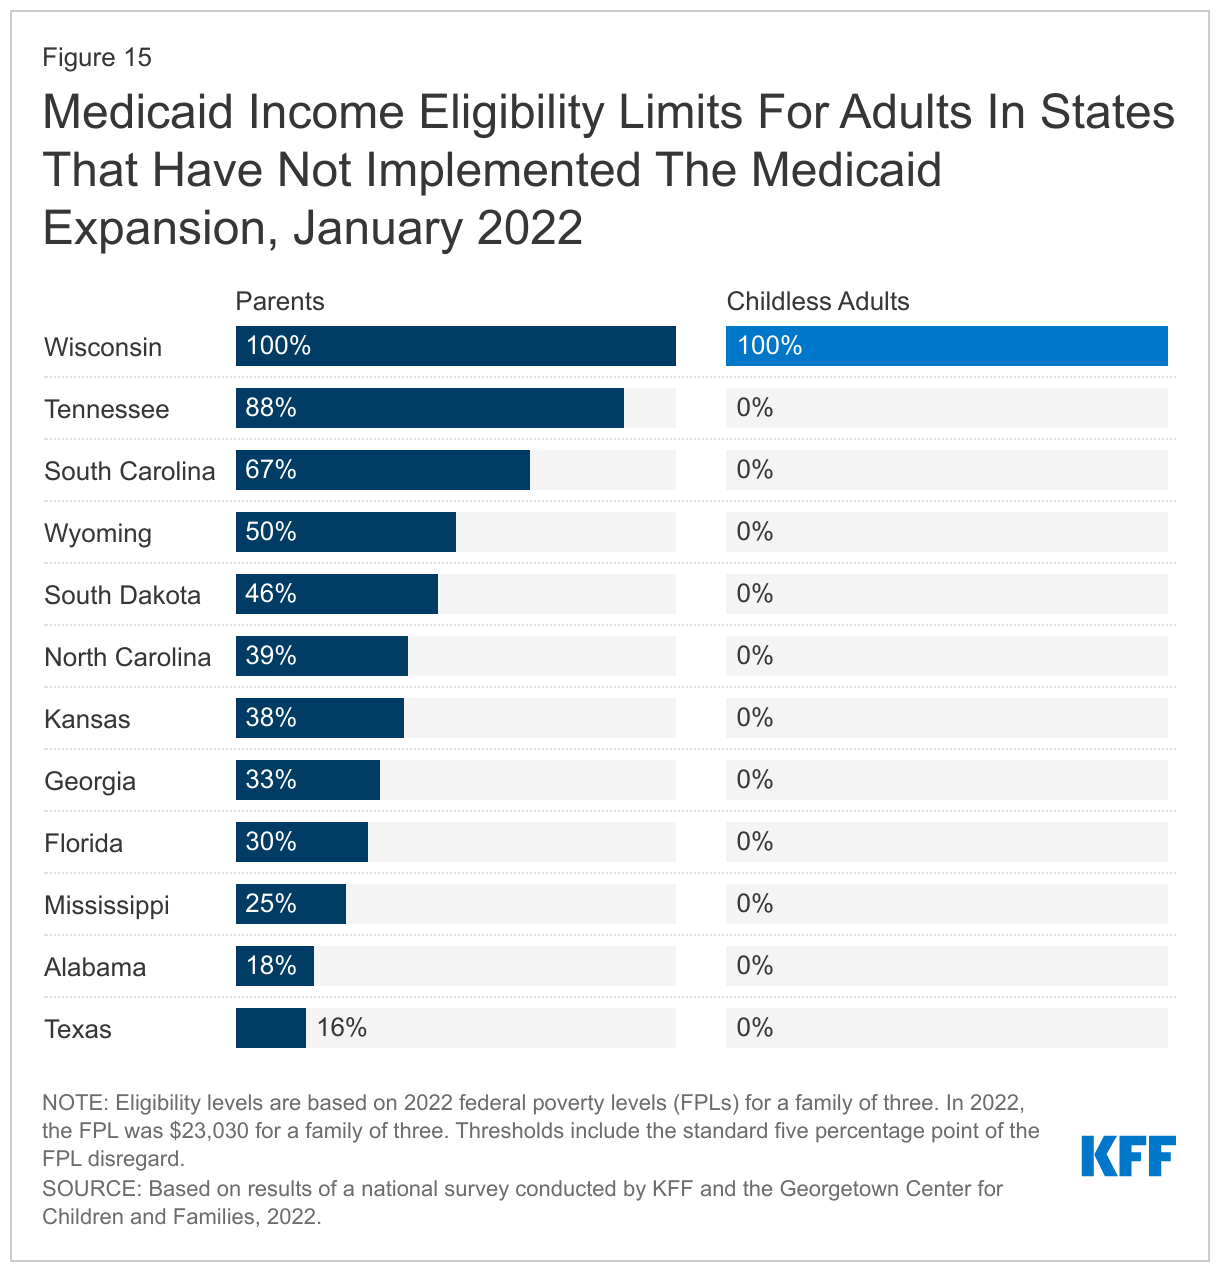
As of January 2022, Medicaid and CHIP eligibility was stable as the PHE protections remained in effect for the entirety of 2021. Oklahoma and Missouri implemented the ACA Medicaid adult expansion in 2021, leaving only 12 states that have not filled the coverage gap for low-income adults. In the 12 states that have not implemented the Medicaid expansion, eligibility for parents remains extremely low (ranging from 16% to 100% of the poverty level) and only Wisconsin covers adults without dependent children (through a waiver of standard Medicaid eligibility rules). Eligibility levels for children and pregnant women held constant with median eligibility at 255% of the federal poverty level (FPL) and 205% FPL respectively.
Looking Ahead
Recent CMS guidance provides guardrails and flexibilities for states to promote continuity of coverage during the unwinding period; however, state decisions and actions will have implications for Medicaid enrollment. Recently released guidance emphasizes strategies to promote continuity of coverage. The guidance reiterates existing options for states, such as adopting 12-month continuous eligibility for children and extending postpartum coverage for 12 months, and provides additional flexibilities, including using Supplemental Nutrition Assistance Program (SNAP) eligibility to renew Medicaid coverage. How states approach the unwinding of the continuous enrollment requirement will affect the extent to which eligible individuals retain coverage and those who are no longer eligible are able to transition to other coverage. Outcomes will differ across states as they make different choices and careful monitoring of state progress throughout the unwinding period can provide information to assess fiscal effects and state efforts to promote continuity of coverage.
The fate of the Build Back Better Act (BBBA) will have implications for overall coverage. The BBBA includes provisions to close the Medicaid coverage gap in states that have not adopted the ACA Medicaid expansion and to extend the enhanced Marketplace premium subsidies initially made available by the American Rescue Plan Act (ARPA), which have made coverage more affordable for millions of people. While the number of people who are uninsured has not increased during the PHE as many had predicted, millions of people could lose coverage if those who continue to be eligible for Medicaid are not able to retain coverage, and if the provisions in the BBBA that close the coverage gap and make Marketplace coverage more affordable are not enacted.
Report
Introduction
The extension of the coronavirus public health emergency through the entirety of 2021 had a significant impact on Medicaid and the Children’s Health Insurance Program (CHIP). Since its emergence in early 2020, the coronavirus’ twin economic and public health crises continued to expose significant disparities in the public health infrastructure and further highlighted the importance of health coverage. During this time, enrollment in Medicaid increased as people sought coverage after losing jobs or income because of the pandemic. Provisions in the Families First Coronavirus Response Act (FFCRA) and the Coronavirus Aid, Relief and Economic Security Act (CARES), require states to maintain eligibility standards and provide continuous enrollment in Medicaid until the end of the public health emergency (PHE) to qualify for a 6.2 percentage point increase in Federal Medical Assistance Percentage (FMAP). The continuous enrollment requirement and other economic factors resulted in Medicaid enrollment growth of 19.1% between February 2020 and September 2021 (the most recently available data), with much of the increase occurring in the first year of the PHE. States also adopted other temporary changes in their state Medicaid plans, through disaster-related authorities, to streamline processes and connect individuals to coverage more quickly, such as expanding the use of presumptive eligibility, waiving premiums and cost-sharing, and allowing self-attestation of certain eligibility criteria.
This 20th annual survey of Medicaid and CHIP program officials in the 50 states and the District of Columbia (DC) conducted in January 2022 by KFF and the Georgetown University Center for Children and Families provides data on state Medicaid and CHIP eligibility levels and presents a snapshot of key aspects of state enrollment and renewal procedures in place during the second year of the COVID-19 PHE. In anticipation of the likely end of the PHE in 2022, this year’s survey also focuses on actions states are taking to prepare for the lifting of the continuous enrollment requirement. The report includes policies for children, pregnant women, parents and other non-elderly adults whose eligibility is based on Modified Adjusted Gross Income (MAGI) financial eligibility rules; it does not include policies for groups eligible through Medicaid pathways for adults over the age of 65 or on the basis of disability.
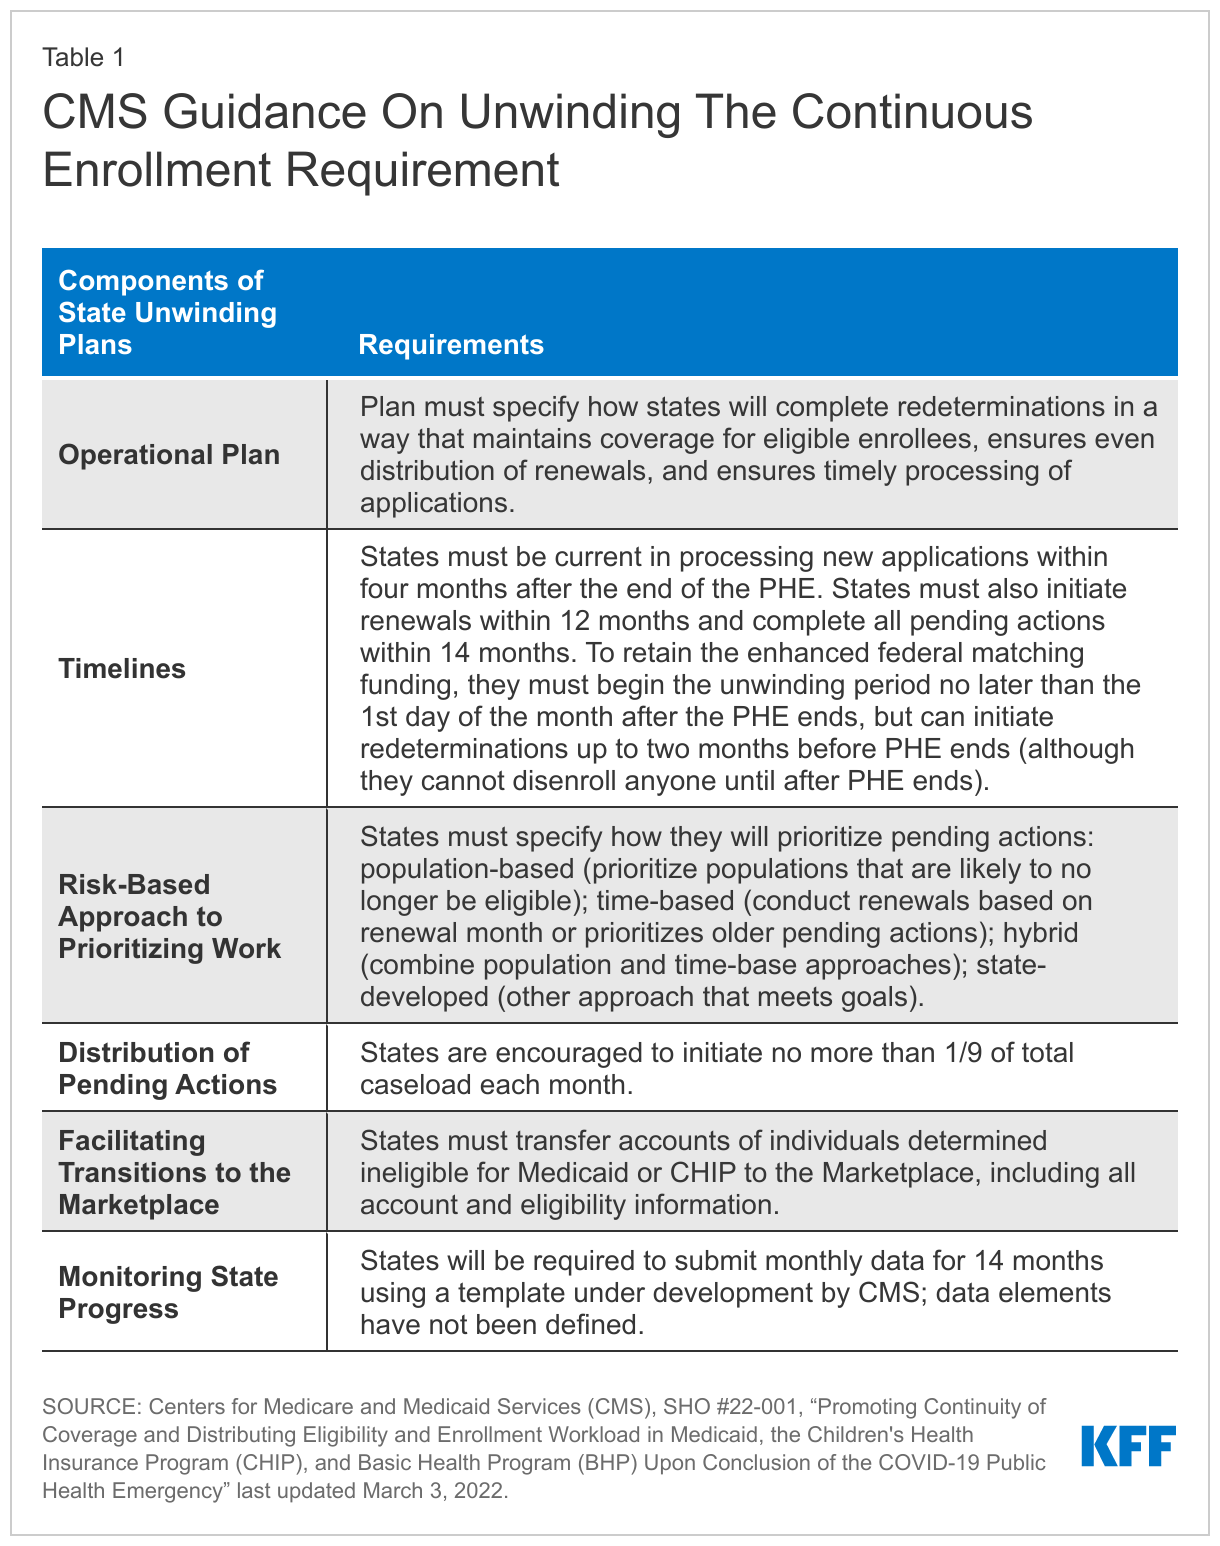
CMS released new guidance on March 3, 2022 that emphasizes promoting continuity of coverage and avoiding inappropriate coverage terminations when the continuous enrollment requirement ends (Table 1). While this recent guidance was released after the survey was fielded, state responses reported here illustrate how states expect to approach the unwinding of continuous enrollment and what the effects of the new guidance may be.
Preparing for the End of the PHE
Resuming Redeterminations and Disenrollments
States are required to develop plans for how they will prioritize outstanding eligibility and renewal actions when the continuous coverage requirement is lifted; just over half of states (27) have determined their approach (Figure 1). Given uncertainty around the timing of the end of the PHE, additional guidance that CMS may issue, and the future of the BBBA, it is perhaps not surprising that many states have yet to finalize their plans. However, having plans in place early will allow for better preparation and will enable states to communicate their plans to enrollees and other stakeholders in the state. Among the states with firm plans, eleven states indicate they will target individuals who have been flagged with a change in circumstances and/or are no longer likely to be eligible (population-based approach) while eight states plan to conduct fresh renewals based on the individual’s renewal month (time-based approach). Eight states plan to adopt a hybrid approach that combines the population- and time-based approaches. States adopting a population-based approach mentioned targeted strategies, including aligning renewals in some way with the Supplemental Nutrition Assistance Program (SNAP), prioritizing those with premiums in order to avoid unnecessary billing, processing individuals who have aged out of coverage, and deprioritizing pregnant women. Regardless of the approach a state adopts, the operational plan must consider ways to ensure continuity of coverage among those who remain eligible. While most states plan to wait until the continuous enrollment requirement is lifted to resume disenrollments, three states have not decided whether to forgo enhanced federal funding and begin disenrollments before the end of the PHE. However, even if states begin disenrollments prior to the end of the PHE, they must still follow the unwinding guidance CMS has issued.
Fifteen states indicate they will conduct electronic data matches to identify and target enrollees for priority action who may no longer be eligible after the continuous enrollment requirement is lifted (Figure 2). Nineteen states do not plan to conduct these types of data matches and 16 states indicate that a decision has yet to be made. While taking steps to identify individuals whose income has increased above Medicaid thresholds may be a useful way to prioritize renewals, these data searches, if broad in nature, can result in unintended consequences. Wide-ranging data searches may identify inconsistent or inaccurate information that does not impact eligibility; however, states may be prompted to take action on these discrepancies, which could lead to eligible individuals losing coverage if they do not follow up. In the most recent guidance, CMS recommends states suspend periodic data matches as a way to improve coverage retention and reduce churn.
The majority of states plan to take up to a full year to process redeterminations and return to routine operations (Figure 3). When states resume redeterminations at the end of the PHE, they will need to conduct a fresh review of eligibility based on current circumstances and consider eligibility for all eligibility pathways before disenrolling anyone from Medicaid. Current CMS guidance, released after the survey was fielded, gives states up to 12 months to initiate and 14 months to complete the backlog of redeterminations. Of the 48 states that have established a timeframe for processing redeterminations, 41 states plan to take 9-12 months; four states plan to take 6-9 months; and three states plan to take 3-6 months. No state currently plans to take less than 3 months. Importantly, the enhanced federal Medicaid matching rate will end at the end of the quarter in which the PHE ends, which could put fiscal or political pressure on states to move more quickly. The risk of moving quickly is that there will be less time to conduct outreach to enrollees and develop staff capacity to process renewals. CMS encourages states to initiate redeterminations on no more than 1/9th of their total caseload each month to minimize this risk.
When the continuous enrollment requirement is lifted, a majority of states (41) plan to follow-up with enrollees when action must be taken to avoid a loss of coverage due to missing information (Figure 4). States must give individuals 30 days to respond to a renewal request but there is no federal requirement for states to do more than send the renewal form, followed by a termination notice if the individual does not respond. However, sending reminder notices via mail and also through other communication modes, such as phone, text, and/or email, can increase the response rate to renewal requests. Follow-up reminders can be key to reducing the number of people who remain eligible but are disenrolled at the end of the PHE because they did not respond to a request for information. Of the 41 states that plan to send reminders, about half (25) will attempt to contact enrollees at least two times and most plan to use a variety of communication modes ranging from mail (33 states), email (18), individual phone call (17), automated call (11), and text (11).
Updating Contact Information
The vast majority of states (46) are planning actions to update mailing addresses before the end of the PHE (Figure 5). Outdated mailing addresses and returned mail have long been a problem in Medicaid and the impact of the more than two-year COVID-19 emergency is expected to exacerbate difficulties in reaching enrollees by mail, the primary method states use to send renewals and requests for information. Most states are taking proactive steps to update mailing addresses before the end of the PHE, including conducting “update your address” outreach (34 states); checking for updated addresses in SNAP or other benefit programs (27 states); working with managed care organizations (MCOs) (25 states); and conducting data matches with the United States Postal Service (USPS) National Change of Address database (9 states). Two states have not yet made a final decision on what actions they will take. The total number of states taking steps is higher than the 19 states indicating they were taking proactive steps to update mailing addresses in the 2021 survey.
Over two-thirds of the states (35) take steps to follow-up on returned mail beyond re-mailing a notice to the same address. Returned mail has been a persistent problem in Medicaid, and CMS has provided guidance to the states on dealing with returned mail, depending on whether mail is returned with an in-state, out-of-state, or no forwarding address. Of the 35 states that take action on returned mail, almost all (32) follow up by telephone, while 12 states indicate they use email, 8 states check other programs and data sources, and 3 states use text to contact enrollees about the need to update their mailing address. Once the PHE expires, under current federal rules, states that do not have follow-up procedures in place may automatically terminate coverage without the advance ten-day notice when an enrollee cannot be located. However, using alternative methods for following up on returned mail can help reduce the number of disenrollments that occur when regular mail does not reach an enrollee.
Boosting Staff Capacity
More than half of states (30) plan to take steps to boost staff capacity at the end of the PHE (Figure 6). Like many employers, state eligibility agencies have experienced challenges in retaining and recruiting eligibility workers during the pandemic. Staff hired in the past two years are not experienced in processing renewals, and even workers with more tenure need refresher training. Of the states planning to boost workforce capacity, 21 states plan to approve overtime, while 15 states plan to hire new eligibility workers, and 12 states plan to hire contractors to boost capacity. Fewer states plan to borrow staff from other units/agencies or bring back retired workers on a temporary basis.
Monitoring the Return to Normal Operations and Estimating Coverage Impacts
Almost all states (50) report they are capable of tracking call center statistics and a majority (41) are able to report the share of disenrollments that were determined ineligible versus disenrollments due to procedural reasons. Having timely and reliable data from states on key metrics will be needed to monitor the unwinding process and assess if the state needs to take additional steps to avoid coverage losses among those who remain eligible. Unreasonable call wait times and increasing loss of coverage due to procedural reasons can signal early problems that could warrant oversight from CMS. States have been required to report data on call wait time and reason for disenrollment along with other metrics to CMS through the Performance Indicator Project. However, most of these data are not publicly reported by CMS, making them less useful for monitoring the immediate effects of the unwinding of the continuous enrollment requirement on coverage unless a state chooses to voluntarily share key data. In recently released guidance, CMS has indicated it will require states to report monthly data on their progress with the unwinding, although it has not yet identified the data elements that states will be required to report.
In 20 states able to report, it is estimated that about 13% of Medicaid enrollees will be disenrolled when the continuous enrollment requirement ends. However, the estimates range widely across reporting states from about 8% to over 30% of total enrollees. Based on available data, most states report that an increase in income will be the primary reason for the disenrollments, but several states also expect incomplete renewals or missing documentation to be a primary reason for disenrollment. If these estimates hold true, millions of people will lose Medicaid coverage in the months following the end of the PHE; however, many children will likely be eligible for CHIP and many adults will likely be eligible for Marketplace or other coverage. Successfully transitioning these individuals into those other coverage options could reduce the number who lose coverage altogether and become uninsured.Back to top.
Enrollment and Renewal Processes During the PHE
Eligibility System Integration
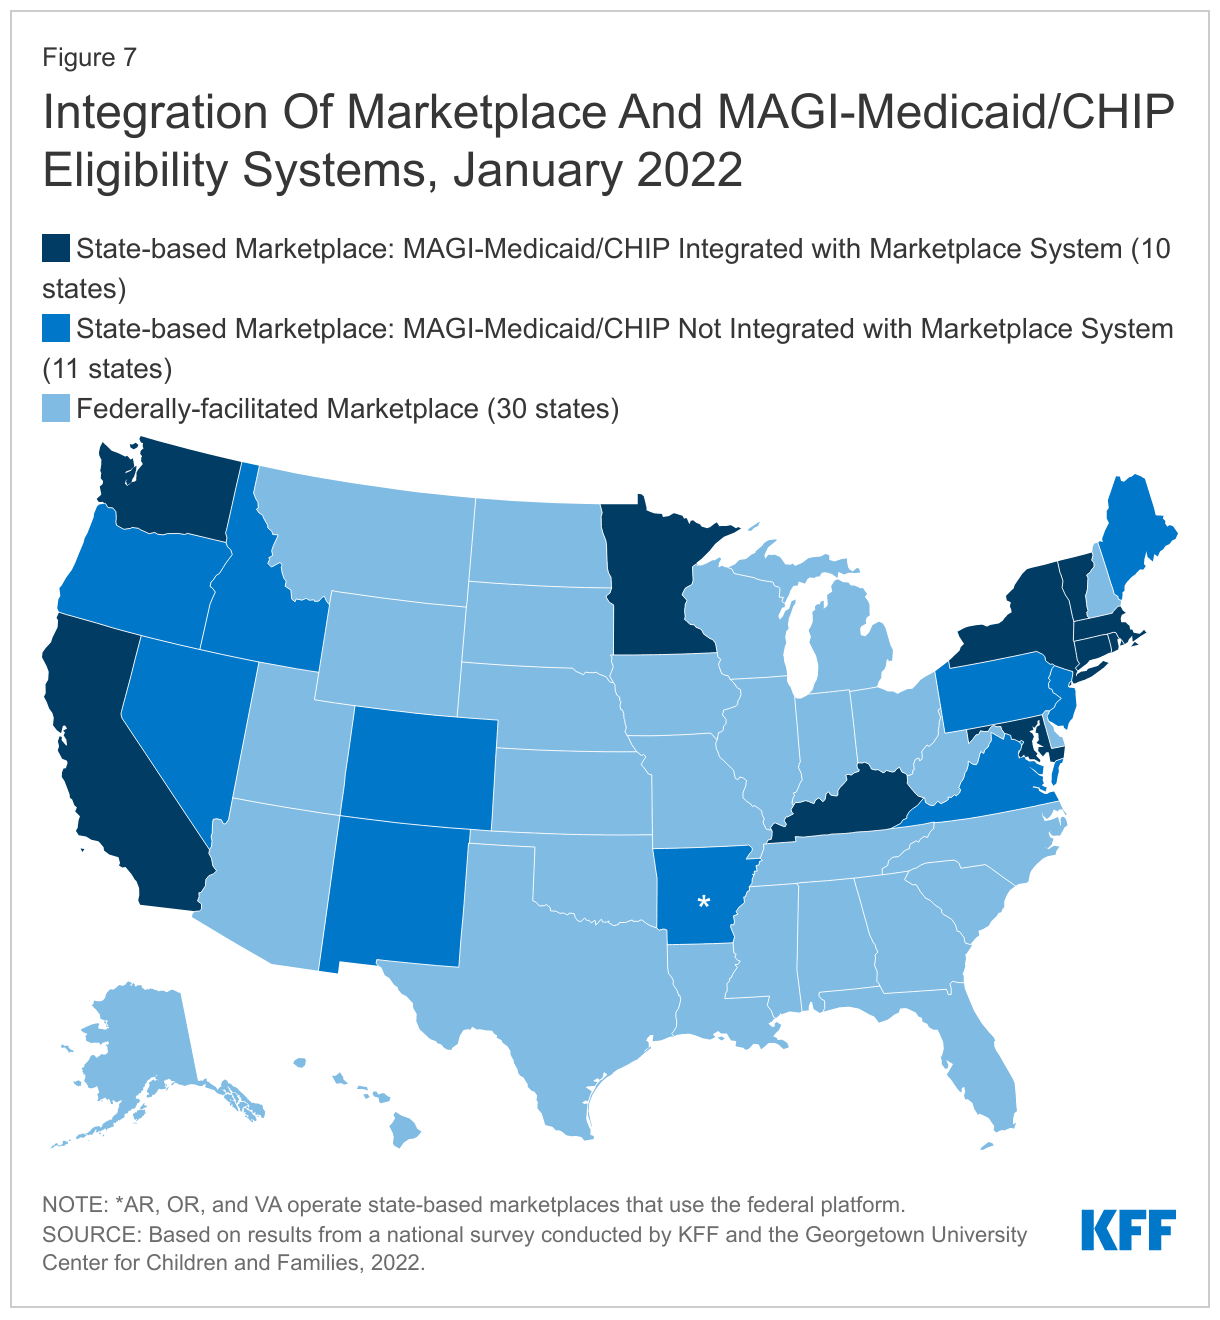
While more states are moving toward managing their own State-based Marketplaces (SBM), not all SBM states have integrated Medicaid and CHIP into their Marketplace eligibility and enrollment system (Figure 7). Since 2020, six states transitioned to SBM status, bringing the total number of SBMs to 21, which includes 18 states that operate their own Marketplace eligibility systems and three states that rely on the federal healthcare.gov platform (SBM-FP). The remaining 30 states rely on the Federally-facilitated Marketplace (FFM) for some or all Marketplace functions. SBM states can choose to integrate Medicaid and CHIP into their Marketplace eligibility system, which can facilitate transitions of coverage between Medicaid, CHIP, and the Marketplaces. However, not all states have done so, particularly states that transitioned to full SBM status more recently. In 10 of the 18 SBM states with their own systems, the Marketplace eligibility system also determines eligibility for MAGI Medicaid and CHIP, but eight SBM states have yet to integrate Medicaid and CHIP into their Marketplace system. These eight SBM states, along with the three SBM-FP states and 30 FFM states that use healthcare.gov, have separate Medicaid and CHIP eligibility systems (41 states in total).
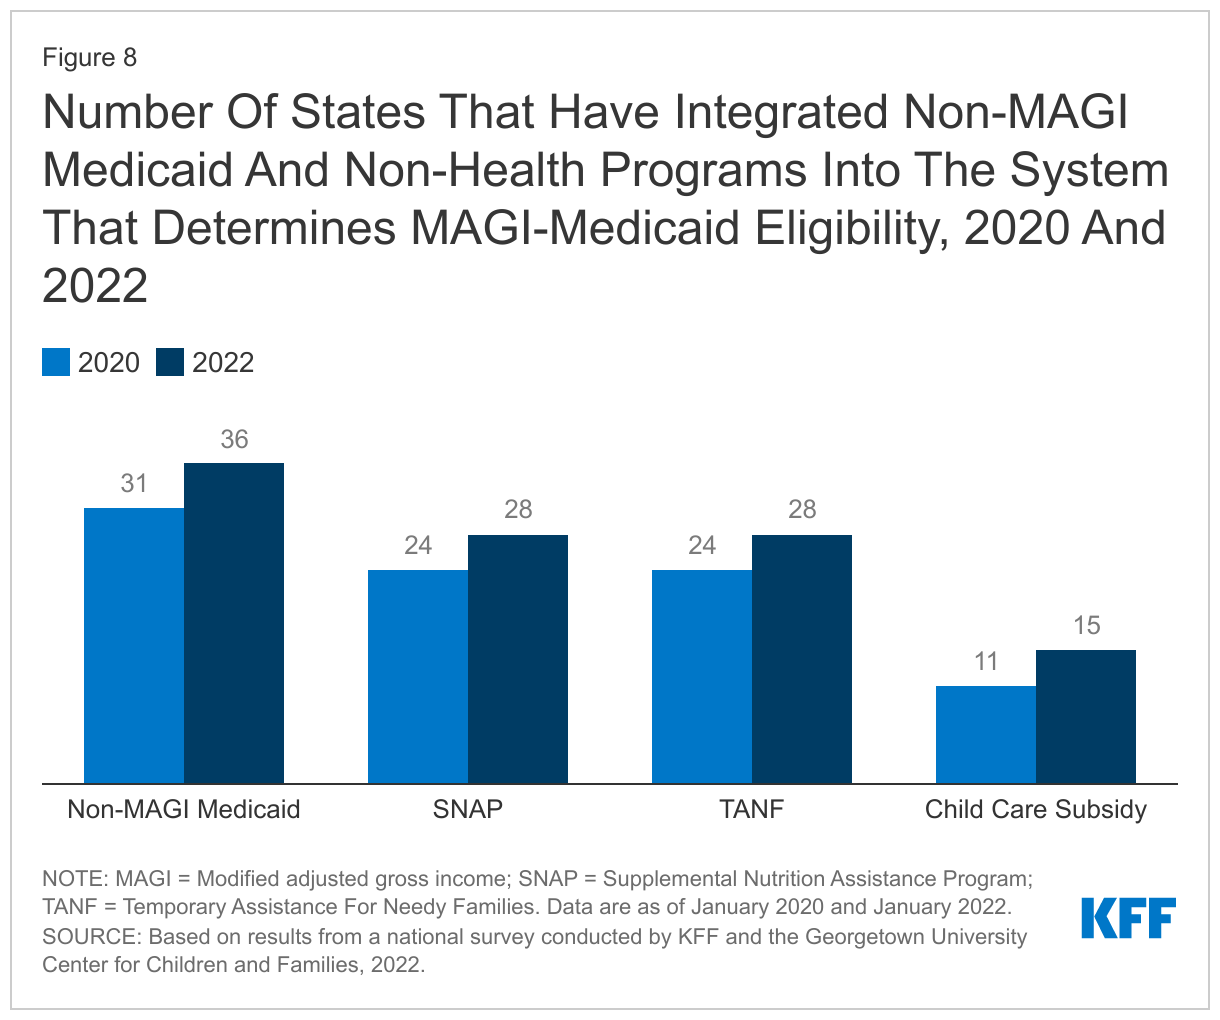
States continue to integrate non-MAGI and non-health programs into the system that determines MAGI Medicaid eligibility. When the ACA Medicaid expansion and other changes were implemented in 2014, many states delinked their Medicaid eligibility systems for MAGI groups (children, pregnant women parents, and expansion adults) from their systems for seniors and individuals with disabilities (non-MAGI groups) and from non-health programs, including Supplemental Nutrition Assistance Program (SNAP), Temporary Assistance for Needy Families (TANF), and child care subsidies. Since then, however, many states have reintegrated these programs. Systems that integrate eligibility for all health programs, as well as non-health programs, make it easier for individuals to apply for multiple assistance programs and for states to consolidate eligibility tasks, increasing administrative efficiency. It also allows for the sharing of information across programs to verify eligibility and facilitate renewals for Medicaid. In January 2022, over two-thirds of states (36) reported having integrated non-MAGI Medicaid with the MAGI Medicaid and CHIP eligibility system. SNAP and TANF are integrated in the system that determines eligibility for Medicaid in 28 states while 15 states have also integrated child care subsidies into their MAGI Medicaid eligibility systems (Figure 8). These counts include Kentucky and Rhode Island, the only SBM states that have fully integrated their Marketplace eligibility system with eligibility for MAGI Medicaid, non-MAGI Medicaid, and non-health programs.
Applications, Online Accounts, and Mobile Access
In almost all states, applications can be submitted online, by telephone, in person, or by mail. All states accept applications online and in person (subject to COVID restrictions) while 50 states offer paper applications that can be mailed in, and 49 states accept applications by telephone without requiring a written signature. More than half of the states (28) accept applications through other modes, most frequently fax or email.
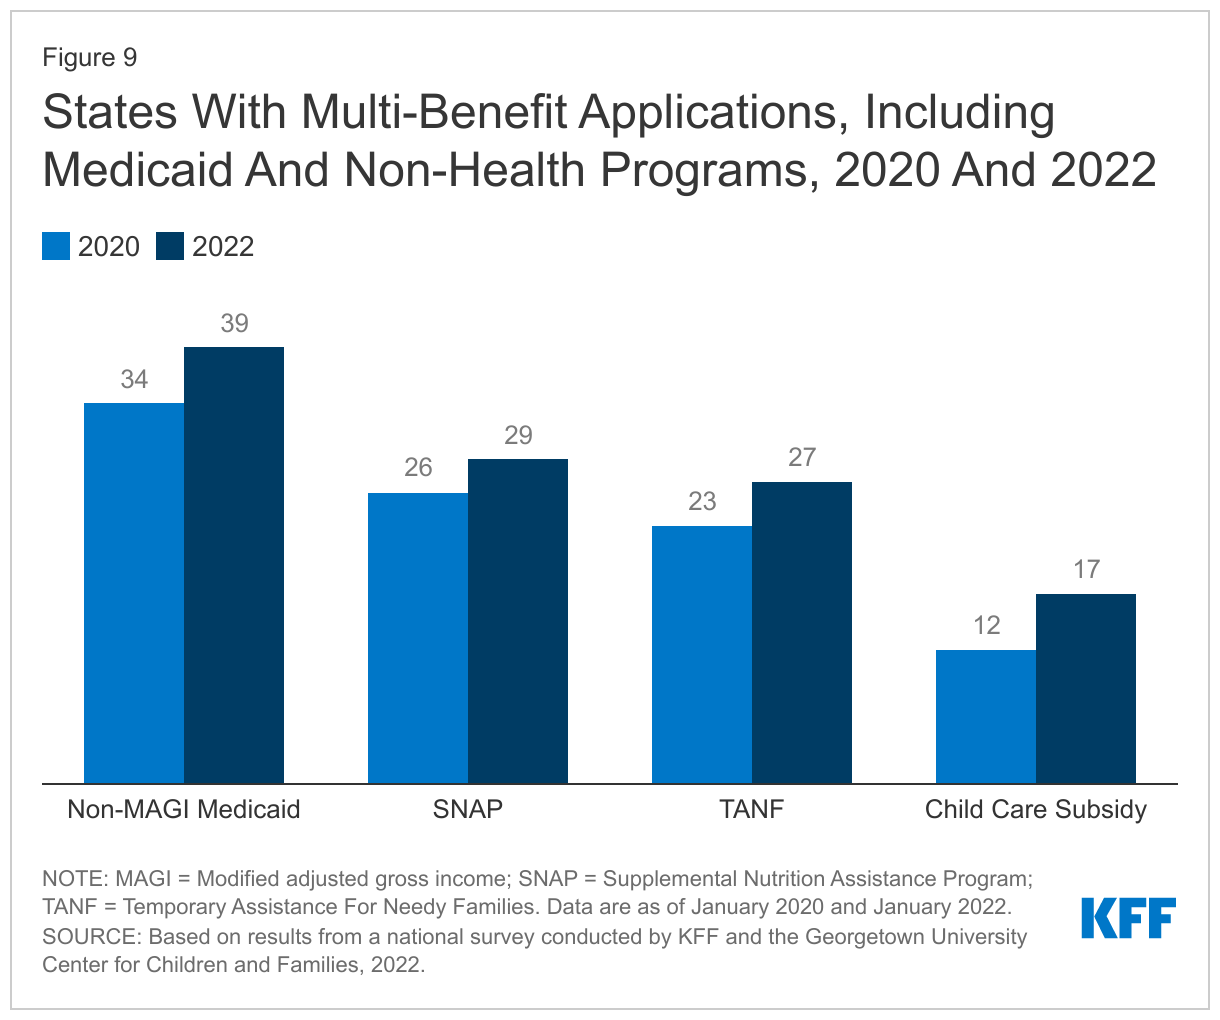
Several states have added non-MAGI Medicaid and non-health programs to their applications during the pandemic. Thirty-nine states allow applicants to apply for both MAGI and non-MAGI Medicaid through a single application, up from 34 states in 2020. Multi-benefit applications now include SNAP in 29 states (up from 26 states in 2020) and TANF in 27 states (up from 23 states in 2020). In addition, 17 states include child care subsidies in their multi-benefit applications, up from 12 in 2020 (Figure 9). Multi-benefit applications are more common in states that have Medicaid eligibility systems that are integrated with non-MAGI Medicaid and non-health programs.
Nearly all states (48) now offer online accounts for Medicaid and CHIP enrollees that make it easier for individuals to submit and access information about their coverage. Five states (Arkansas, Iowa, Kansas, Missouri, and North Carolina) launched online accounts since January 2020. Almost all states that have online accounts allow individuals to check application status, report changes, and view notices while slightly fewer permit individuals to renew coverage through their account. Since January 2020, several states have expanded the features offered, including the ability to upload documentation and the option to receive notices electronically (41 states up from 33 states in 2020).
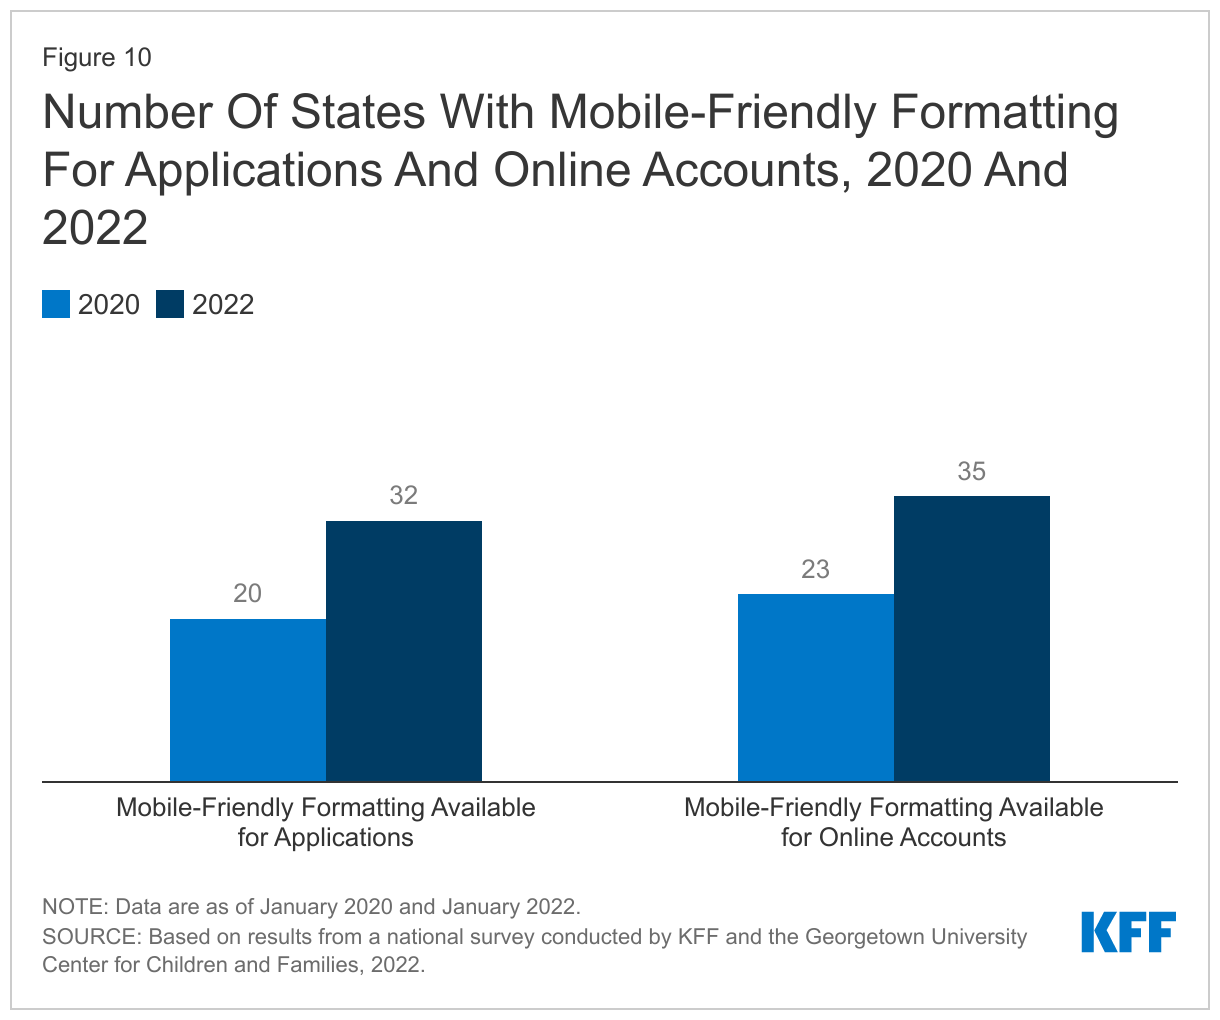
States have taken steps to improve the mobile friendliness of their applications and online accounts. As more individuals use smart devices, such as phones and tablets, states are increasingly working to ensure that applications and online accounts can be used on multiple technology platforms. As of January 2022, 32 states report their online applications are mobile friendly compared to just 20 states in 2020. Similarly, 35 of the 48 states with online accounts report mobile-friendly formatting, an increase of 12 states since 2020 (Figure 10).
Eligibility Verification Processes
All states use electronic data matches from a variety of data sources to verify income eligibility. Under the ACA, states must first attempt to verify eligibility (both income and other criteria) before requiring the individual to complete a form or submit documentation. Data-driven eligibility determinations at application and renewal are faster and reduce the burden of submitting and processing paperwork for both individuals and states. Data sources used by more than 40 states include the Federal Data Services Hub, state wage databases, and state unemployment databases. Two-thirds (34) of states also use commercial databases (like TALX or the Work Number) that provide wage information from large employers and 30 states access SNAP income data. Nearly all states access multiple sources to verify income.
The use of electronic data enables most states to process at least a small number of eligibility determinations in real time (defined as 24 hours); however, there is significant variation across states in the share of real-time determinations. Forty-three states report being able to make real-time eligibility determinations but some states indicate that while a small share of applications may be processed in 24 hours, their “systems are not programmed” to make real-time determinations; determinations made within 24 hours in these states require eligibility worker intervention. Since 2018, CMS has released an annual report showing the share of MAGI applications processed within five timeframes: within 24 hours; 1 – 7 days; 8 – 30 days; 31 – 45 days; and over 45 days.
Renewal Processes During the PHE
As of January 2022, most states (42) report processing ex parte renewals to extend coverage for individuals during the PHE. Under the ACA, states must seek to complete administrative or ex parte renewals by verifying ongoing eligibility through available data sources, such as state wage databases, before sending a renewal form or requesting documentation from an enrollee. Some states suspended renewals as they implemented the MOE continuous enrollment requirement and made other COVID-related adjustments to operations. Under normal circumstances, if a state cannot determine that an individual remains eligible based on available information, it must send the enrollee a pre-populated form with the renewal information and provide at least 30 days for the enrollee to provide the necessary information and correct inaccuracies. During the PHE, states have been encouraged to continue using data to conduct ex parte renewals and extend coverage for 12 months for those who remain eligible. Of the 42 states actively processing ex parte renewals, nearly two-thirds (30 states) are sending renewal forms or requests for documentation when they are unable to confirm ongoing eligibility through electronic data sources, although they may not disenroll anyone for eligibility or procedural reasons during the PHE. By processing ex parte renewals and sending out renewal forms, states will have a smaller backlog of delayed renewals or pending actions when the PHE ends.
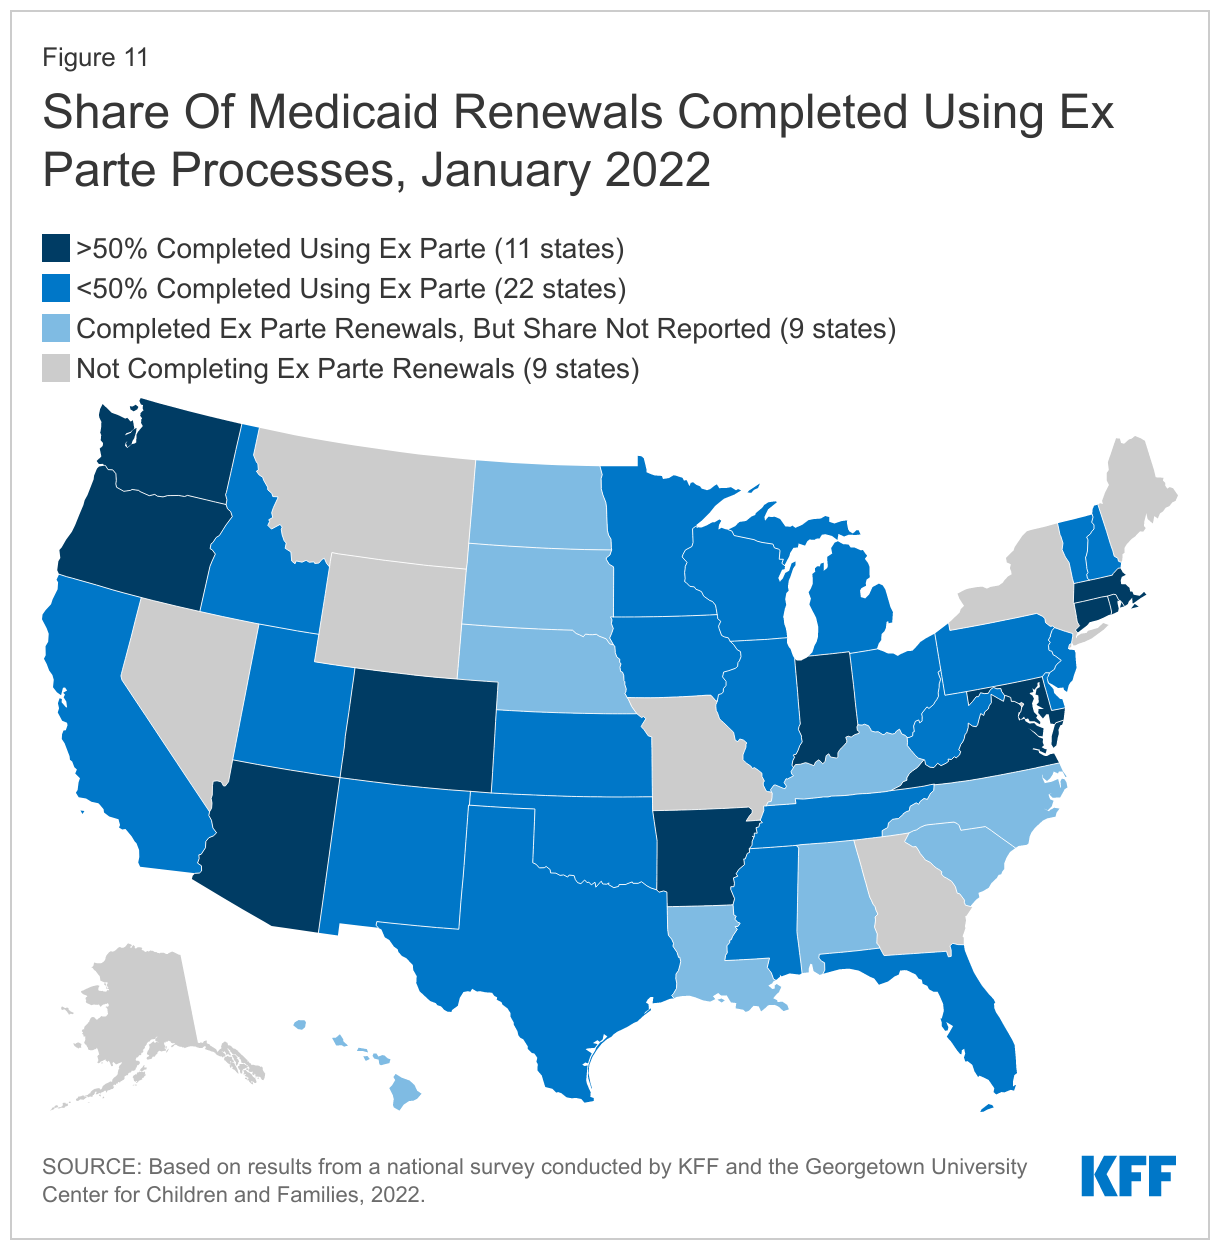
The share of renewals completed using ex parte processes varies across states and is low in many states. Completing renewals by checking electronic data sources to verify ongoing eligibility reduces the burden on enrollees to maintain coverage. Of the 42 states processing ex parte renewals, only 11 states report completing 50% or more of renewals using ex parte processes. Twenty-two states complete less than 50% of renewals on an ex parte basis, including 11 states where less than 25% of renewals are completed using ex parte processes (Figure 11). CMS notes in recent guidance that states can increase the share of ex parte renewals they complete without having to follow up with the enrollee by expanding the data sources they use to verify ongoing eligibility.
Under the ACA, states are expected to accept renewals through four modes: online, by telephone, in person, and by mail. When renewals can be completed via ex parte or administrative processes, there is no need for enrollees to take action unless the information used to renew coverage is inaccurate. However, if a state is unable to renew coverage using data available to the agency, it is likely that documentation will be needed to confirm ongoing eligibility. Almost all states (50) accept information needed at renewal via mail and in person, with slightly fewer states accepting missing information over the phone (39 states) with a telephonic signature. As states add or expand online account functionality, more states are allowing enrollees to provide missing renewal information or documentation through their online accounts (41 states compared to 39 states in 2020). Most states (49) also allow renewal information to be submitted by fax.
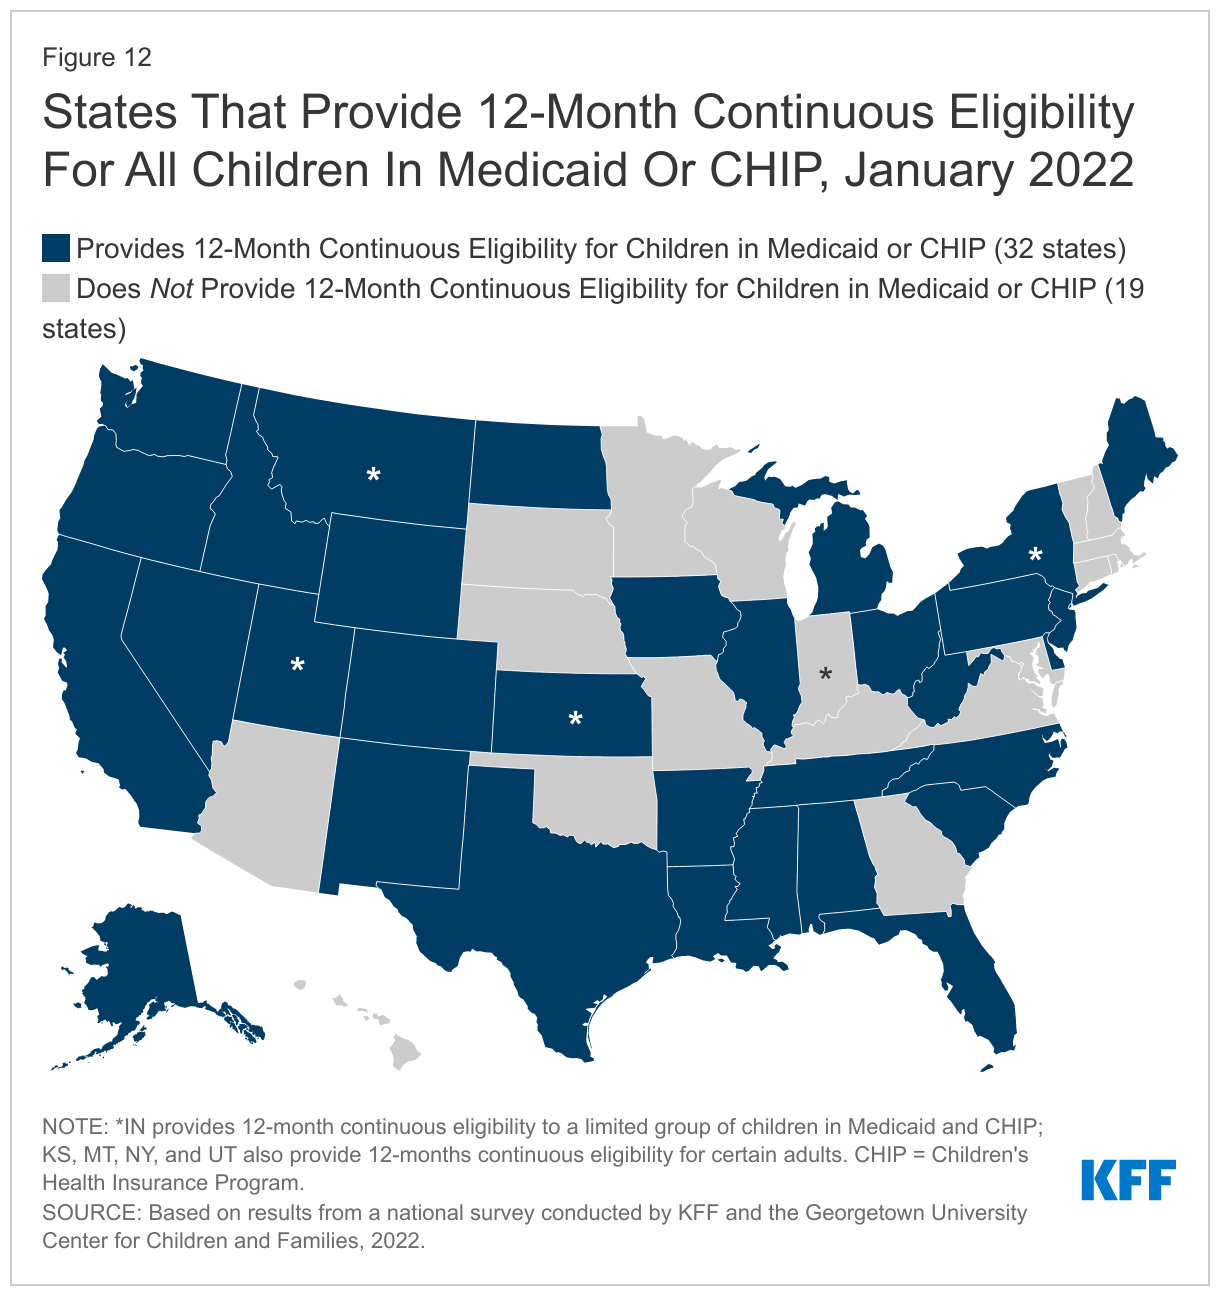
As of January 2022, 32 states provide 12-month continuous eligibility for all children in Medicaid and/or CHIP and four states provide continuous eligibility for adults (Figure 12). Two states provide 12-month continuous eligibility to a limited group of younger children in Medicaid, and one states limits eligibility in both programs. The continuous coverage policy for children is more common in CHIP with 24 of 34 separate CHIP programs providing a full year of coverage compared to 24 of the 51 Medicaid programs that have adopted the option. Only New York provides 12-month continuous eligibility for all adults. Kansas covers parents and Utah covers a targeted group of adults with incomes 0-5% FPL for a full year under waiver authority. Montana received approval from CMS in December 2021 to eliminate 12-month continuous eligibility for expansion adults, although the coverage remains in effect during the PHE. The state also requested approval to eliminate 12-month continuous eligibility for parents; however, that request is still pending with CMS. Continuous eligibility eliminates coverage gaps due to income fluctuations, which are often temporary, and is referenced in recent CMS guidance as a strategy for promoting continuous coverage for eligible individuals and reducing churn. In states without continuous eligibility, enrollees are expected to report changes in circumstances, which will add to the state’s workload as it resumes routine operations at the end of the PHE.
Medicaid and CHIP Eligibility
As of January 2022, Medicaid and CHIP eligibility were stable as the public health emergency protections remained in effect for the entirety of 2021. To provide economic relief to the states and promote stability of coverage during the COVID-19 pandemic, the FFCRA provides a 6.2 percentage point increase in the federal share (FMAP) of certain Medicaid spending if states meet MOE requirements. The MOE provisions prohibit states from reducing eligibility levels, implementing stricter enrollment procedures, or increasing premiums beyond policies in place as of January 1, 2020. States are also required to provide continuous enrollment through the end of the month in which the PHE ends and must cover COVID-19 testing and treatment for Medicaid enrollees. The COVID-related MOE does not apply to separate CHIP programs, but other MOE requirements remain in place for CHIP.
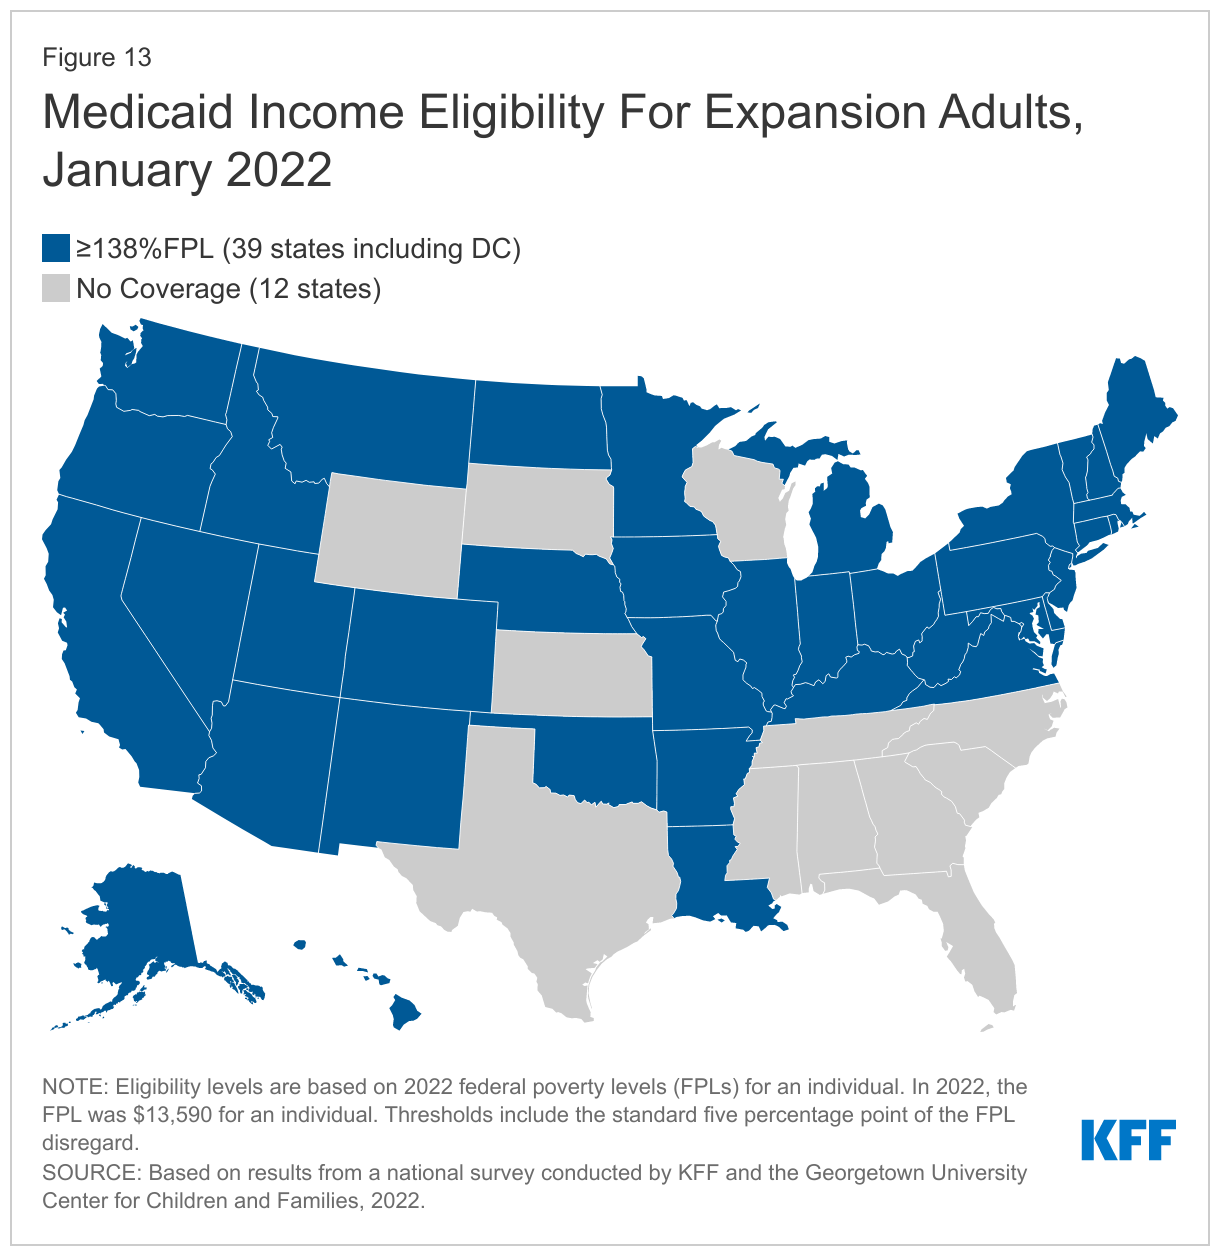
In 2021, Oklahoma and Missouri implemented the ACA Medicaid adult expansion, leaving only 12 states that have not filled the coverage gap for low-income adults (Figure 13). As of January 2022, 39 states cover parents and adults without dependent children with incomes at least up to 138% FPL (the FPL is $13,590 for an individual; $23,030 for a family of three in 2022). Just half of the states (25) and DC immediately expanded coverage to adults in January 2014. Since then, an additional 13 states have adopted the Medicaid expansion; six via state ballot initiatives, including Missouri and Oklahoma. In 2022, South Dakota will be the seventh state where voters will have a say in the state’s decision to expand Medicaid.
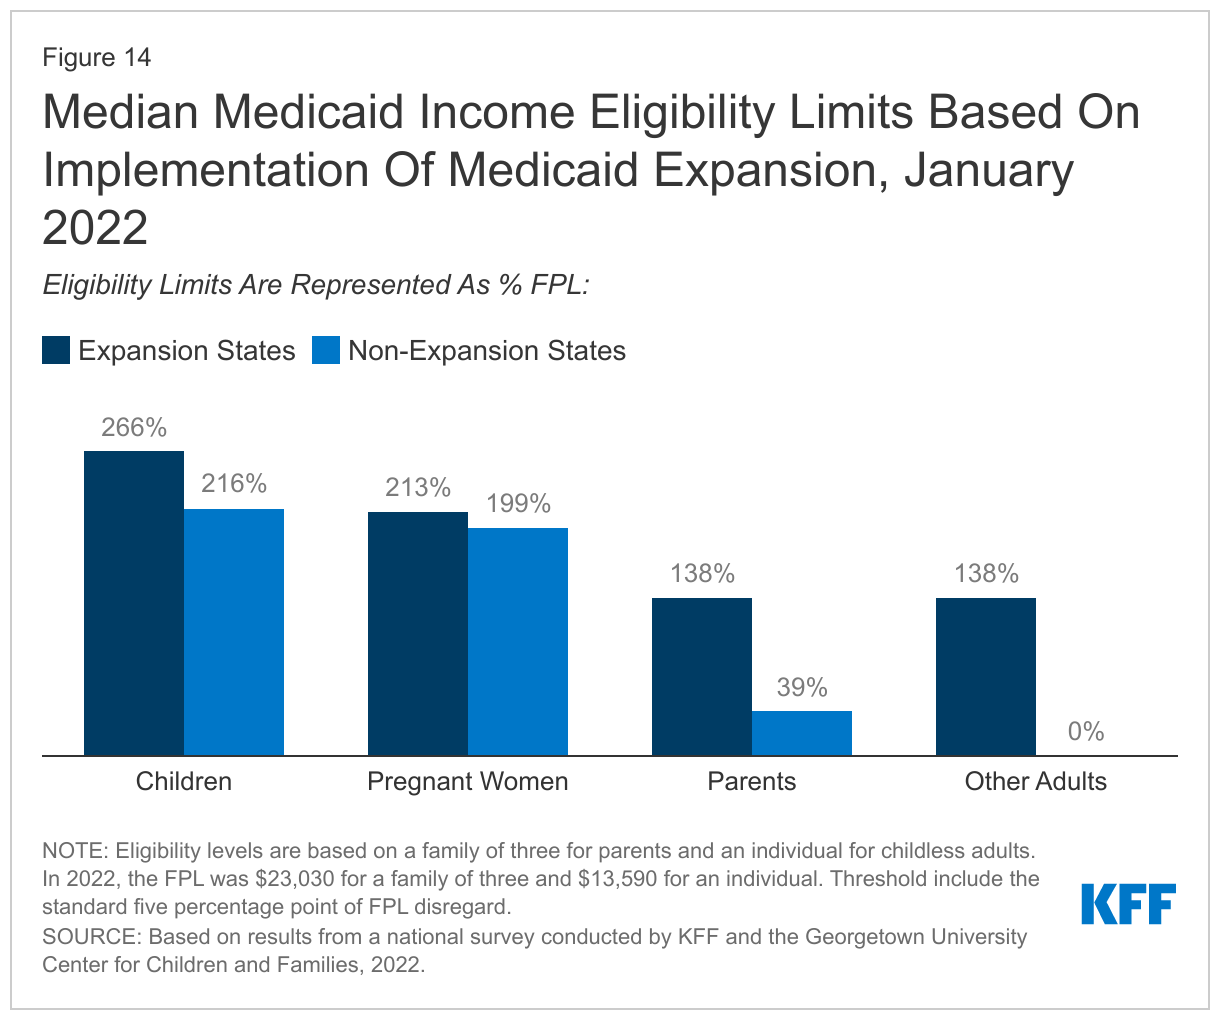
In the 12 states that have not implemented the Medicaid expansion, eligibility for parents remains extremely low, and only Wisconsin covers adults without dependent children (Figures 14 and 15). The median eligibility level for parents and caretakers in the 12 non-expansion states now stands at 38.5% FPL ($8,866 annually for a family of three), ranging from a low of 16% FPL in Texas to 100% FPL in Wisconsin. Nine non-expansion states base eligibility on a fixed dollar threshold that is converted to the equivalent federal poverty level for comparison purposes. Over time, the equivalent eligibility level will decrease when annual updates adjust federal poverty levels upward to account for inflation. In a year when the jump in the federal poverty levels is more significant, as it was in 2022, this erosion is more evident. For example, Tennessee’s parent eligibility declined from 93% FPL to 88% FPL between 2021 and 2022. Wisconsin is the only non-expansion that has aligned eligibility for adults without dependent children with that for parents at 100% FPL, through a waiver.
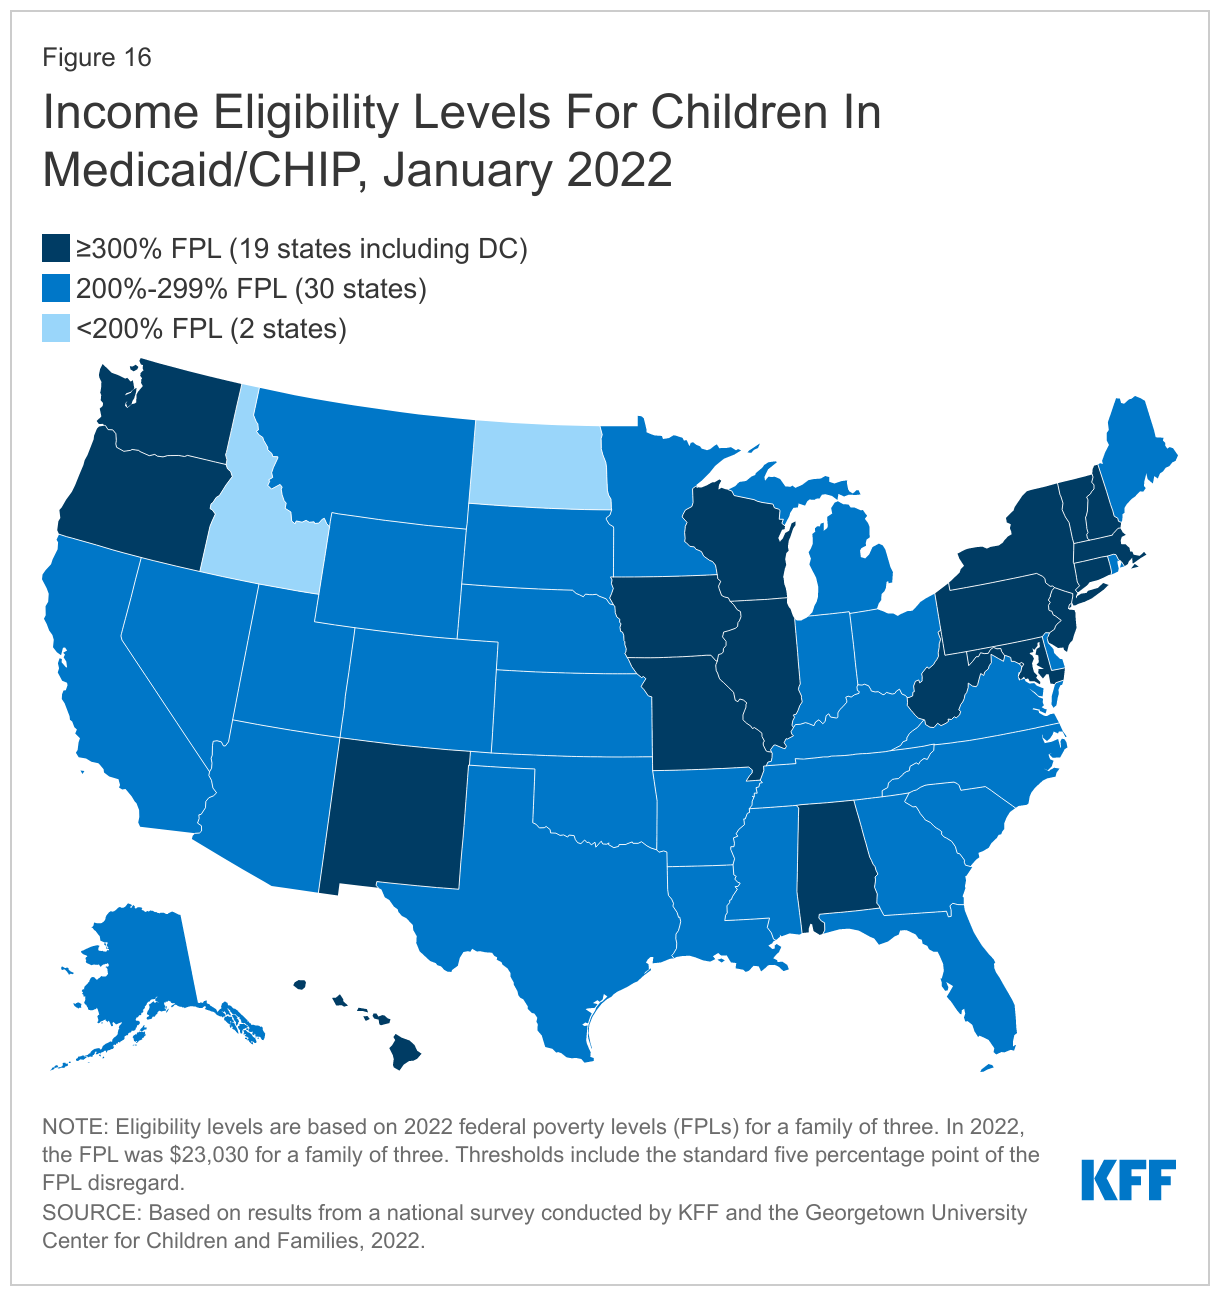
As of January 2022, children’s upper income eligibility remains unchanged, with the median eligibility level stable at 255% FPL. Child eligibility in Medicaid and CHIP continues to be the highest of all eligibility groups with all but two states (Idaho and North Dakota) covering children at or above 200% FPL. (Figure 16). Eligibility levels for children range from a low of 175% FPL in North Dakota to a high of 405% FPL in New York. More than a third of the states (19) cover children at or above 300% FPL. The only change in eligibility levels for children’s coverage was in Kansas, where CHIP eligibility is linked to a dollar-based income level tied to the 2008 FPL.
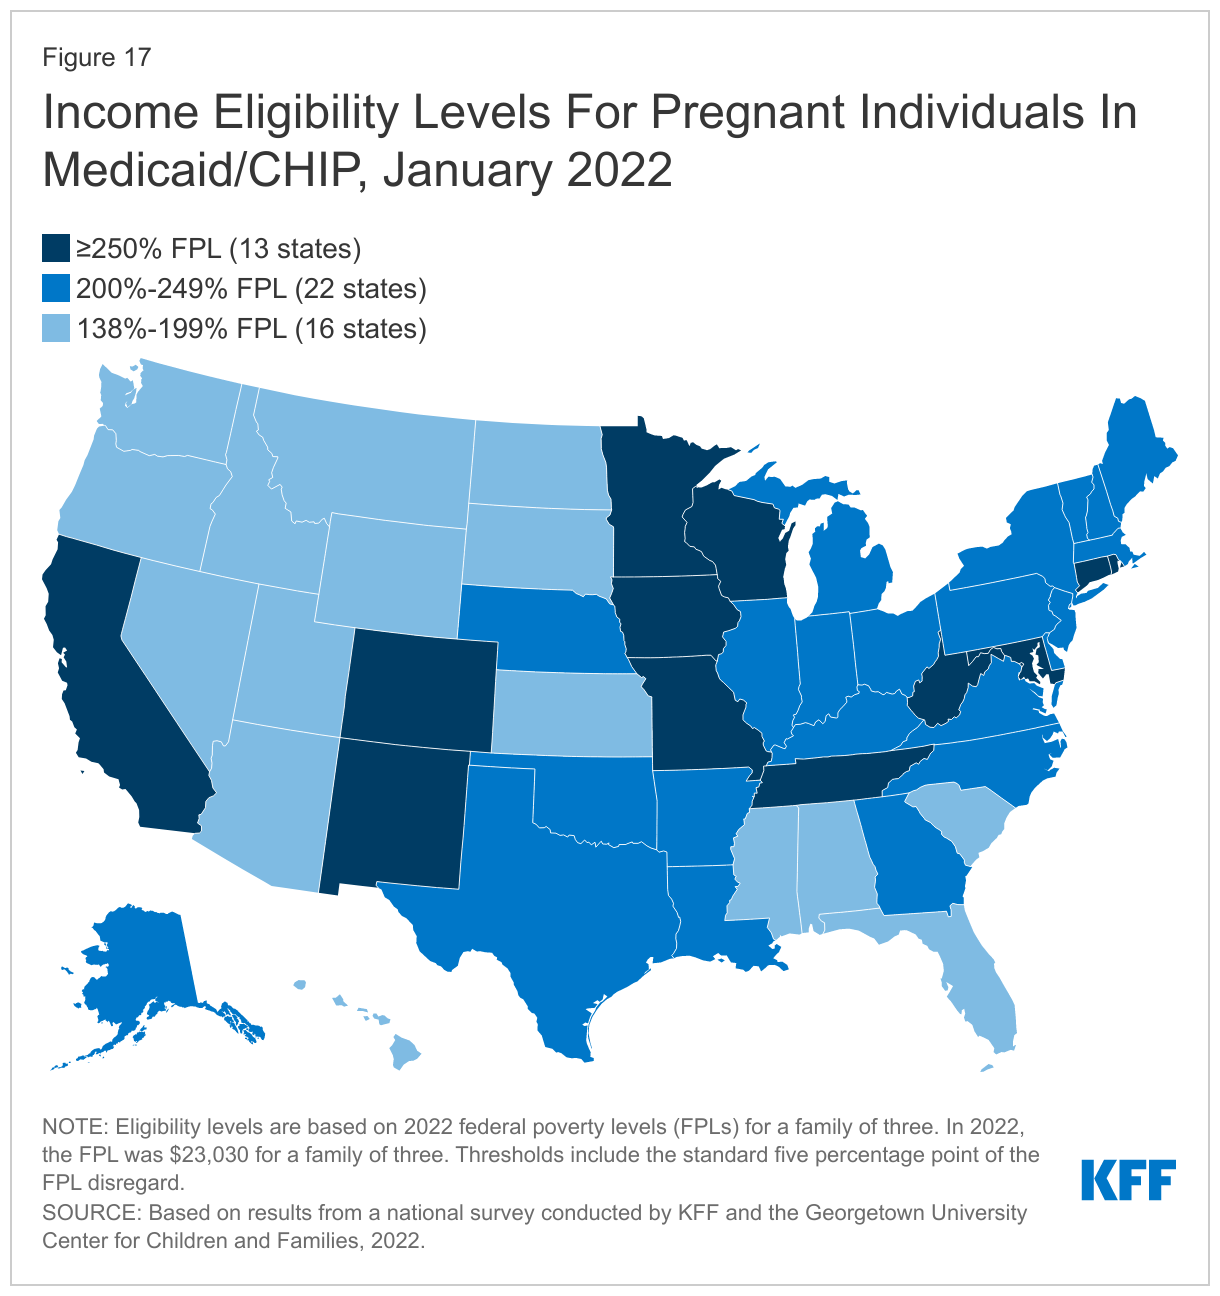
The median eligibility limit for coverage for pregnant women in Medicaid and CHIP remained steady at 205% FPL. States provide pregnancy coverage at higher income levels than coverage for parents or other adults. Across states, eligibility levels for pregnant women in Medicaid and CHIP range from a low of 138% FPL (the federal minimum level) in Idaho and South Dakota to a high of 380% FPL in Iowa. Two-thirds of the states (35) cover pregnant women at or above 200% FPL. Six states have expanded pregnancy coverage in CHIP, an option for states that cover pregnant women in Medicaid up to at least 185% FPL (Figure 17) while 18 states provide pregnancy coverage from birth to conception for targeted low-income children.
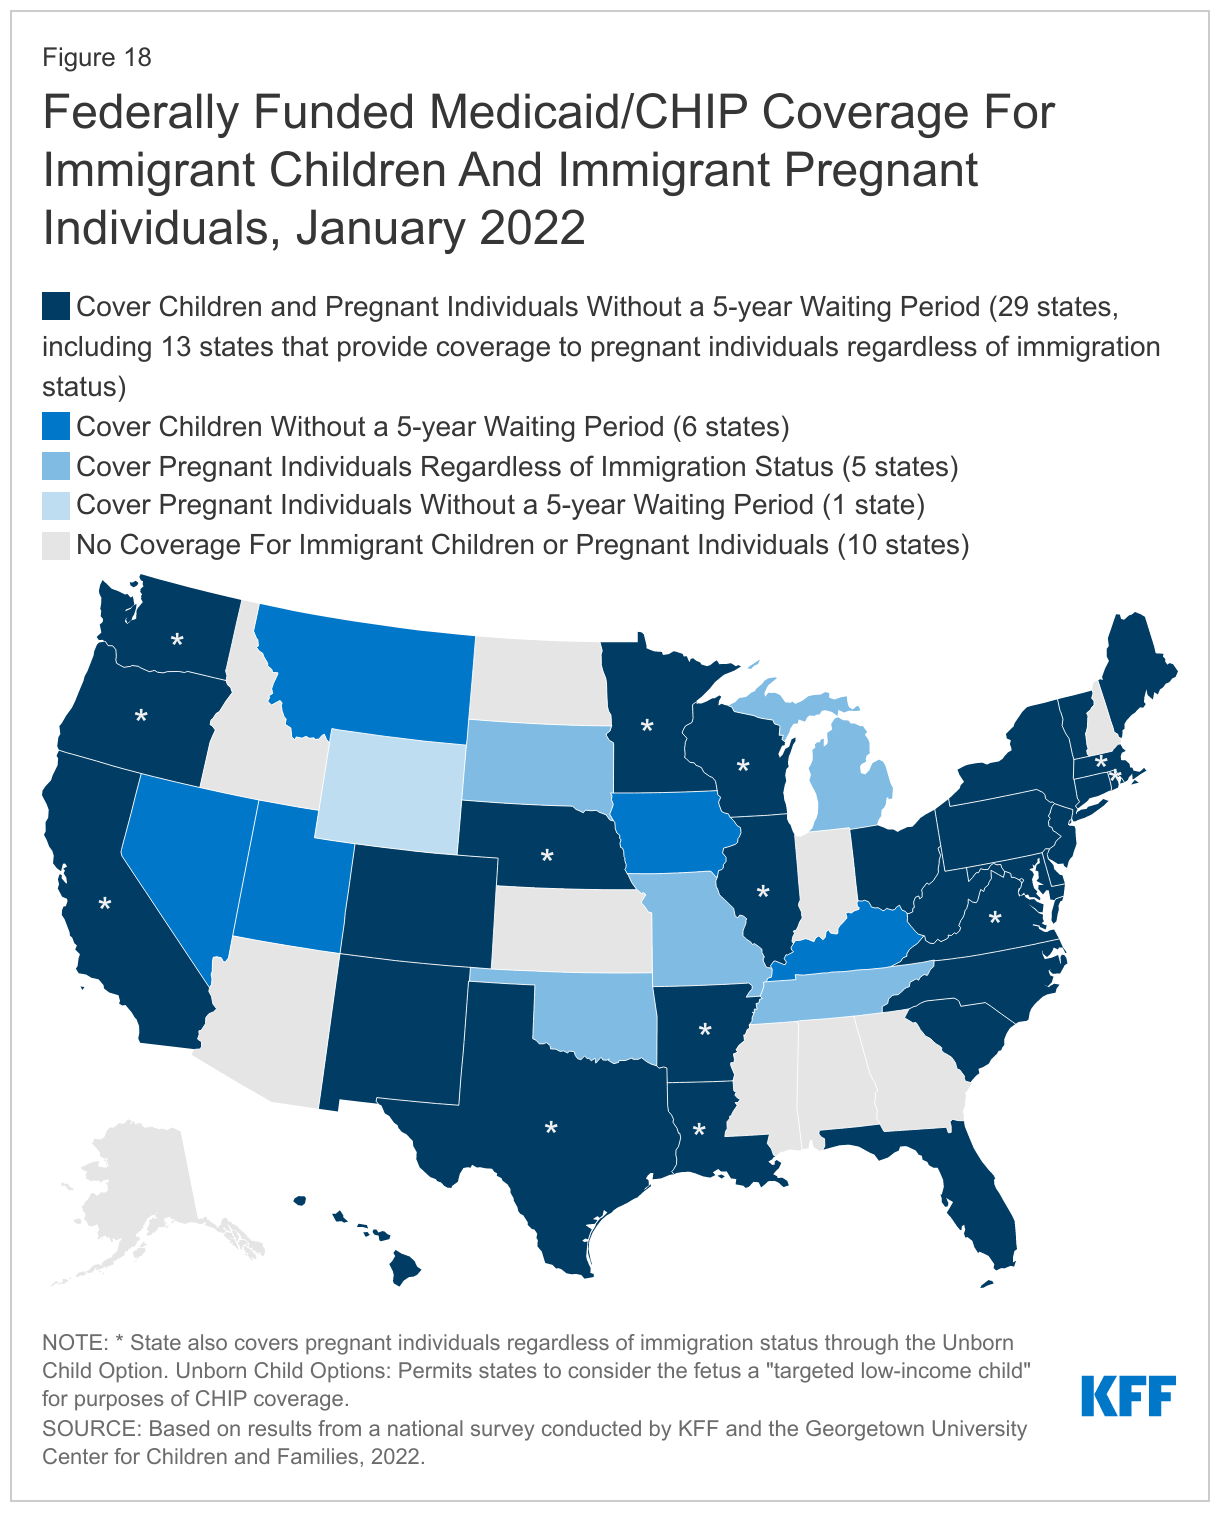
As of January 2022, 41 states have adopted federal options to extend coverage to immigrant children and pregnant women; eight of these states use state funds to extend coverage or limited benefits to some adults and children who do not qualify for federal funding. States have several options to use federal funding to cover children or pregnant people without the five-year waiting period in Medicaid and CHIP. Dating back to the enactment of CHIP, states have had the option to provide coverage in CHIP from conception to birth, known as the unborn child option, which effectively extends coverage to pregnant people without regard to immigration status. In 2021, Virginia became the 18th state to adopt this option. The 2009 CHIP Reauthorization Act (CHIPRA) also provided states another option to waive the five-year waiting period before covering lawfully-residing children and pregnant people. As of January 2022, two-thirds of states (35) have implemented the CHIPRA option for children in Medicaid and all of those states with separate CHIP programs (24 states) cover lawfully-residing children in CHIP. Twenty-five states have adopted the CHIPRA option to cover lawfully-residing pregnant people (Figure 18).
States also use state-only funds to extend coverage to immigrant groups who are not eligible for federal funding. As of January 2022, seven states cover all children regardless of immigration status, while Iowa covers some immigrant children who do not qualify for federal funding. California began covering young adults ages 19-26 regardless of immigration status in January 2020 and starting in May 2022, will extend coverage to adults ages 50 and older regardless of immigration status. There is growing interest in filling coverage gaps, particularly for children and pregnant women. Maine, New Jersey, and Vermont will extend coverage to all children regardless of immigration status in July 2022 and Connecticut will cover all children under age nine starting in January 2023. Vermont will also extend state-funded coverage to pregnant people who do not qualify for federal funding in mdi-2022 and the District of Columbia and Maine are planning to adopt the CHIP unborn child option for pregnant people in April and July 2022, respectively.
The median eligibility level for family planning services was 206% FPL, but eligibility levels range from 138% FPL in Louisiana and Oklahoma to a high of 306% FPL in Wisconsin. All states must cover family planning services in Medicaid and 30 states use federal funds, through a state plan option or waiver, to provide family planning only services to people who do not qualify for full Medicaid through another pathway.Back to top.
Looking Ahead
States are preparing now for the end of the PHE, but they will still need lead time to finalize their plans. Anticipating the end of the PHE in the coming months, states have begun making decisions around actions they will take to resume normal operations. However, some states have yet to adopt key strategies related to how they will approach processing redeterminations and other pending actions that will inform their overall operational plans. These plans are necessary to begin taking steps to update policies and procedures, make any needed systems changes, and engage with stakeholders around the details. Providing adequate lead time to states before ending the PHE will enable states to finalize their operational plans. The Biden administration has promised to provide at least 60 days’ notice, but signaling even earlier when the PHE will end, if possible, would enable states and other key stakeholders, including MCOs, to ensure policies and processes are in place and ready to implement.
CMS guidance on resuming normal operations focuses on prioritizing continuity of coverage. CMS has released several rounds of guidance during the PHE, initially in December 2020, in August 2021 and most recently in March 2022 (the latest guidance was released after the survey was fielded). Guidance issued under the Biden administration has consistently emphasized strategies to promote continuity of coverage and avoid inappropriate terminations among people who remain eligible for coverage. The most recent guidance reiterates that all states must complete a full redetermination before an enrollee’s coverage can be terminated. It also gives states an additional two months to complete processing renewals, but all renewals must still be initiated in the 12-month unwinding period. The guidance strongly encourages states to initiate no more than 1/9th of total caseloads each month to reduce the risk that a compressed renewal workload will result in individuals being erroneously determined ineligible and to distribute renewals more evenly in future years. It also provides states with additional flexibilities to align work on pending actions, including aligning Medicaid renewals with SNAP recertifications or coordinating renewals for all household members.
The PHE has demonstrated how continuous enrollment can eliminate churn in Medicaid; going forward states can adopt existing options and strategies to promote coverage. Such options include adopting 12-month continuous coverage for children (also for adults through an 1115 waiver), extending postpartum coverage for 12-months, and increasing the effectiveness of data-driven determinations and renewals by using information from other programs and expanding data sources used to verify income and other information. Many states have adopted these options, including 32 states that provide 12-month continuous eligibility for children and 21 states that have or plan to extend postpartum coverage from 60 days to 12 months to all pregnant individuals. Adopting the Medicaid expansion in the 12 states that have not yet done so can also ensure continuity of coverage for parents in those states who may have experienced a small increase in income during the pandemic and may no longer be eligible under current rules. It would also provide coverage to the two million people in the coverage gap who do not currently have an affordable coverage option. The American Rescue Plan Act (ARPA) provides temporary financial incentives for states that newly adopt the Medicaid expansion. States that have not yet done so can protect ongoing coverage by adopting these options or otherwise streamlining automated renewal processes.
State actions and decisions around the unwinding will affect Medicaid enrollment and transitions to other coverage. How states approach the unwinding of the continuous enrollment requirement will affect the extent to which eligible individuals retain coverage and those who are no longer eligible are able to transition to other coverage. Outcomes will differ across states as they make different choices and face challenges balancing workforce capacity, fiscal pressures, and the volume of work. Careful monitoring of state progress throughout the unwinding period can provide information to assess fiscal effects and state efforts to promote continuity of coverage. CMS has indicated states will be required to submit baseline and monthly data for a minimum of 14 months that it will use to monitor the unwinding to ensure compliance with timelines and to prevent erroneous disenrollment of eligible individuals. CMS has not yet specified what data elements states will need to report nor does it indicate whether the data will be made publicly available. If the data are not released publicly, it will be more difficult for entities other than CMS to monitor state actions.
The fate of the Build Back Better Act (BBBA) will have implications for overall coverage. The BBBA includes several provisions related to the unwinding of the continuous enrollment requirement, some of which CMS has incorporated in the most recent guidance. BBBA also includes provisions to close the Medicaid coverage gap in the dozen states that have not expanded eligibility under the ACA and to extend the enhanced Marketplace premium subsidies initially made available by ARPA that have made coverage more affordable for millions of people. The number of people who are uninsured has not increased during the PHE as many had predicted. However, the end of the PHE poses risks to that coverage stability. Millions of people could lose coverage if those who continue to be eligible for Medicaid are not able to retain coverage and if the provisions in the BBBA that close the coverage gap and make Marketplace coverage more affordable are not enacted.