PEPFAR and Sustained Epidemic Control
Issue Brief
Overview
While PEPFAR was designed at the outset as an emergency program, the importance of building sustainable capacity was recognized early on, and over time, this emphasis has increased and evolved. Most recently, PEPFAR has elevated its focus on sustainability even further, placing it “at the same level of priority as epidemic control.” To better understand how PEPFAR is defining and approaching sustained epidemic control, we examined PEPFAR’s most recent Country and Regional Operational Plan (COP) Guidance and country planning level letters (PLLs) for the 25 countries required to prepare COPs in 2022. We assessed country progress across several dimensions of sustainability as follows: the status of epidemic control and global HIV targets; progress toward meeting PEPFAR’s 16 minimum program requirements (MPRs); the HIV funding landscape; the status of health systems strengthening efforts; progress toward addressing gaps for key and other vulnerable populations; and community and civil society inclusion and engagement. Among our findings:
- Most COP countries (16 of 25) are at, or near, epidemic control, as defined by PEPFAR, including 12 that have reached epidemic control. Eight have reached the global viral suppression target (73% of people with HIV virally suppressed) set for 2020.
- While progress toward meeting the 16 PEPFAR MPRs is underway, no COP country has completed all of them; the average number completed is five and completion rates range from 6% to 75% in COP countries. Certain MPRs have higher completion rates, with implementation of test & start and elimination of user fees at the top, while increased domestic funding from partner governments is at the bottom.
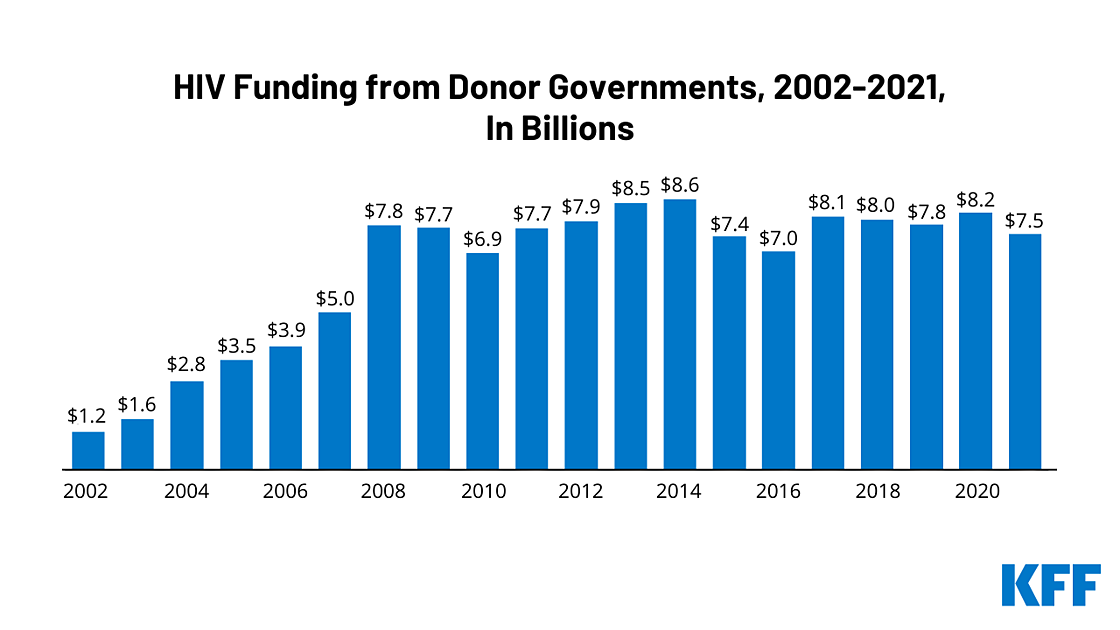
- National HIV budgets in COP countries vary significantly in size and in terms of funding per person living with HIV. PEPFAR accounts for the largest share of national HIV budgets (46%), and most COP countries are dependent on external financing for their HIV response.
- Country PLLs identify a number of issues and challenges related to health systems strengthening in the following areas: supply chains and stockouts (10 countries); laboratory networks and systems (8); data systems, such as the lack of population-based estimates (7); and rightsizing the health care workforce, including using human resources for health (HRH) data to optimize staffing levels (7).
- Nearly all country PLLs (22) highlight the importance of bolstering prevention, testing, and treatment to reach children and adolescent girls and young women (AGYW), though gender-based violence is only mentioned in four countries. More than half (13) identify addressing gaps for key populations, and nearly all (23) have a technical directive focused on improving and expanding data in this area. Few however specifically mention stigma and discrimination or human rights as priority areas, despite the fact that many have legal and policy barriers that may present challenges to reaching and supporting key populations in accessing HIV services.
- Finally, the importance of engaging community partners in order to improve PEPFAR programming, with particular emphasis on the role of community-led monitoring (CLM), is mentioned in all PLLs.
This analysis provides an initial look at how PEPFAR is currently defining and approaching sustained epidemic control at the country level. As it finds, the picture is multi-layered, and there is significant variation across countries and across dimensions. Going forward, better understanding how these markers of sustainability, such as epidemic control status, financial dependency, and MPR status, fit together may help to paint a clearer narrative of country progress. Some of this information may be forthcoming, as PEPFAR is expected to release a new five-year strategy and sustainability roadmaps for some countries.
Introduction
While PEPFAR was designed at the outset as an emergency program, the importance of building sustainable capacity was recognized early on, including in its authorizing legislation. Over time, this emphasis has increased and evolved, and in 2014, PEPFAR characterized its next phase as one of achieving “Sustainable Control of the Epidemic” and introduced an “epidemic control” target. Epidemic control is defined by PEPFAR as the point at which the total number of new HIV infections falls below the total number of deaths from all causes among HIV-infected individuals, with both new infections and deaths among people living with HIV low and declining. As part of its next strategy, now under development, and through recent guidance to countries, PEPFAR has elevated its focus on sustainability even further, placing it “at the same level of priority as epidemic control” and identifying several programmatic and management characteristics necessary for achieving sustainability (see Box 1).
Box 1: Defining “Sustained Epidemic Control”
PEPFAR’s 2022 COP/ROP Guidance defines and describes the process for achieving sustained epidemic control as follows:
- Places sustainability at the same level of priority as epidemic control
- Includes a focus on both functional (e.g., enabling environment, locally-led HIV services and systems, etc.) and financial (e.g., adequate resource mobilization, understanding and managing cost, etc.) responsibilities and capacity
- Includes the following program and management characteristics:
Program Characteristics
- maintain the total number of new HIV infections below the total number of deaths from all causes among people with HIV
- reach viral load suppression of 85% for all ages, genders, and population groups
- have a robust public health capacity to monitor and track HIV outbreaks as well as other existing and emerging health threats
- have an environment that fights stigma and discrimination, and promotes human rights and equity in the HIV response
Management Characteristics
- ensure an enabling/nimble policy is in place to support sustained HIV outcomes
- possess sufficient technical and human capacity to manage and maintain the scale of key programs, services, systems, and resources stewarded by local institutions, communities, and other local actors
- possess technical and human capacity to introduce and adapt effective and efficient models and programs
- invest sufficient domestic financial resources that are used efficiently and effectively to sustain essential HIV services and meet emerging needs
- possess management and monitoring capacities to deliver quality assured HIV services and commodities
SOURCE: PEPFAR, PEPFAR 2022 Country and Regional Operational Plan (COP/ROP) Guidance for all PEPFAR-Supported Countries, Jan. 2022.
To better understand how PEPFAR is defining and approaching sustained epidemic control and progress in PEPFAR countries, we examined PEPFAR’s most recent Country and Regional Operational Plan (COP) Guidance and associated planning level letters (PLLs) sent to country teams. COP guidance describes program investments, requirements, activities, and targets and, as such, is one of the main vehicles for interpreting how PEPFAR seeks to operationalize its goals and objectives in the coming year. PLLs provide specific input to each country team, including notional funding levels and country-specific challenges and objectives to be addressed in their annual COPs. In our analysis of the PLLs, we categorized issues as key challenges only if they were specifically identified in the “challenges” or “priority changes” sections of the PLLs. Based on these documents, and analysis of a range of supplemental data, we assessed country progress toward sustained epidemic control across several dimensions as follows:
- The status of PEPFAR’s epidemic control target and other global HIV targets in PEPFAR countries;
- Progress toward meeting PEPFAR’s 16 minimum program requirements (MPRs), the policies and practices that countries are expected to have place to ensure success;
- The HIV funding landscape, including the size of national HIV budgets and funding composition;
- The status of health system strengthening efforts, including supply chains, laboratory networks, data systems, and the health workforce;
- Progress toward addressing gaps for key and other vulnerable populations and an assessment of the larger political and legal environment that could affect access; and
- Community and civil society inclusion and engagement.
This list is not intended to be exhaustive but, rather, to capture some of the main elements that are key to sustained epidemic control, as identified by PEPFAR and other global stakeholders. We focused our analysis on the 25 countries required to prepare COPs in 2022.1
Findings
Status of Epidemic Control and Global HIV Targets in COP Countries
Epidemiologic measures, including PEPFAR’s epidemic control target, are key elements of sustained control. We looked across COP countries to describe their HIV epidemics and assess their status toward epidemic control and other global HIV targets.
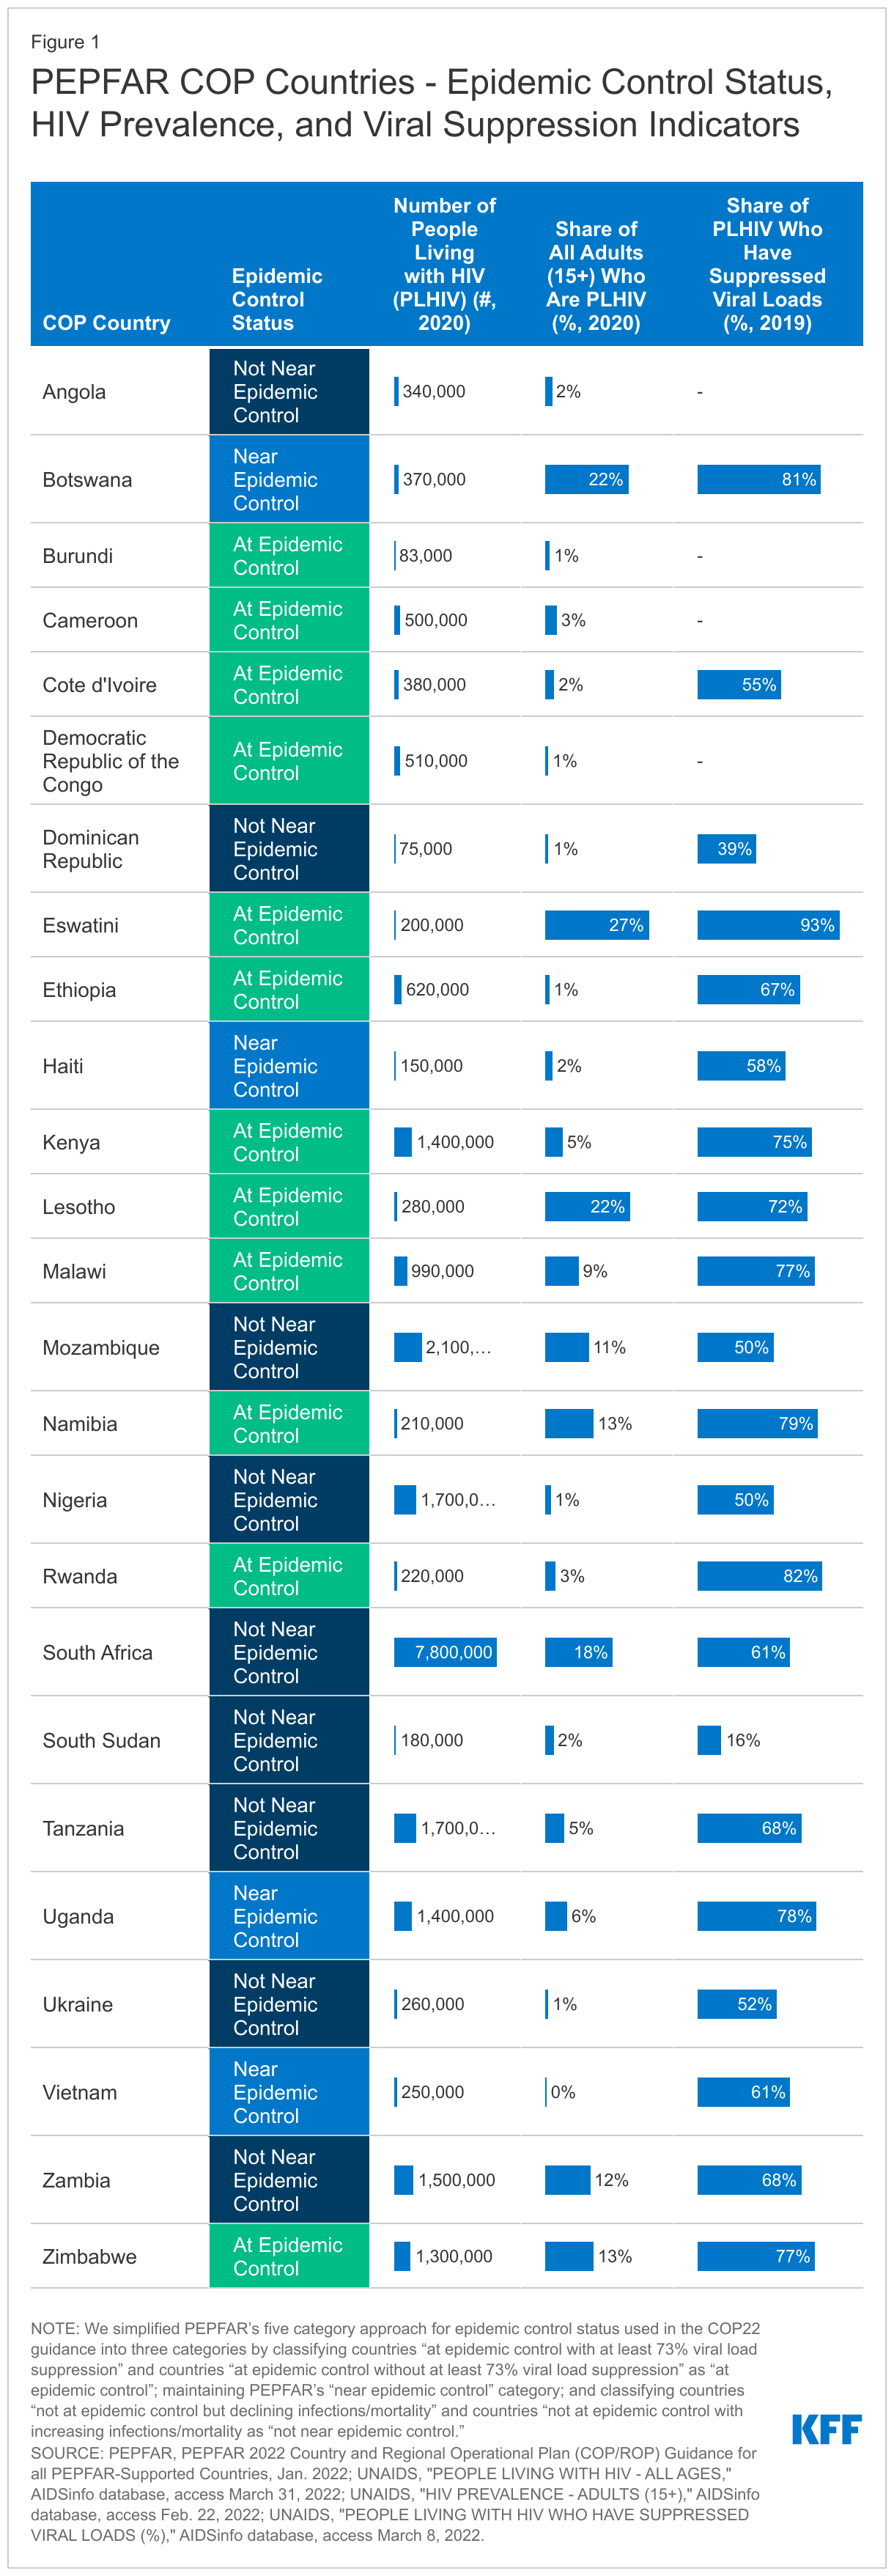
- The 25 COP countries are home to almost two-thirds (65% or 24.5 million) of all people living with HIV globally and include some of the highest prevalence countries in the world. Most are in sub-Saharan Africa (21 of 25); the others are in Latin America and the Caribbean (2), Asia (1), and Eastern Europe and Eurasia (1). Adult HIV prevalence in these countries ranges from 0.3% (in Vietnam) to 27.1% (in Eswatini), with four countries having prevalence rates exceeding 15% (South Africa, Botswana, Lesotho, and Eswatini). See Figure 1.
- The majority of COP countries (16 of 25) are at, or near, epidemic control, as defined by PEPFAR. Twelve COP countries have reached epidemic control (new infections and deaths are low and declining, and new HIV infections are below the total number of deaths from all causes among HIV-infected individuals), while four countries are near that point (new infections and deaths are low and declining, but new infections are not yet lower than deaths). The remaining nine countries are not yet near epidemic control (infections and deaths remain high, and new infections are not lower than deaths).2 See Figure 1.
- COP countries range on their progress toward global viral suppression targets, with a third having reached the global target set for 2020. Across COP countries, the share of people with HIV who are virally suppressed ranges from 16% (in South Sudan) to 93% in Eswatini. In twelve countries, two-thirds or more are virally suppressed, including eight that have reached or exceeded the UNAIDS 73% viral load suppression target originally set for achievement by 2020. One country (Eswatini) has already surpassed the UNAIDS 86% viral load suppression target for achievement by 2025. See Figure 1.
Progress Toward Minimum Program Requirements
Minimum program requirements (MPRs) set by PEPFAR are considered essential policies and practices that must be in place in order to ensure the success of the program, including progress toward reaching and sustaining epidemic control. As stated in the current COP guidance, “evidence demonstrates that lack of any one of these policies/practices significantly undermines progress toward reaching and sustaining epidemic control and results in inefficient and ineffective programs.” There are currently 16 MPRs, including one that was added this year (see Box 2).
Box 2: PEPFAR’s Minimum Program Requirements (MPRs)
Care and Treatment (5 MPRs):
1. Adoption and implementation of Test and Start, with immediate >95% linkage to treatment
2. Rapid optimization of antiretroviral therapy (ART) for adults and children
3. Adoption and implementation of differentiated service delivery models (DSD) for all clients with HIV, including six-month multi-month dispensing (MMD)
4. All eligible PLHIV, including children and adolescents, should complete tuberculosis (TB) preventive treatment (TPT)
5. Completion of Diagnostic Network Optimization (DNO) activities for viral load and early infant diagnosis, TB, and other coinfections, and ongoing monitoring to ensure reductions in morbidity and mortality
Case Finding (1 MPR):
6. Scale-up of index testing and self-testing, ensuring consent procedures and confidentiality are protected and assessment of intimate partner violence (IPV) is established
Prevention and Orphans and Vulnerable Children (OVC) (2 MPRs):
7. Direct and immediate assessment for and offer of prevention services, including pre-exposure prophylaxis (PrEP), to HIV-negative clients found through testing in populations at elevated risk of HIV acquisition
8. Alignment of OVC packages of services and enrollment to provide comprehensive prevention and treatment services to OVC ages 0-17
Policy & Public Health Systems Support (8 MPRs):
9. Demonstrate evidence of progress toward advancement of equity, reduction of stigma and discrimination, and promotion of human rights to improve HIV prevention and treatment outcomes for key populations, adolescent girls and young women, and other vulnerable groups (new target added this year)
10. Elimination of all formal and informal user fees in the public sector for access to all direct HIV services and medications, and related services
11. Assure program and site standards, including infection prevention & control interventions and site safety standards, are met by integrating effective Quality Assurance (QA) and Continuous Quality Improvement (CQI) practices into site and program management
12. Evidence of treatment literacy and viral load literacy activities supported by Ministries of Health, National AIDS Councils and other partner country leadership offices with the general population and health care providers regarding Undetectable = Untransmittable (U=U) and other updated HIV messaging to reduce stigma and encourage HIV treatment and prevention
13. Clear evidence of agency progress toward local partner direct funding, including increased funding to key populations-led and women-led organizations
14. Evidence of partner government assuming greater responsibility of the HIV response including demonstrable evidence of year after year increased resources expended
15. Monitoring and reporting of morbidity and mortality outcomes including infectious and non-infectious morbidity
16. Scale-up of case surveillance and unique identifiers for patients across all sites
SOURCE: PEPFAR, PEPFAR 2022 Country and Regional Operational Plan (COP/ROP) Guidance for all PEPFAR-Supported Countries, Jan. 2022.
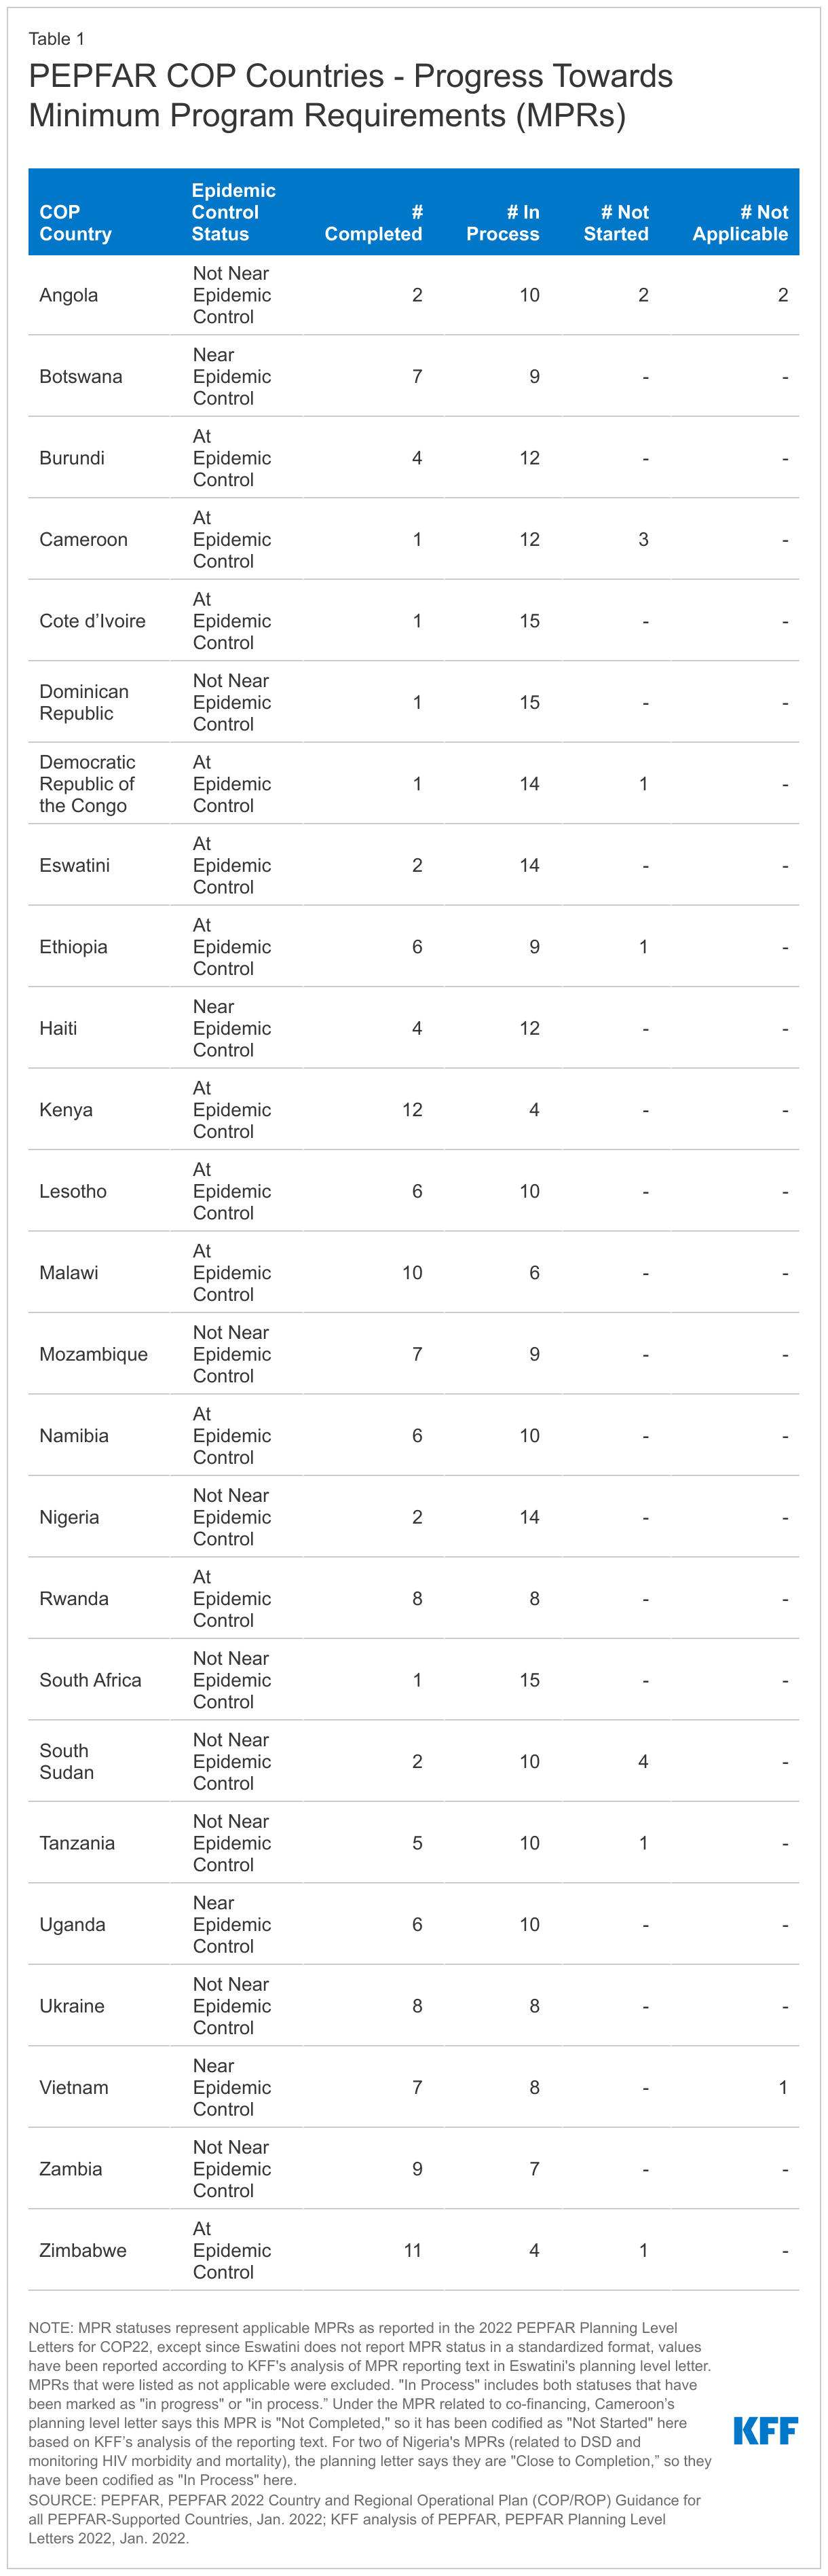
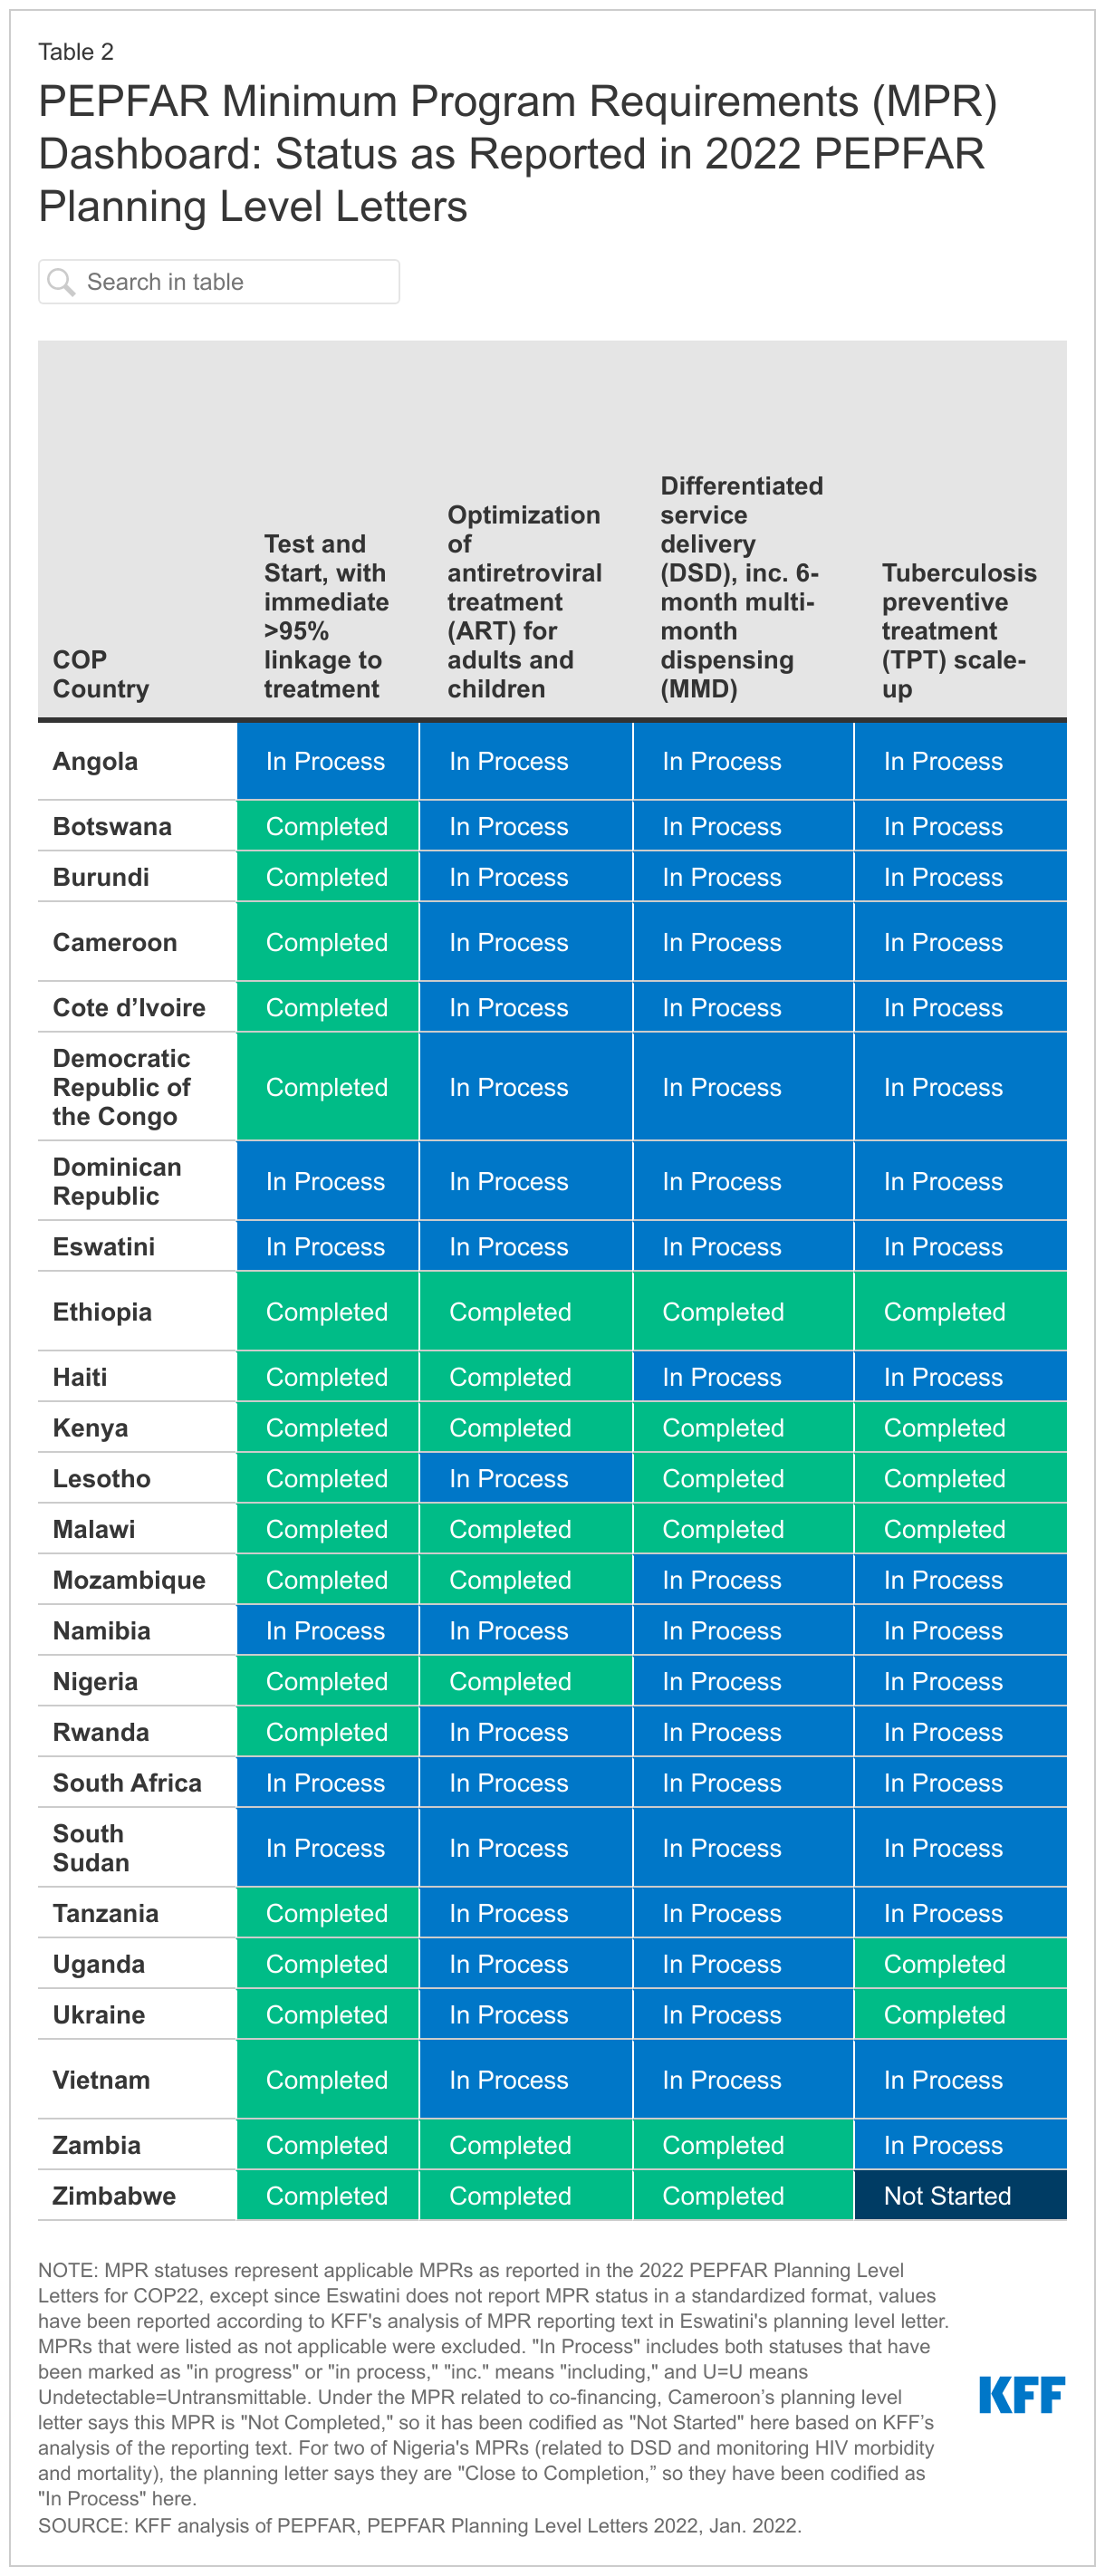
We looked at the status of progress toward the 16 MPRs in PEPFAR COP countries, based on what was reported by countries in the PLLs (although specific criteria used for measuring progress were not provided in these documents).
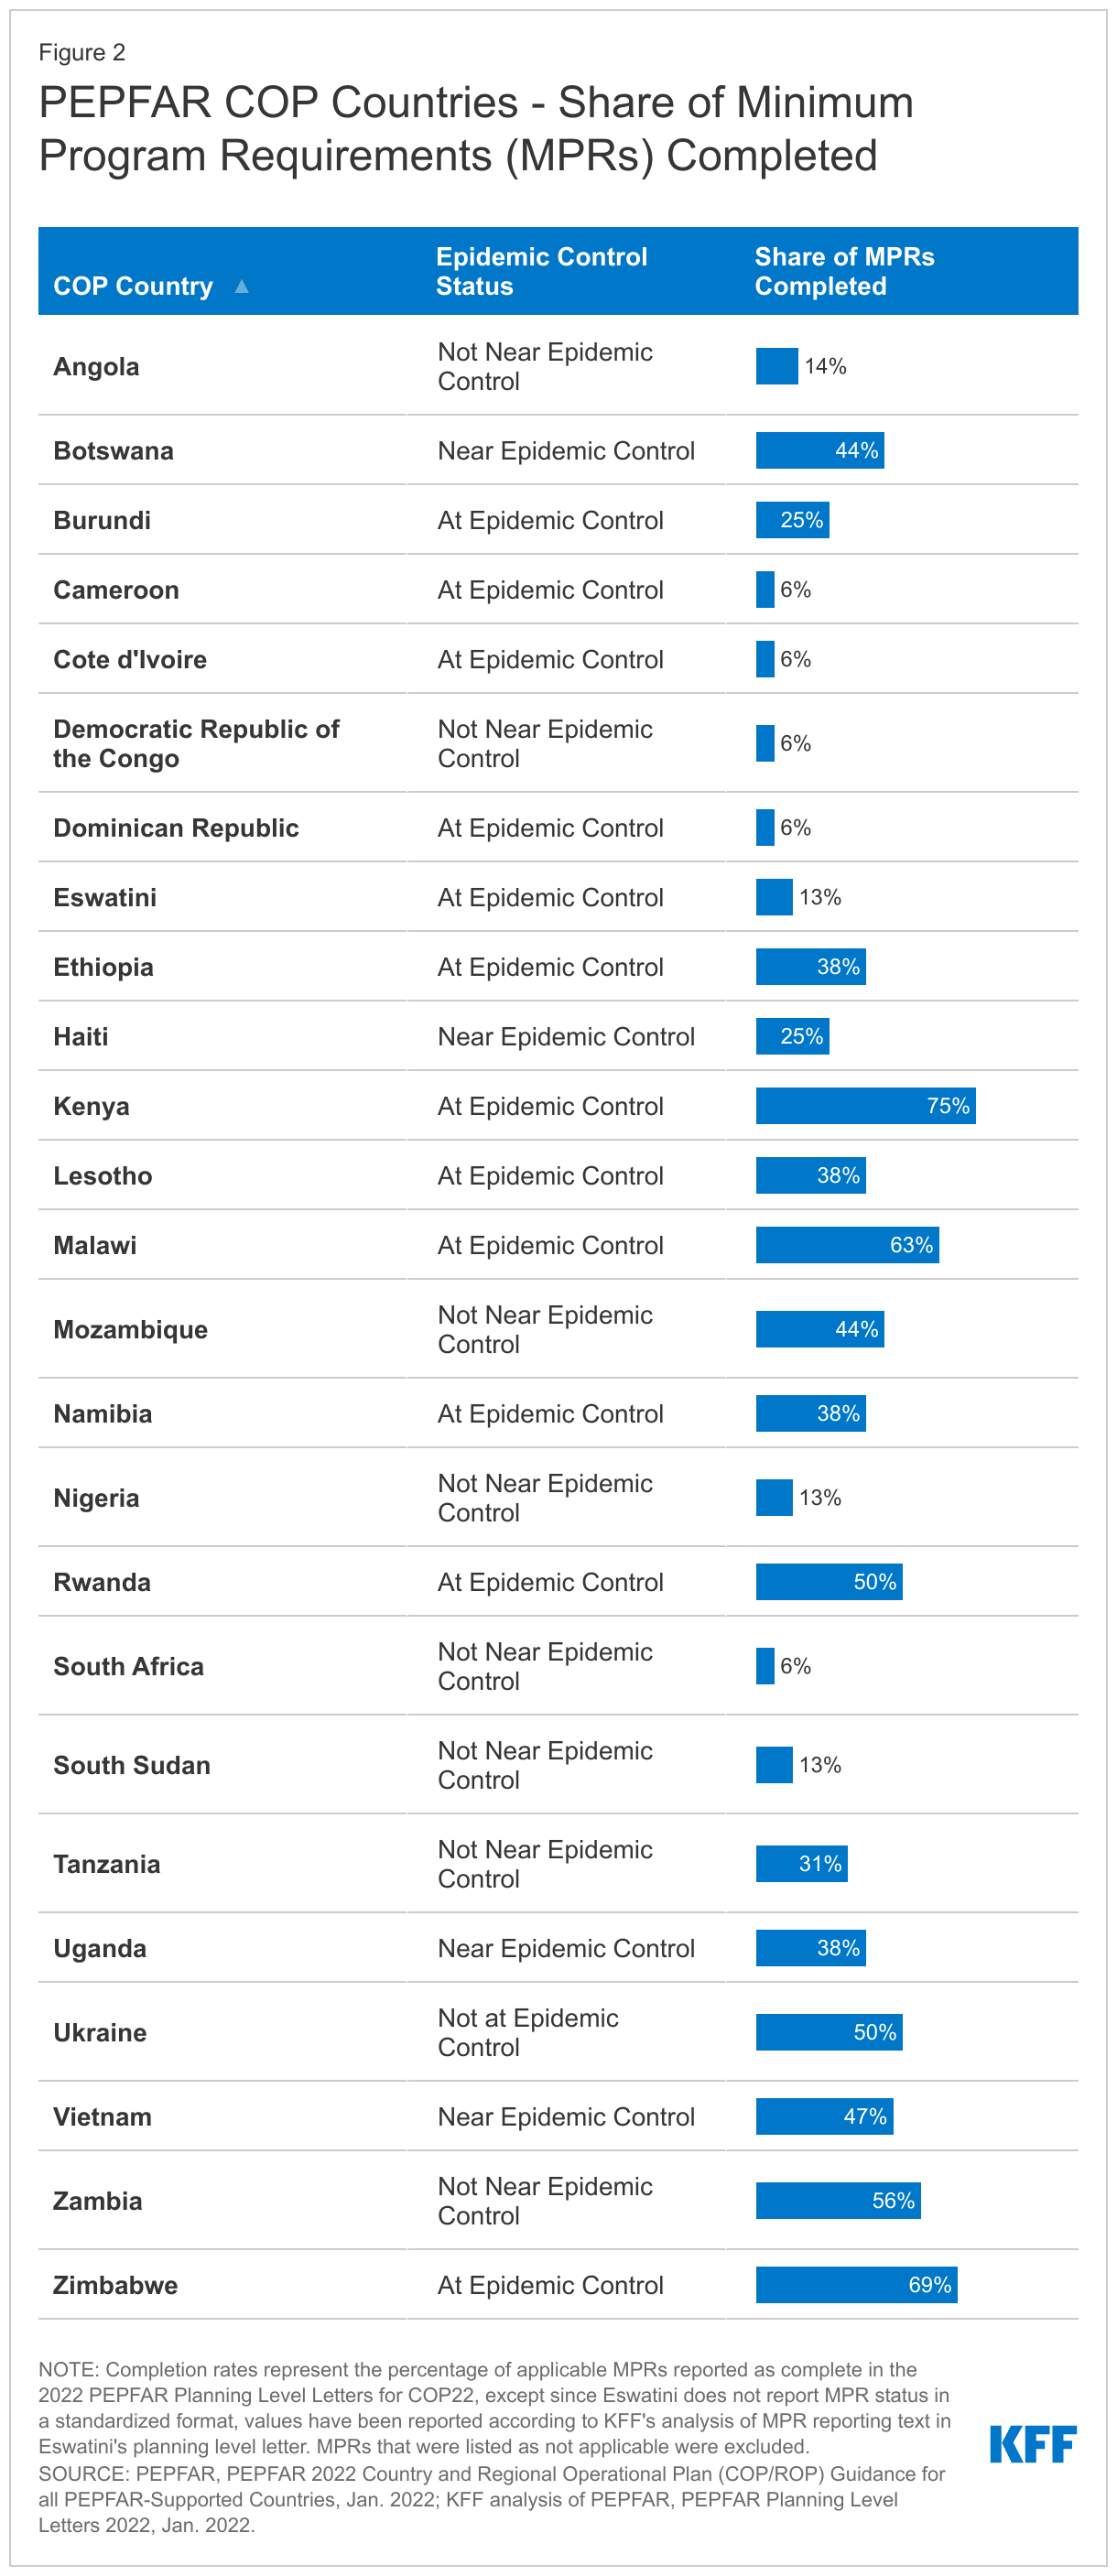
- While progress toward meeting MPRs is underway, no COP country has completed all 16. Only four countries (Zambia, Malawi, Zimbabwe, and Kenya) have completed more than half of the MPRs, with Kenya having completed the most (12). The average number completed is five. Eleven countries have completed a quarter or less. Completion rates ranges from 6% to 75%. See Figure 2.
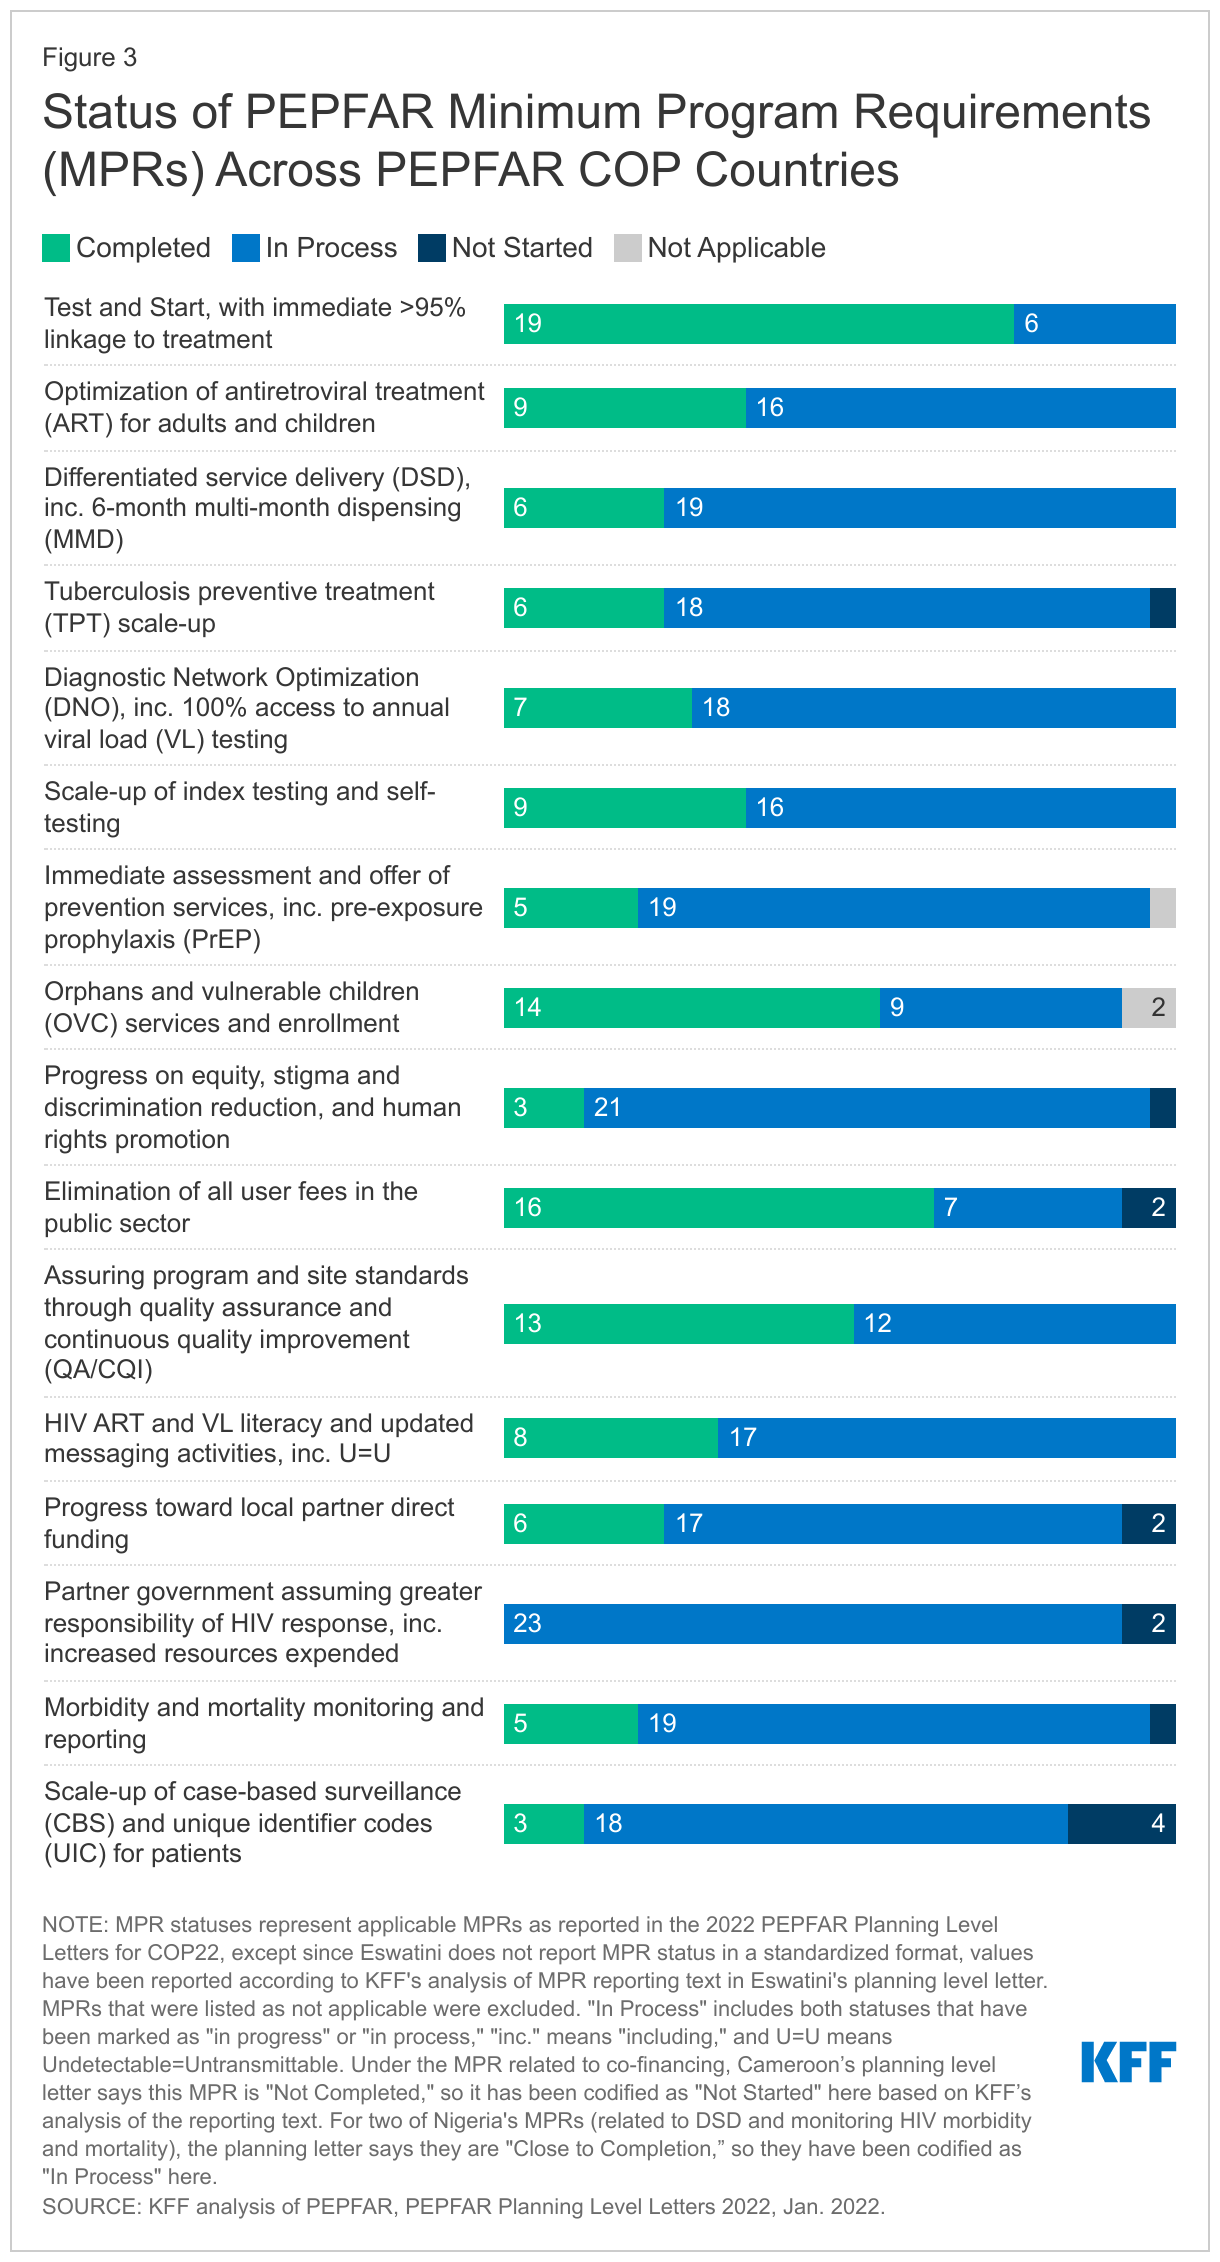
- Certain MPRs have higher completion rates, with implementation of test & start and elimination of user fees at the top, while increased domestic funding from partner governments is at the bottom. Most countries (19, or 76%) have adopted and implemented test & start efforts,3 sixteen (64%) have eliminated user fees,4 and fourteen (61%) have aligned their services for orphans and vulnerable children (OVC) with PEPFAR standards.5 On the other end of the spectrum, only three countries have met the MPR to scale up case surveillance and unique patient identifiers, and no country has yet met the requirement to demonstrate that it is assuming greater responsibility for its HIV response including “demonstrable evidence of year after year” increased domestic resources. For the new MPR introduced this year, focused on demonstrating that there is progress toward advancing equity, reducing stigma and discrimination, and promoting human rights, three countries reported that they have completed this measure. See Figure 3.
See Appendix for more detail.
HIV Funding Landscapes & Sustainable Financing
Financing will be a central component of sustained epidemic control. To that end, we examined the funding landscapes in COP countries, looking at the size of national HIV budgets, funding sources (including the extent to which COP countries rely on external financing), the share of resources provided to local partners, and the larger economic environment.
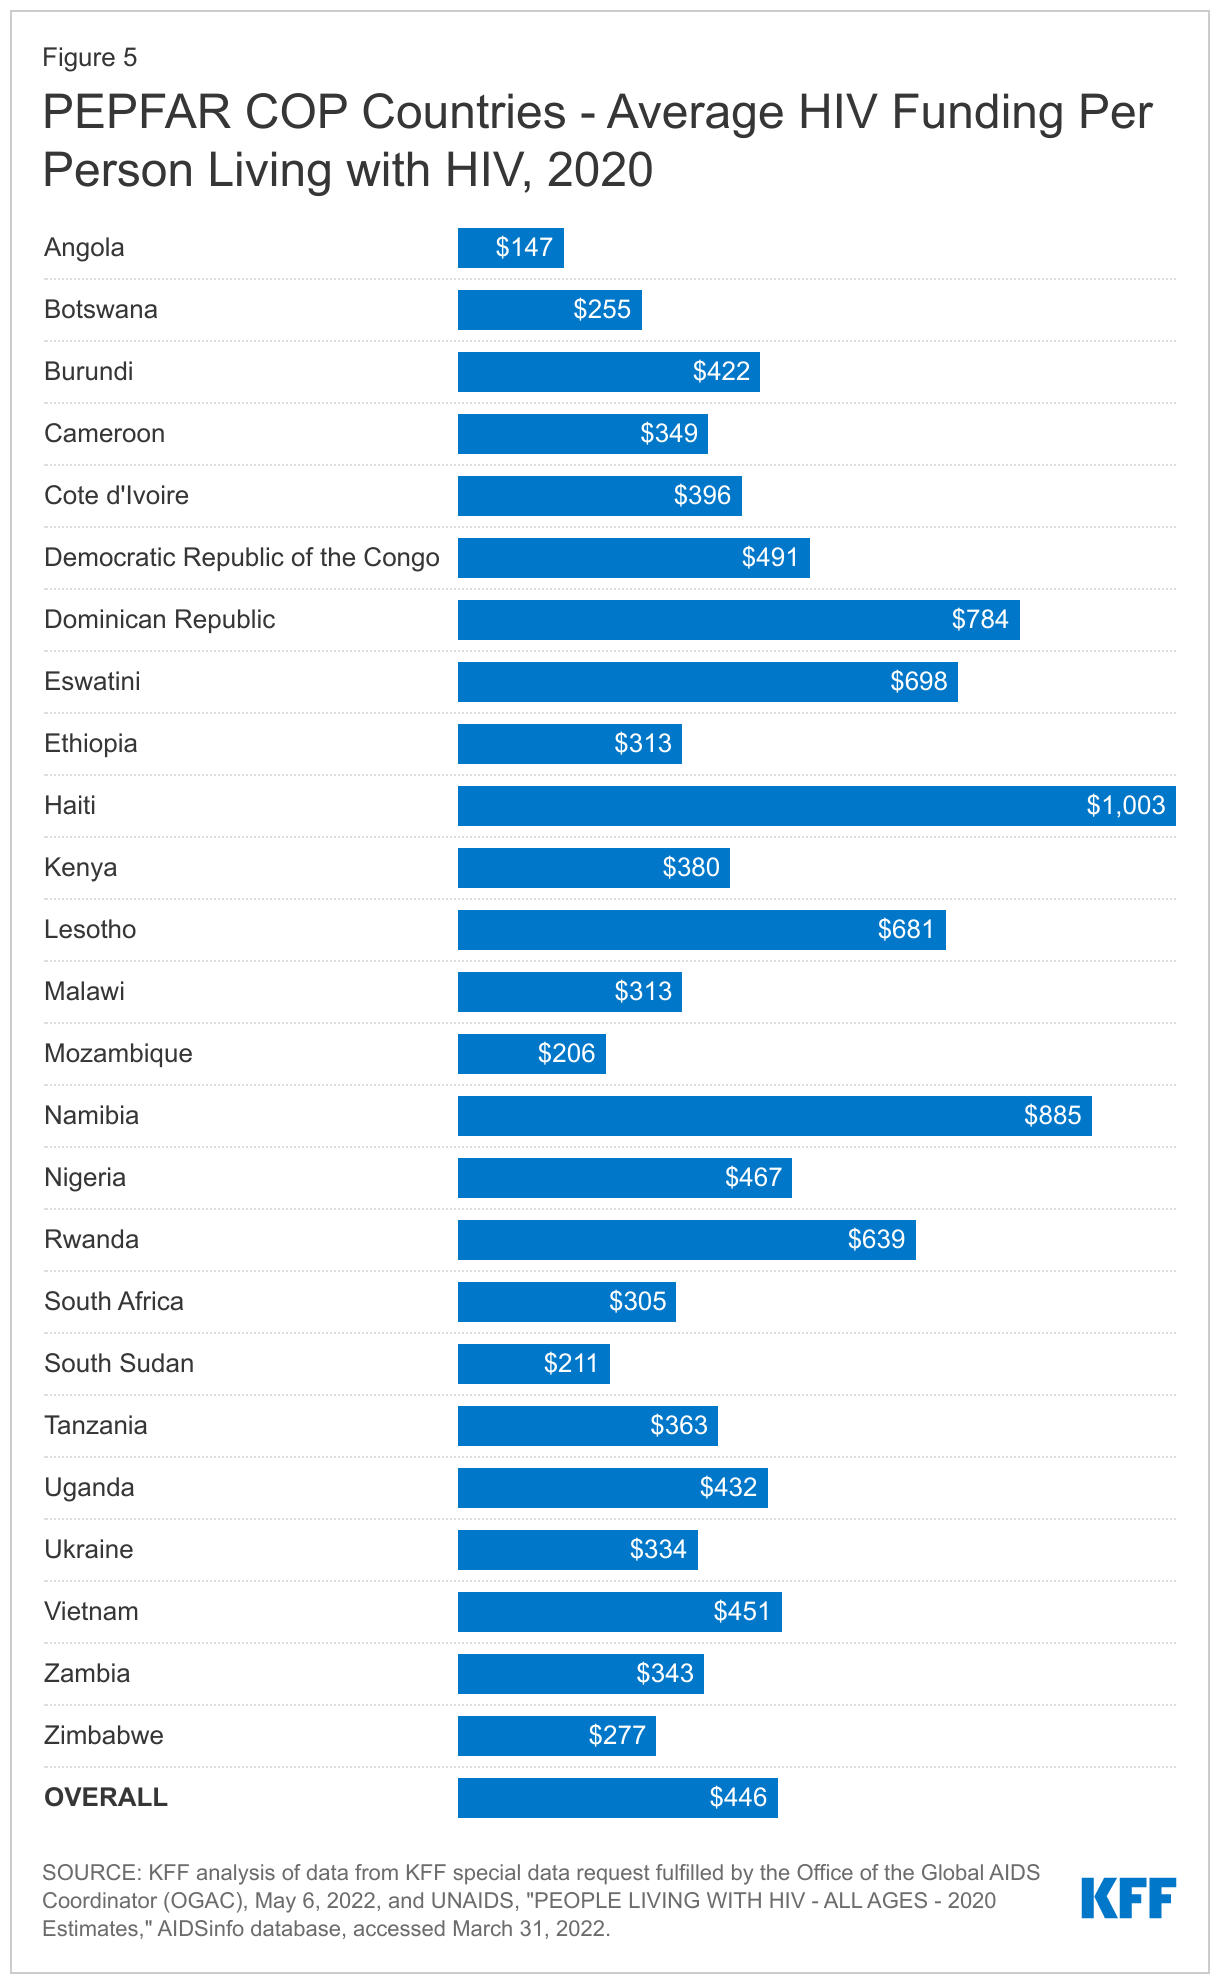
- National HIV budgets in COP countries vary significantly in size and in funding per person living with HIV. National HIV budgets, from all sources, range from $35.0 million in Burundi to $2.4 billion in South Africa in 2020. HIV funding per person living with HIV ranges from $147 in Angola to $1,003 in Haiti (the average is $446). See Figures 4 and 5.
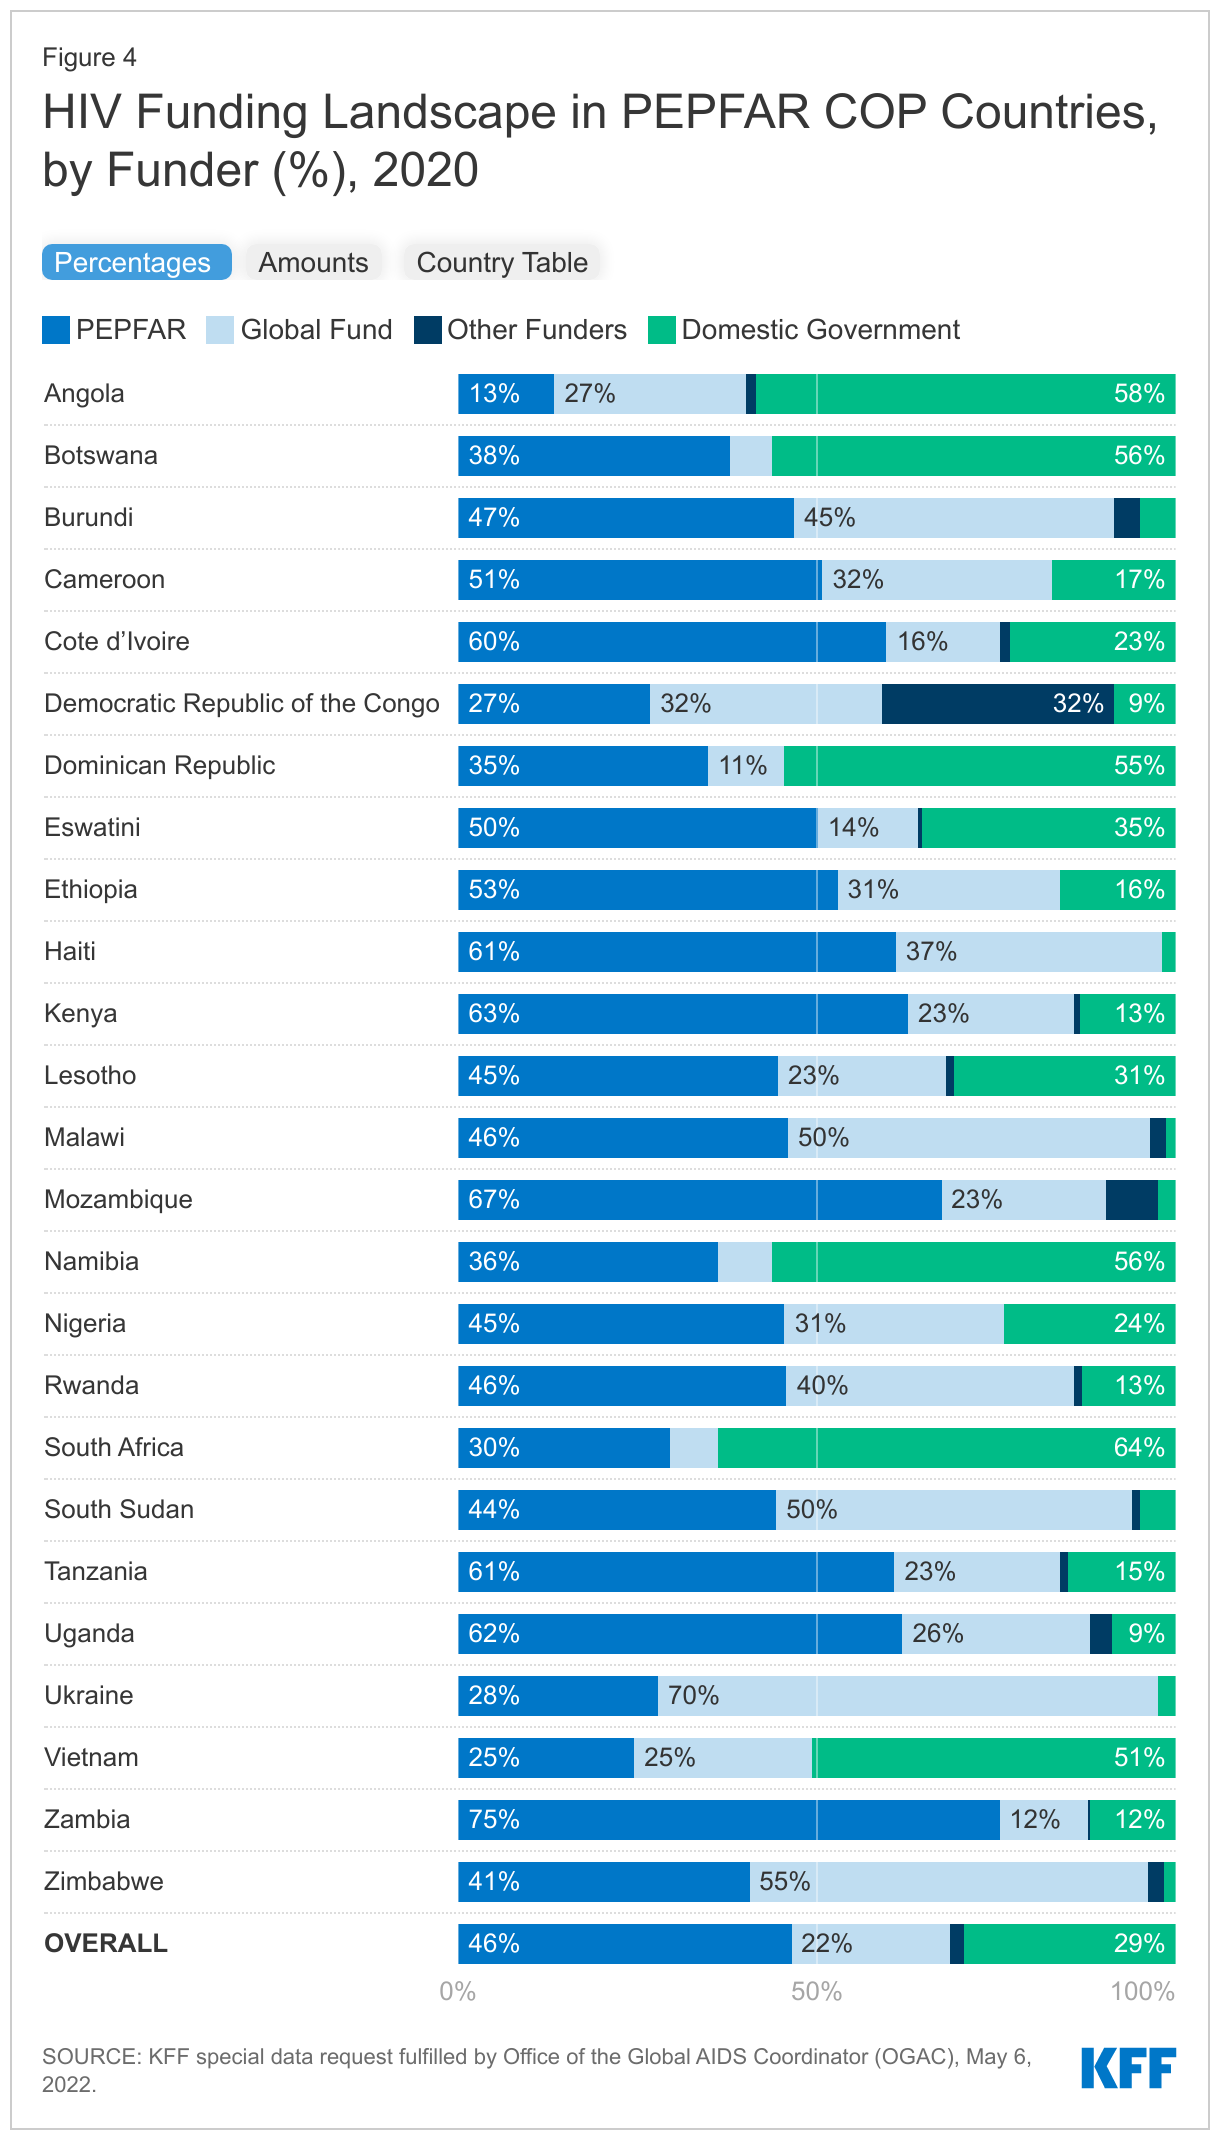
- Across COP countries, PEPFAR accounts for the largest share of national HIV budgets (46%). The next largest share is domestic governments (29%), followed by the Global Fund to Fight AIDS, Tuberculosis and Malaria (22%). PEPFAR funding ranges from less than a fifth of the HIV budget in Angola (13%) to three-quarters in Zambia (75%). See Figure 4.
- Most COP countries are dependent on external financing for their HIV response. In 19 countries, donors provided the majority of HIV funding in 2020, including 10 in which PEPFAR alone provided most funding. Only six countries (Angola, Botswana, Dominican Republic, Namibia, South Africa, and Vietnam) financed the majority of their own HIV response. In 17 COP countries, the country government contribution accounts for less than a quarter of the national HIV budget. As mentioned above, no COP country has yet met the MPR to demonstrate increased domestic resources for HIV from the country government. See Figure 4.
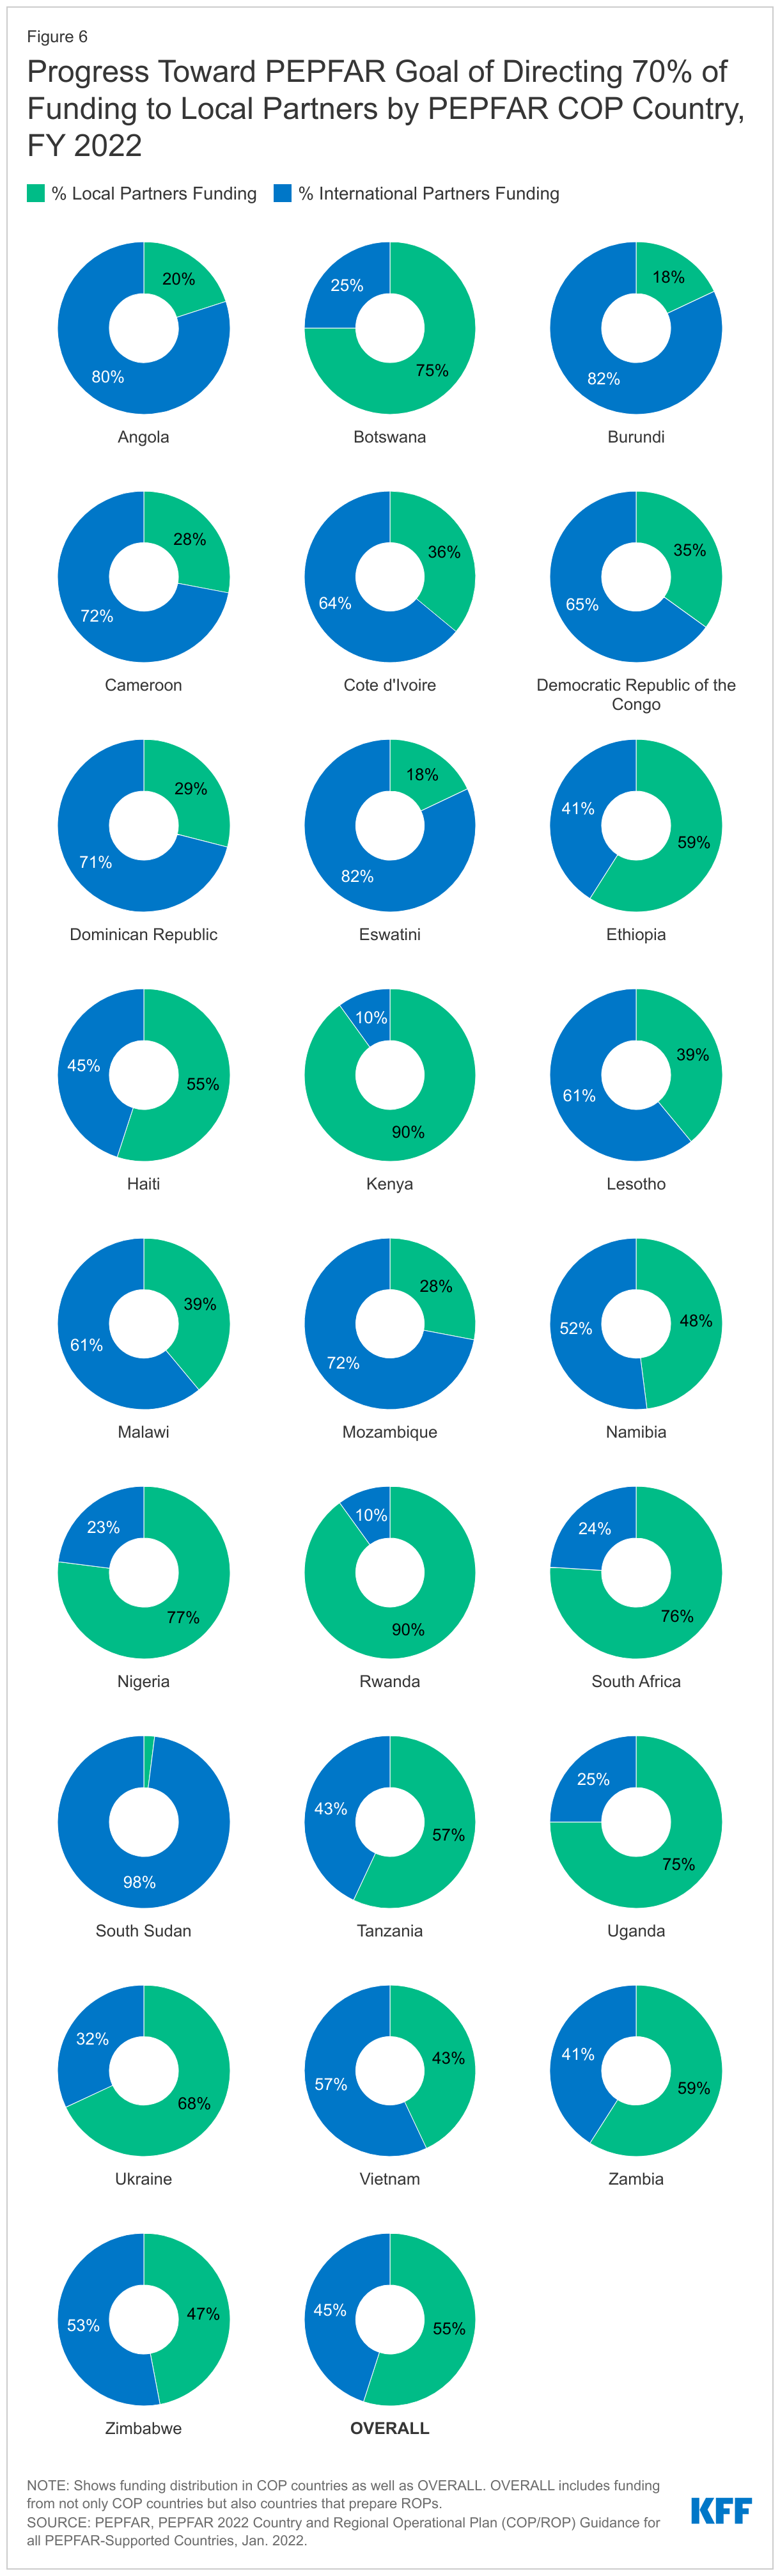
- In FY 2022, only six COP countries have met or exceeded PEPFAR’s goal to channel 70% of new PEPFAR funding to local partners, a goal intended to support country ownership and local capacity building. The six are Botswana and Uganda (75%), South Africa (76%), Nigeria (77%), and Kenya and Rwanda (90%). The majority of COP countries (14) have directed less than half of new funding to local partners. Overall, 55% of new funding across COP countries is being channeled to local partners, ranging from 2% in South Sudan to 90% in Kenya and Rwanda. See Figure 6.
Health Systems Strengthening
One of the main goals of the COP process this year is to “build enduring capabilities” including “resilient and capacitated country health systems.” While standardized country-level data on health systems are not readily available, we looked at how the PLLs address and assess health system strengthening in COP countries, focusing specifically on key challenges or strategic priorities raised regarding supply chains, laboratory networks, data systems, and the health workforce. We also looked at how the PLLs address sustainability planning.
- Supply Chains: In half of COP countries, PLLs identify supply chain issues as key challenges, ranging from challenges with data systems to commodity stockouts. In ten countries,6 including Cameroon, Kenya, and Zimbabwe, persistent stockouts and commodity shortages, often influenced by the COVID-19 pandemic and inadequate funding for supply chain systems, are raised as key challenges.7 Additionally, in other countries, such as for Uganda and Namibia, the governments are called upon to take greater ownership of their supply chain systems and reduce their dependency on PEPFAR as either key challenges or elsewhere in the PLLs. Other issues identified broadly in the PLLs are allocating sufficient resources for procurement and planning for safe collection and disposal of pharmaceutical waste.
- Laboratory Networks: Building stronger laboratory networks and systems is raised in eight countries as a key challenge.8 Equipment breakdowns and delays in testing results were also mentioned in seven countries as key challenges.9 Another key challenge cited is limited laboratory capacity, especially as testing networks were utilized to address the COVID-19 pandemic. For example, the Burundi PLL notes that laboratory reagents were used for both HIV and COVID-19 testing, constraining the country’s testing capacity. For the related MPR, diagnostic network optimization, seven countries report completion, and 17 report it as “in process.”
- Data Systems: Improving data systems, such as to strengthen the ability of country governments to monitor epidemiological data and assess patient-level outcomes, was mentioned in nearly all COP countries as a key challenge. Various data quality and availability issues were identified in country PLLs, including interoperability - the ability to exchange and use information - between facilities (seven countries);10 directives to implement or improve electronic medical records (six countries);11 and improved population-based estimates (seven countries).12 For example, the Burundi PLL identifies the lack of interoperability between data systems as well as delays in data availability as a key challenge. The Kenya PLL identifies the lack of unique identifiers for patient-level data as a key challenge that may result in Kenya’s program having high levels of patient transfers and re-tests. Only three countries report completing the related MPR, which addresses implementing unique patient identifiers and scale-up of case surveillance.
- Health Workforce: Most countries’ PLLs highlight rightsizing, aligning, or integrating human resources for health (HRH) in coordination with country governments and other stakeholders as a key challenge. For example, the Malawi PLL recommends “prioritizing the judicious allocation of HRH with” the country government and directs the country team to “identify HRH requirements based on expected future adjustments to maintain HIV service delivery and utilize this to inform transition or absorption of PEPFAR-supported staff.” Likewise, the Eswatini PLL recommends aligning and merging PEPFAR human resources support with the country government’s health care workforce architecture. There are also recommendations in many PLLs, especially for countries at or nearing epidemic control (such as the Kenya and Zimbabwe PLLs), to review data to ensure optimal and efficient staffing, to plan for lesser reliance on a PEPFAR-supported health workforce in the future, and to facilitate discussion of the workforce with the government or alignment of support with the Global Fund. Other PLLs highlight HRH challenges related to limited capacity. For example, the South Sudan PLL discusses human resource capacity limitations as a key challenge, while the Ethiopia PLL identifies the displacement and loss of health care workers due to conflict in certain regions of the country as a key challenge. OGAC reports that PEPFAR teams have collected data through a new HRH inventory for each country, which may help inform these efforts going forward, and PLLs for seven countries13 specifically mention this inventory in a technical directive and direct country teams to review these data to ensure optimal staffing levels.
- In six COP countries,14 the PLLs specifically call for the development of sustainability or transformation plans. For instance, Rwanda’s PLL asks for the program, along with the country government, to begin developing a framework for local entities to assume greater responsibility for its HIV services, while the Botswana PLL says the country team should “develop a plan with the GoB [Government of Botswana], multilaterals, and local partners that establishes milestones and a path for a staged shift in responsibilities.” Similarly, the Eswatini PLL directs the country team to “begin formal discussions and mapping of [the] pathway to sustainability of the national HIV response” and to “disarticulate technical and programmatic sustainability from financial.”
- Other PLLs address sustainability issues and planning in a broader manner. For example, the Dominican Republic PLL identifies building political will, removing barriers to services, and prioritizing HIV services as among its key challenges, while the Kenya PLL says, “Now that Kenya overall is at epidemic control, the program approach should be examined to: 1) center the strategy around sustainability in every aspect of the program and 2) tailor the strategy to reach the last mile at the county-level and for all populations.” Likewise, the Zambia PLL recommends that the country team “work with the Government of Zambia to ensure alignment in the vision to jointly sustain impact on the HIV epidemic” and it also suggests that the country team should “support Zambia’s public health approach and platform to strengthen primary care.”
Key and Other Vulnerable Populations & Stigma and Discrimination
PEPFAR has placed increasing emphasis on the importance of addressing structural barriers (including in the legal and policy environment), focusing on equity and human rights challenges for key populations (sex workers, gay men and other men who have sex with men, transgender people, people who inject drugs, and people in prisons), and closing the gaps for other vulnerable populations (including women and girls, and young people). These are major themes in this year’s COP guidance, including a new gender equality section and a new MPR. We analyzed the PLLs to assess key challenges identified in countries and also looked at the legal and policy environments in COP countries.
- The PLLs frequently identify addressing gaps for children and adolescent girls and young women (AGYW) as a key challenge, with nearly all (22)15 highlighting prevention, testing, and treatment to reach these groups. For example, the Botswana PLL identifies “persistent gaps in case-finding, linkage, treatment, and viral load coverage/suppression for pediatric and adolescent people living with HIV,” the Malawi PLL identifies maintaining enrollment in DREAMS as well as case finding and treatment efforts for adolescents, and the Mozambique PLL identifies similar challenges for children and youth treatment as well as prevention efforts for AGYW. Gender-based violence is mentioned in 4 PLLs,16 and it is highlighted as an important component of DREAMS programming in some cases. Though less of a focus, some PLLs highlight other groups of women, including pregnant and breastfeeding women (e.g., Cameroon, Ethiopia, and Tanzania) and adult women (e.g., the Democratic Republic of the Congo, Haiti, and Mozambique).
- More than half of the PLLs highlight addressing gaps for key populations as a key issue, and nearly all have a technical directive focused on improving and expanding data in this area. For example, Uganda’s PLL specifically calls for addressing barriers to HIV prevention and treatment services among key populations, such as through community-based medication distribution and support services at drop-in centers. Additionally, nearly all (23)17 of the PLLs identify the lack of robust data on key populations and services provided to them as a barrier, impeding the ability to improve and scale up key population programming. These countries are directed to describe during the COP planning meetings how they will improve their approach to strengthening key population data systems and analyses and addressing structural and other barriers to accelerating services focused on key populations.
- As the MPR related to equity, reducing stigma and discrimination, and promoting human rights is new this year, most countries (20) report it is still “in process,” and only a few specifically mention stigma and discrimination or human rights as key issues. Among the few that do are Uganda’s PLL, which flags increasing concern about stigma, discrimination, and human rights violations and addressing these barriers. Similarly, Cote d’Ivoire’s PLL mentions stigma remains high and that barriers must be addressed in order for vulnerable populations to access key services. The PLLs of three COP countries (Cote d’Ivoire, Mozambique, and South Africa) report they have been selected for participation in a stigma and discrimination pilot effort, known as the focal countries’ collaboration, that involves the Global Fund, UNAIDS, and PEPFAR. The collaboration is intended to help countries to address stigma and discrimination over three to five years and will support these countries to “focus on removal of societal, including legal barriers (specifically stigma, discrimination, punitive policy environments, and violence) that limit access to or utilization of HIV services.”
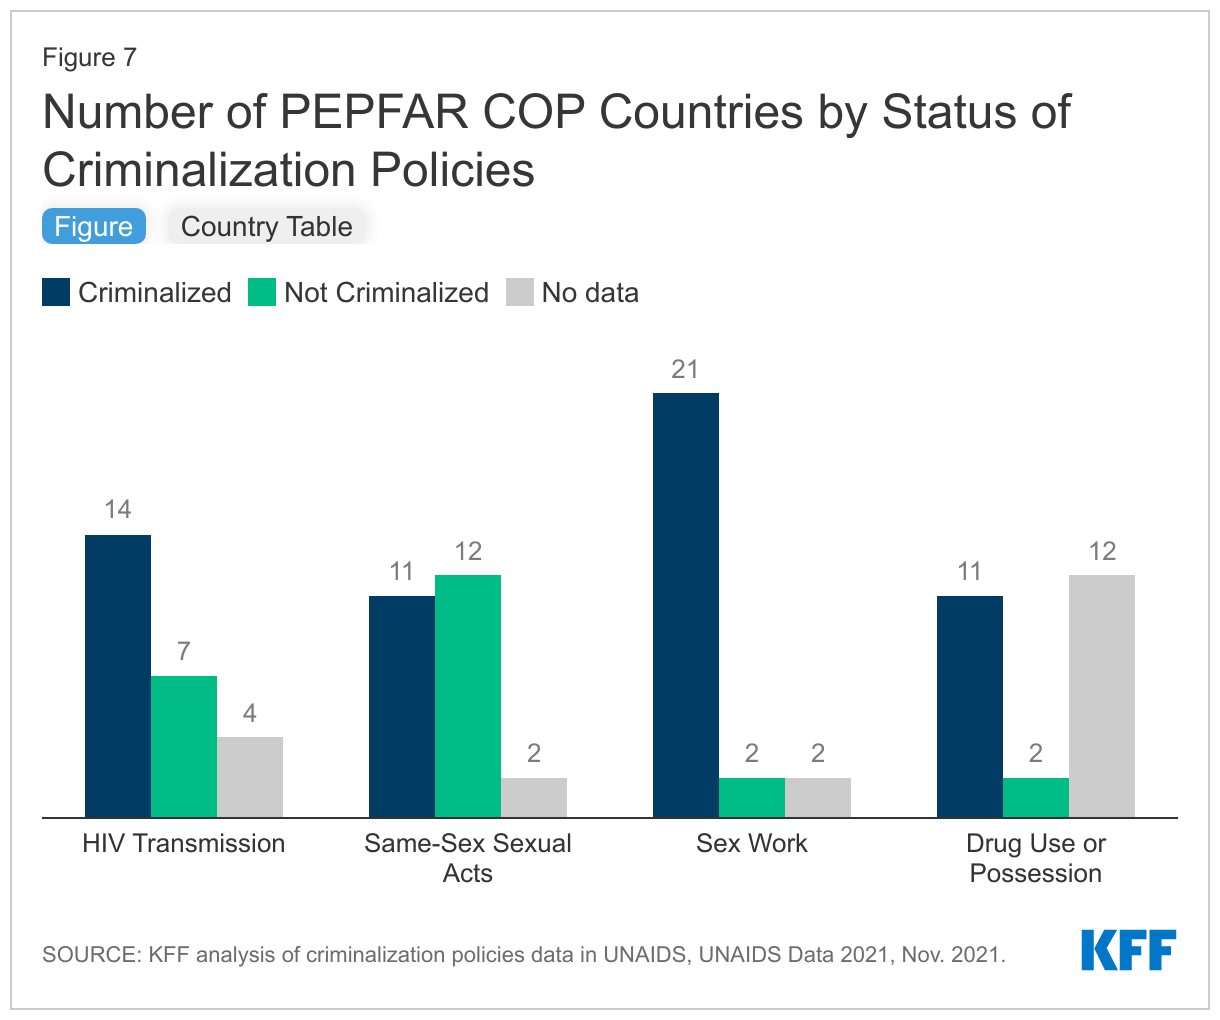
- Many COP countries have legal and policy barriers that may present challenges to reaching and supporting key populations in accessing HIV services. This is particularly notable in the case of sex work, which is criminalized in most COP countries (21). HIV transmission is criminalized in more than half (14), and drug use and possession as well as same-sex sexual acts are criminalized in almost half of the COP countries (11 each). See Figure 7.
Community and Civil Society
PEPFAR’s inclusion of community and civil society has a long history and sets it apart from most other bilateral health programs. This year’s COP guidance calls on countries to include community and civil society in every stage of programming and planning to help promote sustainability as well as accountability. We examined how the COP PLLs addressed engagement of civil society and also looked at the legal and policy environment in COP countries regarding civil society participation.
- The importance of engaging CSOs in order to improve PEPFAR programming, with particular emphasis on the role of community-led monitoring (CLM), is mentioned in all PLLs. This includes engaging with CSOs throughout the PEPFAR planning process (both during and outside the COP) and implementation. For example, some countries’ PLLs, such as for the Dominican Republic, emphasize the importance of defining the role of CSOs (as well as other stakeholders) in national strategic plans or other efforts, while others, such as for Cote d’Ivoire, direct PEPFAR programs to engage with CSOs to ensure sharing of best practices to improve alignment of health service delivery. Further, several PLLs, encourage programs to utilize CSOs to improve treatment continuity among patients as they help track and return them to care, like that of South Sudan, or to track and improve accountability for outcomes among pediatric patients, like that of Angola. As required, all PLLs include a section focused on CLM that calls for, among other things, the PEPFAR country program to support CLM funding.
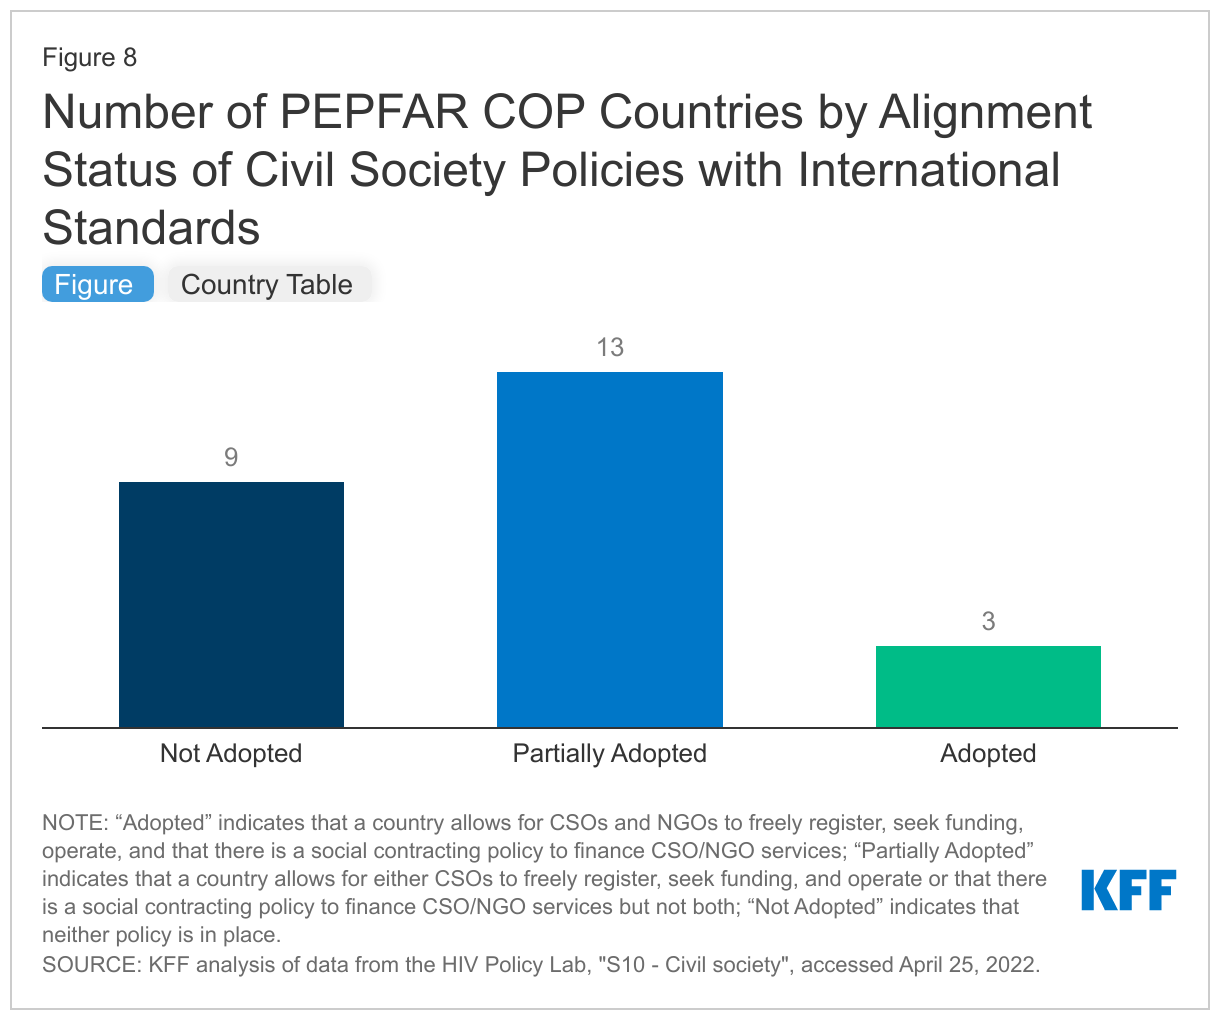
- The legal and policy landscape for civil society inclusion varies in COP countries, and there are limits in some cases. Fifteen COP countries allow for one or both of the following: 1) CSOs may freely register, seek funding, and operate, and 2) there is a mechanism for the government to finance them to provide health services.18 Of these 15 countries, only three – Botswana, the Dominican Republic, and South Africa – have adopted both policies, while 12 have adopted one policy only. The remaining nine have not adopted either policy. See Figure 8.
Conclusion
This analysis examines PEPFAR’s current vision for achieving sustained epidemic control, a priority focus for the program, by providing an initial look at how PEPFAR is currently defining and approaching sustained epidemic control at the country level. As it finds, the picture is multi-layered, and there is significant variation across countries and across several dimensions that are important for sustainability, including epidemiological (PEPFAR’s epidemic control target) but also financial and structural. It finds that all countries are making progress toward sustainability, with 12 having reached epidemic control and four making significant progress on the MPRs, reporting they completed at least half. Still, progress varies, and there are some areas, such as increasing domestic funding from partner governments, where progress is particularly lagging. In that area specifically, there may be new challenges ahead, as many PEPFAR countries continue to experience the economic effects of COVID-19, and there are rising inflationary pressures, which may limit their ability to provide additional domestic resources. Moreover, in many PEPFAR countries, there are structural barriers affecting access for key populations, which, while identified by PEPFAR as important for countries to address, may be especially hard to ameliorate. Going forward, better understanding how these markers of sustainability, such as epidemic control status, financial dependency, and MPR status, fit together may help to paint a clearer narrative of country progress. Some additional information about PEPFAR’s approach and progress toward sustained epidemic control may be forthcoming, as PEPFAR is expected to release the country team-prepared COPs, PEPFAR’s next five-year strategy, and multiyear sustainability roadmaps for many PEPFAR countries.19 In addition, discussions about PEPFAR’s next reauthorization are likely to begin later this year.
Appendix
Endnotes
- Although PEPFAR supports activities in more than 50 countries, the other countries fall under Regional Operational Plans (ROPs), which were not included in this analysis. ↩︎
- We simplified PEPFAR’s five category approach for epidemic control status used in this year’s COP guidance into three categories by classifying countries “at epidemic control with at least 73% viral load suppression” and countries “at epidemic control without at least 73% viral load suppression” as “at epidemic control”; maintaining PEPFAR’s “near epidemic control” category; and classifying countries “not at epidemic control but declining infections/mortality” and countries “not at epidemic control with increasing infections/mortality as “not at epidemic control.” ↩︎
- Test and start is a policy in which at least 95% of those who are identified as HIV positive are linked to antiretroviral treatment immediately upon testing. ↩︎
- This MPR relates to countries’ adoption and implementation of policies that eliminate fees at the point of care for direct HIV services and related services, such as antenatal care, TB, and cervical cancer in the public sector. ↩︎
- PEPFAR standards for the OVC program include facilitating testing for all children at risk for HIV, linking children living with HIV to treatment and case management, and reducing risk of sexual violence. The share of COP countries does not include COP countries where this OVC MPR is not applicable, namely, Angola and Vietnam. ↩︎
- These include Angola, Burundi, Cameroon, Cote d’Ivoire, the Dominican Republic, Kenya, Malawi, Tanzania, Ukraine, and Zimbabwe. ↩︎
- Additional COP countries may not cite commodity stockout or shortages issues as challenges or priority changes but may mention it elsewhere such as in explanations for not completing certain MPRs (e.g., Eswatini cites stockouts of antiretrovirals as a barrier to completing the MPR related to differentiated service delivery). ↩︎
- These include Burundi, Democratic Republic of the Congo, Eswatini, Haiti, Angola, Mozambique, Nigeria, and Tanzania. ↩︎
- These include Burundi, Cote d’Ivoire, Mozambique, Nigeria, Tanzania, Zambia, and Zimbabwe. Additional COP countries may not cite laboratory equipment breakdowns or delays in testing results as major challenges or key issues but rather as explanations for not completing certain MPRs. For example, in Haiti, equipment failures and increased turnaround times for viral load samples, among other issues, are cited as barriers to completing the MPR related to diagnostic network optimization. ↩︎
- These include Botswana, Burundi, Cote d’Ivoire, Lesotho, Mozambique, Uganda, and Vietnam. Additional countries, such as Eswatini and South Africa, mention interoperability in their MPR explanations. ↩︎
- These include Botswana, Dominican Republic, Lesotho, Malawi, Uganda, and Zambia. Additional countries, such as Cameroon and Uganda, mention this in their MPR explanations. ↩︎
- These include the Democratic Republic of the Congo, the Dominican Republic, Lesotho, Mozambique, Nigeria, South Africa, and Uganda. ↩︎
- These include those of Cote d’Ivoire, Lesotho, Malawi, Namibia, South Africa, Uganda, and Zimbabwe. ↩︎
- These include those of Botswana, Eswatini, Lesotho, Rwanda, Tanzania, and Uganda. ↩︎
- These include Angola, Botswana, Burundi, Cameroon, Cote d’Ivoire, the Democratic Republic of the Congo, the Dominican Republic, Eswatini, Ethiopia, Haiti, Kenya, Lesotho, Malawi, Mozambique, Nigeria, Rwanda, South Africa, South Sudan, Tanzania, Uganda, Zambia, and Zimbabwe. ↩︎
- These include the Cote d’Ivoire, Eswatini, Ethiopia, and Haiti PLLs. ↩︎
- These include Botswana, Burundi, Cameroon, Cote d’Ivoire, the Democratic Republic of the Congo, Eswatini, Ethiopia, Haiti, Kenya, Lesotho, Malawi, Mozambique, Namibia, Nigeria, Rwanda, South Africa, South Sudan, Tanzania, Uganda, Ukraine, Vietnam, Zambia, and Zimbabwe. In the case of the Dominican Republic, its PLL discusses the lack of robust data on focus clients (“FC”) services, which refers to “migrants of Haitian origin living in the Dominican Republic and their descendants.” ↩︎
- KFF analysis of data from the HIV Policy Lab, “S10 - Civil society,” accessed April 25, 2022, https://www.hivpolicylab.org/policy/S10. ↩︎
- Key among these will be six COP countries (Botswana, Eswatini, Kenya, Lesotho, Namibia, and Uganda) identified as “Sustaining Impact Operating Units (OUs)” during the 2022 COP planning process that are expected to release sustainability roadmaps later this year. ↩︎