Medicare

NEW AND NOTEWORTHY

Decoding Medicare Advantage Coding Intensity

Federal payments to Medicare Advantage plans, and adjustments for health status, have come under increased scrutiny. This brief answers key questions about coding intensity, recent steps taken by CMS, the effects on beneficiaries, and other proposals to improve payment accuracy.

Data Visualization

The Facts About Medicare Spending

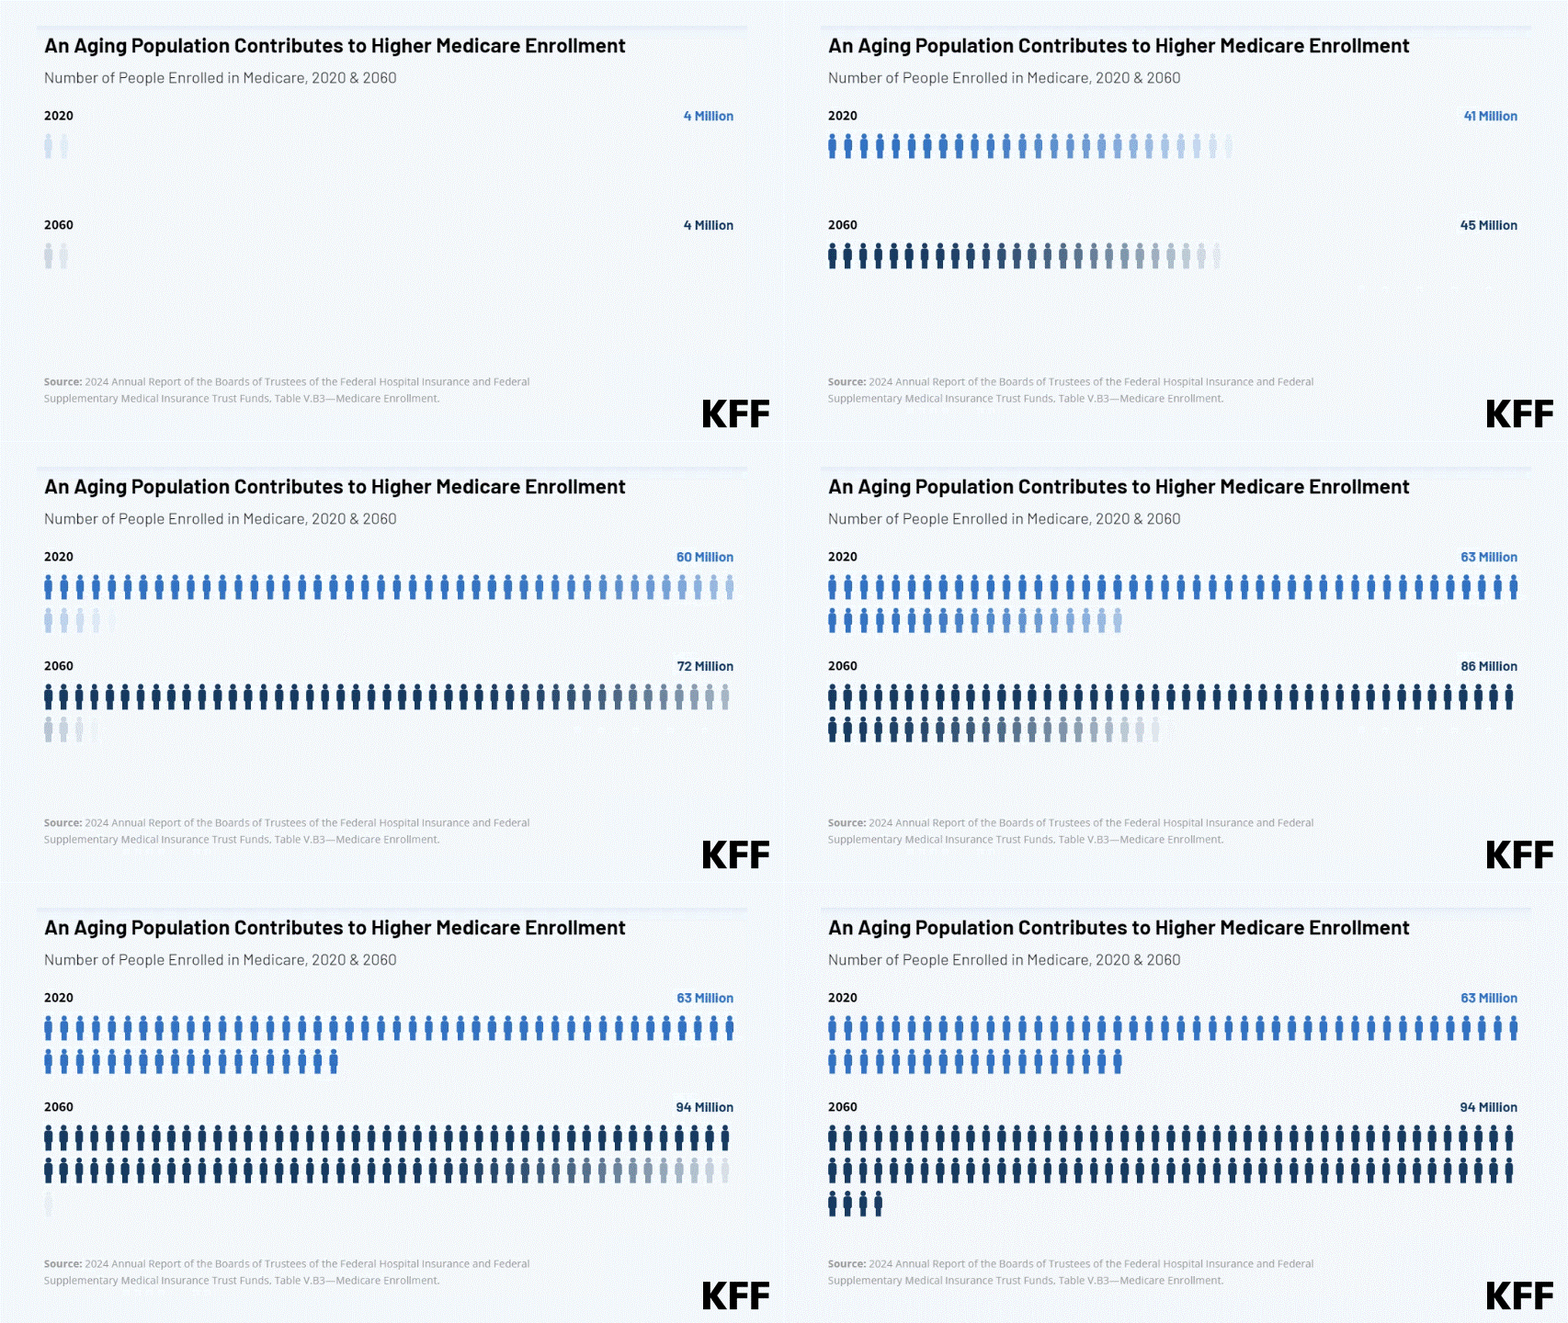
This interactive provides the facts on Medicare spending. Medicare, which serves 67 million people and accounts for 12 percent of the federal budget and 21 percent of national health spending, is often the focus of discussions about health expenditures, health care affordability and the sustainability of federal health programs. Explore data on enrollment growth, Medicare spending trends overall and per person, growth in Medicare spending relative to private insurance, spending on benefits and Medicare Advantage, Part A trust fund solvency challenges, and growth in out-of-pocket spending by beneficiaries.

Read More

Stay informed.

Stay informed.

Filter

1,171 - 1,180 of 1,613 Results

  • The Diversity of Dual Eligible Beneficiaries: An Examination of Services and Spending for People Eligible for Both Medicaid and Medicare

    Issue Brief

    This issue brief analyzes linked Medicare and Medicaid data to examine dual eligibles' utilization and spending in both programs in 2007. As a group, dual eligibles are costly—with per capita Medicare and Medicaid spending over four times Medicare spending for other beneficiaries. However, a small share of dual eligibles account for most of the group's spending, and dual eligibles who are high cost to the Medicare program are generally not the same individuals who are…

  • Medicare Part D 2009 Data Spotlight: Ten Most Common Brand-Name Drugs

    Issue Brief

    This Data Spotlight focuses on Part D plan coverage of the ten brand-name drugs that were most commonly prescribed for Medicare beneficiaries in 2006 and lack generic equivalents in 2009. Findings are based on an analysis of data for the 44 unique, national and near-national stand-alone prescription drug plans. The list of the top ten brand-name drugs is based on the number of prescriptions filled in 2006 in all Part D plans. The list includes…

  • Medicare Part D 2010 Data Spotlight: A Comparison of PDPs Offering Basic and Enhanced Benefits

    Report

    This Part D Data Spotlight examines key differences between basic and enhanced Medicare stand-alone prescription drug plans (PDPs), including monthly premiums, cost sharing, and gap coverage. It also examines plan names to assess whether they convey meaningful differences between basic and enhanced PDPs. Companies that sponsor Medicare Part D prescription drug plans are required to offer a basic benefit, either the standard Part D benefit defined by law or an actuarially equivalent benefit design. Plan…

  • Explaining Health Care Reform: Key Changes to the Medicare Part D Drug Benefit Coverage Gap

    Issue Brief

    On March 23, 2010, President Obama signed the Patient Protection and Affordable Care Act into law. The health reform law, as modified by the Health Care and Education Reconciliation Act of 2010 which passed the House of Representatives on March 21, 2010 and is under consideration in the Senate, makes several key changes to the Medicare Part D drug benefit to reduce Part D enrollees’ out-of-pocket liability when they reach the coverage gap, known as…

  • Visualizing Income and Assets Among Medicare Beneficiaries: Now and in the Future

    Interactive

    This interactive tool describes the income, savings and home equity of people on Medicare in 2013, and in 2030. It allows users to break out the data by age, gender, race/ethnicity, marital status and education level, providing insight into the disparities within and across categories of beneficiaries.

  • How Much Is Enough? Out-of-Pocket Spending Among Medicare Beneficiaries: A Chartbook

    Report

    This new analysis and chartbook examines out-of-pocket spending among Medicare beneficiaries, including spending on health and long-term care services and insurance premiums, using the most current year of data available from a nationally representative survey of people on Medicare. It explores which types of services account for a relatively large share of out-of-pocket spending, which groups of beneficiaries (including by age, gender, health status, and chronic conditions) are especially hard hit by high out-of-pocket costs,…

  • The Rising Cost of Living Longer: Analysis of Medicare Spending by Age for Beneficiaries in Traditional Medicare

    Report

    This analysis provides a detailed look at per person Medicare spending on the nearly 30 million beneficiaries over age 65 who are enrolled in the traditional Medicare program. Among the key findings of the report is that per person spending rises with age, peaking at age 96. But this rise is not entirely explained by Medicare spending on end of life care, which declines with age. What Medicare spends money on also changes as beneficiaries…

  • Visualizing Health Policy: The Role of Medicare Advantage

    News Release

    This Visualizing Health Policy infographic provides a snapshot of the role of Medicare Advantage plans, an alternative to traditional Medicare, including information about the proportion of Medicare beneficiaries who are enrolled in Medicare Advantage plans, geographic differences in Medicare Advantage penetration, the trend of increasing enrollment in Medicare Advantage plans, and the concentration of enrollment within a small number of firms and affiliates. It also shows the extent that Medicare has been paying more for…