KFF designs, conducts and analyzes original public opinion and survey research on Americans’ attitudes, knowledge, and experiences with the health care system to help amplify the public’s voice in major national debates.
A selection of articles from our fellows’ work are represented below. Many of the articles are translated from their original language (Marathi or Hindi) into English for greater accessibility. It is important to note that as a result of the translations, the language in the articles may not reflect the full original intended meaning or tone.
Hindustan newsaper (Hindi) Sudhir Mishra, principal correspondent, Lucknow
Indian Express newspaper Toufiq Rashid, principal correspondent, New Delhi
“New surveys to pin AIDS count” February 16, 2006 “Moving Down South” April 2, 2006 “Back to Basics” April 2, 2006 “72,000 New HIV cases, high-risk group is problem” April 5, 2006
Delhi, Mumbai, Pune, Panchgani, Jaipur, India, U.S. Journalists’ Sitevisit, April 2-13, 2007Click here for the NPR report by Joe Neel about our site visit to India (7/6/07)
International Health Journalism Fellowship Project in Indiawas launched in 2005 at the Media Leaders’ Summit at the Prime Minister’s residence in New Delhi. The program encouraged substantive coverage of the health, social, economic, political and cultural implications of HIV/AIDS and associated health problems by partnering with selected news organizations and training their entire newsrooms. Following trainings, partner news organizations selected a reporter to undertake an individually tailored project that focused on HIV/AIDS or related health issues in India. Priority for these projects went to those that were
otherwise unlikely to be undertaken or completed without outside funding,
focused on issues currently under-reported or not reported at all
highly likely to be published/broadcast and
accessible to a relatively large audience
The Project in India was funded entirely through a generous grant from The Bill & Melinda Gates Foundation, as part of a larger initiative on increasing understanding of global health issues. The Gates Foundation was not involved in the selection of any project-award recipient, and no representation should be made that the Gates Foundation supported the activities of any project-award recipient.
The International Health Journalism Fellowship Project in India also produced the widely-read Health e-Letter, a monthly newsletter about public health issues in India. This newsletter was edited by Ms. Kalpana Jain, former Health Editor at the Times of India, while she was the Kaiser International Journalism Fellow in India and published articles by Indian health journalists – many of them former fellows.
You can view past issues of the Health e-Letter, as well as examples of work produced by Kaiser Fellows in India, in our archives below.
A newer version of this Snapshot is available here.
Compensation for Workers with and without Access to Health Benefits at Work October 2008
This paper compares the payroll and benefit compensation of workers that had access to employer-sponsored health benefits at work to that of workers who did not have an insurance offer. By analyzing compensation differences within occupations and establishment sizes for those with and without access to health benefits, we provide new information to help policymakers as they consider how to design effective and targeted strategies to increase job-based coverage.
Surveys of employers indicate that smaller and lower wage firms are less likely to offer health benefits to workers, but do not provide detailed information about wage and benefit differences for workers with and without an offer of health benefits working in different settings.1 In this Snapshot, we use information from a nationally representative survey of workers to provide a fuller picture of the compensation for workers with health coverage access at their job compared to those without such access by firm size and occupation. We also look at trends over time.
Our analysis is based on data from the National Compensation Survey (NCS), which is a nationwide survey of labor costs in private and public establishments conducted quarterly by the Bureau of Labor Statistics (BLS).2 Details about the NCS and our analysis are available in a methodological appendix at the end of this analysis. Worker compensation is divided into three categories: payroll costs, fringe benefit costs excluding employer payments for health insurance, and employer payments for health insurance. Differences in compensation between workers with and without access to health benefits are compared with regard to payroll and non-health fringe benefits.
Definitions of key terms:
Payroll costs include employer payments for wages, salary, overtime, vacation, holiday, sick days, bonus, and other cash compensation to employees, but exclude severance payments and unemployment benefits.
Employer costs for health benefits include all employer payments for health coverage and exclude employee contributions to premiums or out-of-pocket medical cost-sharing.
Non-health fringe benefits include employer payments for life and short-term disability insurance, defined benefit and defined contribution pension plans, worker’s compensation, and Social Security and Medicare payroll taxes.
Total compensation is defined as the sum of payroll and all fringe benefit costs including health.
Establishment size is the number of employees at a selected plant or office. Firms may be made up of one or more establishments.
Compensation Levels
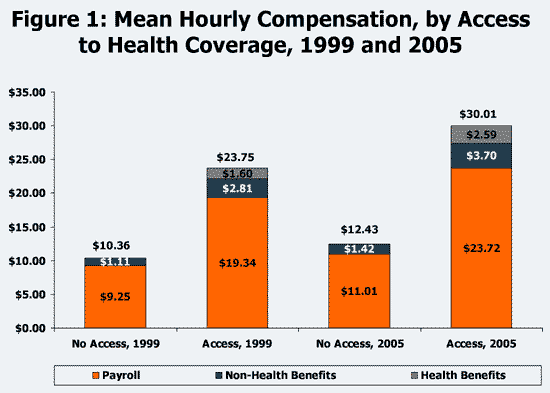
Employees with relatively high wages are more likely to have access to employer-provided health benefits. Employees in establishments with access to health benefits, on average, receive more than twice as much in payroll and non-health benefit compensation as employees who do not have access to health benefits at work (Figure 1). When employer costs for health benefits are added to compensation for workers who have access (i.e., total compensation), the difference between these groups grows. In 2005, employees with access to health benefits had total compensation averaging $30.01 per hour, compared with $12.43 for employees without access. The gap has been widening. From 1999 to 2005, the real percentage change in total compensation for workers with access was about 9.8 percent compared to 2.8 percent for those without access.3
Source: Kaiser Family Foundation calculations based on data from the National Compensation Survey, 1999 & 2005, conducted by the Bureau of Labor Statistics.
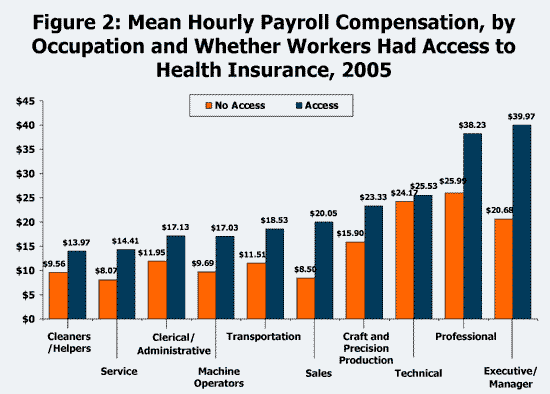
Workers with access to health benefits are disproportionately in higher paid occupations, although we still find significant differences in average payroll compensation within occupation categories for workers with and without access (Figure 2). (We focus on payroll compensation for the remainder of this section because it is by far the largest portion of total compensation). Large differences in average hourly payroll compensation were found for workers with and without access to health benefits in nine of ten selected occupation categories, with a range of average hourly payroll costs, in 2005 (Figure 2). Some of the most notable differences occurred in the more highly paid professional and executive management occupation categories.
Source: Kaiser Family Foundation calculations based on data from the National Compensation Survey, 2005, conducted by the Bureau of Labor Statistics.
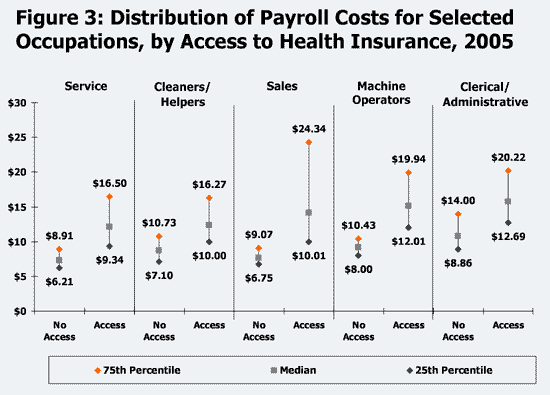
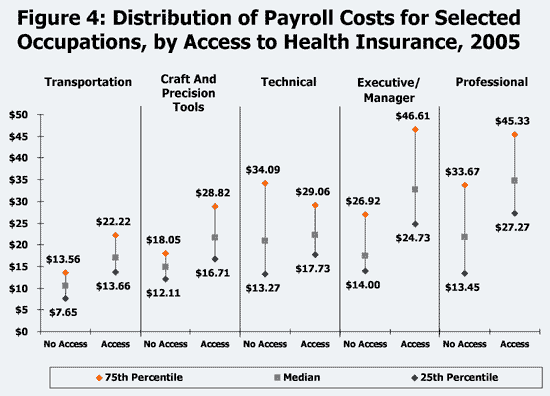
Because a wide variety of jobs can be captured even within a single occupation category, particularly for occupations like the sales, professional, and executive/manager categories, we assessed how payroll compensation is distributed within occupation categories. Figures 3 and 4 show the 25th percentile, median (or midpoint), and 75th percentile of payroll for workers with and without access to health benefits within each of the ten occupation categories in 2005.4 For example, looking at workers with access to health benefits in the service occupation, 25 percent had payroll compensation at or below $9.34, one half had payroll compensation equal to or less than $12.10, and 75 percent had payroll compensation at or below $16.50. In contrast, for service workers without access to health benefits at work, a quarter had hourly payroll compensation at or below $6.21, one half had hourly payroll compensation at or below $7.28 and only one quarter had hourly payroll compensation above $8.91. This is a lower and narrower range than is seen for service workers with access to health benefits. Large shares of workers without access to health benefits have relatively low payroll compensation when compared to workers within the same occupations with access to health benefits. In fact, for several of these occupations, the payroll compensation at the 25th percentile for those with access was greater than the 75th percentile for those without access.
Source: Kaiser Family Foundation calculations based on data from the National Compensation Survey, 2005, conducted by the Bureau of Labor Statistics.
Source: Kaiser Family Foundation calculations based on data from the National Compensation Survey, 2005, conducted by the Bureau of Labor Statistics.
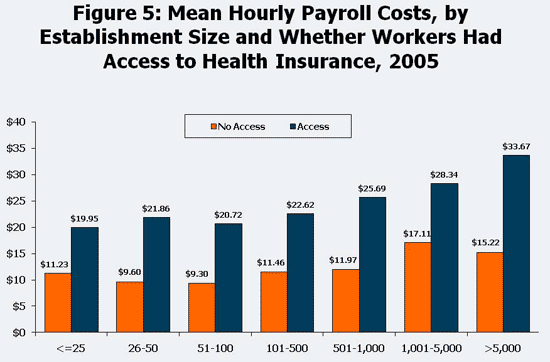
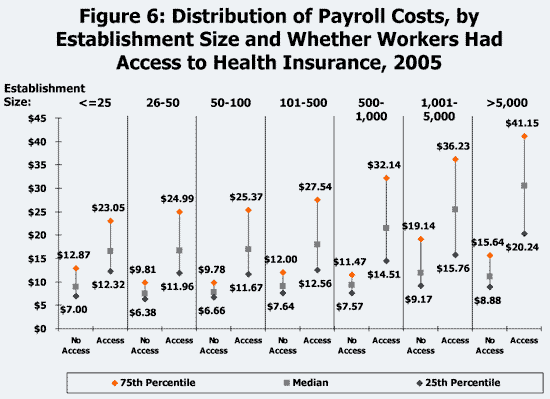
A similar pattern emerges when payroll compensation for workers with and without health benefit access is examined by the size of the establishments where they work. Average payroll compensation is much higher for workers with health insurance access than for workers without access across all establishment sizes (Figure 5). The distributions for payroll compensation for workers with and without access by establishment size confirms that most workers with access have much higher payroll compensation than the majority of workers without access (Figure 6). For workers without access to employer health insurance, there is a noticeably lower and smaller variation in payroll compensation. In five out of the seven establishment size categories analyzed here, the 25th percentile of payroll for workers with access exceeded the 75th percentile of payroll for workers without access.5
Source: Kaiser Family Foundation calculations based on data from the National Compensation Survey, 2005, conducted by the Bureau of Labor Statistics.These data were corrected on 10/4/2010.
Source: Kaiser Family Foundation calculations based on data from the National Compensation Survey, 2005, conducted by the Bureau of Labor Statistics.
Changes in Compensation
Health benefit costs grew rapidly from 1999 to 2005,6 so we might expect, all other things being equal, payroll and non-health benefit compensation to have grown more slowly for those with access to health benefits than for those without access. Since workers with health benefit access saw a greater share of their compensation shifted to health benefits over the period,7 in theory, this relative growth in the health benefit costs should be offset by a reduction in the growth of payroll and non-health benefits. On the other hand, the compensation of workers without health insurance access is not directly affected by the rapid rise in health benefit costs, so changes in their total compensation should rise with other factors, such as their overall productivity.
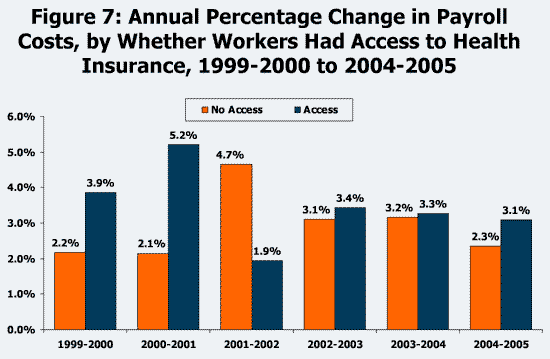
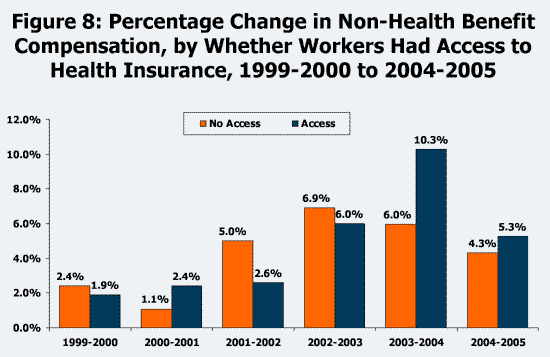
However, payroll and non-health benefit compensation did not rise more over this period for workers without access to health insurance than it did for workers with access; in fact, workers with access to health benefits appeared to have slightly higher compensation increases over the period (Figures 7 and 8). A possible explanation is that the period of time that we observed is too short for wages to adjust to the growth in health benefit costs, and that we would see the expected pattern if a longer period of time were available. Another possibility is that average productivity grew faster over the period for workers with health benefit access than for workers without access. If this were the case, then we would not expect that changes in total compensation growth over the period to be the same for workers with and without access (because workers with health benefit access on average would be more valuable over time).8
Note: Numbers not adjusted for inflation.Source: Kaiser Family Foundation calculations based on data from the National Compensation Survey, 1999-2005, conducted by the Bureau of Labor Statistics.
Note: Numbers not adjusted for inflation.Source: Kaiser Family Foundation calculations based on data from the National Compensation Survey, 1999-2005, conducted by the Bureau of Labor Statistics.
Discussion
We show a substantial gap in compensation between workers with and without health benefit access from the establishments where they work. Workers with access to employer health benefits receive much higher total compensation, payroll compensation, and non-health benefit compensation. The substantial gaps in payroll compensation generally hold up when the data is divided by establishment size and worker occupation.
This paper offers new insight into the diversity of the workforce and the compensation differences for workers with and without access to health benefits at work. Understanding these differences may assist efforts to design affordable approaches to improving access to coverage for workers who currently are not offered coverage at work. The relatively low payroll compensation of workers not currently offered health benefits suggests that it may be difficult for many of them to fund a meaningful portion of the cost of health benefits out of their current compensation.
When evaluating different approaches for extending coverage, special attention to the financial circumstances of these workers and the establishments in which they work seems warranted. For example, payroll differences are consistent and significant across establishment sizes, so policies aimed at providing special protection to smaller business and their workers, while potentially justified and important, may ignore equally important financial hardships faced by larger employers and their workers. Generally, the low payrolls of workers not offered health benefits suggests that relatively generous financial assistance will be needed if these workers are to gain coverage.
This paper was prepared by Gary Claxton of the Kaiser Family Foundation’s Health Care Marketplace Project and Paul Jacobs who formerly worked in that division.
Financing the response to AIDS in low- and middle-income countries: International assistance from the G8, European Commission and other donor Governments, 2007
Authors: Jennifer Kates, José-Antonio Izazola, and Eric Lief
Financing a sufficient and sustained response to the HIV/AIDS epidemic in low- and middle- income countries has emerged as one of the world’s greatest challenges, and one that will be with us for the foreseeable future. International assistance from donor governments, through bilateral aid and contributions to the Global Fund to Fight AIDS, Tuberculosis and Malaria (the Global Fund) as well as other financing channels, is a critical part of this response. Other international financing sources include multilateral institutions and the private sector. Domestic spending by many affected-country governments to combat their epidemics, as well as spending by households and individuals within these countries, are also major parts of the response. Funding from all these sources has risen over the past decade. Despite these increases, however, the difference between UNAIDS’ estimates of resource needs compared to resources available in 2007 was at least $8 billion, a difference that could even grow larger over the next few years. Most of this difference will need to be filled by the international community.
This analysis provides the latest available data on international assistance for AIDS in low- and middle-income countries provided by donor governments, including the Group of Eight (G8), the European Commission (EC), Australia, Ireland, The Netherlands, Sweden, and other donor governments who are members of the Organisation for Economic Co-operation and Development (OECD)’s Development Assistance Committee (DAC), and provide international HIV/AIDS assistance. The data were collected and analyzed through a collaborative effort between UNAIDS and the Kaiser Family Foundation. The Henry L. Stimson Center also conducted research for this project.
Key Highlights
In 2007, international AIDS assistance from the G8, EC, and other donor governments reached its highest level ever:
Commitments totalled US$6.6 billion, of which US$5.4 billion was through bilateral channels (including earmarked multilateral commitments) and US$1.2 billion to the Global Fund (adjusted to represent the AIDS share).
For every ten dollars committed in 2007, more than seven were disbursed (including disbursements against both current and past commitments), totalling US$4.9 billion in disbursements, or resources made available for AIDS in low- and middle- income countries by donor governments.
Funding from donor governments has risen significantly over the past several years:
Between 2002 and 2007, commitments and disbursements each increased by at least four-fold, although commitments rose at a faster rate than disbursements.
In the most recent period, 2006 to 2007, disbursements rose faster than commitments (27% compared to 19%, respectively).
Increases in international AIDS assistance from donor governments have been driven by a subset of G8 Members and, notably, a few non-G8 Members:
In 2007, the United States was the largest donor in the world, accounting for more than 40% of disbursements by governments. Among resources available in 2007 for the fight against AIDS in low-and middle- income countries from all sources (domestic and international), the U.S. accounted for 20%, the largest share.
The United Kingdom accounted for the second largest share of disbursements from all donor governments, followed by the Netherlands. Sweden and Ireland each accounted for larger shares than some G8 Members.
Most funding provided by donor governments is channelled bilaterally or earmarked through multilateral instruments (and therefore here considered bilateral), accounting for 75% of disbursements in 2007; the remainder is provided through the Global Fund. Funding channel patterns vary significantly by donor.
UNAIDS estimates that US$18.1 billion was needed to address the epidemic in low- and middle- income countries in 2007:
Of this, an estimated US$10.0 billion was available from all sources (public and private), with bilateral international assistance accounting for almost 40% (US$3.7 billion in disbursements).
The U.S., U.K., and the Netherlands accounted for the largest shares of such assistance funding.
Still, there was a gap of US$8.1 billion between resources available from all sources and resources needed in 2007, as estimated by UNAIDS.
Assessing “fair share” in the context of international assistance is a challenging task and there is no single, agreed upon methodology for doing so. Two different methodologies used in this analysis indicate that, in 2007:
The U.S. provided one-fifth (20%) of the funding available for AIDS from all sources (donor governments, multilaterals, the private sector, and domestic sources), the largest share of any donor, but less than its share of the world’s economy as measured by gross domestic product or GDP(26% in 2007). The U.K., the Netherlands, Sweden, and Ireland each provided greater shares of all resources for AIDS than their shares of GDP.
When standardized by GDP per US$1 million, to account for differences in the sizes of government economies, the Netherlands provided the highest amount of resources for AIDS in 2007, followed by Sweden and Ireland. The U.K. was fourth and the U.S., fifth.
A Kaiser study published as a Health Affairs web-exclusive article finds the number of working-age adults who have major chronic conditions grew by 25 percent between 1997 and 2006 and those without health coverage in this group experienced substantial erosion in access to health care. The study also reveals that finds the cost of prescription drugs more of a problem today for all with chronic conditions, regardless of insurance coverage status.
In October 2007, the Foundation’s Kaiser Commission on Medicaid and the Uninsured and the National Academy for State Health Policy convened a day-long meeting of policy officials and oral health experts to discuss children’s access to dental care in Medicaid and the State Children’s Health Insurance Program (SCHIP) and exchange information and perspectives on the strategies have worked best to improve it. This report summarizes the 15 experts recommendations on a wide assortment of effective actions that states can take related to each of several key dimensions of children’s access to oral health care in Medicaid and SCHIP. In addition, the report includes discussion of larger, systemic barriers to access and care that must ultimately be tackled, and advice on how Medicaid and SCHIP might contribute.
More than 100 million Americans have no insurance to help cover dental needs. With health reform discussions ongoing, the Foundation’s Kaiser Commission on Medicaid and the Uninsured (KCMU) cosponsored a briefing which examined oral health in the broader conversation of improving quality and expanding access. Three new reports from KCMU were released at the event.
Two new surveys by NPR, the Kaiser Family Foundation and the Harvard School of Public Health examine the pocketbook problems facing people in Ohio and Florida — two presidential swing states — including their struggles with gas prices, getting and keeing a well-paying job and affording health care. The surveys, , also take an in-depth look at the impact of medical bills on family finances and health care, and provide insights into the way health care costs affect people’s daily life decisions. The polls were conducted jointly by NPR and public opinion researchers at Kaiser and Harvard.
The telephone surveys involved statewide representative samples of 1,358 adults in Florida and 1,201 adults in Ohio and were conducted between May 21 and June 4. The margin of sampling error is plus or minus 3 percentage points for the full sample in each survey. For subgroups, the margin of error may be higher.
These surveys are a part of a series of projects about health-related issues by NPR, the Henry J. Kaiser Family Foundation and the Harvard School of Public Health. Representatives of the three organizations worked together to develop the survey questionnaire and to analyze the results, with NPR maintaining editorial control over its broadcasts on the surveys.
These toplines provide an overview of the results from a May 21 and June 4, 2008, survey conducted jointly by NPR and public opinion researchers at the Kaiser Family Foundation and the Harvard School of Public Health that examines examine the pocketbook problems facing people in Ohio and Florida – two presidential swing states – including their struggles with gas prices, getting and keeping a good-paying job and affording health care.
The telephone surveys involved statewide representative samples of 1,358 adults in Florida and 1,201 adults in Ohio and were conducted between May 21 and June 4. The margin of sampling error is plus or minus 3 percentage points for the full sample in each survey. For subgroups, the margin of error may be higher.
These surveys are a part of a series of projects about health-related issues by NPR, the Henry J. Kaiser Family Foundation, and the Harvard School of Public Health. Representatives of the three organizations worked together to develop the survey questionnaire and to analyze the results, with NPR maintaining editorial control over its broadcasts on the surveys.