KFF designs, conducts and analyzes original public opinion and survey research on Americans’ attitudes, knowledge, and experiences with the health care system to help amplify the public’s voice in major national debates.
The Ryan White HIV/AIDS Program is a more than two-decade old federal effort that provides care and services to more than half a million people with and affected by HIV each year. With its current authorization set to expire in September, policymakers are weighing the program’s future at a time when scientific advances in antiretroviral treatment, the passage of the Affordable Care Act and the release of the country’s first comprehensive National HIV/AIDS Strategy have significantly altered the environment in which the program operates. The brief, Updating the Ryan White HIV/AIDS Program For A New Era: Key Issues & Questions for the Future, identifies key issues and questions facing the program and explores a range of potential changes for policymakers and others to consider. These fall into four broad, intersecting areas:
Supporting people with HIV at each stage of the treatment cascade, from diagnosis to viral suppression;
Building HIV care networks in underserved communities;
Integrating HIV care expertise into the mainstream health care system effectively and fairly allocating Ryan White resources.
Under the Affordable Care Act (ACA), states are afforded a number of new and expanded opportunities, including enhanced federal financing, to improve access to and delivery of Medicaid long-term services and supports (LTSS). This policy brief provides an overview of six key Medicaid LTSS options created or enhanced by the 2010 law and state adoption of these options to date. Nearly every state (47 states and DC) has taken steps forward with at least one of the six options.
With federal and state governments now pursuing efforts to better coordinate care and reduce costs for people dually eligible for both Medicare and Medicaid benefits, this brief examines how insurers now serving these markets view the opportunities and challenges.
The brief is based on interviews with senior executives at 13 large firms that contract with the Medicare and Medicaid programs and finds almost all of the insurers expect dually eligible beneficiaries will become more important to their business over time. The brief also looks at how insurers currently serve dually eligible beneficiaries, particularly through Special Needs Plans that are part of the Medicare Advantage program.
The report is authored by researchers at Mathematica Policy Research and the Kaiser Family Foundation.
This article examines the growing attention to global health diplomacy and its future outlook as donor nations continue to face tight budgetary conditions. Authored by Joshua Michaud and Jennifer Kates of the Kaiser Family Foundation, the article was published in the inaugural issue of the Global Health: Science and Practice journal in March 2013.
On March 23, 2010, the Affordable Care Act (ACA) was signed into law. Although the date for full implementation of most provisions of the law is January 1, 2014, the ACA has already led to progress toward expanded coverage of the uninsured; improved access and better care delivery models; broader access to community-based long-term care; and more integrated care and financing for beneficiaries who are dually eligible for Medicare and Medicaid.
The brief provides an overview of the ACA’s early impacts on private insurance and exchanges; Medicaid coverage; access to primary and preventive care; Medicare; and dually eligible beneficiaries.
Time Magazine’s recent cover story on health care – “Bitter Pill” by Steven Brill – has focused attention on hospital prices, especially for people paying out of their own pockets. This is not a new issue, but certainly one that deserves attention.
However, what has been lost in the ensuing commentary on high hospital prices is that Brill’s article is as much about inadequate insurance, which is the reason why the patients he writes about were paying the bulk of their own hospitals bills. One of them was uninsured, but the rest had private insurance. The problem was that the insurance plans these policyholders had ultimately covered very little of their care.
The main culprit seemed to be caps on the dollar amount of coverage, such as
• A non-group plan that covered only up to $2,000 per day in a hospital.• An employer-sponsored plan through Cigna’s Starbridge subsidiary that capped coverage for any hospital stay at $2,500 total.• A union plan that limited annual benefits to $60,000.• A student policy that capped benefits at $50,000.
In some cases, these insurance plans with very limited coverage are referred to as “mini-med” plans. As we’ve written before, these are often provided to lower-wage hourly employees in restaurant chains and retail establishments, or they may be purchased as individual coverage.
Starting in 2014, the Affordable Care Act (ACA) generally prohibits annual dollar limits on the benefits any insurance plan provides. This requirement has been phased in, with plans currently prohibited from having an annual cap of less than $1.25 million this year.
However, a number of plans have received temporary waivers from this requirement in order to avoid disrupting coverage until the major elements of the ACA go into effect in 2014. In total about 3.9 million people are covered by plans that have received these waivers and therefore still may have limited coverage.
How limited is that coverage? To find out, we requested the waiver applications from the Department of Health and Human Services, but did not receive sufficient detail to assess the kinds of limits these insurance policies now have. As an alternative, we analyzed the financial information insurers file with state insurance departments, as compiled by Mark Farrah Associates. Among the insured mini-med plans purchased by small and large employers, the average amount of benefits paid out per enrollee was $747 in 2011. That was less than one-quarter of the average benefits paid out under more typical, comprehensive employer-sponsored insurance plans.
Much has been written lately about concerns over whether premiums will increase significantly for some people next year as the ACA prohibits discrimination against people with pre-existing conditions, limits age rating, and sets minimum coverage requirements (our analysis of that issue is here). There is no doubt that premiums will go up for the people with limited coverage that Brill writes about in his article. But the article also provides tangible evidence of the enhanced coverage and protections that people will get in exchange for those higher premiums.
Three years after the passage of the Patient Protection and Affordable Care Act (the ACA), but still many months away from the implementation of most of its major provisions, the latest Kaiser Health Tracking Poll finds that a majority of Americans are unsure how the law will impact them, and few are paying attention to the details of state-level decisions about implementation. Though opinion on the law overall remains nearly evenly divided, opponents’ attacks seem to have taken a toll on the public’s expectations, and Americans are now more likely to think the law will make things worse rather than better for their own families. While most of the law’s individual provisions remain popular, many of the most well-liked elements are the least well-known among the public. Public knowledge of the ACA’s provisions has not increased since 2010, and awareness of some key provisions has declined somewhat since the law’s passage when media attention was at its height. On another health policy topic that has been in the news, while national data shows that health care cost growth has slowed down in recent years, a majority of the public perceives that the country’s health costs have been going up faster than usual.
Public Not Paying Much Attention To State Decisions On Exchanges, Medicaid Expansion
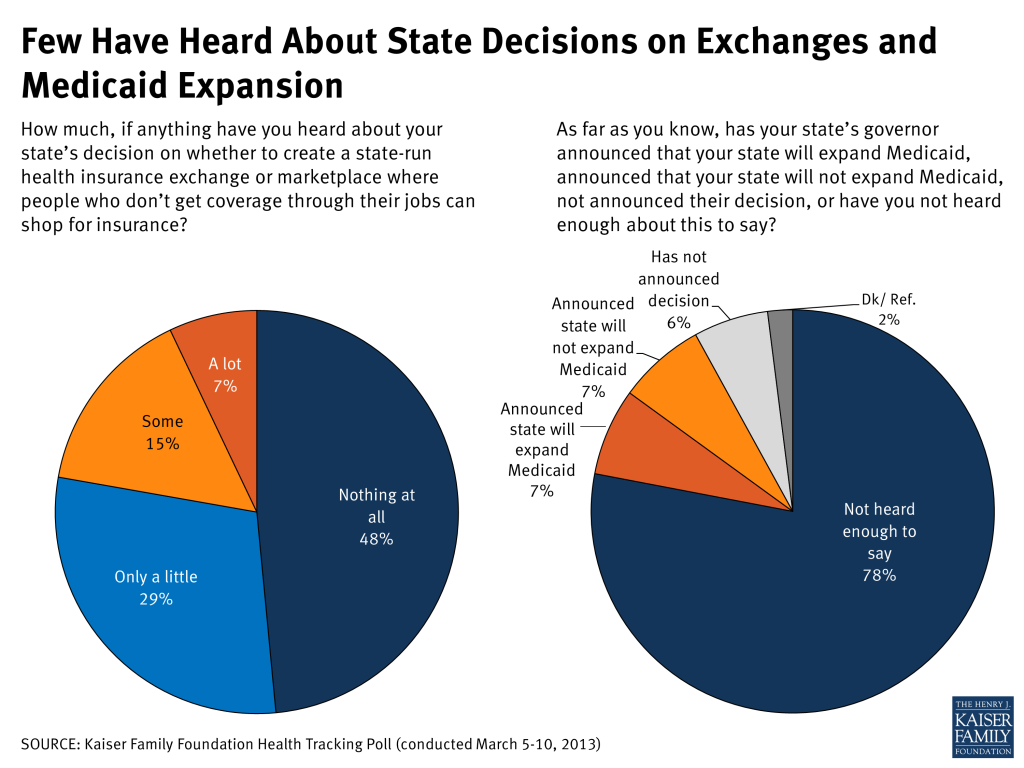
While state and federal policymakers are busy making decisions about the Medicaid expansion and working out the logistics of their health insurance exchanges before 2014, the public at large hasn’t been paying much attention to either of these topics. Asked how much they have heard about their own state’s decision on whether to create a state-run exchange, roughly half the public (48 percent) reports hearing “nothing at all,” while just over one in five have heard “a lot” (7 percent) or “some” (15 percent). Further, when asked what they know about their governor’s decision on whether to expand Medicaid in their state, the vast majority (78 percent) say they haven’t heard enough to say whether the governor has announced a decision or what that decision is. This is equally true in states where the governor has stated that they will expand Medicaid (80 percent say they haven’t heard enough to say) and in those whose governor has said they will not move forward with the expansion (74 percent).
Figure 1
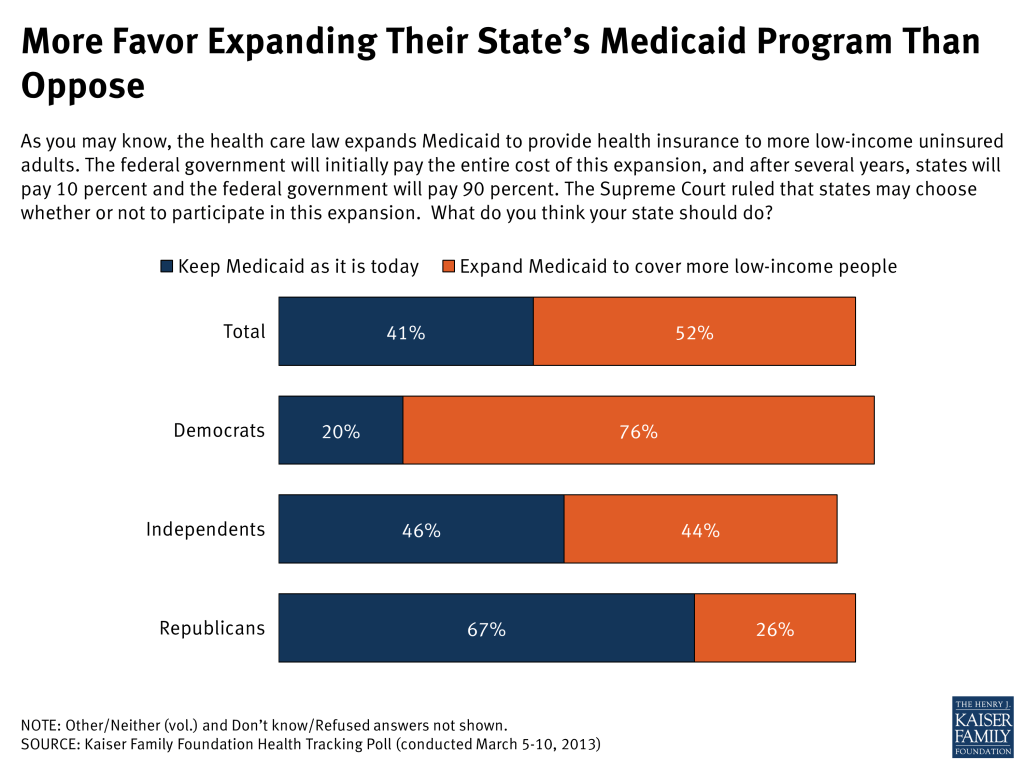
When asked whether they think their state should implement the Medicaid expansion, with the federal government picking up most of the cost, the survey finds that more Americans are in favor of expanding Medicaid in their state (52 percent) than oppose it (41 percent), shares that have remained similar since last July. A familiar partisan divide is evident, with two-thirds of Republicans wanting to keep their state’s Medicaid program as it is today, three-quarters of Democrats wanting to expand it, and independents nearly evenly divided.
Figure 2
Public: What Health Cost Growth Slowdown?
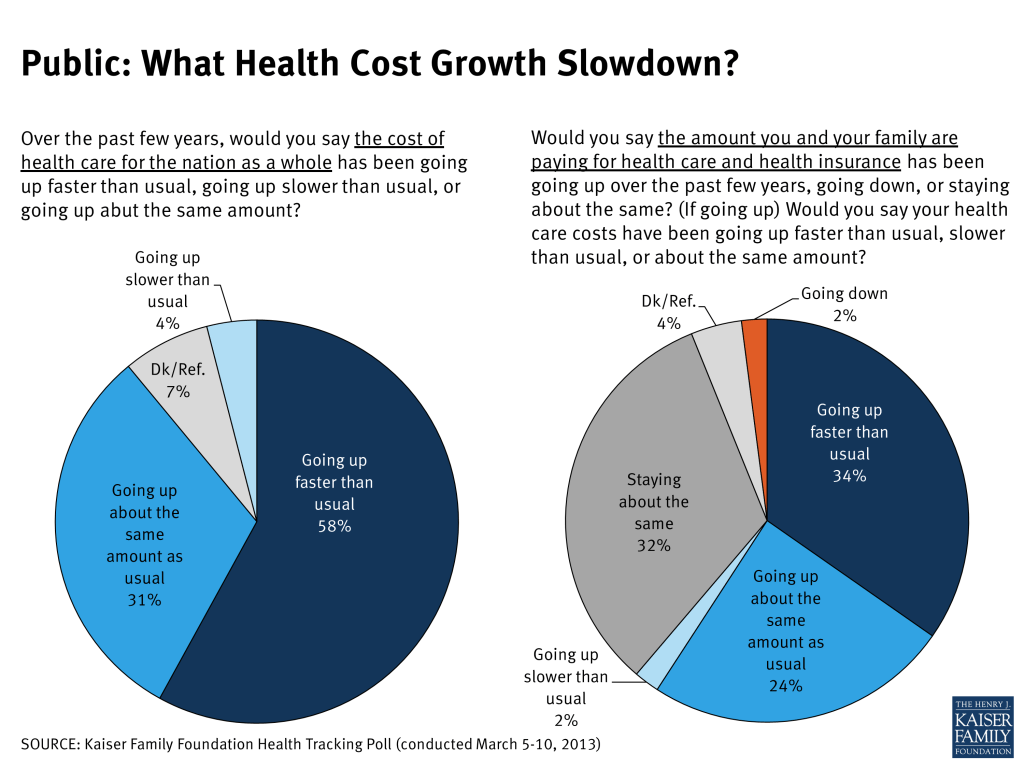
Analysis of national data has shown that, while health care cost growth continues to outpace inflation, the rate of growth in national health expenditures has slowed markedly in recent years.1 The public’s perception of the cost trajectory is quite different, however. Nearly six in ten adults (58 percent) say that over the past few years, the cost of health care for the nation as a whole has been going up faster than usual, while just 4 percent say it has been going up slower than usual and three in ten (31 percent) think it’s been going up by about the same amount.
Figure 3
When it comes to their own experiences with rising costs, about a third of Americans (34 percent) report that their own family’s health care costs have been going up faster than usual, while roughly a quarter say they’ve been going up about the same amount as usual (24 percent), and 32 percent say their costs have held steady in recent years. Only small shares say their costs have been going up more slowly than usual (2 percent) or that their costs have actually come down (2 percent).
Public Opinion On The ACA Remains Divided At Third Anniversary
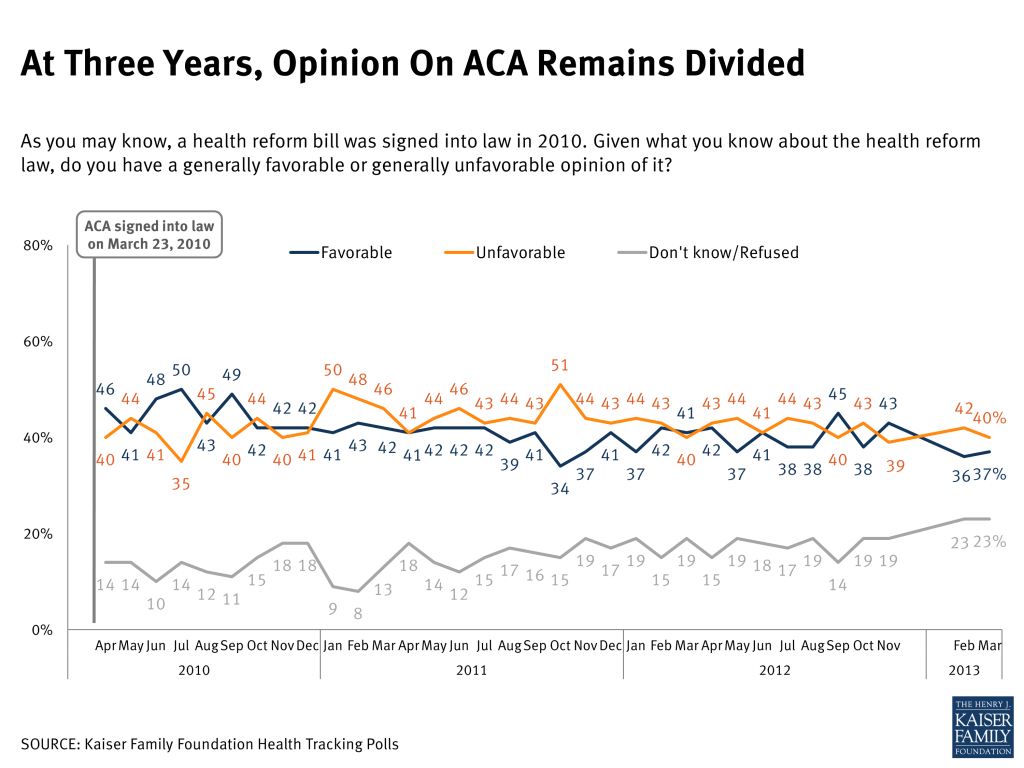
Since the ACA was signed into law in March 2010, overall opinion of the law has stayed within a relatively narrow band, with roughly equal proportions saying they feel favorable and unfavorable towards it. This division of opinion continues on the 3rd anniversary of the ACA, with 37 percent holding a favorable view and 40 percent unfavorable. The share of the public who declined to offer an opinion on the law remains high this month, at 23 percent.
Figure 4
Asked about the reasons behind their views, the most common response among those who view the law favorably has to do with expanded access to health care and insurance (58 percent), while those who view the law unfavorably are most likely to cite cost considerations (30 percent), opposition to the individual mandate (15 percent), and concerns about government involvement in health care (13 percent).
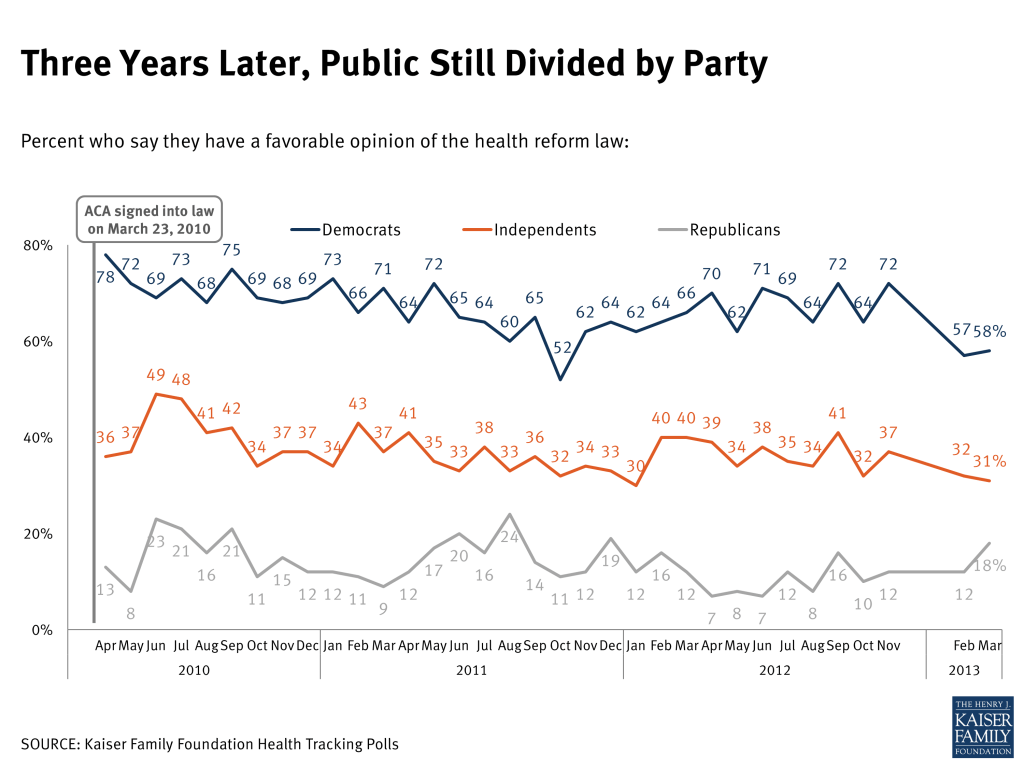
Last month’s drop in the share of Democrats viewing the law favorably leveled off this month, and views by party continue to be as divided as ever, with most Republicans (68 percent) viewing the law unfavorably, a majority of Democrats (58 percent) viewing it favorably, and independents more negative than positive (31 percent favorable, 45 percent unfavorable). The intensity of opinion on the law still lies with the GOP, another aspect of opinion that has been true throughout the last three years of Kaiser polling on the ACA. About half of Republicans (53 percent) say they have a very unfavorableview, compared to three in ten Democrats (31 percent) who say they have a very favorableview.
Figure 5
Most Report No Personal Experience With Law Yet
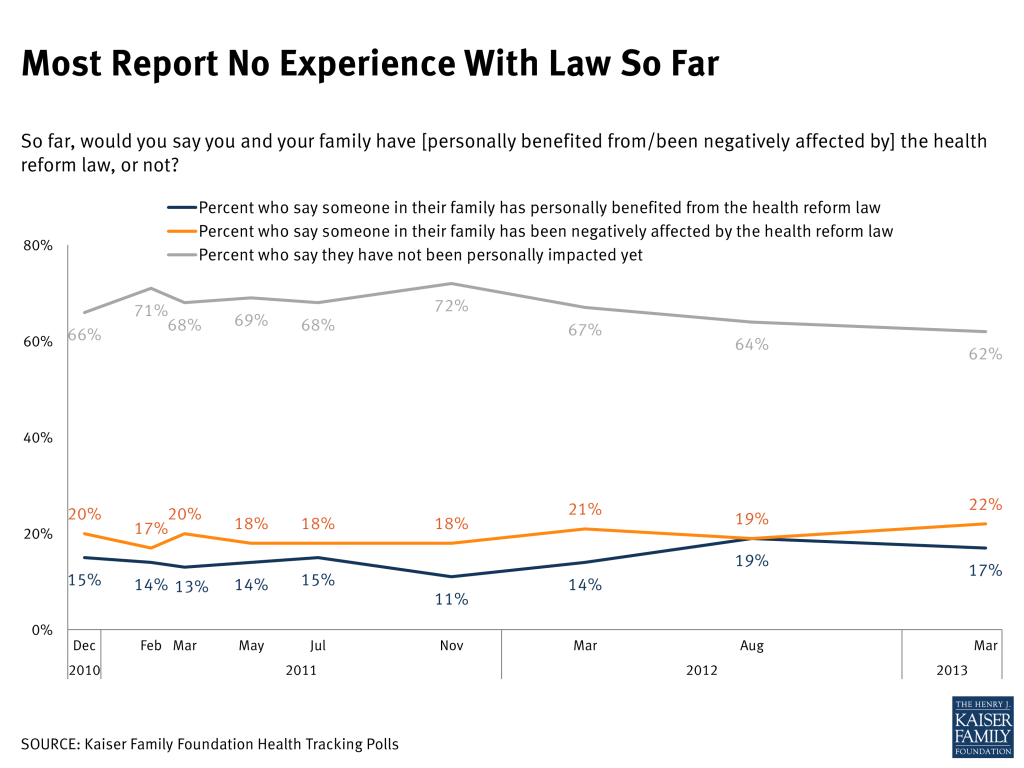
Thus far, most Americans report having no direct experience, either positive or negative, with the ACA. A little over two in ten say someone in their family has been negatively affected by the law (22 percent), with the most commonly cited reason being increased costs, followed by cuts to benefits. A slightly smaller share feel they’ve personally benefited (17 percent), either through expanded benefits and access to care, lower health care costs, or the provision that allows parents to keep their children under the age of 26 on their insurance plan. Still, the majority of the public – 62 percent – reports that they have not felt any impact either way, a number that has stayed relatively steady since December 2010.
Figure 6
FIGURE 7: IN THEIR OWN WORDS
Among the 17% who say their family has personally benefited from the health reform law: In what ways would you say you have benefited from the health reform law?
Among the 22% who say their family has been negatively affected by the health reform law: In what ways would you say you have been negatively affected by the health reform law?
“My birth control is now free”
“Don’t care for the government intrusion”
“We’ve been able to continue coverage for our child that has graduated from college and we don’t have to pay co-pays for well visits”
“My doctor will no longer take Medicare patients like he did before. Now he limits the time he will see Medicare patients and they don’t pay as well as they did before”
“Great difference, I don’t have to pay as much as I did”
“I received a bill for blood work which I have never received before”
“There is a provision where people with Medicare get a wellness annual checkup and I think that’s a good idea. And I have had mine and it was very helpful”
“My mother is a small business owner and she cannot afford to pay for health care for the employees even though the employees already have health care”
“Just ease of mind”
“It’s costing me more money for less coverage”
“Because I didn’t have insurance and now I do”
“Taking the money out of Medicare to help ObamaCare”
“Makes businesses give insurance to employees”
“Some of my family members’ hours have been cut so the businesses don’t have to participate”
“Yearly increase has been lower than in the past 10 years”
“When my husband gets his checks it keeps taking out more”
“Removal of some caps of number of visits a year, specifically for mental health”
“The taxpayers will have to pay whether they are covered or not, we are covered we should not pay”
“I would have been denied insurance for a pre-existing condition and now I’m not”
“Because we don’t have all the details yet”
Parts More Popular Than The Whole
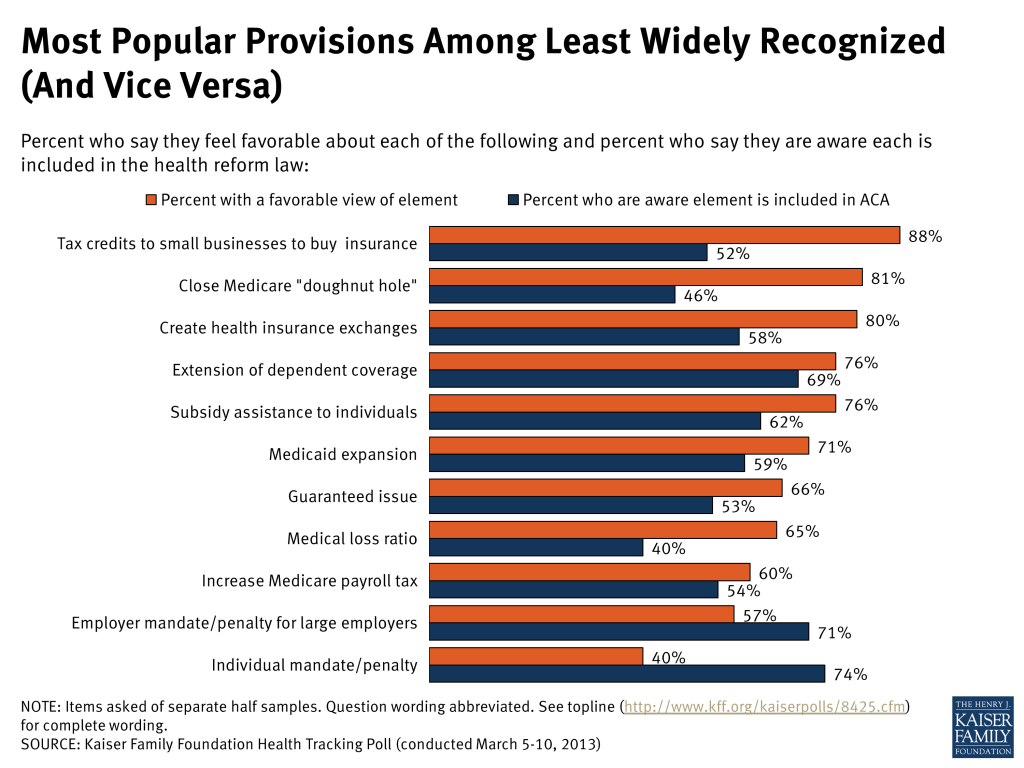
While the public is divided on the law as a complete package, many of its component parts are quite popular, some on a bipartisan basis. Majorities of the public are favorable towards the law’s tax credits for small businesses who offer their employees insurance (88 percent, including 53 percent very favorable), closing the Medicare “doughnut hole” (81 percent, 52 percent very favorable), and the provision allowing young adults to stay on their parents’ health plans up to age 26 (76 percent, 54 percent very favorable). Three of the hallmark features of the law – the health insurance exchanges, subsidies to help individuals purchase insurance, and the Medicaid expansion – are also popular, with between seven and eight in ten Americans favoring each (80 percent, 76 percent, and 71 percent, respectively). But consistent with previous polls, the individual mandate falls at the bottom of this list, with six in ten feeling unfavorable about this provision of the law.
Even some of the law’s most fervent opponents like many of the things the ACA has done or will do. A majority of Republicans feel favorable towards seven of the 11 provisions asked about in the March poll, with seven in ten or more favoring tax credits to small businesses, closing the Medicare “doughnut hole”, and the exchanges. Less popular among the GOP: the highly politicized Medicaid expansion (42 percent favorable), increased Medicare payroll tax for those with higher incomes (37 percent), the employer and individual mandates (36 percent and 21 percent, respectively).
FIGURE 8: MANY ELEMENTS OF ACA CONTINUE TO BE POPULAR ACROSS PARTIES
Percent who say they feel favorable about each of the following elements of the health reform law
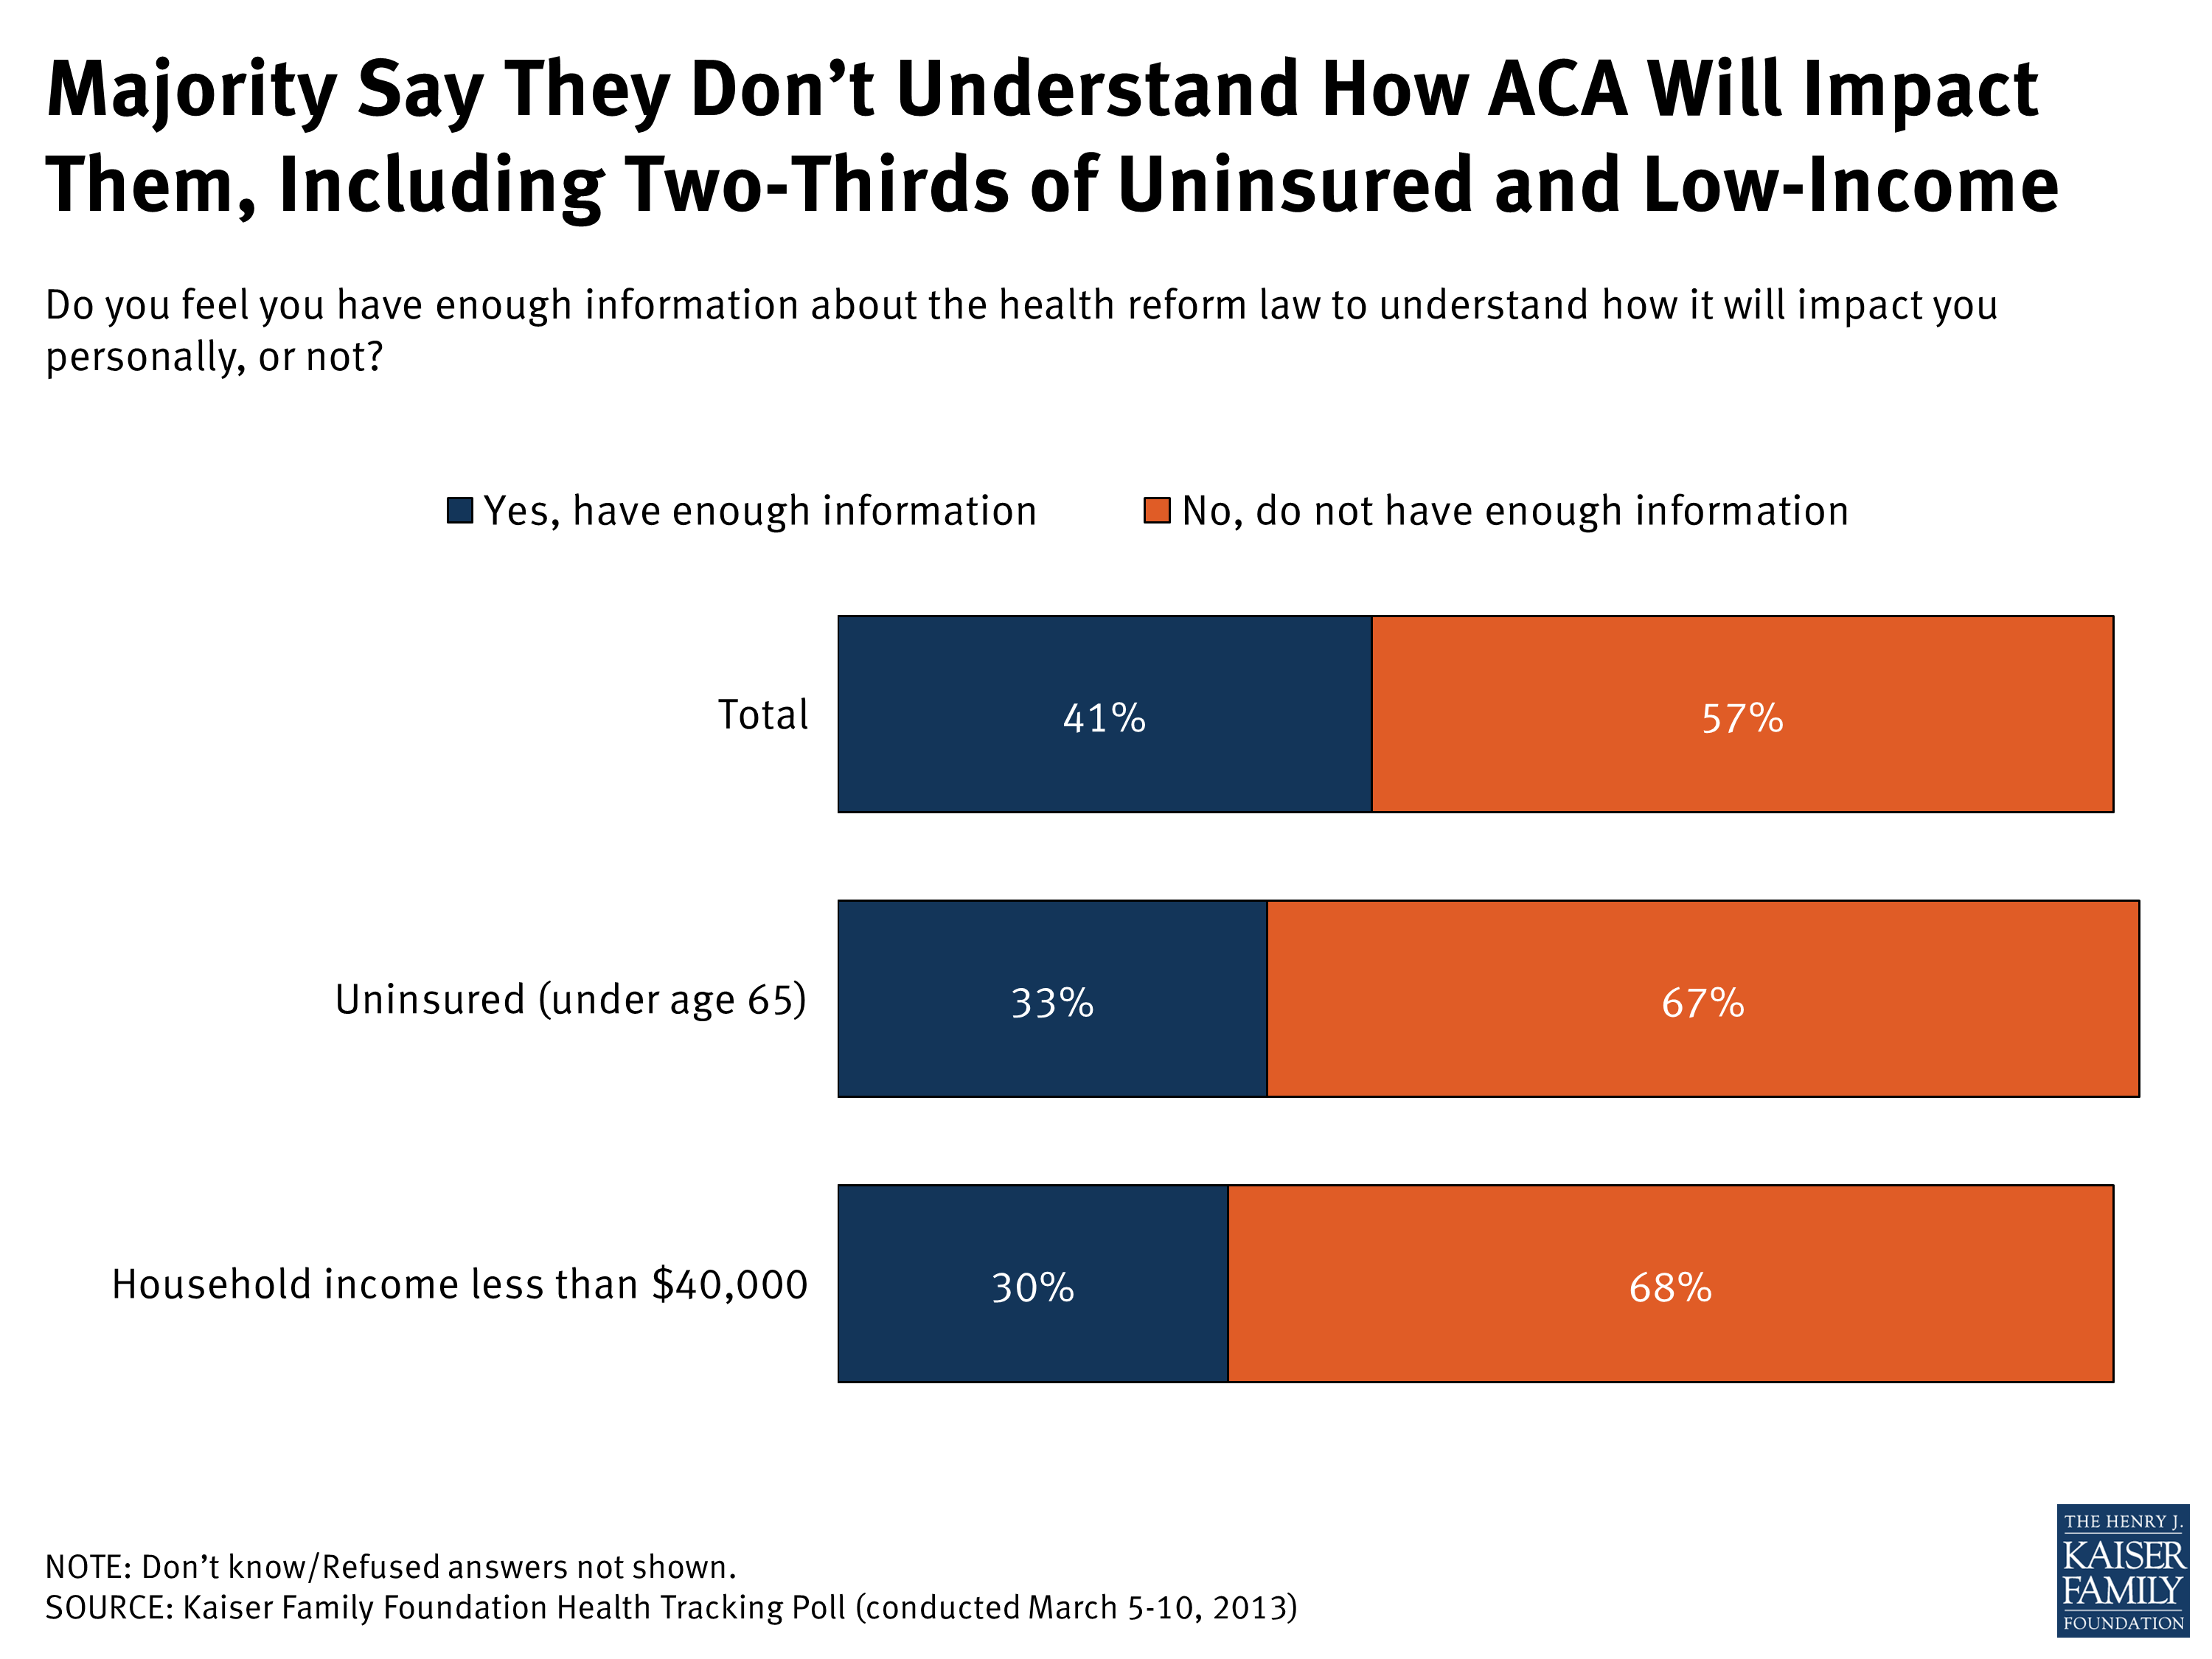
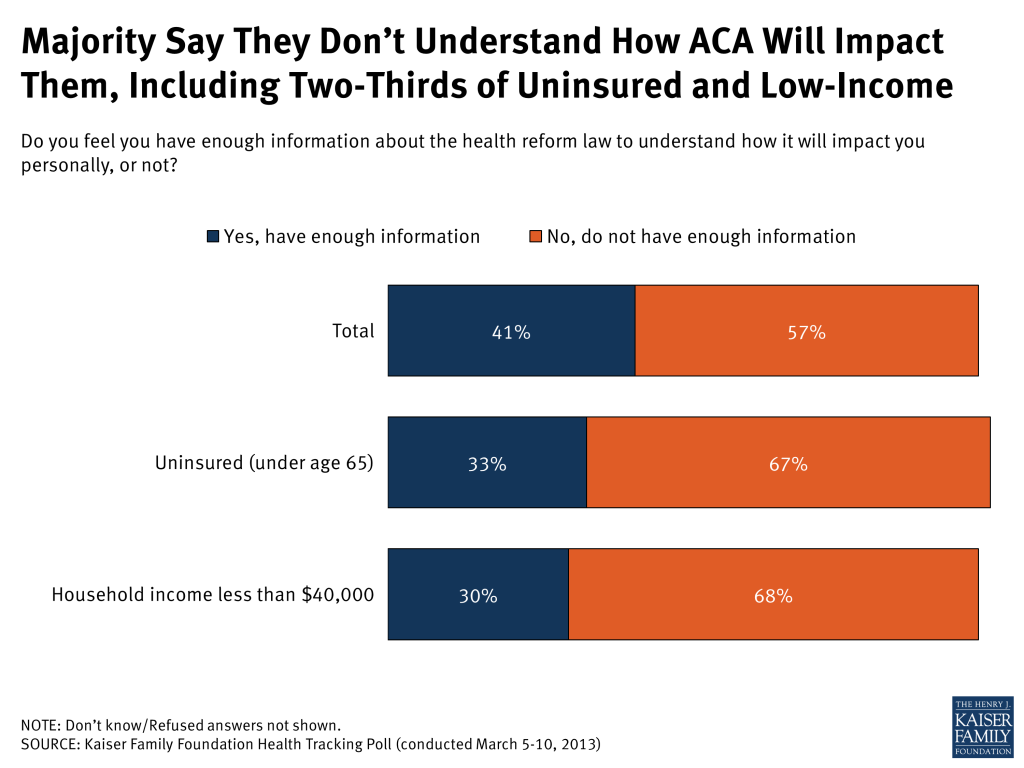
Three years after passage, a majority of Americans (57 percent) say they do not have enough information about the ACA to understand how it will affect them. Perhaps more importantly, this share rises to two-thirds among some of the key groups the law was designed to help: the uninsured (67 percent) and those with incomes below $40,000 (68 percent).
Figure 9
While a majority of the public has an accurate perception of how much of the law has been implemented (67 percent say that “some provisions” have been put into place thus far), many continue to have false impressions about which provisions are actually included in the law and which are not.
Among the public, the most widely recognized element is the unpopular individual mandate, which three-quarters (74 percent) of the public say is part of the law. The employer requirement, that companies with 50 or more full-time employees offer insurance or pay a fine, closely follows (71 percent). Large shares are also aware that the law allows adult children to stay on their parents’ insurance until age 26 (69 percent), provides subsidies to help low and moderate income Americans purchase insurance (62 percent), gives states the option of expanding their Medicaid program (59 percent), and creates insurance exchanges where people can shop for coverage (58 percent).
Among the items that are less familiar to the public: just about half recognize that the law increases the Medicare payroll tax for upper-income Americans (54 percent); prohibits insurance companies from denying coverage to people with pre-existing conditions (also known as “guaranteed issue,” 53 percent); and provides tax credits to small businesses who cover their workers (52 percent). Even less well-known are the law’s provisions to close the Medicare prescription drug coverage gap, or “doughnut hole” (46 percent) and the medical loss ratio provision that requires insurance companies to give rebates to customers if they spend too little on health care services and too much on administrative costs and profits (40 percent).
FIGURE 10: AWARENESS OF PROVISIONS INCLUDED IN THE HEALTH CARE LAW (TRUE STATEMENTS)
To the best of your knowledge, would you say the health reform law does or does not do each of the following?
At the same time, many Americans hold misimpressions about the law’s contents. Just under six in ten (57 percent) mistakenly think the law creates a government-run health plan (the so-called “public option”). And close to half (47 percent) say the law allows undocumented immigrants to receive financial help from the government to buy health insurance, when in fact they are not eligible for subsidies. Many (40 percent, including 35 percent of seniors) continue to hold on to the myth that the law allows a government panel to make decisions about end-of-life care for people on Medicare (the so-called “death panels”) and another two in ten aren’t sure (21 percent).
FIGURE 11: MISPERCEPTIONS ABOUT PROVISIONS NOT INCLUDED IN THE LAW (FALSE STATEMENTS)
To the best of your knowledge, would you say the health reform law does or does not do each of the following?
CORRECT
INCORRECT
No, law does not do this
Yes, law does this
Don’t Know/ Refused
Cut benefits for people in Medicare
43%
44%
14%
Establish a government panel to make decisions about end-of-life care for people on Medicare
39
40
21
Allow undocumented immigrants to receive subsidies to purchase insurance
As previous Kaiser polls have shown, some of the most popular provisions of the law are among the least widely recognized, and vice versa. For example, three-quarters of Americans recognize that the individual mandate is part of the law, but only four in ten have a favorable view. Larger shares report having positive views of less well-known provisions. For example, 88 percent of Americans favor providing tax credits to small businesses that offer health insurance, while just about half (52 percent) are aware the law includes such a provision.
Figure 12
Public knowledge about these provisions has not increased since 2010, and awareness of some of the most popular provisions has actually decreased. For example, compared with April 2010, the shares who recognize that the law includes tax credits to small businesses to buy insurance, subsidy assistance for individuals, and guaranteed issue of health insurance are down 14, 13, and 11 percentage points, respectively.
FIGURE 13: DECLINES IN AWARENESS OF SOME KEY PROVISIONS
Percent who say the health reform law does each of the following:
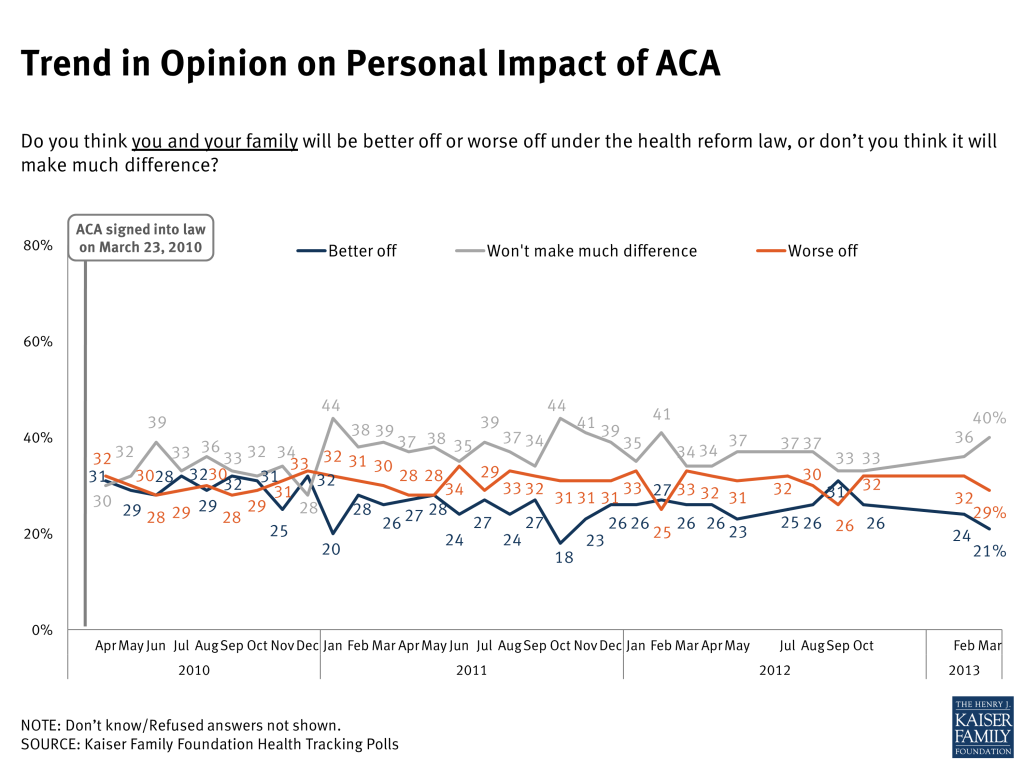
Three years after the ACA passed, and months away from the implementation of most of its major provisions, a plurality of Americans (40 percent) say they don’t expect the law to make much difference for their families overall. Those who do expect to see an impact are more likely to say it will leave them worse off (29 percent) rather than better (21 percent). Like favorability, expectations of the law’s personal impact have also bounced around within a narrow band, but in most months since 2011, those saying they expect to be worse off have outnumbered those expecting to be better off, with the largest share saying they expect to see little difference in their own lives.
Figure 14
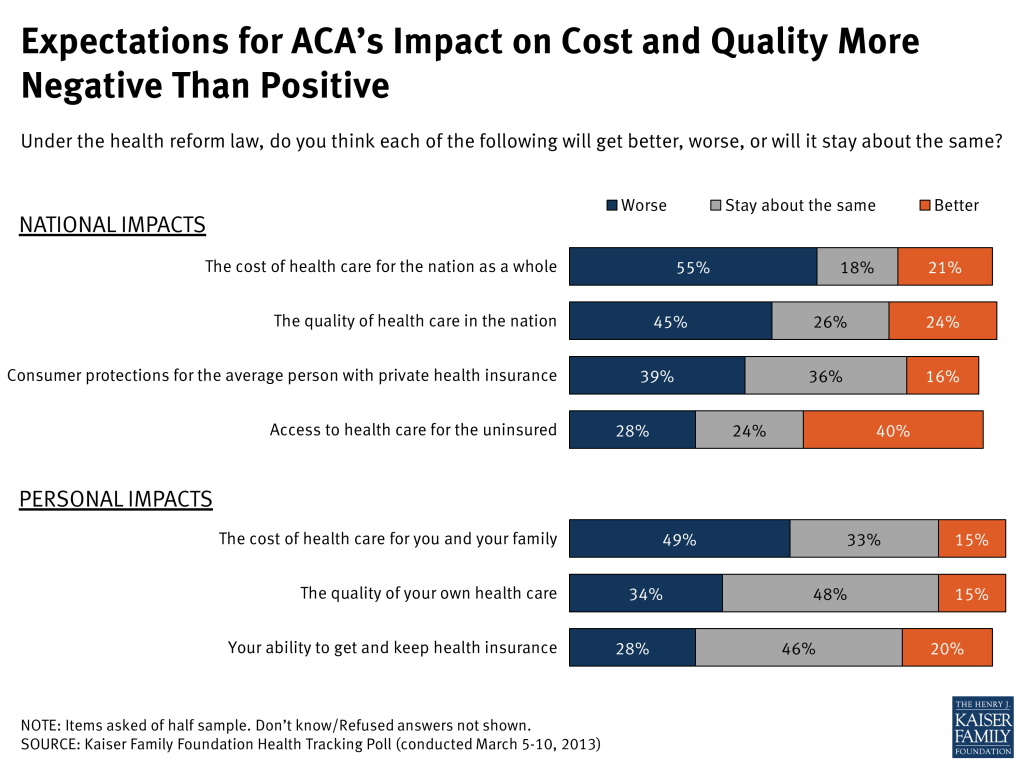
Drilling down further into the specifics, the latest poll finds Americans’ expectations about the law’s impacts on health care costs, quality, and consumer protections are also more negative than positive. The biggest area of concern is costs; more than half (55 percent) say the cost of health care for the nation as a whole will get worse under the law, and nearly as many (49 percent) say the same about their own personal health care costs. Americans are also much more likely to say things will get worse rather than better in terms of quality of care in the nation (45 percent vs. 24 percent) and consumer protections for the average person with health insurance (39 percent vs. 16 percent). When it comes to the quality of their own care and their ability to get and keep insurance, nearly half don’t expect to see much change, but larger shares expect things to get worse rather than better.
The one area asked about in the survey where the public’s expectations are more positive is access to health care for the uninsured: 40 percent expect it to get better under the law, while 28 percent expect it to get worse.
Figure 15
Not surprisingly, expectations about the law’s impacts in each of these areas are also divided sharply by party, with Republicans far more likely than Democrats to think things will get worse, both for themselves and for the nation. For example, while 73 percent of Republicans say the quality of care in the nation will worsen, four in ten Democrats (39 percent) expect it to get better under the law. Similarly, more than half (53 percent) of Democrats expect the uninsured will have better access to care, while Republicans are divided as to whether access will get better (31 percent) or worse (33 percent).
It’s worth noting, however, that even Democrats, who favor the law for the most part, are divided as to whether the law will make things better or worse in terms of national health care costs (37 percent better vs. 34 percent worse), consumer protections (27 percent vs. 24 percent), and their own families’ health care costs (23 percent vs. 26 percent), with substantial shares saying it won’t make much difference.
FIGURE 16: PARTISAN DIFFERENCES IN PERCEPTIONS OF LAW’S IMPACTS
Under the health reform law, do you think each of the following will get better, worse, or stay about the same?
Total
Dem
Ind
Rep
NATIONAL IMPACTS
The cost of health care for the nation as a whole
Better
21%
37%
16%
6%
Worse
55
34
57
83
Stay about the same
18
26
21
8
The quality of health care in the nation
Better
24
39
18
5
Worse
45
25
55
73
Stay about the same
26
34
22
17
Consumer protections for the average person with private health insurance
Better
16
27
13
8
Worse
39
24
33
69
Stay about the same
36
40
44
14
Access to health care for the uninsured
Better
40
53
36
31
Worse
28
21
28
33
Stay about the same
24
21
30
22
PERSONAL IMPACTS
The cost of health care for you and your family
Better
15
23
10
10
Worse
49
26
59
72
Stay about the same
33
46
28
18
The quality of your own health care
Better
15
25
11
6
Worse
34
16
39
54
Stay about the same
48
55
48
35
Your ability to get and keep health insurance
Better
20
34
14
9
Worse
28
17
31
42
Stay about the same
46
43
52
42
Expectations Of Changes Related To Individual Mandate
In another measure of people’s expectations about the law, the survey finds that just under three in ten Americans (28 percent) say they expect to make some sort of change to their current health insurance arrangements as a result of the ACA’s individual mandate. Of those who say they will have to make different health care arrangements, most expect those changes to come in the form of needing to get new coverage or paying more for their current coverage. Not surprisingly, the group that is most likely to say they expect to change their arrangements are those who are currently uninsured (62 percent, versus 22 percent of the insured).
Overall, people are more likely to say these changes will leave them worse off (19 percent) than better (7 percent). However, the uninsured are somewhat more evenly divided on the impact of these new health care arrangements – 23 percent say the changes will leave them better off, compared to 34 percent who say the changes will leave them worse off.
FIGURE 17: EXPECTATIONS OF IMPACTS RELATED TO INDIVIDUAL MANDATE
When the requirement that nearly all Americans have health insurance goes into effect in 2014, do you think you will have to change your current health insurance arrangements, or not? Do you think that change will leave you better off or worse off?
Total
Insured (under age 65)
Uninsured (under age 65)
Yes, will have to change health insurance arrangements
28%
22%
62%
Better off
7
4
23
Worse off
19
16
34
Won’t make much difference either way (VOL.)
1
1
1
Don’t know/ Refused
1
1
3
No, will not have to change
66
73
32
Don’t know/ Refused
6
5
6
This Kaiser Health Tracking Poll was designed and analyzed by public opinion researchers at the Kaiser Family Foundation led by Mollyann Brodie, Ph.D., including Liz Hamel, Claudia Deane, Sarah Cho, and Bianca DiJulio. The survey was conducted March 5-10, 2013, among a nationally representative random digit dial telephone sample of 1,204 adults ages 18 and older, living in the United States, including Alaska and Hawaii (note: persons without a telephone could not be included in the random selection process). Computer-assisted telephone interviews conducted by landline (602) and cell phone (602, including 315 who had no landline telephone) were carried out in English and Spanish by Princeton Data Source under the direction of Princeton Survey Research Associates International (PSRAI). Both the landline and cell phone samples were provided by Survey Sampling International, LLC. For the landline sample, respondents were selected by asking for the youngest adult male or female currently at home based on a random rotation. If no one of that gender was available, interviewers asked to speak with the youngest adult of the opposite gender. For the cell phone sample, interviews were conducted with the person who answered the phone.
The combined landline and cell phone sample was weighted to balance the sample demographics to match estimates for the national population data from the Census Bureau’s 2011 American Community Survey (ACS) on sex, age, education, race, Hispanic origin, nativity (for Hispanics only), and region along with data from the 2010 Census on population density. The sample was also weighted to match current patterns of telephone use using data from the January-June 2012 National Health Interview Survey. The weight takes into account the fact that respondents with both a landline and cell phone have a higher probability of selection in the combined sample and also adjusts for the household size for the landline sample. All statistical tests of significance account for the effect of weighting. Weighted and unweighted values for key demographic variables are shown in the table below.
Sample Demographics
Unweighted
Weighted
Gender
Male
46.5%
48.4%
Female
53.5%
51.6%
Age
18-24
8.4%
13.2%
25-34
12.0%
16.5%
35-44
13.9%
17.1%
45-54
19.9%
18.6%
55-64
20.8%
16.9%
65+
25.0%
17.9%
Education
HS Graduate or Less
30.1%
41.0%
Some College/Assoc. Degree
26.6%
31.2%
College Grad.
43.4%
27.8%
Race/Ethnicity
White/not Hispanic
72.6%
67.3%
Black/not Hispanic
11.5%
11.7%
Hisp – US born
5.1%
6.9%
Hisp – born outside
5.4%
7.2%
Other/not Hispanic
5.4%
6.8%
Party Identification
Democrat
34.4%
33.2%
Independent
30.7%
31.0%
Republican
23.3%
22.3%
Other
7.6%
8.8%
The margin of sampling error including the design effect for the full sample is plus or minus 3 percentage points. For results based on subgroups, the margin of sampling error may be higher. Sample sizes and margin of sampling errors for other subgroups are available by request. Note that sampling error is only one of many potential sources of error in this or any other public opinion poll.
The response rate calculated based on the American Association of Public Opinion Research’s Response Rate 3 formula was 11 percent for the landline sample and 13 percent for the cell phone sample.
Endnotes
M Hartman, AB Martin, J Benson, A Catlin, and the National Health Expenditure Accounts Team, u201cNational Health Spending in 2011: Overall Growth Remains Low, But Some Payers and Services Show Signs of Acceleration,u201d Health Affairs, January 2013, 32:87-99. ↩︎