KFF designs, conducts and analyzes original public opinion and survey research on Americans’ attitudes, knowledge, and experiences with the health care system to help amplify the public’s voice in major national debates.
A new Kaiser Family Foundation analysis estimates that Americans who currently buy their own insurance through the individual market would receive tax credits averaging nearly $2,700 next year for coverage purchased through new insurance marketplaces. The tax credits or subsidies would cover 32 percent of the premiums on average for this group of enrollees in a so-called “silver” plan.
The new analysis by Foundation researchers comes as some states are releasing information on what premiums will be in 2014 when the Affordable Care Act’s market reforms and newly created health insurance marketplaces take effect. These rate announcements illustrate “sticker prices” that do not reflect federal subsidies that will offset the cost of insurance for many current individual market policy holders.
“Tax subsidies are an essential part of the equation for many people who buy insurance through the new marketplaces next year,” Foundation President and CEO Drew Altman said. “They will help make coverage more affordable for low- and middle-income people.”
Tax credits will be available to subsidize premiums for people who buy their insurance in the new marketplaces, do not have access to other affordable coverage, and have incomes between 100% and 400% of the federal poverty level (between about $11,500 and $46,000 for a single person, and $24,000 and $94,000 for family of four).
An estimated 48% of people who currently have individual market coverage will be eligible for tax credits, the analysis finds. Tax credits among those eligible will average $5,548 per family, and subsidies will average $2,672 across all families now purchasing their own insurance. Many people who are now uninsured will also be eligible for subsidies in the new marketplaces, and their tax credits will likely be higher on average since they have lower incomes than those who now buy their own coverage.
There are many reasons why premium costs in the individual insurance market will change under the ACA before tax credits are applied. For instance, insurance companies will be prohibited from discriminating against people with pre-existing conditions, leading to higher enrollment of people with expensive health conditions. More young, healthy people may also enroll due to the ACA’s individual mandate and premium subsidies. Furthermore, insurance providers will be required to meet a minimum level of coverage that will raise premiums for people buying skimpier coverage today, but also lower their out-of-pocket costs on average when they use those services. Premiums before and after the law goes into effect are not necessarily comparable, as health plans in the new marketplaces will be required to cover a broader range of services than are found in many current individual market policies and the health needs of people who will enroll are likely to be different. The Foundation also has developed a health reform subsidy calculator that estimates the premiums and tax credits available to people next year through the insurance marketplaces, based on their income levels, family size, ages and tobacco use.
Methodology
Based on data from the Congressional Budget Office (CBO) and the federal government’s Survey of Income and Program Participation, the analysis estimates the average impact of the ACA on the individual market by quantifying how current enrollees will fare once relevant provisions of the health law are implemented. Premium data released by states to date suggest that the CBO premium projection is reliable. While subsidies and premiums will vary widely depending on each enrollee’s personal characteristics, the analysis focuses on averages to provide an indication of how much overall assistance the law will provide to people buying their own coverage today.
Medicaid, the nation’s main public health insurance program for low-income people, now covers over 65 million Americans – more than 1 in every 5 – at least some time during the year. The program’s beneficiaries include many of the most disadvantaged individuals and families in the U.S. in terms of poverty, poor health, and disability. The Affordable Care Act (ACA) provided for a broad expansion of Medicaid to cover millions of low-income uninsured adults whom the program has historically excluded. However, as a result of the Supreme Court’s decision on the ACA, the Medicaid expansion is, in effect, a state option. Almost half the states are moving forward with the Medicaid expansion. But the others, which are home to half the uninsured adults who could gain Medicaid coverage under the ACA, have decided not to expand Medicaid at this time or are still debating the issue.
Controversy about the Medicaid expansion has been stoked by an assertion that first appeared in a Wall Street Journal editorial a couple of years ago and has since resurfaced periodically, that “Medicaid is worse than no coverage at all.”123456 This claim about Medicaid is sharply at odds with the authoritative findings of the Institute of Medicine (IOM) Committee on Consequences of Uninsurance, detailed in Care Without Coverage: Too Little, Too Late, the second of six reports the IOM issued on the subject in the early 2000’s.7 Based on a comprehensive review of the research examining the impact of health insurance on adults, the IOM charted the causal pathway from coverage to better health outcomes, concluding:
Health insurance coverage is associated with better health outcomes for adults. It is also associated with having a regular source of care and with greater and more appropriate use of health services. These factors, in turn, improve the likelihood of disease screening and early detection, the management of chronic illness, and effective treatment of acute conditions such as traumatic brain injury and heart attacks. The ultimate result is improved health outcomes.
In light of Medicaid’s large and growing coverage role, and the significant health care needs of its beneficiaries, an evidence-based assessment of the program’s impact on access to care, health outcomes, and quality of care is of major interest. Such an assessment would also be helpful given perennial concerns about insufficient physician participation in Medicaid, generally attributed to low fees paid by state Medicaid programs. Since Medicaid was established nearly 45 years ago, a large body of research on and analysis of the program has accumulated. After first reviewing the purpose of health insurance and the distinctive profile of the Medicaid population – both considerations that lend important context to the research findings – this brief takes a look at what the literature shows overall regarding the difference Medicaid makes.
Issue Brief
What is the purpose of health insurance?
The IOM articulated the purpose of health insurance in the first of its six reports: “For individuals and families, health insurance enhances access to health services and offers financial protection against high expenses that are relatively unlikely to be incurred as well as those that are more modest but are still not affordable to some.”8 Three points of elaboration help to explain the mechanisms of health insurance, and to highlight both its potential and its limits. First, health coverage helps to connect people with care, in many cases by linking them with a network of providers who participate in their health insurance plan. This is how managed care and preferred provider organizations work. Second, health insurance lowers financial barriers to access. It does this by reducing out-of-pocket costs for medical care, which disproportionately burden low-income people and people with extensive health care needs. Common measures of financial access to care (or lack thereof) include both delayed or forgone care or unmet needs due to cost, and medical cost burden, such as out-of-pocket expenses exceeding some threshold and rates of medical debt and medical bankruptcy.
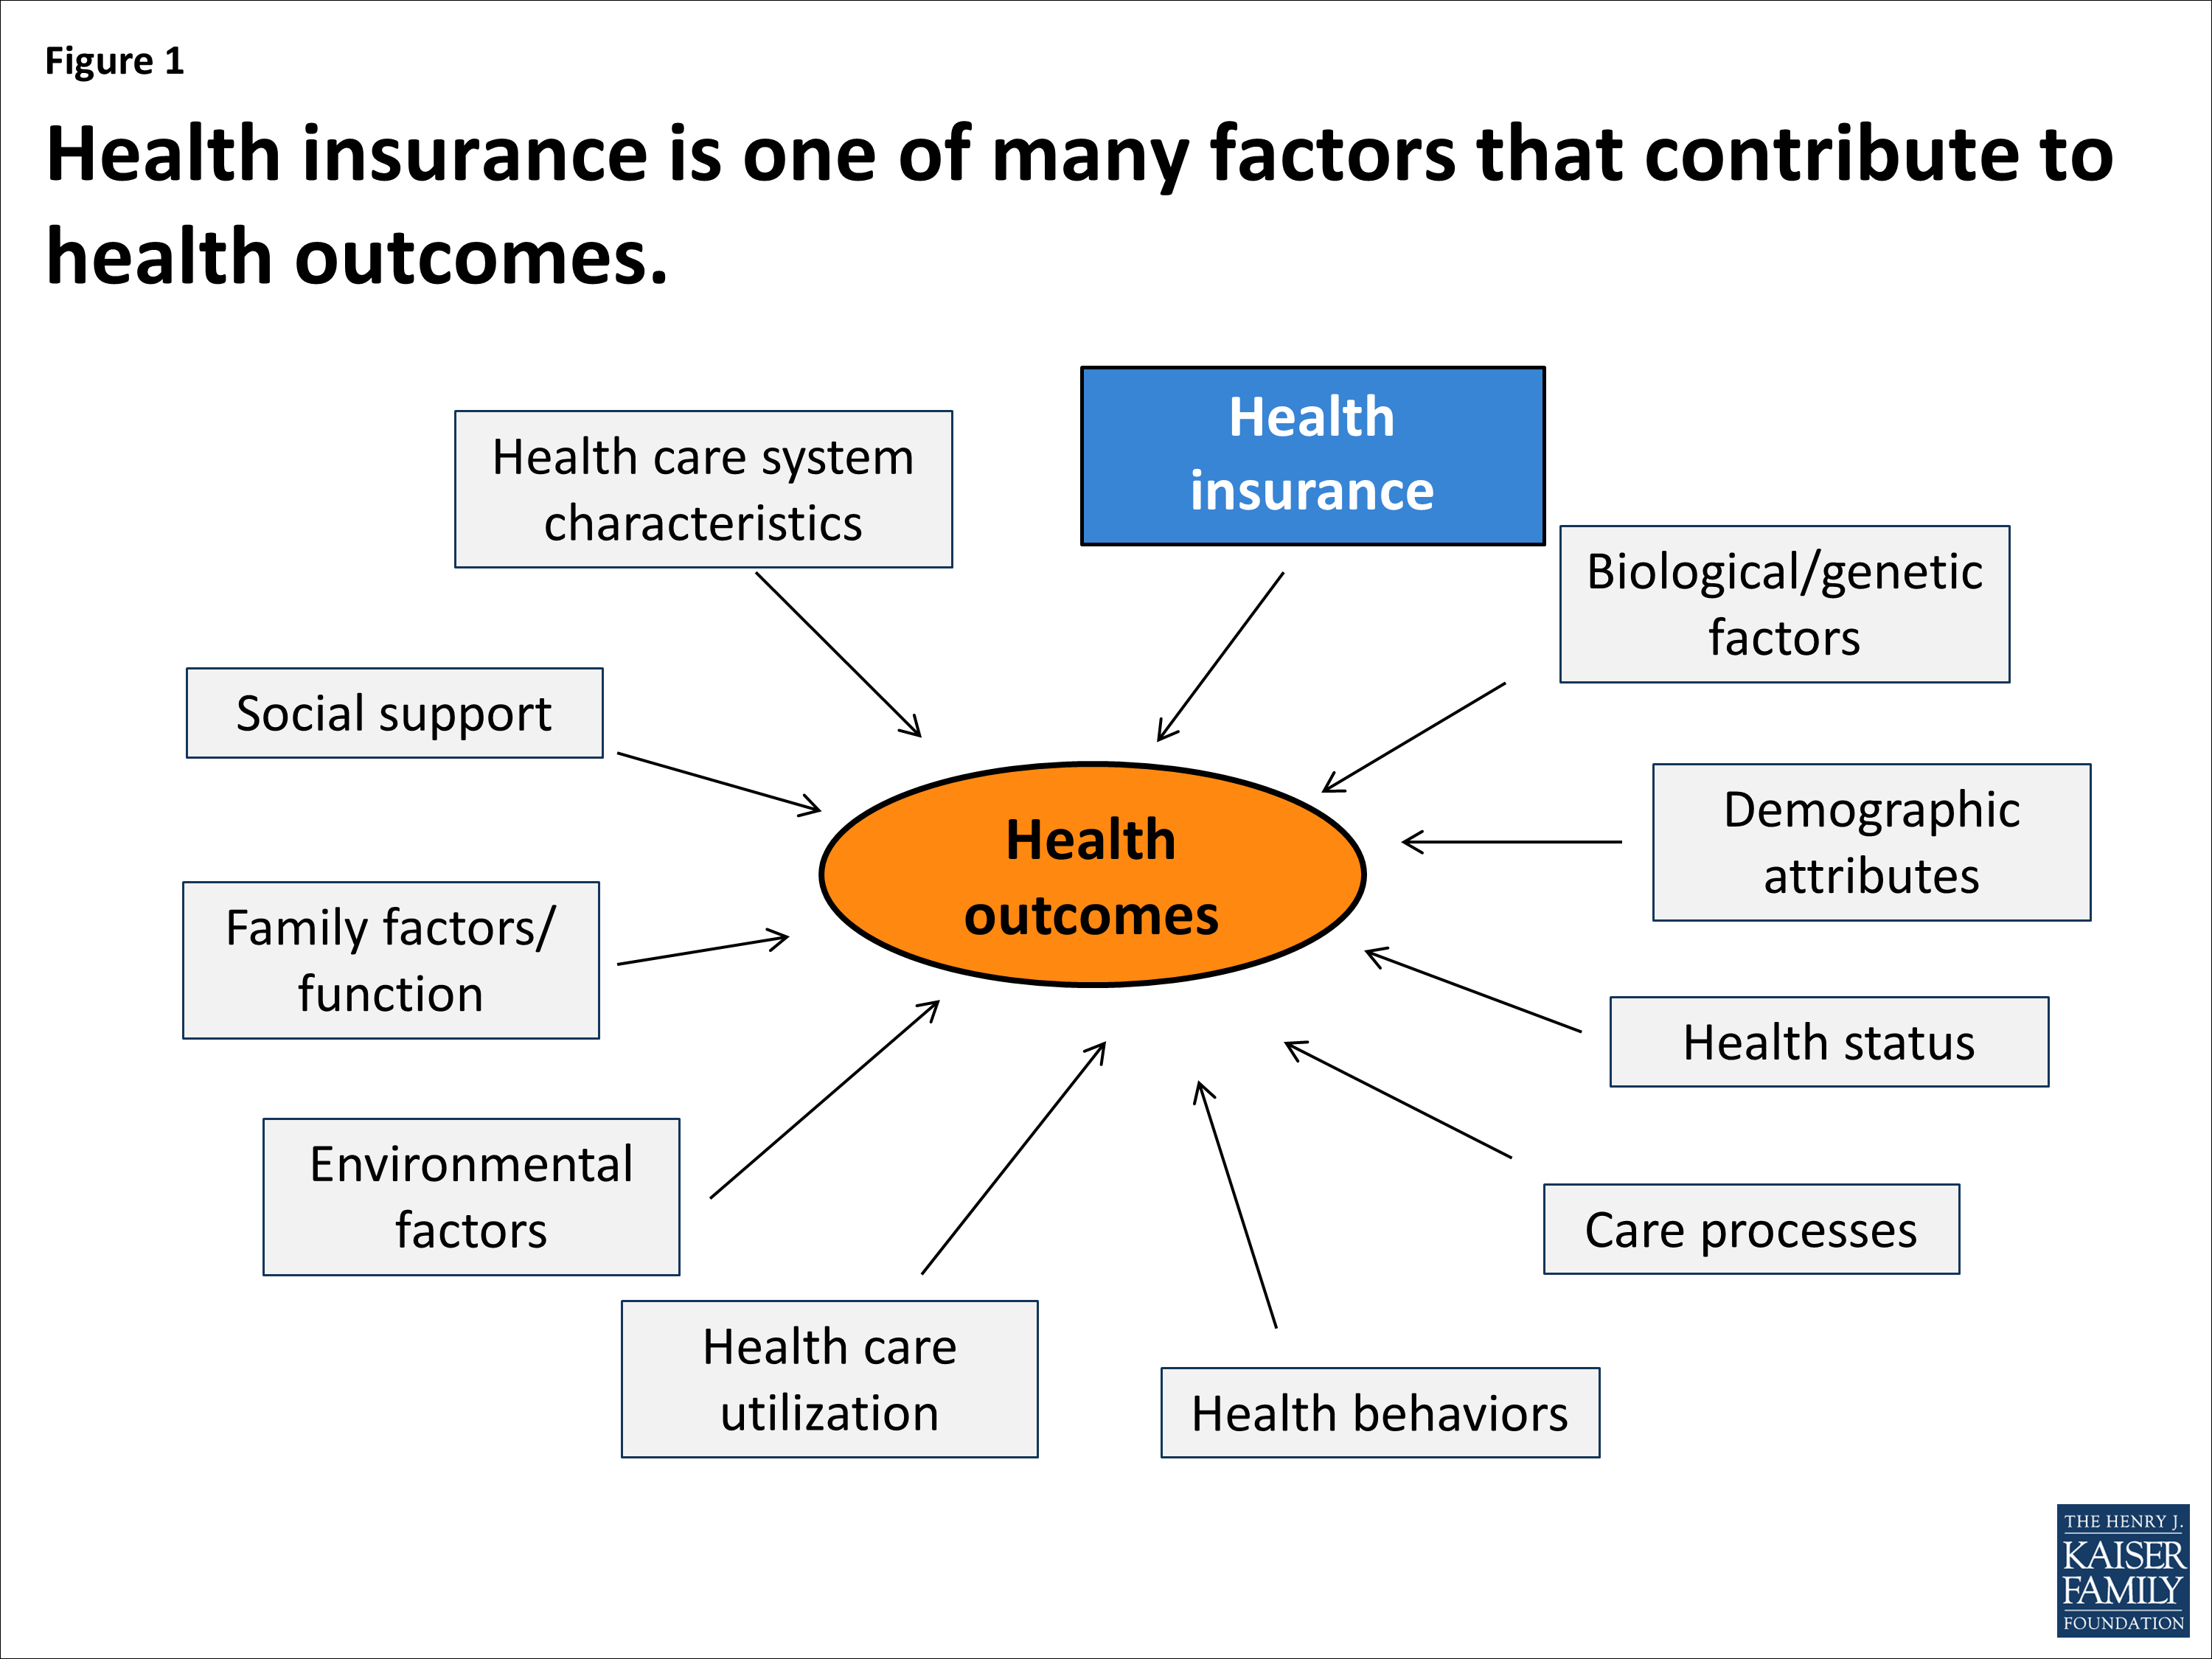
Finally, conceptual models of access and health have identified health insurance as one factor among many, including social, family, genetic, health care system factors and others, whose interaction determines how individuals and populations fare.9 Figure 1 provides a simplified illustration of just some of the variables at play. Given the complex influences involved in determining access, quality, and outcomes, expectations that health insurance alone can correct inadequacies in care or health disparities, are misplaced. Health insurance cannot overcome systemic barriers to access like health care workforce shortages in low-income communities, or the higher prevalence of chronic diseases in some populations. The impact of health insurance – whether public or private – needs to be considered in this broader context, and researchers and users of research must ask whether observed shortfalls in health care outcomes reflect failures of health insurance or the contribution of other factors that may call for different policy responses.
Who are Medicaid beneficiaries?
Medicaid was designed to provide health coverage for low-income children and families who lack access to private health insurance because of their limited finances, health status, and/or severe physical, mental health, intellectual, or developmental disabilities. Medicaid also assists low-income elderly and disabled Medicare beneficiaries with their Medicare premiums and cost-sharing and covers important benefits that Medicare does not cover, especially long-term care. Most states have expanded coverage for low-income children beyond federal minimum requirements so that children with family income up to at least 200% of the federal poverty level (FPL) are eligible for Medicaid or the Children’s Health Insurance Program (CHIP). [In 2013, 200%FPL was $47,100 for a family of four] However, state Medicaid eligibility standards for parents are far more restrictive and, in half the states, childless adults under age 65 – no matter how low their income – are ineligible for Medicaid unless they are disabled or pregnant. Thus, the adult populations studied in most Medicaid research are extremely poor.
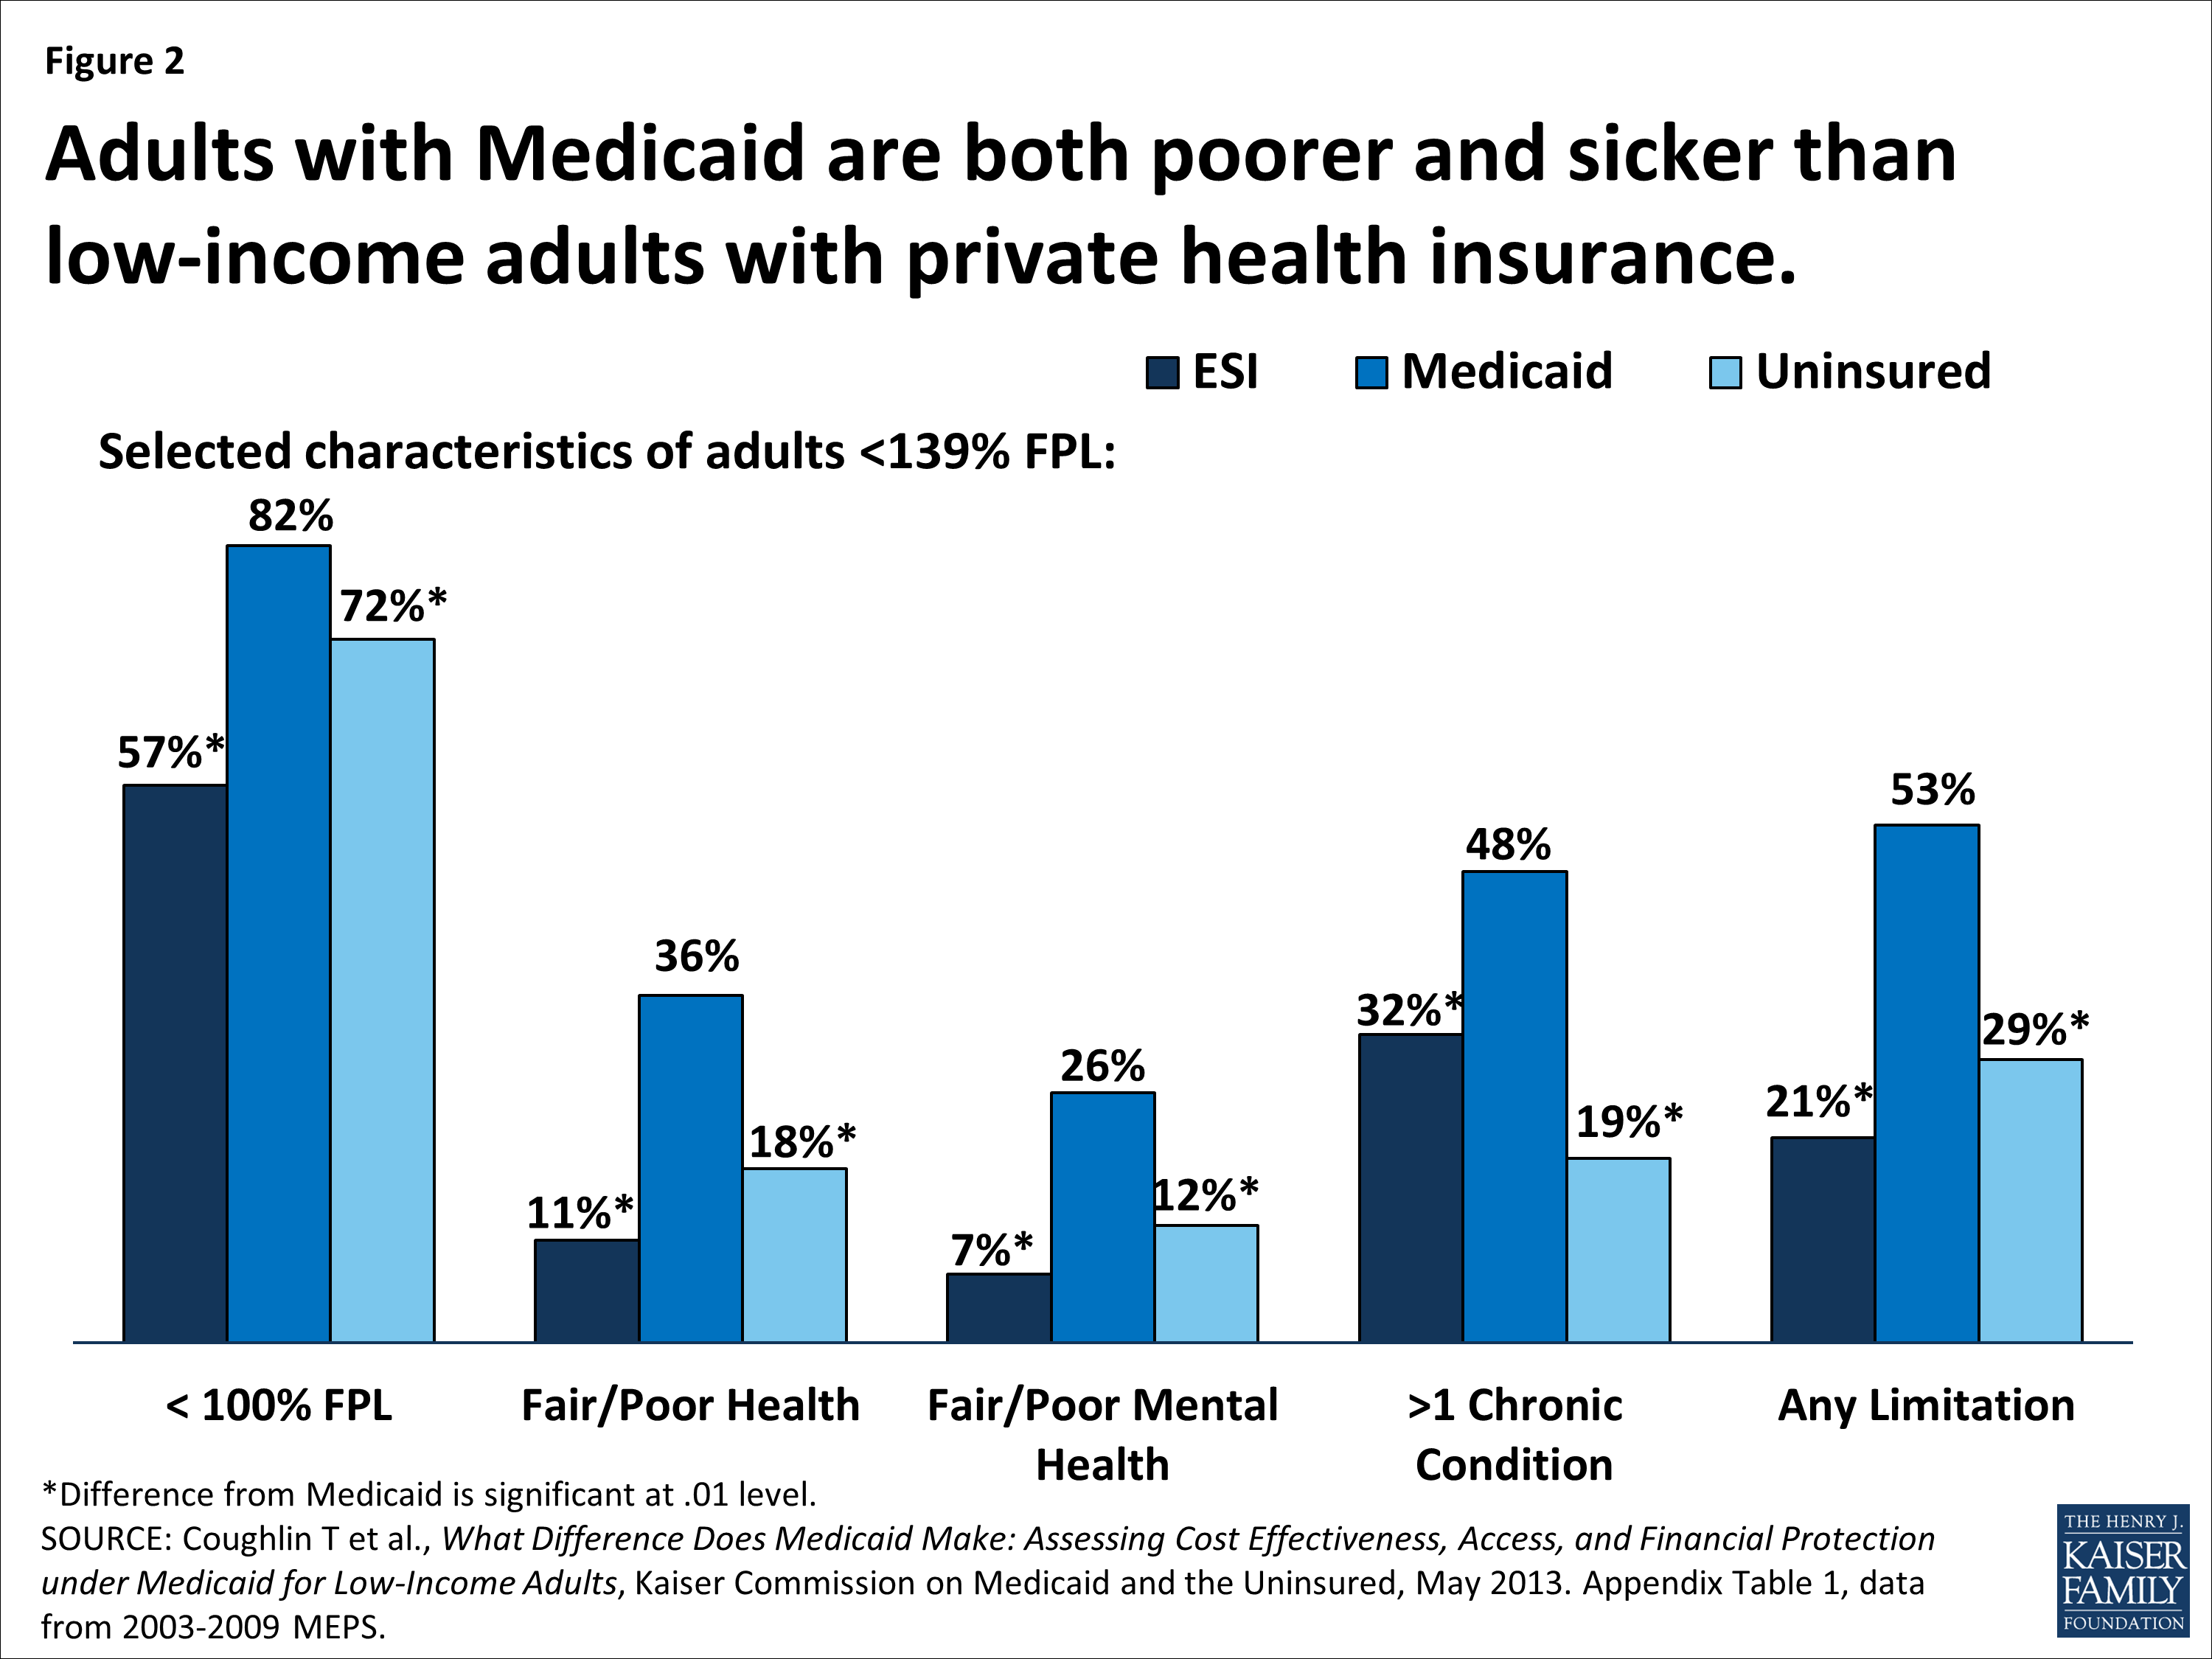
Because of Medicaid’s eligibility criteria and the strong correlation between poverty and poor health and disability, Medicaid beneficiaries are poorer and have a poorer health profile compared with both the privately insured and the uninsured. This is true even within the low-income population, as Figure 2 illustrates for adults. The distinctly higher rates of poverty, chronic illness, and disability in the Medicaid population are important to bear in mind when considering the evidence on Medicaid’s impact. These disadvantages make access and quality benchmarks that are based on the experience of the privately insured population more challenging to meet in Medicaid. Studies that control for observable differences between Medicaid and comparison populations provide a fairer assessment of the program’s impact on access and quality. Even so, researchers commonly cite as a limitation of their studies the possibility that they did not fully control for underlying population differences that might help to explain their findings. This limitation may be even more consequential in analyses that examine how health outcomes (as opposed to access or quality of care) compare between Medicaid beneficiaries and other populations, because a larger set of factors may attenuate the impact of health coverage on outcomes.
Finding #1: Having Medicaid is much better than being uninsured.
Consistently, research indicates that people with Medicaid coverage fare much better than their uninsured counterparts on diverse measures of access to care, utilization, and unmet need. A large body of evidence shows that, compared to low-income uninsured children, children enrolled in Medicaid are significantly more likely to have a usual source of care (USOC) and to receive well-child care, and significantly less likely to have unmet or delayed needs for medical care, dental care, and prescription drugs due to costs.10111213
The research findings on adults generally mirror the patterns for children. A synthesis of the literature on the impact of Medicaid expansions for pregnant women concluded, “…the weight of evidence is that expansions led to modest improvements in prenatal care use, in terms of either earlier prenatal care or more adequate prenatal care, at least in some states and for some groups affected by the expansions.”14 Mothers covered by Medicaid are much more likely than low-income uninsured mothers to have a USOC, a doctor visit, and a dental visit, and to receive cancer screening services.15 Nonelderly adults covered by Medicaid are more likely than uninsured adults to report health care visits overall and visits for specific types of services; they are also more likely to report timely care and less likely to delay or go without needed medical care because of costs.16 Projections from a recent analysis show that, if Medicaid beneficiaries were instead uninsured, they would be significantly less likely to have a USOC and much more likely to have unmet health care needs; except for emergency department care, their use of key types of services would also drop significantly. At the same time, their out-of-pocket spending would increase dramatically – almost four-fold on average.17 Other research provides evidence of increased access to care and health care utilization for previously uninsured low-income adults who gain Medicaid coverage under state expansions of eligibility.18
Recently, the Oregon Health Insurance Experiment has provided uniquely powerful evidence about the impact of Medicaid coverage on uninsured adults.192021 The evidence is compelling because the study is a randomized controlled trial (RCT), the gold standard in research design. Taking advantage of a lottery held in Oregon in 2008 to allocate a limited number of new Medicaid “slots” for low-income, uninsured nonelderly adults, a team of researchers gathered data on access, utilization, and clinical health measures for both the adults who gained Medicaid through the lottery and the adults who did not. Two rounds of findings have been published in the NewEngland Journal of Medicine, which can be summarized, in part, as follows:
Medicaid increased access to care and health care use, and improved self-reported health.One year out from the lottery, the adults who gained Medicaid were 70% more likely to have a regular place of care and 55% more likely to have a regular doctor than the adults who did not gain coverage. Associated with more consistent primary care, Medicaid also increased the use of preventive care such as mammograms (by 60%) and cholesterol checks (by 20%), and the Medicaid adults had more outpatient visits and hospital admissions and used more prescription drugs. Finally, the researchers found that being covered by Medicaid increased self-reported health. Compared with the uninsured adults, the Medicaid adults were 25% more likely to report they were in good to excellent health (versus fair to poor health), 40% less likely to report health declines in the last six months, and 10% more likely to screen negative for depression. The findings two years out from the lottery confirmed that Medicaid coverage continued to be associated with increased access to care and health care use, and improved self-reported health.
Medicaid improved adults’ mental health markedly; Medicaid’s impact on physical health remains inconclusive.Objective clinical data collected on both groups of adults two years after the lottery show that, relative to being uninsured, having Medicaid led to a 30% reduction in the rate of positive screens for depression. Gains in physical health were more limited: while Medicaid did increase the detection of diabetes and use of diabetes medication, it did not have a statistically significant effect on diabetes control, or on control of high blood pressure or high cholesterol. The researchers note that their study lacked sufficient statistical power to detect changes, and many of their point estimates are, in fact, within the range of clinically meaningful changes that would be expected if Medicaid were effective. The authors also identify multiple factors that may mitigate the impact of coverage on clinical outcomes, including unmeasured barriers to access, missed diagnoses, inappropriate medication, patient noncompliance, and ineffectiveness of treatments.
Medicaid virtually eliminated catastrophic medical expenses. Catastrophic out-of-pocket spending (defined as costs exceeding 30% of income) was nearly eliminated among the adults who gained Medicaid coverage. Also, the likelihood of having medical debt was reduced by more than 20%, and having Medicaid had a significant impact on all self-reported measures of financial strain due to health care costs, including borrowing money or skipping other bills to pay medical bills and being refused treatment due to medical bills in the past six months.
Analyses that examine how Medicaid beneficiaries with serious chronic illnesses, such as diabetes, fare are of particular interest because of the prevalence of these conditions in the Medicaid population and the consequences if care is lacking. A recent series of studies focused specifically on low-income nonelderly adults with major chronic diseases shows statistically significant and clinically important differences between Medicaid beneficiaries and the uninsured on important measures of access and care. For example, adults with diabetes who are covered by Medicaid are less likely than those who lack insurance to report delaying or being unable to get needed care. They also have more office visits, fill more prescriptions, and are more likely to receive the key elements of recommended diabetes care.22 The two related studies on other major chronic illnesses show similar results.23
Continuity in Medicaid coverage makes a difference. Research has shown that interruptions in Medicaid coverage can lead to greater emergency department use as well as significant increases in hospitalization for conditions that can be managed on an ambulatory basis.242526 Studies examining the short-term impacts of loss of Medicaid coverage provide additional evidence of Medicaid’s impact. Studies in California and Oregon of low-income adults who lost their Medicaid coverage found significant declines in basic measures of access, such as having a USOC, unmet health care and medication needs, and likelihood of a recent primary care visit, as well as significant declines in health status.2728 In focus groups conducted with adult Medicaid beneficiaries in Massachusetts following the state’s elimination of adult dental benefits, nearly all the participants reported serious oral health problems that, for many, resulted in chronic and serious pain.29
Beyond showing improved access to care and use of recommended care for Medicaid beneficiaries relative to the uninsured, research also provides evidence that broader eligibility for Medicaid at the state level is associated with significant reductions in both child mortality30 and adult mortality.31 A study examining the relationship between broader state Medicaid coverage of adults and access to physician and preventive services found that higher levels of Medicaid coverage were associated with substantially improved access to care for all low-income adults in the state, and also that access gaps between low- and high-income adults were substantially larger in states with limited Medicaid coverage than in states with broader coverage.32
Finding #2: Medicaid beneficiaries and the privately insured have comparable access to preventive and primary care.
Given the benefits that cascade as health insurance lowers financial barriers and opens the door to the health care system, and, in contrast, the downstream deficits in care that the uninsured experience, measures of access to preventive and primary care, like having a USOC, receipt of a well-child visit, and cancer screening rates, can be seen not just as process measures or ends for their own sake, but as the anchors of high-quality care. Accordingly, how Medicaid beneficiaries do on these basic access measures is an important indicator of the quality of care in Medicaid. Many studies have used the experience of privately insured individuals as a benchmark for gauging Medicaid’s performance.
Children with Medicaid and privately insured children compare quite closely in their access to and use of preventive and primary care. Nationally, more than 95% of both groups of children have a USOC, and the very small percentage who report delaying or going without needed care due to cost in the past year is the same between the two groups, which is notable considering the lower income and greater health care needs of children covered by Medicaid.33 The most recent annual HHS report on the quality of care for children in Medicaid and CHIP concluded that children are similarly likely to have had a primary care visit in the past year whether they are publicly or privately insured.34 Younger children with public coverage appear to lag behind privately insured children on well-child visit rates and immunization rates, but adolescents with Medicaid or CHIP may fare as well as or better than adolescents with private coverage.
A recent report prepared for the Medicaid and CHIP Payment and Access Commission (MACPAC) reached similar findings when comparisons between publicly and privately insured children were adjusted for health, demographic, and socioeconomic differences between the two groups.35 It also found that children with public coverage are as likely as privately insured children to have had a specialist visit in the past year. At the same time, the report identified important measures of access on which Medicaid children fare slightly worse than those with private insurance. For example, they are less likely to have a USOC with night or weekend hours and are more likely to delay care for this reason. They are also more likely to lack transportation to the doctor’s office or clinic.
A companion study for MACPAC on adults enrolled Medicaid found that, when health, demographic, and socioeconomic differences were controlled for, Medicaid adults did as well as or better than privately insured adults on key measures, including USOC and receipt in the past year of a routine check-up, a general doctor visit, a specialist visit, a mammogram, and flu vaccination.36 The shares of Medicaid and privately insured adults reporting any unmet needs due to costs were comparable, but Medicaid adults were significantly less likely to report unmet needs for medical care, prescription drugs, and mental health care, compared with privately insured adults. These results are largely consistent with findings from other studies comparing Medicaid and privately insured adults’ access and utilization.373839 A review of the literature on Medicaid’s impact on birth outcomes concluded that, when known risk factors for preterm birth and low birth weight are controlled for, birth outcomes are not different between women with Medicaid and privately insured women.40 Medicaid also provides greater financial protection than private health insurance.41 ,42 Research estimating how Medicaid beneficiaries would fare if they had private insurance instead projects that their out-of-pocket spending would increase more than three-fold on average, and that out-of-pocket burden would be heaviest for the subgroup of individuals with health limitations.43
Finding #3: Specialists are less willing to accept Medicaid patients than privately insured patients. However, studies comparing access to specialist care between Medicaid and private insurance have produced mixed findings – likely a reflection of the difficulty of adjusting for all the factors that may influence access.
As distinct from access to primary care, access to specialty care has emerged in some research as a weakness in Medicaid relative to private insurance. A review of the literature on children’s access to specialty care found that Medicaid children appear less likely than privately insured children to receive specialist care for various conditions and more likely to have trouble finding a physician willing to accept their insurance.44 Data included in the HHS report on Medicaid and CHIP children mentioned earlier show that fewer than half of parents with children enrolled in Medicaid or CHIP said it was always easy to get an appointment with a specialist, and the report cites access to specialty care as an area of particular concern. Consistent with those results, “secret shopper” and other studies have found specialist physicians and clinics far more likely to deny appointments to Medicaid and CHIP children than to privately insured children, and much longer wait times for appointments for publicly insured children.4546 At the same time, the report for MACPAC, also mentioned earlier, found that observed gaps in access to specialty between publicly and privately insured children disappeared when demographic as well as health status differences between the two groups were controlled for.
In a nine-city audit study investigating adults’ access to specialist care, 64% of callers saying they were privately insured, but only 34% of those saying they had Medicaid, were able to secure an appointment for urgent follow-up care for three serious conditions, suggesting that Medicaid adults may lack adequate access to specialist care.47 However, the report for MACPAC on adults cited earlier determined that privately insured adults are no more or less likely than Medicaid adults to have a specialist visit. It showed that, when health status and demographic differences between the two groups are controlled for, the two groups are equally likely to have specialist visits overall, specialist visits excluding OB/GYN visits, and, for women, OB/GYN visits.48 This finding is at variance with the finding from another analysis, which projected that, if Medicaid adults were instead covered by private insurance, their use of specialists would be significantly higher.49
Finding #4: Studies examining the causes of higher emergency department (ED) use by Medicaid beneficiaries compared to the privately insured indicate that most of the difference is due to higher rates of symptoms determined by ED triage staff to need urgent attention. Barriers to access to care are also a factor.
Compared with both privately insured people and the uninsured, Medicaid beneficiaries have much higher rates of ED use.50 However, a substantial body of research investigating this disparity more closely indicates that poorer health and access challenges in Medicaid both play important roles in explaining Medicaid’s higher ED visit rates.
A study issued about a year ago showed that only a small portion of Medicaid patients’ higher ED use was explained by visits for non-urgent symptoms. Most of the Medicaid-private difference was attributable to more ED visits by Medicaid patients for symptoms that were judged by ED triage staff to need urgent or semi-urgent evaluation. Compared to nonelderly privately insured people, nonelderly Medicaid patients had almost double the rate of ED visits both for symptoms needing evaluation within an hour and for those needing evaluation within one to two hours.51 Also, compared with the privately insured adults with ED visits, the Medicaid adults were more likely to have a secondary diagnosis of a mental disorder, and their visits were more likely to involve more than one major chronic condition and more likely to involve a disability.
Other research provides evidence that increased ED utilization is associated with barriers to timely primary care, and that more accessible after-hours care is associated with lower rates of ED visits.5253 A study examining the reasons for ED visits by nonelderly adults points in this direction; the results show that, compared with the privately insured with ED visits, Medicaid adults with ED visits were much more likely to report that they had no other place to go and that their doctor’s office or clinic was not open.54 A study probing factors associated with specialists’ willingness to accept children with public health insurance identified referral through hospital EDs as a common mechanism by which primary care physicians secure this care for their Medicaid and CHIP patients.55 The results from a recently published qualitative study seeking to identify the reasons that people of low socioeconomic status prefer hospital care to ambulatory care indicate that patients, too, see increased access to specialty care as one important advantage of seeking care in a hospital setting. Medicaid patients reported that while the direct costs of an ED visit and a physician office visit were similar, the overall cost associated with an office visit was greater because of the additional time and expense required for specialty visits or tests recommended by the primary care provider. Transportation also emerged as an issue. Finally, many patients reported that when they called physicians’ offices, they were advised to go to the ED.56
Finding #5: New evidence is emerging about the quality of care provided to Medicaid beneficiaries.
Research investigating the quality of care received by Medicaid beneficiaries is limited, but two new analyses, one focused on health center care and the other on hospital care, indicate that the care received by people with Medicaid coverage tracks closely with benchmarks for high quality.
Health center care
Health centers are a key source of preventive and primary care for medically underserved communities and populations, including millions of Medicaid beneficiaries. The ACA funded a major expansion of the health center program to help meet the expected increased demand for care as both Medicaid and private coverage expand. Given the role of health centers in providing care to Medicaid patients, evidence on the quality of care they deliver is important to an assessment of the Medicaid program itself. A recent study examined how health center performance on a set of three quality measures – diabetes control, blood pressure control, and receipt of a Pap test within the past three years – compares to the performance of Medicaid managed care organizations (MCOs), which also serve a low-income population.57 The study defined the standard for “high performance” as the 75th percentile of Medicaid MCO quality scores, and the standard for “lower performance” as the mean Medicaid MCO quality score. Because all Medicaid MCO enrollees are insured but a large share of health center patients are uninsured, MCO performance is a demanding benchmark to use for health centers.
The study produced the following key findings:
More than 1 in 10 health centers have consistently high performance relative to Medicaid MCOs. Of 1,200 health centers total, 130 outperformed three-quarters of Medicaid MCOs on all three measures of chronic and preventive care. Moreover, the average quality scores for these health centers exceeded the MCO high-performance benchmark by at least 10 percentage points on each measure. Many additional health centers were high-performing on individual measures, although not on all three – 80% met or exceeded the MCO high-performance standard for diabetes control, and over half did so for blood pressure control. Fewer than 4% of health centers were lower-performing on all three measures. However, in 70% of all health centers, Pap test rates trailed the average Medicaid MCO score, highlighting an important gap in the quality of preventive care for women.
The consistently high-performing health centers were concentrated in certain states, as were consistently lower-performing health centers.A majority of states had at least one consistently high-performing health center, but one-third of such high-performers were in California, New York, and Massachusetts, where just 18% of all health centers are located. Similarly, one-third of the consistently lower-performing health centers were concentrated in three states – Louisiana, Texas, and Florida – that account for just over 10% of all health centers.
Health centers with consistently lower performance are distinguished by extremely high uninsured and homeless rates.In the health centers that lagged behind average Medicaid MCO performance on all three quality measures, fully half the patients were uninsured, and well over one-third were homeless. The lower performance of these health centers probably says more about the profile of their patients and the limited resources available to health centers with high proportions of uninsured patients with complex health needs than about the quality of care provided to them. The higher rates of both private and Medicare coverage observed in the consistently high-performing health centers suggest that broader coverage as the ACA is implemented could help usher improvements in health center quality.
Hospital care
A team of Harvard researchers conducted a study to compare the quality of hospital care received by nonelderly adults covered by Medicaid and by private insurance, respectively, for three major conditions: heart attack, congestive heart failure, and pneumonia.58 Because the recommended processes of care for all these conditions are supported by strong scientific evidence, the researchers used “perfect care” – the receipt by an individual of all indicated processes of care – to gauge the quality of hospital care. Perfect-care scores for Medicaid patients and private-pay patients were calculated by aggregating the individual-level data by payer, both nationally and for each state.
The study found that:
Medicaid and privately insured patients receive hospital care of very similar quality. The study found statistically significant but small differences at the national level between the shares of Medicaid and privately insured adults who received perfect care. Perfect-care scores were higher for privately insured patients, but the differences were between 1% and 3%. State-level differences in hospital quality between Medicaid and private-pay patients were also small – less than 3 percentage points on average. The largest Medicaid-private difference in a state was 14 percentage points for heart attack care, but fewer than 10 states had differences larger than 5 percentage points for any of the three conditions.
State variation in the quality of hospital care Medicaid patients receive likely reflects geographic variation in how hospital care is delivered rather than state Medicaid policies.Notably, the researchers found significant variation in the quality of hospital care from state to state. However, quality tended to be higher for Medicaid patients where it was also higher for the privately insured, and lower for Medicaid patients where it was lower for the privately insured. The strong correlation in quality between Medicaid and privately insured patients suggests that the factors driving the quality of hospital care for Medicaid patients have more to do with how hospital care is delivered geographically, by state, than with factors related to state Medicaid policies.
Conclusion
In its totality, the research on Medicaid shows that the Medicaid program, while not perfect, is highly effective. A large body of studies over several decades provides consistent, strong evidence that Medicaid coverage lowers financial barriers to access for low-income uninsured people and increases their likelihood of having a usual source of care, translating into increased use of preventive, primary, and other care, and improvement in some measures of health. Furthermore, despite the poorer health and the socioeconomic disadvantages of the low-income population it serves, Medicaid has been shown to meet demanding benchmarks on important measures of access, utilization, and quality of care. This evidence provides a solid empirical foundation for the ACA expansion of Medicaid eligibility to millions of currently uninsured adults, and individuals and communities affected by the Medicaid expansion can be expected to benefit significantly. At the same time, the Medicaid program cannot overcome health care system-wide problems, like gaps in the supply and distribution of the health care workforce, or lack of access to transportation in low-income communities. Nor can Medicaid be expected to tackle many other barriers and issues that disproportionately affect low-income individuals and communities. These challenges require an additional set of policy responses beyond Medicaid’s ambit.
Still, Medicaid can be further strengthened by addressing recognized shortcomings in the current program. Securing adequate provider participation in Medicaid remains a key challenge. Improving continuity in Medicaid coverage is necessary to ensure that beneficiaries are able to obtain timely care and uninterrupted management of their chronic illnesses and disabilities. Rigorous oversight of the risk-based managed care arrangements in which more and more Medicaid beneficiaries receive their care is needed, especially as states expand managed care to people with more complex needs. New models of more coordinated and integrated care, and payment approaches that support them, are also needed. States are moving forward on all these fronts, often leading the way, and increased resources and flexibilities provided by the ACA continue to accelerate their progress. With stable and adequate federal and state investment in Medicaid, and state actions that leverage the purchasing power of the program to drive higher quality, Medicaid’s demonstrated potential to improve access and care for low-income people can be optimized.
The Path to Prosperity: A Responsible Balanced Budget. Fiscal Year 2014 Budget Resolution, House Budget Committee, March 2013. http://budget.house.gov/fy2014/↩︎
Senator Ted Cruz, PolitiFact.com, reported in Tampa Bay Times, April 1, 2013. ↩︎
Dayaratna K, “Studies Show: Medicaid Patients Have Worse Access and Outcomes than the Privately Insured,” Heritage Foundation Backgrounder No. 2740, November 9, 2012. ↩︎
Care without Coverage: Too Little, Too Late, Committee on the Consequences of Uninsurance, Board on Health Care Services, Institute of Medicine, National Academy Press, 2002. (Page 6) ↩︎
Coverage Matters: Insurance and Health Care, Committee on the Consequences of Uninsurance, Board on Health Care Services, Institute of Medicine, National Academy Press, 2001. (Page 28) ↩︎
Aday L and R Andersen, “A Framework for the Study of Access to Medical Care,” Health Services Research 9(3), Fall 1974. ↩︎
Dubay L and G Kenney, “Health Care Access and Use among Low-Income Children: Who Fares Best?” Health Affairs 20(1), 2001. ↩︎
Howell E and G Kenney, “The Impact of the Medicaid/CHIP Expansions on Children: A Synthesis of the Evidence,” Medical Care Research and Review 69(4), August 2012. ↩︎
Selden T and J Hudson, “Access to Care and Utilization Among Children: Estimating the Effects of Public and Private Coverage,” Medical Care 44(5), 2006. ↩︎
Kenney G and C Coyer, National Findings on Access to Health Care and Service Use for Children Enrolled in Medicaid or CHIP, MACPAC Contractor Report No. 1, March 2012. ↩︎
Howell E, “The Impact of the Medicaid Expansions for Pregnant Women: A Synthesis of the Evidence,” Medical Care Research and Review 58(1), March 2001. ↩︎
Long S et al., “How Well Does Medicaid Work in Improving Access to Care?” Health Services Research 40(1), February 2005. ↩︎
Long S et al., National Findings on Access to Health Care and Service Use for Non-elderly Adults Enrolled in Medicaid. MACPAC Contractor Report No. 2, June 2012. ↩︎
Coughlin T et al., “What Difference Does Medicaid Make? Assessing Cost Effectiveness, Access, and Financial Protection under Medicaid for Low-Income Adults,” Kaiser Commission on Medicaid and the Uninsured, May 2013. ↩︎
DeLeire T et al., “Wisconsin Experience Indicates that Expanding Public Insurance to Low-Income Childless Adults has Health Care Impacts,” Health Affairs 32(6), June 2013. ↩︎
Baicker K and A Finkelstein, “The Effects of Medicaid Coverage – Learning from the Oregon Experiment,” The New England Journal of Medicine 365(8), August 25, 2011. (Also see Finkelstein et al., The Oregon Health Insurance Experiment: Evidence from the First Year, NBER Working Paper 17190, 2011. http://www.nber.org/papers/w17190) ↩︎
Baicker K et al., “The Oregon Experiment – Effects of Medicaid on Clinical Outcomes,” The New England Journal of Medicine 368(18), May 2, 2013. ↩︎
Kronick R and A Bindman, “Protecting Finances and Improving Access to Care in Medicaid,” The New England Journal of Medicine 368(18), May 2, 2013. ↩︎
Garfield R and A Damico, “Medicaid Expansion under Health Reform May Increase Service Use and Improve Access for Low-Income Adults with Diabetes,” Health Affairs 31(1), January 2012. ↩︎
The Role of Medicaid for Adults with Chronic Illnesses, Kaiser Commission on Medicaid and the Uninsured, November 2012. ↩︎
Ku L et al., Improving Medicaid’s Continuity of Coverage and Quality of Care, The George Washington University Department of Health Policy, July 2009. ↩︎
Kasper J et al., “Gaining and Losing Health Insurance: Strengthening the Evidence for Effects on Access to Care and Health Outcomes,” Medical Care Research and Review 57(3), September 2000. ↩︎
Cassedy A et al., “The Impact of Insurance Instability on Children’s Access, Utilization, and Satisfaction with Health Care,” Ambulatory Pediatrics 8(5), September-October 2008. ↩︎
Carlson M et al., “Short-Term Impacts of Coverage Loss in a Medicaid Population: Early Results from a Prospective Cohort Study of the Oregon Health Plan,” Annals of Family Medicine 4(5), September/October 2006. ↩︎
Lurie N et al., “Termination from Medicaid: Does it Affect Health?” The New England Journal of Medicine 311(7), August 16, 1984. ↩︎
Eliminating Adult Dental Coverage in Medicaid: An Analysis of the Massachusetts Experience, Kaiser Commission on Medicaid and the Uninsured, August 2005. ↩︎
Currie J and J Gruber, “Health Insurance Eligibility, Utilization of Medical Care, and Child Mortality,” Quarterly Journal of Economics 111(2), 1996. ↩︎
Sommers B et al., “Mortality and Access to Care among Adults after State Medicaid Expansions,” The New England Journal of Medicine 367(11), July 25, 2012. ↩︎
Weissman J et al., “State Medicaid Coverage and Access to Care for Low-Income Adults,” Journal of Health Care for the Poor and Underserved 19(1), February 2008. ↩︎
Health, United States, 2012, National Center for Health Statistics, Centers for Disease Control and Prevention, U.S. Department of Health and Human Services, May 2013. ↩︎
2012 Annual Report on the Quality of Care for Children in Medicaid and CHIP, U.S. Department of Health and Human Services, December 2012. ↩︎
Anum E et al., “Medicaid and Preterm Birth and Low Birth Weight: The Last Two Decades,” Journal of Women’s Health 19(3), 2010. ↩︎
Kogan M et al., “State Variation in Underinsurance among Children with Special Health Care Needs in the United States,” Pediatrics 125(4), April 2010. ↩︎
Magge H et al., “Prevalence and Predictors of Underinsurance aong Low-Income Adults,” Journal of General Internal Medicine, February 2013. ↩︎
Skinner A and M Mayer, “Effects of Insurance Status on Children’s Access to Specialty Care: A Systematic Review of the Literature,” BMC Health Services Research 7(194), 2007. ↩︎
Bisgaier J and K Rhodes, “Auditing Access to Specialty Care for Children with Public Insurance,” The New England Journal of Medicine 364(24), June 16, 2011. ↩︎
Medicaid and CHIP: Most Physicians Serve Covered Children but Have Difficulty Referring them for Specialty Care, Government Accountability Office, June 2011. ↩︎
Asplin B et al., “Insurance Status and Access to Urgent Ambulatory Care Follow-up Appointments,” Journal of the American Medical Association 294(10), September 2005. ↩︎
Garcia T et al., “Emergency Department Visitors and Visits: Who Used the Emergency Room in 2007?” NCHS Data Brief No. 38, May 2010. ↩︎
Sommers A et al., “Dispelling Myths about Emergency Department Use: Majority of Medicaid Visits are for Urgent or More Serious Symptoms,” HSC Research Brief No. 23, July 2012. ↩︎
Cheung P et al., “Changes in Barriers to Primary Care and Emergency Department Utilization,” Archives of Internal Medicine 171(15), August 2011. ↩︎
O’Malley A, “After-Hours Access to Primary Care Practices Linked with Lower Emergency Department Use and Less Unmet Medical Need,” Health Affairs 32(7), December 2012. ↩︎
Gindi R et al., Emergency Room Use among Adults Aged 18-64: Early Release of Estimates from the National Health Interview Survey, January–June 2011, National Center for Health Statistics, May 2012. ↩︎
Rhodes K et al., “’Patients Who Can’t Get an Appointment Go to the ER’: Access to Specialty Care for Publicly Insured Children,” Annals of Emergency Medicine 61(4), April 2013. ↩︎
Kangovi S et al., “Understanding Why Patients of Low Socioeconomic Status Prefer Hospitals over Ambulatory Care,” Health Affairs 32(7), July 2013. ↩︎
Shin P et al., Quality of Care in Community Health Centers and Factors Associated with Performance, Kaiser Commission on Medicaid and the Uninsured, June 2013. ↩︎
Weissman J et al., “The Quality of Hospital Care for Medicaid and Private Pay Patients,” Medical Care 51(5), May 2013. ↩︎
It has been more than two decades since beginning of the HIV/AIDS epidemic. Since that time, over 60 million people worldwide have become infected, including more than 20 million who have already died. In the U.S., nearly half a million Americans have already died and almost one million more are currently estimated to be living with HIV/AIDS. The multiple threats posed by the epidemic have led to both domestic and global responses that have produced some significant progress. However, the HIV/AIDS epidemic continues to present serious public policy challenges to lawmakers at all levels of government, as well as community members, advocates, people living with and affected by HIV/AIDS, and others.
The Henry J. Kaiser Family Foundation, an independent philanthropy focusing on the major health care issues facing the nation today, has conducted a Capitol Hill Briefing Series and developed materials designed to provide policymakers with up-to-date information on the state of the HIV/AIDS epidemic and to allow for an interchange of ideas with experts in the field. The Briefing Series is a bi-partisan effort. Topics to date have included:
The State of the Epidemic. What has been the course of the epidemic? Where is it going? What has been the Federal response to date? (April 3, 2000)
Research. What are the latest advances in AIDS research? Are new treatments on the way? What progress have we made in the search for an AIDS vaccine? (June 2, 2000)
Financing HIV/AIDS Care. How do the 800,000 to 900,000 Americans living with HIV get their insurance coverage? What role does private insurance play? What role do Medicaid and Medicare play? And how does the Ryan White CARE Act fill the holes in this insurance safety net? (October 27, 2000).
Women and HIV/AIDS. This briefing examines the impact of the HIV/AIDS epidemic on women, the challenges facing health care providers in serving women with HIV/AIDS, and highlights the experiences of a woman living with HIV/AIDS. (May 2, 2001).
Latinos and HIV/AIDS in the United States. Latinos in the United States have been disproportionately affected by the HIV/AIDS epidemic. They account for a greater proportion of new HIV infections and AIDS cases than their representation in the U.S. population overall. The Kaiser Family Foundation has conducted two Capitol Hill briefings on the Impact of HIV/AIDS on Latinos in the U.S. March 2002 and July 2003.
On August 1, 2013, Diane Rowland, Executive Vice President of the Kaiser Family Foundation and Executive Director of the Foundation’s Kaiser Commission on Medicaid and the Uninsured, testified before the Federal Commission on Long-Term Care about ways in which the Medicaid program could be strengthened to better support low-income individuals with long-term services and supports needs.
In May 2013, a group of leading state Medicaid directors met outside Denver, Colorado to discuss the current opportunities and challenges facing state Medicaid programs as they prepare to implement the Affordable Care Act (ACA) coverage expansions and enrollment simplifications that will take effect in January 2014. Medicaid directors described a time of focused attention on their preparation for the implementation of significant and complex system and policy changes.
Key findings include:
States participating in the discussion varied with regard to their decisions on the ACA Medicaid expansion. Debate over the decision included a number of factors beyond just the fiscal impact.
The discussion clearly illustrated how widely divergent state decisions and approaches are on expanding Medicaid. Directors indicated that the debate on whether to move forward with the Medicaid expansion included a number of factors, many of which were specific to state circumstances. Beyond the fiscal impact of the decision, other factors mentioned as part of the debate included: how the expansion would be implemented, past experiences with coverage expansions, as well as potential action to reduce the federal deficit, and the funding commitment to Medicaid, in the future.
Regardless of where states stood on the Medicaid expansion, all the directors reported that they were actively working to have new streamlined eligibility and enrollment processes ready for 2014.
As part of health care reform implementation, all states are preparing to implement major changes to simplify and streamline eligibility and enrollment processes. By January 1, 2014, state Medicaid programs are required to use Modified Adjusted Gross Income (MAGI) to determine eligibility for most non-elderly Medicaid applicants and to have simplified enrollment policies and updated eligibility systems in place that interface with the new marketplaces. However, because the new marketplace will begin enrollment on October 1, 2013, there is an additional push to have Medicaid enrollment systems ready earlier. These changes are significant and complex, and they are required even if states do not adopt the ACA Medicaid expansion. Overall, there was broad consensus among the participants that they were working hard to be ready for open enrollment, but that eligibility and enrollment-related issues would inevitably occur at the start despite the best efforts of states and the federal government. As such, they stressed the importance of setting realistic expectations for January 2014.
In addition to implementation of the ACA, states continue to improve their existing Medicaid programs, by continuing to pursue payment and delivery reforms and by building on previous successes.
States are continuing to pursue significant payment and delivery system reforms to better coordinate care for complex and high need populations. Discussion group participants cited a number of new and ongoing initiatives in their states, which illustrated their commitment to improving health outcomes and controlling costs.
Directors also noted the importance of recognizing the successes of Medicaid, particularly at a time when there are many missperceptions about the program. There was consensus that as the Medicaid expansion is implemented and states continue to make delivery and payment reforms to the program, it will be important to both share the program’s achievements, innovations, and impact, and to communicate its effectiveness in connecting people to the care they need.
Issue Brief
Introduction and Background
In May 2013, a group of leading state Medicaid Directors met outside Denver, Colorado to discuss the current opportunities and challenges facing state Medicaid programs as they prepare to implement the ACA coverage expansions and enrollment simplifications that will take effect in January 2014. At that time, affordable health coverage will become available to millions of Americans in every state either through new state-based marketplaces (also known as “exchanges”) or through the new federally operated marketplace. Millions more will become newly eligible for Medicaid in states that implement the ACA Medicaid expansion.1
The Medicaid expansion extends Medicaid eligibility to nearly all adults with incomes up to 138 percent of the federal poverty level (FPL), ($15,856 for a household of one or $32,499 for a household of four in 2013), including adults without dependent children who historically have been excluded from Medicaid coverage in most states. The ACA provides 100 percent federal financing for those newly eligible for Medicaid from 2014 through 2016, phasing down to 90 percent by 2020 and beyond.
The fiscal impact of the decision varies across states, though states are likely to see net savings from the expansion. A report prepared by the Urban Institute for the Kaiser Commission on Medicaid and the Uninsured estimates that if all states expanded Medicaid, the total cost of the expansion would be about $1 trillion over the 2013-2022 period, with the federal government paying $952 billion (93%) and the states paying up to $76 billion.2 State costs are related to increased participation among those currently eligible for coverage (reimbursed at the traditional Medicaid match rate) and a small share for those newly eligible (up to 10% by 2020). Increased participation in Medicaid is likely to occur even if a state chooses not to implement the ACA Medicaid expansion due to national outreach and enrollment activities as well as requirements to simplify and streamline the enrollment process and to coordinate enrollment for the Marketplace, Medicaid and CHIP.
States are also likely to see savings or offsets to costs from the Medicaid coverage expansion from: reduced state spending for uncompensated care; the transition of current Medicaid coverage for specific groups to the “newly eligible” category at the higher match rates; the transition of those with incomes above 138% FPL currently covered by Medicaid to coverage in the Marketplace; or reduced spending for programs that serve indigent populations (such as state funded mental health or substance abuse programs.) States could also see increased revenue from broader economic effects such as increased jobs, income and state tax revenues within the health care sector and beyond. As of July 2013, 24 states are moving forward with Medicaid expansion; 21 states are not moving forward at this time and 6 states remain undecided or continue to debate the expansion.3
Regardless of whether a state chooses to implement the Medicaid expansion, new requirements for web-based, paperless, real-time Medicaid eligibility and enrollment processes will need to be in place by January 1, 2014. States also will need to shift to a uniform income eligibility standard (Modified Adjusted Gross Income or MAGI) for most coverage groups and coordinate closely with the new marketplaces to establish a “no wrong door” enrollment approach, so that, regardless of a person’s point of entry (i.e., a marketplace or state Medicaid agency), eligibility is determined for all insurance affordability programs. For states, these changes will represent a huge transformation of their current systems.
Concurrent with implementation of the eligibility and enrollment changes under the ACA, states must continue to administer their existing Medicaid programs. At the time of the discussion in May 2013, most states were at the end of fiscal year (FY) 2013 and about to start FY 2014. On the whole, state revenues were continuing to grow, having improved after several years of record level declines during the Great Recession, but revenues were growing at a modest rate compared to recoveries from previous recessions. On average across all states, state revenues have returned to pre-recession levels but are still far from full recovery.4 States continue to actively pursue payment and delivery reforms to better coordinate care for Medicaid beneficiaries, particularly those with chronic conditions.
It was within this context that a cross-section of Medicaid directors from across the country met for a structured discussion including members of the Board and staff of the National Association of Medicaid Directors (NAMD). This report is based on that discussion.
Key Findings
States participating in the discussion varied with regard to their decisions on the ACA Medicaid expansion. Debate over the decision included a number of factors beyond just the fiscal impact.
The discussion clearly illustrated how widely divergent state decisions and approaches are on expanding Medicaid. (Box 1) Directors indicated that the debate on whether to move forward with the Medicaid expansion included a number of factors, many of which were specific to state circumstances. Beyond the fiscal impact of the decision, other factors mentioned as part of the debate included: how the expansion would be implemented, past experiences with coverage expansions, as well as concerns over future federal action to reduce the federal deficit.
The fiscal impact of the Medicaid expansion was a part of the debate in all states, though its weight varied. Three of the Medicaid directors participating in the discussion group commented that their states (Michigan, Washington and West Virginia) had one or more fiscal analyses showing a net savings to the state from the ACA Medicaid expansion. For Washington and West Virginia, these analyses supported state decisions to implement the expansion and, in Washington, the expansion helped to partially offset a projected budget deficit. The Medicaid directors from Georgia, South Carolina and Tennessee – states not currently moving forward with the expansion or still debating the issue– indicated that their analyses showed overall net direct costs from implementing the expansion.
However, directors also indicated that the fiscal impact was not the only factor driving expansion decisions. In the state of Michigan, for example, implementation of the expansion remained in doubt at the time of the discussion despite legislative fiscal agency estimates of over $1 billion in net savings over ten years (including $200 million in mental health-related savings). Larger annual savings are expected in the first six years of implementation, which would more than offset small annual costs that would begin in year seven.5 Despite the overall savings estimates and generally improving state revenue collections, at the time of the focus group, the Michigan legislature had not provided the needed budget authority for the expansion.
Box 1: Status of State Decisions on the Medicaid Expansion from the Directors’ Discussion
Moving Forward at this Time: Medicaid directors from California, Washington and West Virginia indicated that their states were actively moving forward with implementing the ACA Medicaid expansion. Since the discussion, legislation has been signed into law by the Governor of Arizona.
Not Moving Forward at this Time: Medicaid directors from Georgia and South Carolina indicated that their states were not moving forward with the Medicaid expansion at this time. The Medicaid director from Virginia indicated that legislation precluded her state from moving forward at this time until a number of Medicaid reforms had been implemented, as determined by a bicameral legislative committee.
Debate Ongoing: Directors in two states, Indiana and Tennessee, indicated that although their Governors remain undecided, they are working with CMS to pursue alternative models for the Medicaid expansion. Indiana’s Governor has proposed using its current Section 1115 Demonstration program, the “Healthy Indiana Plan,” as the benefit model for the expansion. Tennessee’s Governor has been in discussions with CMS officials about the potential use of a premium assistance model for the expansion population. Unlike in Indiana, the Medicaid director in Tennessee indicated that additional legislative authority may be needed. The Medicaid director from Michigan described continuing legislative resistance, despite gubernatorial support for expansion. At the time of the discussion, the Michigan Governor was continuing to seek the legislative budget authority required to expand. Since the discussion, legislation authorizing the expansion through a waiver has been passed by the state House in Michigan and is pending in the state Senate.
Debate on the Medicaid expansion in some states focused on how the Medicaid expansion would be implemented. Medicaid directors from Indiana and Tennessee, for example, noted that although their governors remain undecided, they are pursuing alternative methods of expanding Medicaid. Indiana’s Governor has proposed using the state’s current Section 1115 Demonstration program, the “Healthy Indiana Plan,” as the benefit model for the expansion. Tennessee’s Governor had been discussing with CMS the potential use of a premium assistance model for the expansion population. Unlike in Indiana, additional legislative authority may be needed in Tennessee depending on the changes negotiated. In Virginia, expansion is predicated on a number of Medicaid reforms being implemented as determined by a bicameral legislative committee, including the successful negotiation of a Memorandum of Understanding with the federal government to implement their Financial Alignment Demonstration for those eligible for Medicare and Medicaid as well as expanding the use of managed care.
Past experiences with coverage expansion also played a role in how the debate for the Medicaid expansion was framed in some states. In Arizona, for example, the Medicaid expansion is viewed by the Governor and her supporters as a “restoration” rather than as an “expansion” given that the state had a previous coverage expansion to adults up to the poverty level that was reduced due to budgetary pressures in the recent recession. In Tennessee, the state’s experience with its Medicaid managed care expansion in the mid-1990s has, in part, influenced the Governor’s decision to pursue negotiations with CMS to use a premium assistance model for the expansion.
Concerns over possible future action to reduce the federal deficit, and the funding commitment to Medicaid, also factored into the expansion decision. Some states, such as Arizona, have included language in authorizing legislation that specifies if the federal share for the newly eligible drops below that which is specified in federal statue or some other specified level, the state will terminate the Medicaid expansion. Others have pointed to the long history of the program, during which the formula that determines the federal share of Medicaid spending has remained steady since the start of the program.6 Congress has only amended the formula to provide more federal funding, not less.7
Regardless of where states stood on the Medicaid expansion, all the directors reported that they were actively working to have new streamlined eligibility and enrollment processes ready for 2014.
As part of health care reform implementation, all states are preparing to implement major changes to simplify and streamline eligibility and enrollment processes. By January 1, 2014, state Medicaid programs are required to use Modified Adjusted Gross Income (MAGI) to determine eligibility for most non-elderly Medicaid applicants and to have simplified enrollment policies and updated eligibility systems in place that interface with the new marketplaces. However, because the new marketplace will begin enrollment on October 1, 2013, there is an additional push to have Medicaid enrollment systems ready earlier. These changes are required whether or not states decide to adopt the ACA Medicaid expansion.
All the participating directors stressed that their states are working hard to prepare for implementation of these changes and that they will be ready by 2014, though there will be differing degrees of readiness. Some directors noted that there will likely be a significant number of manual and paper “workarounds” at initial implementation. Some directors also noted that staffing levels may not be fully adequate for the initial influx of applications expected due to the ACA. Some states noted that they were adding shifts and will be increasing the amount of teleworking to try to address potential staff issues. In addition, a few directors commented that some rural areas of their states lacked broadband internet access and that this potential limitation needs to be better understood by all states and by the federal government as electronic access to the exchange application process (by both staff and consumers) is developed. While states will be in different places at the start, they will continue to improve processes over time after initial implementation.
Directors wanted more detailed information about the federal government’s projected timelines for system development and implementation to help inform state operations and planning efforts. Directors in the group pointed to the significant federal implementation challenges, including the creation of the federal data hub (that will link to various federal agencies to verify income and other information provided by applicants). There were also concerns expressed about the adequacy of staffing for the federal call center and several noted that many consumers will likely want enrollment assistance. States operating their own marketplaces, as well as some of those where the federal government will be operating the marketplace, are developing contingency plans with the intention of ensuring rapid response to problems that may arise with eligibility and enrollment issues. The directors noted that states have significant incentives to minimize implementation problems as state residents will likely turn to state officials if they experience enrollment difficulties, regardless of whether their marketplace is operated by the state or the federal government.
States represented by the directors in the discussion group varied widely in their plans and preparations to provide outreach and marketing for the new coverage expansions. Outreach and enrollment efforts in 2014 will likely vary across states. In addition to broad campaigns launched by the federal government and states, private entities, including advocacy groups, provider organizations and health plans, may launch their own outreach and enrollment efforts. The directors from Washington and West Virginia, for example, reported that their states were planning aggressive outreach efforts. In Washington, state staff is developing marketing and outreach plans and is also working to develop a brand identity for Medicaid. West Virginia has started working with Enroll America to form grass-roots educational partnerships (“Enroll West Virginia”). The director from South Carolina—which is not currently planning to implement the Medicaid expansion—indicated that the state is still planning aggressive efforts to enroll people currently eligible for Medicaid but not enrolled and those who will be eligible for coverage through the new marketplace.
Other directors commented that outreach was not currently a high priority in their states, as they remained primarily focused on systems implementation. In addition, concerns were raised that aggressive outreach may not be advisable at initial implementation since it would drive higher volumes of applications to systems when they are first coming online as states and CMS are still working through implementation issues. Some also noted that outreach campaigns would need to target messaging to account for coverage options that may be available in one state but not in the next, particularly in light of some states not moving forward with the Medicaid expansion at this time.
States continue to improve their existing programs, by continuing to pursue payment and delivery reforms and by building on previous successes.
In addition to implementation of the ACA, states continue to pursue significant payment and delivery system reforms to better coordinate care for complex and high need populations. Discussion group participants cited a number of new and ongoing initiatives in their states. For example, California and Tennessee mentioned plans to pursue bundled or episodic payments. Further expansion of managed care was also mentioned by several states; South Carolina, for example, discussed converting its Medical Home Network to a capitated payment arrangement. Additionally, Washington noted efforts to coordinate performance measures between Medicaid and mental health.
A number of other states mentioned ongoing efforts to better coordinate care for dual eligible beneficiaries, either as part of the financial alignment demonstrations offered by CMS or outside of these demonstrations. States are particularly focused on better coordinating care for this population because of both the potential to improve care for this population, which is served by both Medicare and Medicaid, as well as the potential for savings. Participants in the discussion indicated that as work has continued, expectations have strengthened that such initiatives would improve the delivery of care for this population and deliver some savings for states, though states are moderating their original projections on the amount of state savings that may be achieved.
Directors highlighted the importance of recognizing the Medicaid program’s successes in connecting people to needed care and improving their health. The focus group discussion closed with discussion about the importance of recognizing the successes of Medicaid, particularly at a time when there are many misperceptions about the program. It was noted that several recent significant research studies show how Medicaid improves the access to health care and the health status of low-income and vulnerable populations, including studies demonstrating improved birth outcomes and child health as well as reduced mortality for adults.8, 9, 10, 11 However, even with these positive research findings and positive quality metrics, misperceptions about the program’s effectiveness remain and have become part of the Medicaid expansion debate, leading to calls for program reform in some states.
Overall, there was consensus that as the Medicaid expansion is implemented and states continue to make delivery and payment reforms to the program, it will be important to share the successes of the program and communicate its effectiveness in connecting people to the care they need.
Conclusion
While states are in different places on the decision to move forward with the Medicaid expansion, all states are currently hard at work preparing to implement the ACA coverage expansions and enrollment simplifications that will take effect in in January 2014. All the directors participating in the discussion stressed that that they are making every effort to be ready by 2014. Despite different degrees of readiness at the start, they will continue to improve processes over time after initial implementation. At the same time, states are also continuing to pursue payment and delivery system reforms to better coordinate care for complex populations that the program serves.
Methodology
The Kaiser Commission on Medicaid and the Uninsured convened a focus group discussion with Medicaid directors who serve on the Board of the National Association of Medicaid Directors (NAMD). The discussion focused on state progress and concerns about implementing the ACA including eligibility system changes and state action on the Medicaid expansion decision as well as activity around payment and delivery system reform, and other budget and enrollment trends. The discussion took place in May 2013. Nine Medicaid directors from the NAMD Board plus the Michigan Medicaid Director and NAMD staff participated in the discussion. The following states were represented: Arizona, California, Georgia, Indiana, Michigan, South Carolina, Tennessee, Virginia, Washington, and West Virginia.
This report was prepared by Kathleen Gifford, Michael Nardone and Vernon Smith from Health Management Associates and Laura Snyder and Samantha Artiga from the Kaiser Commission on Medicaid and the Uninsured.
Endnotes
In its June 2012 ruling in National Federal of Business v. Sebelius, the U.S. Supreme Court limited the federal government’s ability to enforce the ACA’s Medicaid expansion requirement effectively making implementation of the Medicaid expansion optional for states. ↩︎
John Holahan, Matthew Beuttgens, Caitlin Carroll and Stan Dorn, The Cost and Coverage Implications of the ACA Medicaid Expansion: National and State-by-State Analysis (Washington, DC: Kaiser Commission on Medicaid and the Uninsured, November 2012), http://modern.kff.org/medicaid/report/the-cost-and-coverage-implications-of-the/. NOTE: These estimates do not include savings states will realize from reductions in state spending for mental health and other state-funded programs, or new state revenues from increased economic activity. ↩︎
There is also concern that growth rates for the fourth quarter of 2012 and the first few quarters of 2013 are inflated due to one-time actions in response to federal tax changes related to the Fiscal Cliff as well as tax rate increases in California.
Lucy Dadayan and Donald J. Boyd, Data Alert: Strong Growth in Personal Income Tax Collections in First Quarter of 2013 but Cloudy Fiscal Outlook (New York City, NY: The Rockefeller Institute of Government, June 5, 2013), http://www.rockinst.org/newsroom/data_alerts/2013/2013-06-SRR92_data_alert_djb_v2.htm. ↩︎
The Michigan director noted that the governor, who supports expansion, proposed to deposit savings into a dedicated fund to be used to fund coverage in later years essentially making the expansion budget neutral for 21 years through the year 2034. ↩︎
Benjamin D. Sommers, M.D., Ph.D., Katherine Baicker, Ph.D., and Arnold M. Epstein, M.D., “Mortality and Access to Care among Adults after State Medicaid Expansions,” New England Journal of Medicine, 367 (Sept. 13, 2012):1025-1034. ↩︎
This study followed 10,405 persons selected in the lottery (the lottery winners) and 10,340 persons not selected (the control group). Katherine Baicker, Ph.D., and Amy Finkelstein, Ph.D., “The Effects of Medicaid Coverage – Learning from the Oregon Experiment,” New England Journal of Medicine, 365 (August 25, 2011): 683-685. ↩︎
The Affordable Care Act (ACA) of 2010 includes a number of new policies intended to substantially reduce the number of people without health insurance. Key provisions to be implemented in 2014 include new health insurance exchanges, subsidies for coverage in those exchanges, health insurance market reforms, and an individual mandate. The ACA also includes an expansion of Medicaid coverage to individuals with incomes up to 138 percent of the Federal Poverty Level ($15,856 for an individual or $26,951 for family of three in 2013).1 The Medicaid expansion under the ACA became a state option following the Supreme Court ruling in June of 2012. At this point, it is not clear how many states will elect to expand Medicaid coverage.2 If all states were to do so, enrollment in Medicaid is projected to increase nationwide by about 18.1 million and the uninsured would decline by 23.1 million.[footnote Holahan2012]
This brief provides highlights from new state and sub-state estimates of how the number and composition of individuals enrolled in Medicaid/CHIP would change with full implementation of the ACA, including the Medicaid expansion. These estimates provide more detail on the projected coverage changes under the ACA at the state level than in prior research.3 They also provide new information on the expected coverage changes resulting from the ACA at the local level in all states. This analysis demonstrates that there is substantial variation across and within states in the magnitude and composition of the population that is projected to gain Medicaid coverage under the ACA. These estimates also provide guidance on the areas that are likely to experience the largest declines in the uninsured and where the residual uninsured are likely to be concentrated.
Methods
The analysis uses the Urban Institute’s American Community Survey – Health Insurance Policy Simulation Model (ACS-HIPSM). This model simulates decisions of individuals in response to policy changes, such as Medicaid expansions, new health insurance options, subsidies for the purchase of health insurance, and insurance market reforms, using data from the American Community Survey (ACS). The estimates draw on a sample of approximately 7.5 million individuals from combined 2008, 2009, and 2010 ACS data. All three years of data were combined to achieve sufficient precision at both the state and local level. The data was reweighted so that the distribution of the population by age, race, and sex in the pooled file matches 2011 population estimates published by the Census Bureau. For more detail on the ACS-HIPSM model and the methods underlying this analysis, see the Methods Appendix. For further information, see Documentation on the Urban Institute’s American Community Survey-Health Insurance Policy Simulation Model (ACS-HIPSM).
Report
Medicaid Enrollment Increases Under the ACA
The demographic composition of Medicaid enrollees shifts under the ACA
Nationally, our model projects a 37.4 percent increase in Medicaid/CHIP enrollment under the ACA, with total enrollment rising from 48.3 million to 66.4 million.4 This enrollment includes both people newly-eligible for Medicaid coverage and also new enrollment among adults and children currently eligible for Medicaid coverage but not enrolled. The composition of individuals gaining Medicaid enrollment is projected to differ from the current distribution of individuals covered by Medicaid/CHIP, primarily due to the increased coverage of nonelderly adults, particularly those without dependent children, who have historically been excluded from coverage.5 For example, 78.0 percent of new enrollees are adults, compared to 39.3 percent of current enrollees
. Children will represent a smaller share of Medicaid/CHIP beneficiaries than they currently do. Currently, children represent a majority of enrollees in 45 states, but after the ACA implementation, only 24 states will have more than half of their enrollees under the age of 19 (data not shown).
New Medicaid enrollees will also differ from current enrollees in terms of their race/ethnicity as well as language spoken at home. For example, 55.0 percent of new Medicaid/CHIP enrollees are white non-Hispanic, compared to 43.1 percent of current enrollees
. With full implementation of the ACA, the share of the Medicaid/CHIP population that would be living in a Spanish-speaking household is expected to decline.6 Specifically, 71.8 percent of new enrollees live in households in which all adults speak only English at home compared to 66.0 percent of current Medicaid/CHIP enrollees.
Medicaid enrollment increases across and within states under the ACA
Our model projects that with full implementation of the Medicaid expansion under the ACA, Medicaid enrollment increases will vary substantially across states.7 A total of 14 states are projected to experience enrollment increases in excess of 50 percent,8 while seven states are projected to expand their Medicaid/CHIP enrollment by less than 20 percent under the ACA
.9 The current differences among states in the expansiveness of Medicaid/CHIP eligibility for adults are reflected in the varying projected changes in Medicaid/ CHIP growth among adults. Overall, Medicaid/CHIP enrollment is expected to increase among adults by 74.1 percent, ranging from under 15 percent in New York and Vermont to over 150 percent in Montana, Nevada, and Idaho
The increases in Medicaid/CHIP enrollment projected under the ACA relative to current levels vary not only by state, but also across areas within states
. State boundaries can only account for approximately 60 percent of the total variation in Medicaid/CHIP enrollment growth seen across areas.10 In many states, areas of both high and low Medicaid/CHIP enrollment growth are found. California, where the median area in terms of Medicaid/CHIP enrollment growth is 38.5 percent, contains one local area with 111.2 percent projected growth in enrollment and another with 21.1 percent projected growth, which is below the national median
Outside of Massachusetts, Medicaid/CHIP enrollment is anticipated to increase in each area of the country under the ACA, particularly among adults who may not have been eligible in the past. Nearly 40 percent of all local areas are projected to experience a doubling of their adult Medicaid/CHIP population, while 20 areas across the nation are expected to experience a tripling of their adult Medicaid/CHIP population under the ACA (data not shown).11 Most of the areas with large projected increases in their adult Medicaid/CHIP population are in states that are expected to experience well above average enrollment increases in Medicaid/CHIP.
Medicaid demographic composition changes on the local level
There is also local area variation in the composition of Medicaid enrollment after ACA implementation. For example, the share in Spanish-speaking households varies substantially across local areas, and areas in seven different states are expected to have at least half of their post-ACA Medicaid enrollees in households in which the adults speak only Spanish [Arizona (3 areas), California (22 areas), Florida (4 areas), New Jersey (2 areas), New York (2 areas), and Texas (10 areas)]. These areas face an increase in the number of Medicaid enrollees with potential linguistic barriers to both enrollment and care. For some areas with a large share of the projected Medicaid population in Spanish speaking households after ACA implementation, this will represent a major increase in the number of Medicaid enrollees with potential linguistic barriers. For example, in the Kendall/ Kendale Lakes/ Tamiami area of Florida, the Medicaid population in Spanish speaking households would be projected to increase by 60.4 percent
Projected declines in the uninsured across and within states
With full implementation of the ACA, the uninsured rate would decline by 47.1 percent nationally. Every state will experience a decrease in the uninsured of at least 25 percent, although it will vary as a consequence of different current uninsured rates and expected post-ACA uninsured rates.12 Uninsured rates currently vary from under 10 percent in Massachusetts, Hawaii, and the District of Columbia, to over 25 percent in Texas and Nevada. They will vary less after reform, with every state below 15 percent, and 7 states below 6 percent
. Currently, 264 of the 781 local areas have an uninsured rate of 20 percent or higher. The ACA would greatly compress the distribution of uninsured rates across areas both within and between states
Characteristics of the uninsured under the ACA. The composition of the uninsured is also expected to change under the ACA. For example, proportionately fewer of the remaining uninsured will be between the ages of 19 and 24 nationwide. Additionally, a higher proportion of the remaining uninsured will be Hispanic and in Spanish-speaking households
The data permit detailed estimates to be constructed for each state. As an example of how these estimates can be used to understand variation within states, we analyze results from two states, Texas and Illinois. Both states show wide variation in the effects of the ACA among local areas. Texas has 59 different local areas within the state, and Illinois has 29 local areas.
Texas
With full implementation of the Medicaid expansion in Texas, Medicaid/CHIP enrollment is projected to increase by 50.7 percent (from 3.9 million to 5.8 million), with 76.1 percent of the new enrollment occurring among adults ages 19 to 64. On average, the Texas Medicaid/CHIP population under full ACA implementation is projected to be more likely to be white non-Hispanic and to speak English relative to the pre-implementation Medicaid population
. The areas within Texas that would experience the largest growth in Medicaid/CHIP enrollment under the ACA include Collin, Randall, Fort Bend, and Brazos Counties, each in very different parts of the state. Growth in Medicaid coverage of adults drives most growth in total enrollment in local areas with large increases. Overall, Medicaid enrollment among nonelderly adults would grow by 147.5 percent in Texas under the ACA , with growth rates between 82.3 and 324.8 percent for areas within Texas
With full implementation of the ACA, the uninsured rate is projected to fall by 46.8% percent in Texas. Each of the 59 local areas within Texas are expected to see a decline of 40 percent or greater in their uninsured rate, and 22 areas would see their uninsured rate decline by more than 50 percent
. Fully 35.4 percent of the total expected decline in the uninsured would occur in the counties containing Texas’ three largest cities of Houston (Harris County), Dallas (Dallas County), and San Antonio (Bexar County), which together account for 1.0 million of the expected 2.9 million expected to gain coverage in Texas under the ACA (data not shown). With ACA implementation that includes the expansion of Medicaid, the uninsured rate in the state of Texas would be 14.3 percent, higher than the expected national rate of 9.6 percent, but a marked decline compared to the pre-reform rate in Texas of 26.8 percent
Illinois
In Illinois, with full implementation of the ACA and the Medicaid expansion, Medicaid/CHIP enrollment is expected to increase by over 33 percent, or by about 696,000 new enrollees. Among nonelderly adults 19-64, enrollment is expected to increase by 69.4 percent. Total Medicaid enrollment post-ACA is estimated to be almost 2.8 million individuals, with the large majority of new enrollees expected to be white, non-Hispanic and adult. Unlike in Texas, the majority of new enrollees are projected to reside in households where everyone speaks English
. The area in Illinois with the largest projected increase in Medicaid/CHIP enrollment under the ACA is Champaign County. Other than McLean County in the central part of the state, the remaining top five areas are all part of the greater-Chicago region. More so than in Texas where, with several exceptions, most areas can anticipate a high share of post-reform Medicaid enrollees to come from Spanish speaking households, the language distribution in Illinois is much more varied across areas. Some areas, especially in the greater-Chicago region, are projected to have a high share of Medicaid enrollees in Spanish speaking households. The Cicero/ Berwyn/ Oak Park Area slightly west of Chicago would have almost half their Medicaid enrollees in such households, whereas 9 areas are projected to have less than 5 percent of their enrollees in such households
The uninsured rate in Illinois is projected to decrease 45.4 percent, or by about 814,000 individuals, with the full implementation of the ACA. Every area is expected to experience a decrease in their uninsured rate greater than 35 percent. In over 10 areas, the decline is projected to exceed 50 percent. The post-reform rate of uninsured is not expected to be uniform across areas. Three areas within Chicago are expected to have uninsured rates persisting above 14 percent, whereas two counties in the central part of the state, Tazewell and McLean County, are projected to have rates below 5 percent
Health systems will need to prepare for coverage expansions and changes in the composition of the Medicaid population
We find substantial variation within states in the projected size of Medicaid enrollment gains under the ACA and in the composition of the population that would be newly covered by Medicaid/CHIP. Particular attention will be needed to assess whether Medicaid provider networks are sufficient to meet the needs of the new populations who would be served under the ACA. Most of those gaining Medicaid are expected to be adults, whose service needs likely differ substantially from those of the children who currently predominate in many state Medicaid programs.
Our analysis suggests that health care networks in certain areas may face greater linguistic complexity with respect to the Medicaid/CHIP enrollees they would be serving under the ACA. Given that prior research has shown that language barriers can have a significant negative impact on access and use of care, it will be important to consider the geographic concentration of certain language groups in designing provider networks and services.13
Increases in Medicaid, as well as private insurance gains anticipated under the ACA, may put pressure on local health care systems to provide adequate access to care.14 Many of those newly insured under Medicaid may have primary care needs that had not been well addressed in the prior period when they were uninsured.15 Our estimates show substantial local variation in both the number of new Medicaid enrollees and their characteristics. With the growth in the Medicaid population that is expected under the ACA, it will be important to track the extent to which supply of services keeps pace with demand. While the ACA includes provisions to address provider capacity within Medicaid, such as increased financing for federally qualified health centers and increases in primary care reimbursement rates, other policy changes may be needed to meet the health care needs of Medicaid enrollees.
Medicaid/CHIP Enrollment Gains have Potential to Expand Access to Care
Almost 73 percent of the new Medicaid coverage expected under the ACA draws from the ranks of the uninsured (data not shown). Currently, these groups go without needed care at much higher rates than those who have Medicaid coverage. Therefore, the acquisition of Medicaid coverage under the ACA should reduce the extent of unmet health needs and financial health burdens experienced by the low-income population and increase the extent to which they receive preventive and other types of needed care. However, the declines in the uninsured that are estimated here depend on full implementation of the ACA. The states that choose not to expand Medicaid will experience much smaller increases in Medicaid enrollment and associated declines in the uninsured than reflected in these estimates, which will place greater demands on the safety net. Moreover, this analysis shows that even with full implementation of the ACA, local areas in AZ, CA, FL, and TX can still expect to have one in every five people without health insurance coverage. The adequacy of the safety net will remain an important policy concern, particularly in local areas where high rates of the uninsured persist.
Conclusion
Our ACS-based simulation projects that an additional 18.1 million would enroll in Medicaid/CHIP coverage under full implementation of the ACA, assuming all states expand Medicaid eligibility to 138 percent FPL. Our analysis provides new information on the extent to which these gains would vary across the country and show how the demographic and socioeconomic characteristics of the population covered by Medicaid/CHIP could change under the ACA. This analysis also highlights the extent to which uninsured rates could decline across states and in all local areas. Capacity and access issues will be important on the local levels as individuals who were previously uninsured now have coverage, and their needs may differ based on the changing demographic of enrollees. Without full implementation of the ACA, many states and local areas will continue to see higher uninsured rates.
This research draws on work completed for the Kaiser Commission on Medicaid and the Uninsured. The authors gratefully acknowledge the funding of the Robert Wood Johnson Foundation for contributing to the development of the Urban Institute’s Health Policy Center’s American Community Center (ACS) Health Insurance Policy Simulation Model (ACS-HIPSM). The authors appreciate the research contributions and advice of Fredric Blavin, Linda Blumberg, John Holahan, Jennifer Haley, Caitlin Carroll, and Nathaniel Anderson to the development of the ACS-HIPSM simulation model and the construction of geographic areas on the ACS and the helpful advice of Rachel Garfield and Rachel Licata in developing the estimates for the website.
Data Sources
Data Sources
The American Community Survey. Pooled American Community Survey (ACS) data from 2008, 2009, and 2010 form the core data set for this model and the resultant estimates. The ACS is an annual survey fielded by the United States Census Bureau with a reported response rate of 98.0 percent in 2009.16 The estimates presented here are derived from the data that were collected from approximately 2.5 million non-elderly sample respondents (ages 0 to 64) in the civilian non-institutionalized population each year, yielding a total sample of approximately 7.5 million. The ACS is a mixed mode survey that includes households with and without telephones (landline or cellular.) The ACS is designed to be state-representative, including samples from each county in the country.
Since 2008, the ACS has asked respondents about the health insurance coverage status at the time of the survey of each individual in the household. In an effort to correct for potential measurement errors in the ACS coverage data and to define coverage as including only comprehensive health insurance as opposed to single-service plans (e.g., dental coverage), we apply a set of logical coverage edits in the cases where other information collected in the ACS implies that coverage for a sample case likely has been misclassified.17 The edits target under-reported Medicaid/CHIP coverage among children and over-reported non-group coverage among both adults and children, which in turn, affect other coverage types. We draw from approaches that have been applied to other surveys18 and build on ACS edit rules used by the Census Bureau.19
American Community Survey-Health Insurance Policy Simulation Model. We use the Urban Institute’s American Community Survey – Health Insurance Policy Simulation Model (ACS-HIPSM) to estimate the effects of the ACA on the non-elderly at the state and local level.20 The ACS-HIPSM model builds off of HIPSM, which uses the Current Population Survey (CPS) as its core data source, matched to several others, including the Medical Expenditure Panel Survey-Household Component (MEPS-HC). We apply the micro-simulation approach developed in HIPSM/CPS to model decisions of individuals in response to policy changes, such as Medicaid expansions, new health insurance options, subsidies for the purchase of health insurance, and insurance market reforms with data from the ACS. With the large ACS sample, we are able to produce more precise estimates for state and sub-state areas than available from models based on other data sources. Under our model, eligibility for Medicaid/CHIP and exchange subsidies are simulated using ACS data from 2008, 2009, and 2010 based on state-level eligibility guidelines for Medicaid and CHIP in 2010 and available information on the regulations for implementing the ACA.
We combine three years of ACS data to achieve sufficient precision at the state and local level. This process involves adjusting all dollar amounts such as income and wages to 2011 levels using the Consumer Price Index (CPI-U) and reweighting the combined file so that the distributions of demographic, employment, income, and health insurance coverage in the merged file match those of the 2011 ACS.
We simulate the main coverage provisions of the ACA as if they were fully implemented and the impacts were fully realized and compare the results to the model’s pre-reform baseline results. The HIPSM models use a micro-simulation approach based on the relative desirability of the health insurance options available to each individual and family under reform, taking into account a number of factors such as premiums and out-of-pocket health care costs for available insurance products, health care risk, whether or not the individual mandate would apply to them, and family disposable income.
Medicaid/CHIP Eligibility Simulation Model.We use The Urban Institute Health Policy Center’s ACS Medicaid/CHIP Eligibility Simulation Model to simulate pre-ACA eligibility for Medicaid/CHIP by comparing family income and other characteristics to the Medicaid and CHIP rules in each sample person’s state of residence.21 The model uses available information on eligibility guidelines, including income thresholds for the appropriate family size,22 asset tests, parent/family status, and the amount and extent of income disregards for each program and state in place as of the middle of each year.23 The model takes into account disregards for child care expenses, work expenses, and earnings in determining eligibility, but does not take into account child support disregards. For non-citizens, the model also takes into account length of U.S. residency in states where term of residency is a factor in eligibility.24 Because the ACS does not contain sufficient information to determine whether an individual is an authorized immigrant and therefore potentially eligible for Medicaid/CHIP coverage, we impute documentation status for non-citizens based on a model developed using CPS ASEC data.25
Estimates from our ACS models of pre-ACA eligibility have been extensively benchmarked to assess their validity and have been found to line up with those from other sources; for instance, despite the differences between the ACS and the CPS ASEC, the models from the two surveys produce fairly comparable results in terms of participation rates and the number of uninsured children who are eligible for Medicaid/CHIP but not enrolled for the same time frame.26 The number and characteristics of individuals according to their eligibility for Medicaid/CHIP and their eligibility pathway (Medicaid vs. CHIP, etc.) are also quite similar across the two models.
Projections of Eligibility Under the ACA. Under the ACA, income eligibility will be based on the Internal Revenue Service tax definition of modified adjusted gross income (MAGI) and will include the following types of income for everyone who is not a tax-dependent child: wages, business income, retirement income, Social Security, investment income, alimony, unemployment compensation, and financial and educational assistance. The ACS asks only indirectly about unemployment compensation, alimony, and financial and educational assistance when it asks about “other income” so we imputed income from other sources using a model developed for the CPS which has more detail on income sources than the ACS.
To compute family income as a ratio of the poverty level, we sum the person-level MAGI across the tax unit.27 In situations where a dependent child is away at school, the ACS does not contain data on the family income and other family information on the child’s record or the presence of the dependent child on the records of family members, so we assign some college students to families before beginning the simulation. Eligibility for Medicaid or subsidies under the ACA also depends on immigration status; HIPSM uses documentation status imputations described above.
We simulate ACA eligibility for adults and children for the eligibility pathways which correspond roughly to the order in which we expect eligibility to be determined. For children, we check for disability (SSI or Aged/Blind/Disabled eligibility under current rules), new Medicaid eligibility (family income up to 138 percent of FPL and meets immigration requirements), CHIP eligibility under current rules, and other eligibility under current rules, otherwise known as maintenance-of-eligibility. For adults, we check for disability (SSI or Aged/Blind/Disabled eligibility under current rules), Title IV-E/foster care, new Medicaid eligibility, and maintenance-of-eligibility.28
We model subsidy eligibility, which depends on whether the family was offered affordable health insurance benefits, based on imputations of the presence of an insurance offer in the family and the value of the employee’s contribution towards the cost of the insurance premium among those with ESI. We impute offer status using regression models estimated from CPS data collected in 2005, the last year that the CPS included information on ESI offers in its February supplement. We first impute firm size on the ACS because offers are highly dependent on firm size. Similarly, we impute policyholder status to people in families with ESI because the ACS does not ask whose job offered the ESI.
Projections of Health Insurance Coverage Under the ACA.Once we have modeled eligibility status for Medicaid/CHIP and subsidized coverage in the exchanges, we use HIPSM to simulate the decisions of employers, families, and individuals to offer and enroll in health insurance coverage. To calculate the impacts of reform options, HIPSM uses a micro-simulation approach based on the relative desirability of the health insurance options available to each individual and family under reform.29 The approach (known as a “utility-based framework”) allows new coverage options to be assessed without simply extrapolating from historical data, as in previous models. The health insurance coverage decisions of individuals and families in the model take into account a number of factors such as premiums and out-of-pocket health care costs for available insurance products, health care risk, whether or not the individual mandate would apply to them, and family disposable income. Our utility model takes into account people’s current choices as reported on the survey data. We use such preferences to customize individual utility functions so that their current choices score the highest, and this in turn affects behavior under the ACA. The resulting health insurance decisions made by individuals, families, and employers are calibrated to findings in the empirical economics literature, such as price elasticities for employer-sponsored and non-group coverage.
The first stage in the simulation process is to estimate additional enrollment in Medicaid and CHIP, both by those gaining eligibility under the ACA and those who are currently eligible, but not enrolled. Many characteristics are used to determine take-up, but the two most important are new eligible status and current insurance coverage, if any. The ACA includes a number of policies aimed at promoting enrollment, including a “no wrong door” enrollment policy whereby children and families will be screened and evaluated for Medicaid, CHIP, and subsidy eligibility no matter whether they apply for coverage (through Medicaid, CHIP or an exchange); new outreach funding; and procedures that minimize application and enrollment barriers. As a consequence, the model projects that Medicaid/CHIP participation rates will rise under the ACA for children and nonelderly adults who are eligible for Medicaid under current rules (see Holahan, Buettgens et al. 2012 for more on this issue.) While the HIPSM model projects that participation among children and non-elderly adults will increase with full implementation of the ACA, it projects that some individuals will remain uninsured despite being eligible for Medicaid/CHIP coverage. In subsequent stages, we model the following sequentially: enrollment in the non-group exchange, additional enrollment of the uninsured in employer-sponsored coverage, additional enrollment of the uninsured in non-group coverage outside of the exchange, transitions from single to family ESI and transition from non-group to ESI.
Geographies Used for Local Estimates
The geographies used for this analysis are constructed from available county-level information and Super Public Use Microdata Area (SuperPUMA) definitions on the 2008, 2009, and 2010 pooled American Community Survey. The 531 SuperPUMAs are made up of combinations of the more than 2,000 PUMAs. PUMAs and SuperPUMAs have been defined by Census in conjunction with state and local governments to reflect areas that generally follow the boundaries of county groups, single counties, or census-defined “places,” constrained by the necessity to have a minimum population size (100,000 for PUMAs, 400,000 for SuperPUMAs). County of residence is available on the public-use files for residents of 374 counties, which together account for about 60% of the US population. Identifiable counties all have a population of at least 100,000, and include many of the nation’s largest counties, but do not include all such counties.
In defining local geographies, our methodology uses the county of residence to define a sub-state area unless the county is larger than one of its constituent SuperPUMAs, in which case the SuperPUMA is assigned as the geographic unit instead. When a SuperPUMA is partially composed of an identifiable county according to the rules above, a “Rest of SuperPUMA” area is assigned to individuals in the SuperPUMA who do not reside in the identifiable county. In five small states that are composed of just one SuperPUMA (AK, DC, SD, VT, and WY), we constructed two sub-state areas in each state based on the PUMA definitions for the state.
The result is that each individual is assigned to either a county or an “other area” which could be either: a full SuperPUMA, a “Rest of SuperPUMA,” or a specially constructed area. No resulting area is smaller than 100,000, and none is larger than the largest SuperPUMA of approximately 400,000 people. This yields 781 mutually exclusive geographies which span the entire US
. The states with the largest number of local geographies are California, for which we have defined 78 sub-state areas using the above described methods, followed by Texas and Florida, with 59 and 48 sub-state areas, respectively. We assigned non-county geographies names based on the cities/towns/etc. that are located in the area. We also separately provide estimates for all 374 counties that are identifiable in the ACS.
Individual and Family Characteristics
The estimates that are available on kff.org/zooming-in-aca explore the composition of 1) individuals with Medicaid coverage/who were uninsured before implementation of the major coverage provisions of the ACA, 2) individuals who are projected to gain Medicaid under the ACA, and 3) individuals with Medicaid/who were uninsured after implementation of the ACA with respect to the following characteristics:
Age—Reported age of individual defined categorically (between 0-18, 19-24, 25-44, or 44-64).
Race—Reported race of individual. We define anyone who reported being “Hispanic” or “Latino” as Hispanic, and define single race-only for self-identified white or black respondents. Other ethnicities or those identifying multiple ethnicities are classified as “Other” race or ethnicity.
Gender—Reported gender of individual.
Language spoken at home—Reported language spoken at home by residents of the household aged 19 to 64. We define households where only English is spoken, only Spanish is spoken, English and some other language are spoken, or no English and not exclusively Spanish are spoken.
In this brief, we present estimates for all states; estimates are also presented for Texas and Illinois to spotlight the local variation in ACA impacts within a particular state. We also provide estimates of the share of Medicaid/CHIP enrollees who live in Spanish-speaking households to highlight the variation in the demographic and socio-economic composition of enrollees within states. We report estimates for all geographies with sufficient sample size to provide reliable estimates along these socio-demographic dimensions. Additional dimensions were modeled for this population but the data was not published. Our sample size cutoff for estimate suppression was 150 respondents in that cell in the geographic area. Only estimates of those newly gaining Medicaid under reform (between 5 and 10 percent of all geographies) were suppressed by this rule.
Limitations
Both the baseline and the ACA estimates presented here have a number of limitations, including measurement error in reported health insurance coverage on the ACS, which may not be fully addressed by the edits that were implemented and in the Medicaid and CHIP eligibility simulation model. Efforts to simulate eligibility for public coverage based on survey data are inherently challenging, particularly for adults. Challenges include misreporting of income, insurance coverage, or other information used to model eligibility and lack of specific information needed to simulate all the pathways to eligibility. The ACS, like many other surveys, does not contain information on such factors as pregnancy status, legal disability status,30 child support amounts, whether custodial parents meet child support cooperation requirements, medical spending (which would be used to calculate spend-down for medically needy eligibility), and duration of Medicaid enrollment or income history to determine Transitional Medical Assistance (TMA) and related eligibility. Finally, there is additional uncertainty in any projection of ACA coverage impacts related to difficulties associated with predicting take up of different types of coverage under the ACA, federal and state actions that could number of implementation issues related to state and federal actions and guidance and a host of behavioral responses that are difficult to predict.
Endnotes
Based on the IRS tax definition of modified adjusted gross income (MAGI)—for more details on MAGI income definition, see: Buettgens, M., D. Resnick, V. Lynch, and C. Carroll. 2013. Documentation on the Urban Institute’s American Community Survey Health Insurance Policy Microsimulation Model (ACS-HIPSM.) The Urban Institute. Washington DC. ↩︎
Sommers, B.D. and A.M. Epstein. 2010. “U.S. Governors and the Medicaid Expansion — No Quick Resolution in Sight.” New England Journal of Medicine 368(6): 496-499. ↩︎
Clemans-Cope, C., G. Kenney, M. Buettgens, C. Carroll, and F. Blavin. 2012. The Affordable Care Act’s Coverage Expansions Will Reduce Differences In Uninsurance Rates By Race And Ethnicity. Health Affairs, 31(5): 920-930; Holahan, Buettgens et al. 2012; Holahan, J. and I. Headen. 2010. “Medicaid Coverage and Spending in Health Reform: National and State-by-State Results for Adults at or Below 133% FPL.” Washington, DC: Kaiser Commission on Medicaid and the Uninsured.; Dorn, S. and M. Buettgens. 2011. “Net Effects of the Affordable Care Act on State Budgets” Washington, DC: The Urban Institute. ↩︎
These national estimates are consistent with other models of Medicaid enrollment increases under the ACA: Blavin F., M. Buettgens, and J Roth. 2011. “State Progress Toward Health Reform Implementation: Slower Moving States Have Much to Gain.” Washington, DC: The Urban Institute; Holahan, Buettgens et al. 2012. ↩︎
While pathways through which childless adults can gain access to Medicaid coverage have existed, they’ve been limited to special categories of individuals and in most states income-based eligibility for childless adults has been very limited or nonexistent. ↩︎
Spanish-speaking households are defined as households in which all the non-elderly adults speak Spanish. ↩︎
This excludes Massachusetts, which we model as experiencing no change in Medicaid enrollment as a result of the ACA. ↩︎
When we partition the total variation in area-level Medicaid/CHIP percent increases between within and across state variation, we find that variation within states accounts for 40.4 percent of the total. The rest (59.6 percent) is attributed to across state variance. ↩︎
The areas with large percentage increases in their Medicaid/CHIP population do not correspond perfectly to the areas with the largest absolute Medicaid/CHIP population increases because of variation in reliance on Medicaid at baseline. ↩︎
Except in Massachusetts, which, as indicated above, we model as exhibiting no change due to reform. ↩︎
Ponce, N., L. Ku, W. Cunningham, and R. Brown. 2006. Language Barriers to Health Care Access Among Medicare Beneficiaries. Inquiry, 43(1): 66-76. ↩︎
Ku, L., K. Jones, P. Shin, B. Bruen, and K. Hayes. 2011. “The States’ Next Challenge — Securing Primary Care for Expanded Medicaid Populations.” New England Journal of Medicine, 364: 493-495. ↩︎
US Census Bureau. 2009. American Community Survey. ↩︎
Lynch V, and G. Kenney. 2011. “Improving the American Community Survey for Studying Health Insurance Reform.” Proceedings of the 10th Conference on Health Survey Research Methods, April 2011, Atlanta, GA. Hyattsville, MD.: Department of Health and Human Services; Lynch V., G. Kenney, J. Haley, and D. Resnick. 2011. Improving the Validity of the Medicaid/CHIP Estimates on the American Community Survey: The Role of Logical Coverage Edits. Submitted to the U.S. Census Bureau. ↩︎
National Center for Health Statistics, Division of Health Interview Statistics. 2005. 2004 National Health Interview Survey (NHIS) Public Use Data Release Survey Description. Hyattsville, MD: National Center for Health Statistics. ↩︎
Lynch V, M. Boudreaux, and M. Davern. 2010. “Applying and Evaluating Logical Coverage Edits to Health Insurance Coverage in the American Community Survey.” Suitland, MD.: U.S. Census Bureau, Housing and Household Economic Statistics Division. ↩︎
For a description of ACS-HIPSM, see: Buettgens, M., D. Resnick, V. Lynch, and C. Carroll. 2013. Documentation on the Urban Institute’s American Community Survey Health Insurance Policy Microsimulation Model (ACS-HIPSM.) The Urban Institute. Washington DC. ↩︎
Kenney G., V. Lynch, A. Cook and, S. Phong. 2010. “Who And Where Are The Children Yet To Enroll In Medicaid And The Children’s Health Insurance Program?” Health Affairs 29(10):1920-1929.Kenney, G., M. Buettgens, J. Guyer, and M. Heberlein. 2011. “Improving Coverage For Children Under Health Reform Will Require Maintaining Current Eligibility Standards For Medicaid And CHIP.” Health Affairs, 30(12): 2371-2381; Kenney G., V. Lynch, J. Haley, M. Huntress, D. Resnick, and C. Coyer. 2011. “Gains for Children: Increased Participation in Medicaid and CHIP in 2009.” Washington, DC: The Urban Institute; Kenney G., V. Lynch, J. Haley, and M. Huntress. 2012. “Variation in Medicaid Eligibility and Participation among Adults: Implications for the Affordable Care Act.” Inquiry, 49(3): 231-253. ↩︎
Family-level characteristics used in determining pre-ACA eligibility, such as income, are based on the family groupings that states define during the process of determining eligibility under pre-ACA rules. However, indicators for “family” characteristics discussed in this paper refer to the family unit that is generally eligible for the same private plan, known as the health insurance unit (HIU). Eligibility for CHIP coverage is defined according to whether the child meets the income, asset, and documentation requirements for coverage and does not take into account whether the child might be subject to a waiting period. ↩︎
Cohen Ross, D., M. Jarlenski, S. Artiga, and C. Marks. 2009. “A Foundation for Health Reform: Findings of a 50 State Survey of Eligibility Rules, Enrollment and Renewal Procedures, and Cost- Sharing Practices in Medicaid and CHIP for Children and Parents During 2009.” Washington, D.C.: Kaiser Commission on Medicaid and the Uninsured; Heberlein et al., 2011, 2012; Kaiser Commission on Medicaid and the Uninsured. 2010. Expanding Medicaid to Low-Income Childless Adults under Health Reform: Key Lessons from State Experiences. Publication No. 8087. Washington, D.C.: Kaiser Commission on Medicaid and the Uninsured; Kaiser Commission on Medicaid and the Uninsured. 2011. Where are States Today? Medicaid and CHIP Eligibility Levels for Children and Non-Disabled Adults. Publication No. 7993-02. Washington, D.C.: Kaiser Commission on Medicaid and the Uninsured. ↩︎
National Immigration Law Center. 2011. Table: Medical Assistance Programs for Immigrants in Various States. ; Sullivan, J. 2010. “Expanding Coverage for Recent Immigrants: CHIPRA Gives States New Options.” Washington, DC: Families USA.; Heberlein, M., T. Brooks, J. Guyer, S. Artiga, and J. Stephens. 2011. Holding Steady, Looking Ahead: Annual Findings of a 50-State Survey of Eligibility Rules, Enrollment and Renewal Procedures, and Cost-Sharing Practices in Medicaid and CHIP, 2010–2011. Washington, D.C. Kaiser Commission on Medicaid and the Uninsured; Heberlein, M., T. Brooks, J. Guyer, S. Artiga, and J. Stephens. 2012. Performing Under Pressure: Annual Findings of a 50-State Survey of Eligibility, Enrollment, Renewal, and Cost-Sharing Policies in Medicaid and CHIP, 2011–2012. Washington, D.C.: Kaiser Commission on Medicaid and the Uninsured. ↩︎
Documentation status is imputed to immigrants in two stages using individual and family characteristics, based on an imputation methodology that was originally developed by Passel (Passel and Cohen, 2008). The approach is designed to produce imputations that match, in the aggregate, published summary estimates of the U.S. undocumented population, nationally and in a subset of large states. ↩︎
Kenney, G., V. Lynch, A. Cook, and S. Phong. 2010b. Who And Where Are The Children Yet To Enroll In Medicaid And The Children’s Health Insurance Program? Health Affairs, 29(10): 1920-1929. ↩︎
We use “tax unit” and “HIU” or “health insurance unit” interchangeably in this report. ↩︎
Based on the most recent regulations as of this analysis, we assume maintenance-of-eligibility for children and for adults not above 138% FPL in an 1115 waiver or limited benefit program (federally- or state-funded programs that offer substantially more limited medical services, higher cost sharing, or other limitations). ↩︎
We apply this simulation approach to all individuals except those in Massachusetts, whom we assume will experience no change in health insurance status due to ACA implementation. ↩︎
States’ determinations of disability-related eligibility use additional criteria than the indicators of functional limitations available on the ACS. Thus, some of the sample people who appear in our model to be eligible through the disability pathway might not qualify when the more detailed information on their characteristics is taken into account. ↩︎
In March 2013, the Kaiser Family Foundation convened key HIV/AIDS stakeholders from a variety of backgrounds to explore opportunities for maximizing the beneficial impact of the Affordable Care Act (ACA) for people living with HIV and examine strategies to help them navigate the transition to new health coverage. This report summarizes the information shared and key issues discussed at the meeting.
The Senate Committee on Appropriations approved, by a vote of 23-7, the FY 2014 State and Foreign Operations Appropriations bill (S.1372), which includes funding for U.S. global health programs at the U.S. Agency for International Development (USAID) and the State Department (see table below) comprising a significant portion of U.S. funding for global health (total funding for global health is not currently available as some funding provided through USAID, HHS, and DoD is not yet available).
According to a Committee Report accompanying the bill and a summary released by the Committee, funding for global health programs at USAID and the State Department would be $140 million (2%) above the President’s request and $280 million (3%) above the related House appropriations bill. Funding for PEPFAR at the State Department, which supports bilateral programs and the Global Fund to Fight AIDS, Tuberculosis and Malaria (Global Fund), is at the same level as both the President’s request and the related House appropriations bill. Funding in the bill for tuberculosis, neglected tropical diseases (NTDs), pandemic influenza, maternal and child health (MCH), and polio are above the President’s request. Total funding for family planning and reproductive health (FP/RH) programs in the bill, which includes $40 million for UNFPA, is above both the President’s request and the House appropriations bill.
Note: Final FY 2013 amounts are not yet available.*Represents combined PEPFAR funding (HIV bilateral and Global Fund) at the State Department.**FY 2012 FP/RH funding was enacted at “not less than” $610 million; according to ForeignAssistance.gov (accessed 7/19/14), the Administration had planned to provide $638 million for FP/RH in FY 2012. The House FY 2014 State and Foreign Operations bill states that “Of the funds appropriated by this Act, not more than $461,000,000 may be made available for family planning/reproductive health.”***In FY12, Congress approved $35m in funding for UNFPA. However, due to policy conditions put in place by Congress annually, the actual contribution to UNFPA totaled $30.2m.
Development of the Financial Alignment Demonstrations for Dual Eligible Beneficiaries: Perspectives from National and State Disability Stakeholders
Authors:
Jeffrey S. Crowley, O'Neill Institute for National and Global Health Law, Georgetown University Law Center, MaryBeth Musumeci, and Erica L. Reaves
As part of the implementation of the Affordable Care Act, 26 states submitted proposals to the Centers for Medicare and Medicaid Services (CMS) to implement demonstrations to integrate care and align financing for beneficiaries who are dually eligible for Medicare and Medicaid; as of July 2013, six states have received approval from CMS to implement a demonstration, and 16 proposals remain pending review. Given the degree of interest in these demonstrations, we sought to identify common issues and potential solutions to inform other states as they develop and implement demonstrations. With an emphasis on illuminating the specific concerns of beneficiaries under age 65 and those who use long-term services and supports, we conducted a series of 26 structured interviews with national and state disability stakeholders from October 2012 through January 2013. Respondents included representatives of cross disability coalitions and organizations representing people with physical, mental health, and developmental disabilities, as well as legal services providers. In addition to representatives of national organizations, we focused on examining the experience to date in Colorado, Massachusetts, Michigan, Ohio, and Washington. This issue brief provides an early snapshot into disability community perspectives on state design and implementation efforts related to the new demonstrations.