KFF designs, conducts and analyzes original public opinion and survey research on Americans’ attitudes, knowledge, and experiences with the health care system to help amplify the public’s voice in major national debates.
The August 2013 Visualizing Health Policy infographic provides an informational snapshot of long-term services and support (LTSS) for seniors in the United States. This includes information about the number and proportion of seniors who will need LTSS because of physical and cognitive impairment, the role of unpaid family caregivers in providing the majority of LTSS, the role of Medicaid (not Medicare) as the primary payer for LTSS, the shifting of Medicaid spending from institutional-based care toward community-based care, and the fact that 35% of US adults 40 years or older say they have set aside money for their long-term needs.
Visualizing Health Policy is a monthly infographic series produced in partnership with the Journal of the American Medical Association (JAMA). The full-size infographic is freely available on JAMA’s website and is published in the print edition of the journal.
The Grammy Award-winning artist joins with local residents and leaders, the music and faith communities, and elected officials to come together to tackle HIV’s disproportionate impact in communities of color.
NEW YORK, Aug. 22, 2013 — Grammy Award-winning artist and advocate Alicia Keys rallied with community leaders and residents of Harlem today, hosting a community conversation aimed at tackling the issue of HIV/AIDS. Hosted by Harlem Hospital together with Greater Than AIDS, Ms. Keys was joined by Congressman Charlie Rangel (D-NY); Denise Soares, the Executive Director of Harlem Hospital; Minister Vin Baker of the Abyssinian Baptist Church in Harlem; Dr. Helene Gayle; Russell Simmons; and Greater Than AIDS ambassador Stephanie Brown, in an open and honest discussion with residents of Harlem about HIV/AIDS, its impact in the community, and the stigma that often surrounds the disease.
In Harlem, as nationally, people of color have been disproportionately affected by HIV/AIDS. The large majority of people living with HIV in Harlem are Black or Hispanic. In 2011, the most current year data is available, the rate of HIV diagnosis per 100,000 population was 4 to 5 times higher in Harlem as compared to the nation overall.
Speaking to an energetic crowd of over 400 at Harlem Hospital, the speakers stressed the urgency of addressing HIV/AIDS in communities of color. The event brought together different parts of the community– faith and political leaders, social and health care advocates, artists and young people – to break down the barriers of stigma, fear and ignorance and promote HIV testing and treatment for those who are positive. Following the community conversation, Alicia Keys, Congressman Rangel and Dr. Gayle joined with community residents to get tested as part of a free on-site HIV screening being offered by Harlem Hospital.
“There are serious misconceptions out there that keep HIV/AIDS in the shadows,” said Keys. “Each and every one of us has to come together to change that. There is no reason that Black and Hispanic people should continue to be affected like this. By talking about HIV/AIDS honestly and openly, we can overcome stigma and fear and start a real dialogue that allows us to know, learn and share the truth.” Earlier this year, Ms. Keys joined with Greater Than AIDS to launch EMPOWERED, a new campaign to reach women in the U.S. about HIV/AIDS and highlight their power in changing the course of the epidemic.
“We cannot sit idly as this epidemic continues to spread,” said Congressman Rangel. “In fact, the fight against HIV/AIDS is one of my highest priorities in Congress. Recently I introduced the Communities United with Religious Leaders for the Elimination of HIV/AIDS (CURE) Act. It would authorize the U.S. Department of Health and Human Services and the National Institutes of Health to provide grants to health agencies, and community and faith-based organizations for education, outreach, research, and testing activities related to HIV/AIDS prevention. I urge my colleagues in Congress to put politics aside and act on this important issue. But all of us, from all corners of society, need to do more. I will continue to fight for those afflicted with HIV/AIDS and will work tirelessly until the day we have a cure.”
“We know AIDS is caused by a virus that attacks the immune system. But societal factors are among the leading reasons why some populations are more impacted by HIV than others,” said Dr. Helene Gayle, president and CEO of CARE USA. “We know there are a variety of reasons why communities of color are disproportionately affected by HIV and AIDS. They are some of the same reasons that our communities are disproportionately impacted by other diseases—social and economic factors, including poverty. For example, African Americans are more likely than whites to be uninsured, less likely to be privately insured and have access to high quality services, and are more likely to postpone medical care due to lack of transportation resources and other competing needs. But these types of underlying societal factors can be changed. They must be changed, by all of us.”
“The faith community plays a crucial role in this conversation,” said Vin Baker, a former NBA all-star who is now a minister at Abyssinian Church in Harlem. “We need to encourage our families to talk about HIV and AIDS, to remove the unnecessary stigma around it. And most importantly, we need to support our brothers and sisters who live with it.”
“We have a responsibility to ourselves, to our friends, and to our community to become educated on the impacts of HIV/AIDS,” said Russell Simmons, hip-hop icon and co-founder of Def Jam Recordings. “And the hip-hop community has an important role to play in that. We have to make sure we promote love and tolerance, not fear and stigma. We have to stand in solidarity with our HIV positive brothers and sisters. As Alicia said, artists have a responsibility we’ve got to fight for others.”
EMPOWERED, the cross-platform public information campaign Ms. Keys developed with Greater Than AIDS, speaks to both those affected by HIV/AIDS and allies in the fight about what can be done to change the course of the disease. It includes outreach through public service ads, social media and community programs. With a particular focus on women, EMPOWERED encourages increased knowledge and understanding about HIV and AIDS, open communications with family and friends, use of protection, regular testing and adherence to treatment for those living with the disease.
“When I got infected, I wasn’t educated at all about HIV,” said Stephanie Brown, an artist and advocate who serves as an ambassador for Greater Than AIDS and EMPOWERED. Stephanie, who learned she was HIV positive at 19, joined the campaign earlier this year. “It was rough. Thinking about the idea that nobody wants you, it was like this whole new life I had to start living. At first I didn’t even want to start treatment. But it was what I had to do. What made me start fighting back though was the silence, the fact that no one was talking about it. That’s when I decided to share my experience and speak up for myself and for others who can’t. That’s why I joined EMPOWERED. Sympathy needs to be taken out of HIV. We need to start getting mad about it.”
During the 90-minute forum, audience members were encouraged to engage with panelists and ask questions about HIV/AIDS and the launch of the campaign. One audience member asked Keys: “What do you hope will come out of this campaign?”
“I want HIV to become something we talk about often and openly. I want it to be something that’s not awkward. I want the next generation of kids to grow up and wonder why it ever was,” she responded.
Keys is also leading the EMPOWERED Community Grants program, administered by AIDS United, to give up to $25,000 grants to community-level projects that focus on women and HIV. She is co-founder and Global Ambassador of Keep a Child Alive, which provides AIDS treatment, food and other support to children and families affected by HIV and AIDS in Africa and India.
In June 2012, the number of children enrolled in the Children’s Health Insurance Program (CHIP) reached 5.5 million. From June 2011 to June 2012, an additional 206,000 children enrolled in CHIP programs across the country, a rate of growth (3.9 percent), a slight uptick from the prior annual period (3.5%) but still well below the program’s recessionary peak of 10% growth from June 2007 to June 2008.
In June 2012, Medicaid enrollment reached 54.1 million as high unemployment and falling incomes led many families to turn to Medicaid for coverage. However, as economic conditions improved, enrollment growth in Medicaid slowed. An additional 1.3 million people enrolled in Medicaid between June 2011 and June 2012 (a growth rate of 2.5 percent) compared to the program’s most recent peak at the height of the recessionary period, where nearly 3.5 million additional people enrolled each period (growth rates of 7.8 and 7.2 percent).
The issue brief provides further analysis of enrollment trends across all 50 states and DC as well as within select eligibility groups such as Families, the Aged & Disabled, as well as adult expansions of non-disabled, non-elderly adults.
Annual Family Premiums Now Top $16,000 On Average, With Workers Paying Nearly $4,600
Menlo Park, Calif. – Annual premiums for employer-sponsored family health coverage reached $16,351 this year, up 4 percent from last year, with workers on average paying $4,565 toward the cost of their coverage, according to the Kaiser Family Foundation/Health Research & Educational Trust (HRET) 2013 Employer Health Benefits Survey released today. During the same period, workers’ wages and general inflation were up 1.8 percent and 1.1 percent respectively.
This year’s rise in premiums remains moderate by historical standards. Since 2003, premiums have increased 80 percent, nearly three times as fast as wages (31 percent) and inflation (27 percent).
“We are in a prolonged period of moderation in premiums, which should create some breathing room for the private sector to try to reduce costs without cutting back benefits for workers,” Kaiser President and CEO Drew Altman, Ph.D., said.
“Ensuring that workers have access to affordable coverage is important for our health care system and slower premium growth is supporting that,” said Maulik Joshi, Dr.P.H., president of HRET and senior vice president for research at the American Hospital Association. “Wellness programs are an exciting component of this process with employers offering resources to employees that help improve their overall health – our ultimate goal.”
The 15th annual Kaiser/HRET survey of more than 2,000 small and large employers provides a detailed picture of the status and trends in employer-sponsored health insurance costs and coverage. In addition to the full report and summary of findings being released today, the journal Health Affairs is publishing a Web First article with select findings.
The survey shows that firms with many lower-wage workers (at least 35 percent earning $23,000 or less annually) require workers to pay $1,363 more on average toward family premiums than workers at firms with fewer lower-wage workers ($5,818 vs. $4,455 annually). The lower-wage firms on average offer less costly coverage too, creating a large disparity in the share of the premium that their workers pay (39 percent vs. 29 percent).
This year, 78 percent of all covered workers face a general annual deductible, up from 72 percent in 2012. Workers typically must pay this deductible before most services are covered by their health plan. The average deductible this year for worker-only coverage is $1,135, similar to the $1,097 average deductible in 2012.
The survey also finds that large deductibles of at least $1,000 or more are common in employer-sponsored plans, especially among workers of smaller firms. This year, 38 percent of all covered workers face such a deductible. At small firms, 58 percent of covered workers now face deductibles of at least $1,000, including nearly a third (31 percent) who face deductibles of at least $2,000, up from 12 percent in 2008.
Wellness Programs and Financial Incentives
Employee wellness programs are a popular strategy for employers trying to control costs. In 2013, 35 percent of employers say they are a very effective strategy for controlling costs, a larger share than says the same about any other strategy, including disease management (22 percent), consumer-driven health plans (20 percent) or higher cost sharing (17 percent).
Nearly all large employers (at least 200 workers) offer at least one wellness program, which can take many forms and target a wide range of conditions. More than a third (36 percent) of large employers who offer wellness programs offer some kind of financial incentive for workers to participate, such as lower premiums or a lower deductible, receiving a larger contribution to a tax-preferred savings account, or gift cards, cash or other direct financial incentives.
Among large firms offering health benefits, more than half (55 percent) offer some kind of biometric screenings to measure workers’ health risks. Of these, 11 percent reward or penalize workers financially based on whether they achieve specific biometric outcomes.
Implications for the Affordable Care Act
The Affordable Care Act (ACA) includes provisions that allow broader use of financial incentives to encourage workers to improve their health status and outcomes.
“This will be an important issue to watch next year, as employers will have more flexibility and could ask workers to pay more because of their lifestyles and health conditions,” said Kaiser Vice President Gary Claxton, the study’s lead investigator and director of the Foundation’s Health Care Marketplace Project.
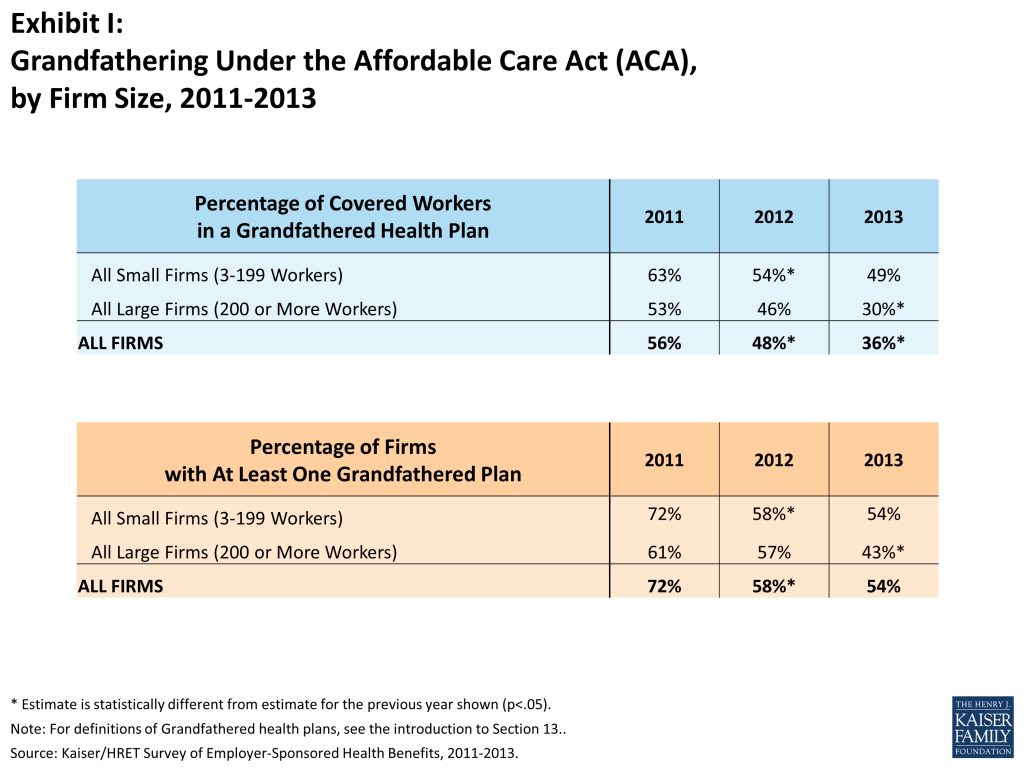
The survey also finds that 36 percent of covered workers are in “grandfathered” plans as defined by the ACA, down from 48 percent last year. The shift means a rising share of workers will benefit from some of the health law’s reforms affecting the employer market, such as covering preventive benefits without cost sharing and offering an external appeals process. Grandfathered plans, which were in place before the law’s passage, are exempt from these provisions. Plans lose their grandfathered status if they make significant changes to reduce benefits or raise workers’ costs.
The slow growth in premiums also means that fewer employer plans are likely to be subject to the ACA’s high-cost plan tax that takes effect in 2018. The Congressional Budget Office recently reduced its estimate of the number of plans that would trigger the tax, and a continued low growth rate could further reduce the impact of this provision.
For the first time, the survey also asked large employers about their interest in private health insurance exchanges, a relatively new concept that pulls together a wide range of insurance plans which participating employers can offer to their workers to choose from. Though relatively few chose this option in 2013, 29 percent of those with at least 5,000 workers say they are considering offering benefits through a private exchange in the future. These jumbo firms employ almost 40 percent of all covered workers, so their interest could portend a significant shift in the way many people get their health insurance in the future.
Offer rates
Offer rates have remained relatively stable. This year, the survey finds 57 percent of firms offer health benefits to their workers – statistically unchanged from the 61 percent in 2012 and 60 percent in 2011. As in the past, the larger an employer is, the more likely they are to offer health benefits — with nearly all firms with at least 200 workers offering health benefits to at least some of their workers.
Since most firms in the country are small, variation in the overall offer rate is driven primarily by changes in the percentages of the smallest firms (3-9 workers) offering health benefits (45 percent in 2013, similar to the 50 percent which did so in 2012). Also, firms with many low-wage workers are significantly less likely to offer health insurance than firms with few low-wage workers (23 percent and 60 percent, respectively).
The annual survey is a joint project of the Kaiser Family Foundation and the Health Research & Educational Trust. The survey was conducted between January and May of 2013 and included 2,948 randomly selected, non-federal public and private firms with three or more employees (2,067 of which responded to the full survey and 881 of which responded to a single question about offering coverage). A research team at Kaiser, HRET and NORC at the University of Chicago, led by Kaiser’s Gary Claxton, designed, conducted and analyzed the survey. For more information on the survey methodology, please visit the Survey Design and Methods Section at https://www.kff.org/EHBS .
The Kaiser Family Foundation, a leader in health policy analysis, health journalism and communication, is dedicated to filling the need for trusted, independent information on the major health issues facing our nation and its people. The Foundation is a non-profit private operating foundation, based in Menlo Park, California.
Founded in 1944, the Health Research & Educational Trust (HRET) is a private, not-for-profit organization involved in research, education, and demonstration programs addressing health management and policy issues. An affiliate of the American Hospital Association (AHA), HRET collaborates with health care, government, academic, business, and community organizations across the United States to conduct research and disseminate findings that shape the future of health care. For more information about HRET, visit http://www.hret.org.
Health Affairs is the leading journal at the intersection of health, health care, and policy. Published by Project HOPE, the peer-reviewed journal appears each month in print, with additional Web First papers published periodically and Health Policy Briefs published twice monthly at http://www.healthaffairs.org. The full text of each Health Affairs Web First paper is available free of charge to all website visitors for a one-week period following posting, after which it switches to pay-per-view for nonsubscribers. You can also find the journal on Facebook and Twitter. Read daily perspectives on Health Affairs Blog. Download our podcasts, including monthly Narrative Matters essays, on iTunes. Tap into Health Affairs content with the new iPad app.
This annual survey of employers provides a detailed look at trends in employer-sponsored health coverage, including premiums, employee contributions, cost-sharing provisions, and other relevant information. The 2013 survey included almost three thousand interviews with non-federal public and private firms.
Annual premiums for employer-sponsored family health coverage reached $16,351 this year, up 4 percent from last year, with workers on average paying $4,565 towards the cost of their coverage, according to the Kaiser Family Foundation/Health Research & Educational Trust (HRET) 2013 Employer Health Benefits Survey.
News Release
A news release announcing the publication of the 2013 Employer Health Benefits Survey is available here.
Summary of Findings
The Summary of Findings provides an overview of the 2013 survey results and is available under the “Summary of Findings” tab or as a pdf file in the “Download” box to the right.
Full Report
The complete Employer Health Benefits Survey Report includes over 200 exhibits and is available under the “Report” tab or as a pdf file in the “Download” box to the right. The “Report” tab contains 14 separate sections. Users can also download each section separately from the “Download” box or download the complete set of section exhibits from the bottom of the respective section page.
Twenty overview slides from the 2013 Employer Health Benefits Survey are available as a slideshow or as pdf.
Additional Resources
Standard errors for selected estimates are available in the Technical Supplement here.
Employer Health Benefits Surveys from 1998-2012 are available here. Please note that historic survey reports have not been revised with methodological changes.
Researchers may request a public use dataset here.
Researchers at the Kaiser Family Foundation, NORC at the University of Chicago, and Health Research & Educational Trust designed and analyzed the survey.
Summary Of Findings
Employer-sponsored insurance covers about 149 million nonelderly people.1 To provide current information about employer-sponsored health benefits, the Kaiser Family Foundation (Kaiser) and the Health Research & Educational Trust (HRET) conduct an annual survey of nonfederal private and public employers with three or more workers. This is the fifteenth Kaiser/HRET survey and reflects employer sponsored health benefits in 2013.
The key findings from the survey, conducted from January through May 2013, include modest increases in premiums for both single coverage (5%) and family coverage (4%). Covered workers generally face similar premium contributions and cost-sharing requirements in 2013 compared to 2012. However, the percentage of covered workers enrolled in plan with a general annual deductible increased in 2013, to over three quarters of covered workers (78%). Additionally, over half (58%) of covered workers at small firms (3-199 workers) now have a deductible of a $1,000 dollars or more. The percentage of firms (57%) which offer health benefits to at least some of their employees and the percentage of workers covered at those firms (62%) are statistically unchanged from 2012. The percentage of covered workers enrolled in grandfathered health plans – those plans exempt from many provisions of the Affordable Care Act (ACA) – declined to 36% of covered workers from 48% in 2012 and 56% in 2011. Firms offering health benefits continue to offer wellness and health promotion programs: 77% of firms offer at least one wellness program, 24% offer employees health risk assessments, and 57% offer at least one disease management program. Small percentages of these firms use financial incentives in order to encourage workers to participate or complete these activities.
HEALTH INSURANCE PREMIUMS AND WORKER CONTRIBUTIONS
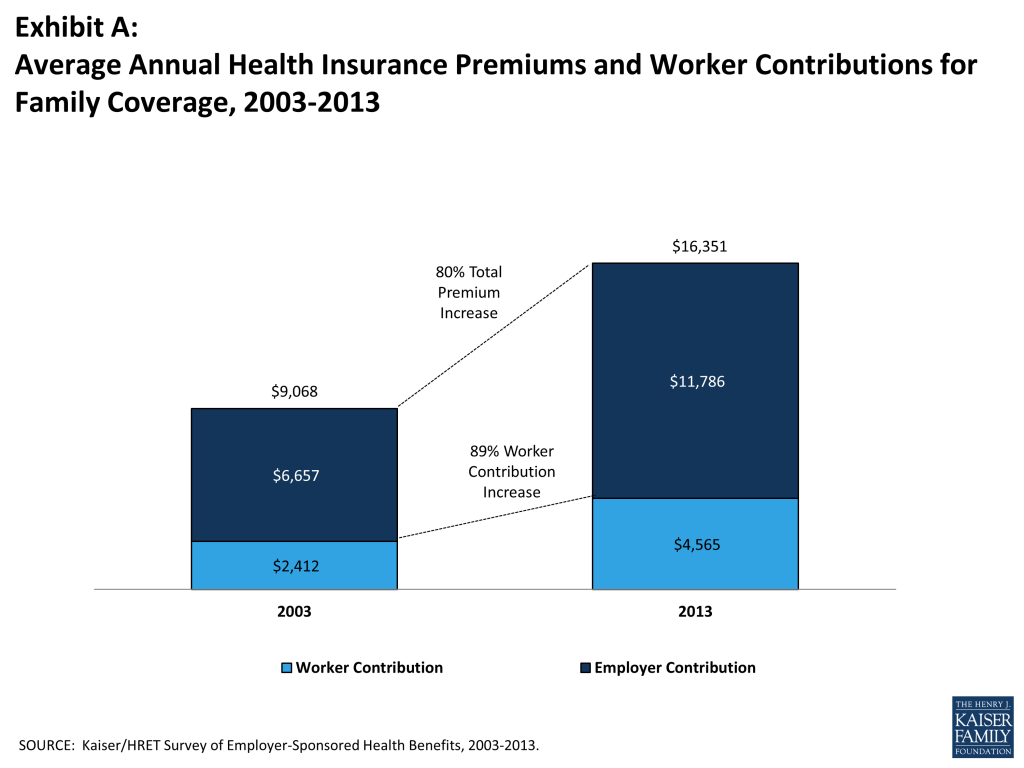
In 2013, the average annual premiums for employer-sponsored health insurance are $5,884 for single coverage and $16,351 for family coverage. The single premium is 5% higher and the family premium is 4% higher than the 2012 average premiums. During the same period workers’ wages increased 1.8% and inflation increased 1.1%.2 Over the last 10 years, the average premium for family coverage has increased 80% (Exhibit A).
Exhibit A
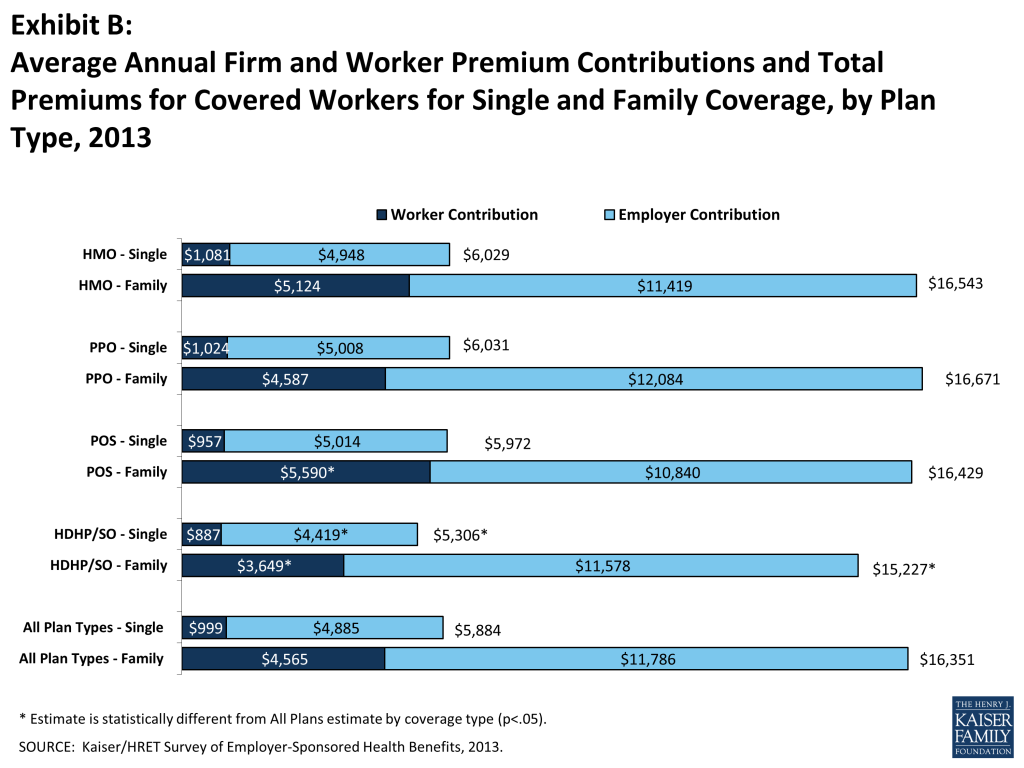
Average premiums for high-deductible health plans with a savings option (HDHP/SOs) are lower than the overall average for all plan types for both single and family coverage (Exhibit B), at $5,306 and $15,227, respectively. Looking at firm size, the average premium for family coverage is lower for covered workers in small firms (3-199 workers) than for workers in larger firms ($15,581 vs. $16,715).
Exhibit B
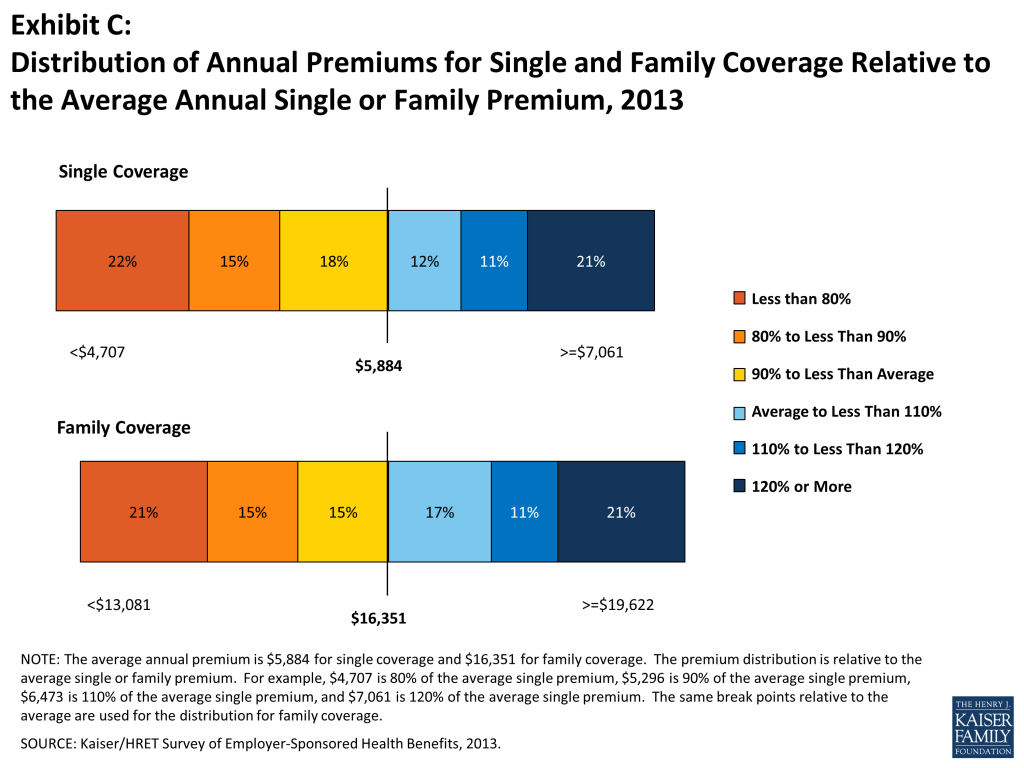
There is significant variation around the average single and family premiums, resulting from differences in benefits, cost sharing, covered populations, and geographical location. Twenty-one percent of covered workers are in plans with an annual total premium for family coverage of at least $19,622 (120% of the average family premium), while 21% of covered workers are in plans where the family premium is less than $13,081 (80% of the average family premium). The distribution is similar around the average single premium (Exhibit C).
Exhibit C
Most often, employers require that workers make a contribution towards the cost of the premium. Covered workers contribute on average 18% of the premium for single coverage and 29% of the premium for family coverage, similar to the percentages contributed in 2012 and relatively unchanged over the past decade. Workers in small firms (3 – 199 workers) contribute a lower average percentage for single coverage compared to workers in larger firms (16% vs. 19%), but they contribute a higher average percentage for family coverage (36% vs. 26%). Workers in firms with a higher percentage of lower-wage workers (at least 35% of workers earn $23,000 or less) contribute higher percentages of the premium for single coverage (23% vs. 17%) and for family coverage (39% vs. 29%) than workers in firms with a smaller share lower-wage workers.
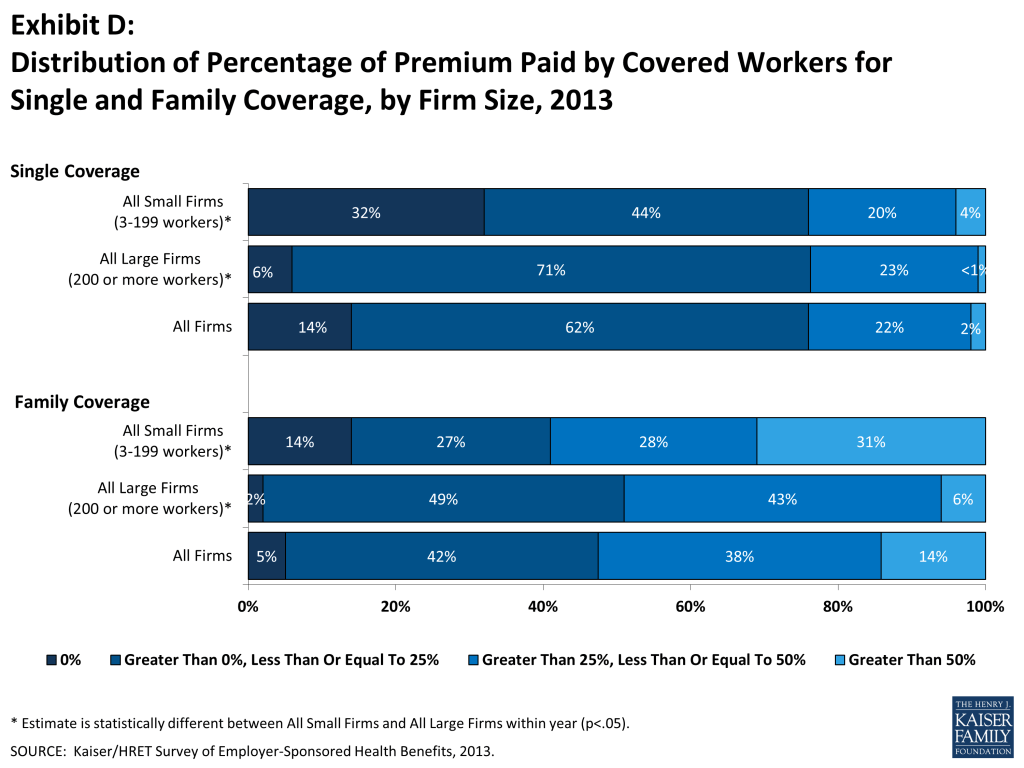
As with total premiums, the share of the premium contributed by workers varies considerably among firms. For single coverage, 62% of covered workers are in plans that require them to make a contribution of less than or equal to a quarter of the total premium, 2% are in plans that require a contribution of more than half of the premium, and 14% are in plans that require no contribution at all. For family coverage, 42% of covered workers are in plans that require them to make a contribution of less than or equal to a quarter of the total premium and 14% are in plans that require more than half of the premium, while only 5% are in plans that require no contribution at all for family coverage (Exhibit D).
Looking at the dollar amounts that workers contribute, the average annual premium contributions in 2013 are $999 for single coverage and $4,565 for family coverage. Neither amount is a statistically significant increase over the 2012 values ($951 and $4,316, respectively). Covered workers’ average dollar contribution to family coverage has increased 89% since 2003 and 36% since 2008 (Exhibit A). Workers in small firms (3 – 199 workers) have lower average contributions for single coverage than workers in larger firms ($862 vs. $1,065), but higher average contributions for family coverage ($5,284 vs. $4,226). Workers in firms with a higher percentage of lower-wage workers (at least 35% of workers earn $23,000 or less) have higher average contributions for single coverage ($1,234 vs. $979) and for family coverage ($5,818 vs. $4,455) than workers in firms with lower percentages of lower-wage workers.
Exhibit D
PLAN ENROLLMENT
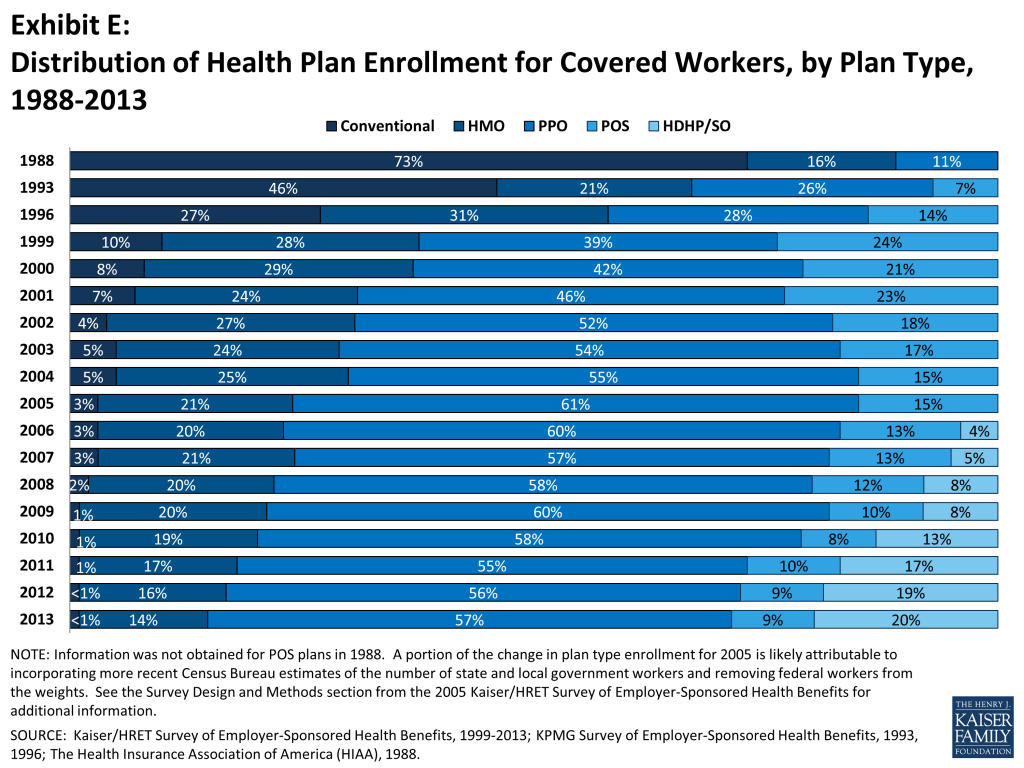
PPO plans remain the most common plan type, enrolling 57% of covered workers in 2013. Twenty percent of covered workers are enrolled in an HDHP/SO, 14% in an HMO, 9% in a POS plan, and less than 1% in a conventional plan (Exhibit E). Enrollment in HDHP/SOs increased significantly between 2009 and 2011, from 8% to 17% of covered workers, but has plateaued since then (Exhibit E). Enrollment distribution varies by firm size, for example, PPOs are relatively more popular for covered workers at large firms (200 or more workers) than smaller firms (62% vs. 47%) and POS plans are relatively more popular among smaller firms than large firms (16% vs. 5%).
Exhibit E
EMPLOYEE COST SHARING
Most covered workers face additional plan costs when they use health care services. Seventy-eight percent of covered workers have a general annual deductible for single coverage that must be met before most services are reimbursed by the plan. Even workers without a general annual deductible often face other types of cost sharing when they use services, such as copayments or coinsurance for office visits and hospitalizations.
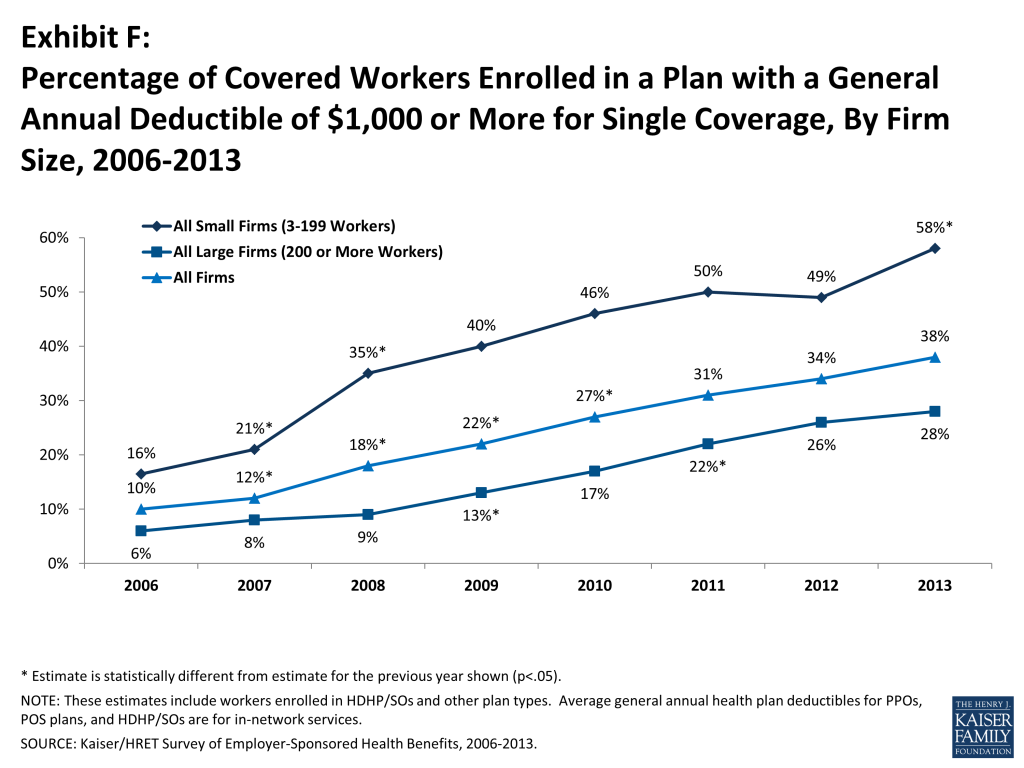
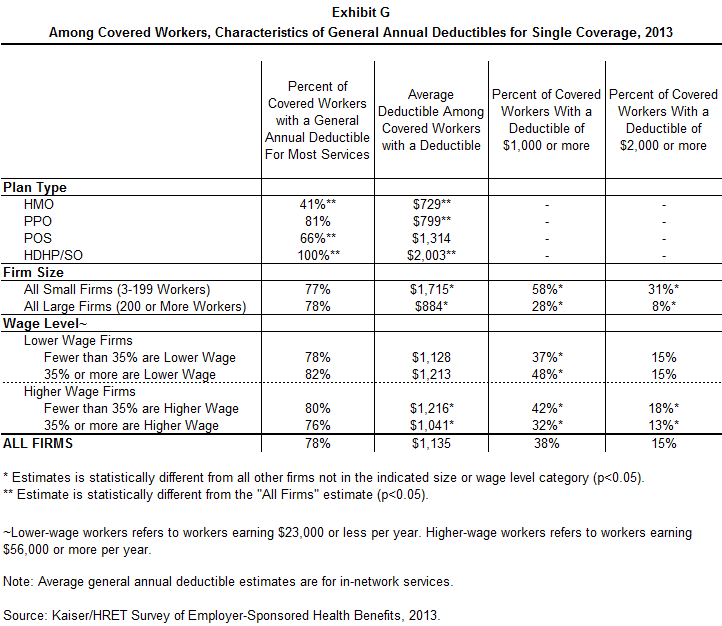
Among covered workers with a general annual deductible, the average deductible amount for single coverage is $1,135. The average annual deductible is unchanged from 2012 ($1,097), but has increased from $735 dollars in 2008. Deductibles differ by firm size: for workers in plans with a deductible, the average deductible for single coverage is $1,715 in small firms (3-199 workers), compared to $884 for workers in larger firms (Exhibit G). Among all covered workers, 58% in small firms (3-199 workers) and 28% in larger firms are in a plan with a deductible of at least $1,000 for single coverage (Exhibit F). The percentage of covered workers at small firms (3-199 workers) with a deductible of a $1,000 or more increased significantly in 2013 from 49% in 2012.
Exhibit F
The large majority of workers also have to pay a portion of the cost of physician office visits. Almost three-in-four covered workers pay a copayment (a fixed dollar amount) for office visits with a primary care physician (74%) or a specialist physician (72%), in addition to any general annual deductible their plan may have. Smaller shares of workers pay coinsurance (a percentage of the covered amount) for primary care office visits (20%) or specialty care visits (20%). For in-network office visits, covered workers with a copayment pay an average of $23 for primary care and $35 for specialty care. For covered workers with coinsurance, the average coinsurance for office visits is 18% for primary and for specialty care. While the survey collects information only on in-network cost sharing, it is generally understood that out-of-network cost sharing is higher.
The cost sharing that a person pays when they fill a prescription usually varies with the type of drug – for example whether it is a generic, brand-name or specialty drug – and whether the drug is considered preferred or not on the plan’s formulary. These factors result in each drug being assigned to a tier that represents a different level, or type, of cost sharing. Eighty-one percent of covered workers are in plans with three-or-more tiers of cost sharing. Copayments are the most common form of cost sharing for tiers one through three and coinsurance is the most common form of cost sharing for drugs on the fourth or higher tier of formularies. Among workers with three-or-more tier plans, the average copayments in these plans are $10 for first-tier drugs, $29 for second-tier drugs, $52 for third-tier drugs, and $80 for fourth-tier drugs – similar to the amounts reported last year. HDHP/SOs have a somewhat different cost-sharing pattern for prescription drugs than other plan types: just 61% of covered workers are enrolled in a plan with three-or-more tiers of cost sharing, while 12% are in plans that pay the full cost of prescriptions once the plan deductible is met, and 18% are in a plan with the same cost sharing for all prescription drugs.
Most workers also face additional cost sharing for a hospital admission or an outpatient surgery episode. After any general annual deductible is met, 61% of covered workers have a coinsurance and 16% have a copayment for hospital admissions. Lower percentages have per day (per diem) payments (7%), a separate hospital deductible (3%), or both copayments and coinsurance (8%). The average coinsurance rate for hospital admissions is 18%, the average copayment is $278 per hospital admission, the average per diem charge is $264, and the average separate annual hospital deductible is $436. The cost-sharing provisions for outpatient surgery are similar to those for hospital admissions, as most covered workers have either coinsurance (62%) or copayments (18%). For covered workers with cost sharing for each outpatient surgery episode, the average coinsurance is 18% and the average copayment is $140.
Most plans limit the amount of cost sharing workers must pay each year, generally referred to as an out-of-pocket maximum. Eighty-eight percent of covered workers have an out-of-pocket maximum for single coverage, but the actual dollar limits differ considerably. For example, among covered workers in plans that have an out-of-pocket maximum for single coverage, 43% are in plans with an annual out-of-pocket maximum of $3,000 or more, and 15% are in plans with an out-of-pocket maximum of less than $1,500. Even in plans with a specified out-of-pocket limit, not all spending is counted towards meeting the limit. For example, among workers in PPOs with an out-of-pocket maximum, 76% are in plans that do not count towards physician office visit copayments, 34% are in plans that do not count towards spending on the general annual deductible, and 84% are in plans that do not count towards prescription drug spending when determining if an enrollee has reached the out-of-pocket limit. The ACA will require that all non-grandfathered plans have an out-of-pocket maximum that counts all cost sharing towards the limit.
Exhibit G
AVAILABILITY OF EMPLOYER-SPONSORED COVERAGE
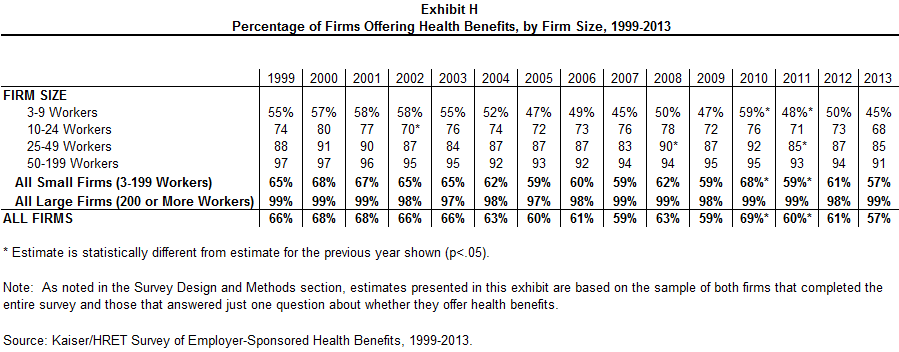
Fifty-seven percent of firms offer health benefits to their workers, statistically unchanged from the percentage that offered last year (61%) (Exhibit H). The offer rate is similar between 2012 and 2013 for both small firms (3 – 199 workers) and larger firms. The likelihood of offering health benefits differs significantly by size of firm, with only 45% of employers with 3 to 9 workers offering coverage, but virtually all employers with 1,000 or more workers offering coverage to at least some of their employees. Ninety percent of workers are in a firm that offers health benefits to at least some of its employees, similar to 2012 (92%). Offer rates also differ by other firm characteristics; 59% of firms with fewer younger workers (less than 35% of the workers are age 26 or younger) offer health benefits compared to 23% of firms with more younger workers.
Even in firms that offer health benefits, not all workers are covered. Some workers are not eligible to enroll as a result of waiting periods or minimum work-hour rules. Other workers do not enroll in coverage offered to them because of the cost of coverage or because they are covered through a spouse. Among firms that offer coverage, an average of 77% of workers are eligible for the health benefits offered by their employer. Of those eligible, 80% take up their employer’s coverage, resulting in 62% of workers in offering firms having coverage through their employer. Among both firms that offer and do not offer health benefits, 56% of workers are covered by health plans offered by their employer, the same percentage as 2012.
Exhibit H
RETIREE COVERAGE
Twenty-eight percent of large firms (200 or more workers) that offer health benefits in 2013 also offer retiree health benefits, similar to the percentage (25%) in 2012. Among large firms (200 or more workers) that offer retiree health benefits, 90% offer health benefits to early retirees (workers retiring before age 65), 67% offer health benefits to Medicare-age retirees, and 4% offer a plan that covers exclusively prescription drugs.
WELLNESS
Employers continue to offer programs in large numbers that help employees identify issues with their health and engage in healthier behavior. These include offering their employees the opportunity to complete a health risk assessment, and offering a variety of wellness programs that promote healthier lifestyles, including better diet and more exercise. Some employers have begun to collect biometric information from employees (e.g., cholesterol levels and body mass index) and are using it as part of their wellness and health promotion programs.
Almost one-in-four employers (24%) offering health benefits provide employees with an opportunity to complete a health risk assessment. A health risk assessment includes questions about medical history, health status, and lifestyle, and is designed to identify the health risks of the person being assessed. Large firms (200 or more workers) are more likely than smaller firms to ask employees to complete a health risk assessment (55% vs. 23%). Among these firms, 54% of large firms (200 or more workers) report that they provide a financial incentive to employees that complete the assessment.
Fifty-five percent of large firms (200 or more workers) and 26% of smaller firms offering health benefits report offering biometric screening to employees. A biometric screening is a health examination that measures an employee’s risk factors, such as body weight, cholesterol, blood pressure, stress, and nutrition. Of these firms, 11% percent of large firms require employees to complete a biometric screening to enroll in the health plan; and 11% of large firms report that employees may be financially rewarded or penalized based in meeting biometric outcomes.
Virtually all large employers (200 or more workers) and most smaller employers offer at least one wellness program. Seventy-seven percent of employers offering health benefits offer at least one of the following wellness programs in 2013: weight loss programs, gym membership discounts or on-site exercise facilities, biometric screening, smoking cessation programs, personal health coaching, classes in nutrition or healthy living, web-based resources for healthy living, flu shots or vaccinations, Employee Assistance Programs (EAP), or a wellness newsletter. Large firms (200 or more workers) are more likely to offer one of these programs than smaller firms (99% vs. 76%). Of firms offering health benefits and a wellness program, 36% of large firms (200 or more workers) and 8% of smaller firms offer employees a financial incentive to participate in a wellness program, such as smaller premium contributions, smaller deductibles, higher HSA/HRA contributions or gift cards, travel, merchandise or cash.
OTHER EMPLOYER PROGRAMS
Disease Management Programs. Most employers offer at least one disease management program as part of their largest health plan. Disease management programs identify people with chronic illnesses, such as diabetes, depression and hypertension, and offer treatment options to manage or improve the identified condition. Large firms (200 or more workers) are more likely to have a disease management program as part of their largest health plan than small firms (77% vs. 57%). Only 8% of large firms (200 or more workers) whose largest plan includes a disease management program, have a financial incentive to encourage employees to participate.
High Performance or Tiered Networks. Almost a quarter (23%) of employers offering health benefits have high performance or tiered networks in their largest health plan. These programs identify providers that are more efficient or have higher quality care, and may provide financial or other incentives for enrollees to use the selected providers.
Retail Health Clinics. Fifty-six percent of employers offering health benefits cover services provided by retail health clinics. These may be health clinics located in grocery stores or pharmacies to treat minor illnesses or provide preventive services, such as vaccines or flu shots. Among firms covering services in these settings, 17% provide a financial incentive to receive services in a retail clinic instead of a physician’s office.
OTHER TOPICS
Grandfathered Health Plans. The ACA exempts “grandfathered” health plans from a number of its provisions, such as the requirements to cover preventive benefits without cost sharing or the new rules for small employers’ premiums ratings and benefits. An employer-sponsored health plan can be grandfathered if it covered a worker when the ACA became law (March 23, 2010) and if the plan has not made significant changes that reduce benefits or increase employee costs.3 Fifty-four percent of firms offering health benefits offer at least one grandfathered health plan in 2013, similar to the percentage reported in 2012. Small firms (3-199 workers) are more likely than larger firms to offer a grandfathered health plan (54% vs. 43%). Looking at enrollment, 36% of covered workers are enrolled in a grandfathered health plan in 2013, down from 48% in 2012 (Exhibit I). Covered workers in small firms (3-199 workers) are more likely than covered workers in larger firms to be enrolled in a grandfathered health plan (49% vs. 30%).
Exhibit I
Self-Funding. Sixteen percent of covered workers at small firms (3-199 workers) and 83% of covered workers at larger firms are enrolled in plans which are either partially or completely self-funded, similar to 2012 (15% and 81%). Six percent of firms offering fully-insured plans report that they intend to self-insure because of the ACA.
Shopping for Coverage. Fifty-four percent of firms shopped for a new health plan or insurance carrier in the previous year. There was not a significant difference between small (3 – 199 workers) and larger firms in the likelihood of shopping for new coverage. Among firms that shopped, 18% changed carriers in the past year and 15% changed the type of health plan (e.g., HMO, PPO, POS or HDHP/SO) that they offer.
Exchanges for Large Employers. In the last two years, several consulting firms have announced that they were creating private exchanges for employers.4,5 These exchanges would provide employers an opportunity to give their employees a contribution that may be used to choose from a potentially broad choice of health plans that would be managed by the exchange. While few employers have adopted this approach to date, 9% of large firms (200 or more employees), including 29% of firms with 5,000 or more employees, reported that they are considering offering health benefits through a private exchange in the future. This interest may signal a significant change in the way that employers approach health benefits and the way employees get coverage, with employers playing a less active role in plan design and management.
CONCLUSION
The 2013 annual survey did not find major changes in employer-based health benefits. Premiums increased at modest levels, consistent with the last several years, and coverage and offer rates did not change significantly. Employers remain committed to wellness programs: most covered workers are in plans with some type of wellness program and a majority (67%) of employers believes that wellness programs are very or somewhat effective in controlling health care costs.
More changes are expected over the next several years as many of more far-reaching provisions of the health reform law will take effect in 2014, including new benefits, cost-sharing tiers and premium rating rules that will apply to plans for employers with 50 or fewer workers. While several provisions affecting some larger employers have been delayed, most notably the requirement to offer coverage to all full-time employees by 2014, employers may begin adapting benefits and contributions to prepare to meet this requirement for 2015. The adoption of new federal rules for employee wellness programs, which permit employers to have larger financial rewards for employees who participate in wellness programs or who meet defined health outcomes, may encourage employers to modify or extend their wellness approaches.
The emergence of new exchanges, or marketplaces, also may portend important changes for employer-sponsored health insurance. Through an exchange, an employer can provide employees with a larger number and type of health plan options. Exchanges also facilitate the use of defined contributions or other strategies that encourage employees to choose lower cost plans or pay the difference in costs themselves. New SHOP exchanges will offer coverage options to small employers beginning in 2014, although employee choice will be limited in the federal SHOP exchanges until 2015. Large employers have the option of offering coverage through one of several exchanges being sponsored by benefit consulting organizations. While these approaches are new and differ across different exchanges, the common theme is to devolve some benefit choices, and some of the financial responsibility for those choices, to employees. Whether this new way of purchasing coverage works for employers and their employees, and how it affects benefits and plan costs, will be among the more important stories for the employer health insurance market over the next few years.
METHODOLOGY
The Kaiser Family Foundation/Health Research & Educational Trust 2013 Annual Employer Health Benefits Survey (Kaiser/HRET) reports findings from a telephone survey of 2,067 randomly selected public and private employers with three or more workers. Researchers at the Health Research & Educational Trust, NORC at the University of Chicago, and the Kaiser Family Foundation designed and analyzed the survey. National Research, LLC conducted the fieldwork between January and May 2013. In 2013 the overall response rate is 49%, which includes firms that offer and do not offer health benefits. Among firms that offer health benefits, the survey’s response rate is 50%.
We ask all firms with which we made phone contact, even if the firm declined to participate in the survey: “Does your company offer a health insurance program as a benefit to any of your employees?” A total of 2,948 firms responded to this question (including the 2,067 who responded to the full survey and 881 who responded to this one question). Their responses are included in our estimates of the percentage of firms offering health coverage. The response rate for this question is 70%.
Since firms are selected randomly, it is possible to extrapolate from the sample to national, regional, industry, and firm size estimates using statistical weights. In calculating weights, we first determine the basic weight, then apply a nonresponse adjustment, and finally apply a post-stratification adjustment. We use the U.S. Census Bureau’s Statistics of U.S. Businesses as the basis for the stratification and the post-stratification adjustment for firms in the private sector, and we use the Census of Governments as the basis for post-stratification for firms in the public sector. Some numbers in the exhibits in the report do not sum up to totals due to rounding effects, and, in a few cases, numbers from distribution exhibits referenced in the text may not add due to rounding effects. Unless otherwise noted, differences referred to in the text and exhibits use the 0.05 confidence level as the threshold for significance.
The Kaiser Family Foundation, a leader in health policy analysis, health journalism and communication, is dedicated to filling the need for trusted, independent information on the major health issues facing our nation and its people. The Foundation is a non-profit private operating foundation, based in Menlo Park, California.
The Health Research & Educational Trust is a private, not-for-profit organization involved in research, education, and demonstration programs addressing health management and policy issues. Founded in 1944, HRET, an affiliate of the American Hospital Association, collaborates with health care, government, academic, business, and community organizations across the United States to conduct research and disseminate findings that help shape the future of health care.
Section One: Cost Of Health Insurance
The average annual premiums in 2013 are $5,884 for single coverage and $16,351 for family coverage. Average premiums increased 5% for single coverage and 4% for family coverage in the last year. Family premiums have increased 80% since 2003 and have more than doubled since 2002. Average family premiums for workers in small firms (3-199 workers) ($15,581) are significantly lower than average family premiums for workers in larger firms (200 or more workers) ($16,715).
Premium Costs for Single and Family Coverage
The average premium for single coverage in 2013 is $490 per month or $5,884 per year 1. The average premium for family coverage is $1,363 per month or $16,351 per year 1.
The average annual premiums for covered workers in HDHP/SOs are lower for single ($5,306) and family coverage ($15,227) than the overall average premiums for covered workers. Average annual premiums for all other plan types, including PPO plans, HMOs, and POS plans, are similar to the overall average premiums for covered workers 1.
The average premium for family coverage for covered workers in small firms (3-199 workers) ($15,581) is lower than the average premium for covered workers in large firms (200 or more workers) ($16,715) 2. The average single premium for covered workers in small firms (3-199 workers) and larger firms do not differ significantly.
Average single and family premiums for covered workers are higher in the Northeast ($6,117 and $17,411) and lower in the Midwest ($5,613 and $15,724) than the average premiums for covered workers in all other regions 3. Covered workers in the West also face higher premiums for single coverage ($6,140).
Covered workers in firms where 35% or more of the workers are age 26 or younger have lower average single and family premiums ($5,166 and $14,645) than covered workers in firms where a lower percentage of workers are age 26 or younger ($5,929 and $16,457). Covered workers in firms where 35% or more of the workers are age 50 or older have higher average single and family premiums ($6,263 and $17,424) than covered workers in firms where a lower percentage of workers are age 50 or older ($5,622 and $15,612) 5 and 6.
Covered workers in firms with a large percentage of lower-wage workers (at least 35% of workers earn $23,000 per year or less) have lower average single and family premiums ($5,450 and $15,225) than covered workers in firms with a smaller percentage of lower-wage workers ($5,922 and $16,450). Covered worker in firms with a large percentage of higher-wage workers (at least 35% of workers earn $56,000 per year or more) have higher average single and family premiums ($6,025 and $16,989) than covered workers in firms with a smaller percentage of higher-wage workers ($5,760 and $15,789) 5.
There is considerable variation in premiums for both single and family coverage.
Twenty-one percent of covered workers are employed by firms that have a single premium at least 20% higher than the average single premium, while 22% of covered workers are in firms that have a single premium less than 80% of the average single premium 7.
For family coverage, 21% of covered workers are employed in a firm that has a family premium at least 20% higher than the average family premium, and another 21% of covered workers are in firms that have a family premium less than 80% of the average family premium 7 and 8.
Premium Changes Over Time
The average annual single premium ($5,884) in 2013 is 5% higher than the average annual single premium in 2012 ($5,615), and the average annual family premium ($16,351) is 4% higher than the average annual family premium last year ($15,745) 11.
The $16,351 average annual family premium in 2013 is 29% higher than the average family premium in 2008 and 80% higher than the average family premium in 2003 11.
Premiums for both small and large firms have seen a similar increase since 2008 (29%). For small firms (3 to 199 workers), the average family premium rose from $12,091 in 2008 to $15,581 in 2013. For large firms (200 or more workers), the average family premium rose from $12,973 in 2008 to $16,715 in 2013 13.
Since 2003, premiums for small firms (3 to 199 workers) have increased 74% ($15,581 in 2013 vs. $8,946 in 2003). The premiums for large firms have increased 83% ($16,715 in 2013 vs. $9,127 in 2003) 13.
For large firms (200 or more workers), the average family premium for covered workers in firms that are fully insured has grown at a similar rate to premiums for workers in fully or partially self-funded firms from 2008 to 2013 (28% in fully insured firms vs. 29% in self-funded firms) and from 2003 to 2013 (84% in fully insured firms vs. 83% in self-funded firms) 14.
Section Two: Health Benefits Offer Rates
While nearly all large firms (200 or more workers) offer health benefits, small firms (3-199 workers) are significantly less likely to do so. The percentage of all firms offering health benefits in 2013 (57%) is statistically unchanged from 2012 and 2011 (61% and 60%).
In 2013, 57% of firms offer health benefits, statistically unchanged from the 61% reported in 2012 1.
Similar to 2012, 99% of large firms (200 or more workers) offer health benefits to at least some of their workers 2. In contrast, only 57% of small firms (3-199 workers) offer health benefits in 2013.
Between 1999 and 2013, the offer rate for large firms (200 or more workers) has consistently remained at or above 97%. Since most firms in the country are small, variation in the overall offer rate is driven primarily by changes in the percentages of the smallest firms (3-9 workers) offering health benefits.
Offer rates vary across different types of firms.
Smaller firms are less likely to offer health insurance: 45% of firms with 3 to 9 workers offer coverage, compared to 68% of firms with 10 to 24 workers, 85% of firms with 25 to 49 workers, and 91% of firms with 50 to 199 employees 3.
Offering rates throughout different firm size categories in 2013 remained similar to those in 2012 2.
Firms with fewer lower-wage workers (less than 35% of workers earn $23,000 or less annually) are significantly more likely to offer health insurance than firms with many lower-wage workers (35% or more of workers earn $23,000 or less annually) (60% vs. 23%) 4. The offer rate for firms with many lower-wage workers is not significantly different from the 28% reported in 2012. We observe a similar pattern among firms with many higher-wage workers (35% or more of workers earn $56,000 or more annually) 4.
The age of the workforce significantly affects the probability of a firm offering health benefits. Firms where 35% or more of its workers are age 26 or younger are less likely to offer health benefits than firms where less than 35% of workers are age 26 or younger (23% and 59%, respectively) 4.
Among firms offering health benefits, relatively few offer benefits to their part-time and temporary workers.
In 2013, 25% of all firms that offer health benefits offer them to part-time workers, similar to the 28% reported in 2012 5. Offering firms with 200 or more workers are more likely to offer health benefits to part-time employees than firms with 3 to 199 workers (47% vs. 25%) 7.
Consistently, a very small percentage (3% in 2013) of firms offering health benefits have offered them to temporary workers 6. The percentage of firms offering temporary workers benefits is similar for small firms (3-199 workers) and large firms (200 or more workers) (3% vs. 6%) 8. The percentage of firms offering health benefits to temporary workers has been stable over time.
Firms Not Offering Health Benefits
The survey asks firms that do not offer health benefits if they have offered insurance or shopped for insurance in the recent past, and about their most important reasons for not offering. Because such a small percentage of large firms report not offering health benefits, we present responses for smaller firms (3 to 199 workers) that do not offer health benefits.
The cost of health insurance remains the primary reason cited by firms for not offering health benefits. Among small firms (3-199 workers) not offering health benefits, 50% cite high cost as “the most important reason” for not doing so, followed by: “firm is too small” (16%) and “employees are generally covered under another plan” (15%) 9.
Many non-offering, small firms have either offered health benefits in the past five years, or shopped for alternative coverage options recently.
Seventeen percent of non-offering, small firms (3-199 workers) have offered health benefits in the past five years, while 18% have shopped for coverage in the past year 10.
Among non-offering, small firms (3-199 workers), 10% report that they provide funds to their employees to purchase health insurance through the individual (non-group) market 11.
Section Three: Employee Coverage, Eligibility, And Participation
Employers are the principal source of health insurance in the United States, providing health benefits for about 149 million nonelderly people in America.6 Most workers are offered health coverage at work, and the majority of workers who are offered coverage take it. Workers may not be covered by their own employer for several reasons: their employer may not offer coverage, they may be ineligible for benefits offered by their firm, they may choose to elect coverage through their spouse’s employer, or they may refuse coverage from their firm.
Among firms offering health benefits, 62% percent of workers are covered by health benefits through their own employer 2. When considering both firms that offer health benefits and those that don’t, 56% of workers are covered under their employer’s plan 1. This coverage rate has remained stable over time.
Eligibility
Not all employees are eligible for the health benefits offered by their firm, and not all eligible employees take up the offer of coverage. The share of workers covered in a firm is a product of both the percentage of workers who are eligible for the firm’s health insurance and the percentage who choose to “take up” (i.e., elect to participate in) the benefit.
Seventy-seven percent of workers in firms offering health benefits are eligible for the coverage offered by their employer 2.
Eligibility varies considerably by wage level. Employees in firms with a lower proportion of lower-wage workers (less than 35% of workers earn $23,000 or less annually) are more likely to be eligible for health benefits than employees in firms with a higher proportion of lower-wage workers (80% vs. 61%). We observe a similar pattern among firms with many higher-wage workers (35% or more of workers earn $56,000 or more annually) (84% vs. 73%) 3.
Eligibility also varies by the age of the workforce. Those in firms with fewer younger workers (less than 35% of workers are age 26 or younger) are more likely to be eligible for health benefits than are workers in firms with many younger workers, at 78% versus 63% 3.
Take-up Rate
Employees who are offered health benefits generally elect to take up the coverage. In 2013, 80% of eligible workers take up coverage when it is offered to them, which is similar to the 81% reported last year 2.7
The likelihood of a worker accepting a firm’s offer of coverage also varies by workforce wage level. Eligible employees in firms with a lower proportion of lower-wage workers are more likely to take up coverage (81%) than eligible employees in firms with a higher proportion of lower-wage workers (35% or more of workers earn $23,000 or less annually) (68%) 4. Similar patterns are seen in firms with a higher proportion of younger workers, with workers in these firms being less likely to take up coverage than those in firms with a smaller share of younger workers (70% vs. 81%).
Almost nine out of ten workers at public employers who offer health benefits take up coverage (89%). However, workers at private for-profit employers are significantly less likely to do so – only 77% of these workers take up coverage 4.
Coverage
There is significant variation by industry in the coverage rate among workers in firms offering health benefits. For example, only 37% of workers in retail firms offering health benefits are covered by the health benefits offered by their firm, compared to 74% of workers in finance, and 74% of workers in the transportation/communications/utilities industry category 2.
Among workers in firms offering health benefits, those in firms with relatively few part-time workers (less than 35% of workers are part-time) are much more likely to be covered by their own firm than workers in firms with a greater percentage of part-time workers (68% vs. 38%) 5.
Among workers in firms offering health benefits, those in firms with fewer lower-wage workers (less than 35% of workers earn $23,000 or less annually) are more likely to be covered by their own firm than workers in firms with many lower-wage workers (65% vs. 41%) 5. A comparable pattern exists in firms with a larger proportion of higher wage workers (35% or more earn $56,000 or more annually) offering health benefits.
Among workers in firms offering health benefits, those in firms with fewer younger workers (less than 35% of workers are age 26 or younger) are more likely to be covered by their own firm than workers in firms with many younger workers (63% vs. 44%) 5.
Average Waiting Periods
Seventy-seven percent of covered workers face a waiting period before coverage is available. Covered workers in small firms (3-199 workers) are more likely than those in large firms to have a waiting period, at 83% versus 74% 7. Workers in the Northeast are less likely to face a wait for coverage than all other regions (70%).
The average waiting period among covered workers who face a waiting period is 1.8 months 7. While 30% of covered workers face a waiting period of 3 months or more, only 9% face a waiting period of 4 months or more. Workers in small firms (3-199 workers) generally have longer waiting periods than workers in larger firms 8.
Ninety-one percent of covered workers at firms with many lower wage workers (firms where more than 35% of the workforce makes $23,000 or less) compared to 76% at firms with few lower-wage workers face a waiting period before coverage is available.
Section Four: Types Of Plans Offered
Most firms that offer health benefits offer only one type of health plan (82%) (See Text Box). Larger firms are more likely to offer more than one type of health plan. Employers are most likely to offer their workers a PPO, HMO, or HDHP/SO plan and are least likely to offer a conventional plan.
Eighty-two percent of firms offering health benefits in 2012 offer only one type of health plan. Large firms (200 or more workers) are more likely to offer more than one plan type than small firms (3-199 workers): 45% vs. 17% 1.
Over half (52%) of covered workers are employed in a firm that offers more than one health plan type. Sixty-five percent of covered workers in large firms (200 or more workers) are employed by a firm that offers more than one plan type, compared to 26% in small firms (3-199 workers) 2.
Three quarters (75%) of covered workers in firms offering health benefits work in a firm that offers one or more PPOs; 39% work in firms that offer one or more HDHP/SOs; 37% work in firms that offer one or more HMOs; 14% work in firms that offer one or more POS plans; and 4% work in firms that offer one or more conventional plans 4.8
The survey collects information on a firm’s plan with the largest enrollment in each of the plan types. While we know the number of plan types a firm has, we do not know the total number of plans a firm offers. In addition, firms may offer different types of plans to different workers. For example, some workers might be offered one type of plan at one location, while workers at another location are offered a different type of plan.
Section Five: Market Shares Of Health Plans
Enrollment remains highest in PPO plans, covering more than half of covered workers, followed by HDHP/SOs, HMO plans, POS plans, and conventional plans. Enrollment distribution varies by firm size, for example, PPOs are relatively more popular for covered workers at large firms (200 or more workers) than smaller firms (62% vs. 47%) and POS plans are relatively more popular among smaller firms than large firms (16% vs. 5%)
Fifty-seven percent of covered workers are enrolled in PPOs, followed by HDHP/SOs (20%), HMOs (14%), POS plans (9%), and conventional plans (<1%) 1.
After years of significant annual increases in the percentage of covered workers enrolled in HDHP/SO plans (8% in 2009, 13% in 2010, and 17% in 2011), there has been a similar level of enrollment over the past two years (19% in 2012 and 20% in 2013) 1.
Enrollment in HMO plans is similar to 2012, but has declined significantly since 2011.
Plan enrollment patterns vary by firm size. Workers in large firms (200 or more workers) are more likely than workers in small firms (3-199 workers) to enroll in PPOs (62% vs. 47%). Workers in small firms are more likely than workers in large firms to enroll in POS plans (16% vs. 5%) 3.
Plan enrollment patterns also differ across regions.
HMO enrollment is significantly higher in the West (25%) and significantly lower in the South (10%) and Midwest (7%) 3.
Workers in the South (66%) are more likely to be enrolled in PPO plans than workers in other regions; workers in the West (49%) are less likely to be enrolled in a PPO 3.
Enrollment in HDHP/SOs is higher among workers in the Midwest (27%) than in other regions 3.
Section Six: Worker And Employer Contributions For Premiums
Premium contributions by covered workers average 18% for single coverage and 29% for family coverage.9 The average monthly worker contributions are $83 for single coverage ($999 annually) and $380 for family coverage ($4,565 annually). These percentage and dollar values are similar to the values reported in 2012.
In 2013, covered workers on average contribute 18% of the premium for single coverage and 29% of the premium for family coverage, similar to the contribution percentages reported for 2012 1. The premium contributions have remained stable over the last three years for both single and family coverage.
On average, workers with single coverage contribute $83 per month ($999 annually), and workers with family coverage contribute $380 per month ($4,565 annually), towards their health insurance premiums, similar to the amounts reported in 2012 2, 3, and 4.
Worker contributions in HDHP/SOs are lower than the overall average worker contributions for family coverage ($3,649 vs. $4,565) 5. Similarly, covered workers enrolled in HDHP/SO plans contribute less on average for family coverage than covered workers enrolled in other plan types ($3,649 vs. $4,787).
Worker contributions in POS plans are higher for family coverage ($5,590) compared to the overall worker contribution for family coverage 5.
In addition to differences between plan types, there are differences in worker contributions by type of firm. As in previous years, workers in small firms (3-199 workers) contribute a lower amount annually for single coverage than workers in large firms (200 or more workers), $862 vs. $1,065. In contrast, workers in small firms with family coverage contribute significantly more annually than workers with family coverage in large firms ($5,284 vs. $4,226) 8.
There is a great deal of variation in worker contributions to premiums.
Twenty-seven percent of covered workers contribute $1,399 or more annually (140% or more of the average worker contribution) for single coverage, while 15% of covered workers have an annual worker contribution of less than $600 (less than 60% of the average worker contribution) 14.
For family coverage, 21% of covered workers contribute $6,392 or more annually (140% or more of the average worker contribution), while 20% of covered workers have an annual worker contribution of less than $2,739 (less than 60% of the average worker contribution) 14.
The majority of covered workers are employed by a firm that contributes at least half of the premium for single and family coverage.
Fourteen percent of covered workers with single coverage and 5% of covered workers with family coverage work for a firm that pays 100% of the premium 15.
Covered workers in small firms (3-199 workers) are more likely to work for a firm that pays 100% of the premium for single coverage than workers in large firms (200 or more workers). Thirty-two percent of covered workers in small firms have an employer that pays the full premium for single coverage, compared to 6% of covered workers in large firms 16. For family coverage, 14% percent of covered workers in small firms have an employer that pays the full premium, compared to 2% of covered workers in large firms 17.
Four percent of covered workers in small firms (3-199 workers) contribute more than 50% of the premium for single coverage, compared to less than one percent of covered workers in large firms (200 or more workers) 16. For family coverage, 31% of covered workers in small firms work in a firm where they must contribute more than 50% of the premium, compared to 6% of covered workers in large firms 17.
The percentage of the premium paid by covered workers varies by several firm characteristics.
For family coverage, covered workers in firms with many lower-wage workers (35% or more earn $23,000 or less annually) contribute a greater percentage of the premium than those in firms with fewer lower-wage workers (39% vs. 29%).
Covered workers with family coverage in firms that have at least some union workers contribute a significantly lower percentage of the premium than those in firms without any unionized workers (23% vs. 33%) 20.
For workers with family coverage in large firms (200 or more workers), the average percentage contribution for workers in firms that are partially or completely self-funded is lower than the average percentage contributions for workers in firms that are fully insured (25% vs. 32%)1020.
Among firms offering health benefits with fewer than 20 employees, 41% contribute different dollar amounts toward premiums for different employees 25. Employer may contribute different amounts to different employees based for a variety of reasons, including workers’ age, smoking status, seniority, job title or location.
Changes over Time
The amount which workers contribute to single coverage premiums has increased 97 percent since 2003 and 39% since 2008. Covered workers’ contributions to family coverage have increased 89% since 2003 and 36% since 2008.
Section Seven: Employee Cost Sharing
In addition to any required premium contributions, most covered workers face cost sharing for the medical services they use. Cost sharing for medical services can take a variety of forms, including deductibles (an amount that must be paid before some or all services are covered by the plan), copayments (fixed dollar amounts), and/or coinsurance (a percentage of the charge for services). The type and level of cost sharing often vary by the type of plan in which the worker is enrolled. Cost sharing may also vary by the type of service, such as office visits, hospitalizations, or prescription drugs.
The cost-sharing amounts reported here are for covered workers using services provided in-network by participating providers. Plan enrollees receiving services from providers that do not participate in plan networks often face higher cost sharing and may be responsible for charges that exceed plan allowable amounts. The framework of this survey does not allow us to capture all of the complex cost-sharing requirements in modern plans, particularly for ancillary services (such as durable medical equipment or physical therapy) or cost-sharing arrangements that vary across different settings (such as tiered networks). Therefore, we do not collect information on all plan provisions and limits that affect enrollee out-of-pocket liability.
General Annual Deductibles
A general annual deductible is an amount that must be paid by the enrollee before most services are covered by their health plan. Some plans require enrollees to meet a service specific deductible such as on prescription drugs or hospital admissions in lieu of or in addition to a general deductible. Federal law requires that some services such as preventative care are covered by some plans without cost sharing.
Seventy-eight percent of covered workers are enrolled in a plan with a general annual deductible for single coverage. More covered workers are enrolled in a plan with a general annual deductible in 2013 than in 2012 (78% vs. 72%) 2. Since 2006, the percent of covered workers with a general annual deductible has increased from 55% to 78%.
The percent of covered workers enrolled in a plan with a general annual deductible is similar for small (3-199 workers) and larger firms (77% and 78%) 2.
The likelihood of having a deductible varies by plan type. Workers in HMOs are less likely to have a general annual deductible for single coverage compared to workers in other plan types. Fifty-nine percent of workers in HMOs do not have a general annual deductible, compared to 34% of workers in POS plans and 19% of workers in PPOs 1.
Workers without a general annual plan deductible often have other forms of cost sharing for medical services. For workers without a general annual deductible for single coverage, 81% in HMOs, 83% in PPOs, and 73% in POS plans are in plans that require cost sharing for hospital admissions. The percentages are similar for family coverage 4.
The dollars amounts of general annual deductibles vary greatly by plan type and firm size.
The average annual deductible is $1,135. There are differences in the average general annual deductible by plan type. The average annual deductibles among those covered workers with a deductible for single coverage are $729 for HMOs, $799 for PPOs, $1,314 for POS plans, and $2,003 for HDHP/SOs 5. Overall, the average general annual deductible for all covered workers is $1,135.
There is no statistically significant change in deductible amounts from 2012 to 2013 for any plan type 7.
Deductibles are generally higher for covered workers in small firms (3-199 workers) than for covered workers in large firms (200 or more workers) across plan types 5. For covered workers in PPOs, deductibles in small firms are more than twice as large as deductibles in large firms ($1,488 vs. $563). On average, covered workers at small firms face higher general annual deductibles than covered workers at large firms ($1,715 vs. $884) 5.
For family coverage, the majority of workers with general annual deductibles have an aggregate deductible, meaning all family members’ out-of-pocket expenses count toward meeting the deductible amount. Among those with a general annual deductible for family coverage, the percentage of covered workers with an average aggregate general annual deductible is 56% for workers in HMOs, 58% for workers in PPOs, 77% for workers in POS plans and 84% for workers in HDHP/SOs 13.
The average amounts for workers with an aggregate deductible for family coverage are $1,743 for HMOs, $1,854 for PPOs, $2,821 for POS plans, and $4,079 for HDHP/SOs 14.
The average aggregate deductible amounts for family coverage are similar to last year for each plan type 15.
The other type of family deductible, a separate per-person deductible, requires each family member to meet a separate per-person deductible amount before the plan covers expenses for that member. Most plans with separate per-person family deductibles consider the deductible met for all family members if a prescribed number of family members each reach their separate deductible amounts. Plans may also require each family member to meet a separate per-person deductible until the family’s combined spending reaches a specified dollar amount.
For covered workers in health plans that have separate per-person general annual deductible amounts for family coverage, the average plan deductible amounts are $609 for HMOs, $782 for PPOs, $1,080 for POS plans, and $2,033 for HDHP/SOs 14.
Most covered workers in plans with a separate per-person general annual deductible for family coverage have a limit to the number of family members required to meet the separate deductible amounts 18.11 Among those workers in plans with a limit on the number of family members, the most frequent number of family members required to meet the separate deductible amounts is three for HMO and PPO plans, and two for POS plans 19.
Thirty-eight percent of covered workers are in plans with a deductible of $1000 or more for single coverage, similar to the percentage (34%) in 2012 9.
Over the last five years, the percentage of covered workers with a deductible of $1,000 or more for single coverage has increased from 18% to 38% 9. Workers in small firms (3-199 workers) are more likely to have a general annual deductible of $1,000 or more for single coverage than workers in large firms (200 or more workers) (58% vs. 28%) 8. The percent of covered workers at small firms (3-199 workers) who have a deductible of a $1,000 or more increased from 49% in 2012 to 58% in 2013 9.
Fifteen percent of covered workers are enrolled in a plan with a deductible of $2,000 or more. Thirty-one percent of covered workers at small firms (3-199 workers) have a general annual deductible of $2,000 or more 8.
The majority of covered workers with a deductible are in plans where the deductible does not have to be met before certain services, such as physician office visits or prescription drugs, are covered.
Large majorities of covered workers (77% in HMOs, 78% in PPOs, and 72% in POS plans) with general plan deductibles are enrolled in plans where the deductible does not have to be met before physician office visits for primary care are covered 21.
Similarly, among workers with a general annual deductible, large shares of covered workers in HMOs (95%), PPOs (91%), and POS plans (87%) are enrolled in plans where the general annual deductible does not have to be met before prescription drugs are covered 21.
Hospital and Outpatient Surgery Cost Sharing
In order to better capture the prevalence of combinations of cost sharing for inpatient hospital stays and outpatient surgery, the survey was changed to ask a series of yes or no questions beginning in 2009. The new format allowed respondents to indicate more than one type of cost sharing for these services, if applicable. Previously, the questions asked respondents to select just one response from a list of types of cost sharing, such as separate deductibles, copayments, coinsurance, and per diem payments (for hospitalization only). Due to the change in question format, the distribution of workers with types of cost sharing does not equal 100% as workers may face a combination of types of cost sharing. In addition, the average copayment and coinsurance rates for hospital admissions include workers who may have a combination of these types of cost sharing.
Whether or not a worker has a general annual deductible, most workers face additional types of cost sharing when admitted to a hospital or having outpatient surgery (such as a copayment, coinsurance, or a per diem charge).
For hospital admissions, 61% of covered workers have coinsurance and 16% have copayments. Lower percentages of workers have per day (per diem) payments (7%), a separate hospital deductible (3%), or both copayments and coinsurance (8%), while 17% have no additional cost sharing for hospital admissions after any general annual deductible has been met 22. For covered workers in HMO plans, copayments are more common (37%) and coinsurance (26%) is less common than in other plan types.
The percent of covered workers in a plan which requires coinsurance for hospital admission has increased from 53% in 2010 to 61% in 2013.
The average coinsurance rate is 18%; the average copayment is $278 per hospital admission; the average per diem charge is $264; and the average separate annual hospital deductible is $436 24.
The cost-sharing provisions for outpatient surgery are similar to those for hospital admissions, as most workers have coinsurance or copayments. Sixty-two percent of covered workers have coinsurance and 18% have copayments for an outpatient surgery episode. In addition, 2% have a separate annual deductible for outpatient surgery, and 5% have both copayments and coinsurance, while 19% have no additional cost sharing after any general annual deductible has been met 23.
For covered workers with cost sharing, the average coinsurance is 18%, the average copayment is $140, and the average separate annual outpatient surgery deductible is $726 24.
Cost Sharing for Physician Office Visits
The majority of covered workers are enrolled in health plans that require cost sharing for an in-network physician office visit, in addition to any general annual deductible.12
The most common form of physician office visit cost sharing for in-network services is copayments. Seventy-four percent of covered workers have a copayment for a primary care physician office visit and 20% have coinsurance. For office visits with a specialty physician, 72% of covered workers have copayments and 20% have coinsurance. Workers in HMOs, PPOs, and POS plans are much more likely to have copayments than workers in HDHP/SOs for both primary care and specialty care physician office visits. For example, the majority of workers in HDHP/SOs have coinsurance (55%) or no cost sharing after the general annual plan deductible is met (22%) for primary care physician office visits 25.
Among covered workers with a copayment for in-network physician office visits, the average copayment is $23 for primary care and $35 for specialty physicians 26, similar to $23 and $33 reported in 2012.
Among workers with coinsurance for in-network physician office visits, the average coinsurance rates are 18% for a visit with a primary care physician and 19% for a visit with a specialist 26.
Out-Of-Pocket Maximum Amounts
Most covered workers are in a plan that partially or totally limits the cost sharing that a plan enrollee must pay in a year. These limits are generally referred to as out-of-pocket maximum amounts. Enrollee cost sharing, such as deductibles, office visit cost sharing, or spending on prescription drugs, may or may not apply to the out-of-pocket maximum. Therefore, the survey asks what types of out-of-pocket expenses count when determining whether a covered worker has met the plan out-of-pocket maximum. When a plan does not count certain types of spending, it effectively increases the amount a worker may pay out-of-pocket.
Twelve percent of covered workers are in a plan that does not limit the amount of cost sharing enrollees have to pay for either single or family coverage 31.
Covered workers with single or family coverage in HMOs (25%) are more likely to be enrolled in a plan that does not limit the amount of cost sharing than workers in PPOs (11%) 31.
Covered workers without an out-of-pocket maximum, however, may not have large cost-sharing responsibilities. For example, 76% of covered workers in HMOs with no out-of-pocket maximum for single coverage have no general annual deductible, only 2% have coinsurance for a hospital admission and less than 1% have coinsurance for outpatient surgery episodes.
HSA-qualified HDHPs are required by law to have an out-of-pocket maximum of no more than $6,250 for single coverage and $12,500 for family coverage in 2013. HDHP/HRAs have no such requirement, and among workers enrolled in these plans, 9% have no out-of-pocket maximum for single or family coverage.
For covered workers with out-of-pocket maximums, there is wide variation in spending limits.
Twenty-nine percent of covered workers with an out-of-pocket maximum for single coverage have an out-of-pocket maximum of less than $2,000, while 12% have an out-of-pocket maximum of $5,000 or more 33. Covered workers with an out-of-pocket maximum in small firms (3 to 199 workers) are more likely than such workers in larger firms to be covered by a plan with an out-of-pocket maximum of $3,000 or more (52% vs. 39%).
Like deductibles, some plans have an aggregate out-of-pocket maximum amount for family coverage that applies to cost sharing for all family members, while others have a per-person out-of-pocket maximum that limits the amount of cost sharing that the family must pay on behalf of each family member. Sixty-three percent of covered workers in a plan with an out-of-pocket maximum are in a plan with an aggregate limit 34.
For covered workers with an aggregate out-of-pocket maximum for family coverage, 29% have an out-of-pocket maximum of less than $4,000 and 24% have an out-of-pocket maximum of $8,000 or more 35. Among workers with separate per-person out-of-pocket limits for family coverage, 85% have out-of-pocket maximums of less than $4,000 36.
As noted above, covered workers with an out-of-pocket maximum may be enrolled in a plan where not all spending counts toward the out-of-pocket maximum, potentially exposing workers to higher out-of-pocket spending.
Among workers enrolled in PPO plans with an out-of-pocket maximum for single or family coverage, 34% are in plans that do not count spending for the general annual plan deductible toward the out-of-pocket limit 32.
It is more common for covered workers to be in plans that do not count prescription drug cost sharing toward the out-of-pocket limit. Eighty-four percent of workers enrolled in PPO plans and 71% enrolled in HMO plans with an out-of-pocket maximum for single or family coverage are in plans that do not count prescription drug spending towards the out-of-pocket maximum 32. The ACA will require that all non-grandfathered plans have an out-of-pocket maximum that counts all cost sharing towards the limit.
Section Eight: High-deductible Health Plans With Savings Option
Changes in law over the past few years have permitted the establishment of new types of savings arrangements for health care. The two most common are health reimbursement arrangements (HRAs) and health savings accounts (HSAs). HRAs and HSAs are both financial accounts that workers or their family members can use to pay for health care services. These savings arrangements are often (or, in the case of HSAs, always) paired with health plans with high deductibles. The survey treats high-deductible plans that can be paired with a savings option as a distinct plan type – High-Deductible Health Plan with Savings Option (HDHP/SO) – even if the plan would otherwise be considered a PPO, HMO, POS plan, or conventional health plan. Specifically for the survey, HDHP/SOs are defined as (1) health plans with a deductible of at least $1,000 for single coverage and $2,000 for family coverage13 offered with an HRA (referred to as HDHP/HRAs); or (2) high-deductible health plans that meet the federal legal requirements to permit an enrollee to establish and contribute to an HSA (referred to as HSA-qualified HDHPs).14
Percentage of Firms Offering HDHP/HRAs and HSA-Qualified HDHPs, and Enrollment
Twenty-three percent of firms offering health benefits offer an HDHP/HRA or an HSA-qualified HDHP. Among firms offering health benefits, 6% offer an HDHP/HRA and 17% offer an HSA-qualified HDHP 1.
Firms with 5,000 or more workers are significantly more likely to offer an HDHP/SO than smaller firms. Forty-three percent of firms with 1,000 or more workers offer an HDHP/SO, compared to 22% of firms with 3 to 199 workers, 39% of firms with 200-999 workers 2.
Health Reimbursement Arrangements (HRAs) are medical care reimbursement plans established by employers that can be used by employees to pay for health care. HRAs are funded solely by employers. Employers typically commit to make a specified amount of money available in the HRA for premiums and medical expenses incurred by employees or their dependents. HRAs are accounting devices, and employers are not required to expend funds until an employee incurs expenses that would be covered by the HRA. Unspent funds in the HRA usually can be carried over to the next year (sometimes with a limit). Employees cannot take their HRA balances with them if they leave their job, although an employer can choose to make the remaining balance available to former employees to pay for health care.
HRAs often are offered along with a high-deductible health plan (HDHP). In such cases, the employee pays for health care first from his or her HRA and then out-of-pocket until the health plan deductible is met. Sometimes certain preventive services or other services such as prescription drugs are paid for by the plan before the employee meets the deductible.
Health Savings Accounts (HSAs) are savings accounts created by individuals to pay for health care. An individual may establish an HSA if he or she is covered by a “qualified health plan” which is a plan with a high deductible (i.e., a deductible of at least $1,250 for single coverage and $2,500 for family coverage in 2013) that also meets other requirements.[1] Employers can encourage their employees to create HSAs by offering an HDHP that meets the federal requirements. Employers in some cases also may assist their employees by identifying HSA options, facilitating applications, or negotiating favorable fees from HSA vendors.
Both employers and employees can contribute to an HSA, up to the statutory cap of $3,250 for single coverage and $6,450 for family coverage in 2013. Employee contributions to the HSA are made on a pre-income tax basis, and some employers arrange for their employees to fund their HSAs through payroll deductions. Employers are not required to contribute to HSAs established by their employees but, if they elect to do so, their contributions are not taxable to the employee. Interest and other earnings on amounts in an HSA are not taxable. Withdrawals from the HSA by the account owner to pay for qualified health care expenses are not taxed. The savings account is owned by the individual who creates the account, so employees retain their HSA balances if they leave their job.
Twenty percent of covered workers are enrolled in an HDHP/SO in 2013, similar to the 19% enrolled last year 5. Enrollment in HDHP/SOs had increased significantly in previous years (17% in 2011; 13% in 2010; 8% in 2009).
Nine percent of covered workers are enrolled in HDHP/HRAs in 2013, and 11% percent of covered workers are enrolled in HSA-qualified HDHPs 5.
Plan Deductibles
As expected, workers enrolled in HDHP/SOs have higher deductibles than workers enrolled in HMOs, PPOs, or POS plans.
The average general annual deductible for single coverage is $1,854 for HDHP/HRAs and $2,098 for HSA-qualified HDHPs 7. These averages are similar to the amounts reported in recent years. There is wide variation around these averages 9. Eighteen percent of covered workers are enrolled in a HDHP/SO with a deductible of $3,000 or more.
Since 2006, the survey has collected information on two types of family deductibles. The survey asks employers whether the family deductible amount is (1) an aggregate amount (i.e., the out-of-pocket expenses of all family members are counted until the deductible is satisfied), or (2) a per-person amount that applies to each family member (typically with a limit on the number of family members that would be required to meet the deductible amount).
The average aggregate deductibles for workers with family coverage are $4,059 for HDHP/HRAs and $4,037 for HSA-qualified HDHPs 7. There is wide variation around these average amounts for family coverage 1. Almost a third of covered workers enrolled in HDHP/So plans have an aggregate family deductible of $5,000 dollars or more.
Out-of-Pocket Maximum Amounts
HSA-qualified HDHPs are legally required to have a maximum annual out-of-pocket liability of no more than $6,250 for single coverage and $12,500 for family coverage in 2013. HDHP/HRAs have no similar requirement.
The average annual out-of-pocket maximum for single coverage is $4,093 for HDHP/HRAs15 and $3,509 for HSA-qualified HDHPs 7.
As with deductibles, the survey asks employers whether the family out-of-pocket maximum liability is (1) an aggregate amount that applies to spending by any covered person in the family, or (2) a separate per person amount that applies to spending by each family member or a limited number of family members. The survey also asks whether spending by enrollees on various services counts towards meeting the plan out-of-pocket maximum.
Among covered workers with family coverage whose out-of-pocket maximum is an aggregate amount that applies to spending by any covered person in the family, the average annual out-of-pocket maximums are $8,886 for HDHP/HRAs and $7,077 for HSA-qualified HDHPs 7.
Premiums
In 2013, the average annual premiums for HDHP/HRAs are $5,655 for single coverage and $16,477 for family coverage 8.
The average annual premium for workers in HSA-qualified HDHPs is $5,006 for single coverage and $14,155 for family coverage. These amounts are lower than the average single and family premium for workers in plans that are not HDHP/SOs 7.
Worker Contributions to Premiums
The average annual worker contributions to premiums for workers enrolled in HDHP/HRAs are $1,058 for single coverage and $4,087 for family coverage 8.
The average annual worker contributions to premiums for workers in HSA-qualified HDHPs are $726 for single coverage and $3,241 for family coverage 8. The average contribution for single coverage for workers in HSA-qualified HDHPs is significantly less than the average premium contribution made by covered workers in plans that are not HDHP/SOs 7.
Employer Contributions to Premiums and Savings Options
Employers contribute to HDHP/SOs in two ways: through their contributions toward the premium for the health plan and through their contributions (if any, in the case of HSAs) to the savings account option (i.e., the HRAs or HSAs themselves).
Looking just at the annual employer contributions to premiums, covered workers in HDHP/HRAs on average receive employer contributions of $4,597 for single coverage and $12,390 for family coverage. The average employer contribution for single coverage in HDHP/HRAs is significantly less than the average employer premium contribution for plans that are not HDHP/SOs 8.
The average annual employer contributions to premiums for workers in HSA-qualified HDHPs are $4,280 for single coverage and $10,914 for family coverage. These amounts are lower than the average contributions for single or family coverage for workers in plans that are not HDHP/SOs 8.
When looking at employer contributions to the savings option, workers enrolled in HDHP/HRAs receive, on average, an annual employer contribution to their HRA of $947 for single coverage and $1,800 for family coverage 8.
HRAs are generally structured in such a way that employers may not actually spend the whole amount that they make available to their employees’ HRAs.16 Amounts committed to an employee’s HRA that are not used by the employee generally roll over and can be used in future years, but any balance may revert back to the employer if the employee leaves his or her job. Thus, the employer contribution amounts to HRAs that we capture in the survey may exceed the amount that employers will actually spend.
Workers enrolled in HSA-qualified HDHPs on average receive an annual employer contribution to their HSA of $653 for single coverage and $1,150 for family coverage 8.
In some cases, employers that sponsor HSA-qualified HDHP/SOs do not make contributions to HSAs established by their employees. Fifty-one percent of employers offering single coverage and fifty percent offering family coverage through HSA-qualified HDHPs do not make contributions towards the HSAs that their workers establish 8. Thirty-one percent of workers with single coverage and thirty-two percent of workers with family coverage in an HSA-qualified HDHP do not receive an account contribution from their employer 14 and 15.
The percent of covered workers enrolled in a plan where the employer makes no HSA contribution for single coverage is similar to 34% last year and 26% five years ago.
The average HSA contributions reported above include the portion of covered workers whose employer contribution to the HSA is zero. When those firms that do not contribute to the HSA are excluded from the calculation, the average employer contribution for covered workers is $950 for single coverage and $1,680 for family coverage 7.
Employer contributions to savings account options (i.e., the HRAs and HSAs themselves) for their employees can be added to their health plan premium contributions to calculate total employer contributions toward HDHP/SOs.
For HDHP/HRAs, the average annual total employer contribution for covered workers is $5,544 for single coverage and $14,190 for family coverage. The average total employer contribution amounts for single and family coverage in HDHP/HRAs are higher than the average amount that employers contribute towards single and family coverage in health plans that are not HDHP/SOs 8.
For HSA-qualified HDHPs, the average annual total employer contribution for covered workers is $4,931 for single coverage and $12,065 for workers with family coverage. The total amounts contributed for workers in HSA-qualified HDHPs for single and family coverage are similar to the amounts contributed for workers not in HDHP/SOs 8.
Section Nine: Prescription Drug Benefits
Almost all covered workers have coverage for prescription drugs. More than three in four covered workers are in plans with three or more cost-sharing tiers for prescription drugs. Copayments, rather than coinsurance, continue to be the preferred form of cost sharing in most drug tiers.
As in prior years, nearly all (98%) covered workers in employer-sponsored plans have a prescription drug benefit.
Three-or-More Drug Cost-Sharing Tiers
A large majority of covered workers (92%) in 2013 have a tiered cost-sharing formula for prescription drugs 1. Cost-sharing tiers generally refer to a health plan placing a drug on a formulary or preferred drug list, which classifies drugs as generic, preferred, or non-preferred. Over the past years, an increasing number of plans have created a fourth or even higher tier of drug cost sharing, which may be used for lifestyle drugs or expensive biologics. Employers often place various drugs in generic, preferred, or non-preferred tiers to encourage enrollees to select cheaper alternatives or to pass on to enrollees the higher costs of more expensive drugs.
Eighty-one percent of covered workers are enrolled in plans with three, four, or more tiers of cost sharing for prescription drugs, similar to 77% of covered workers in 2012 1. The percentage of covered workers enrolled in a plan with four or more tiers for prescription drugs has increased from 14% in 2012 to 23% in 2013.
HDHP/SOs have different cost-sharing patterns for prescription drugs than other plan types. Only 45% of covered workers in HDHP/SOs are in a plan with three or more tiers of cost sharing for prescription drugs; 12% are in plans that pay 100% of prescription costs once the plan deductible is met 2.
Twenty-three percent of covered workers are in a plan that has four or more tiers of cost sharing for prescription drugs 1. Among workers covered by plans with three or more tiers of cost sharing for prescription drugs, copayments are far more common than coinsurance in the first three tiers 3. For covered workers in plans with three or more cost-sharing tiers, 39% face a copayment for fourth-tier drugs and 48% face coinsurance 3.
For covered workers in plans with three, four, or more tiers of cost sharing for prescription drugs, the average drug copayments for first-tier drugs ($10), second-tier drugs ($29), third-tier drugs ($52), and fourth-tier ($80) are comparable to the amounts reported in 2012 ($10, $29, $51, and $79, respectively) 4.
For covered workers in plans with three, four, or more tiers of cost sharing for prescription drugs who face coinsurance rather than copayments, coinsurance levels average 16% for first-tier drugs, 25% for second-tier drugs, 38% for third-tier drugs, and 32% for fourth-tier drugs. All of the estimates are similar to last year except for the average coinsurance for first-tier drugs (16%) which is statistically different from 2012 (20%) 4.
Two Drug Cost-Sharing Tiers
Ten percent of covered workers are in a plan that has two tiers for prescription drug cost sharing 1. Similar to workers in plans with more cost-sharing tiers, copayments are more common than coinsurance for workers in plans with two tiers 5. The average copayment for the first tier is $11, and the average copayment for the second tier is $31. The average coinsurance rate for the second tier is 30% 6.
Single Drug Cost-Sharing Tiers
Five percent of covered workers are covered by plans in which cost sharing is the same regardless of the type of drug chosen 1. Among these covered workers, 19% have copayments and 81% have coinsurance 7.
For those workers with the same cost sharing regardless of the type of drug, the average copayment is $12 and the average coinsurance is 22% 8.
Coinsurance rates for prescription drugs often have maximum or minimum dollar amounts associated with the coinsurance rate. Twenty-three percent of workers with a coinsurance rate have a maximum dollar amount attached to the coinsurance rate, 6% have a minimum, and 17% have both for first-tier drugs 9.
Generic drugs: Drugs product that are no longer covered by patent protection and thus may be produced and/or distributed by multiple drug companies.
Preferred drugs: Drugs included on a formulary or preferred drug list; for example, a brand-name drug without a generic substitute.
Nonpreferred drugs: Drugs not included on a formulary or preferred drug list; for example, a brand-name drug with a generic substitute.
Fourth-tier drugs: New types of cost-sharing arrangements that typically build additional layers of higher copayments or coinsurance for specifically identified types of drugs, such as lifestyle drugs or biologics.
Brand-name drugs: Generally, a drug product that is covered by a patent and is thus manufactured and sold exclusively by one firm. Cross-licensing occasionally occurs, allowing an additional firm to market the drug. After the patent expires, multiple firms can produce the drug product, but the brand name or trademark remains with the original manufacturer’s product.
Section Ten: Plan Funding
Federal law (the Employee Retirement Income Security Act of 1974, or ERISA) exempts self-funded plans from state insurance laws, including reserve requirements, mandated benefits, premium taxes, and consumer protection regulations. Three in five covered workers are in a self-funded health plan. Self-funding is common among larger firms because they can spread the risk of costly claims over a large number of employees and dependents. Many self-funded plans use insurance, often called stoploss coverage, to limit the plan sponsor’s liability for very large claims. Almost three in five covered workers in self-funded plans are in plans with stoploss protection.
Self-Funded Plan: An insurance arrangement in which the employer assumes direct financial responsibility for the costs of enrollees’ medical claims. Employers sponsoring self-funded plans typically contract with a third-party administrator or insurer to provide administrative services for the self-funded plan. In some cases, the employer may buy stop-loss coverage from an insurer to protect the employer against very large claims.
Fully Insured Plan: An insurance arrangement in which the employer contracts with a health plan that assumes financial responsibility for the costs of enrollees’ medical claims.
Sixty-one percent of covered workers are in a self-funded plan, similar to the percentage reported in 2012 1. The percentage of covered workers who are in a plan that is completely or partially self-funded has increased over time from 49% in 2000 to 54% in 2005 and to 59% in 2010.
The percentage of covered workers differs by plan type: 70% of covered workers in PPOs, 62% in HDHP/SOs, 31% in HMOs, and 31% in POS plans are in a self-funded plan 5.
As expected, covered workers in large firms (200 or more workers) are significantly more likely to be in a self-funded plan than covered workers in small firms (3-199 workers) (83% vs. 16%) 4. The percentage of covered workers in self-funded plans increases as the number of employees in a firm increases. Seventy-nine percent of covered workers in firms with 1,000 to 4,999 workers and 94% of covered workers in firms with 5,000 or more workers are in self-funded plans in 2013 4.
Fifty-nine percent of workers in self-funded health plans are in plans that have stoploss insurance 10. Stoploss coverage limits the amount that a plan sponsor has to pay in claims. Stoploss coverage may limit the amount of claims that must be paid for each employee or may limit the total amount the plan sponsor must pay for all claims over the plan year.
Eighty-eight percent of covered workers in self-funded plans that have stoploss protection are in plans where the stoploss insurance limits the amount that the plan must spend on each employee 11.17
Firms with per enrollee stoploss coverage were asked for the dollar amount where the stoploss coverage would start to pay for most or all of the claim (called an attachment point). The average attachment point in small firms (50-199 workers) is about $96,000. For larger firms (200 or more workers), the average attachment point is about $317,000 11.
In anticipation of major provisions of the Affordable Care Act (ACA) going into effect in 2014, firms offering health benefits were asked whether they plan to self-insure. Self-funded plans are not required to comply with the medical loss ratio or the essential health benefits rules that apply to some fully insured plans.
Six percent of firms offering fully-insured plans reported they plan to self-insure, 83% reported that they did not plan to self-insure, and 11% did not know 13. There were no significant differences between small and large firms.
Section Eleven: Retiree Health Benefits
Retiree health benefits are an important consideration for older workers making decisions about their retirement. Health benefits for retirees provide an important supplement to Medicare for retirees age 65 or older. Among firms offering health benefits to their workers, large firms (200 or more workers) are much more likely than small firms (3-199 workers) to offer retiree health benefits to at least some of their former employees.
Twenty-eight percent of large firms (200 or more workers) that offer health benefits to their employees offer retiree coverage in 2013, similar to 25% in 2012. There has been a downward trend in the percentage of firms offering retirees coverage, from 34% in 2006 and 66% in 1988 1.
The offering of retiree health benefits varies considerably by firm characteristics.
Large firms are much more likely to offer retiree health benefits than small firms – 28% vs. 5% 2.
Among large firms that offer health benefits, state and local governments (78%) and firms in the finance (52%) industry are more likely than large firms in other industries to offer retiree health benefits. In contrast, large firms in the wholesale industry are less likely (6%) to offer retiree health benefits when compared to large firms in other industries 2.
Large firms with fewer lower-wage workers (less than 35% of workers earn $23,000 or less annually) are more likely to offer retiree health benefits than large firms with many lower-wage workers (35% or more of workers earn $23,000 or less annually) (32% vs. 6%). A comparable pattern exists in firms with a larger proportion of higher-wage workers (35% or more earn $56,000 or more annually) 3.
Large firms with union workers are more likely to offer retiree health benefits than large firms without union workers – 45% vs. 22% 3.
Large, publicly owned employers are more likely to offer retiree benefits than large private for-profits firms or private not-for-profits employers. (61% vs. 24% and 20%, respectively) 3.
Among all large firms (200 or more workers) offering retiree health benefits, most firms offer them to early retirees under the age of 65 (90%). A lower percentage (67%) of large firms offering retiree health benefits offer them to Medicare-age retirees 4. These percentages are similar to 2012 and have remained stable over time.
Among all large firms (200 or more workers) offering retiree health benefits, 4% offer coverage which exclusively covers prescription drugs 6.
Section Twelve: Wellness Programs And Health Risk Assessments
A majority of firms offering health benefits offers some type of wellness program, with large firms (200 or more workers) being more likely than smaller firms (3-199 workers) to do so. Thirty-six percent of large firms and 8% of small firms offering at least one wellness benefit offer financial incentives to employees who participate in wellness programs. Twenty-four percent of firms offer employees the opportunity to complete health risk assessments, with some of these firms tying financial penalties or rewards to employees who do so. Disease management programs remain common among firms offering health benefits with over half of these firms and more than three-quarters of large firms (200 or more workers) having at least one of the specified programs.
Wellness Benefits
For a variety of reasons, including efforts to improve health and lower costs, many employers and health plans offer wellness programs. Wellness programs may range from classes in nutrition or healthy living to a wellness newsletter.
Seventy-seven percent of firms offering health benefits offer at least one of the following wellness programs:
Weight loss programs
Biometric screenings
Gym membership discounts or on-site exercise facilities
Smoking cessation program
Lifestyle or behavioral coaching, classes in nutrition or healthy living
Web-based resources for healthy living
Flu shot or vaccinations
Employee assistance program (EAP)
Wellness newsletter
In the 2012 survey, offering firms were not asked if they offered an “EAP” or “flu shots and vaccinations”. Excluding these two categories, 69% of all firms offering health benefits also offered one of the listed wellness programs in 2013, similar to the amount in 2012 (63%).
Large firms (200 or more workers) offering health benefits are more likely to offer each of the listed wellness programs than smaller firms. In addition, large firms (200 or more workers) offering health benefits are more likely to offer at least one of the listed wellness programs than smaller firms (99% vs. 76%) 2.
About half of firms offering health benefits offer flu shots or vaccinations (54%), a wellness newsletter (48%) or web-based resources for healthy living (47%). The offer rate for each type of wellness benefit included in the survey is presented in 1, 2, and 3.
Forty-eight percent of firms offering health benefits and at least one wellness benefit offer wellness benefits to spouses or dependents. Large firms (200 or more workers) offering at least one wellness benefit are more likely than smaller firms to offer wellness benefits to spouses or dependents (65% vs. 47%) 4.
Among firms offering health benefits and at least one wellness program, 80% report that most of the wellness benefits they offer are provided by the health plan 4.18 Small firms (3 to 199 workers) are more likely than larger firms to report that most wellness programs are provided by the health plan (81% vs. 56%) 4.
Incentives for Wellness Benefits:
In order to encourage participation in wellness programs, firms may offer financial incentives to employees who participate.19
Eight percent of firms offering health benefits and at least one of the listed wellness programs offer gift cards, travel, merchandise, or cash to workers who participate in wellness programs. Large firms (200 or more workers) are more likely to offer these incentives than smaller firms (26% vs. 7%) 5.
A small percentage of firms offering health benefits and at least one of the listed wellness programs offers lower worker premium contributions (3%) or cost sharing (such as lower deductibles) (1%) as an incentive to encourage employees to participate. Among firms that offer a high-deductible health plan paired with a HRA or HSA, one percent offers workers who participate in wellness programs higher HSA or HRA contributions 5.
Employers use a variety of strategies to promote wellness programs. Large employers (200 or more employees) offering health benefits and at least one wellness program are more likely than smaller employers to use one of the following strategies to promote wellness (79% vs. 55%) 11:
Assigning an employee to promote wellness
Access to a benefits counselor
Incentives
Personalized communication
Team competitions
Social media tools
Nearly half of large firms (200 or more workers) offering health benefits and at least one wellness program use personalized communication (49%) or assign an employee (45%) to promote wellness programs.
Employers use a range of strategies to evaluate wellness programs. Seventy-two percent of large firms (200 or more workers) offering health benefits and at least one wellness program and 34% of smaller firms use at least one of the following evaluation methods 12:
Return on investment
Health outcomes
Employee retention
Employee participation
Employee satisfaction
For large firms (200 or more workers) offering health benefits and at least one wellness benefit, employee participation is the most common metric (65%) 12.
Health Risk Assessments
Some firms give their employees the opportunity to complete a health risk assessment to identify potential health issues. Health risk assessments generally include questions about medical history, health status, and lifestyle.
Overall, 24% of firms offering health benefits ask their employees to complete a health risk assessment. Large firms (200 or more workers) are more likely than smaller firms to offer employees this option (55% vs. 23%) 6.
Some firms offer financial incentives to encourage employees to complete health risk assessments.
Fifty-four percent of large firms (200 or more workers) offering health benefits and health risk assessments give financial incentives to employees who complete a health risk assessment.
Five percent of large firms (200 or more workers) who offer health benefits and health risk assessments require employees to complete a health risk assessment in order to enroll in a health plan.
Nine percent of large firms (200 or more workers) that offer health benefits and provide employees the opportunity to complete a health risk assessment penalize employees with identified health risks factors who do not complete a wellness program (9%) 7.
Biometric Screening
Biometric screening is a health examination that measures an employee’s risk factors, such as cholesterol, blood pressure, stress, and nutrition. Biometric outcomes may include meeting a target body mass index (BMI) or cholesterol level. Twenty-six percent of small firms (3 to 199 workers) and 55% of larger firms offering health benefits offer biometric screenings as a wellness benefit 1.
Firms which offer their employees biometric screenings may include additional incentives for those employees who complete screenings. Among large firms (200 or more workers) offering health benefits and biometric screenings, eleven percent reward or penalize employees for meeting biometric outcomes and eleven percent require employees to complete biometric screenings in order to enroll in a health plan 14.
Disease Management
Disease management programs try to improve the health of and reduce the associated costs of people with chronic illnesses by teaching patients about their disease, suggesting treatment options, and assessing the treatment process and outcomes.
Fifty-seven percent of firms offering health benefits offers one or more of the following disease management programs in their largest plan208:
Diabetes
Asthma
Hypertension
High cholesterol
Lower back pain
Depression
Obesity
Large firms (200 or more workers) offering health benefits are more likely than smaller firms to have a disease management program (77% vs. 57%) 9. Seventy-three percent of large firms offering health benefits have a disease management program for diabetes.
To encourage participation, two percent of firms offering health benefits and at least one of the specified disease management programs also offer financial incentives to employees who participate in these programs 10. Large, offering firms (200 or more workers) that offer disease management programs are more likely than smaller firms to have an incentive for participating in a disease management program (8% vs. 2%).
Section Thirteen: Grandfathered Health Plans
The Affordable Care Act (ACA) is bringing about a number of meaningful changes for the American health care system, including for the employer-sponsored health insurance market. While many of the most significant provisions of the ACA will begin in 2014, some are already in effect (for more information, see the health reform implementation timeline at http://www.kff.org/interactive/implementation-timeline/). The ACA exempts certain health plans that were in effect when the law was passed, referred to as grandfathered plans, from some of the new standards in the law; these include requirements to cover preventive benefits without cost sharing, have an external appeals process, or comply with the new benefit and rating provisions in the small group market. Overall, 54% of firms offering health benefits have at least one health plan that is a grandfathered plan in 2013.
Although some important provisions of the ACA will become effective sometime in 2014, we generally did not ask employers in the 2013 survey how they planned to respond to the new requirements. In many cases, rules were not finalized until after the interview process began, so employers did not have all the information necessary to formulate proper responses. We will track employer responses to changes in the market in future surveys.
Grandfathering
For the employer-sponsored market, health plans that were in place when the ACA was enacted (March 2010) can be grandfathered health plans. Interim final rules released by the Department of Health and Human Services on June 17, 2010, and amended on November 17, 2010, stipulate that firms cannot significantly change cost sharing, benefits, employer contributions, or access to coverage in grandfathered plans.21 New employees can enroll in a grandfathered plan as long as the firm has maintained consecutive enrollment in the plan.
While grandfathered plans are exempted from many of the ACA’s new requirements, they must comply with many provisions as they become effective, including: (1) provide a uniform explanation of coverage, (2) report medical loss ratios and provide premium rebates if medical loss ratios are not met, (3) prohibit lifetime and annual limits on essential health benefits, (4) extend dependent coverage to age 26, (5) prohibit health plan rescissions, (6) prohibit waiting periods greater than 90 days, and (7) prohibit coverage exclusions for pre-existing health conditions.22 Firms must decide whether to grandfather their insurance plans, which limits the changes they can make to their plans, or whether to comply with the full set of new health reform requirements.
Fifty-four percent of firms offering health benefits have at least one health plan that is a grandfathered plan in 2013 1, similar to the 58% of offering firms with at least one grandfathered plan in 2012, but lower than the 64% in 2011.
Worker enrollment in grandfathered plans has decreased, with 36% of covered workers enrolled in a grandfathered health plan in 2013, down from 48% in 2012 and 56% in 2011 3.
There are differences in the percentage of covered workers enrolled in grandfathered plans by firm size and region.
Fewer covered workers at large firms (200 or more workers) are enrolled in a grandfathered health plan than covered workers at smaller firms (30% vs. 49%).
Fewer covered workers in the Northeast region (27%) are enrolled in grandfathered health plans than covered workers in other regions.
Section Fourteen: Employer Opinions And Health Plan Practices
Employers play a significant role in health insurance coverage – so their opinions and experiences are important factors in health policy discussions.
Employer Opinions on Cost Containment
Firms offering health benefits were asked to rate how effective several different strategies, such as wellness programs, tighter managed care restrictions, consumer-driven health plans, higher employee cost sharing, and disease management programs, would be in reducing the growth of health insurance costs.
Thirty-five percent of firms offering health benefits stated that wellness programs would be very effective at containing health insurance costs, more than any of the other strategies. There was no statistical difference in the distribution of opinions between small (3 to 199 workers) and larger firms towards the effectiveness of wellness programs (Exhibit 14.1).
Eight percent of firms offering health benefits stated that tighter managed care restrictions would be “very effective” at containing health insurance costs, fewer than any of the other strategies (Exhibit 14.1). Larger firms were more likely than smaller firms to state that tighter managed care restrictions were “very effective”.
Shopping for Health Coverage
More than one-half (54%) of firms offering health benefits reported shopping for a new health plan or a new insurance carrier in the past year, suggesting that the market is quite dynamic
Among firms that offer health benefits and shopped for a new plan or carrier, 18% changed insurance carriers and 15% reported changing the type of health plan provided to employees. A firm is considered to have changed health plan types when they switch between conventional, HMO, PPO, POS or HDHP/SO plans. There were no significant differences between small firms (3 to 199 workers) and larger firms on either these measures (Exhibit 14.3).
The majority of firms offering health benefits use a broker or consultant to assist in choosing a health plan (82%)
Large firms offering health benefits (200 or more workers) are more likely than smaller firms to use a broker or consultant (90% versus 82%).
Retail Clinics and Nurse Hotlines
Among firms offering health benefits, over half (56%) cover care received at retail clinics in their plan with the largest enrollment. Retail clinics treat minor illness and provide preventive care at locations such as retail stores, pharmacies, and supermarkets. Among these firms covering care at retail clinics, 17% offer financial incentives to receive care at a retail clinic location rather than at a physician’s office. There is no significant difference between small firms (3 to 199 workers) and larger firms covering care received at a retail clinic or for offering financial incentives to do so (Exhibit 14.5).
Among plans with the largest enrollment in firms offering health benefits, over half include a nurse hotline (55%). Large firms offering health benefits (200 or more workers) are more likely than smaller firms to have a nurse hotline (74% vs. 54%) (Exhibit 14.7).
Tiered Networks
A tiered or high performance network is one that groups providers into the network based on quality, cost, and/or the efficiency of the care they deliver. These networks encourage patients to visit more efficient doctors by either restricting networks to efficient providers, or by having different copayments or coinsurance for providers in different tiers in the network.
Twenty-three percent of firms that offer health benefits include a high performance or tiered provider network in the health plan with the largest enrollment (Exhibit 14.4). This is similar to the 20% reported in 2011 (the last time these questions were asked).
Offering Health Benefits through a Private Exchange
Recently, several large consulting firms have created private exchanges to offer health benefit options for mid-sized and larger employers. While models vary, the general idea is that the exchange contracts with different health plan vendors and offers a number of different health plan options to the employees of participating employers. This permits an employer to offer a larger variety of health plans to employees, and to structure contributions or other rules to encourage employees to choose more efficient plans.
Nine percent of large firms (200 or more workers) offering health benefits are considering offering benefits through a private exchange. Among offering firms with at least 5,000 workers, 29% are considering offering benefits through the exchange (Exhibit 14.6).
Survey Design And Methods
The Kaiser Family Foundation and the Health Research & Educational Trust (Kaiser/HRET) conduct this annual survey of employer-sponsored health benefits. HRET, a nonprofit research organization, is an affiliate of the American Hospital Association. The Kaiser Family Foundation designs, analyzes, and conducts this survey in partnership with HRET, and also pays for the cost of the survey. KFF contracts with researchers at NORC at the University of Chicago (NORC) to work with Foundation and HRET researchers in conducting the study. Kaiser/HRET retained National Research, LLC (NR), a Washington, D.C.-based survey research firm, to conduct telephone interviews with human resource and benefits managers using the Kaiser/HRET survey instrument. From January to May 2013, NR completed full interviews with 2,067 firms.
Survey Topics
As in past years, Kaiser/HRET asked each participating firm as many as 400 questions about its largest health maintenance organization (HMO), preferred provider organization (PPO), point-of-service (POS) plan, and high-deductible health plan with a savings option (HDHP/SO).23 We treat EPOs and HMOs as one plan type and report the information under the banner of “HMO”; if an employer sponsors both an HMO and an EPO, they are asked about the attributes of the plan with the larger enrollment. Similarly, in 2013, plan information for conventional (or indemnity) plans was collected within the PPO battery following a similar approach. Less than one percent of firms which completed the PPO section had more enrollment in a conventional plan than a PPO plan.
As in past years, the survey includes questions on the cost of health insurance, health benefit offer rates, coverage, eligibility, enrollment patterns, premiums,24 employee cost sharing, prescription drug benefits, retiree health benefits, wellness benefits, and employer opinions.
Response Rate
After determining the required sample from U.S. Census Bureau data, Kaiser/HRET drew its sample from a Survey Sampling Incorporated list (based on an original Dun and Bradstreet list) of the nation’s private employers and from the Census Bureau’s Census of Governments list of public employers with three or more workers. To increase precision, Kaiser/HRET stratified the sample by ten industry categories and six size categories. Kaiser/HRET attempted to repeat interviews with prior years’ survey respondents (with at least ten employees) who participated in either the 2011 or the 2012 survey, or both. As a result, 1,622 of the 2,067 firms that completed the full survey also participated in either the 2011 or 2012 surveys, or both.25 The overall response rate is 49%.26
The vast majority of questions are asked only of firms that offer health benefits. A total of 1,865 of the 2,067 responding firms indicated that they offered health benefits. The response rate for firms that offer health benefits is 50%.
We asked one question of all firms in the study that we made phone contact with but the firm declined to participate. The question was, “Does your company offer a health insurance program as a benefit to any of your employees?” A total of 2,948 firms responded to this question (including 2,067 who responded to the full survey and 881 who responded to this one question). These responses are included in our estimates of the percentage of firms offering health benefits.27 The response rate for this question is 70%. In 2012 the calculation of the response rates was adjusted to be slightly more conservative than previous years.
Firm Size Categories and Key Definitions
Throughout the report, exhibits categorize data by size of firm, region, and industry. Firm size definitions are as follows: small firms: 3 to 199 workers; and large firms: 200 or more workers. Exhibit M.1 shows selected characteristics of the survey sample. A firm’s primary industry classification is determined from SSI’s designation on the sampling frame. A firm’s ownership category and other firm characteristics used in exhibits such as 3.2 and 6.19 are based on respondents’ answers.
Exhibit M.2 displays the distribution of the nation’s firms, workers, and covered workers (employees receiving coverage from their employer). Among the over three million firms nationally, approximately 60.8% are firms employing 3 to 9 workers; such firms employ 8.2% of workers, and 3.6% of workers covered by health insurance. In contrast, less than one percent of firms employ 1,000 or more workers; these firms employ 48% of workers and 53% of covered workers. Therefore, the smallest firms dominate any statistics weighted by the number of employers. For this reason, most statistics about firms are broken out by size categories. In contrast, firms with 1,000 or more workers are the most important employer group in calculating statistics regarding covered workers, since they employ the largest percentage of the nation’s workforce.
Throughout this report, we use the term “in-network” to refer to services received from a preferred provider. Family coverage is defined as health coverage for a family of four.
Each year, the survey asks firms for the percentage of their employees who earn less than a specified amount in order to identify the portion of a firm’s workforce that has relatively low wages. This year, the income threshold is $23,000 per year for low-wage workers and $56,000 for high-wage workers. These thresholds are based on the 25th and 75th percentile of workers’ earnings as reported by the Bureau of Labor Statistics using data from the Occupational Employment Statistics (OES) (2011).28 The cutoffs were inflation adjusted and rounded to the nearest thousand. In previous years wage cuts offs were calculated using the now eliminated National Compensation Survey.
Rounding and Imputation
Some exhibits in the report do not sum to totals due to rounding effects. In a few cases, numbers from distribution exhibits may not add to the numbers referenced in the text due to rounding. Although overall totals and totals for size and industry are statistically valid, some breakdowns may not be available due to limited sample sizes. Where the unweighted sample size is fewer than 30 observations, exhibits include the notation “NSD” (Not Sufficient Data).
To control for item nonresponse bias, Kaiser/HRET imputes values that are missing for most variables in the survey. On average, 3% of observations are imputed. All variables are imputed following a hotdeck approach. In 2013, there were 14 variables where the imputation rate exceeded 20%. For these cases, the unimputed variable is compared with the imputed variable. There are a few variables that Kaiser/HRET has decided not to impute; these are typically variables where “don’t know” is considered a valid response option (for example, firms’ opinions about effectiveness of various strategies to control health insurance costs). In addition, there are several variables in which missing data is calculated based on respondents’ answers to other questions (for example, when missing employer contributions to premiums are calculated from the respondent’s premium and the ratio of contributions to premiums).
In 2012 the method to calculate missing premiums and contributions was revised; if a firm provides a premium for single coverage or family coverage, or a worker contribution for single coverage or family coverage, that information was used in the imputation. For example, if a firm provided a worker contribution for family coverage but no premium information, a ratio between the family premium and family contribution was imputed and then the family premium was calculated. In addition, in cases where premiums or contributions for both family and single coverage were missing, the hotdeck procedure was revised to draw all four responses from a single firm. The change in the imputation method did not make a significant impact on the premium or contribution estimates.
Sample Design
We determined the sample requirements based on the universe of firms obtained from the U.S. Census. Prior to the 2010 survey, the sample requirements were based on the total counts provided by Survey Sampling Incorporated (SSI) (which obtains data from Dun and Bradstreet). Over the years, we found the Dun and Bradstreet frequency counts to be volatile due to duplicate listings of firms, or firms that are no longer in business. These inaccuracies vary by firm size and industry. In 2003, we began using the more consistent and accurate counts provided by the Census Bureau’s Statistics of U.S. Businesses and the Census of Governments as the basis for post-stratification, although the sample was still drawn from a Dun and Bradstreet list. In order to further address this concern at the time of sampling, starting in 2009 we use Census data as the basis for the sample.
Starting in 2010, we also defined Education as a separate sampling category, rather than as a subgroup of the Service category. In the past, Education firms were a disproportionately large share of Service firms. Education is controlled for during post-stratification, and adjusting the sampling frame to also control for Education allows for a more accurate representation of both the Education and Service industries.
In past years, both private and government firms were sampled from the Dun and Bradstreet database. Beginning in 2009, Government firms were sampled from the 2007 Census of Governments. This change was made to eliminate the overlap of state agencies that were frequently sampled from the Dun and Bradstreet database. The sample of private firms is screened for firms that are related to state/local governments, and if these firms are identified in the Census of Governments, they are reclassified as government firms and a private firm is randomly drawn to replace the reclassified firm. The federal government is not included in the sample frame.
Finally, the data used to determine the 2013 Employer Health Benefits sample frame include the U.S. Census’ 2009 Statistics of U.S. Businesses and the 2007 Census of Governments. At the time of the sample design (December 2012), these data represented the most current information on the number of public and private firms nationwide with three or more workers. As in the past, the post-stratification is based on the most up-to-date Census data available (the 2010 update to the Census of U.S. Businesses was purchased during the survey field period). The Census of Governments is conducted every five years; this is the fifth year the data from the 2007 Census of Governments has been available for use.
In 2012, the method for calculating the size of the sample was adjusted. Rather than using a combined response rate for panel and non-panel firms, separate response rates were used to calculate the number of firms to be selected in each strata. In addition, the Mining stratum was collapsed into the Agriculture and Construction industry grouping. In sum, changes to the sampling method required more firms to be included and may have reduced the response rate in order to provide more balanced power within each strata.
Weighting and Statistical Significance
Because Kaiser/HRET selects firms randomly, it is possible through the use of statistical weights to extrapolate the results to national (as well as firm size, geography, regional, and industry) averages. These weights allow Kaiser/HRET to present findings based on the number of workers covered by health plans, the number of total workers, and the number of firms. In general, findings in dollar amounts (such as premiums, worker contributions, and cost sharing) are weighted by covered workers. Other estimates, such as the offer rate, are weighted by firms. Specific weights were created to analyze the HDHP/SO plans that are offered with an HRA or that are HSA-qualified. These weights represent the proportion of employees enrolled in each of these arrangements.
Calculation of the weights follows a common approach. First, the basic weight is determined, followed by a nonresponse adjustment. As part of this nonresponse adjustment, Kaiser/HRET conducted a small follow-up survey of those firms with 3 to 49 workers that refused to participate in the full survey. Just as in years passed, Kaiser/HRET conducted a McNemar test to verify that the results of the follow-up survey are comparable to the results from the original survey. Next, we trimmed the weights in order to reduce the influence of weight outliers. First, we identified common groups of observations. Within each group, we identified the median and the interquartile range of the weights and calculated the trimming cut point as the median plus six times the interquartile range (M + [6 * IQR]). Weight values larger than this cut point are trimmed to the cut point. In all instances, less than one percent of the weight values were trimmed. Finally, we calibrated the weights to U.S. Census Bureau’s 2009 Statistics of U.S. Businesses for firms in the private sector, and the 2007 Census of Governments as the basis for calibration / post-stratification for public sector firms. Historic employer weighted statistics were updated in 2011.
Between 2006 and 2012 only limited information was collected on conventional plans. Starting in 2013, information on conventional plans was collected under the PPO section and therefore the covered worker weight was representative of all plan types.
The survey contains a few questions on employee cost sharing that are asked only of firms that indicate in a previous question that they have a certain cost-sharing provision. For example, the copayment amount for prescription drugs is asked only of those that report they have copayments for prescription drugs. Because the composite variables (using data from across all plan types) are reflective of only those plans with the provision, separate weights for the relevant variables were created in order to account for the fact that not all covered workers have such provisions.
To account for design effects, the statistical computing package R and the library package “survey” were used to calculate standard errors.29,30 All statistical tests are performed at the .05 confidence level, unless otherwise noted. For figures with multiple years, statistical tests are conducted for each year against the previous year shown, unless otherwise noted. No statistical tests are conducted for years prior to 1999. In 2012 the method to test the difference between distributions across years was changed to use a Wald test which accounts for the complex survey design. In general this method was more conservative than the approach used in prior years. Exhibits such as 7.9, 7.10, 7.16 etc. are affected by the change.
Statistical tests for a given subgroup (firms with 25-49 workers, for instance) are tested against all other firm sizes not included in that subgroup (all firm sizes NOT including firms with 25-49 workers, in this example). Tests are done similarly for region and industry; for example, Northeast is compared to all firms NOT in the Northeast (an aggregate of firms in the Midwest, South, and West). However, statistical tests for estimates compared across plan types (for example, average premiums in PPOs) are tested against the “All Plans” estimate. In some cases, we also test plan-specific estimates against similar estimates for other plan types (for example, single and family premiums for HDHP/SOs against single and family premiums for HMO, PPO, and POS plans); these are noted specifically in the text. The two types of statistical tests performed are the t-test and the Wald test.
The small number of observations for some variables resulted in large variability around the point estimates. These observations sometimes carry large weights, primarily for small firms. The reader should be cautioned that these influential weights may result in large movements in point estimates from year to year; however, often these movements are not statistically significant.
Additional Notes on the 2013 Survey
In 2012, average coinsurance rates for prescription drugs, primary care office visits, specialty office visits, and emergency room visits include firms that have a minimum and/or maximum attached to the rate. In years prior to 2012, we did not ask firms the structure of their coinsurance rate. For most prescription drug tiers, and most services, the average coinsurance rate is not statistically different depending on whether the plan has a minimum or maximum.
Historical Data
Data in this report focus primarily on findings from surveys jointly authored by the Kaiser Family Foundation and the Health Research & Educational Trust, which have been conducted since 1999. Prior to 1999, the survey was conducted by the Health Insurance Association of America (HIAA) and KPMG using a similar survey instrument, but data are not available for all the intervening years. Following the survey’s introduction in 1987, the HIAA conducted the survey through 1990, but some data are not available for analysis. KPMG conducted the survey from 1991-1998. However, in 1991, 1992, 1994, and 1997, only larger firms were sampled. In 1993, 1995, 1996, and 1998, KPMG interviewed both large and small firms. In 1998, KPMG divested itself of its Compensation and Benefits Practice, and part of that divestiture included donating the annual survey of health benefits to HRET.
This report uses historical data from the 1993, 1996, and 1998 KPMG Surveys of Employer-Sponsored Health Benefits and the 1999-2013 Kaiser/HRET Survey of Employer-Sponsored Health Benefits. For a longer-term perspective, we also use the 1988 survey of the nation’s employers conducted by the HIAA, on which the KPMG and Kaiser/HRET surveys are based. The survey designs for the three surveys are similar.
Endnotes
Kaiser Family Foundation, Kaiser Commission on Medicaid and the Uninsured, The Uninsured: A Primer: Key Facts About Americans Without Health Insurance, October 2012. http://modern.kff.org/uninsured/issue-brief/the-uninsured-a-primer/. 56% of the non-elderly American population receives insurance coverage through an employer-sponsored plan. ↩︎
Kaiser/HRET surveys use the April-to-April time period, as do the sources in this and the following note. The inflation numbers are not seasonally adjusted. Bureau of Labor Statistics. Consumer Price Index – All Urban Consumers [Internet]. Washington (DC): Department of Labor; 2012 [cited 2013 June 16]. Available from: http://data.bls.gov/timeseries/CUUR0000SA0?output_view=pct_1mth. Wage data are from the Bureau of Labor Statistics and based on the change in total average hourly earnings of production and nonsupervisory employees. Employment, hours, and earnings from the Current Employment Statistics survey [Internet]. Washington (DC): Department of Labor; 2013 [cited 201 June 16]. Available from: http://data.bls.gov/timeseries/CES0500000008. ↩︎
Fronstin P. Private health insurance exchanges and defined contribution health plans: is it déjà vu all over again?. Washington (DC): Employee Benefit Research Institute; 2012 Jul [cited 2013 Jul 19]. (Issue Brief No. 373). Available from: http://www.ebri.org/pdf/briefspdf/EBRI_IB_07-2012_No373_Exchgs2.pdf. ↩︎
Kaiser Family Foundation, Kaiser Commission on Medicaid and the Uninsured, The Uninsured: A Primer: Key Facts About Americans Without Health Insurance, October 2012. http://modern.kff.org/uninsured/issue-brief/the-uninsured-a-primer/. 56% of the non-elderly American population receives insurance coverage through an employer-sponsored plan. ↩︎
In 2009, Kaiser/HRET began weighting the percentage of workers that take up coverage by the number of workers eligible for coverage. The historical take up estimates have also been updated. See the Survey Design and Methods section for more information. ↩︎
Starting in 2010 we included firms that said they offer a plan type even if there are no covered workers in that plan type. ↩︎
Estimates for premiums, worker contributions to premiums, and employer contributions to premiums presented in Section 6 do not include contributions made by the employer to Health Savings Accounts (HSAs) or Health Reimbursement Arrangements (HRAs). See Section 8 for estimates of employer contributions to HSAs and HRAs. ↩︎
For definitions of Self-Funded and Fully Insured plans, see the introduction to Section 10. ↩︎
Some workers with separate per-person deductibles or out-of-pocket maximums for family coverage do not have a specific number of family members that are required to meet the deductible amount and instead have another type of limit, such as a per-person amount with a total dollar amount limit. These responses are included in the averages and distributions for separate family deductibles and out-of-pocket maximums. ↩︎
Starting in 2010, the survey asked about the prevalence and cost of physician office visits separately for primary care and specialty care. Prior to the 2010 survey if the respondent indicated the plan had a copayment for office visits, we assumed the plan had a copayment for both primary and specialty care visits. The survey did not allow for a respondent to report that a plan had a copayment for primary care visits and coinsurance for visits with a specialist physician. The changes made in 2010 allow for variations in the type of cost sharing for primary care and specialty care. This year the survey includes cost sharing for in-network services only. See the 2007 survey for information on out-of-network office visit cost sharing. ↩︎
There is no legal requirement for the minimum deductible in a plan offered with an HRA. The survey defines a high-deductible HRA plan as a plan with a deductible of at least $1,000 for single coverage and $2,000 for family coverage. Federal law requires a deductible of at least $1,250 for single coverage and $2,500 for family coverage for HSA-qualified HDHPs in 2013. See the Text Box for more information on HDHP/HRAs and HSA-qualified HDHPs. ↩︎
The definitions of HDHP/SOs do not include other consumer-driven plan options, such as arrangements that combine an HRA with a lower-deductible health plan or arrangements in which an insurer (rather than the employer as in the case of HRAs or the enrollee as in the case of HSAs) establishes an account for each enrollee. Other arrangements may be included in future surveys as the market evolves. ↩︎
The average out-of-pocket maximum for HDHP/HRAs is calculated for plans with an out-of-pocket maximum. About 9% of covered workers in HDHP/HRAs with single coverage or family coverage are in plans that reported having no limit on out-of-pocket expenses. ↩︎
In the survey, we ask, “Up to what dollar amount does your firm promise to contribute each year to an employee’s HRA or health reimbursement arrangement for single coverage?” We refer to the amount that the employer commits to make available to an HRA as a contribution for ease of discussion. As discussed, HRAs are notional accounts, and employers are not required to actually transfer funds until an employee incurs expenses. Thus, employers may not expend the entire amount that they commit to make available to their employees through an HRA. ↩︎
This includes stoploss insurance plans that limit a firm’s per employee spending as well as plans that limit both a firm’s overall spending and per employee spending. ↩︎
The survey asks firms offering at least one wellness program if most of the wellness benefits are provided by the health plan or by the firm. ↩︎
Firms that offer only web-based resources or a wellness newsletter were not asked questions about any financial incentives provided. ↩︎
In 2013, firms were asked if they offer each of the specified disease management programs. In previous years, firms were asked if they offered a disease management program and then were accordingly asked about specified programs. For this reasons, the estimate of the number of firms offering a disease management program in 2013 is not comparable to the estimates from 2010 and 2008. ↩︎
United States. Congressional Research Service CRS. Open CRS. By Bernadette Fernandez. Grandfathered Health Plans Under the Patient Protection and Affordable Care Act (PPACA), Jan. 3, 2011. http://assets.opencrs.com/rpts/R41166_20110103.pdf. ↩︎
HDHP/SO includes high-deductible health plans offered with either a Health Reimbursement Arrangement (HRA) or a Health Savings Account (HSA). Although HRAs can be offered along with a health plan that is not an HDHP, the survey collected information only on HRAs that are offered along with HDHPs. For specific definitions of HDHPs, HRAs, and HSAs, see the introduction to Section 8. ↩︎
HDHP/SO premium estimates do not include contributions made by the employer to Health Savings Accounts or Health Reimbursement Arrangements. ↩︎
In total, 163 firms participated in 2011 and 2013, 359 firms participated in 2012 and 2013, and 1,100 firms participated in 2011, 2012, and 2013. ↩︎
Response rate estimates are calculated by dividing the number of completes over the number of refusals and the fraction of the firms with unknown eligibility to participate estimated to be eligible. Firms determined to be ineligible to complete the survey are not included in the response rate calculation. ↩︎
Estimates presented in Exhibits 2.1, 2.2 and 2.3 are based on the sample of both firms that completed the entire survey and those that answered just one question about whether they offer health benefits. ↩︎
Analysis of the 2011 survey data using both R and SUDAAN (the statistical package used prior to 2012) produced the same estimates and standard errors. Research Triangle Institute (2008). SUDAAN Software for the Statistical Analysis of Correlated Data, Release 10.0, Research Triangle Park, NC: Research Triangle Institute. ↩︎
The Affordable Care Act (ACA) (P.L.111-148) is most widely recognized for its expansion of affordable coverage to low-income parents and adults, however, a lesser-known feature of the ACA facilitates alignment of Medicaid coverage across families at 133 percent of the federal poverty level (FPL) ($31,322 for a family of four in 2013).1 Today, all states must minimally cover children under the age of six in families with income of up to at least 133 percent of the FPL in Medicaid while older children and teens with incomes above 100 percent of the FPL ($23,550 for a family of four in 2013) may be covered in separate state Children’s Health Insurance Programs (CHIP). This split source of coverage for children, also referred to as “stairstep” eligibility, results in different aged children in the same family being enrolled in different coverage programs with different benefits, provider networks and cost-sharing, as well as disparate enrollment and renewal procedures. (See Graph 1 below)
Graph 1. Children’s Medicaid and CHIP Coverage in the United States.2
When the ACA was enacted, twenty-one (21) states had stairstep eligibility. In 2011, New York began an early transition, and New Hampshire took a bolder step and moved all of its CHIP kids into Medicaid. Following in the footsteps of New Hampshire, California is currently in the process of phasing in a transition of all children from its separate CHIP program, known as Healthy Families, into the state’s Medicaid program. In January 2013, Colorado also began a phased-in implementation to align Medicaid coverage for children of all ages.
The remaining 17 states that must transition the stairstep kids by January 1, 2014 are: Alabama, Arizona, Delaware, Florida, Georgia, Kansas, Mississippi, Nevada, North Carolina, North Dakota, Oregon, Pennsylvania, Tennessee, Texas, Utah, West Virginia, and Wyoming. This issue brief reviews the implications for children’s coverage associated with the transition, and summarizes lessons learned from states transferring children ahead of the statutory deadline.
While the statutory authority in the ACA for this change emerges from the same section of the law that extends Medicaid eligibility to adults below 133% of FPL, the decision by the Supreme Court effectively allowing states to choose whether or not to cover newly eligible adults does not extend to other provisions of the ACA.3 Thus, the requirement to align children’s coverage stands, as articulated in sub-regulatory guidance released by the Department of Health and Human Services on July 10, 2012.4 The Secretary of HHS has further clarified that the stairstep children must be transferred no later than January 1, 2014, and also reassured states, as described below, that they will continue to receive the higher federal CHIP match for this group of children. Some states have expressed an interest in transferring children on their renewal dates, but as of this writing CMS has not opined on this issue.
Part I: Overview of the Effects of Transitioning Stairstep Children
How many children will be affected?
Table 1 shows the estimated number of children in each state that will be making the transfer.5 On average, 28 percent of CHIP kids will move into Medicaid in 2014 for those states required to eliminate stairstep eligibility. In a handful of states (Mississippi, Oregon, Utah), more than half of their children will transition from CHIP to Medicaid. In the remaining states, 13-48 percent of their CHIP children will move to Medicaid. As discussed below, California and New Hampshire eliminated their separate state CHIP program entirely – moving approximately 860,000 and 9,300 children, respectively, into Medicaid.
Table 1. Estimate of Stairstep Children Moving to Medicaid
State
Estimated Stairstep Kids Moving to Medicaid in 2014
Estimated Percent of CHIP Children Aligning with Medicaid in 2014
Alabama
25,000
29%
Arizonaa
6,000
21%
Coloradob
19,000
23%
Delaware
2,900
45%
Florida
71,329
28%
Georgia
59,435
27%
Kansas
8,909
19%
Mississippi
40,000
57%
Nevada
11,435
46%
North Carolina
58,000
30%
North Dakota
2,300
48%
Oregon
42,000
59%
Pennsylvania
40,000
21%
Tennessee
10,000
13%
Texas
131,070
23%
Utah
25,725
70%
West Virginia
8,000
32%
Wyoming
1,000
18%
TOTAL
562,103
28%
aEstimated percent of CHIP children aligning with Medicaid in 2014 calculated using estimates for December 2012 due to large increases in coverage from June to December from open enrollment changes.
bColorado began its transition on January 1, 2013.
How will children and families be affected?
We examined four key issues that will affect families with stairstep children transitioning to Medicaid in 2014: Benefits, cost-sharing, enrollment procedures, and access to care. Children and their families gain from more comprehensive benefits, greater cost-sharing protections and coordinated enrollment and renewal procedures for families. While all states will be required to implement the ACA requirements to streamline and coordinate enrollment across health programs, some states may continue to have more restrictive enrollment procedures in Medicaid than CHIP, however, and some have expressed concern that access to providers may be more limited in Medicaid.
Benefits
Federal law requires that all children in Medicaid receive the Early Periodic Screening Diagnosis and Treatment (EPSDT) benefit, a set of comprehensive and preventive health services that includes screenings, hearing, vision, dental, mental health, and developmental services. EPSDT is considered by the American Academy of Pediatrics to be the “gold standard” for children, as Medicaid provides all medically necessary services and treatments for children.
States that use CHIP funds to expand coverage through Medicaid must also cover EPSDT. However, EPSDT is not mandatory in states that have separate CHIP programs. Separate CHIP programs are required to provide a comprehensive and specific set of services including immunizations, well-child visits, dental care, inpatient and hospital care, but states have more flexibility in designing their benefit package. The package may be based on commercial plan benchmarks that are less generous than Medicaid. Thus, benefits vary by state and the type of CHIP program; but all children who transition to Medicaid in 2014 will be entitled to the full Medicaid benefit package, including EPSDT, and thus will be guaranteed a stronger benefit package.
Cost-Sharing
An extensive body of research indicates that when low-income families face higher premiums and cost-sharing, enrollment and the use of needed services decreases.6 Medicaid expansion programs funded through CHIP must follow the same rules as Medicaid, which sharply limit cost-sharing for children.7 States are not allowed to charge premiums for children in Medicaid in families with income below 150 percent of the poverty level, and allowable co-payments for services are restricted to nominal charges.8 Separate CHIP programs have more flexibility to impose premiums, co-payments, deductible and co-insurance on children. Although cost-sharing is not allowed for preventive services including well-child visits, separate CHIP programs can impose cost-sharing up to 5% of a family’s income.9
Once moved to Medicaid, stairstep kids will fall under the Medicaid cost-sharing rules, providing these families with stronger cost-sharing and premium protections than they currently have in CHIP.10 For example, under current rules as noted above, states cannot charge premiums to children in Medicaid, but children in families with income between 100 percent and 150 percent of the poverty level can be charged up to $19 per child per month in CHIP.11 In Florida, a family of four with income of 120% of the FPL and two children in Florida’s CHIP program (Florida KidCare) is currently charged premiums of $30 per month ($15 per child). Once these children transfer, their families will no longer be required to pay premiums. Increasing premiums has been shown to decrease enrollment for lower-income populations. For example, a Florida study found that a $5 premium increase reduced CHIP enrollment by more than half, with lower-income children more severely impacted than higher-income children.12 With the transition to Medicaid, stairstep families will no longer be charged premiums and children will be more likely to enroll and stay enrolled.
Enrollment and Renewal Procedures
Many states have simplified administrative procedures to promote enrollment and retention of coverage, and all states are gearing up for new ACA requirements that will further streamline their administrative processes. Beginning in 2014, eligibility and enrollment rules will be aligned for Medicaid and CHIP in many respects. For example, states must review eligibility for children and families no more often than once every 12 months. Currently, Texas requires families to renew children’s coverage in Medicaid every six months while CHIP renews coverage once a year. Following the transition, a family in Texas with income of 115% of the FPL, that presently has two children, ages 4 and 8, enrolled in Medicaid and CHIP respectively, will no longer have to renew coverage nor re-enroll their children, more than once a year, through separate processes.
However, the ACA’s eligibility and enrollment rules will not require all Medicaid and CHIP policies to be fully aligned. For example, states have the option to adopt continuous eligibility in Medicaid and/or CHIP for children, which allows children to maintain Medicaid or CHIP coverage for up to one full year, even if families experience a change in income or family size.13 This is one of the most effective strategies to promote ongoing coverage, which is essential to achieving better health outcomes and enabling states to measure more effectively the quality of care over time. Seven (7) of the states (Delaware, Florida, Nevada, Pennsylvania, Tennessee, Texas and Utah) that will be transitioning “stairstep” kids to Medicaid currently have 12-month “continuous eligibility” for children in CHIP but not in Medicaid.14 In addition to aligning family coverage, states may want to examine their enrollment and renewal policies more broadly to promote consistency across programs and encourage enrollment and retention of coverage.
Access to Care
Research has proven that Medicaid and CHIP significantly improve access to care for the children they cover, especially with respect to primary and preventive care. Children insured by Medicaid and CHIP report nearly the same levels of access as children covered by private insurance.15 Most major data sets do not distinguish between the two public programs. However, there is growing concern about the ability of Medicaid to ensure strong access to care with states shifting kids to Medicaid, especially in states that will be expanding Medicaid to newly eligible adults thus creating additional demand for services in 2014.
The ACA partially addresses this issue with a provision that requires states to reimburse Medicaid primary care providers at 100% of the Medicare reimbursement rates in calendar years 2013 and 2014.16 The federal government will fund 100% of the difference in cost between what a state’s Medicaid rate was on July 1, 2009 and the applicable Medicare rate. This aims to ensure access more broadly in Medicaid and to care for children as states eliminate stairstep eligibility, but this is an area that will need to be monitored going forward.
What is the fiscal impact on states?
The Federal Medical Assistance Percentage (FMAP) (also called the federal match rate) determines the share of the cost of Medicaid and CHIP that is paid by the federal government. FMAPs vary by state and are determined annually using a federal formula. The federal government contributes a greater share of CHIP costs than Medicaid costs, hence the CHIP match is often referred to as the “enhanced FMAP.” The current national average FMAP is 57% for Medicaid and 71% for CHIP.17,18 As a result, states are acutely aware of the financial implications of serving children in Medicaid versus CHIP.
Since the ACA was enacted in 2010, states have questioned which FMAP would apply to the stairstep kids – the Medicaid FMAP or the enhanced CHIP FMAP. The Centers for Medicare and Medicaid Services (CMS) has clarified more than once that these children will continue to receive the enhanced CHIP match, most prominently in the final Medicaid and CHIP eligibility rules released on March 23, 2012.19 On February 6, 2013, HHS also released an Informational Bulletin with the same guidance.20 Although this question persists, it is clear that states will not lose the enhanced CHIP match for this population.21
Although aligning coverage will likely free up administrative resources as discussed below, and federal matching dollars will not go down, other state costs associated with the stairstep transition will vary by state depending on the cost of covering a child in CHIP or Medicaid. For example, Utah projects a net increased cost to the state of $886,403 in 2014. The projections were based on a lower CHIP per child annual cost estimate of $1,136.55, compared to a Medicaid per child annual cost of $1,276.95.22 Florida, however, estimates that the state will save an estimated $17.6 million in 2014 due to the transition.23
Administrative Efficiency
Aligning coverage will be more cost-effective and efficient for states by eliminating the need to transfer children from Medicaid to CHIP when they turn six. This can involve the Medicaid agency disenrolling a child who is then enrolled by the CHIP agency along with sending new insurance cards and benefit information. Such changes can be confusing to families, particularly when different health care delivery systems and provider networks are used, which in turn generates calls from families potentially to both agencies to understand why the change was made and what the differences are in benefits and cost-sharing. Having all children in the same family covered under one program could also streamline the state’s ongoing administrative workload and reduce paperwork by eliminating the duplication of effort by two agencies when processing renewals and other changes.
Not only does aligning coverage free up administrative resources, it promotes continuous coverage that enables states to more easily measure access to care and health outcomes. Few states have systems in place to track access and quality of care across different delivery systems and coverage sources. Thus, efforts to promote better health outcomes are disrupted as children “age out” of Medicaid and move to CHIP, at a time when use of preventive health care begins to decline.
Part II: Lessons learned from states that have already transferred stairstep children
A Look at New York and Colorado
Both New York and Colorado elected to implement the stairstep transition in advance of the January 1, 2014 deadline. Interviews with state administrators and child advocates in New York and Colorado were conducted to learn more about their experiences and what lessons they might hold for other states.
New York aligned eligibility for children ages 6 to 18 from 100 to 133% of the FPL when the New York State Department of Health issued an administrative directive effective November 1, 2011 to move children from CHIP (known as Child Health Plus) to Medicaid at the time of the child’s next renewal. In Colorado, SB 11-008 was signed into law on April 8, 2011, authorizing the transition of stairstep children to Medicaid in the fall of 2011, but the fiscal note assumed that implementation would begin in January 2013. The legislation was never amended, so the transition was delayed until January 2013.
By acting early, both states have avoided a mass transition of children on January 1, 2014 – a time when many other changes will be occurring in states’ health care systems.
How have children transitioned from Medicaid to CHIP in states?
In New York, from November 2011 through May 2012 during the renewal process (which is handled by the CHIP health plans), if a child appeared to be eligible for the new Medicaid income group, families were informed that they must apply for Medicaid. To determine final eligibility, families were required to submit a new Access New York Health Care (Medicaid) application to a local Department of Social Services. Children remained in the CHIP program for 60 days to allow time for families to complete the Medicaid application process.
However, this was a labor-intensive process, so the state began to use Express Lane Eligibility (ELE)24 in June 2012 to streamline the transition and reduce the administrative burden on families, heath plans, and local Departments of Social Services. Children were enrolled into Medicaid using the Child Health Plus renewal application which is easier for families to complete. Since families in New York can attest to their income at the Child Health Plus renewal, children transitioning through ELE were not required to provide proof of income, which is required for new Medicaid applications.
Instead of undertaking a mass transition of children into Medicaid in Colorado, all new applicants with family income between100-133% of the FPL will be enrolled in Medicaid starting on January 1, 2013. Current enrollees between the ages of 6-18 at 100-133% will be transitioned to Medicaid at their renewal date or when eligibility is otherwise being re-determined (e.g., reported change in family circumstance, at the request of family). The decision to not do a mass transition was made so that children would be ensured continuity of care and to avoid disrupting children’s 12-month continuous coverage in CHP+.25
How have families been notified about the changes?
Families in New York identified with stairstep children at renewal were mailed notices informing them that their children would be transitioned to Medicaid at the end of their Child Health Plus enrollment period. Once the children were enrolled in Medicaid, their managed care health plan sent the family a Medicaid welcome package and member handbook outlining the benefits, including EPSDT. The state does not impose premiums or cost-sharing on children with family incomes below 133% of the FPL in Medicaid and Child Health Plus, thus no changes occurred on that front.
When stairstep children are identified during the renewal process in Colorado, a Medicaid eligibility notice is automatically generated from the state’s eligibility system. After the new eligibility information goes through the Medicaid Management Information System, families receive enrollment materials relating to the transition. This includes a letter explaining the purpose of the materials, a summary comparison of the Medicaid plans available, a quality report card containing ratings for the plans, changes in cost-sharing and information about Medicaid’s EPSDT benefit. New enrollees also decide if they want to accept their assigned provider or request the Medicaid provider of their choice.
How do delivery systems affect the alignment?
With almost identical delivery systems of managed care for Medicaid and Child Health Plus, there was significant overlap in provider networks in New York, which facilitated the transition considerably. Most families continued with the same PCP as they were transitioned to Medicaid. Since all but one of the managed care plans in the state cover both Medicaid and Child Health Plus, most families received this information from their current plan. If the Child Health Plus plan did not participate in Medicaid managed care in a certain county, children were enrolled in a default plan. The default plan was selected by comparing provider networks of PCPs and pediatricians to find the closest network of providers. If a family was not pleased with the default assignment, the family had 90 days to change plans. The State Department of Health continuously evaluates the provider networks to ensure that capacity is adequate and requires managed care health plans to submit their provider networks to the Department quarterly.
Colorado has different health care delivery systems for Medicaid and CHP+, as most Medicaid enrollees are in fee-for-service while CHP+ has a managed care delivery system. Past analysis has indicated that there is a 70% overlap in provider networks but Colorado was unable to identify families prospectively that would be affected by the transition. Thus, assuring provider continuity for these children was not guaranteed.
How were providers engaged in the process?
Due to the overlap of provider networks, New York did not specifically educate providers about the change. Only the health plans were informed of the transition through the administrative directive.
Colorado chose to inform providers through Medicaid and CHIP bulletins, newsletters, and other publications about the transition. The State also presented a series of four webinars outlining the changes to county workers, eligibility workers, certified application assistance site workers, Family Health Coordinators, and the State’s enrollment broker. All webinars were followed by Question and Answer (Q&A) sessions, and all Q&As were posted to a State website. The stakeholder community also was involved in communications as they assisted the Department in drafting “talking points.”
As previously mentioned, CHP+ children in Colorado have 12-month continuous eligibility, but children in Medicaid do not. Many providers did not like the idea of moving children from a program with 12-month continuous eligibility to a program where there may be an increase in churning. Passage of House Bill 09-1293, a reform bill funded by a hospital provider fee, which authorized the Department of Health Care Policy and Financing in Colorado to implement 12-month continuous eligibility for children in Medicaid. However, the policy has not yet been implemented.
Other Models to Coordinate Medicaid and CHIP
By transferring their entire CHIP programs into Medicaid, New Hampshire and California also accomplished an early transition of their stairstep children albeit through a more far-reaching method.
In 2012, New Hampshire aimed to achieve savings of $6.6 Million in the 2012-13 biennium by transitioning approximately 8,200 children enrolled in the state’s CHIP program (New Hampshire Healthy Kids or NHHK) to Medicaid. California followed suit with a similar proposal in 2012 through Assembly Bill (AB) 1494, which authorized the transition of 860,000 children enrolled in the state’s CHIP Program (Healthy Families Program or HFP) to the state’s Medicaid program (Medi-Cal) beginning in January 2013.26
Both states pushed for this concept as a way to save the state money through administrative efficiency and as a way to benefit families, as children would be under the same health plan as their siblings, receive EPSDT, and no longer have waiting periods, premiums, or cost-sharing. However, many child advocates and providers in both states were concerned that the provider capacity would not be sufficient to serve the children moving to Medicaid, especially considering the lower reimbursement rates of Medicaid providers. In California, many stakeholders advocated for moving only the stairstep children initially and delaying the transition for the remaining HFP children until later, so that this would allow the state to evaluate and monitor the transition closely, while also addressing any access issues that may occur. Despite pushback from stakeholders, the state has moved forward with the entire transition of Healthy Families Program into Medi-Cal.
To educate families affected by the transition, families with children in New Hampshire’s Healthy Kids program were sent a letter two months before the NHHK program ended and a new Medicaid card. Before the transition, NHHK had administered enrollment and eligibility for children in Medicaid (Healthy Kids Gold), children in CHIP (known as Healthy Kids Silver), and a Healthy Kids Buy-in program (children in families with incomes above New Hampshire’s CHIP income limit of 300% of the FPL were allowed to purchase a subsidized HMO product and pay a premium for their coverage). Both Silver and Buy-in Families paid premiums, with buy-in families’ premiums being higher than the Healthy Kids Silver. Approximately 500 children were in the buy-in program, which was eliminated, leaving them without assistance for health care until new federal options become available on January 1, 2014. A study to examine the impact of how buy-in kids have adjusted in the absence of subsidized coverage is currently underway. Medicaid enrollment has increased by an estimated 9,300 children in New Hampshire since the transition.
California’s much larger transition began on January 1, 2013 and will continue throughout 2013 over four phases.27 Because this change is going forward under Section 1115 waiver authority, CMS monitors and evaluates the transition, and the state must have written approval from CMS before starting each implementation phase. To inform families affected by the transition, the State must provide a written notice to the families at least 90 days prior to the start of each phase. Additionally, stakeholders and CMS have had the opportunity to comment on all draft notices before they are sent to families. In all phases, the state must send transitioning children subsequent notices throughout the 90 days leading up to each phase of the transition so that families are sufficiently informed about the transition and can get their questions answered.
Conclusion
Experiences in New York and Colorado indicate that having the administrative capacity to manage the transition is essential, as some states may be overburdened and have limited resources. Both states felt that it would be important to have strong public awareness and effective communication to the families, providers and stakeholder community affected. States should also consider alignment of enrollment procedures and provider networks as important issues to address early in the process, especially in states that may not have much overlap in provider networks between Medicaid and CHIP.
Aligning coverage for families in Medicaid will bring benefits for families and children such as a better benefits package, greater cost-sharing protections, and the administrative ease of covering siblings in the same program. Downsides may include more difficult enrollment procedures if Medicaid is not as streamlined as CHIP and fewer providers, although this remains to be seen. The fiscal impact varies by state. Nevertheless, states face a significant administrative task in aligning family eligibility for children in 2014 – particularly those that have been slow to move forward with ACA implementation. Thus, states and stakeholders may want to consider phasing in the transition as soon as possible and proactively communicate this alignment to providers, families, and eligibility workers.
Endnotes
As discussed below, these children will continue to receive the higher CHIP matching rate after they are transferred to Medicaid.
↩︎
Currently, all children from birth to age 6 with family incomes up to 133% of the FPL are eligible for Medicaid. For CHIP, 46 states and D.C. cover children up to or above 200% of the FPL. The minimum upper income limit in CHIP is 160% of the FPL in North Dakota, and the maximum upper limit in CHIP is 400% of the FPL in New York.
↩︎
National Federation of Independent Business v. Sebelius, Slip Opinion, Syllabus, at 5.
↩︎
Estimates calculated based on the number of estimated stairstep children moving to CHIP in 2014 was collected from state officials and state advocates and using June 2012 CHIP monthly enrollment data provided to Health Management Associates for the Kaiser Commission on Medicaid and the Uninsured.
↩︎
Snyder, Laura and Robin Rudowitz. “Premiums and Cost-Sharing in Medicaid: A Review of Research Findings.” Kaiser Commission on Medicaid and the Uninsured, February 2013. http://modern.kff.org/medicaid/upload/8417.pdf.
↩︎
It is important to note that the Centers for Medicare and Medicaid Services (CMS) issued proposed rules on January 22, 2013, that would streamline and simplify Medicaid premium and cost-sharing rules and provide states more flexibility. For a comparison of the current Medicaid cost-sharing rules and the CMS proposed rules, see Snyder, Laura and Robin Rudowitz. “Premiums and Cost-Sharing in Medicaid.” Kaiser Commission on Medicaid and the Uninsured, February 2013.
↩︎
Georgetown University Center for Children and Families. “Cost Sharing for Children and Families in Medicaid and CHIP,” 2009.
↩︎
States cannot impose any cost sharing on children in Medicaid below 150 percent of the federal poverty level except in a narrow range of circumstances (e.g., a non-emergency use of the emergency room, only if a Medicaid enrollee has been provided with an appropriate referral to an alternative provider and for certain prescription drugs). At more moderate-income levels, federal rules also exempt some services, such as preventive services for children, from cost sharing.
↩︎
States can charge premiums through Section 1115 waiver authority.
↩︎
J. Boylston Herndon, et al., “The Effect of Premium Changes on SCHIP Enrollment Duration,” Health Services Research, 43: 458-477 (September 2007).
↩︎
Recently, HHS released guidance to states confirming that through Section 1115 waiver authority, states may implement 12-month continuous eligibility for parents, which will further align family coverage.
↩︎
States have the option to implement continuous eligibility, allowing children to maintain Medicaid or CHIP coverage for up to one full year, even if families experience a change in income or family status.
↩︎
Georgetown University Health Policy Institute Center for Children and Families. “Medicaid Provides Needed Access to Care,” February 2013.
↩︎
Public Law 111-152. Health Care and Education Reconciliation Act of 2010 (HCERA), enacted on March 30, 2010.
↩︎
“Medicaid Financing: An Overview of the Federal Medicaid Matching Rate (FMAP).” Kaiser Commission on Medicaid and the Uninsured, September 2012.
↩︎
Section 2101(a) of the Patient and Protection and Affordable Care, P.L. 111-148 includes a provision that will increase each state’s CHIP FMAP by 23 percentage points on October 1, 2015. However CHIP funding expires in 2015 and must be renewed by Congress; so it is unclear if this increase will go into effect.
↩︎
The Children’s Health Insurance Program Reauthorization Act of 2009 (CHIPRA) allowed states to use tools to implement ELE. States can use eligibility determinations from other public need-based programs, such as Supplemental Nutrition Assistance Program, or Head Start to streamline enrollment.
↩︎
States have the option to keep children covered in Medicaid and CHIP for 12 months, regardless of whether their family income changes in that time frame.
↩︎
The Centers for Medicare and Medicaid Services (CMS) granted federal approval for the Department of Health Care Services (DHCS) to begin the transition via the Bridge to Reform 1115 Demonstration Waiver.
↩︎
The HFP transition will occur in four phases in 2013:
Phase 1A: Children enrolled in a HFP plan that is also a Medi-Cal managed care plan.
Phase 1B: Additional children enrolled in a HFP plan that is also a Medi-Cal managed care plan, in their county of residence.
Phase 1C: Remaining children enrolled in a HFP health plan that is also a Medi-Cal managed care plan, in their county of residence.
Phase 2: Children enrolled in a HFP plan that is a subcontractor of a Medi-Cal managed care plan, in their county of residence.
Phase 3: Children enrolled in a HFP plan that is not a Medi-Cal managed care plan and does not contract with a Medi-Cal managed care plan.
Phase 4: Children enrolled in the HFP residing in a county that is not currently a Medi-Cal managed care county. ↩︎
A number of states have recently released information on what premiums will be in the individual insurance market in 2014, when significant changes in that market take effect due to the Affordable Care Act (ACA). In some cases, states have provided estimates of how those premiums compare to what people buying their own insurance are paying today.
However, these premiums are in effect “sticker prices” that many people will not pay because they will be eligible for federal tax credits under the ACA to offset the cost of insurance. In this data note, we explain how the tax credits will work and estimate how much premium assistance people now buying their own insurance will be eligible for in 2014.
Why Premiums in the Individual Market Will Change
There are a number of reasons why individual market premiums will change, both overall and for any given individual now buying coverage:
Prohibiting discrimination against people with pre-existing health conditions will tend to raise premiums as higher cost individuals who have previously been excluded from the market buy coverage. This may be offset by an influx of younger and healthier people, due to the ACA’s individual mandate and premium subsidies for low- and middle-income people buying insurance in new health insurance marketplaces (also known as exchanges).
Eliminating premium surcharges based on health status and limiting premium variation due to age will tend to lower premiums for people who are older and sicker and raise premiums for people who are younger and healthier. Also, eliminating gender-based rating will generally result in higher premiums for younger men and lower premiums for younger women.
Establishing a minimum level of coverage will generally raise premiums for people who are buying skimpier coverage today, though it will also lower their out-of-pocket costs on average when they use services.
Creating a $10 billion reinsurance pool to reimburse insurers for high-cost enrollees in the individual market in 2014 will tend to lower premiums.
Premiums will be higher in 2014 for some current individual market purchasers and lower for others, and on average will likely be higher in most states.
How Premium Tax Credits Work
Premium subsidies (in the form of federal tax credits) will be available for people buying their own insurance in new marketplaces or exchanges who have incomes from 100% up to 400% of the poverty level (about $24,000 to $94,000 per year for a family of four in 2014). Those with access to affordable employer-provided insurance or Medicaid are ineligible for tax credits.
The amount of the tax credit is based on a benchmark premium, which is the cost of the second-lowest-cost silver plan in the area where a person lives. The tax credit equals that benchmark premium minus what the individual is expected to pay based on their family income (which is calculated on a sliding scale from 2% to 9.5% of income).
Here is how the calculation might work for a 40-year-old individual making $30,000 a year:
Estimated benchmark premium for a 40-year old = $3,857 per year (which will vary from area to area)
Person is responsible for paying 8.37% of their income = $2,512
Tax credit = $1,345
The tax credit can be used in any plan offered in the health insurance marketplace, so the person would end up paying less than $2,512 to enroll in the lowest cost silver plan or a lower cost bronze plan, and more to enroll in a higher cost plan. A calculator from the Kaiser Family Foundation provides subsidy estimates for families of varying characteristics.
Estimating Tax Credits for People Currently Buying in the Individual Market
While premium tax credits will provide substantial subsidies to people now buying individual insurance, it can be difficult to characterize the level of subsidies because they vary so much based on personal characteristics (e.g., age, income, family size, and place of residence). To provide a sense of how much assistance these subsidies will provide, we quantified how much of a tax credit on average current individual market enrollees will be eligible for. We look at people who are currently purchasing their own insurance and are anticipated to continue to do so in 2014 because they do not have access to employer coverage and are not eligible for Medicaid (including expanded Medicaid eligibility in states that have adopted the ACA expansion) or the Child Health Insurance Program.
Our analysis – which is described more fully in the methodology appendix – is based on premium estimates from the Congressional Budget Office (CBO) and the characteristics of current individual market enrollees in the federal government’s Survey of Income and Program Participation. While our premium estimate is based on CBO’s projection and actual premiums will vary from area to area, the premium values we are using are consistent with those that have been released to date in several states.
Using CBO’s estimate of an average premium for the second-lowest-cost silver in 2016, we estimate that the national average benchmark premium for a 40-year-old in 2014 would be $3,857 per year (or $321 per month). Benchmark premiums at other ages are based on uniform age factors that have been established in regulations issued by the Department of Health and Human Services.
We estimate that current individual market purchasers will face an average premium per family for the second-lowest-cost silver plan of $8,250 in 2014. This is an average premium across families of all sizes. Most current individual market enrollees are in families of one person (55%) or two people (29%). (Note that for the purposes of tax credit eligibility under the ACA, families are defined as including people who are claimed as dependents on an income tax return. Our estimates reflect that definition to the extent possible with data available.)
About half (48%) of people now buying their own insurance would be eligible for a tax credit that would offset their premium. This does not include over one million adults buying individual insurance today who will be eligible for Medicaid starting in 2014 (i.e., they have family income up to 138% of the poverty level and are living in states that have decided to expand Medicaid under the ACA).
Tax credits have the potential to cover a substantial portion of the premiums paid by current individual market enrollees:
Across all current individual market purchasers anticipated to continue buying coverage, the average tax credit their families would be eligible for would be $2,672. Assuming all eligible current enrollees applied for a tax credit, the subsidy would reduce the premium for the second-lowest-cost silver plan by an average of 32% across all people now buying insurance in the individual market.
Among the approximately half of current enrollees who will be eligible for tax credits, the average subsidy would be $5,548 per family, which would reduce their premium for the second-lowest-cost silver premium by an average of 66%.
Tax credits would subsidize a higher share of the premium for individuals choosing to enroll in lower cost plans. For example, enrolling in a bronze plan from the same insurer offering the benchmark silver plan would mean an average subsidy across all current individual market enrollees of about 38% of the premium and an average subsidy among only those eligible for tax credits of 77%.
Methodology
We estimated the availability and size of health insurance premium subsidies for people enrolled in non-group coverage using data from the 2008 Survey of Income and Program Participation (SIPP), Wave 6 (interview period April to July, 2010).
Individuals were grouped into families based on a series of decision rules designed to approximate what is referred to as “health insurance unit (HIU)” or “tax filing unit,” which is the basis for determining eligibility for premium tax credits under the ACA.
The analysis is based on the universe of people currently purchasing non-group insurance (also referred to as individual insurance) and anticipated to continue to do so. Based on ACA rules regarding eligibility for premium tax credits in health insurance marketplaces (also known as exchanges), certain groups of current non-group purchasers were assumed to obtain alternative coverage:
All individuals belonging to a health insurance unit where any member received health insurance through work or an offer of employer-sponsored insurance. All members of a family were assumed to have access to employer-sponsored insurance if one member of the family was offered coverage. People with access to affordable employer coverage are ineligible for exchange-based premium tax credits.
Adults with incomes up to 138% of the poverty level and living in a state that has decided to expand Medicaid under the ACA (as of July 1, 2013). People eligible for Medicaid are ineligible for tax credits in exchanges. In states that choose not to expand, adults with incomes below 100% of the poverty level are included in the analysis but are ineligible for premium tax credits.
Children (up to age 18 and full-time students up to age 20) with family income that would qualify them for Medicaid of the Child Health Insurance Program (CHIP) based on current eligibility levels.
All individuals currently receiving Medicare or Medicaid as well as purchasing non-group coverage, who would be ineligible for premium tax credits and presumed not to purchase exchange-based coverage starting in 2014.
There are a small number of uninsured people (under 200,000 nationwide) living in families where another person is currently buying non-group coverage, and they are assumed to remain uninsured for the purposes of this analysis. If they purchased coverage, average tax credits would be higher than are reported here.
Health insurance units were assigned a premium based on age and family composition, assuming all current non-group purchasers (excluding those described above) continue to buy coverage. Premiums are based on our estimates for 2014 using the latest projection from the Congressional Budget Office (CBO) of the national average premium for the second-lowest-cost silver plan in 2016. Some states have begun to report approved premiums for 2014, and these early reports suggest CBO’s estimates are reliable.
Since tax credits are determined at the family level, all premium and subsidy figures are reported for adult purchasers based on the aggregate amounts for their entire health insurance units.