How are Seniors Choosing and Changing Health Insurance Plans?

Authors: Gretchen Jacobson, Christina Swoope, Michael Perry, and Mary C. Slosar
Published: May 13, 2014

Executive Summary

For many seniors, selecting an initial Medicare plan is an unexpectedly daunting task.  The plan environment in Medicare today is quite unlike that of 10 or 20 years ago, when the vast majority of seniors were enrolled in traditional Medicare and may only have had to decide whether or not to purchase a Medigap supplemental policy.  In recent years, the Medicare plan landscape has been transformed, with dozens of private Medicare Advantage and Part D drug plans available to most people on Medicare.  With so many plans and options to review, many beneficiaries find the process of comparing and selecting plans overwhelming and look for ways to simplify the task.  If they choose traditional Medicare, they often need to choose a specific stand-alone Part D prescription drug plan (PDP), and perhaps a supplemental Medigap plan if they are not otherwise receiving supplemental coverage under a retiree health plan or Medicaid.  If instead they choose coverage under Medicare Advantage, they often face a myriad of plan choices, including HMOs and PPOs, with different provider networks, benefits, and premiums.  Each year, plans may change their premiums, benefits, and other features and beneficiaries have the opportunity to assess these changes and, if deemed necessary, switch plans during the annual open enrollment period.  Yet, many studies show that few beneficiaries revisit their coverage decisions each year to determine which option is best for them based on their individual needs and the specific features of the plans available to them.1 

This report summarizes first-hand accounts of seniors’ decision making strategies for choosing and changing Medicare private plans, based on 9 focus groups of 6 to 8 seniors in 4 cities.  To explore the diverse methods and thought processes employed by seniors in their plan decision making, focus groups were conducted in cities reflecting variations in Medicare marketplace features:  Baltimore, Maryland; Seattle, Washington; Memphis, Tennessee; and Tampa, Florida.

Key findings:

  • Seniors cited a number of factors that were important in choosing a plan when they first enrolled in Medicare, including: premiums and out-of-pocket costs, access to desired providers, familiarity with the name of the company offering the plan (such as AARP), favorable experience with a plan representative, and adequate coverage for their health care needs.  Some also said they enrolled in a particular Part D or Medicare Advantage plan in order to have the same coverage as their spouse. Star quality ratings of plans did not play a role in seniors’ plan choices.  In the case of seniors choosing among Part D plans, some wanted to be sure the specific drug they were taking was covered by the plan before signing up.
  • Seniors say they found it frustrating and difficult to compare plans due to the volume of information they receive in the mail and through media (television and radio) and their inability to organize the information to determine which plan is best for them.  Most seniors did not use the “Medicare Compare” tool available on the medicare.gov website, and many of those who did said they found it confusing, lacking information, and poorly constructed for comparisons on their desired factors.   For this reason, many rely on insurance agents as trusted advisors or receive suggestions from friends, family, doctors’ offices and/or pharmacists to help them narrow down their options.
  • Many senior Medicare beneficiaries said they did not want to switch plans because the process of their initial plan selection was so frustrating.  They believed they did their homework the first time and most did not want to revisit the decision.  In general, they did not view the annual open enrollment period as a time to review their health plan options and confirm they were still in the plan most likely to meet their needs.  Instead, they feared that a change in plan may disrupt their care or lead to an unforeseen increase in out-of-pocket costs, and require them to learn a daunting new set of rules and requirements.  To many senior beneficiaries, the grass was not necessarily greener in other plans, and other plans could be worse.  They were skeptical that any other plan would be much better, even if they were less than satisfied with their coverage or costs.  Most viewed premium increases as inevitable, and were reluctant to switch plans unless premiums rose considerably.  For these reasons, many will go to considerable lengths to make their existing plan work.
  • Among the relatively small number of seniors in the focus groups who said they did switch plans, some cited a desire to stay with a particular health care provider.  Seniors would consider switching plans in response to a significant change in their personal health care needs, a major modification to their coverage or provider network, or, in the case of Part D plans, a big increase in the cost of a particular drug that they take, or a change in their plan’s formulary or utilization management requirements.

Seniors in our focus groups said they appreciated being able to choose among many plans, and did not want their number of choices to be limited; however, they also felt unqualified to choose among plans and would like the process to be easier. Beneficiaries wanted to make well-informed and financially sound decisions but did not feel confident in their ability to do so under the current system.  While they tried to compare costs, coverage, and provider networks, beneficiaries found the process frustrating and confusing.  Many said they wanted advice from experts, so they relied on input from an insurance agent or a plan representative, or suggestions from family, friends, and medical professionals.  Our focus groups identified a high demand for clear, concise, and easily comparable information presented in a digestible format focusing on the factors most important to consumers, namely cost, provider networks, and coverage.  Few described the materials they have received as easy to use, and even fewer said they would turn to Medicare Compare during the next open enrollment period.   Making it easier for beneficiaries to compare and switch plans, when it is in their interest to do so, would help achieve the goal of having consumers choose a plan that best meets their individual needs and preferences. In addition, if more beneficiaries switch to lower-cost plans, the result could be lower costs for themselves and for the Medicare program.

Introduction

Several leading Medicare reform proposals are predicated on the assumption of a well-functioning marketplace, where beneficiaries are offered a choice of competing health plans and choose a specific plan that is most likely to meet their individual needs and preferences.  The proposals are further based on the supposition that as plans change, or beneficiaries’ needs change, beneficiaries will re-evaluate health plan options available to them and change plans as necessary to optimize their coverage.  These ideals are critical elements for a dynamic, competitive marketplace of private plans, and are the underpinnings of Medicare Part D and Medicare Advantage.

The plan environment in Medicare today is quite unlike that of 10 or 20 years ago, when the vast majority of seniors was enrolled in traditional Medicare and may only have had to decide whether or not to purchase a Medigap supplemental policy.  In recent years, the Medicare plan landscape has been transformed, with dozens of private Medicare Advantage and Part D drug plans available to most people on Medicare.  With so many plans and options to review, beneficiaries have many choices to make when they enroll in the Medicare program.

If they choose traditional Medicare, they often need to choose a specific stand-alone Part D prescription drug plan (PDP), and perhaps a supplemental Medigap plan if they are not otherwise receiving supplemental coverage under a retiree health plan or Medicaid.  If instead they choose coverage under Medicare Advantage, they often face a myriad of plan choices, including HMOs and PPOs, with different provider networks, benefits, and premiums.  Medicare Part D plans and Medicare Advantage plans are both subsidized by the Medicare program.  Each year, plans may change their premiums, benefits, and other features and beneficiaries have the opportunity to assess these changes and, if deemed necessary, switch plans during the annual open enrollment period.

However, many studies show that few beneficiaries revisit their coverage decisions each year to determine which option is best for them based on their individual needs and the specific features of the plans available to them.2   At the same time, analyses indicate that for PDPs, premiums and formularies have changed over time.3   Medicare Advantage plans’ premiums, out-of-pocket limits, and provider networks have also changed over time.4   Based on these studies, most seniors seem to prefer to stick with their original plans despite changes in costs, coverage, and providers.

Further, several studies have shown that most beneficiaries who are enrolled in a Part D plan are not in the lowest cost PDP available to them.5   Similarly, many Medicare Advantage enrollees are not enrolled in the lowest premium Medicare Advantage plans, with significant geographic variation in the preference for zero-premium plans.6   It would appear that Medicare Advantage enrollees are attracted to plans with high quality ratings,7  but it is not clear whether the ratings are the reason for beneficiaries’ plan enrollment or if it is a coincidence.  Overall, beneficiaries may be enrolling in plans for reasons other than premiums or out-of-pocket costs, which could have important implications not only for beneficiaries’ costs but also Medicare spending to subsidize plans.

In light of these critical issues, KFF partnered with PerryUndem to conduct a series of focus groups with seniors about their health plan decision making.  These focus groups were undertaken to shed light on the following questions:

  1. What factors drive seniors to choose one plan over another when they first go on Medicare?  How do they decide between traditional Medicare and Medicare Advantage, and once they make this decision, how do they choose among available Part D or Medicare Advantage plans in their area?
  2. Why do most seniors stay in the same plan year after year, rather than review and switch plans during the annual open enrollment period, even when they may face higher costs by remaining in the same plan?
  3. Among the minority of seniors who switch plans in a given year, what prompted them to change plans?

The aim of these focus groups was to understand the experiences of beneficiaries today, assess whether the Medicare Part D and Medicare Advantage marketplaces are working as envisioned from the beneficiary perspective, and identify potential opportunities for policymakers to improve the marketplaces and make it easier for beneficiaries to assess and choose Medicare Advantage and Part D plans.

Methods

The focus group participants included Medicare beneficiaries ages 65 or older who make health coverage decisions for themselves and/or their spouse. Participants included beneficiaries in traditional Medicare, with  Part D stand-alone plan coverage, and beneficiaries enrolled in Medicare Advantage plans.  Because the study focused on decisions around health plans, we excluded beneficiaries with retiree coverage from a former employer or union and beneficiaries dually eligible for Medicare and Medicaid.

The focus groups were conducted in four cities:  Baltimore, Maryland; Memphis, Tennessee; Seattle, Washington; and Tampa, Florida.  The selection of cities was based on several criteria, designed primarily to reflect the variation in Medicare marketplaces across the country, including:

  • the number of Medicare Advantage plans available to beneficiaries.  In 2013, the average Medicare beneficiary could choose from 20 Medicare Advantage plans, 31 PDPs, as well as a multitude of Medigap plans;8 
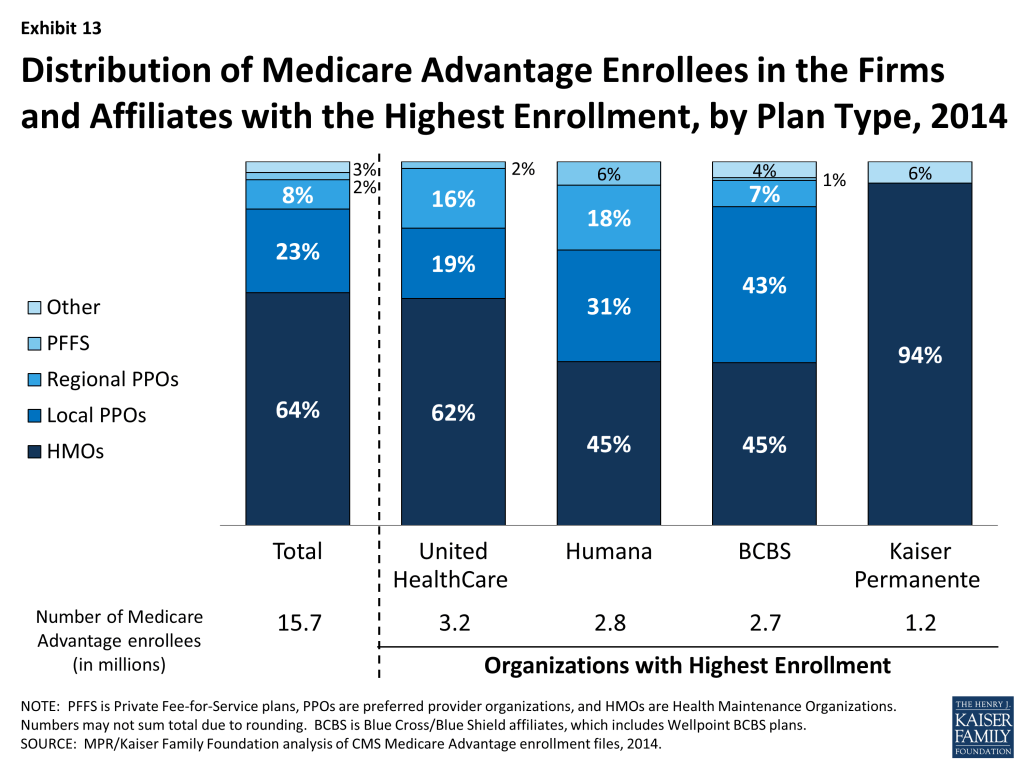
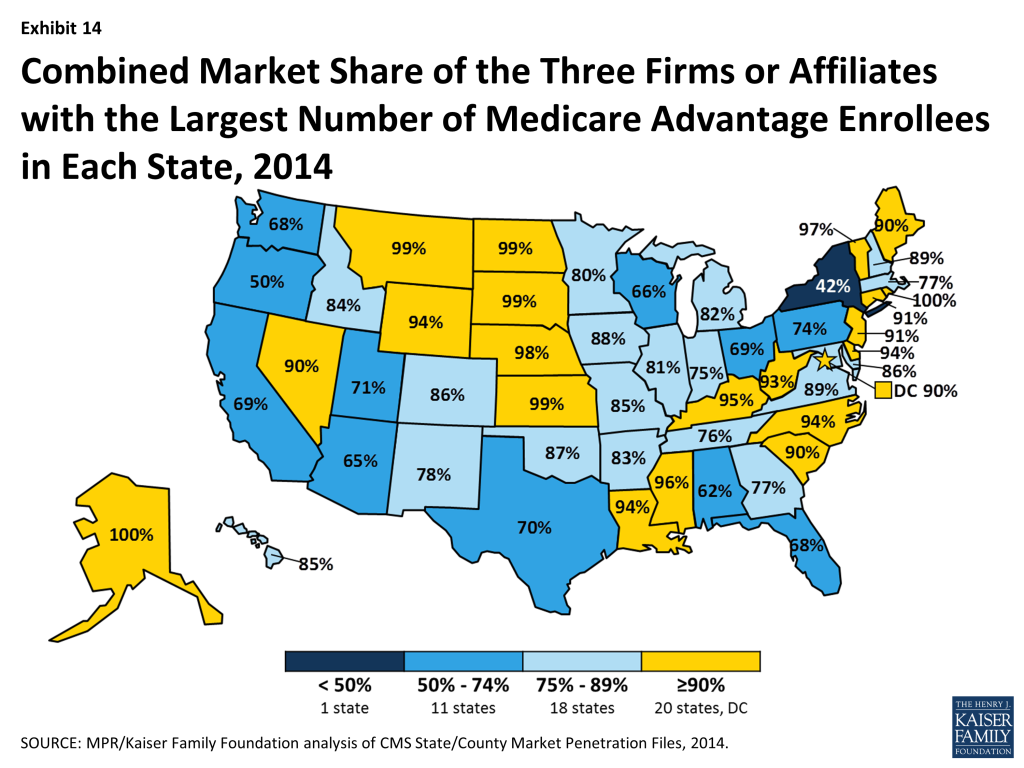
  • the extent to which Medicare Advantage enrollment was concentrated within a small number of companies, as an indicator of the amount of Medicare marketplace competition among insurers.  In 2013, three firms or affiliates accounted for 55 percent of Medicare Advantage enrollment, and similarly, 3 firms accounted for 50 percent of enrollment in PDPs, indicating that enrollment is highly concentrated in many Medicare Advantage and PDP markets;9 
  • Medicare Advantage penetration rate, to reflect the diversity of beneficiaries’ familiarity, comfort and experience with respect to Medicare Advantage plans; an
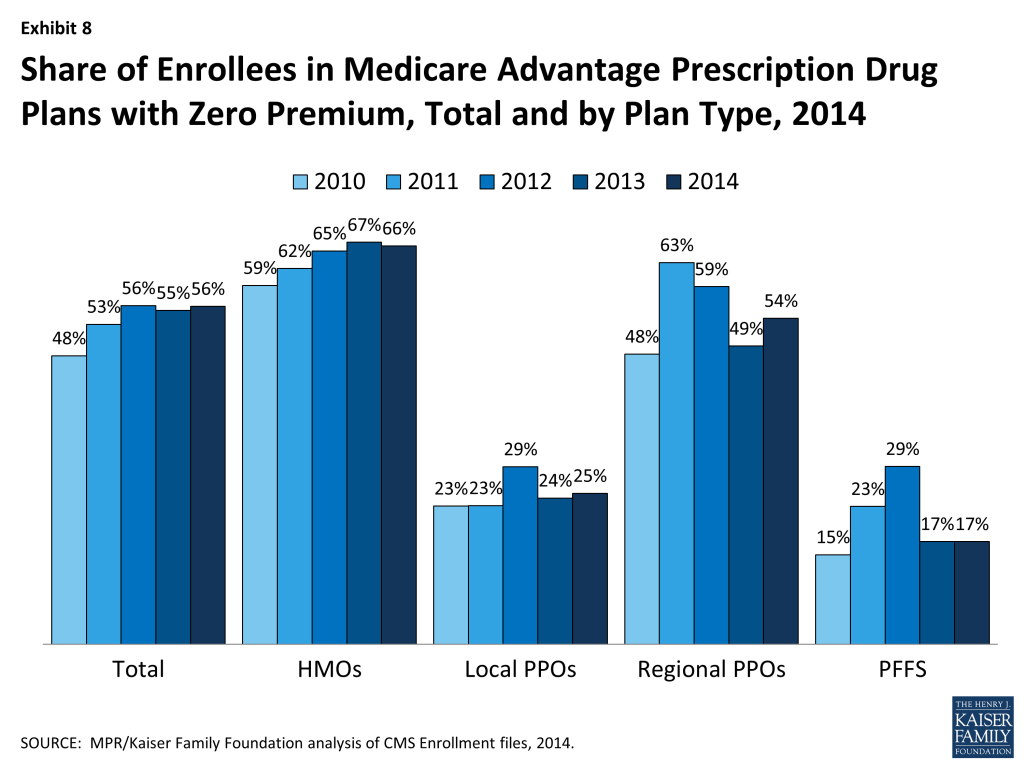
  • the percentage of enrollees in Medicare Advantage plans with prescription drug coverage (MA-PDs) that charged a monthly premium, to help examine whether premiums played a larger role in plan selection in some areas than others.  In 2013, 87 percent of Medicare beneficiaries had access to a MA-PD with no monthly premium, but only 55 percent of Medicare Advantage enrollees were in a plan with no premium, with large variations across counties in the share of enrollees in plans with premiums.10 

In addition, to ease focus group recruitment efforts, we identified cities with high percentages of individuals ages 65 and older, and relatively low percentages of beneficiaries dually eligible for Medicare and Medicaid (who were not included in this study) (Table 1).

Table 1.  Profiles of Focus Group Sites
SiteNumber of stand-alone prescription drug plans (PDPs) offeredNumber of Medicare Advantage (MA) plans offeredShare of enrollees in plans offered by the largest MA InsurerLargest MA InsurerMA penetration rateShare of MA enrollees paying plan premiumsShare of population ages 65+Percent of beneficiaries dually eligible
Baltimore, MD(Baltimore County)291766%Cigna10%93%15%16%
Memphis, TN(Shelby County)331532%Cigna21%35%11%13%
Seattle, WA(King County)302134%Group Health Cooperative32%63%12%15%
Tampa, FL(Hillsborough County)344642%Humana43%3%12%17%
SOURCE: Medicare Advantage penetration rates, number of plans, enrollees by insurer, and percent of enrollees paying plan premiums from KFF analysis of CMS enrollment files, 2013.  Percent of beneficiaries dually eligible from KCMU and Urban Institute analysis of FY2008 MSIS.  Percent of population ages 65 and older from American Fact Finder, U.S. Census Bureau, 2012.

The focus groups were conducted in November of 2013, in order to overlap with the Medicare open enrollment period, which starts October 15 and ends December 7 of each year.  Each focus group included 6-8 participants, differing by age, gender, race/ethnicity, and health status.  After an initial screening, we separated participants into groups of Medicare Advantage enrollees, and beneficiaries covered under traditional Medicare.  In total, we conducted 9 focus groups in 4 cities, and each focus group lasted 90 minutes (Table 2).  In some instances, groups were stratified by income, with the groups comprised of only lower income beneficiaries (below $25,000/individual or $50,000/couple) or higher income beneficiaries, to test whether different income levels would alter the process by which beneficiaries select plans.  Additionally, all Medicare Advantage focus groups included participants enrolled in plans offered by different insurance companies and paying different monthly premiums, with the exception of the focus groups in Tampa where all beneficiaries were enrolled in zero-premium plans.

Table 2. Focus Group Characteristics
SiteTraditional MedicareMedicare AdvantageIncome
Baltimore, MDxLower income
Baltimore, MDxHigher income
Memphis, TNxMixed income
Seattle, WAxMixed income
Tampa, FLxMixed income
Tampa, FLxLower income
Tampa, FLxHigher income


Report: What Factors Lead Beneficiaries To Not Be Enrolled In The “lowest Cost” Health Plan?

This was the first one that I’d ever had, you know, the first time I was on Medicare with the Part D and I was young and impressionable when I made the decision and it was purely based on the fact that 95 percent of my medications were zero co-pay.
-PDP Beneficiary (Baltimore, MD)

Seniors in this study were asked to think back to when they last chose a Medicare Part D plan or a Medigap policy (if in traditional Medicare) or a Medicare Advantage plan.  They mentioned a number of factors they weighed in their decision making, with costs usually at the top of the list.  Other considerations included staying with a particular provider, familiarity with the insurance company, the plan’s marketing efforts, staying in the same plan as a spouse, and the plan’s coverage.

Beneficiaries define “lowest cost” differently

 A couple of scripts are like “Phew. It’s the meds or the car payment, what do I do?”
-PDP Beneficiary (Baltimore, MD)

I look at the cap and then I want to look at the hospitalization. What I care about is if I have a major issue and go in the hospital and my out of pocket [is] $2,500 dollars or $5,000 dollars.
-Medicare Advantage Beneficiary
(Memphis, TN)

It often but not always means the premium.

Beneficiaries are concerned about the cost of health care because most live on fixed incomes with limited savings.11   When they think about costs, the first thing that comes to mind for most beneficiaries is a plan’s monthly premium, because it is a predictable, monthly expense that they will incur regardless of their health needs.  However, many beneficiaries, particularly those in poorer health also consider deductibles, co-pays, and other out-of-pocket expenses they might incur. Focus group participants who interacted more with the health care system tended to be more sophisticated in their thinking and calculations around cost.  For beneficiaries in Medicare Advantage, they examine the premium and may also look at the deductibles and out-of-pocket costs for different services, such as hospitalizations, especially if they have needed those services in the past.  For those in Part D plans, they look at the premiums and deductibles, and may consider the cost of a specific drug if they take one that is particularly costly or one that is particularly important for treating a chronic health condition.  Some beneficiaries in poorer health said they tried to anticipate what health care they might need in the future, and defined the lowest cost plan as the one that placed them at the lowest financial risk, while healthier beneficiaries tended to focus more on the premiums, particularly beneficiaries in PDPs.

Cost is important but other things are more important to beneficiaries

Many seniors want to have access to specific healthcare providers.

I want the choice.  I like the PPO because I have a choice.  I might not like this doctor always and want to go someplace else.
-Medicare Advantage Beneficiary
(Seattle, WA)

When we travel … we like the idea that CVS is up there, the networking is there.  [It is] very easy to walk in and you’re just like an old friend, because you’re with that program.
-Medicare Advantage Beneficiary
(Tampa, FL)

For people considering Medicare Advantage plans, a top issue is whether their doctors are part of the plan’s network. In most cases, people are concerned about maintaining access to their primary care physician.  Many of those with specific health needs, however, are often more concerned about having access to a specialist they are used to seeing. While some seem willing to give up their regular doctors to have a more affordable plan, others are not. It seems to depend (at least to some extent) on the strength of the relationship between the doctor and patient.

Importantly, people are not only concerned about whether their plan allows access to their preferred doctors; access to certain hospitals or health centers also matters. Some mentioned specifically that they wanted to be sure they could go to the best hospital in their area or that, if they were diagnosed with cancer, they could go to the best treatment center in their area.Many people with stand-alone Part D plans said having access to the pharmacy they are familiar with or that is close to their home is very important to them, and often more important than drug prices. Some have strong relationships with their pharmacists and do not want to give that up.

Familiarity with the name of the insurance company is important to many beneficiaries.

Names matter to beneficiaries. Some are drawn to certain plans and turned off by others simply because of the name. At a most basic level, a plan from a company with a recognizable name seems most important. Some expressed hesitation about the idea of going with a plan from a company they had never heard of, even if that plan was cheaper than their current one.

I wouldn’t go to Bob’s discount liquor and used clothing store/Part D insurance coverage.
-PDP Beneficiary (Memphis, TN)

When I chose my current one I chose it because of the credibility of AARP; they were bound to be my advocate.
-PDP Beneficiary (Memphis, TN)

Reputation Matters.  Apart from simple name recognition, reputation matters – and people make certain (good and bad) associations with specific names. For example, several people said they decided to go with a plan through AARP because they knew AARP and trusted that it would be a good plan. Others, however, were turned off by AARP plans because they did not agree with the organization politically. People also associate certain reputations with big insurance companies like Blue Cross Blue Shield, United Healthcare, and Aetna. Some have impressions of certain companies being good or bad and this influences their willingness to look into their plans.

A few expressed commitments to certain companies and this helped them narrow down their choice of plans. For whatever reason, some had decided they wanted a plan from a specific company a priori and when it came time to choose a plan, they only considered plans offered by that company.

Some seniors stay with the same company through which they had employer-sponsored insurance or other insurance prior to going onto Medicare.

In my case my husband retired from AT&T so we had United Healthcare for years. So the plan that they offer is the Advantage plan so we didn’t have a whole lot of choice.
-Medicare Advantage Beneficiary
(Memphis, TN)

A few people mentioned that they decided to go with a specific insurance company because they had insurance through them before they were enrolled in Medicare. They were already familiar with the company and with the customer service, so it seemed relatively easy to just stay with them. One man, for example, was with Humana when he was employed. When it was time to enroll in Medicare, he went to Humana’s office and they helped him choose a new plan and sign up the same day.

Plan representatives and marketing influence plan choices.

When I went to Humana I just went in and sat with a rep in the office. They went over everything and it seemed to look like what I was looking for and encompassing a lot of different things so I went ahead and selected that.
-Medicare Advantage Beneficiary (Tampa, FL)

While not a top factor in choosing plans, the extent to which beneficiaries feel like they are receiving good customer service matters. This is especially true when they are choosing their initial Medicare plan. If a company has good customer service and can answer their questions about plans in a clear way, this makes beneficiaries more likely to go with that company. If they have a bad customer service experience early on, they are turned off.Many enroll in plans after talking with a plan representative at an information session or having one over to their home to discuss the details of plans. This face-to-face interaction is important to many, and it often seals the deal.

Some want to make sure they have the same plan as their spouse. 

Same plan, same doctor, same household, same everything.
-Medicare Advantage Beneficiary
(Seattle, WA)

[Unlike me] my husband has quite a bit of problems … My being in the same plan, this gives us the same doctors so they know me and they know him.  It’s more of a combined knowledge there so they know exactly the whole family.
-Medicare Advantage Beneficiary
(Tampa, FL)

When choosing a plan, some married beneficiaries say they make sure they and their spouse have the same plan (or at least the same company). In most cases, this seemed to be a matter of convenience and practicality. They say it is easier to keep track of information, rules, changes, and the like for a single plan rather than two. It helps avoid confusion and makes life easier. In a few cases, the spouses seemed to have very different health needs, but they still felt the convenience of having a single plan outweighed the potential benefits of having separate plans that might better meet their health needs.

Not all married people see things this way. Many explained that one spouse had very different needs than the other and that having the same plan did not make financial sense for them. For example, one spouse might have a chronic condition that requires a lot of care and medication while the other is healthy. Many people with spouses explained that in a case like this, they would not prioritize having the same plan; however, in a few cases, spouses taking different prescription drugs preferred to be in the same PDP despite their different health needs.  

Having good coverage for drugs and needed medical services is an important factor for many.

Coverage is important, particularly when prescription medications are involved. When it comes to Part D plans, they want to know first and foremost that their current medications are going to be covered. Many are also often checking for more general coverage information like the extent to which brand name versus generic drugs are covered.

When looking at Medicare Advantage plans, they want to make sure the healthcare services they may need are covered. Among those with specific health needs, they are looking to make sure they can get the care they know they will need. Among those without many current healthcare needs, some look for plans that cover any and everything they might need in the future. Others, however, want to make sure they are not going to end up paying to cover services they do not expect to use.

Among those with Medicare Advantage plans, the ability to get vision and dental coverage is a major draw. The addition of other services like the Silver Sneakers (exercise and gym) program is also attractive to many. They like feeling like they are getting a lot of services out of the plan, even if they do not use them.

Medicare’s star ratings do not influence decisions very much (if at all).

Most are unaware of consumer tools like the star ratings that Medicare provides and as a result do not use them in making their decisions. Overall, people seemed to think the star rating system could provide them with some helpful, additional information but did not suggest that it would be a decisive factor for anyone; instead, it would be another piece of information to consider. Focus group participants wanted to know more about how the rating system actually worked.  For example, they wanted to know who creates the rating, based on what criteria, and how often it is updated.

I’ve never used [star ratings] because I presume that they are doing some weighting of these factors to get to those stars and my only factor that I care about is cost. It’s like those lists of best places to live.  You don’t know what they are weighting.
-Medicare Advantage Beneficiary
(Tampa, FL)

Some have seen these ratings and considered them, but explain that they did not play a major role in their decision-making process. Likewise, among those who were unfamiliar with the ratings, the general sense was that they would look at the ratings, but they would not likely weight them heavily in their decision. New, outside information about their plan does not necessarily make them question their initial choice.  This is especially true if they already have personal experience with a plan; in most cases, their personal experience would outweigh the star rating.

If they are generally satisfied, they are not likely to consider changing plans even if they learn about others’ negative reviews of the plan. For example, most say that learning that a friend has had a bad experience with the same plan would not make them consider changing. They say that this is one person’s experience, not theirs.  Likewise, if they found out that their plan only had three stars in Medicare’s rating system, they would not necessarily start looking for a plan with more stars. They view the ratings as based on other people’s experiences, which are not necessarily relevant to them. But when asked what they would think if they found out their plan had a very low rating (say, less than 3 out of 5 stars), many said they would at least look into it to see why.

There was one notable scenario when the star rating system was relied on by focus group participants, or in this case, the absence of a star rating altogether.  One man mentioned that he ruled out a plan because instead of having a star rating, it said “plan is too new to be rated.” This made him feel like the plan might be risky since it was so new.  

Beneficiaries find it too difficult to compare plans

They receive and collect a lot of information from various sources.  

Some beneficiaries say they have gone to the Medicare Compare plan finder website on Medicare.gov to learn more about plans and make comparisons, but most have not. Among those who have gone to Medicare.gov, a few found the information to be helpful at a general level, but most say that once you get into the details of plans, the information on the site is confusing. They think the language is too technical and the comparisons are not very helpful because the information is not standardized. Additionally, many explain that they are not very savvy with the computer and navigating the website is just too much for them.

I can’t find anything that makes any sense.  When I call about it and ask for information I get such strange ideas about how I should get information from different providers and then analyze it and compare it like I’m some kind of computer or something.  I can’t do that.
-PDP Beneficiary (Baltimore, MD)

Some have called Medicare’s 800 phone number with mixed results. A few say they had good experiences and received customer service that helped them with the information they needed. Others complained of long wait times or less than helpful customer service.

Everyone recalls receiving the “Medicare and You” handbook. It seems that most people look at it initially but do not use it to choose a plan.

Focus group participants also received booklets and information from health plans. People said they use them to see if their doctors and prescriptions are covered in the plans they are considering. But this is often the extent to which these materials are used. People say they are not easy to read, and are not always up to date with the current lists of physicians accepting specific plans.

Beneficiaries explain that they receive and seek a lot of information about plans when they first enroll in Medicare. Sources of information include the following:

  • “Medicare and You” handbook sent out by the Centers for Medicare and Medicaid Services
  • Information from insurance plan websites
  • Plan materials sent to their homes
  • Informational sessions hosted by insurance companies
  • Infomercials on television

Many mentioned that they do at least look over the information for their current plans during open enrollment to make sure they are aware of any changes that might be taking place. Many people with Part D plans, for example, will review their formularies to make sure their prescriptions are still covered. But this is done more as a housekeeping task, not necessarily as a step toward changing their plan. If any red flags are raised in this process, however, they may consider looking into other options.

Seniors say they have tried to compare the costs, coverage, and provider networks of plans, but find it frustrating and confusing.

That’s what gets me, they wait until we retire to make it complicated. […] now all of the sudden I have all of these Advantage programs and I have to do a spreadsheet.
-Medicare Advantage Beneficiary
(Memphis, TN)

I went online. I had papers taped together, it was six feet wide, of the different companies and circles and arrows.
-PDP Beneficiary (Baltimore, MD)

For those who do not engage very frequently in the healthcare system, their monthly premium is the main cost they consider – often looking for the lowest premium and either not paying attention to or not worrying about deductibles and co-pays because they do not expect to need much healthcare. This was especially true among many Medicare Advantage enrollees, who explained that they had plans with very low premiums. The trade-off was higher co-pays (especially for hospital stays), but many felt that the tradeoff was worth it given how little they expected to use healthcare services.

For those who see doctors often or take a lot of medication, determining their total expected costs can become quite complicated. This is a very frustrating aspect of sifting through plan information and trying to make a choice. It may be that no Part D plan, for example, covers all the medications they need, so they have to figure out what their out-of-pocket spending would be for several plans. A few people explain that they make spreadsheets to lay out all of this information. Most, however, either just do the best they can or enlist the help of insurance agents, adult children, or others to help them figure it out.

Seniors rely on insurance agents as trusted advisors.

Following the advice of an insurance agent seemed to be the most common way that people chose their plans. They trust agents as valuable sources of information who can help them figure out the best plan for them. Many have agents they have worked with before enrolling in Medicare and stick with them. Others find new agents through referrals or because an agent proactively sought them out as a customer.Few seem to have concerns about insurance agents’ objectivity or potential biases. They view them as knowledgeable professionals who can help simplify what feels like a very complicated decision-making process.

…all our insurance comes under our agent and we’ve had him for 20 years, so we just kind of accepted the recommendation for it. But I do believe that he has researched the other companies and made available what we should know.
-PDP Beneficiary (Memphis, TN)

Many receive suggestions from friends. Most say that they would not blindly follow a friend’s recommendation. They recognize that what is good for one person may not be right for another. But they often take friends’ experiences into account as starting points to look into certain plans. Also, if they hear that a friend is getting a good deal (a low premium, for example), this may spark their interest to look into that plan.

Many get suggestions from pharmacists and doctors’ offices. 

Many beneficiaries say they start narrowing down their plan options by asking their pharmacist or doctor’s office what insurance they accept. This is a way for them to make sure they are looking into plans that would allow them to continue using their pharmacy and keep their doctor. Very few talk about these issues with their doctors directly, however. Most view their doctors as not knowing much about insurance.

We have a lot of friends who do research, so we did a lot of networking.  It works.
-PDP Beneficiary (Baltimore, MD)

While most seniors say they heavily weighed costs when selecting their plans initially, costs do not seem to be as important after they are enrolled.  A number of seniors in this study acknowledged that their costs had risen since they first enrolled but that they still had not considered changing plans.  They offer a number of reasons for this, including wanting to avoid the frustrating process of choosing a new plan, fears that they will be worse off in a new plan, and an expectation that costs are going to increase regardless of which plan they choose.

Report: Why Do Medicare Beneficiaries Tend To Stay In The Same Health Plan From One Year To The Next?

In each focus group a few people had either changed plans at some point or were considering changing plans soon, but the vast majority had not and were not considering doing so. There was general consensus that they are resistant to changing plans. Choosing plans is an unpleasant task they try to avoid. Additionally, they view changing as risky. Focus group participants did not think the “grass was greener” in other plans and were wary of unknown aspects of other plans.  Even if they were not 100% satisfied with their plans, they felt more comfortable staying with what they knew.

There are days when I look at a plan, or look at my plan, and I think about possibly making a change, depending upon what’s out there for me … I’ve reached the age of 78 and I’m saying to myself, “I’m too goddamn tired to investigate this.”
-PDP Beneficiary (Baltimore, MD)

For the most part, people seem to be satisfied (enough) with their plans. Many invested some time and effort in making their initial choice and would need a major reason to revisit that choice. Most have various complaints about their plans, but very few have issues that seem major enough to make them reconsider their options and go back to square one.

Comparing and choosing plans the first time was frustrating enough, and they are reluctant to do it again

Choosing insurance plans is a frustrating, overwhelming process for most.

Beneficiaries describe the choice process as difficult and overwhelming. They receive lots of information from Medicare, insurance plans, insurance agents, friends, and others, and they do not know how to navigate through it all. They find it difficult to compare plans because there are so many details and the information across plans is not presented in a standardized way.

Many say they do not feel confident to make the right choice and just do the best they can. Most would like more help from trusted sources in the process and are grateful for the help they receive from knowledgeable people, especially in-person help from insurance agents and plan representatives.

And because I feel that I did my homework to the hilt initially, that should remain good for me.  If it is up and pricey, that’s okay. I don’t gamble. I am not a gambler.
-PDP Beneficiary (Baltimore, MD)

For most, choosing their initial plan was a very complicated process. The thought of doing all of that again was not appealing. Even the savviest of beneficiaries admit that they find all of the plan information overwhelming and are not sure how to go about choosing another plan again. People who have relationships with insurance agents seem less resistant to change for this reason; they have someone who they feel like they can call and just ask, “Is there something better out there for me?” But even these people are resistant to the idea of changing if there is no major issue with their current plan.

Open enrollment is not typically viewed as an opportunity to find a better quality or more affordable plan.

Open enrollment is viewed by many as a time to change plans only if they are unhappy with their current plan.  Even though the focus groups occurred during open enrollment, most admit they were not reviewing their plan choices and intended to stay put in their current plans. To consider changing plans, it seems that beneficiaries need to be frustrated with some aspect of their current plan. Only then would most people look into other options.

Open enrollment is only once per year and timing may not be ideal.

I think the older you get, the more resistant you are to change in general. There’s that comfort level, also. I wouldn’t want to keep going from one plan to another. There would have to be a big reason.
-PDP Beneficiary (Seattle, WA)

At our age as we get older we learned that the grass is not really greener on the other side.  We’re very cautious about changing to something else that is unfamiliar when we have that [which we] know in front of us.
-PDP Beneficiary (Tampa, FL)

It is important to point out that timing matters when it comes to changing plans. While many people have complaints about their plans, often times the issues arise when the open enrollment period is still in the distant future. In the meantime, they cope – they swallow the extra cost, they find a tolerable workaround, they go without seeing a particular doctor, and so on. For some, it seems that by the time open enrollment comes around, they are not as concerned about the issue as they were initially. They become accustomed to managing and as a result may not end up changing plans. If problems arise or persist during open enrollment, it seems people are much more open to considering changing plans. It becomes a top of mind issue that they feel like they can address immediately.

Change is not perceived as a good thing. Changing plans potentially disrupts their care, which may cause anxiety.  Seniors who use a lot of services are used to going to their preferred pharmacy, their chosen providers, and obtaining the medications they need.  They do not want to risk upsetting a pattern of care that is working well for them, even if there are problems with their plans.  There is a feeling among many seniors that they will be worse off if they leave their current plans.

Newer isn’t always perceived as better.  When it comes to changing plans, many express a view along the lines of “the grass isn’t always greener on the other side.” They say there will always be trade-offs and no plan will meet all of their needs all of the time. Given this reality, it is better to avoid the hassle of changing plans and to stick with what they know.

Beneficiaries are more likely to change their care before their plan

Most will go to considerable lengths to make their existing plan work.

If you can find an alternative [drug] through your doctor, try something else. Then you make the decision whether you need to change your plan.
-PDP Beneficiary (Baltimore, MD)

I figure if someone has gone through medical school and has their diploma on the wall, chances are they know enough about what is wrong with me to treat me. I’m not that committed to one particular doctor. Now if I get some serious ailment I may change my mind overnight.
-Medicare Advantage Beneficiary
(Tampa, FL)

Beneficiaries seem willing to do just about anything to make their existing plans work. When problems arise, they seek workarounds. This seems especially true for people with Part D plans. For example, if a medication they need is not covered, they will try a number of workarounds, including the following: asking their doctor for an alternative drug or a generic version, seeking samples from their doctor’s office, applying for discounts from drug manufacturers, making appeals to their insurer, and ordering medications from Canada or online.

Many focus group participants in Medicare Advantage plans were also willing to give up their primary care physician. Some said that if their doctor was no longer in their network, they would probably just find another doctor rather than change plans. They explained that if they were happy with the other aspects of their plan, this was something they could live with. Additionally, a few made the point that which doctors participate in which networks changes so often that it would be impossible to follow your doctor around all the time.

Cost increases are expected

Most seniors view cost increases as inevitable. 

Get mad and pay.
-Medicare Advantage Beneficiary
(Seattle, WA)

The cost of a lot of things and these plans keeps creeping up.  It is a matter of when our own personal circumstances reach that point.
-PDP Beneficiary (Baltimore, MD)

They are not surprised by increases in premiums or co-pays. They expect this. Most seem very willing to tolerate increases in monthly costs (be it for their premium, co-pays on medication, or other costs) up to a point. When the increase starts reaching around $75 more a month, most say they would consider looking into new plans. The tolerance for cost increases seems particularly high among those with PDPs.

Sometimes they view lower costs with a suspicious eye.

Most explain that they would be suspicious if there was ever a reduction in their premium from one year to the next. They are accustomed to price increases. A decrease would alarm them and make them think it is a sign of changes made to the plan like less coverage, higher co-pays, or limitations on their choice of pharmacies or providers.

Additionally, some beneficiaries associate higher prices with higher quality and therefore assume that if a plan costs more, you must be getting more for your money. Indeed, some in traditional Medicare say they are suspicious of $0 premium plans; they say it raises red flags about the quality of the plan. It is important to note, however, that many people with Medicare Advantage plans had $0 premium plans and did not express these types of concerns.

Many are not aware of their options

Among people in traditional Medicare, many were not aware of the choice between traditional Medicare and Medicare Advantage plans.  

Heard of [Medicare Advantage], but I know nothing about it.
-PDP Beneficiary (Baltimore, MD)

It seems that most just ended up in traditional Medicare or a Medicare Advantage plan without having made a conscious choice between the two options, and low levels of knowledge remain a problem. Those with traditional Medicare seemed particularly unaware of the choice; most did not know anything about Medicare Advantage plans. A few had heard negative things about them, such as the belief that many doctors do not accept them. Many seem resistant to the idea of having a limited network and giving up some choice on providers. Others feel that Medicare Advantage may be worth looking into as long as their primary care physician or other valued doctors participate in it.

There was more awareness of the choice among people who had Medicare Advantage plans, although many also seemed to have just landed in their plan without having necessarily deliberated the difference between this option and traditional Medicare. In many cases, they chose their plans based on the recommendation of an insurance agent or friend. Some of these beneficiaries express frustration with their limited network, but most are satisfied and say they like having everything in one plan and having access to centers where they can get all the care they need in one place. Many also like having the option to get dental and vision coverage and the extra benefits like gym access through Silver Sneakers.

For most, the amount of information ends up being overwhelming and difficult to sift through. They do not feel as though they can make sense of it all and make a good decision on their own, so they seek help from other sources.

Some are simply uninformed about their plan options.

Some people seem uninformed about the choices they have. A few people, for example, do not understand that they are allowed to change plans during the open enrollment period. Some think that there are not many differences across plans except in terms of cost; they think most plans offer the same coverage and services. And as previously mentioned, most people in traditional Medicare do not know much (if anything) about Medicare Advantage plan options.

Report: What Drives Some People On Medicare To Switch Plans?

If beneficiaries decide to change plans (or to at least look into new options), the way they go about this is similar to the way they chose their initial plan. They collect information during open enrollment and engage trusted sources to help them navigate it all and make a decision. As during their initial plan selection process, insurance agents play an important role for many.

Beneficiaries’ needs change

Some beneficiaries change plans after incurring higher costs or not getting the care they thought they needed. 

For those who have changed Part D plans in recent years, increasing costs seem to be the main driver. For example, a few people sought new Part D plans because they kept falling into the coverage gap (‘donut hole’) and wanted to find new plans that would help limit their out-of-pocket expenses for medications. Others switched Part D plans because a medication they needed to take regularly was not covered and they could not figure out any workarounds. A few people with Part D plans explained that they eventually switched plans once their premiums had increased year after year.

When my wife fell and broke her leg she was in rehab and [the insurance company] shut her off.  They refused to cover her.  So we both said “Forget this Charlie.”
-Medicare Advantage Beneficiary
(Tampa, FL)

Cost is also an important driver for people with Medicare Advantage plans to change plans. The most common cases mentioned in our focus groups seemed to be situations in which people were looking to save money by either switching to a plan with a very low premium but relatively high co-pays (if they did not use many healthcare services) or moving away from such a plan (if they ended up needing more healthcare than they had originally anticipated). In other words, among this group of beneficiaries, their decision to change plans was more often about choosing a plan that made the most financial sense for them and not usually a reaction to an increase in costs.

Plans change

Higher drug costs, tougher utilization management restrictions, and limited pharmacy networks cause people to change plans.

Many seniors in this study relied on medications to maintain their health.  They often had strong preferences when it comes to their medications – and where they obtain them.

They wanted me on a less expensive statin and I would not change. I would not change. I would not change.  So they kept elevating the price until I finally left them.
-PDP Beneficiary (Baltimore, MD)

Changes in their plan’s drug formulary or which pharmacies are covered are reasons a number of seniors say they would consider changing plans.  Seniors also said that they would change plans if the costs of their drug goes up too much, it is more difficult to obtain their drug due to preauthorization requirements or other restrictions, or if their drug was no longer covered by their plan.  

Learning that a valued doctor or hospital is no longer covered in the plan is a motivating factor to change plans.  While not as common of a motivator as costs, for people in Medicare Advantage plans, finding out that a preferred doctor or hospital is no longer covered by a plan has motivated some people to change or consider changing plans. In some cases, this is about losing access to a primary care physician with whom they have a long-standing relationship. In other cases, it is about losing access to a valued specialist for a chronic condition. Learning that they can no longer access a specific hospital – even if they do not have current needs to go there – has also raised red flags for some people. Some are concerned about infection rates in hospitals as well as making sure they can get the best care for a given condition (again, even if they do not currently have it). One Floridian woman, for example, explained that she was concerned that a particular plan was no longer referring patients to a specialty cancer center even though she did not have cancer.

While most are not that vigilant when it comes to reviewing their plans and considering other options, some are more sensitive to changes in their plans than others. For example, people who have a chronic illness, take multiple medications, or see many specialists are much more aware of the details of their plans and more sensitive to plan changes in coverage and costs. They still tend to be resistant to changing plans, but if a strongly preferred doctor or hospital is no longer covered, they would consider changing. Likewise, if increases in costs pass a tolerable threshold, they are more likely to consider changing.

Report: What Do Beneficiaries Suggest To Improve The System?

Seniors need […] support. They need help that’s not just a matter of getting phone numbers and how to work the computer. They need actual, personalized help, that doesn’t cost money.
-PDP Beneficiary (Seattle, WA)

The following are ideas suggested by the seniors in this study for improving the decision making process in Medicare.  While acknowledging that they are resistant to change and reluctant to engage in the decision making process after their initial choices, many seniors feel that Medicare could do more to facilitate plan choice.

Increase access to in-person help for choosing plans.  Beneficiaries want to sit down with someone face-to-face to discuss their options and have their questions answered. Currently, insurance agents and plan representatives are filling this role. While most beneficiaries do not seem concerned about their objectivity or potential biases, beneficiaries would appreciate alternatives to these sources.

Explain more clearly how people might benefit from a change in plans (or the cost of inaction).  Focus group participants do not necessarily think there is anything to gain by revisiting their choice of insurance plans and suggest that it could help to have someone explain how the process could benefit them. Giving real examples of how people benefited after switching plans could be helpful. It could also be helpful to remind people that their health situations change as do plans, and it is worth making sure they are getting the most out of their insurance.

Create a user-friendly online tool to help beneficiaries narrow down their plan options. One of the biggest challenges identified by study participants in choosing a plan was the multitude of plans to consider and compare. Beneficiaries in this study liked the idea of a tool that could give them a shortlist of potential plans that could work for them based on a few pieces of information like their top plan selection criteria.  They did not seem to think that the Medicare Compare plan finder website performed this task adequately.  Beneficiaries complained that the current Medicare Compare plan finder uses complicated language and does not provide helpful plan comparisons. They suggested updating the site with more clear language and streamlined tools that allow apples-to-apples comparisons.

Advertise the star rating system, although beneficiaries say they still may not use it.  Very few people know about the star rating system. While it is not likely to be a decisive factor in people’s decisions, most think it would provide another piece of helpful information. Along with giving the star rating greater visibility, study participants also requested simple explanations of how the ratings are produced; beneficiaries want to know this information and say it will give more credibility to the ratings.

Retain plan choices:  Abundance in the number of plan options is both a blessing and a curse.  Study participants expressed some ambivalence about the amount of choices in plans. On the one hand, most believe that having a lot of plans to choose from leads to more competition and better quality and prices. On the other hand, they also find having too many choices to be overwhelming when it comes to actually sifting through the information and choosing a plan.

Overall, beneficiaries in this study were resistant to the idea of anyone (especially the government) limiting their choices. But they like the idea of developing tools to help them narrow down their choices based on certain criteria that are important or relevant to them.

Discussion

Many seniors on Medicare find the process of choosing a plan to be arduous and frustrating.  They think they did their homework the first time, and should not need to revisit the decision.  Unless they have a particularly bad experience with their plan – such as a substantial increase in costs, a loss of a valued benefit or provider, or a major change in their health condition that identified a mismatch between their needs and coverage – they are reluctant to compare or switch plans during the open enrollment period. The prevailing view is that it is not worth the hassle and the grass is not necessarily greener in another plan.  Even in extreme circumstances (such as their drug plan dropping coverage of their prescription drug), beneficiaries will go to great lengths to adapt to their plan (by switching drugs or getting samples from their doctor) rather than make a change.  When they feel they have no choice but to find another plan, seniors are eager to find shortcuts in making the selection with the least amount of stress and hassle, often preferring to get advice from a trusted advisor, such as an insurance agent or a plan representative, or suggestions from family, friends, and medical professionals.  Focus groups identified a high demand for clear, concise, and easily comparable information presented in a digestible format focusing on the factors most important to the individual, namely cost, provider networks, and coverage.  Few described the materials they have received as easy to use, and even fewer said they would turn to Medicare Compare during the next open enrollment season.

Seniors in our focus groups said they appreciate being able to choose among many plans, and do not want their number of choices to be limited; however, they would like to have additional help with selecting their plan.  Many beneficiaries seek to make well-informed and financially sound decisions but do not feel confident in their ability to do so under the current system.  Making it easier for beneficiaries to compare and switch plans, when it is in their interest to do so, would help achieve the goal of having consumers choose a plan that best meets their individual needs and preferences. In addition, if more beneficiaries switch to lower-cost plans, the result could be lower costs for themselves and for the Medicare program.

Endnotes

  1. For example, see Yaniv Hanoch, Thomas Rice, Janet Cummings, and Stacey Wood, How Much Choice is too Much? The Case of the Medicare Prescription Drug Benefit,” HSR 44(4):1157-1168, August 2009; Jeffrey R. Kling, Sendhil Mullainathan, et al., “Comparison Friction: Experimental Evidence from Medicare Drug Plans,” Quarterly Journal of Economics 127(1): 199-235, January 2012.; Jason T. Abaluck and Jonathan Gruber, “Choice Inconsistencies among the Elderly: Evidence from Plan Choice in the Medicare Part D Program,” American Economic Review 101(4): 1180-1210, June 2011; Florian Heiss, Adam Leive, Daniel McFadden, and Joachim Winter, “Plan Selection in Medicare Part D: Evidence from Administrative Data” (No. w18166), National Bureau of Economic Research, 2012.Hoadley Jack et al., “To Switch or Not to Switch: Are Medicare Beneficiaries Switching Drug Plans To Save Money?” Kaiser Family Foundation, October 2013; and Medicare Payment Advisory Commission, Report to the Congress: Medicare Payment Policy, March 2013; Shinobu Suzuki, “Medicare Part D’s Competitive Design: Do Part D Enrollees Switch Plans?” Academy Health, June 2013. ↩︎
  2. For example, see Yaniv Hanoch, Thomas Rice, Janet Cummings, and Stacey Wood, How Much Choice is too Much? The Case of the Medicare Prescription Drug Benefit,” HSR 44(4):1157-1168, August 2009; Jeffrey R. Kling, Sendhil Mullainathan, et al., “Comparison Friction: Experimental Evidence from Medicare Drug Plans,” Quarterly Journal of Economics 127(1): 199-235, January 2012.; Jason T. Abaluck and Jonathan Gruber, “Choice Inconsistencies among the Elderly: Evidence from Plan Choice in the Medicare Part D Program,” American Economic Review 101(4): 1180-1210, June 2011; Florian Heiss, Adam Leive, Daniel McFadden, and Joachim Winter, “Plan Selection in Medicare Part D: Evidence from Administrative Data” (No. w18166), National Bureau of Economic Research, 2012.Hoadley Jack et al., “To Switch or Not to Switch: Are Medicare Beneficiaries Switching Drug Plans To Save Money?” Kaiser Family Foundation, October 2013; and Medicare Payment Advisory Commission, Report to the Congress: Medicare Payment Policy, March 2013; Shinobu Suzuki, “Medicare Part D’s Competitive Design: Do Part D Enrollees Switch Plans?” Academy Health, June 2013. ↩︎
  3. Hoadley, Jack, Laura Summer, Elizabeth Hargrave, and Juliette Cubanski, “Medicare Part D Prescription Drug Plans: The Marketplace in 2013 and Key Trends, 2006-2013,” Kaiser Family Foundation, December 2013. ↩︎
  4. Gold, Marsha, Gretchen Jacobson, Anthony Damico, and Tricia Neuman, “Medicare Advantage 2014 Spotlight: Enrollment Market Update,” Kaiser Family Foundation, May 2014. ↩︎
  5. Chou Zhou and Yuting Zhang, “The Vast Majority of Medicare Part D Beneficiaries Still Don’t Choose the Cheapest Plans That Meet Their Medication Needs,” Heath Affairs 31(10): 2259-2265, October 2012; Jason Abaluck and Jonathan Gruber, “Evolving Choice Inconsistencies in Choice of Prescription Drug Insurance,” National Bureau of Economic Research Working Paper 19163, June 2013; and Hoadley Jack et al., “To Switch or Not to Switch: Are Medicare Beneficiaries Switching Drug Plans To Save Money?” Kaiser Family Foundation, October 2013. ↩︎
  6. Jacobson, Gretchen, Tricia Neuman, and Anthony Damico, “Transforming Medicare into a Premium Support System: Implications for Beneficiary Premiums,” Kaiser Family Foundation, September 2012. ↩︎
  7. Jacobson, Gretchen, Tricia Neuman, Anthony Damico, and Jennifer Huang, “Medicare Advantage Plan Star Ratings and Bonus Payments in 2012,” Kaiser Family Foundation, November 2011; and Rachel O. Reid, Partha Deb, Benjamin L. Howell, and William H. Shrank, “Association Between Medicare Advantage Plan Star Ratings and Enrollment,” JAMA 309(3): 267-274, January 2013. ↩︎
  8. Gold, Marsha, Gretchen Jacobson, Anthony Damico, and Tricia Neuman, “Medicare Advantage 2013 Spotlight: Plan Availability and Premiums,” Kaiser Family Foundation, December 2012; and Hoadley, Jack, Laura Summer, Elizabeth Hargrave, and Juliette Cubanski, “Medicare Part D Prescription Drug Plans: The Marketplace in 2013 and Key Trends, 2006-2013,” Kaiser Family Foundation, December 2013. ↩︎
  9. Gold, Marsha, Gretchen Jacobson, Anthony Damico, and Tricia Neuman, “Medicare Advantage 2013 Spotlight: Enrollment Market Update,” Kaiser Family Foundation, June 2013; and Hoadley, Jack, Laura Summer, Elizabeth Hargrave, and Juliette Cubanski, “Medicare Part D Prescription Drug Plans: The Marketplace in 2013 and Key Trends, 2006-2013,” Kaiser Family Foundation, December 2013. ↩︎
  10. Gold, Marsha, Gretchen Jacobson, Anthony Damico, and Tricia Neuman, “Medicare Advantage 2013 Spotlight: Plan Availability and Premiums,” Kaiser Family Foundation, December 2012; Gold, Marsha, Gretchen Jacobson, Anthony Damico, and Tricia Neuman, “Medicare Advantage 2013 Spotlight: Enrollment Market Update,” Kaiser Family Foundation, June 2013; and Jacobson, Gretchen, Tricia Neuman, and Anthony Damico, “Transforming Medicare into a Premium Support System: Implications for Beneficiary Premiums,” Kaiser Family Foundation, September 2012. ↩︎
  11. Jacobson, Gretchen, Jennifer Huang, Tricia Neuman, and Karen E. Smith, “Income and Assets of Medicare Beneficiaries, 2013-2030,” Kaiser Family Foundation, January 2014. ↩︎
News Release

Medicare Advantage: Take Another Look 

Published: May 7, 2014

In the latest post in the Policy Insights series, Tricia Neuman and Gretchen Jacobson examine the surprising growth in Medicare Advantage enrollment following payment reductions included in the Affordable Care Act.

Previous columns in the Policy Insights series are also available on kff.org.

Medicare Advantage: Take Another Look

Authors: Tricia Neuman and Gretchen Jacobson
Published: May 7, 2014

While health policy observers are mainly focused on the number of people enrolled in the new federal and state marketplaces, fewer are keeping a close eye on fairly big changes in the estimates and projections for enrollment in Medicare Advantage plans. The number of Medicare beneficiaries in Medicare private plans reached an all-time high this year of nearly 16 million beneficiaries, 6.3 million higher than the Congressional Budget Office (CBO) had projected in 2010 soon after the Affordable Care Act (ACA) was enacted (Figure 1). The CBO now projects Medicare Advantage enrollment will reach 22 million beneficiaries by 2020, more than double the number projected shortly after the ACA was enacted.

Figure 1: Medicare Advantage Enrollment in 2014 Exceeds Projections by 6 Million Beneficiaries

Medicare Advantage enrollment was expected to decrease in response to the reductions in payments to plans that were included in the ACA. The ACA payment reductions were adopted in response to concerns that Medicare was paying 14 percent more for beneficiaries in Medicare Advantage plans than it did for beneficiaries in traditional Medicare, on average.  This contributed to higher Part B premiums for all beneficiaries and to Medicare’s fiscal challenges. The ACA froze payments to plans for 2011 and then phased in reductions between 2012 and 2017.  The reductions were implemented by county on a 2-year, 4-year and 6-year schedule, with the longest phase in allowed for counties with relatively larger payment reductions.  The phased-in approach aimed to give insurers more time to adjust to the reductions and to find ways to deliver services at a lower cost without negatively affecting the quality of patient care.

The payment reductions have now been fully implemented in more than half of all counties and will be fully implemented in about another quarter of counties next year (Figure 2). Since 2010, enrollment has increased by more than one third in the counties with a slower, 6-year phase in, and by even more in the other counties. Nationally, Medicare Advantage enrollment has increased by 41 percent since 2010.

Figure 2: Status of Medicare Advantage Payment Reductions as of 2014

When Congress debated the payment reductions in 2010, forecasters and analysts also projected that reductions would drive insurers to raise premiums, cut extra benefits and even pull out of the Medicare Advantage market as they did after the Balanced Budget Act of 1997.   Thus far, however, the response by insurers to the ACA cuts has been more muted.

Beneficiaries today are able to choose among 18 Medicare Advantage plans, on average– a drop from prior years but still a fair amount of choice by most standards.   Some Medicare Advantage plans terminated or consolidated coverage, but others are moving into new counties and expanding coverage, suggesting that at least some insurers are optimistic about their financial prospects.

The steady but unexpected rise in enrollment may be partly attributable to the quality bonus demonstration implemented by the Centers for Medicare and Medicaid Services between 2012 and 2014.  The demonstration awarded bonuses to nearly all Medicare Advantage plans and boosted the size of the bonuses beyond what the ACA provided. The bonuses helped to offset more than one-quarter of the projected Medicare Advantage reductions in plan payments over these three years. Plans were required to use all bonus payments to provide extra benefits to enrollees, attracting more seniors to Medicare Advantage plans.

As Medicare Advantage enrollment increased, monthly premiums actually declined (from an average $44 per month in 2010 to $35 per month in 2014). Still, some evidence indicates that plans have made other adjustments to cut costs, for example, by increasing out-of-pocket limits, which could affect beneficiaries with relatively high health care expenses, and by narrowing their provider networks.

Plans may be looking for ways to tighten their belts and maintain profits, but the changes thus far do not seem to be scaring seniors away. CBO’s most recent projections show enrollment on track to increase steadily through 2023.   Looking forward, it will be important for beneficiaries to monitor potential changes in their coverage, costs and provider networks, with the bonus demonstration ending and plans continuing to adjust to lower payments and changing market conditions. But, for now, as Mark Twain might have said, the reports of the demise of the Medicare Advantage program appear to be greatly exaggerated.

News Release

May 13 Briefing: How Well Are Seniors Making Choices Among Medicare’s Private Plans And Does It Matter?

Published: May 6, 2014

The typical Medicare beneficiary this year has 18 private Medicare Advantage plans and 35 stand-alone Part D drug plan options to consider, in addition to traditional Medicare. Medicare encourages seniors to make informed decisions with respect to their health coverage options when they first become eligible for Medicare, and to review these options annually so they select coverage that best meet their needs. Yet research suggests only a small share of Medicare beneficiaries voluntarily switch plans during Medicare’s open enrollment periods. This raises questions about the role of choice in Medicare: How do Medicare beneficiaries choose among coverage options? Are Medicare beneficiaries happy with their coverage or just “sticky” when it comes to plan choice? What motivates some to switch plans and why don’t others do so? What are the implications for Medicare beneficiaries, private plans, health care providers and Medicare’s future?

At 9:30 a.m. ET Tuesday, May 13, the Kaiser Family Foundation will hold a policy briefing to examine how seniors and younger Medicare beneficiaries are negotiating their Medicare Advantage and Part D coverage options and consider the implications for them and for Medicare in the future. Swarthmore College Professor Barry Schwartz, author of The Paradox of Choice and a TED conference speaker, will provide opening remarks on why Americans value choice and the effects of abundant choice for individuals and their decision-making. His remarks will be followed by perspectives from an expert panel that will focus on Medicare, comprising Joe Antos, scholar at the American Enterprise Institute; Gretchen Jacobson, associate director for Medicare policy at the Foundation; Joshua Raskin, managing director at Barclays Capital; and Judith Stein, executive director of the Center for Medicare Advocacy. Foundation Senior Vice President Tricia Neuman will moderate.

WHEN: Tuesday, May 13, 9:30 a.m. to 11:00 a.m. (Registration and breakfast at 9 a.m.)

WHERE: Barbara Jordan Conference Center, Kaiser Family Foundation Offices 1330 G Street, NW, Washington, D.C. (one block west of Metro Center)

View the archived webcast of this briefing.

KFF: for trusted information on the health issues facing the nation and its people. The Kaiser Family Foundation is a nonprofit organization based in Menlo Park, California.

How is the ACA Impacting Medicaid Enrollment?

Authors: Vikki Wachino, Samantha Artiga, and Robin Rudowitz
Published: May 5, 2014

New data released by the Centers for Medicare and Medicaid Services (CMS) shows that as of the end of March 2014, Medicaid and CHIP enrollment had increased by over 4.8 million people since open enrollment began for the new Health Insurance Marketplaces in October 2013. These data help provide a better understanding of how the Affordable Care Act (ACA) is impacting Medicaid enrollment, which has been a keen focus and subject of debate among the press, policymakers, and analysts. However, understanding the ACA’s impact on Medicaid enrollment remains complex given that the ACA promotes increased Medicaid enrollment in varied ways, including changes in eligibility, modernization and simplification of enrollment processes, and increased outreach and enrollment efforts. To interpret the data, it is important to understand what they represent, what they show about the impact of the ACA on Medicaid enrollment, and what questions still remain. This brief discusses the data and its interpretation to assess the influence of the ACA on Medicaid enrollment and finds:

  • As of March 2014, Medicaid and CHIP enrollment grew by more than 4.8 million people compared to average monthly enrollment in the three months leading up to the start of open enrollment.
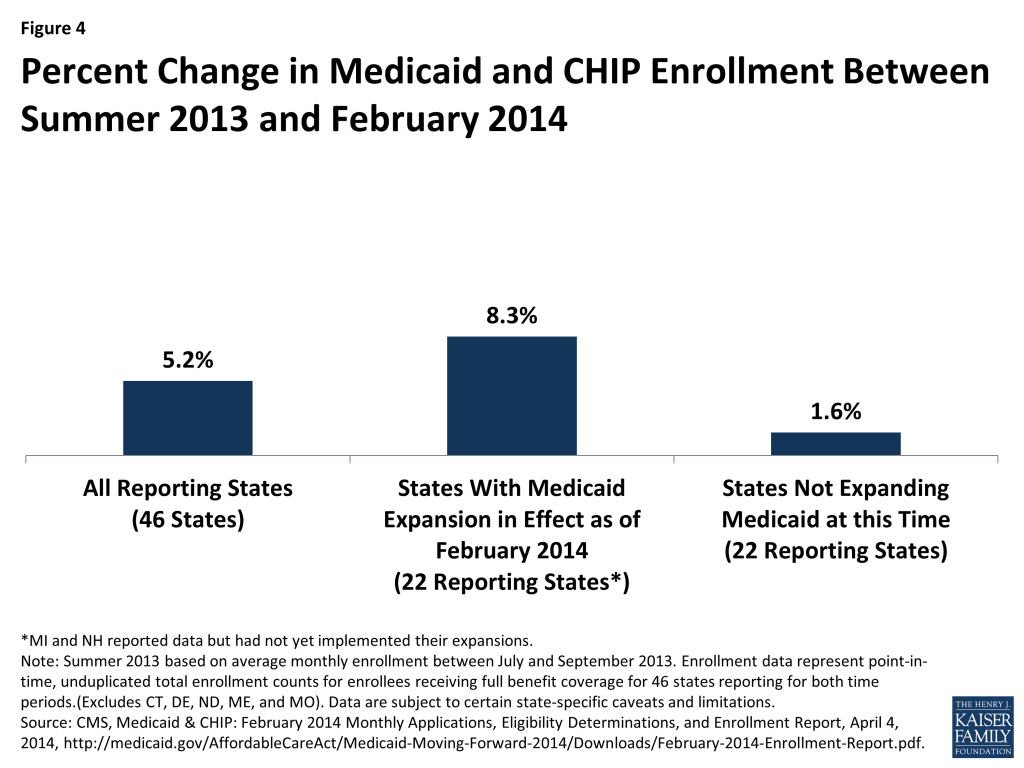
  • Enrollment growth in states that have expanded Medicaid coverage to low-income adults outpaced the national average, and was significantly higher than growth in non-expanding states (12.9% vs. 2.6%).
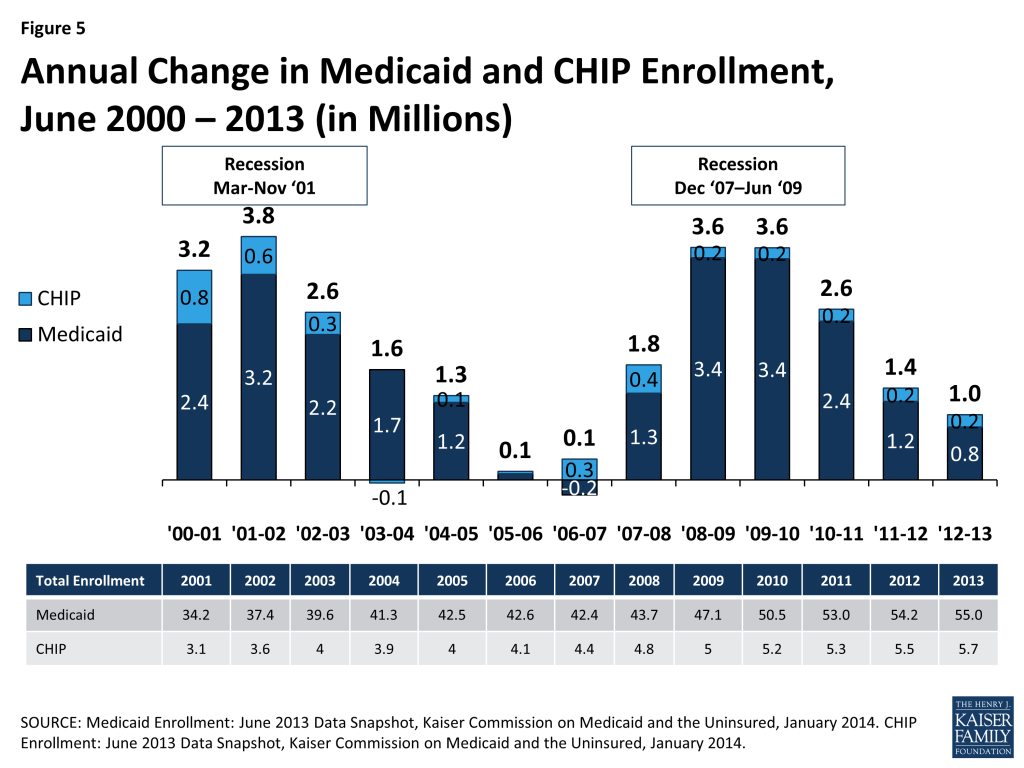
  • The recent data show very strong enrollment growth relative to historic trends, with the recent growth exceeding reported growth at the height of the most recent economic downturn.
  • Overall, the data suggest that the ACA is having a positive impact on Medicaid and CHIP enrollment, particularly in states that have implemented the Medicaid expansion. However, it remains challenging to quantify and separately identify the impacts of the specific ACA policies on enrollment.
  • Although enrollment gains are an important indicator of progress, ultimately the key measure of the ACA’s success in achieving its coverage goals will be a reduction in the number of uninsured.

Three main ACA changes lead to Medicaid enrollment gains.

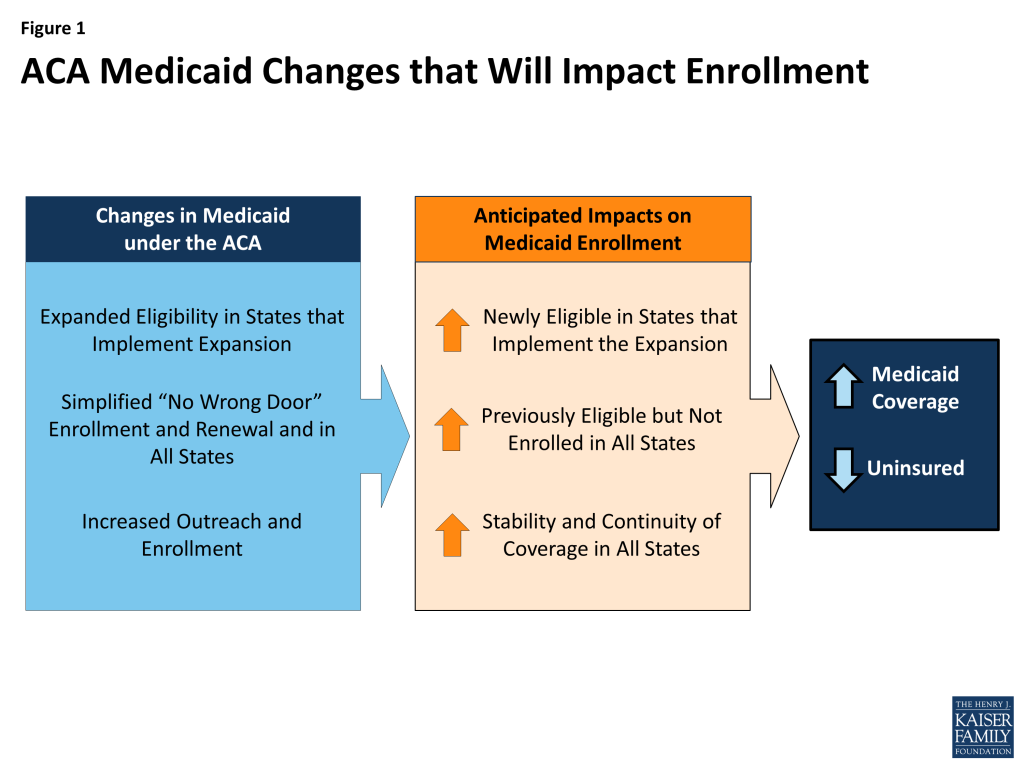
Even though most observers remain focused on the ACA’s Medicaid expansion, the ACA strengthens and improves Medicaid in other key ways that will increase Medicaid enrollment. Overall, there are three main changes the ACA makes to eligibility and enrollment that are expected to contribute to Medicaid enrollment gains (Figure 1):

Figure 1: ACA Medicaid Changes that Will Impact Enrollment
  1. Medicaid expansion to low-income adults. The ACA expands Medicaid eligibility to adults with incomes at or below 138 percent of the poverty line, which is just over $16,000 per year for an individual today. Historically, Medicaid covered low-income children, pregnant women, elderly and disabled individuals, and some parents, but excluded other low-income adults. The expansion, which the Supreme Court effectively made optional for states in 2012, fills this longstanding gap in the program. To date, 27 states, including DC, are implementing the expansion and additional states may expand moving forward.1 
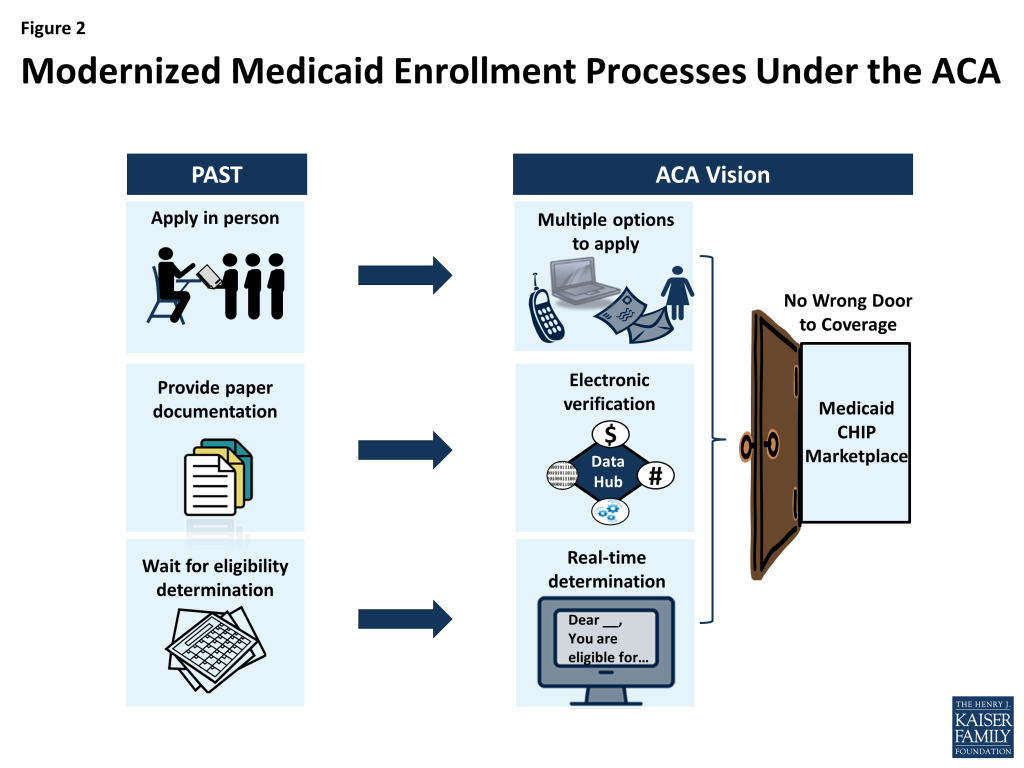
  2. Modernized, simpler enrollment processes. The ACA makes it easier for people to enroll in and renew Medicaid coverage. Prior to the ACA, states had achieved varied progress in modernizing and simplifying their Medicaid enrollment processes. Under the ACA, all states must offer individuals multiple options to apply (for example, online or by mail or phone), seek to rely on electronic data instead of paper to verify information, and, in as many cases as possible, provide “real time” determinations of eligibility for coverage (Figure 2). These processes are designed to coordinate with the new Marketplaces to create a “no wrong door” enrollment system, so that regardless of whether an individual applies directly to Medicaid or through a Marketplace, he or she is enrolled in the program for which he or she is eligible. All states must implement these changes, regardless of whether a state expands Medicaid.

    Figure 2: Modernized Medicaid Enrollment Processes Under the ACA

  3. Increased outreach and enrollment efforts. The ACA spurred outreach and enrollment efforts to help connect eligible people to coverage. Leading up to and throughout the open enrollment period for the Marketplaces, there was significant outreach to encourage individuals to apply for coverage and an array of assistance was available to help individuals enroll. Moreover, because Medicaid enrollment is not limited to the Marketplace open enrollment period, Medicaid outreach and enrollment efforts continue year-round.

Together, these three key changes are expected to lead to increased Medicaid coverage and a reduction in the number of uninsured. In states that expand Medicaid, there will be enrollment gains among adults made newly eligible by the expansion. But, in all states, the simpler enrollment processes and broad outreach and enrollment efforts will promote increased enrollment among individuals who were already eligible for Medicaid before the ACA, but not enrolled, many of whom are children. Prior to the ACA, these individuals may not have known that coverage was available, did not think they would be eligible, or may have encountered difficulties enrolling.

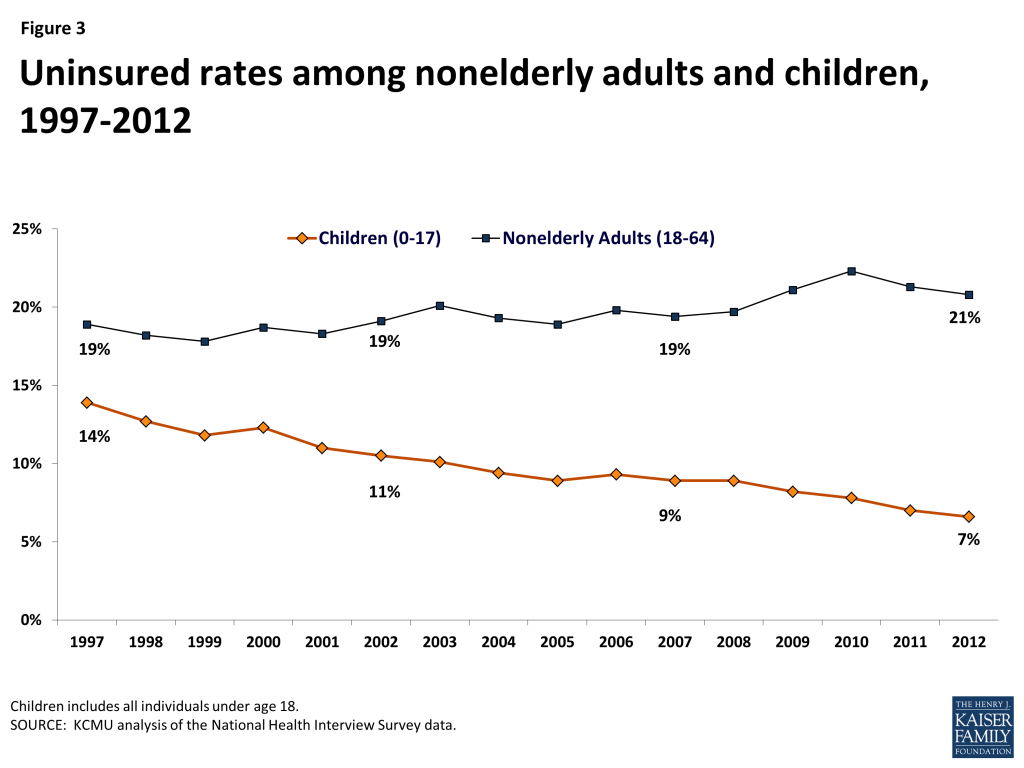
Previous experience with CHIP shows that the combined effects of increased eligibility, simplified enrollment, and enhanced outreach and enrollment efforts lead to decreases in the uninsured rate for children. CHIP was created in 1997 as a complement to Medicaid. It expanded eligibility to uninsured children who were not eligible for Medicaid, led states to simplify enrollment and renewal processes for children, and spurred broad outreach and enrollment efforts. Together, the combined effects of these changes not only increased enrollment of children in both Medicaid and CHIP, but resulted in a steady decline in the uninsured rate for children. Between 1997 and 2012 the uninsured rate for children was cut in half from 14% to a record low of 7%, even as uninsured rates for adults climbed during the recent economic downturn (Figure 3).

Figure 3: Uninsured rates among nonelderly adults and children,1997-2012

What do CMS Medicaid enrollment data show?

CMS recently began publishing monthly reports as part of an initiative to provide data on a broad set of Medicaid and CHIP eligibility and enrollment performance indicators to inform program management and oversight.2  This type of timely data had never before been reported and is providing some of the fastest insights on national Medicaid enrollment in the program’s history. The initial monthly reports provided data on the number of applications submitted and eligibility determinations made for Medicaid and CHIP. The press and assorted experts focused on trying to tease out what share of these determinations were attributable to the ACA and, in particular, the Medicaid expansion. However, it was difficult to disentangle the impacts of the ACA given the limitations of the data. Beginning in its April 2014 report, CMS also began reporting data on total Medicaid and CHIP enrollment. The addition of this data represents progress toward the agency’s goal of reporting a broader set of performance indicators and allows for greater insight into the ACA’s impact on enrollment. To date, CMS has reported point-in-time total Medicaid enrollment as of February 2014 and March 2014, as well as average monthly enrollment data for a comparison period prior to open enrollment (July through September 2013).  However, the data are new and remain subject to gaps, inconsistencies and limitations.

The CMS data show that between the comparison period prior to open enrollment (July to September 2013) and March 2014, total Medicaid and CHIP enrollment grew by over 4.8 million people (from 58.9 to 63.7 million) among the 47 states reporting data for both periods. Nearly all of this growth occurred among the reporting states implementing the Medicaid expansion. In the states expanding Medicaid that reported data for both periods, enrollment grew by 4.2 million (from 34.1 to 38.3 million). In states that are not expanding Medicaid and that reported data for both periods enrollment grew by just over 643,000 people (from 24.7 to 25.4 million).3  This growth reflects a combination of increased enrollment among newly eligible adults in states that have implemented the Medicaid expansion and increased enrollment among previously eligible individuals in all states due to changes in enrollment processes and stronger outreach and enrollment efforts. In the non-expansion states, it is likely that most enrollment gains have been among children, given that children make up most of the eligible but not enrolled uninsured population due to the higher income eligibility levels for children and limited eligibility for adults in these states. The 4.8 million enrollment increase does not reflect the 950,000 individuals enrolled under early expansions in seven states, since most individuals enrolled in these expansions were already enrolled in Medicaid by the July-September 2013 comparison period before the ACA.4 

There are wide disparities in enrollment growth between states that have already expanded Medicaid and those that have not expanded. Across the 47 states that reported data for both the period prior to open enrollment and March 2014, enrollment grew by an average of 8.2% between summer 2013 and March 2014 (Figure 4). The 22 states that had their Medicaid expansions in effect as of March 2014 and reported data for both periods experienced significantly greater enrollment growth compared to reporting states that are not expanding at this time (12.9% vs. 2.6%). Overall, 16 of the 22 reporting states that had already expanded Medicaid reported enrollment growth that exceeded 10%, including 5 that experienced growth exceeding 30%. Among expansion states, the variation in enrollment changes in part reflects differences in the size of the coverage expansion that is occurring in 2014. For example, states that previously covered many adults may see a smaller increase. Nearly all (22 of 23) states that are not expanding Medicaid and reported data for both periods had enrollment growth of less than 10%, with 7 reporting negative enrollment growth or net declines in enrollment over the period (Appendix Table 1).5 

Figure 4: Percent Change in Medicaid and CHIP Enrollment BetweenSummer 2013 and March 2014

It is expected that Medicaid and CHIP enrollment will continue to grow. As noted, not all states reported enrollment data for the period and the data that were reported are preliminary and expected to increase as states finalize their data and incorporate retroactive enrollments into their enrollment counts. These enrollment adjustments will likely include some individuals determined eligible for Medicaid or CHIP by the Federally Facilitated Marketplace (FFM) who may not have had their enrollment completed due to delays in the transfers of accounts between the FFM and Medicaid and CHIP agencies. Moreover, because Medicaid and CHIP enrollment is not limited to the open enrollment period for the Marketplaces, new enrollments will continue year-round.

What have we learned from the new enrollment data?

The recent enrollment data from CMS show strong growth relative to previous enrollment trends. Earlier Medicaid and CHIP enrollment data collected and analyzed by the Kaiser Commission on Medicaid and the Uninsured for multiple years show that enrollment growth was slowing prior to the beginning of open enrollment as economic conditions continued to improve, at 1.4 million between June 2011 and 2012 and 1.0 million between June 2012 and 2013 (Figure 5).6  The CMS-reported enrollment gain of 4.8 million between summer 2013 and March 2014 is greater than enrollment trends at the height of the most recent economic downturn, which peaked at 3.6 million between June 2008 to 2009 and June 2009 to 2010. Although these earlier data are not directly comparable to the new CMS data because not all states reported to CMS and there are differences in data adjustments, they both similarly report monthly point-in-time enrollment. Comparing the recent enrollment change reported by CMS to earlier trends suggests that the ACA policy changes are having a positive impact on enrollment. However, it is important to recognize that additional factors may also be influencing enrollment, including seasonal fluctuations, changing economic conditions, and overall population growth.

Figure 5: Annual Change in Medicaid and CHIP Enrollment,June 2000 – 2013 (in Millions)

Even with the new enrollment data, it remains challenging to quantify and separately identify the impacts of the specific ACA policies on enrollment. Although, in principle, it should be relatively easy to calculate the number of adults enrolled in the Medicaid expansion in the states that have expanded, the reality has proven challenging. Many state systems are not yet able to track enrollment in this group separately and report in real-time. Only a few states (such as Washington) have reported data on the number of people enrolling in the expansion group, and it is not possible to extrapolate from a few states to estimate the entire expansion population accurately. In addition, the CMS enrollment data are for overall enrollment and do not separately identify expansion enrollees. In the future, data on expansion enrollees will become available when states begin requesting payments for the higher federal matching rate provided for adults made newly eligible by the Medicaid expansion. It also is difficult to identify how many people are enrolling in Medicaid as a result of the new, simpler processes or as a result of the ACA’s broad outreach and enrollment efforts. Unlike the Marketplaces, Medicaid was an existing program with ongoing enrollment at the time the ACA was implemented, so separating usual enrollment changes from ACA-driven changes is complex. In contrast, the Marketplaces are entirely new entities created by the ACA, so any enrollee in the Marketplace is, by definition, new and growth in enrollment over time can be more easily measured and compared across states.

Looking Ahead

The new enrollment data reported by CMS suggest that the ACA is having a strong positive impact on Medicaid enrollment, particularly in states that have implemented the Medicaid expansion. However, ultimately the key measure of the ACA’s success will changes in the number of uninsured. Early survey findings show promising reductions in the uninsured rate to date. However, fully assessing the impact of the ACA will require monitoring changes in coverage over longer periods of time to determine changing patterns in health insurance coverage and access to care and the extent to which individuals are able to maintain continuous coverage. While waiting for these measures is challenging, they ultimately will provide the most meaningful measures of the ACA’s progress in achieving its broader coverage goals. In the meantime, the data released by CMS is expected to continue to improve and expand over time, allowing for greater analysis, and surveys like the Kaiser Survey of Low-income Americans will provide insight into low-income consumers’ experiences to provide greater understanding about the impact of the ACA on the low-income uninsured.7 

Appendix Table 1: Total Medicaid and CHIP Enrollment, February and March 2014
StateMedicaid Expansion StatusMonthly AverageJuly-Sept 2013February 2014March 2014Percent ChangeJuly-Sept 2013 to March 2014
ArizonaExpanded1,201,7701,234,4011,301,0108.3%
ArkansasExpanded680,920763,356805,78518.3%
CaliforniaExpanded9,157,0009,999,00010,334,00012.9%
ColoradoExpanded783,420962,2101,012,94429.3%
ConnecticutExpanded –704,387
DelawareExpanded –230,165233,786
District of ColumbiaExpanded235,786238,000241,2432.3%
HawaiiExpanded288,358313,669320,56711.2%
IllinoisExpanded2,753,2272,735,2242,791,7371.4%
IowaExpanded493,515557,501572,37516.0%
KentuckyExpanded840,926966,3651,125,96433.9%
MarylandExpanded856,2971,053,5891,092,40927.6%
MassachusettsExpanded1,296,3591,453,2131,455,06912.2%
MichiganExpansion effective 4/1/141,912,0091,845,1121,942,4371.6%
MinnesotaExpanded873,040976,350972,68311.4%
NevadaExpanded332,559404,825437,21831.5%
New HampshireExpansion effective 7/1/14127,082133,110134,6996.0%
New JerseyExpanded1,283,8511,361,5131,382,0917.7%
New MexicoExpanded572,111602,014632,48910.6%
New YorkExpanded5,678,4185,823,9956,022,2536.1%
North DakotaExpanded
OhioExpanded2,341,4822,361,1032,549,7628.9%
OregonExpanded626,357900,933900,03843.7%
Rhode IslandExpanded190,833227,095244,16227.9%
VermontExpanded127,162168,233173,60936.5%
WashingtonExpanded1,117,5761,369,1791,369,82522.6%
West VirginiaExpanded354,544473,401490,96238.5%
Percent Change in States with Expansion in Effect as of March 2014*12.9%
AlaskaNot Currently Expanding 799,176116,720119,767-1.0%
AlabamaNot Currently Expanding 120,946769,295774,293-3.1%
FloridaNot Currently Expanding 3,086,4453,233,1953,309,5017.2%
GeorgiaNot Currently Expanding 1,702,6501,773,3271,801,4845.8%
IdahoNot Currently Expanding 251,926270,594270,9437.5%
IndianaNot Currently Expanding 1,120,6741,120,8471,165,7184.0%
KansasNot Currently Expanding 397,989415,284420,4875.7%
LouisianaNot Currently Expanding 1,019,7871,008,1761,011,883-0.8%
MaineNot Currently Expanding –
MissouriNot Currently Expanding 714,055828,478829,585-3.9%
MississippiNot Currently Expanding 863,417720,292731,8762.5%
MontanaNot Currently Expanding 139,604149,245153,73610.1%
North CarolinaNot Currently Expanding 244,6001,786,3691,802,1673.3%
NebraskaNot Currently Expanding 1,744,160238,121235,054-3.9%
OklahomaNot Currently Expanding 790,051814,881828,3294.8%
PennsylvaniaNot Currently Expanding 2,386,0462,398,7182,427,0341.7%
South CarolinaNot Currently Expanding 988,3491,017,3331,041,9935.4%
South DakotaNot Currently Expanding 115,501115,013115,7110.2%
TennesseeNot Currently Expanding 1,244,5161,279,3361,298,1814.3%
TexasNot Currently Expanding 4,441,6054,425,3164,444,8190.1%
UtahNot Currently Expanding 322,442330,306332,8263.2%
VirginiaNot Currently Expanding 1,003,2661,058,8391,039,8223.6%
WisconsinNot Currently Expanding 1,161,8761,162,6141,151,225-0.9%
WyomingNot Currently Expanding 71,96272,378119,767-5.6%
Percent Change in States Not Expanding*2.6%
Percent Change in All States*8.2%
* Percent change based on states reporting for both the July-September 2013 and March 2014 periods.Sources: CMS March 2014 and Updated February 2014 Medicaid and CHIP Application and Eligibility Report. See CMS reports for data definitions and state-specific data notes and caveats.

This insight was prepared by Vikki Wachino from NORC at the University of Chicago and Samantha Artiga and Robin Rudowitz from the Kaiser Family Foundation.

  1. State Health Facts, “Status of State Action on the Medicaid Expansion Decision, 2014,” Kaiser Family Foundation, http ://kff.org/medicaid/state-indicator/state-activity-around-expanding-medicaid-under-the-affordable-care-act/. ↩︎
  2. See Monthly Medicaid and CHIP reports, Medicaid Moving Forward 2014, Eligibility Data http://medicaid.gov/AffordableCareAct/Medicaid-Moving-Forward-2014/medicaid-moving-forward-2014.html#. ↩︎
  3. Centers for Medicare and Medicaid Services, “Medicaid & CHIP: March 2014 Monthly Applications, Eligibility Determinations, and Enrollment Report,” May 1, 2014, http://medicaid.gov/AffordableCareAct/Medicaid-Moving-Forward-2014/medicaid-moving-forward-2014.html#. ↩︎
  4. Seven states (CA, CO, CT, DC, MN, NJ, WA) implemented an “early option” to expand Medicaid coverage to adults between April 1, 2010 and January 1, 2014, using new state plan authority provided by the ACA or a Section 1115 demonstration waiver. Some of these states previously covered some adults enrolled in these early expansions through state- or locally-funded coverage programs.  Overall, nearly 950,000 people are covered under these early expansions. Because most of these individuals were already enrolled in Medicaid by the July-September 2013 comparison period before the ACA, most of these beneficiaries are not counted as part of the 4.8 million enrollment gain. ↩︎
  5. Ibid. ↩︎
  6. Snyder, L., et al., “Medicaid Enrollment: June 2013 Data Snapshot,” Kaiser Family Foundation, January 29, 2014, https://modern.kff.org/report-section/medicaid-enrollment-june-2013-data-snapshot-total-enrollment/ and Smith, V., et al, “CHIP Enrollment: June 2013 Data Snapshot,” Kaiser Family Foundation, January 29, 2014, https://modern.kff.org/medicaid/issue-brief/chip-enrollment-june-2013-data-snapshot/. ↩︎
  7. Garfield, R., Licata, R., and K. Young, “The Uninsured at the Starting Line: Findings from the 2013 Kaiser Survey of Low-Income Americans,” February 6, 2014, https://modern.kff.org/uninsured/report/the-uninsured-at-the-starting-line-findings-from-the-2013-kaiser-survey-of-low-income-americans-and-the-aca/. ↩︎

Medicare Advantage 2014 Spotlight: Enrollment Market Update

Authors: Marsha Gold, Gretchen Jacobson, Anthony Damico, and Tricia Neuman
Published: May 1, 2014

Despite concerns that payment changes enacted in the Affordable Care Act of 2010 (ACA) would lead to reductions in Medicare Advantage enrollment, the number and share of Medicare beneficiaries enrolling in Medicare  Advantage plans has continued to climb.  Since the enactment of the ACA, Medicare Advantage enrollment has increased by 4.6 million, or by 41 percent.  Reductions in payments enacted in the ACA aimed to reduce historical overpayments to Medicare Advantage plans and to create more equity between Medicare payments made for beneficiaries in the traditional Medicare program and those joining Medicare Advantage plans.  As of March of 2014, almost one in three (30 percent) people on Medicare (15.7 million beneficiaries) were enrolled in a Medicare Advantage plan, a 10 percent increase since March 2013.  During the past year,  Medicare Advantage enrollment has increased in virtually all states.  Most of the enrollment growth since 2013 has been in the individual market, but group enrollment in Medicare Advantage plans accounted for almost one-third (32%) of the enrollment growth in 2014 and has been a major factor in the experience of some firms.

Average monthly premiums (weighted by enrollment) have remained relatively stable since 2012 ($35 per month in 2014).   During this same period, however, average out-of-pocket spending limits have been on the rise, which could expose a subset of enrollees to higher costs – mainly those who have significant medical needs.   Medicare Advantage plans, unlike traditional Medicare, are required to limit out-of-pocket costs for services covered under Parts A and B ($3,400 is recommended; $6,700 is the maximum).   Between 2013 and 2014, the share of Medicare Advantage enrollees in plans with limits above $5,000 almost doubled, from 24 percent in 2013 to 44 percent in 2014. This Data Spotlight reviews national and state-level enrollment trends as of March 2014 and examines variation in enrollment by plan type and firm. It also analyzes the most recent data on premiums, out-of-pocket limits and prescription drug coverage in the Part D “donut hole” for Medicare Advantage enrollees.

Introduction

Despite concerns that payment changes enacted in the Affordable Care Act of 2010 (ACA) would lead to reductions in Medicare Advantage enrollment, the number and share of Medicare beneficiaries enrolling in Medicare Advantage plans has continued to climb.1  Since the enactment of the ACA, Medicare Advantage enrollment has increased by 4.6 million, or by 41 percent.[endnote 111939-2] Reductions in payments enacted in the ACA aimed to reduce historical overpayments to Medicare Advantage plans and to create more equity between Medicare payments made for beneficiaries in the traditional Medicare program and those joining Medicare Advantage plans. As of March of 2014, almost one in three (30 percent) people on Medicare (15.7 million beneficiaries) were enrolled in a Medicare Advantage plan, a 10 percent increase since March 2013.During the past year, Medicare Advantage enrollment has increased in virtually all states. Most of the enrollment growth since 2013 has been in the individual market, but group enrollment in Medicare Advantage plans accounted for almost one-third (32%) of the enrollment growth in 2014 and has been a major factor in the experience of some firms.

Average monthly premiums (weighted by enrollment) have remained relatively stable since 2012 ($35 per month in 2014).   During this same period, however, average out-of-pocket spending limits have been on the rise, which could expose a subset of enrollees to higher costs – mainly those who have significant medical needs.   Medicare Advantage plans, unlike traditional Medicare, are required to limit out-of-pocket costs for services covered under Parts A and B ($3,400 is recommended; $6,700 is the maximum).   Between 2013 and 2014, the share of Medicare Advantage enrollees in plans with limits above $5,000 almost doubled, from 24 percent in 2013 to 44 percent in 2014. This Data Spotlight reviews national and state-level enrollment trends as of March 2014 and examines variation in enrollment by plan type and firm. It also analyzes the most recent data on premiums, out-of-pocket limits and prescription drug coverage in the Part D “donut hole” for Medicare Advantage enrollees.


Issue Brief: Overall Trends In Enrollment

Nationwide Enrollment. There are 15.7 million beneficiaries – 30 percent of the Medicare population – enrolled in a Medicare Advantage plan in 2014 (Exhibit 1).2  Between 2013 and 2014, total Medicare Advantage enrollment grew by almost 1.4 million, or 9 percent; since 2010, Medicare Advantage enrollment has increased by 4.6 million beneficiaries or 41 percent from 2010 to 2014. This pattern continues the rapid growth in enrollment that occurred concurrently with the introduction of Part D (prescription drug coverage) in 2006 and other changes in the Medicare Advantage program authorized by the Medicare Prescription Drug, Improvement and Modernization Act (MMA) of 2003.  Medicare enrollment has continued to grow despite the fact that the average number of plans available to enrollees nationwide declined from a high of 48 plans in 2009 to 20 plans in 2012 and to 18 in 2014, as firms made changes to plans offered under their Medicare Advantage contracts.3 

Exhibit 1: Total Medicare Private Health Plan Enrollment, 1999-2014
Exhibit 2: Share of Medicare Beneficiaries Enrolled in Medicare Advantage Plans, by State, 2014

Enrollment by State. Medicare Advantage enrollment continues to vary geographically (Table 1). In 2014, as in at least the prior two years, 6 states (AK, DE, MD, NH, VT and WY) had less than 10 percent of Medicare beneficiaries in Medicare Advantage plans (Exhibit 2). In contrast 18 states (versus 15 in 2013) have 30 percent or more of their beneficiaries enrolled in Medicare Advantage plans, including 3 (MN, OR, and HI) with 40 percent or more enrolled in Medicare Advantage plans.  This variation reflects the urban origins of health maintenance organizations (HMOs) in Medicare Advantage and other factors, such as the history of managed care in the state and the prevalence of employer sponsored insurance for retirees.

Despite such variation, enrollment increased in virtually all states in 2014, with the exception of New Jersey where enrollment declined 2 percent.  Among other states, 13 states experienced a growth in enrollment of 5 percent or less   In 19 states, enrollment grew by 6-10 percent, in 9 states enrollment grew by 11-15 percent and in 7 states enrollment grew by 16 percent or more between 2013 and 2014.  Very high rates of growth (such as 56 percent in Illinois and 45 percent in North Carolina) reflect the influence of the group market, and illustrate how  a single change in coverage for an employment-based retiree group can move relatively large numbers of people within a state. Each of these states added over 100,000 group enrollees to Medicare Advantage between March 2013 and 2014.  In most other states, enrollment in group plans had a far more modest effect on the growth in Medicare Advantage enrollment.

Table 1.  Medicare Advantage Enrollment and Penetration Rate, by State, 2013-2014
State2013 Total Enrollment2014 Total EnrollmentChange in Total Enrollment, 2013-2014Percent Change in Enrollment, 2013-20142013 Penetration Rate2014 Penetration Rate
Total U.S.14,361,61515,732,0811,370,46610%28%30%
Alabama203,951220,64016,6898%22%24%
AlaskaN/AN/AN/AN/AN/AN/A
Arizona384,851401,62616,7754%38%38%
Arkansas98,322107,7139,39110%17%19%
California1,937,3502,061,617124,2676%37%38%
Colorado244,356263,78819,4328%35%36%
Connecticut137,253146,3729,1197%23%24%
Delaware10,94112,6231,68215%7%7%
District of Columbia8,6549,7141,06012%10%11%
Florida1,318,7401,438,325119,5859%36%38%
Georgia350,142404,62854,48616%25%28%
Hawaii103,346108,1434,7975%46%46%
Idaho74,87181,4406,5699%30%33%
Illinois209,200326,678117,47856%11%16%
Indiana224,875244,97020,0959%21%22%
Iowa74,52077,0322,5123%14%14%
Kansas54,32959,0184,6899%12%13%
Kentucky178,945198,05219,10711%22%24%
Louisiana193,638213,28019,64210%26%28%
Maine49,34758,2348,88718%17%20%
Maryland73,23976,4643,2254%8%9%
Massachusetts209,147229,40020,25310%18%20%
Michigan478,923547,37268,44914%27%30%
Minnesota415,638448,30132,6638%49%51%
Mississippi64,00069,9625,9629%12%13%
Missouri257,164285,06627,90211%24%26%
Montana27,22931,1253,89614%15%17%
Nebraska33,22833,5072791%12%13%
Nevada126,441135,5999,1587%32%33%
New Hampshire12,55415,9053,35127%5%6%
New Jersey223,161219,494-3,667-2%16%15%
New Mexico98,198107,0648,8669%29%30%
New York1,062,3291,151,62089,2918%33%35%
North Carolina328,020475,432147,41245%20%28%
North Dakota13,71615,2021,48611%12%14%
Ohio755,580794,22638,6465%37%38%
Oklahoma102,224106,7064,4824%16%16%
Oregon286,306305,79419,4887%42%43%
Pennsylvania939,496971,14431,6483%39%39%
Rhode Island68,30670,6272,3213%35%36%
South Carolina167,292193,64126,34916%20%22%
South Dakota18,78122,2423,46118%13%15%
Tennessee338,124376,57738,45311%29%32%
Texas889,551990,399100,84811%27%29%
Utah101,751107,1395,3885%33%34%
Vermont8,1998,3681692%7%7%
Virginia181,455196,99315,5389%15%15%
Washington305,289329,08723,7988%28%29%
West Virginia83,92296,60412,68215%21%24%
Wisconsin324,912352,84227,9309%33%35%
Wyoming1,9401,997573%3%3%
NOTE: Includes employer-sponsored plans, special needs plans, and other private plans.  N/A indicates too few (less than 50) enrollees to report.  Total U.S. includes Puerto Rico.SOURCE:  MPR/Kaiser Family Foundation analysis of CMS Medicare Advantage enrollment and Landscape files, 2013-2014.


Issue Brief: Trends In Enrollment By Plan Type

Nationwide Trends.  HMOs, which were the original form of Medicare Advantage plan, account for almost two-thirds (64 percent) of Medicare Advantage enrollment  in 2014, with 23 percent in local PPOs, 8 percent in regional PPOs, 2 percent in Private fee-for-service (PFFS) plans, and 3 percent in other types of plans (Exhibit 3).  While the HMO market share has remained relatively stable in recent years, PPOs (especially local PPOs) have replaced the PFFS product as the dominant alternative plan attracting enrollees.

Exhibit 3: Distribution of Enrollment in Medicare Advantage Plans, by Plan Type, 2014
  • HMOs. In 2014, 10.1 million Medicare beneficiaries were enrolled in HMOs, up from 9.3 million in 2013, an 8.6 percent increase (Exhibit 4).  Nearly two-thirds of all Medicare Advantage enrollees are in an HMO in 2014 (64%), similar to each year since 2007.
  • PPOs.  In 2014, nearly one-third (31%) of Medicare Advantage enrollees are in either a local or regional PPO, with significantly higher enrollment in local than regional PPOs. Local PPOs have been authorized since the Balanced Budget Act of 1997 and regional PPOs have been authorized since 2006 under the MMA of 2003. However, enrollment in PPOs of any form has been relatively limited until recent years. Between 2007 and 2014, total PPO enrollment grew from about 500,000 to 4.9 million. A key difference between an HMO and a PPO is that the latter provides enrollees with the flexibility to see providers outside of the plan’s provider network, although cost sharing associated with out-of-network providers typically is substantially higher than for providers in a plan’s network.
    • Local PPOs. Roughly three of four Medicare Advantage PPO enrollees are in a local PPO in 2014 (3.7 of 4.9 million).  Local PPOs, like HMOs, are open to beneficiaries who live in specified counties. Since 2007, enrollment among Medicare beneficiaries in local PPOs has increased from 0.4 million to 3.7 million enrollees, up from 3.1 million in 2013.
    • Regional PPOs. In contrast to the relatively rapid growth of local PPO enrollment, enrollment in regional PPOs has increased more slowly.  In 2014, 1.2 million beneficiaries were enrolled in regional PPOs, up from 1.0 million in 2013 and 0.8 million in 2010. Regional PPOs are required to serve areas defined by one or more states with a uniform benefit package across the service area. The MMA of 2003 authorized the introduction of Regional PPOs to encourage more plans to serve rural areas  Thus far, Regional PPOs have had  limited traction nationwide, although they account for a not insignificant share of the market in a small number of states (Table A1).4 
  • PFFS.  Enrollment in PFFS plans continued to decline in 2014, with only around 300,000 enrollees.  This is one-quarter lower than in 2013, and considerably lower than the high of 2.2 million enrolled in 2009. The decline in enrollment in PFFS plans reflects a deliberate policy change included in the Medicare Improvements for Patients and Providers Act (MIPPA) of 2008 that required PFFS plans (with some county-specific exceptions) to have networks of providers by 2011. Such provider networks, legislators believed, were critical to creating the value sought from the Medicare Advantage program. The MIPPA requirements led to a dramatic decline in the number of PFFS plans offered, some of which were offered by companies that only offered PFFS plans and may not have thought that it was in their business interest to form networks.5   PFFS plans were the primary alternative to HMOs from 2007 through 2009 but their role in the Medicare Advantage market has now been more than eclipsed by that of PPOs.6 
Exhibit 4: Total Medicare Advantage Enrollment, by Plan Type, 2007-2014

Geographic Variation in Trends by Plan Type.   The distribution of Medicare Advantage enrollees, by plan type, varies across states (Table A1). HMOs  account for 90 percent or more of Medicare Advantage enrollment in three states (AZ, CA, and NV),  but less than  one-third of total enrollment in 14 states (AK, GA, IN, KY, MN, MT, ND, NH, SC, SD, VT, WV, and WY) plus the District of Columbia.   In states where HMOs are less dominant, local PPOs are most common, but in  some  states, beneficiaries tend to gravitate toward regional PPOs (SC, SD, VT),  PFFS plans (WY,ND, SD) or cost plans (MN, DC). In Florida, most enrollees are in HMOs, but the state also has the largest number of regional PPO enrollees in the nation (almost 340,000).  In Minnesota, more than 60 percent of private plan enrollees are in what is called a cost plan; Minnesota’s cost plan enrollees accounts for 58 percent of all cost plan enrollees nationwide.  Policies that affect specific plan types will therefore have a differential effect from market to market, and across states.


Issue Brief: Specialized Sectors Of The Market

Group Enrollment.  Most Medicare beneficiaries who enroll in Medicare Advantage plans do so as individuals, but a small share is enrolled through groups. The group market consists largely of employment-sponsored Medicare Advantage plans for retirees.  Employers that offer health benefits to Medicare-eligible retirees have the option to contract with Medicare Advantage plans to provide supplemental benefits.  Under these arrangements, the employer contracts with the Medicare Advantage insurer to provide its retirees  supplemental benefits, and Medicare pays the plan a fixed payment per enrollee to provide Medicare benefits , which is supplemented by an employer plan premium for the additional benefits.7 

In 2014, 3.0 million of the 15.7 million Medicare Advantage enrollees were in a group plan (Exhibit 5 and Table A2). Of this total, 59 percent were enrolled in local PPOs and 37 percent were enrolled in HMOs.  In contrast to the individual market, PPOs account for a larger share of the group market than HMOs. The share of Medicare Advantage enrollees in group plans has never been very large, but the numbers are growing, consistent with trends in the overall Medicare Advantage market. In the recent past, group enrollment in Medicare Advantage has grown proportionately to the growth in the market overall; between 2008 and 2013, the number of group enrollees grew from 1.7 million to 2.5 million, but the relative share in the group market changed little over the time period (17.5% in 2008 versus 17.3% % in 2013).  In the past year, group enrollment increased by 17 percent (0.4 million additional enrollees), rising at a faster rate than the 7.9 percent growth rate in the individual market (0.9million additional enrollees).  Today, group enrollees account for 19 percent of the total Medicare Advantage population.

Exhibit 5: Medicare Advantage Enrollment in the Individual and Group Markets, by Plan Type, 2008-2014

According to the Medicare Payment Advisory Commission (MedPAC), group Medicare Advantage plans typically receive higher Medicare payments and have higher bids, on average, than plans offered in the individual Medicare Advantage market.8   Their analysis shows that the average payment to group Medicare Advantage plans was 109 percent of traditional Medicare spending whereas the average payment to all Medicare Advantage plans was 106 percent of traditional Medicare spending.  MedPAC attributes the differences to incentives for firms in the group market to maximize Medicare revenue to offset employer costs by bidding at the benchmark, whereas firms in the individual Medicare Advantage market have an incentive to bid below the benchmark, in order to receive a rebate (a percent of the difference between the bid and the benchmark) with which they can provide extra benefits to individual plan enrollees. MedPAC has recommended changes in the way payments are made for group plans so that there is greater parity with the individual market.

The influence of employer groups on Medicare Advantage enrollment differs across the country depending on the prevalence of employers offering retiree health benefits, including public and unionized industries.9   States where a substantially larger share of Medicare Advantage enrollees are in group plans include West Virginia (57%), Michigan (49%), Kentucky (42%), Illinois (40%), Ohio (38%), District of Columbia (33%), and New Hampshire (33%).  In other states, group enrollment tends to account for less than one-third of total Medicare Advantage enrollment.

Special Needs Plans. Special Needs Plans (SNPs) restrict enrollment to specific types of beneficiaries with significant or relatively specialized care needs, including beneficiaries: (1) dually eligible for Medicare and Medicaid (D-SNPs); (2) requiring a nursing home or institutional level of care (I-SNPs); or (3) with severe chronic or disabling conditions (C-SNPs.)

The most SNP enrollees are in HMOs (87%), with 10 percent enrolled regional PPOs and 3 percent in local PPOs. As a share of the total Medicare Advantage population (Exhibit 6 and Table A3), enrollment in SNPs is relatively low. The 1.9 million enrollees in such plans in 2014 account for about 12 percent of total Medicare Advantage enrollment.

Exhibit 6: Number of Beneficiaries in Special Needs Plans, by Type, 2006 – 2014

Most SNP enrollees (1.5 million or 82%) are in plans serving those dually eligible for Medicare and Medicaid. Such enrollment varies greatly by state, and enrollment of dually eligible beneficiaries in SNPs is particularly prevalent in four states: Hawaii (62%), Arizona (44%), Utah (35%), and Minnesota (30%).

Separately, several states (including CA, MA, MN, NY, IL, OH, SC, VA, and WA) are undertaking demonstrations with CMS to improve the financial alignment of Medicare and Medicaid for dually eligible beneficiaries.  In many states, SNPs may continue to operate separately from the demonstration, and dually eligible beneficiaries enrolled in these SNPs can remain in them.  It is not clear how the demonstration will affect the growth in D-SNP enrollment over time in these states.


Issue Brief: Premiums

Medicare Advantage enrollees are responsible for paying the Part B premium, in addition to any premium charged by the plan. The Medicare Advantage premium paid by enrollees reflects the difference between the plan’s costs of providing Part A and B benefits and any supplemental benefits offered, and the federal payment to the plan for the benefits.  Plans receive a percentage of the difference between their bid and the maximum federal payment (known as a rebate) and are required to use this amount to offset any extra benefits not offered by traditional Medicare, any reduced cost sharing, or the Part B premium. If Part D is part of the plan, as it is for most enrollees, the plan may also use the rebate to reduce the Part D premium.

In this brief, we analyze premiums for Medicare Advantage plans that offer prescription drug benefits (MA-PDs) because the vast majority (88%) of Medicare Advantage enrollees in individual plans is in an MA-PD.

Average Premium Trends. The average enrollee in an MA-PD paid a monthly premium of about $35 in 2014, reflecting little change since 2012, and a reduction in average premiums since 2011 ($38)  and 2010 ($43) (Exhibit 7). It is important to note, however, that the actual premium an enrollee pays varies by plan type and locale, as well as by decisions and preferences of enrollees, such as whether they are willing to pay more for a broader network or more generous benefits. Average premiums and trends in premiums paid by enrollees vary across plan types.  Enrollee premiums in 2014 averaged $27 per month for HMOs, $32 per month for regional PPOs, $59 per month for local PPOs, and $63 per month for PFFS plans.  Compared to 2013, the average HMO premium was unchanged whereas average premiums for local PPOs, regional PPOs, and PFFS plans increased by an average by $1, $3, and $11 per month, respectively.  In 2014, enrollees are generally paying lower premiums in 2014 than in 2010, mainly due to the reduction in average HMO and local PPO premiums over that period and most enrollees are in HMOs and local PPOs in 2014.

Exhibit 7: Weighted Average Monthly Premiums for Medicare Advantage Prescription Drug Plans, Total and by Plan Type, 2010-2014

In the fall of 2013, we calculated that beneficiaries who were enrolled in Medicare Advantage plans at that time would pay a premium of $39 per month in 2014, compared to $35 per month in 2013, which assumed they remained in the same plan.10  Among Medicare Advantage enrollees in 2014, the average premium actually paid by enrollees ($35 per month) is similar to that in 2014. The difference in estimates reflects both changes in beneficiaries enrolled in Medicare Advantage from 2013 to 2014 and shifts by enrollees among plans and plan types.

Zero Premium Plans.  As in prior years, most Medicare beneficiaries (84%) had a choice of at least one MA-PD that charged no additional premium for coverage, other than the monthly Part B premium, also known as “zero premium plans”.  Many plans view such products as good ways of attracting enrollees into Medicare Advantage since they often provide more benefits than traditional Medicare and “one stop shopping” that avoids separate decisions about Part D and supplemental coverage through various Medigap options.

In 2014, 56 percent of all Medicare Advantage plan enrollees were in zero premium MA-PDs (Exhibit 8).  A larger than average share of enrollees in HMOs were enrolled in zero-premium plans (66%) while  a much smaller than average share of PFFS enrollees were enrolled in such plans (17%).  A substantially smaller share of local PPO enrollees than regional PPO enrollees were covered by a zero-premium plan (25% versus 54%).   Further analysis is needed to assess the relationship between zero-premium plans and benefit design, and factors that motivate employers to offer zero premium products in some situations and not others.11 

Exhibit 8: Share of Enrollees in Medicare Advantage Prescription Drug Plans with Zero Premium, Total and by Plan Type, 2014


Issue Brief: Benefits

OUT OF POCKET LIMITS AND DONUT HOLE COVERAGE

In addition to analyzing premiums, we examined variations across plans and trends with respect to two types of benefits: the limit on out-of-pocket costs set by the plan and the availability of expanded Part D benefits relating to the coverage gap or “donut” hole.

Out-0f-Pocket Limits.  Although traditional Medicare does not include an annual out of pocket limit on cost sharing for Medicare A and B benefits, CMS began requiring in 2011 that all Medicare Advantage plans have a limit below $6,700 annually and recommended a limit of $3,400 or lower.  Since 2011, the share of beneficiaries in plans with limits below $3,400 has declined from 51 percent in 2011 to 33 percent in 2014 (Exhibit 9).  During this time period, the share of enrollees in plans with limits above $5,000 almost doubled, from 24 percent in 2011 to 44 percent in 2014.

Exhibit 9: Medicare Advantage Enrollees’ Out of Pocket Limits, 2011-2014

Historically, HMOs have had the lowest average out of pocket limit and regional PPOs have had the highest average out of pocket limit (Exhibit 10). While this remains the case in 2014, limits have risen considerably across plans of all types.  Virtually all regional PPO enrollees (98%), 43 percent of local PPO enrollees, and 38 percent of HMO enrollees are in a plan with a limit over $5,000 annually. While limits define ultimate financial liability rather than the amount an enrollee pays, limits are important and also valuable in communicating to beneficiaries their potential maximum liability, at least for in-network Medicare-covered benefits, in the plan.

Exhibit 10: Medicare Advantage Enrollees’ Out-of-Pocket Limits, by Plan Type, 2011-2014

Coverage in the Part D Donut Hole.  The standard Medicare Part D benefit in 2013 has a $310 deductible and 25 percent coinsurance up to an initial coverage limit of $2,850 in total drug costs, followed by a coverage gap (the so-called “donut hole”), until their total out of pocket Part D spending reaches $4,550 when the catastrophic limit kicks in and beneficiaries pay 5 percent of specified limits for drugs. The ACA gradually reduces the coverage gap until it is eliminated in 2020. In 2014, enrollees in plans with no additional gap coverage will pay 47.5 percent of the total costs of brands and 72 percent of the total cost of generics in the gap until they reach the catastrophic limit.

Covering a larger share of beneficiaries’ out-of-pocket costs in the “coverage gap” is one way Medicare Advantage plans can enhance benefits. In 2014, about half (49%) of all Medicare Advantage enrollees were in plans that offered no additional coverage in the gap (Exhibit 11). Twenty two percent were in plans with some additional coverage for generics and 27 percent with some additional coverage for both some generics and brand name drugs. A relatively small share of enrollees in regional PPOs had any additional gap coverage (30%) compared to enrollees in HMOs (57%).  Most stand-alone Part D plans provide little or no gap coverage in 2014 beyond what is required under the standard benefit.12 

Exhibit 11: Enrollment in Medicare Advantage Prescription Drug Plans, by Coverage in the Gap and Plan Type, 2014


Issue Brief: Firms And Market Structure

Enrollment by Firm.  As in prior years, Medicare Advantage enrollment in 2014 tends to be highly concentrated among a small number of firms (Exhibit 12 and Table A4).  In 2014, six firms or affiliates accounted for 72 percent of the market: United Healthcare (20%), Humana (17%), Blue Cross Blue Shield (BCBS) affiliated plans (17%), Kaiser Permanente (8%), Aetna (7%), and Cigna (3%).  Another 6 national firms account for 5 percent of the market, including Wellcare, HealthNet, Universal American, Munich American Holding Corporation, and Wellpoint not affiliated with BCBS.  The remaining enrollees are in plans offered by more locally or regionally focused firms.

Exhibit 12: Medicare Advantage Enrollment, by Firm or Affiliate, 2014

Firms differ in how they position themselves in the market, including the plan types they offer. As has been the case historically, almost all of Kaiser Permanente’s enrollees (94%) are in HMOs and the remainder are in similarly structured cost plans (Exhibit 13).  In contrast, United Healthcare’s enrollment is in HMOs, local PPOs, regional PPOs, and PFFS plans, in proportions that are similar with the nationwide enrollment distribution. Compared to United Healthcare, Humana and BCBS affiliated plans have a smaller share of their enrollment in HMOs (45% for each versus 62% for United Healthcare). Humana’s distribution of enrollment across plan types continues the shift from earlier years when a much larger share of Humana’s enrollees were in PFFS plans.

Exhibit 13: Distribution of Medicare Advantage Enrollees in the Firms and Affiliates with the Highest Enrollment, by Plan Type, 2014

Each of the large national firms in the Medicare Advantage market now has a sizeable share of enrollees from group accounts. Enrollment in group plans now represents 47 percent of enrollment in Aetna, 39 percent of enrollment in Kaiser Permanente, 23 percent of enrollment in BCBS affiliated plans, 17 percent of enrollment in Humana, and 14 percent of enrollment in United Healthcare (Table A4).

Between 2013 and 2014, some firms appear to have grown their group enrollment particularly rapidly, suggesting that they had a change in employers contracting with them.  Growth in the group market accounts for all of the net growth in United Healthcare’s enrollment over the past year.  Wellpoint BCBS’s total Medicare Advantage enrollment would have declined in the absence of a large increase in group enrollment (from roughly 28,000 to 120,000). In contrast, enrollment in Kaiser Permanente’s individual plans grew more rapidly than its group enrollment.13   Most of the growth in Medicare Advantage enrollment is in the individual market, but enrollment through group plans increased particularly rapidly in 2014 and has been a major factor in the experience of some firms.

Market Concentration by State.   As is the case nationally, a small number of firms also dominate Medicare Advantage enrollment in most states (Exhibit 14).  In all but one state (NY), the three largest firms or affiliates account for 50 percent or more of enrollment.  In 20 states and the District of Columbia, 90 percent of enrollment or more is in the three largest plans and in 18 states, 75 percent of enrollment is in the three largest plans. Some states with highly concentrated markets (three firms accounting for at least 90 percent of enrollment) have relatively low Medicare Advantage penetration rates (AK, DE, KS, MS, MT, ND, NE, SD, VT, WY), but several other such states do not (LA, NC, NV, RI).

Exhibit 14: Combined Market Share of the Three Firms or Affiliates with the Largest Number of Medicare Advantage Enrollees in Each State, 2014

In 15 states and the District of Columbia, one company has more than half of total Medicare Advantage enrollment (Table A5). United Healthcare has the largest share in 19 states and is among the top three firms in an additional 19 states and the District of Columbia. Humana has the largest enrollment in 11 states and is among the top 3 in another 18 states. Plans offered by BCBS affiliates have the most enrollees in 8 states and are among the top firms in another 16 states. Kaiser Permanente’s presence is more geographically focused than other major national firms, with a heavy concentration in California, Colorado, the District of Columbia and Maryland. Kaiser Permanente has more enrollees than any other firm in California, the District of Columbia and Maryland. Locally dominant plans, that is, those with the most Medicare Advantage enrollees in their state include EmblemHealth (CT), Martin’s Point Health are (ME), Tufts Associated HMO (MA), New West (MT), Presbyterian Healthcare Services (NM), and Medica Holding Company (ND and SD).

Enrollment Across Counties with High and Low Traditional Medicare Spending.  Over the years, Congress and various Administrations have made a number of changes to payment and participation rules for private risk-bearing plans that provide Medicare benefits under contract with the federal government, now called Medicare Advantage plans.  Many of these changes have revolved around plan payment levels, seeking to balance having more plans participate with parity in payments between traditional Medicare and Medicare Advantage. The latest of these changes, which is included in the ACA, varies payment policy with the level of traditional Medicare spending in counties, grouped evenly into four quartiles by cost.  Payments to plans now depend on the relationship between their bids and the counties’ traditional Medicare spending and also are increased by any quality based bonus payments the plan may receive.  After being frozen in 2011 at 2010 levels, benchmarks (the maximum Medicare will pay a plan) are being adjusted down so that once payments are fully phased in they will range from 95 percent of traditional Medicare spending for counties in the top quartile of spending (e.g., Miami-Dade, FL) to 115 percent of traditional Medicare spending in the bottom quartile of such spending (e.g., Boise, ID).

Despite the payment changes, enrollment continues to grow across counties in each of the four quartiles of traditional Medicare spending (Table A6). Between 2013 and 2014, enrollment grew at a relatively similar rate in aggregate across in highest quartile counties (8.3%) as in the lowest quartile counties (8.7%), and higher, but not very much differently, in the two quartiles in between (10.7% and 12.3%, respectively).  In 2014, overall penetration also was not very different across quartiles (ranging from 27% to 34%). Thus, enrollment continues to grow across counties that differ in traditional Medicare spending, which is not surprising given that Medicare Advantage penetration rates have historically been high in several low cost counties (e.g., Multnomah, OR and Boise, ID) as well as high cost counties (Miami-Dade, FL and Los Angeles, CA).


Discussion

Medicare Advantage enrollment continues to grow despite concerns that payment rate changes incorporated in the ACA will lead to a drop in enrollment, and a significant reduction in benefits.  Enrollment trends suggest that Medicare Advantage remains an attractive option for a growing number of beneficiaries. Despite some turnover in the composition of available plans, beneficiaries continue to have many choices and the share of beneficiaries enrolled in Medicare Advantage continues to grow in virtually all states, suggesting that the market currently has sufficient choice to attract enrollees.  Our analysis also shows that premiums paid by enrollees have remained fairly flat, with the average premium ($35 per month) the same as it was in 2012 and 2013.

Looking to the future, it is not clear if or how plans will modify their offerings, nor what the effect will be for beneficiaries.  Thus far, there hasn’t been much of a change in the Medicare Advantage market, other than the increase in out-of-pocket limits and reports in the media that some insurers have scaled back provider networks.  As payment reductions continue to be phased in, insurers may reduce the extra benefits they now offer, though they will still be required to provide benefits that are at least equivalent to those that are offered under traditional Medicare, in conjunction with a limit on out-of-pocket spending.  Insurers will need to balance their interest in maintaining market share (and remain attractive to beneficiaries) against their ongoing interest in operating as profitably as possible.

Ultimately the form of both the overall Medicare program and Medicare Advantage will be shaped by the policy and fiscal climate. There are very different perspectives on the kinds of protections Medicare needs to provide for seniors and younger enrollees with disabilities, the appropriate level of Medicare spending and how to finance it, and how Medicare benefits should be provided.  This larger context, and its relevance to the long term stability of the Medicare program, warrants explicit consideration as part of the debate on Medicare Advantage payment.

Marsha Gold is a Senior Fellow Emeritus with Mathematica Policy Research;Gretchen Jacobson and Tricia Neuman are with the Kaiser Family Foundation;Anthony Damico is an independent consultant.

Endnotes

  1. G. Jacobson, T. Neuman, and J. Huang, “Projecting Medicare Advantage Enrollment: Expect the Unexpected?” Kaiser Family Foundation, June 2013.  Also see Alliance for Health Reform briefing, “The Future of Medicare Advantage: Are We on the Right Path?” June 2013; available at https://modern.kff.org/medicare/event/june-10-briefing-the-future-of-medicare-advantage-are-we-on-the-right-path/ ↩︎
  2. Statistics include cost and demonstration plans even though they are organized under separate authority from Medicare Advantage. Enrollment includes those in Special Needs Plans, as well as regular Medicare Advantage plans and includes those enrolled individual plans and group plans. The analysis is based on publicly available CMS data from the contract/plan/state/county enrollment file. This file excludes enrollment in counties with fewer than 11 people in a plan in a county. County-plan records without a valid FIPS county identifier were also excluded from the analysis. These small exclusions add up to about 242,640 beneficiaries or 1.5 percent of total Medicare Advantage enrollment in March 2014. ↩︎
  3. M. Gold, G. Jacobson, A. Damico, and T. Neuman. u201cMedicare Advantage 2014 Data Spotlight: Plan Availability and Premiums,u201d Washington DC: Henry J. Kaiser Family Foundation, December 2013. ↩︎
  4. M. Gold u201cMedicareu2019s Private Plans: A Report Card on Medicare Advantage,u201d Health Affairs Web Exclusive, November 24, 2008. ↩︎
  5. u00a0 For more information on PFFS plans, see M. Gold, G. Jacobson, A. Damico, and T. Neuman. u201cMedicare Advantage 2011 Data Spotlight: Plan Availability and Premiums,u201d Washington DC: Henry J. Kaiser Family Foundation, October 2010.u00a0 J. Blum, R. Brown and M. Frieder u201cAn Examination of Medicare Private Fee For Service Plans, Washington DC: Kaiser Family Foundation, March 2007. ↩︎
  6. M. Gold, u201cMedicare Advantage in 2008.u201d (Table 1: PFFS Contracts by Firm and Number of Counties Covered by the Contract, 2006-2008), Kaiser Family Foundation, June 2008. ↩︎
  7. F. McArdle, T. Neuman and J. Huang.u00a0 u201cRetiree Health Benefits at the Crossroadsu201d.u00a0 Washington DC:u00a0 Henry J. Kaiser Family Foundation, April 2014. ↩︎
  8. u00a0 Medicare Payment Advisory Commission u201cChapter 13. The Medicare Advantage Program: Status Reportu201d in Report to Congress: Medicare Payment Policy, Washington DC, March 2014. pp 323-349. ↩︎
  9. Kaiser Family Foundation and Health Research and Education Trust, u201cSection 11. Retiree Health Benefits.u201d Employer Health Benefits: 2013 Annual Survey. Washington, DC: Kaiser Family Foundation, 2013, pp. 191-199; and P. Fronstein and N. Adams. u201cEmployment Based Retiree Health Benefits: Trends in Access and Coverage: 1997-2010.u201d EBRI Education and Research Institute, 2012. ↩︎
  10. M. Gold, G. Jacobson, A. Damico, and T. Neuman. u201cMedicare Advantage 2014 Data Spotlight: Plan Availability and Premiumsu201d Washington DC: Henry J. Kaiser Family Foundation, December 2013. ↩︎
  11. M. Gold and M. Hudson (2013, op site) and M. Gold, M. Hudson, G. Jacobson and T. Neuman u201c2010 Data Spotlight: Benefits and Cost Sharingu201d Washington DC: Henry J. Kaiser Family Foundation, February 2010. ↩︎
  12. Kaiser Family Foundation. u201cThe Medicare Part D Prescription Drug Benefitu201d Fact Sheet. Washington DC, November 2013. ↩︎
  13. M. Gold, u201cMedicare Advantage in 2008.u201d Kaiser Family Foundation, June 2008. ↩︎