Poll Finding

Kaiser Health Tracking Poll: June 2014

Authors: Liz Hamel, Jamie Firth, and Mollyann Brodie
Published: Jul 1, 2014

As many employers begin to expand their wellness program offerings under new guidelines set forth by the Affordable Care Act (ACA), the latest Kaiser Health Tracking Poll finds that while the public is amenable to the idea of wellness programs in general, they do not think it’s appropriate for employers to charge workers higher health insurance premiums if they don’t participate in these programs. Further, an even larger share of the public is opposed to the idea of employers tying workers’ health insurance premiums to their ability to meet certain health goals. About half of working-age people with employer-provided health insurance say their employer offers some type of wellness program, and most of those who are offered (three in ten of all those with employer coverage) say they participate.

Public opinion on the ACA overall holds steady this month, with 39 percent of the public having a favorable view and 45 percent an unfavorable one. Compared with earlier polls, somewhat fewer now say their impression of the law is based mostly on what they’ve heard in the media, while more say they are basing their opinion on their own experience or that of their family and friends. A majority continues to say the law hasn’t had much impact to date for their own families, and four in ten say they don’t have enough information to understand how the law will impact them. Among those who are currently uninsured, the share who feel they don’t have enough information rises to six in ten.

Most Say It’s Appropriate For Employers To Offer Wellness Programs, But Not To Tie Premiums To Participation Or Health Outcomes

The ACA builds on existing policies to encourage employers to begin offering wellness programs to their workers or expand their existing programs. Guidelines released jointly by the Departments of Health and Human Services, Labor and Treasury1  include rules for both “participatory” wellness programs, which may provide financial incentives for employees to engage in healthy behavior but are not tied to an individual’s health status, as well as “health-contingent” or “outcome-based” wellness programs, which require individuals to meet specific health goals in order to obtain a financial reward. The latest Kaiser Health Tracking Poll finds that while the large majority (76 percent) of the public thinks it is appropriate for employers to offer wellness programs that promote healthy behaviors, most (62 percent) believe it is not appropriate for employers to require workers to pay more for their health insurance premiums if they don’t participate. On the question of outcome-based programs, an even larger share (74 percent) say it is not appropriate for employers to charge workers higher premiums if they are unable to meet certain health goals. Opinions are similar among those who get their health insurance from an employer; 80 percent say it is appropriate for employers to offer participatory wellness programs, but majorities say it is not appropriate for them to charge workers higher premiums if they don’t participate (62 percent) or if they are unable to meet certain health goals (75 percent).
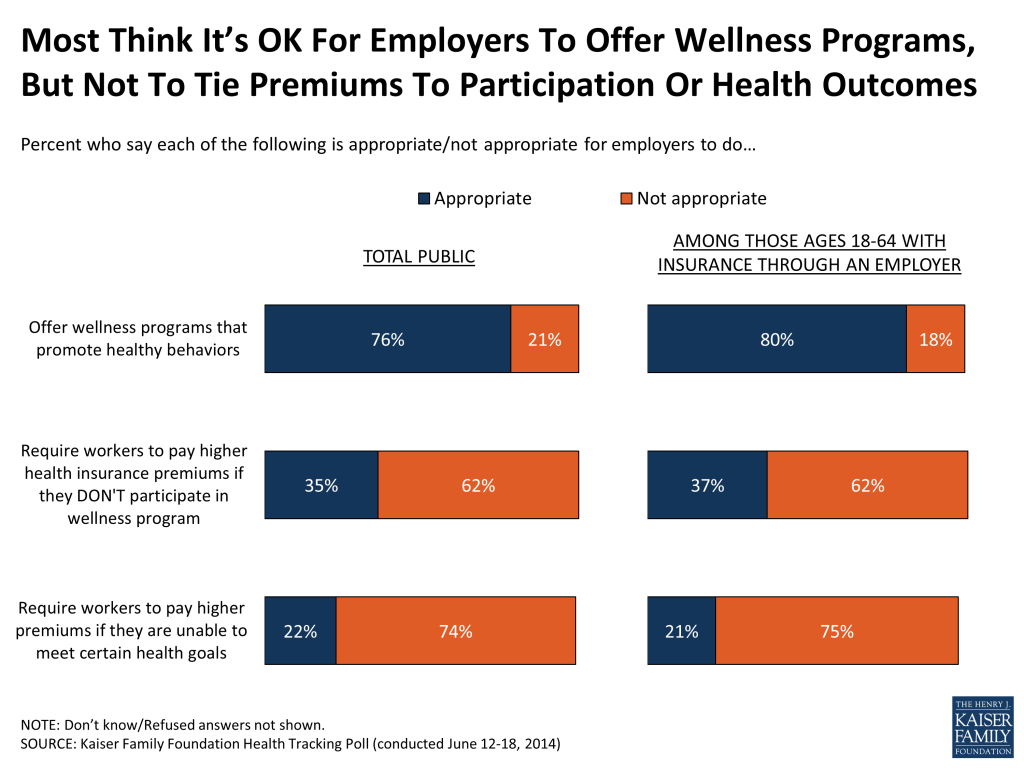
Figure 1

The survey also tested whether arguments for and against outcome-based wellness programs have an impact on the public’s view, and found that responses were similar with and without arguments. After hearing both an argument in favor of these programs (“workers who are unhealthy drive up health care costs and are more likely to be absent from work”) and against them (“it is an invasion of worker’s privacy and may unfairly penalize some people who are unable to meet health goals”), seven in ten (70 percent) say it is not appropriate for employers to have these types of programs, including 75 percent of those with employer-sponsored coverage.
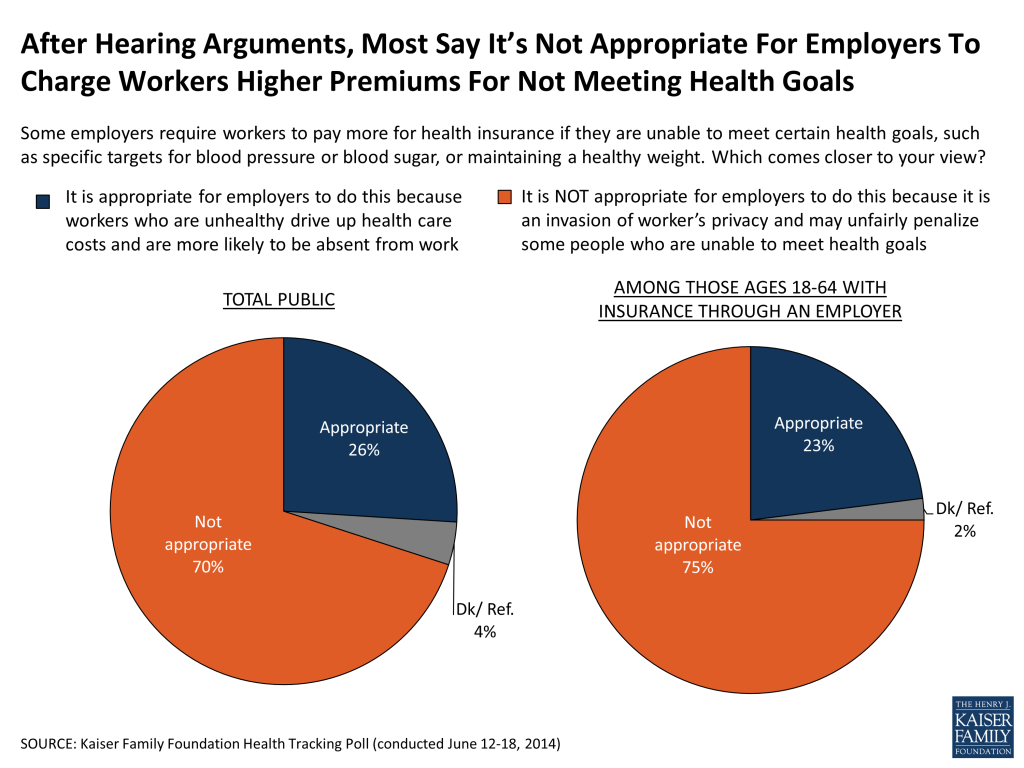
Figure 2

Among working-age adults who get their insurance through an employer, about half (48 percent) say their employer offers some type of wellness program, including 27 percent who say their employer offers a participatory program, 2 percent who say their employer offers an outcome-based program, and 16 percent who say they offer both types of programs.2  Among the 48 percent who say their employer offers either type of program, just over six in ten (63 percent, or 30 percent of all those ages 18-64 with employer coverage) say they participate. Reported participation rates are somewhat higher among women than men (73 percent versus 54 percent among those whose employer offers a program).
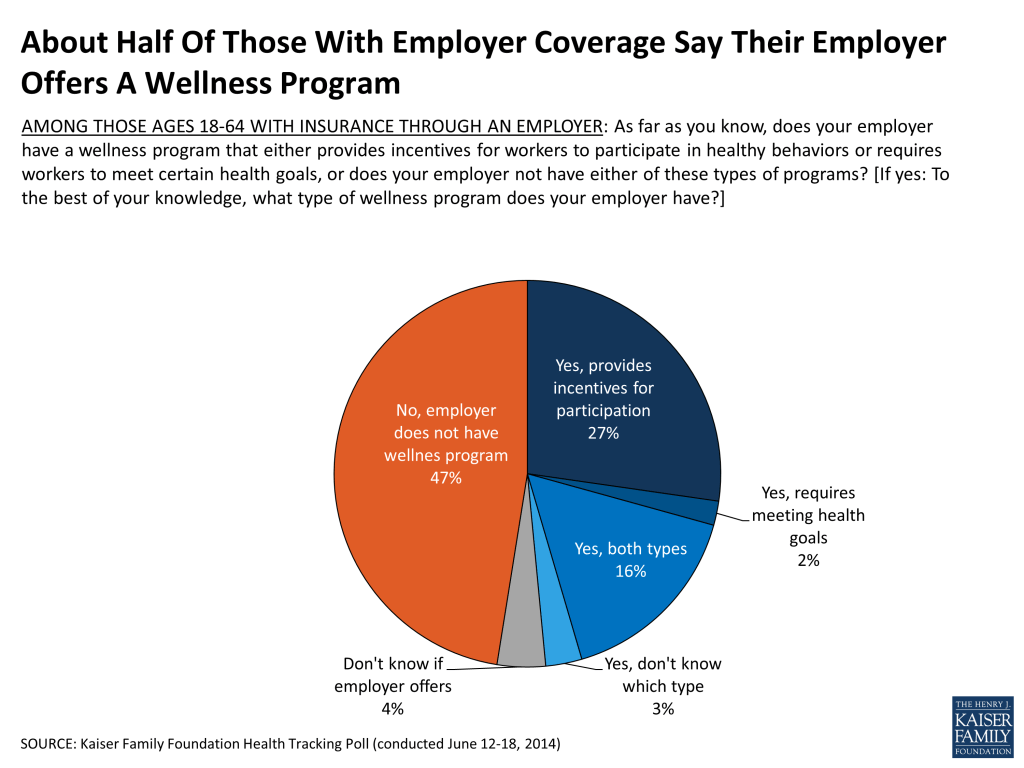
Figure 3

Public Opinion On ACA Holds Steady

Overall public opinion of the ACA remains about the same as it has for the last several months, with a somewhat higher share expressing an unfavorable view of the law (45 percent) than a favorable one (39 percent). Views continue to be polarized by political party, with a large majority of Democrats having a favorable view (66 percent), a large majority of Republicans unfavorable (74 percent), and independents somewhere in the middle but more negative than positive (31 percent favorable, 53 percent unfavorable).
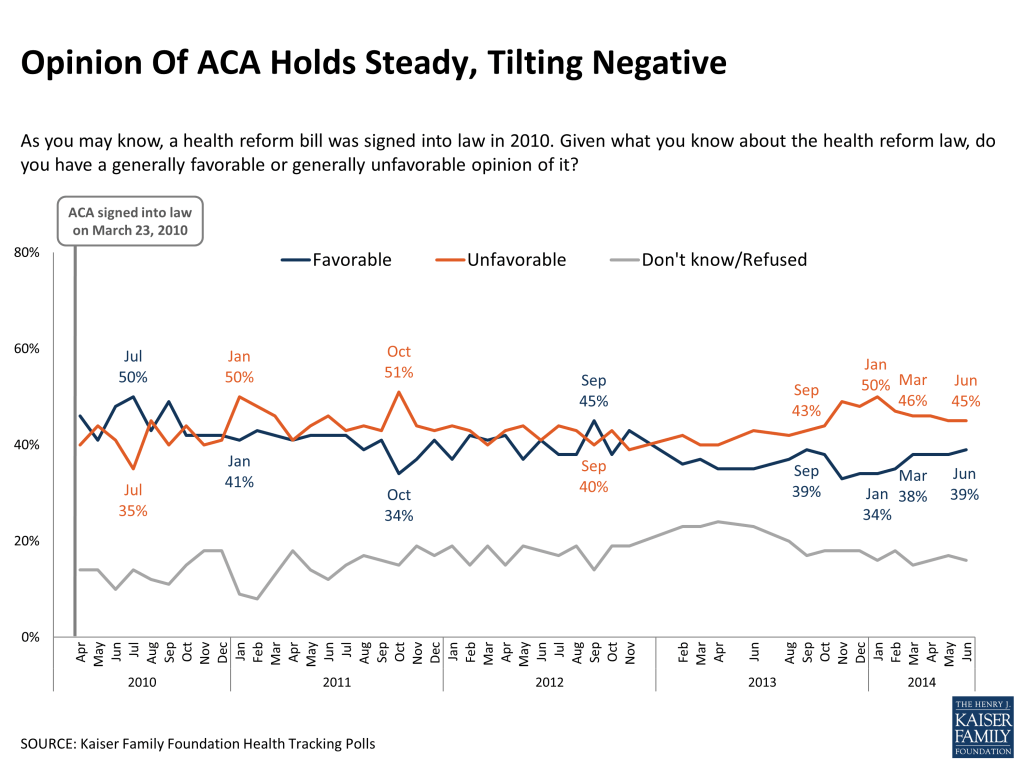
Figure 4

A plurality of the public (37 percent) says their impression of the law is based mainly on what they’ve seen and heard on television, radio, and newspapers, though this share has declined somewhat from earlier tracking polls in February 2014 and February 2013, when more than four in ten said their impression was based mostly on the media. There has also been a corresponding increase in the share who say their impression is based mainly on their own experience (26 percent this month) or what they’ve learned from friends and family (22 percent). For the first time in Kaiser tracking, the combined share basing their impression on their own experience or that of family and friends (48 percent) is larger than the share who report basing their view mostly on the media (37 percent). At least two possible factors may be playing a part in this change over time. As implementation proceeds, more people may be having direct experience with the law themselves or through their loved ones. It’s also possible that as coverage of the law has been out of the media spotlight for the last few months, fewer people are hearing about it in the news, resulting in a declining share who report taking cues from the media.

Figure 5

The survey also finds that while a majority (53 percent) say the law hasn’t made much difference for their own families, this share has declined from 62 percent in January, perhaps another indication that more people are starting to see the law having a direct or indirect impact on them and their families. The share who feel the law has left their family better off increased from 12 percent in January to 18 percent this month, but remains smaller than the 26 percent who say the law has left their families worse off. Similarly, when asked how they feel the law is impacting the country as a whole, a third say the country is better off – up 6 percentage points since January, but still trailing behind the 40 percent who feel the country is worse off as a result of the law.
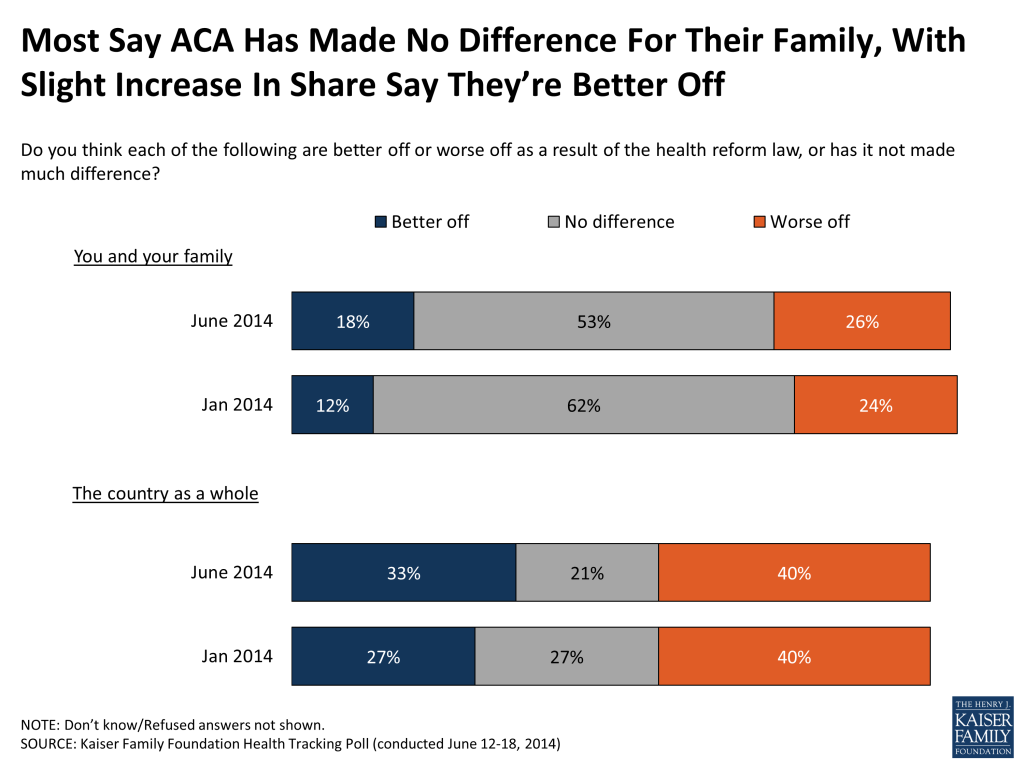
Figure 6

A large portion of the public remains unclear on the law’s personal impact. Overall, four in ten (40 percent) say they don’t have enough information to know how the law will impact them and their family, rising to 62 percent among those who are uninsured.

When it comes to the impact of the law on different groups, the public is most likely to believe the uninsured are better off under the ACA (43 percent), while the perceived impact on those with private health coverage is more mixed. The public is somewhat more likely to perceive a negative rather than a positive impact on people who get coverage through an employer, with 31 percent saying this group is worse off, 26 percent saying they’re better off, and about a third (35 percent) saying the law hasn’t made much difference for them. When asked about people who buy their own health insurance, a somewhat higher share of the public says this group is worse off rather than better (37 percent versus 31 percent), while one in five (20 percent) say it hasn’t made much difference. A recent Kaiser Family Foundation survey of people who purchase their own coverage found a somewhat more positive assessment among this group: 34 percent said they had benefited under the ACA, while 29 percent said they had been negatively impacted.3 
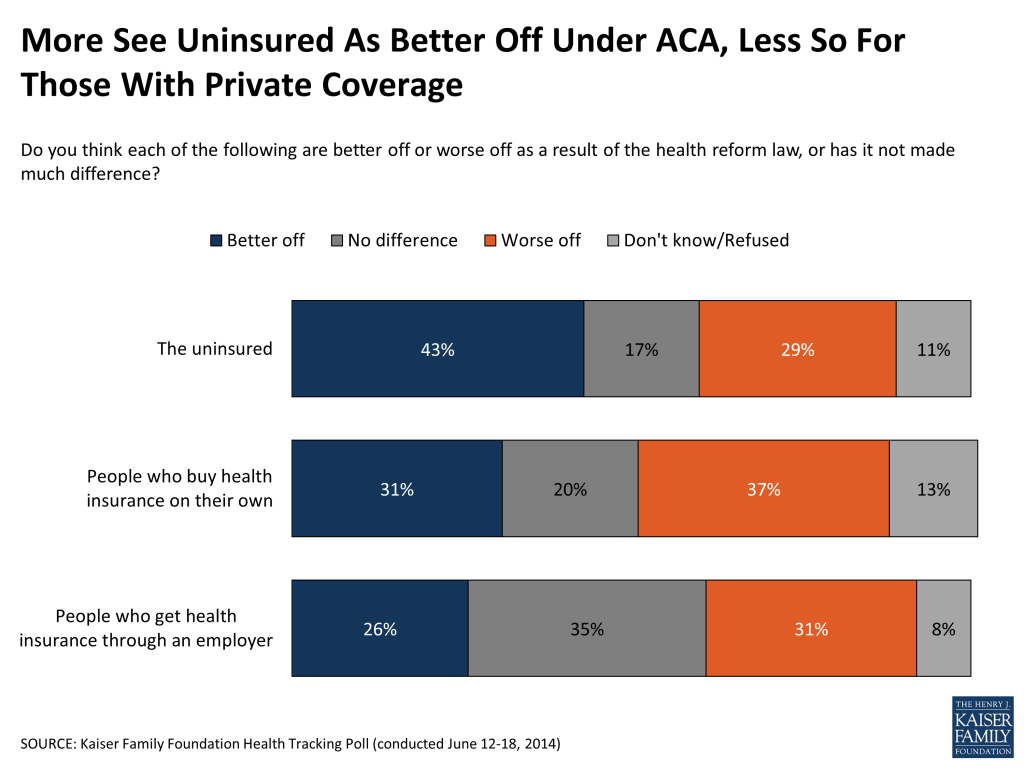
Figure 7

This Kaiser Health Tracking Poll was designed and analyzed by public opinion researchers at the Kaiser Family Foundation (KFF). The survey was conducted June 12-18, 2014, among a nationally representative random digit dial telephone sample of 1,202 adults ages 18 and older, living in the United States, including Alaska and Hawaii (note: persons without a telephone could not be included in the random selection process). Computer-assisted telephone interviews conducted by landline (601) and cell phone (601, including 347 who had no landline telephone) were carried out in English and Spanish by Princeton Data Source under the direction of Princeton Survey Research Associates International (PSRAI). Both the random digit dial landline and cell phone samples were provided by Survey Sampling International, LLC. For the landline sample, respondents were selected by asking for the youngest adult male or female currently at home based on a random rotation. If no one of that gender was available, interviewers asked to speak with the youngest adult of the opposite gender. For the cell phone sample, interviews were conducted with the person who answered the phone. KFF paid for all costs associated with the survey.

The combined landline and cell phone sample was weighted to balance the sample demographics to match estimates for the national population using data from the Census Bureau’s 2012 American Community Survey (ACS) on sex, age, education, race, Hispanic origin, nativity (for Hispanics only), and region along with data from the 2010 Census on population density. The sample was also weighted to match current patterns of telephone use using data from the January-June 2013 National Health Interview Survey. The weight takes into account the fact that respondents with both a landline and cell phone have a higher probability of selection in the combined sample and also adjusts for the household size for the landline sample. All statistical tests of significance account for the effect of weighting.

The margin of sampling error including the design effect for the full sample is plus or minus 3 percentage points. Numbers of respondents and margin of sampling error for key subgroups are shown in the table below. For results based on other subgroups, the margin of sampling error may be higher. Sample sizes and margin of sampling errors for other subgroups are available by request. Note that sampling error is only one of many potential sources of error in this or any other public opinion poll.

GroupN (unweighted)M.O.S.E.
Total1,202±3 percentage points
Those ages 18-64 with employer-sponsored insurance476±5 percentage points
Military household471±5 percentage points
Non-military household731±4 percentage points


Endnotes

  1. http://www.dol.gov/ebsa/newsroom/fswellnessprogram.html  ↩︎
  2. According to the Kaiser/HRET 2013 Survey of Employer-Sponsored Health Benefits, 77 percent of firms that offer health insurance also offer some type of wellness program, but just 10 percent of these offer financial incentives to workers who participate. The survey question asked people specifically about programs that provide financial incentives, but it’s possible that some respondents answered this question based on the fact that their employer offers some type of wellness program, regardless of financial incentives. The ACA encourages employers to increase their use of incentives in wellness programs beginning in 2014, so it’s also possible that the share of firms offering these types of incentives has increased since the 2013 employer survey.  ↩︎
  3. https://modern.kff.org/private-insurance/report/survey-of-non-group-health-insurance-enrollees/  ↩︎
Poll Finding

Kaiser Health Policy News Index: June 2014

Authors: Jamie Firth, Liz Hamel, and Mollyann Brodie
Published: Jul 1, 2014

The Kaiser Health Policy News Index is designed to help journalists and policymakers understand which health policy-related news stories Americans are paying attention to, and what the public understands about health policy issues covered in the news. This month, over six in ten (62 percent) report following news coverage of long waiting lists for those seeking medical care at some Veterans Affairs (VA) medical facilities “very” or “fairly closely,” making this the most closely-followed health policy story so far this year. Most of the public sees the reports of long wait-times at VA facilities as a sign of widespread problems throughout the VA system, and most of those living in military households believe the health care veterans get at the VA is worse than the care they would get from private doctors and hospitals. Other health–related news stories were followed by smaller shares of the public this month, with just over a third following the decision by some states to switch from a state-run marketplace to the federal marketplace, and about a quarter following the release of 2015 health insurance premium rates and the Senate confirmation of Sylvia Burwell as Secretary of Health and Human Services.

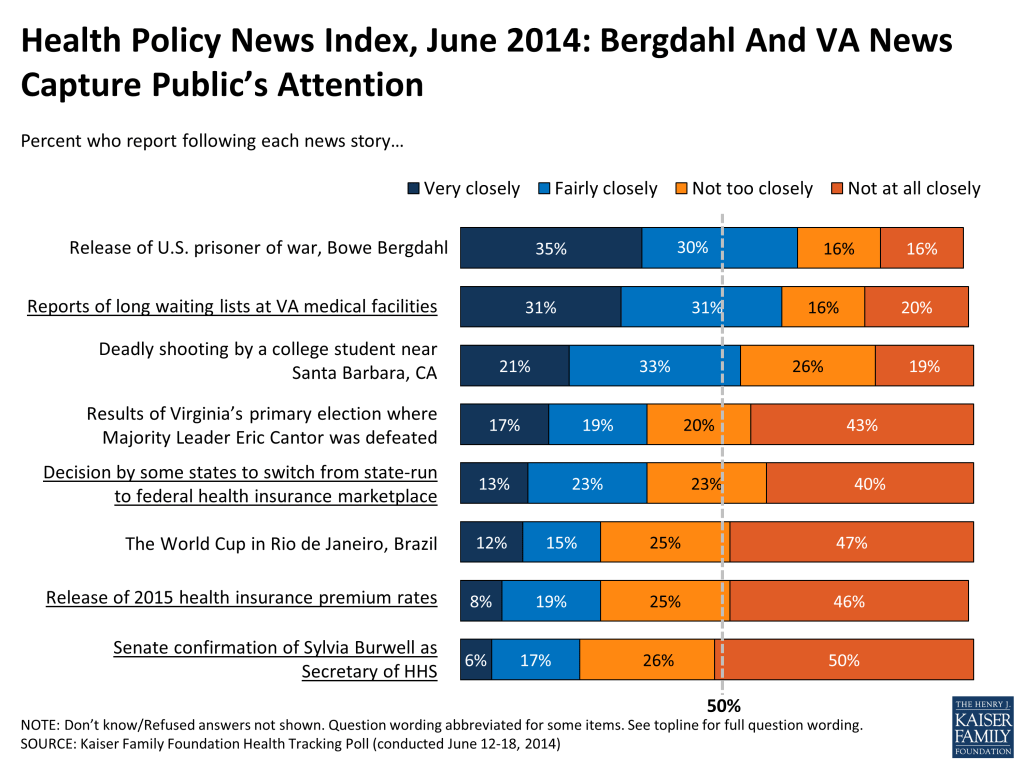
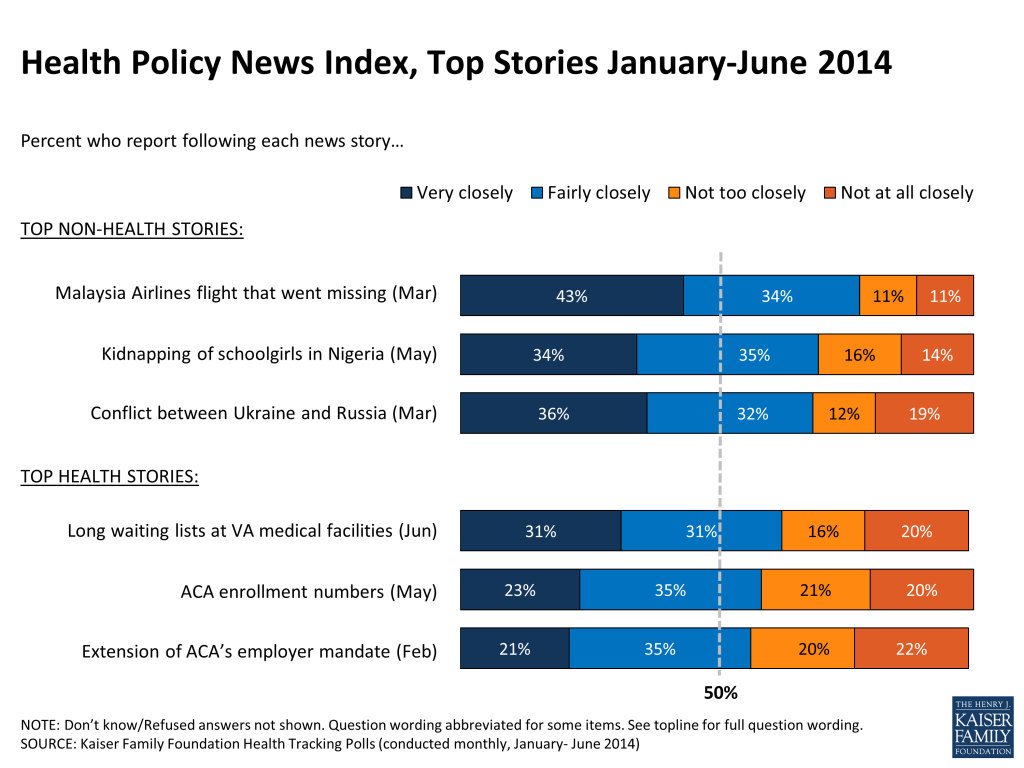
Reports about long waiting times for those seeking care at some Veterans Affairs (VA) medical facilities captured a significant share of the public’s attention this month.  Over six in ten (62 percent) report following the story “very” or “fairly” closely, making it the most closely followed health policy story so far in 2014. Just behind this, two stories about the ACA earlier this year were followed by over half of Americans, including coverage in May about how many people enrolled in health insurance options under the ACA (58 percent) and the announcement in February that some employers would have an extra year to comply with the ACA’s employer mandate (56 percent). Over the past six months, larger shares of the public reported following non-health stories, such as news about the missing Malaysia Airlines flight in March (77 percent), the May news about the kidnapping of schoolgirls in Nigeria (69 percent) and the March coverage of the conflict between Ukraine and Russia (68 percent).

Figure 1

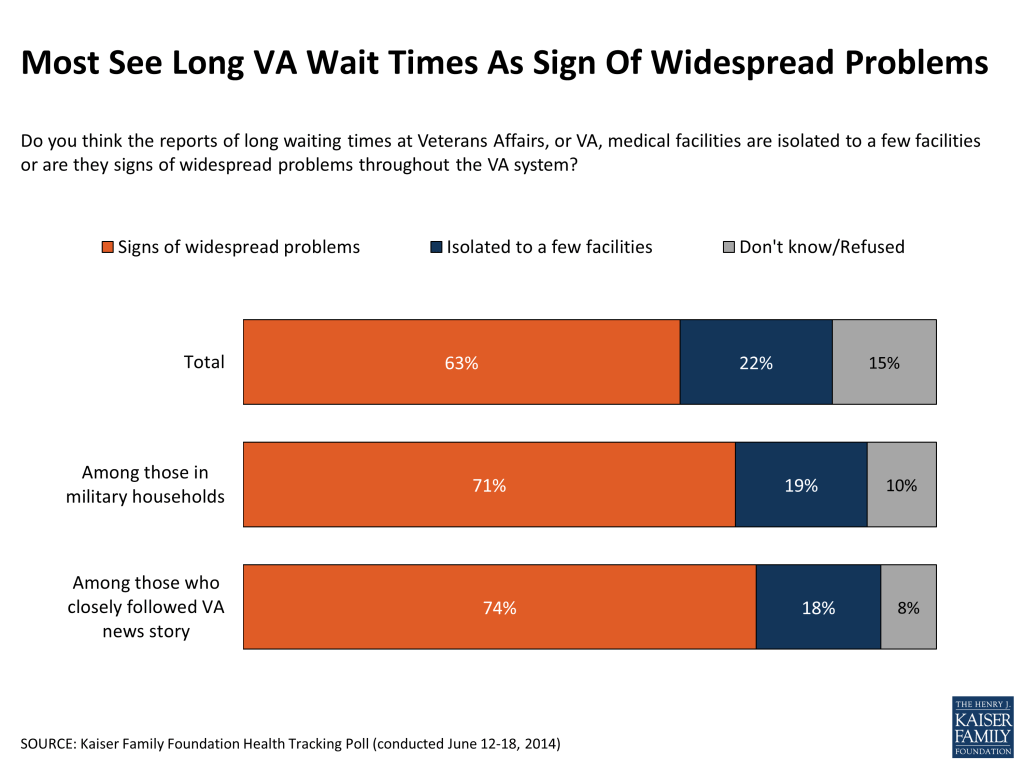
When asked about the reports of long waiting lists at some VA medical facilities, a majority of the public (63 percent) thinks they are signs of widespread problems throughout the VA system, while about two in ten (22 percent) say that long waiting times are isolated to a few facilities. People living in households with someone who has served in the U.S. military and those who report closely following news coverage of VA wait times are even more likely than the general public to believe the problems are widespread (71 percent and 74 percent, respectively).

Figure 2

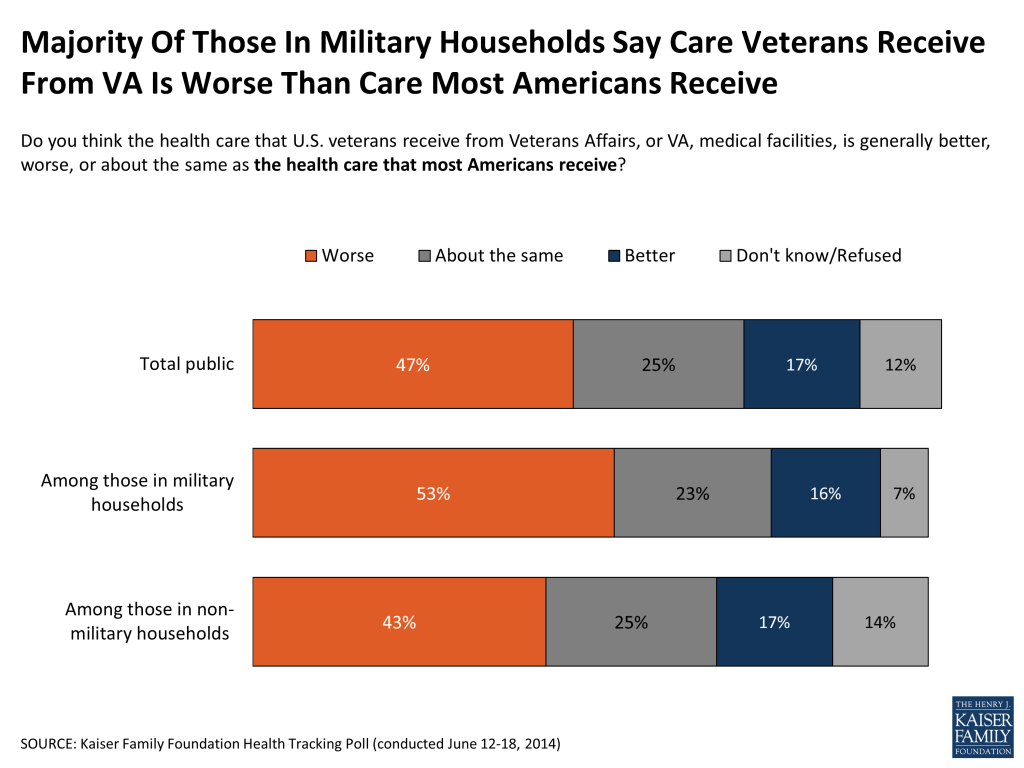
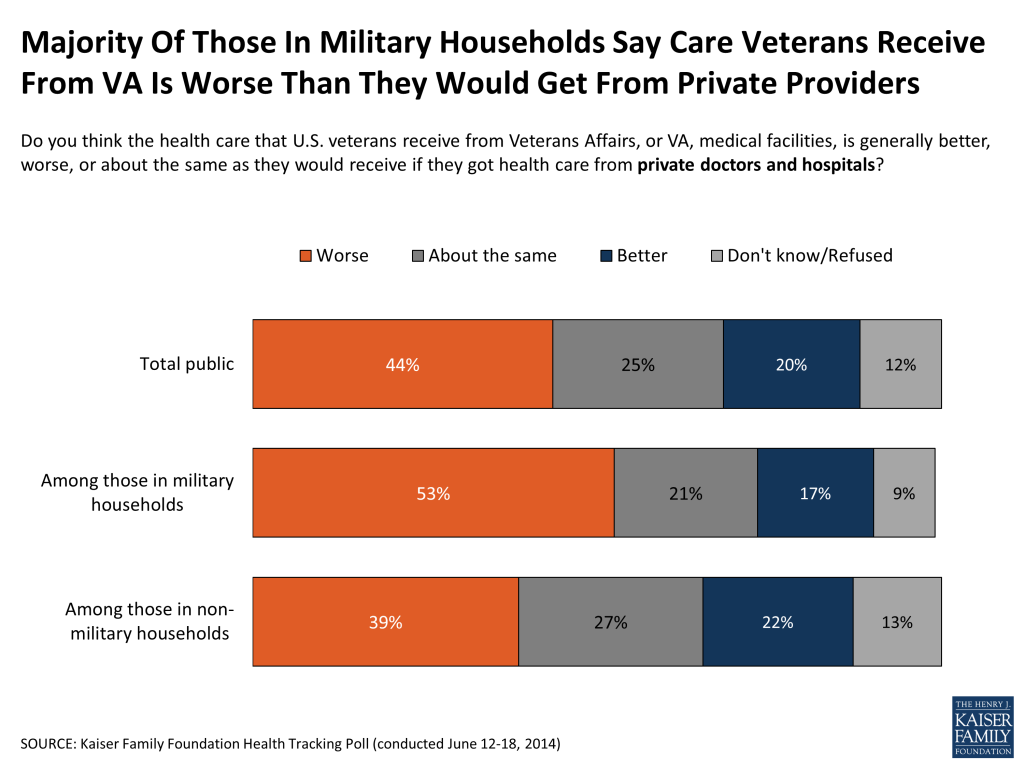
When asked more generally about their impressions of the quality of care veterans receive from VA medical facilities, over four in ten say it is worse than the care they would receive if they got health care from private doctors and hospitals (44 percent) and a similar share say it is worse than the health care that most Americans receive (47 percent). On both questions, a quarter say the care is about the same (25 percent each) and about two in ten say it is better (20 percent and 17 percent). Among those living in military households, even larger shares say the health care veterans receive from VA medical facilities is worse than they would receive from private doctors and hospitals (53 percent) and worse than the health care most Americans receive (53 percent).

Figure 3
Figure 4

Although over six in ten say they closely followed coverage about the VA wait times, a smaller share (41 percent) correctly answered that General Eric Shinseki resigned as Secretary of Veterans Affairs, while about one in ten each believe Shinseki was fired (12 percent) or that he is still the Secretary (10 percent).  A large portion (37 percent) say they do not know Shinseki’s status.

The only news story followed by a larger share of the public than the VA story this month was news about the release of U.S. prisoner of war Bowe Bergdahl, followed by about two thirds (65 percent) of the public. Behind these top two news stories, a majority of Americans (54 percent) report closely following the deadly shootings by a college student near Santa Barbara, CA.  Other health policy stories were followed by much smaller shares of the public, including news about some states’ decisions to switch from a state-run health insurance marketplace to the federal marketplace (36 percent), the release of 2015 health insurance premium rates by insurers in some states (27 percent), and the Senate confirmation of Sylvia Burwell as the new Secretary of Health and Human Services (23 percent).  In other non-health news, just over a third (36 percent) report closely following the results of Virginia’s primary election where House Majority Leader Eric Cantor was defeated by Tea Party-backed candidate Dave Brat, and around a quarter (27 percent) say they closely followed news of the soccer World Cup1 .

Figure 5

NOTE: These questions were asked as part of the June 2014 Kaiser Health Tracking Poll. For more results from that survey, including methods, see: Kaiser Health Tracking Poll: June 2014.

  1. The survey was in the field June 12-18. The first World Cup game was played on June 12, and the first game played by the U.S. team, against Ghana, was on June 16. ↩︎
News Release

I Got Tested Campaign Encourages Americans to Know Their HIV Status for National HIV Testing Drive

Published: Jun 25, 2014

Targeted Media Messages Promote Free and Low-Cost Testing Services

New Partnership with the International Association of Providers of AIDS Care (IAPAC) Supports Providers with Materials in Clinics to Urge Patients to Test for HIV

Free In-Store HIV Testing Offered in Select Walgreens Stores as part of an Ongoing Partnership

MENLO PARK, CA, June 25, 2014 – Greater Than AIDS, a leading national public information response to the domestic AIDS epidemic, has released new targeted media messages urging Americans to get tested for HIV as part of efforts coinciding with National HIV Testing Day (June 27). A new partnership with the International Association of Providers of AIDS Care (IAPAC) places materials in clinics to support providers in HIV outreach, and an ongoing partnership with Walgreens offers free HIV Testing in select pharmacies.

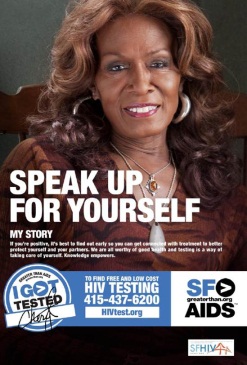
By profiling real-life stories of people who got tested –including both those with positive and negative results – the I Got Tested campaign highlights the importance of knowing one’s status regardless of the outcome, routinizing testing, and reducing stigma. Media ads appearing throughout June promote free and low-cost testing in communities by promoting hotlines and web-based resources provided by departments of health and agencies and Centers for Disease Control and Prevention (CDC).

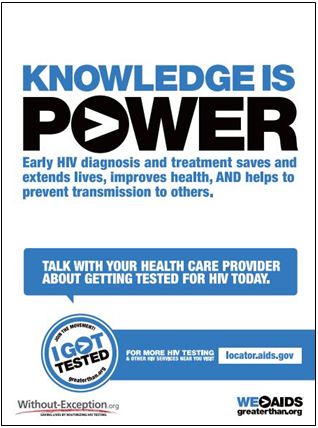
Of the more than 1.1 million people living with HIV/AIDS in the U.S, an estimated one in six, or more than 180,000 people, does not know they are positive. Moreover, one-third of those who test HIV positive are diagnosed so late in the course of their infection that they develop AIDS within a year. For many, the delay in diagnosis and linkage to care denies them the benefit of life-saving antiretroviral therapy (ART). According to the CDC, only one in four people with HIV in this country has their virus “under control” with treatment. Early diagnosis and treatment saves lives AND is known to reduce the spread of HIV.

“Despite overwhelming evidence that early diagnosis and treatment play an important role both in the health of those who are positive and in reducing the spread of HIV, many Americans at highest risk for infection still have not been tested,” said Tina Hoff, Senior Vice President and Director of Health Communication and Media Partnerships at the Kaiser Family Foundation, a co-founding partner of Greater Than AIDS. “This campaign is about helping to reduce the stigma surrounding HIV testing, to encourage patients to ask their providers to get tested, and to connect people with services in their communities.”

Speak_Up_For_Yourself

Public service announcements, including billboards and transit postings appear throughout June, with over 10,000 placements across the country in 40 priority markets, including: Atlanta, Baltimore, Birmingham, Charlotte, Chicago, Dallas, Detroit, Houston, Miami, New Orleans, New York City, Oakland, Philadelphia, Richmond, San Francisco, and Washington, D.C.  Select campaign placements are supported by the Georgia Department of Public Health, Louisiana Department of Health and Hospitals, Texas Department of State and Health Services and Virginia Department of Health. Other Greater Than AIDS media partners are extending the reach of messages on other platforms, including radio, TV and digital. To view all creative assets, visit greaterthan.org/i-got-tested.

Through a new partnership with IAPAC, Greater Than AIDS is distributing nearly 10,000 kits containing 1.25 million HIV testing-themed outreach materials to health care providers across the country to encourage HIV testing as a part of routine care. Greater Than AIDS is also providing I Got Tested community materials to health departments and community organizations across the nation.

“We are pleased to join with Greater Than AIDS to support our network of clinicians by promoting best practices in HIV testing” said Dr. José M. Zuniga,

igt_knowledge_poster

President and CEO of IAPAC.  “As providers, we must routinize HIV testing in clinical settings, ensuring that undiagnosed Americans are screened and tested for HIV and, if positive, subsequently linked to care and treatment€ – Without Exception.”

Also this month, Greater Than AIDS and Walgreens, the nation’s largest drugstore chain, are teaming with health departments and local AIDS service organizations for the fourth year in a row to offer free in-store HIV testing between June 26-28 at select Walgreens in more than 140 cities with results available on-site. BioLytical Laboratories donated 10,000 INSTI HIV one-minute, finger stick test kits to support the effort.  For more about the Greater Than AIDS/Walgreens promotion, including participating stores, go to greaterthan.org/walgreens.

“Since the beginning of the epidemic, Walgreens has served as a trusted resource to help people know their status and manage their condition,” said Glen Pietrandoni, senior director, virology, specialty products and services, Walgreens.  “We are proud to collaborate with Greater Than AIDS and community partners to increase access to testing and education which we know is critical to being a part of the solution to end AIDS.”

About Greater Than AIDS

Greater Than AIDS is a leading national public information response focused on the U.S. domestic epidemic. Launched in 2009, it is supported by a broad coalition of public and private sector partners, including: major media and other business leaders; Federal, state and local health agencies and departments; national leadership groups; AIDS service and other community organizations; and foundations, among others. Through targeted media messages and community outreach, Greater Than AIDS works to increase knowledge, reduce stigma and promote actions to stem the spread of the disease. While national in scope, Greater Than AIDS focuses on communities most affected.

The Kaiser Family Foundation provides strategic direction and day-to-day management, as well as oversees the production of the campaigns. The Black AIDS Institute – a think tank exclusively focused on AIDS in Black America – provides leadership and expert guidance and supports community engagement. Additional financial and substantive support is provided by the Elton John AIDS Foundation and Ford Foundation, among others.

###

Visualizing Health Policy: Understanding the Effect of Medicaid Expansion Decisions in the South

Published: Jun 24, 2014

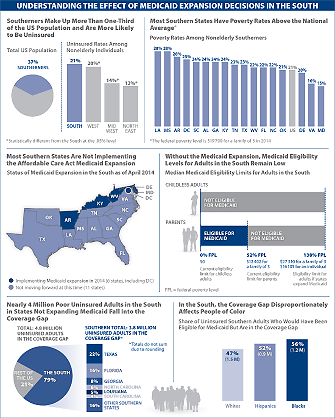
This Visualizing Health Policy infographic examines the effect of decisions by states in the South to implement or forgo the Affordable Care Act Medicaid expansion. It shows that Southerners are more likely than people living in other parts of the United States to be uninsured; that most Southern states have poverty rates above the national average; that without the Medicaid expansion (which most Southern states are not implementing), Medicaid eligibility levels for adults in the South remain low; that nearly 80% of the 4.8 million uninsured US adults who fall into the coverage gap live in the South; and that the coverage gap in the South disproportionately affects people of color.

jama_2014june_thesouth

Visualizing Health Policy is a monthly infographic series produced in partnership with the Journal of the American Medical Association (JAMA). The full-size infographic is freely available on JAMA’s website and is published in the print edition of the journal.View Source Slides

House Appropriations Committee approves FY2015 State and Foreign Operations Appropriations Bill

Published: Jun 24, 2014

The House Committee on Appropriations approved the FY 2015 State and Foreign Operations Appropriations bill (also see the associated report), which includes funding for U.S. global health programs at the U.S. Agency for International Development (USAID) and the State Department (see table below) comprising a significant portion of U.S. funding for global health (total funding for global health is not currently available as some funding provided through USAID, HHS, and DoD is not yet available).

Funding through the House appropriations bill for global health at USAID and the State Department would be $257 million (3%) above the President’s request, but $132 million (2%) below the FY 2014 enacted level.  Bilateral HIV funding provided through the President’s Emergency Plan for AIDS Relief (PEPFAR) at the State Department is $300 million above both the President’s request and the FY 2014 levels; the Global Fund to Fight AIDS, Tuberculosis and Malaria (Global Fund) is funded at the same level as the request. Funding in the bill for tuberculosis, maternal and child health (MCH), polio, nutrition, and vulnerable children is above the President’s request while funding for malaria is equal to the President’s request. Funding for neglected tropical diseases (NTDs) and pandemic influenza was not specified in the bill or the associated report.

Among the known amounts, funding for family planning and reproductive health (FP/RH) is the only area that declined. The bill caps FP/RH funding at $461 million, $183 million below the President’s request and $149 million below the FY 2014 levels. The bill also included the following policy provisions:

• Reinstates the Mexico City Policy (also known as the “Global Gag Rule”)• Prohibits funding for the United Nations Population Fund (UNFPA)

Department / Agency / AreaFY14 Omnibus(millions)FY15 Request(millions)FY15 House Bill (millions)Difference (millions)
House – FY14House – Request
USAID – Global Health Programs Account (GHP)
HIV/AIDS$330.0$330.0$330.0$0(0%)$0(0%)
Tuberculosis$236.0$191.0$236.0$0(0%)$45(23.6%)
Malaria$665.0$674.0$674.0$9(1.4%)$0(0%)
Neglected Tropical Diseases (NTDS)$100.0$86.5Not Yet Known
Maternal & Child Health (MCH)$705.0$695.0$732.0$27(3.8%)$37(5.3%)
of which GAVI$175.0$200.0$200.0$25 (14.3%)$0 (0%)
of which Polio$51.0$44.5$51.0$0 (0%)$6.5 (14.6%)
Nutrition$115.0$101.0$115.0$0(0%)$14(13.9%)
Vulnerable Children$22.0$14.5$22.0$0(0%)$7.5(51.7%)
Family Planning & Reproductive Health (FPRH)*$524.0$538.0See Below
Pandemic Influenza$72.5$50.0Not Yet Known
Total USAID:$2,769.5$2,680.0$2,637.0$-132.5 (-4.8%)$-43 (-1.6%)
State Department – Global Health Programs Account (GHP)
HIV$4,020.0$4,020.0$4,320.0$300(7.5%)$300(7.5%)
Global Fund$1,650.0$1,350.0$1,350.0$-300(-18.2%)$0(0%)
Total State:$5,670.0$5,370.0$5,670.0$0 (0%)$300 (5.6%)
Total GHP – State & USAID
Total USAID & State GHP:**$8,439.5$8,050.0$8,307.0$-132.5 (-1.6%)$257 (3.2%)
International Organizations & Programs (IO&P) – State & Foreign Operations
United Nations Children’s Fund (UNICEF)$132.0$116.6$132.0$0(0%)$15.4(13.2%)
United Nations Population Fund (UNFPA)$35.0$35.3$0.0$-35(-100%)$-35.3(-100%)
Family Planning & Reproductive Health (FP/RH) – State & Foreign Operations (All Accounts)*
FP/RH$610.0$644.3$461.0$-149(-24.4%)$-183.3(-28.4%)
of which GHP account$524.0$538.0Not Yet Known
of which ESF account$51.0$71.0Not Yet Known
of which UNFPA$35.0$35.3$0.0$-35 (-100%)$-35.3 (-100%)
Polio
Polio$59.0$50.0$59.0$0(0%)$9(18%)
of which GHP account$51.0$44.5$51.0$0 (0%)$6.5 (14.6%)
of which ESF account$8.0$5.5$8.0$0 (0%)$2.5 (45.5%)

*The House State & Foreign Operations (SFOPs) appropriations bill specified a total funding level for family planning and reproductive health (FP/RH) activities, but did not delineate this funding by account beyond stipulating that no funding would be provided to UNFPA.**Represents combined PEPFAR funding (HIV bilateral and Global Fund) at the State Department.

Additional Resources:

  • House Appropriations Committee press release summarizing the bill.
  • Read the full text of the bill here.
  • Learn more about the Senate SFOPs appropriations bill (including comparisons to the House bill) here.
News Release

Visualizing Health Policy: Understanding the Effect of Medicaid Expansion in the South

Published: Jun 24, 2014

This Visualizing Health Policy infographic examines the effect of decisions by states in the South to implement or forgo the Affordable Care Act Medicaid expansion. It shows that Southerners are more likely than people living in other parts of the United States to be uninsured; that most Southern states have poverty rates above the national average; that without the Medicaid expansion (which most Southern states are not implementing), Medicaid eligibility levels for adults in the South remain low; that nearly 80% of the 4.8 million uninsured US adults who fall into the coverage gap live in the South; and that the coverage gap in the South disproportionately affects people of color.

jama_2014june_thesouth_(4)

Visualizing Health Policy is a monthly infographic series produced in partnership with the Journal of the American Medical Association (JAMA). The full-size infographic is freely available on JAMA’s website and is published in the print edition of the journal.

Poll Finding

Data Note: Differences In Public Opinion On The ACA’s Contraceptive Coverage Requirement, By Gender, Religion, And Political Party

Authors: Jamie Firth, Liz Hamel, and Mollyann Brodie
Published: Jun 19, 2014

One of the most politically polarizing elements of the Affordable Care Act (ACA) is the law’s requirement that new private health insurance plans cover prescription contraceptives and services, including all methods approved by the Food and Drug Administration. The rule currently provides an exemption for houses of worship and an “accommodation” for religiously affiliated non-profit employers who object to providing contraceptive coverage; however all for-profit employers that provide health insurance must include this benefit. Over forty for-profit corporations have filed lawsuits claiming that the requirement violates their religious rights, and the cases of two corporations, Hobby Lobby and Conestoga Wood Specialties, have reached the Supreme Court. The oral arguments for these cases was heard at the end of March 2014, and in April, over four in ten (44 percent) of the public reported following the news coverage of the oral arguments “very” or “fairly closely.”1  The Supreme Court is expected to announce a decision on these cases in late June. This data note takes a closer look at what the public thinks about this issue.

A majority of the public (58 percent) supports the law’s requirement that private health insurance plans cover the full cost of birth control. On the issue facing the Supreme Court, a somewhat smaller majority (53 percent) believes the contraceptive coverage rule should apply to for-profit companies, even if it violates their owners’ personal religious beliefs, while four in ten (41 percent) say employers that object on religious grounds should not be subject to the requirement, even if it means their female employees will have to pay the cost of birth control themselves. As illustrated in Figure 1, gender and party differences exist on both of these questions, with women more likely to support the requirement than men, and those who identify as Democrats and independents more likely to support it than Republicans.

Figure 1: Support For Contraceptive Requirement By Gender and Political Party
TOTALGENDERPARTY ID
MenWomenRepublicanIndependentDemocrat
In general, do you support or oppose the health care law’s requirement that private health insurance plans cover the full cost of birth control?
Support58%48%67%35%60%78%
Oppose324124563117
With the exception of certain religious organizations, employers are now required to cover the cost of preventive services including prescription birth control in their health plans. Which comes closer to your view about how this law should apply to for-profit companies whose owners object to birth control on religious grounds?
For-profit companies SHOULD be required to cover birth control in their workers’ health plans, even if it violates their owners’ personal religious beliefs53%46%59%32%50%74%
For-profit companies should NOT be required to cover birth control in their workers’ health plans, even if it means their female employees will have to pay the cost of birth control themselves414835664322
NOTE: Don’t Know/ Refused and Neither/ Other (VOL.) responses not shown

Religious identification also plays a role, with support among white Evangelical Protestants much lower than among other groups. Half (50 percent) of white Evangelical Protestants are opposed to the requirement in general, and about two-thirds of this group (68 percent) believe the requirement should not apply to for-profit companies whose owners have religious objections. By contrast, majorities of Catholics, white Mainline Protestants, Protestants who are members of racial and ethnic minority groups, and those who identify with other religions (or no religion) both support the requirement believe it should apply to for-profit companies regardless of their owners objections (Figure 2). Even when controlling for demographic factors, gender, party identification and religious affiliation remain significant predictors of whether an individual supports or opposes the requirement and whether they say it should apply to for-profit companies.

Figure 2: Support For Contraceptive Requirement By Religious Identification
TOTALRELIGIOUS IDENTIFICATION
White EvangelicalWhite Mainline ProtestantNon-White ProtestantCatholicOther/None
In general, do you support or oppose the health care law’s requirement that private health insurance plans cover the full cost of birth control?
Support58%42%60%60%58%65%
Oppose325028303325
With the exception of certain religious organizations, employers are now required to cover the cost of preventive services including prescription birth control in their health plans. Which comes closer to your view about how this law should apply to for-profit companies whose owners object to birth control on religious grounds?
For-profit companies SHOULD be required to cover birth control in their workers’ health plans, even if it violates their owners’ personal religious beliefs53%28%55%56%58%62%
For-profit companies should NOT be required to cover birth control in their workers’ health plans, even if it means their female employees will have to pay the cost of birth control themselves416836393831
NOTE: Don’t Know/ Refused and Neither/ Other (VOL.) responses not shown

Support for the contraceptive coverage requirement also varies by age, and looking at age and gender together illuminates an interesting pattern. Across all age groups, women are consistently more likely than men to support the contraceptive coverage requirement and its application to for-profit companies whose owners have religious objections (Figure 3). While support decreases with age for both men and women, majorities of women in all age groups are supportive of the requirement and believe for-profit companies should abide by it even if their owners have religious objections, while among men, support only reaches above 50 percent for the youngest group (those ages 18-34).

Figure 3

White Evangelical Protestants, who account for 18 percent of all adults, have some of the highest levels of opposition to the contraceptive coverage requirement; half say they oppose the law’s requirement and nearly seven in ten (68 percent) say that for-profit companies whose owners have religious objections should be exempt. However, white Evangelical Protestant men and women vary in their levels of support. A majority of white Evangelical men (58 percent) say they oppose the requirement, while a slim majority of white Evangelical women (52 percent) say they support it (Figure 4). However, support among white Evangelical women decreases significantly when asked their view about whether the requirement should apply to for-profit companies whose owners have religious objections. On this question, one-third of white Evangelical women (34 percent) believe that for-profit companies should be required to cover birth control, while over six in ten  (63 percent) say they should not be required to cover birth control if their owners object on religious grounds.

Figure 4: Support For Contraceptive Requirement By Gender Among White Evangelical Protestants
AMONG WHITE EVANGELICAL PROTESTANTS
TotalMenWomen
In general, do you support or oppose the health care law’s requirement that private health insurance plans cover the full cost of birth control?
Support42%30%52%
Oppose505844
With the exception of certain religious organizations, employers are now required to cover the cost of preventive services including prescription birth control in their health plans. Which comes closer to your view about how this law should apply to for-profit companies whose owners object to birth control on religious grounds?
For-profit companies SHOULD be required to cover birth control in their workers’ health plans, even if it violates their owners’ personal religious beliefs28%21%34%
For-profit companies should NOT be required to cover birth control in their workers’ health plans, even if it means their female employees will have to pay the cost of birth control themselves687663
NOTE: Don’t Know/ Refused and Neither/ Other (VOL.) responses not shown

Among Catholics, who make up about one in five adults, a majority supports both the contraceptive coverage requirement and its application to for-profit companies whose owners have religious objections. Gender differences within Catholics are again apparent on both questions, with Catholic men being nearly evenly divided on both questions, and about two-thirds of Catholic women in support (Figure 5).

Figure 5: Support For Contraceptive Requirement By Gender Among Catholics
AMONG CATHOLICS
TotalMenWomen
In general, do you support or oppose the health care law’s requirement that private health insurance plans cover the full cost of birth control?
Support58%46%67%
Oppose334623
With the exception of certain religious organizations, employers are now required to cover the cost of preventive services including prescription birth control in their health plans. Which comes closer to your view about how this law should apply to for-profit companies whose owners object to birth control on religious grounds?
For-profit companies SHOULD be required to cover birth control in their workers’ health plans, even if it violates their owners’ personal religious beliefs58%49%66%
For-profit companies should NOT be required to cover birth control in their workers’ health plans, even if it means their female employees will have to pay the cost of birth control themselves385128
NOTE: Don’t Know/ Refused and Neither/ Other (VOL.) responses not shown

Similar to public opinion of the health care law as a whole, opinion about the contraceptive coverage requirement is divided along party affiliation. Republicans are more likely to oppose the requirement (56 percent), Democrats are more likely to support it (78 percent), and independents fall in between (though a solid majority – 60 percent – of independents support it). Across all political identifications, women are more likely than men to support the requirement and more likely to think it should apply to for-profit companies (Figure 6).

Figure 6: Support For Contraceptive Requirement By Party Identification Among Men and Women
TOTALMENWOMEN
RepIndDemRepIndDemRepIndDem
In general, do you support or oppose the health care law’s requirement that private health insurance plans cover the full cost of birth control?
Support35%60%78%24%50%72%46%70%83%
Oppose563117653924452210
With the exception of certain religious organizations, employers are now required to cover the cost of preventive services including prescription birth control in their health plans. Which comes closer to your view about how this law should apply to for-profit companies whose owners object to birth control on religious grounds?
For-profit companies SHOULD be required to cover birth control in their workers’ health plans32%50%74%25%44%71%39%57%76%
For-profit companies should NOT be required to cover birth control in their workers’ health plans664322724926593618
NOTE: Don’t Know/ Refused and Neither/ Other (VOL.) responses not shown

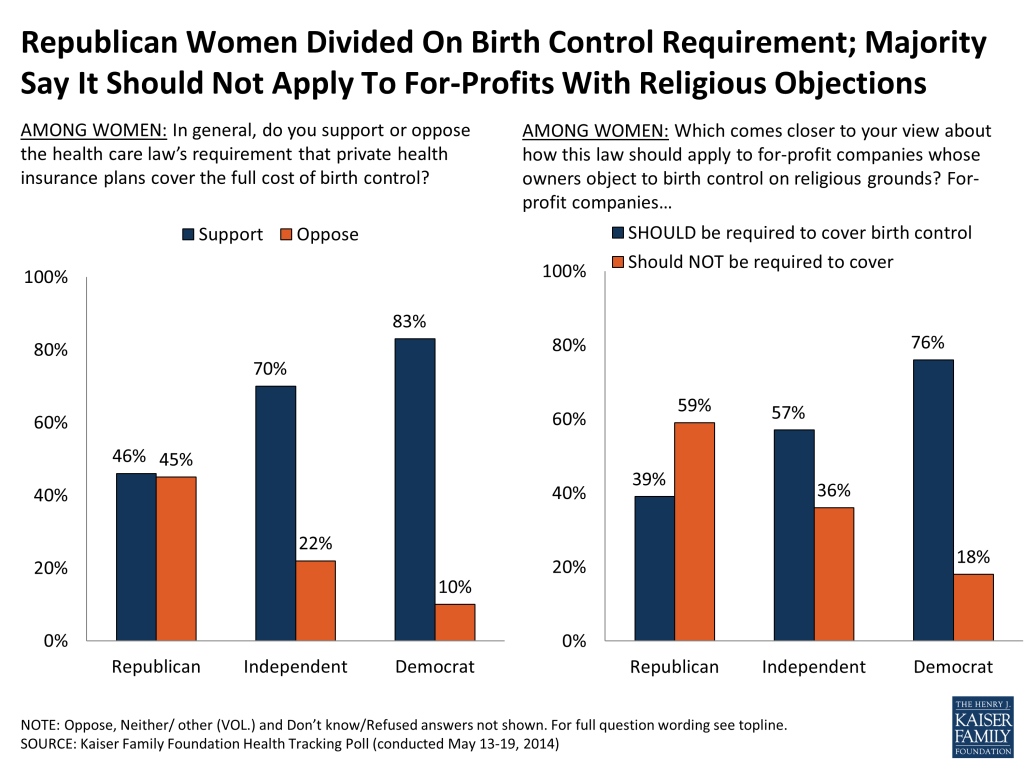
Although Republican women are more likely to support the requirement than Republican men, they are still much less likely to support it than independent and Democratic women. In fact, Republican women are one of the only subgroups of women in which support for the contraceptive requirement drops below 50 percent (46 percent support, 45 percent oppose). When asked whether for-profit companies should be required to cover contraception even if their owners object, a smaller share of Republican women (39 percent) say for-profit companies whose owners have religious objections should be required to cover birth control, while 59 percent say these companies should not be subject to the requirement (Figure 7).

Figure 7

While the majority of adults support the ACA’s contraceptive coverage requirement in private health plans and most feel that it should apply to for-profit employers regardless of owners’ religious views (the question currently being considered by the Supreme Court), there are significant differences between women and men. Support is stronger among women than men, and women’s support holds across age groups, religious beliefs, and political party affiliations, with majorities of most subgroups of women supporting the contraceptive coverage policy and believing the requirement should apply to for-profit companies whose owners have religious objections. Support among men is lower than among women and does not rise above 50 percent for most subgroups of men. However, the importance of party affiliation is evident, as Republican women and Democratic men are notable exceptions to these overall patterns. With public opinion on this topic deeply divided by party, the Supreme Court’s ruling is likely to reignite debate across the political spectrum.

  1. Kaiser Health Tracking Poll: April, 2014 https://modern.kff.org/health-reform/poll-finding/kaiser-health-tracking-poll-april-2014/ ↩︎