Federal and State Standards for “Essential Community Providers” under the ACA and Implications for Women’s Health

Authors: Cristina Jade Peña, Laurie Sobel, and Alina Salganicoff
Published: Jan 23, 2015

Issue Brief

Introduction

Millions of previously uninsured Americans have gained access to health coverage through the Affordable Care Act (ACA) Marketplace plans. The provider networks of the Marketplace plans determine where enrollees can seek medical care. Many of these individuals have received their care for years from safety-net providers, such as community health centers and family planning clinics. Recognizing the important role these providers play in promoting continuity of care as people transition from being uninsured and relying on safety net clinics to private insurance, and to meet the increased demand for medical care in underserved communities, Congress established general requirements to assure that these providers have the opportunity to participate in the health plans that are offered through the Marketplaces. These safety net clinics and hospitals are referred to as Essential Community Providers (ECPs), and the ACA specifically requires that Qualified Health Plans available through the federal or state insurance Marketplaces have a “sufficient number and geographic distribution of ECPs, where available, to ensure reasonable and timely access to a broad range of such providers for low-income, medically underserved individuals in the plan’s service area.”1  Because both the Center for Medicare and Medicaid Services (CMS) and state regulators can have the authority to decide how to implement the broad ECP standard, there is considerable variation across the country in both the categories of providers included as ECPs as well as the standards required for inclusion in plan networks. This brief reviews the definition of ECP, examines the federal and state rules that govern the extent to which plans must include these providers in their networks, identifies the variation from state to state, and discusses the particular importance of these rules and providers for women’s access to care.

ACA Requirement for Essential Community Providers (ECPs) Qualified Health Plans must have a “sufficient number and geographic distribution of ECPs, where available, to ensure reasonable and timely access to a broad range of such providers for low-income, medically underserved individuals in the plan’s service area.”Source: PPACA § 1311 (c)(1)(C); 45 CR 156.235

What are Essential Community Providers?

In 1993, the term “Essential Community Provider” was first introduced in the Health Security Act, proposed under President Clinton. Although that proposal failed, some states adopted legislation requiring managed care plans or Medicaid to include ECPs in their networks.2  ECPs have traditionally included health centers, public hospitals, public health departments, family planning clinics, and community mental health clinics. ECPs collectively provide a wide range of physical and mental health services including, sexual and reproductive health care, preventive health screenings, vaccines, counseling, rehabilitation and referrals to millions of people each year. There is a large network of safety-net providers in the U.S. that serve low-income and medically underserved communities.

Federal law generally defines ECPs as providers who serve predominately low-income, medically underserved individuals, and particularly providers described in section 340B of the Public Health Service (PHS) Act and section 1927(c)(1)(D)(i)(IV) of the Social Security Act (SSA).3  These include providers who are eligible to participate in the 340B Prescription Drug Pricing program, which makes available prescription drugs at deeply discounted prices to certain health care providers including Federally Qualified Health Centers (FQHCs) and FQHC look-alikes, clinics receiving Title X family planning funds, Ryan White Care Act providers for HIV/AIDS care, public hospitals and other disproportionate share hospitals and other specialty hospitals.

In March 2014, CMS issued a letter to all insurers participating in the Federally Facilitated Marketplace4  identifying six ECP designated categories that meet the federal definition and setting forth the minimum inclusion standards for plans to meet in order to be certified as Qualified Health Plans for the 2015 plan year.5 ,6  CMS also developed a non-inclusive state-by-state list of ECPs which specifically listed by name, many but not all ECPs.

Table 1: Federally Defined Essential Community Providers7 
Major ECP CategoryProvider Types
Federally Qualified Health Center (FQHC)FQHC and FQHC “look-alike” clinics, outpatient health programs/facilities operated by Indian tribes, tribal organizations, program operated urban Indian organizations
Ryan White ProviderRyan White HIV/AIDS program providers
Family Planning ProviderTitle X family planning clinics and Title X “look-alike” family planning clinics
Indian Health ProviderIndian Health Service (IHS) providers, Indian tribes, tribal organizations and urban Indian organizations
HospitalDisproportionate share hospital (DSH) and DSH-eligible hospitals, children’s hospitals, rural referral centers, sole community hospitals, free-standing cancer centers, critical access hospitals
Other ECP ProviderSTD clinics, TB clinics, hemophilia treatment centers, black lung clinics, and other entities that serve predominately low-income, medically underserved individuals

In addition to the ECP categories identified by CMS, states have authority to identify and require the inclusion of additional types of providers and categories. While 37 states and the District of Columbia8  exclusively use the CMS identified ECP categories, 14 states have expanded or further clarified the CMS ECP categories to include other specialty providers such as school-based health programs, rural health clinics, and birth centers. For example, Minnesota’s ECP definition, which pre-dates the ACA, includes state hospitals that also specialize in the treatment of cerebral palsy, spina bifida, epilepsy, closed health injuries, and other disabling conditions as an ECP.9  Colorado regulation and Washington law specify that providers who waive charges or charge for services on a sliding scale based on income and do not restrict access or services because of a client’s financial limitation are included in the definition of ECP.10  California includes providers that qualify for the HI-TECH Medi-Cal Electronic Health Record Incentive Programs as ECPs.11  (See Table: Definitions of Essential Community Providers (ECPs) in Marketplaces).

How many ECPs do Marketplace plans have to include in their network?

While CMS has developed ECP inclusion standards for plans operating in Federally-facilitated Marketplaces (FFM) and State-Partnership Marketplaces, states administering their own state-based Marketplaces (SBM) or with a Federally-supported Marketplace have authority to develop their own network adequacy and ECP inclusion standards. Consequently, there is wide variation among states regarding the minimum percentage of ECPs required for inclusion in a plan’s network (Figure 1).12 
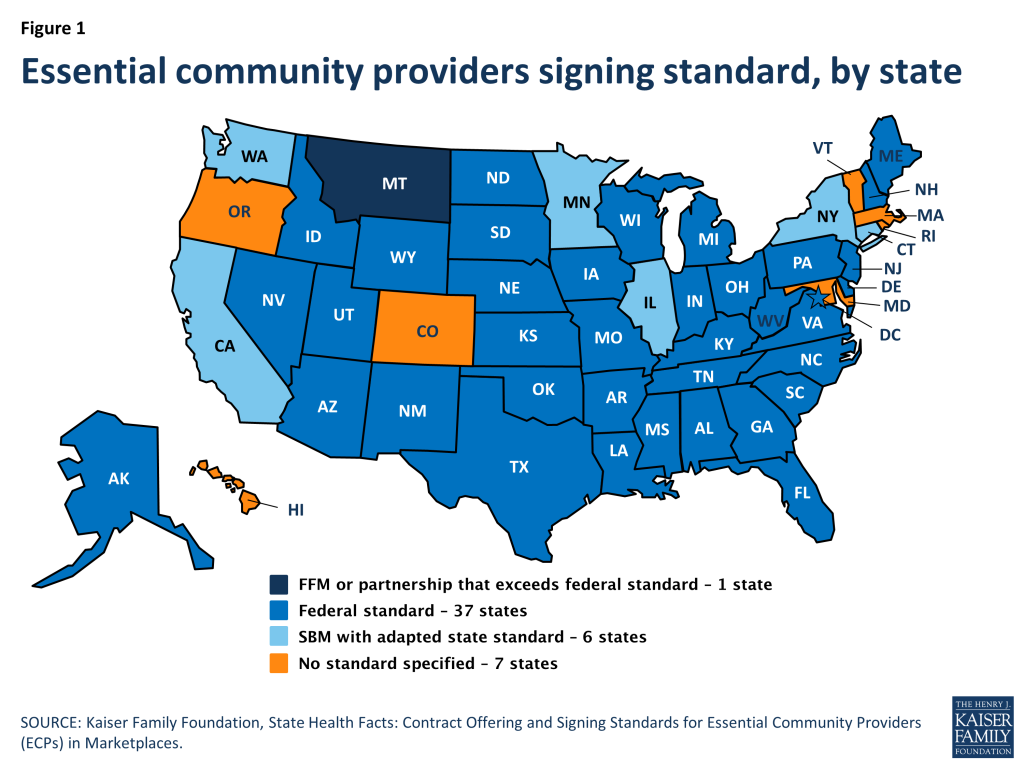
Figure 1: Essential community providers signing standard, by state

Federally-facilitated Marketplace and State-Partnership Marketplaces: For the 2015 plan year, the CMS-established ECP standard requires QHP applicants to include at least 30% of available ECPs in in each plan’s service area in the provider network and must offer contracts in “good faith” to all Indian Health Service providers as well as at least one ECP from each of the six federally-established ECP categories in each county in the service area, where available.13  CMS has defined “good faith” to mean offering contract terms that a “willing, similarly-situated, non-ECP provider would accept or has accepted.” Montana is the only state utilizing the FFM which has established a higher standard than the required federal standard for plan year 2015; Montana requires issuers to “strive to include at least 80% of all ECPs” listed on a state-issued list.

State-based Marketplaces: States operating their own Marketplace (SBM) can choose to follow the federal standard, develop their own standard, or not establish a specific standard necessary to meet the network adequacy set forth in the ACA, which requires “sufficient number and geographic distribution of ECPs, where available, to ensure reasonable and timely access to a broad range of such providers for low-income, medically underserved individuals in the plan’s service area.”14  Of the 17 states operating their own Marketplace,15  6 states16  have developed their own offering or inclusion standard,17  sometimes in response to the ACA requirements and in some cases because they had network adequacy laws that predate the ACA. (See Table: Contract Offering and Signing Standards for Essential Community Providers (ECPs) in Marketplaces) Notable examples include:

  • Minnesota enacted a network adequacy law in 1994 that requires issuers to offer to contract with all ECPs in a plan’s service area. This law now applies to all Marketplace plans in Minnesota.
  • Other states have recently adopted a policy to comply with the ACA. For example, while California has not established an offering standard, California has adopted its own inclusion standard, requiring all issuers to include at least 15% of 340B entities in plan networks, where available.18 
  • Some states have established a stronger ECP inclusion standard than required by CMS. For example, Connecticut requires issuers to offer contracts in good faith including to all school-based health clinics when requested, and requires issuers to contract with at least 90% of FQHCs in the state and 75% of non-FQHC providers from a state-issued list.19 
  • D.C., Idaho, Nevada and New Mexico have opted to adopt the federal standard for both offering and inclusion.
  • Oregon has adopted the federal standard for offering but has not established a standard for contracting.
  • Colorado, Hawaii, Maryland, Massachusetts, Rhode Island and Vermont do not currently have specific contract offering or inclusion standards of ECPs for participating QHPs and rely on the federal regulation that lacks specific offering or contracting standards. (See table: Contract Offering and Signing Standards for Essential Community Providers (ECPs) in Marketplaces)

Who is overseeing the ECP standards?

State regulators and CMS have a role in the oversight of the ECP standards for qualified health plans. In 21 states, CMS alone has the oversight role. In 26 states, a state agency or SBM is charged with oversight. And in 4 states CMS and the state agency or SBM share the responsibility of oversight. (See table: Contract Offering and Signing Standards for Essential Community Providers (ECPs) in Marketplaces)

If a QHP application fails to satisfy the CMS-established 30% ECP standard, the issuer can still receive certification to participate on the Marketplace with submission of a written narrative justification explaining the plan’s efforts to meet the standard, how the plan will provide adequate care to enrollees who might otherwise seek care by ECPs not included in the network, and how the plan will meet the ECP standard in the following year. Many states, but not all states using their own definition have adopted a similar policy.

It is unclear how state regulators and CMS are monitoring and enforcing ECP inclusion in Marketplace plans. As carriers are permitted to change networks during a plan year, the representation of ECPs could change in the middle of a plan year. It is important to consider how federal and state oversight of the inclusion of ECPs can be ongoing and not just at the time of certification as a QHP.

Why is inclusion of ECPs in Marketplace plans important for women?

ECPs often provide services that are specifically developed to address the health needs of low income individuals, including language services, patient support services, coordination of health and social services, and location in a low-income community.20  For women, particularly low-income women and women of color, clinic-based providers, family planning clinics and health centers, are important sources of reproductive and sexual health care. 28% of women enrolled in Medicaid and 43% of uninsured women reported they had their most recent gynecological visit at either a clinic or health center (Figure 2). In addition to providing continuity of care for newly insured patients, ECPs that participate in both Medicaid and Marketplace plans’ networks also provide continuous care to patients who move back and forth between private insurance and Medicaid eligibility because of changes in income. The inclusion of ECPs in Marketplace plans could also strengthen the financial viability of clinics that are needed to continue to serve their patients in the post- ACA health insurance market.
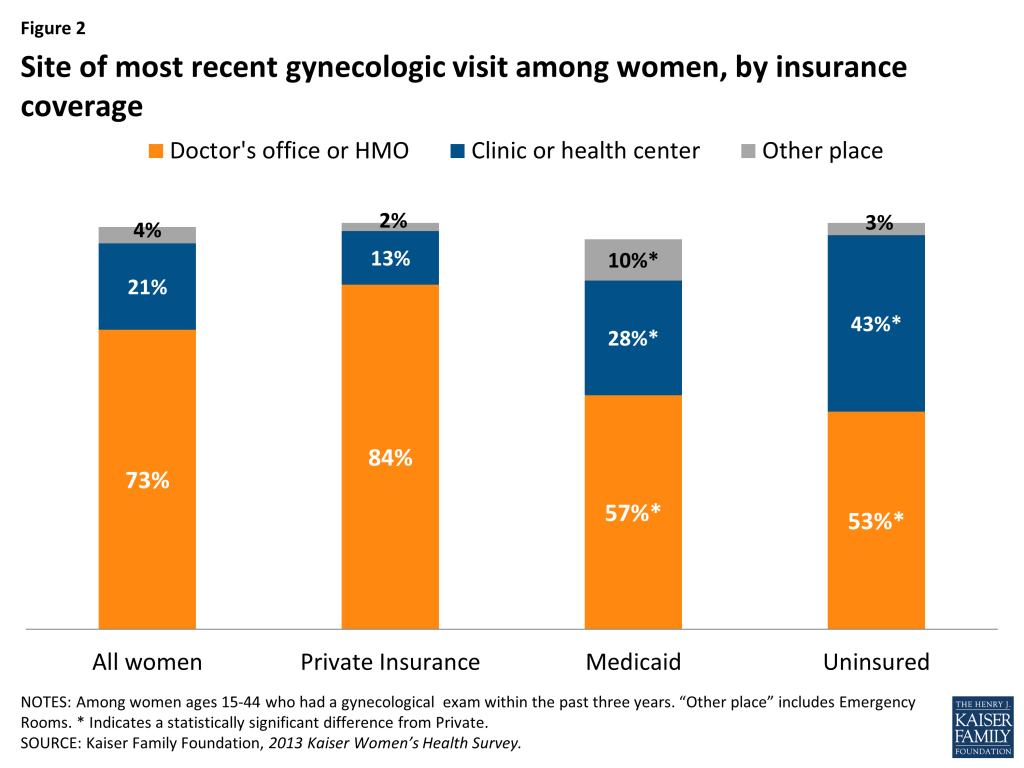
Figure 2: Site of most recent gynecologic visit among women, by insurance coverage

Since 1970, Title X Family Planning centers, which are included in all state and federal ECP definitions, have provided a range of family planning and preventive services to millions of women for free or for a reduced fee based on income. Services typically include most FDA-approved contraceptive methods and counseling, pregnancy testing and counseling, breast and cervical cancer screenings, screening and treatment for sexually transmitted infections (STI), and HIV testing and referral. While Title X Family Planning centers offer services to both men and women, approximately 92% of the nearly five million clients served in 2013 were women.21  In 2013, over 4 in 10 uninsured women said they got their birth control at a family planning or Planned Parenthood clinic, or a community health center (Figure 3). Women who have a choice of providers “say they choose specialized family planning centers because of the respectful, confidential, affordable, and high-quality care they receive from them.”22  Previously uninsured women who now have insurance through the Marketplace may want to continue to seek their sexual and reproductive health care through specialized family planning centers.
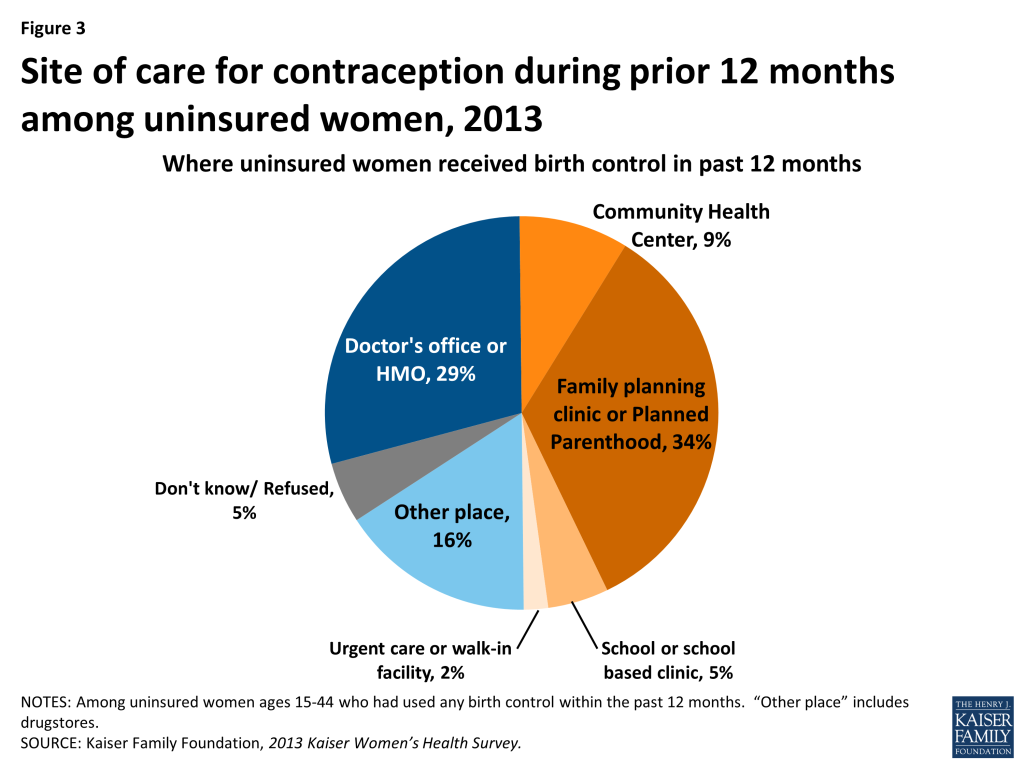
Figure 3: Site of care for contraception during prior 12 months among uninsured women, 2013

ECPs not only play an important role in the provision of preventive health care and related services to low-income women, but also provide health care and treatment for historically underserved populations including minority groups such as Native Americans and Alaskan Natives, immigrant populations and people of color.23  Many ECPs also provide sensitive health services that may be habitually stigmatized and difficult to access within private health plans, such as sexual and reproductive health, mental health, substance use disorder, and HIV/AIDS services, among other specialized health care needs. In 2012, women comprised 29% of HIV positive patients served by Ryan White clinics and 21% of patients served by the AIDS Drugs Assistance Program.

Conclusion

As the ACA broadens access to insurance coverage across the country, it is important to understand and monitor extent to which plans serving previously uninsured populations offer access to care in medically underserved communities, and assure that in-network providers can offer the range of services needed to adequately serve the health needs of new policy holders. Although ECPs, including community health centers and family planning clinics, are required by law to be part of the plan networks, they may not be sufficiently included to assure that their patients have the option of continuity of care. It will be important for CMS and state oversight agencies to monitor the implementation of the current ECP standards to assure that newly insured people can continue seeing their trusted providers at safety-net clinics if they choose and to be sure that midyear changes in plan networks do not compromise access to ECPs. Care provided by ECPs will continue to be as important to those who are newly insured as it is to the millions of remaining uninsured who do not have a pathway to coverage under the ACA.

Endnotes

  1. PPACA § 1311 (c)(1)(C); 45 CR 156.235, Essential Community Providers. The regulation allows for an Alternative Federal ECP standard, which is only applicable for issuers who provide a majority of covered services through physicians employed by the issuer or a single contracted medical group. ↩︎
  2. Rosenbaum, S., Essential Community Providers, Health Reform GPS, 2011. ↩︎
  3. Section 1927 allows the Secretary of HHS to identify any “safety net facility or entity” that would benefit from nominal drug pricing under the Medicaid program. ↩︎
  4. These standards apply to the Federally-facilitated Marketplace as well as the State-Partnership Marketplace. For a full list of state decisions on Marketplace type see: KFF State Health Insurance Marketplace Types, 2015. ↩︎
  5. Centers for Medicare and Medicaid Services, 2015. QHP Application Instructions: Chapter 7: Instructions for the Essential Community Providers Application Section ↩︎
  6. These standards have been incorporated into proposed regulations issued by the Department of Health and Human Services on November 26, 2014 applicable to the 2016 plan year. ↩︎
  7. Centers for Medicare and Medicaid Services, March 2014. 2015 Letter to Issuers in the Federally-facilitated Marketplaces, page 22, table 2.1. ↩︎
  8. The District of Columbia does not require offering contracts with Indian health services provider as there is no Indian health service provider within the district. ↩︎
  9. Minn. Stat. § 62Q.19 ↩︎
  10. Wash. Rev. Code §284-43-221; Colo. Rev. Stat. § 25.5-5-4 ↩︎
  11. Covered California, 2014. Notice Regarding Covered California’s Consolidated Essential Community Provider List. ↩︎
  12. KFF, 2015. Contract Offering and Signing Standards for Essential Community Providers (ECPs) in Marketplaces and KFF, 2015. Definition of Essential Community Providers (ECPs) in Marketplaces. ↩︎
  13. US Department of Health and Human Services Center for Medicare and Medicaid Services, March 2014. 2015 Letter to Issuers in the Federally-facilitated Marketplaces. ↩︎
  14. PPACA § 1311 (c)(1)(C); 45 CR 156.235, Essential Community Providers ↩︎
  15. Out of these 17 states, 3 states (Nevada, New Mexico and Oregon) use the federally supported state-based marketplace model. ↩︎
  16. California, Connecticut, Kentucky, Minnesota, New York and Washington. ↩︎
  17. Some states have expanded the categories of ECPs beyond the federal regulation, while others have provided more detailed definition or expanded the categories beyond the six categories identified in the 2015 CMS letter to FFM issuers, issued March 2014. ↩︎
  18. Covered California, Title 10, California Code of Regulations Section 6420: Qualified Health Plan Issuer 2015 Renewal Application ↩︎
  19. Access Health CT, 2014. Connecticut Health Insurance Exchange: Solicitation to Health Plan Issuers for Participation in SHOP Marketplace. ↩︎
  20. Rosenbaum, S., Essential Community Providers, Health Reform GPS, 2011 citing Institute of Medicine, America’s Health Care Safety Net: Intact but Endangered (Washington D.C. 2000); D. Hurwitz et al., Essential Community Provider Initiative, Enhancing Access, quality, and Cost Effectiveness of Health Care for MassHealth Members and Other Low Income Residents (Commonwealth Medicine, Boston, MA. 2004). ↩︎
  21. Fowler, CI., Gable, J., Wang, J., and McClure, E., “Family Planning Annual Report: 2012 National Summary” Research Triangle Park, NC: RTI International, 2013. ↩︎
  22. Gold, R. B., Besieged Family Planning Network Plays Pivotal Role. Guttmacher, 2013. ↩︎
  23. Families USA, 2014. Network Adequacy and Health Equity: Improving Private Health Insurance Provider Networks for Communities of Color. ↩︎
News Release

American Views on Ebola Response and U.S. Global Health Efforts

Published: Jan 23, 2015

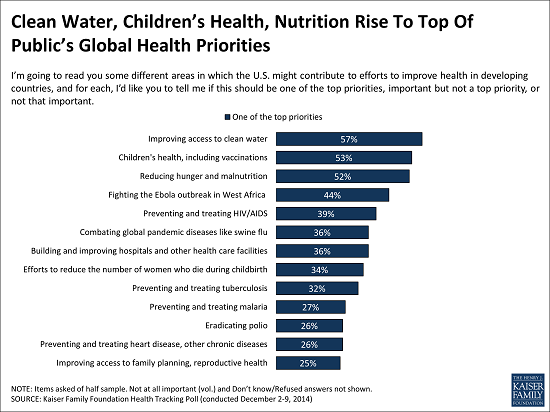
A new Kaiser Family Foundation survey about the U.S. role in global health finds the public puts meeting basic needs such as improving access to clean water and food and helping children at the top of the priority list for U.S. global health spending. Addressing the Ebola outbreak in West Africa is also a top priority. Some high profile issues such as malaria and reproductive health rank further down the list.

About 7 in 10 Americans say U.S. spending to improve health in developing countries helps protect Americans by preventing the spread of diseases like Ebola, and nearly 6 in 10 think this spending helps improve the U.S. image around the world. Fewer Americans say spending on global health helps U.S. national security (37%) or the U.S. economy (36%).

Global_health_top_priorities_chart_for_release_1-15

Most Americans overestimate the share of the U.S. budget spent on foreign aid, with the public estimating on average that 26 percent of the federal budget is spent on foreign aid, according to the Foundation’s latest polling data from December. The correct answer is 1 percent or less of the federal budget. After hearing how much the U.S. actually spends on foreign aid, the share of the public saying the U.S. spends too much on foreign aid drops in half from 56 percent to 28 percent. In December, after the survey had been administered, Congress approved $5.4 billion in appropriations for Ebola and global health security efforts internationally and in the United States.

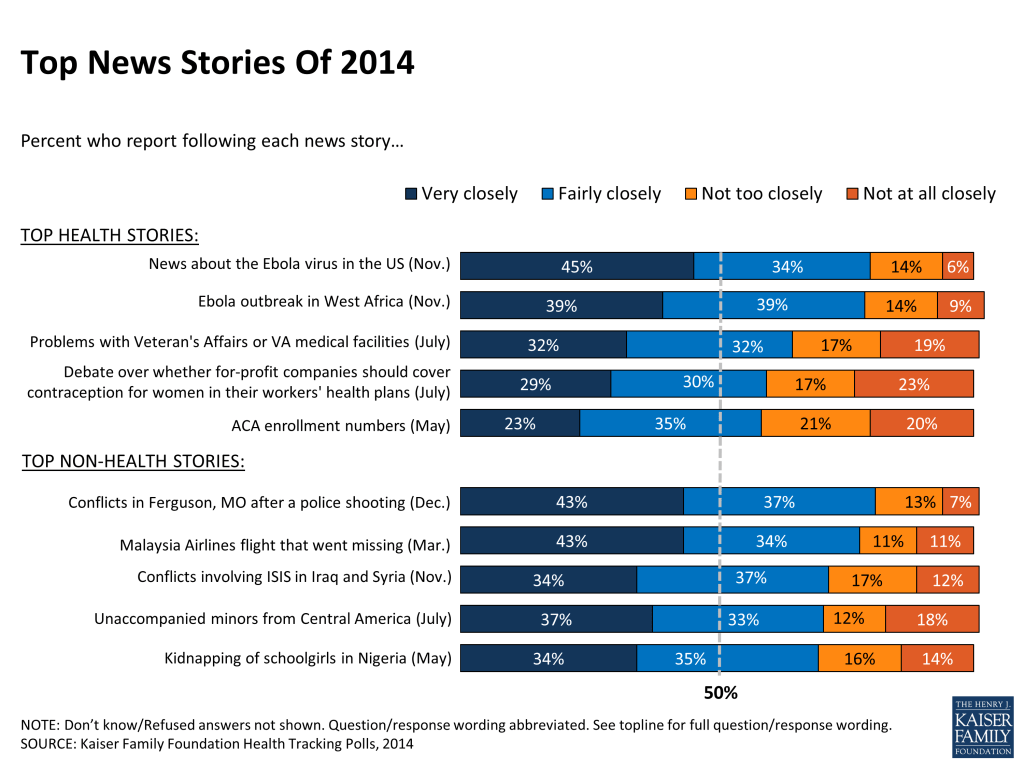
The Kaiser Health Policy News Index, our regular tracking poll of the news stories Americans are following most closely, finds that coverage of the Ebola virus in the U.S. and West Africa ranked as the top health news stories of 2014. Attention to this story grew throughout the fall, and at least three-quarters of Americans said they closely followed news coverage of Ebola in November and December. Forty-one percent of Americans said in December that they think the Ebola outbreak in West Africa is under control — up from only 10 percent who thought the epidemic was under control in October.

The Kaiser Family Foundation has tracked public opinion on global health in-depth since 2009. Data Note: Americans’ Views on the U.S. Role in Global Health provides an update of the public’s views on key questions, particularly their attitudes and knowledge of global health policy in the context of federal budget discussions.

Poll Finding

Data Note: Americans’ Views On The U.S. Role In Global Health

Authors: Bianca DiJulio, Jamie Firth, and Mollyann Brodie
Published: Jan 23, 2015

With a new Congressional session beginning, policymakers preparing for budget discussions, and the ongoing Ebola crisis bringing attention to international health issues, it is an important time to understand Americans’ views on global health and the role of the U.S. government in addressing global health issues. The Kaiser Family Foundation has tracked public opinion on global health in-depth since 2009.

This new survey shows the public, including a plurality of Republicans, Democrats and independents, wants funding for global health maintained. Americans’ top priorities for global health funding focus on meeting basic human needs such as improving access to clean water and food, and helping children; some other high profile issues fall further down the list including malaria, polio, chronic illness and reproductive health. A large majority of the public overestimates the share of the U.S. federal budget spent on foreign aid and most say the country spends too much on it, but the public is more supportive of spending specifically aimed at improving health in developing countries. Another top priority is the fight against Ebola in West Africa, a news story that has ranked among the most closely watched developments of 2014. The number of new Ebola cases has declined recently, and 4 in 10 now believe the outbreak in West Africa is under control, up from just 10 percent in October when Ebola was spreading quickly.

Views Of U.S. Spending On Foreign Aid And Global Health

Most Continue to Overestimate U.S. Spending On Foreign Aid, But Views Change After Hearing The Actual Amount Spent

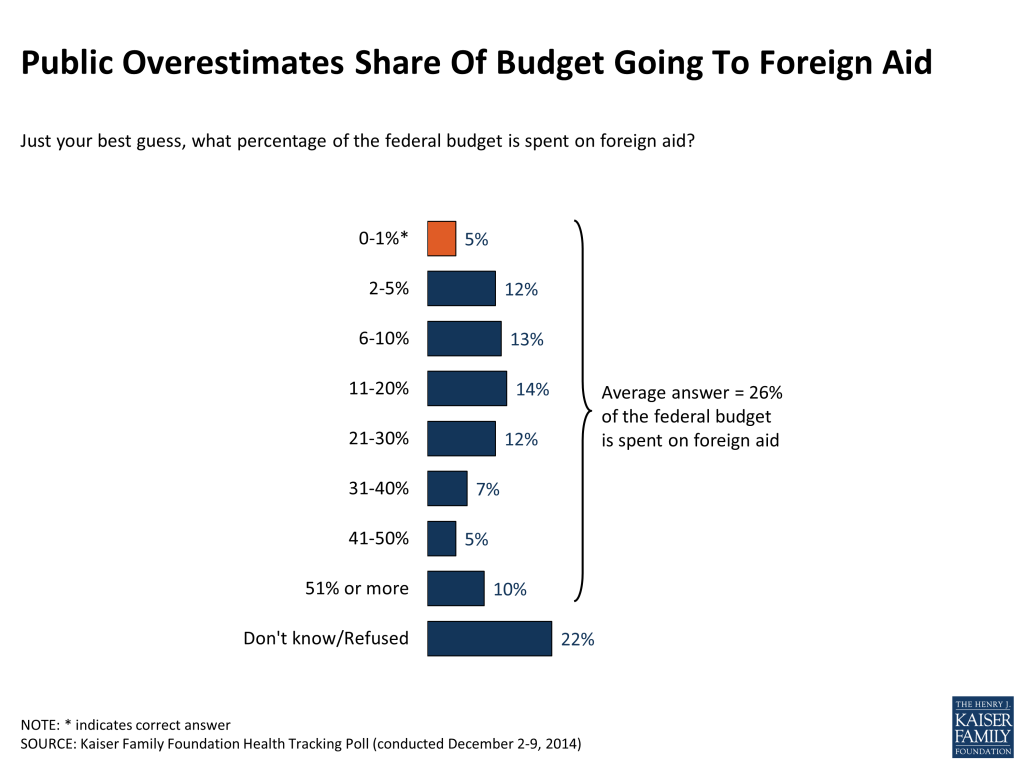
A large majority of the public overestimates the amount of the federal budget that is spent on foreign aid. Similar to past Kaiser polls, just 1 in 20 correctly state that 1 percent or less of the federal budget is spent on foreign aid. About half say it is more than 10 percent of the budget, and, on average, Americans say that spending on foreign aid makes up roughly a quarter of the federal budget.

Figure 1

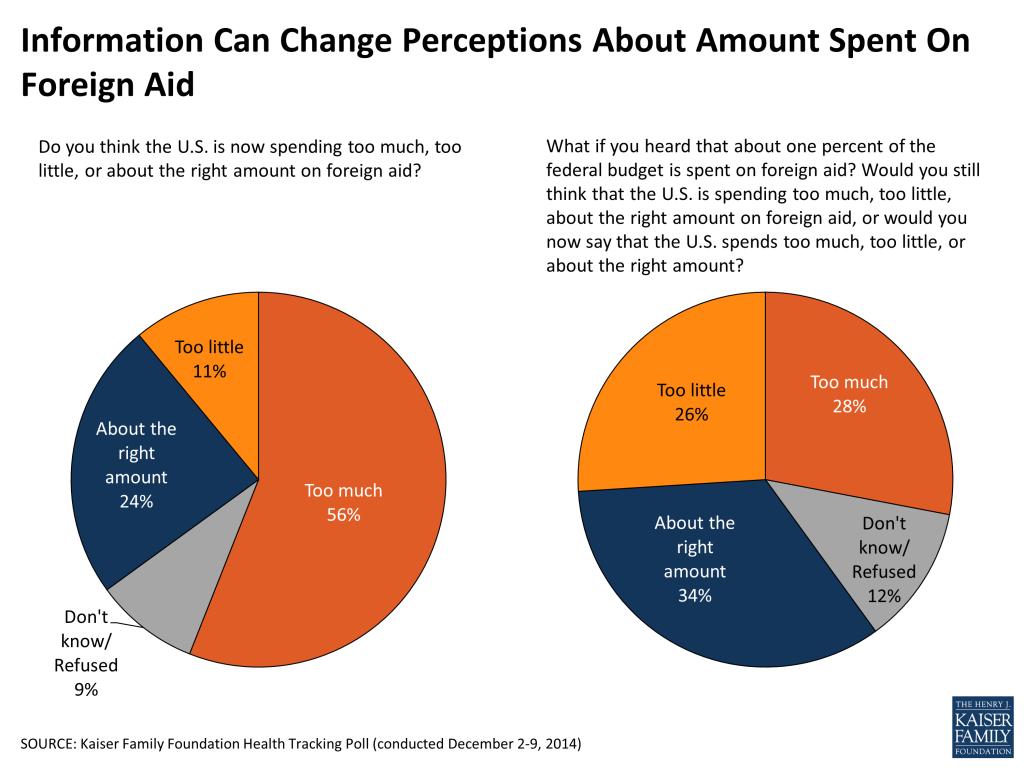
A majority of the public says the U.S. is spending too much on foreign aid, while just about 1 in 10 say too little and a quarter say about the right amount. However, after hearing the factual statement that foreign aid makes up about 1 percent of the federal budget the share saying “too much” drops in half from 56 percent to 28 percent and the share saying “too little” rises from 11 percent to 26 percent.

Figure 2

More Support For Global Health Spending Than For Foreign Aid

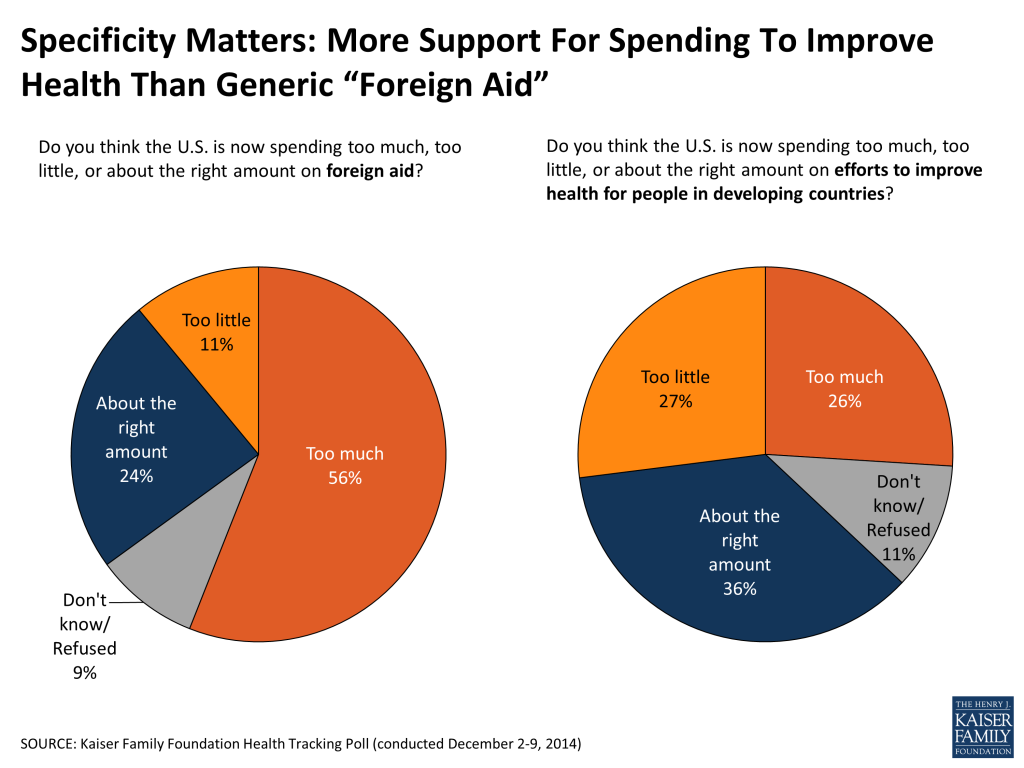
When asked about U.S. spending on global health, the public is more supportive than when asked about spending on foreign aid more generally. About 6 in 10 say the U.S. is now spending too little (27 percent) or about the right amount (36 percent) on efforts to improve health for people in developing countries, and a quarter say the U.S. is spending too much (26 percent).  Over time, opinions on U.S. spending on improving health in developing countries have remained fairly stable.

Figure 3

Partisan Differences In Views On U.S. Global Health Spending

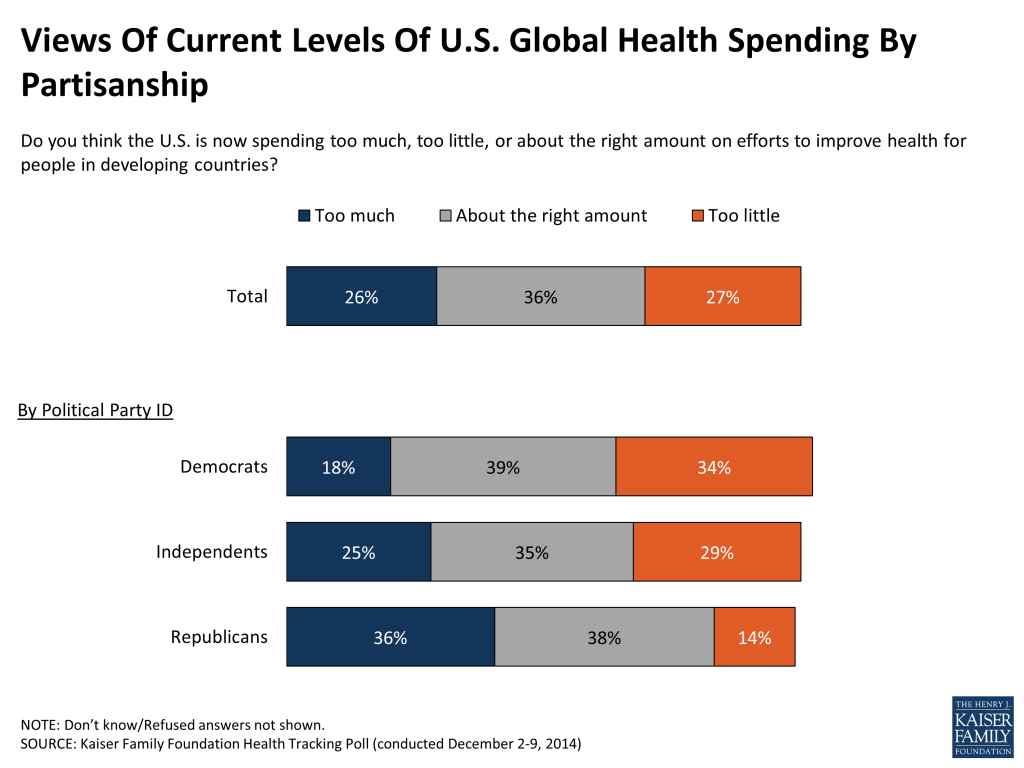
Reflective of overall partisan differences in opinion on the role of government and federal spending, there are differences in views of U. S. spending on global health by political party identification. Across parties, roughly 4 in 10 say the U.S. is spending about the right amount and in no case does a majority say the U.S. is spending too much or too little. Democrats are more likely to say the country is spending too little than too much (34 percent vs. 18 percent), whereas Republicans are more likely to say the country is spending too much than too little (36 percent vs. 14 percent). Independents fall in the middle with roughly equal shares saying the U.S. spends too much (25 percent) or too little (29 percent) on health in developing countries.

Figure 4

Most Say U.S. Global Health Spending Protects Americans’ Health and Improves U.S. Image

About 7 in 10 say that spending money on improving health in developing countries helps protect the health of Americans by preventing the spread of diseases like SARS and Ebola, and nearly 6 in 10 say it helps to improve the image of the U.S. throughout the world.  Over a third say spending on global health helps U.S. national security (37 percent) or the U.S. economy (36 percent). Democrats are more likely than Republicans to say that spending on global health helps in each of these areas, but still over 6 in 10 Republicans say spending helps protect Americans from disease (63 percent).

Percent who say spending money on improving health in developing countries helps…TotalDemocratsIndependentsRepublicans
…protect the health of Americans by preventing the spread of diseases like SARS, bird flu, swine flu, and Ebola69%77%70%63%
…improve the U.S. image around the world57%68%59%46%
…U.S. national security by lessening the threat of terrorism originating in developing countries37%47%36%26%
…the U.S. economy by improving the circumstances of people who can buy more U.S. goods36%44%37%28%

Priorities Within Global Health

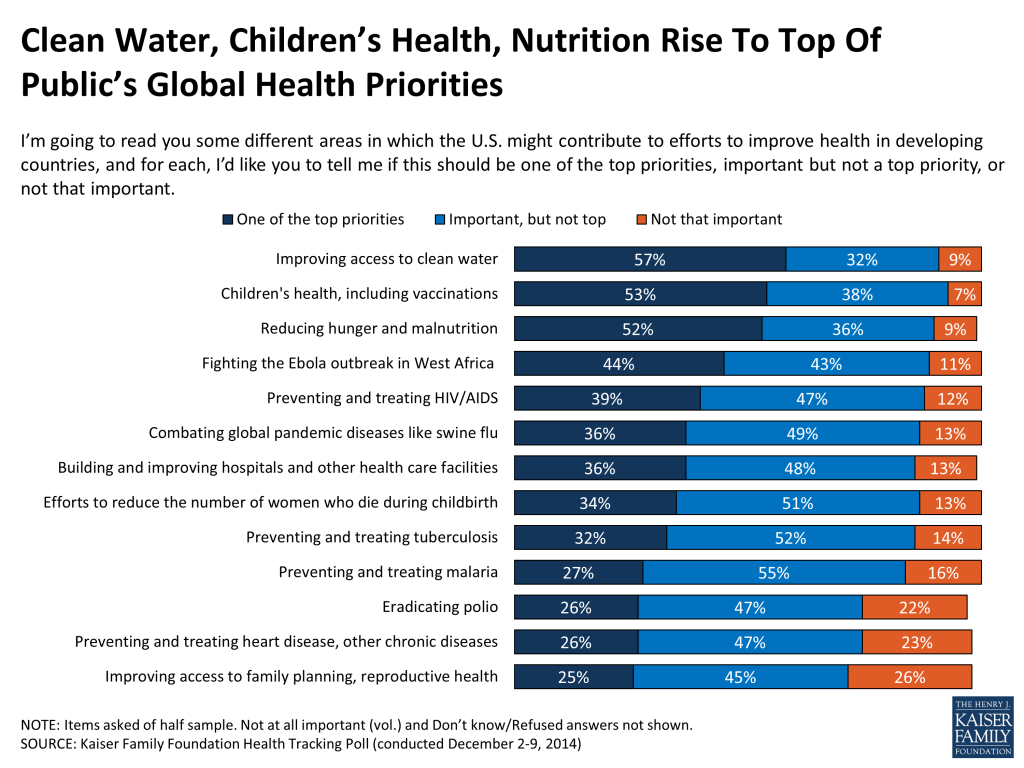
Americans often report that improving health in developing countries is one of many priorities it is important for the U.S. to address around the world.1  When asked which health issues are important for the U.S. to support globally, at least 7 in 10 say each area is important. As for the top priorities, more than half of the public say “one of the top priorities” in U.S. efforts in global health is improving access to clean water (57 percent), children’s health and vaccinations (53 percent) and reducing hunger and malnutrition (52 percent).  Next behind these basic needs is the fight against the Ebola outbreak in West Africa, mentioned as one of the top priorities by over four in ten of the public (44 percent). In December, after this survey was administered, Congress approved $5.4 billion in appropriations for Ebola and global health security efforts internationally and in the United States.2  Some high profile issues are further down the list including malaria, polio, chronic illness and reproductive health.

Figure 5

Ebola Outbreak Captures Public’s Attention, More Now Say It Is Mostly Under Control

Attention To The Ebola Outbreak

Since the fall, the public has remained captivated by news coverage of the Ebola outbreak in West Africa and the diagnosed cases here in the U.S., perhaps contributing to the sentiment that fighting Ebola should be one of our country’s top global health priorities. In fact, the Kaiser Health Policy News Index finds that news coverage of Ebola in West Africa and in the U.S. ranked among the most closely followed news stories of 2014, and were the most closely followed health-related stories by a large margin.

Figure 6

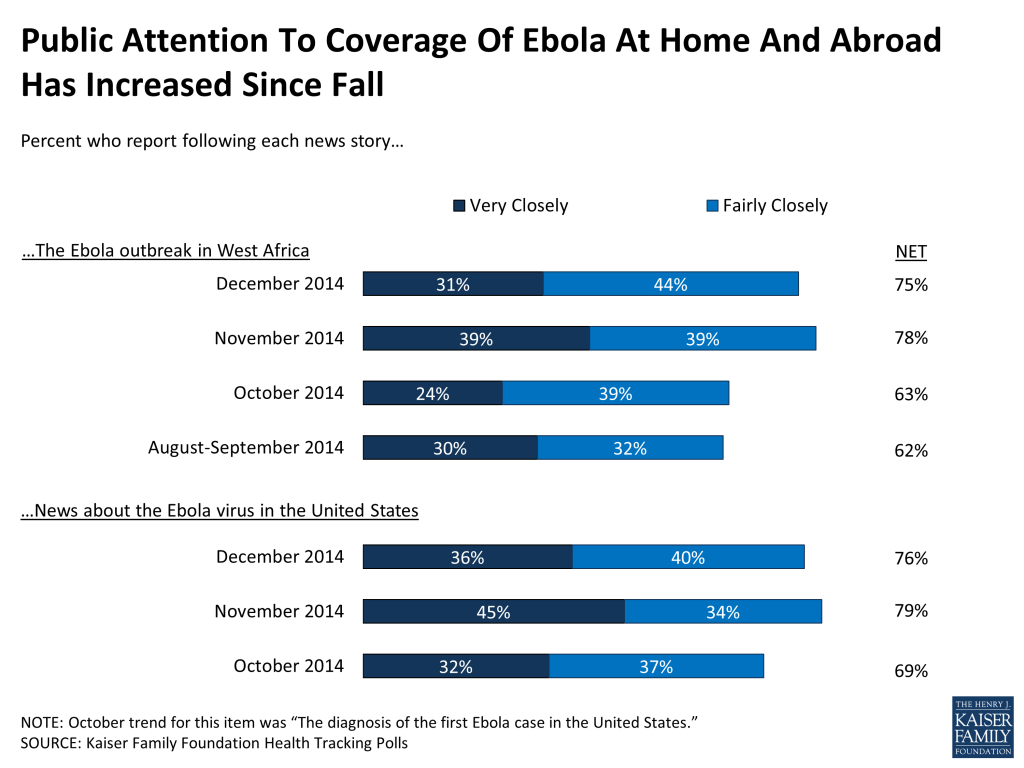
The share of Americans who report following news of the Ebola outbreak in West Africa increased as the outbreak spread. In late summer and early fall, about 6 in 10 Americans reported following news of the outbreak in West Africa closely and about 7 in 10 said they followed news about the virus in the U.S. closely. By late fall, attention to news coverage of Ebola in the U.S. and abroad had grown, with at least three-quarters saying they closely followed the story in November and December.

Figure 7

More Now Say Ebola Outbreak in Africa Is Mostly Under Control

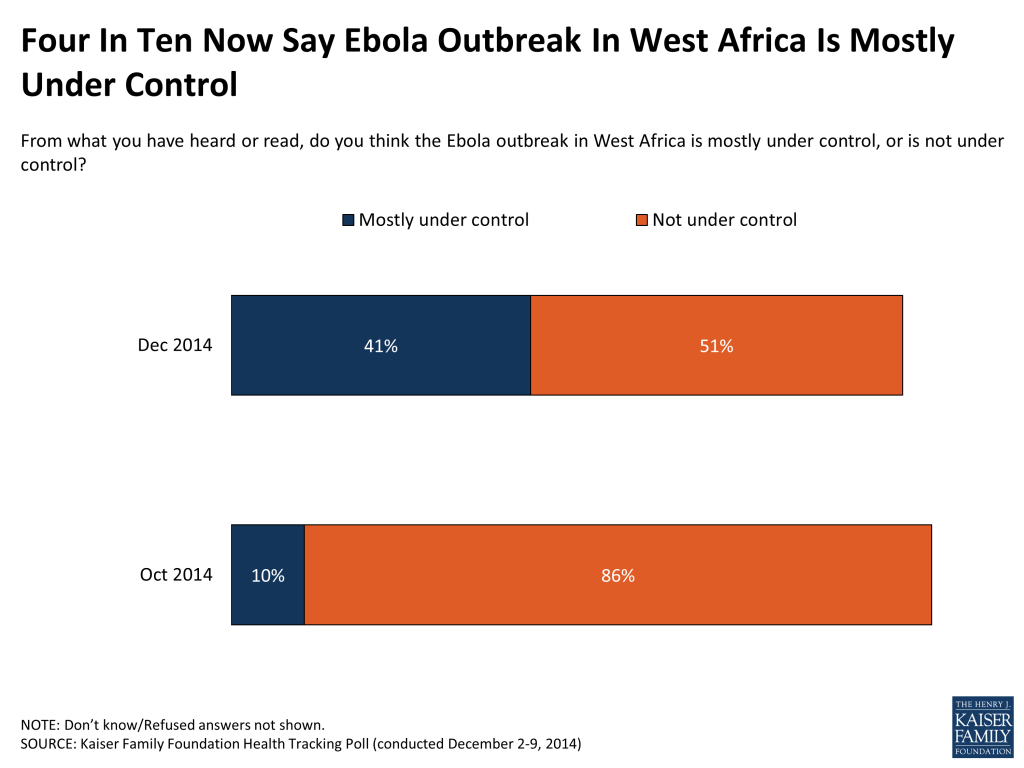
Many Americans now think the outbreak is under control.  Forty-one percent say the epidemic is under control, up significantly from 10 percent in October when Ebola was spreading quickly, and about half (51 percent) say the outbreak is not yet under control.

Figure 8
  1. Kaiser Family Foundation 2013 Survey of Americans on the U.S. Role in Global Health, https://modern.kff.org/global-health-policy/poll-finding/2013-survey-of-americans-on-the-u-s-role-in-global-health/ ↩︎
  2. Kaiser Family Foundation, The U.S. Global Health Budget: Analysis of Appropriations for Fiscal Year 2015, https://modern.kff.org/global-health-policy/issue-brief/the-u-s-global-health-budget-analysis-of-appropriations-for-fiscal-year-2015/   ↩︎

Abortion Coverage in Marketplace Plans, 2015

Published: Jan 21, 2015

Issue Brief

In the negotiations leading to the passage of the Affordable Care Act (ACA), abortion coverage was one of the thorniest and most controversial of many controversial issues. Along with immigrant coverage, it was one of the final issues negotiated before the House vote. Initially, the House passed the Stupak-Pitts Amendment, which would have prohibited any plans in the Marketplaces from receiving federal subsidies if they covered abortion. The final law, however, included a compromise proposed by former Senator Ben Nelson of Nebraska which allows states to ban abortion coverage on their ACA Health Insurance Marketplace and requires plans that offer abortion coverage to segregate funds, assuring that no federal funds are used for abortion coverage. After the ACA was passed, President Obama also signed an executive order to emphasize that no federal funds can be used to pay for abortion beyond the Hyde limitations.

State Policies On Abortion Coverage in Marketplace Plans

In the years following the passage of the ACA, states and insurers have made different choices about abortion coverage and, as a result, the availability of abortion coverage varies considerably. In states that have not banned abortion coverage, plans sold on the Marketplace electing to include abortion coverage must segregate funds consumers pay for abortion coverage from those paid for all other care. By 2017, at least one Multi-State plan that excludes abortion coverage must be available in each Marketplace, so that consumers have an option to enroll in a plan that does not cover abortion.

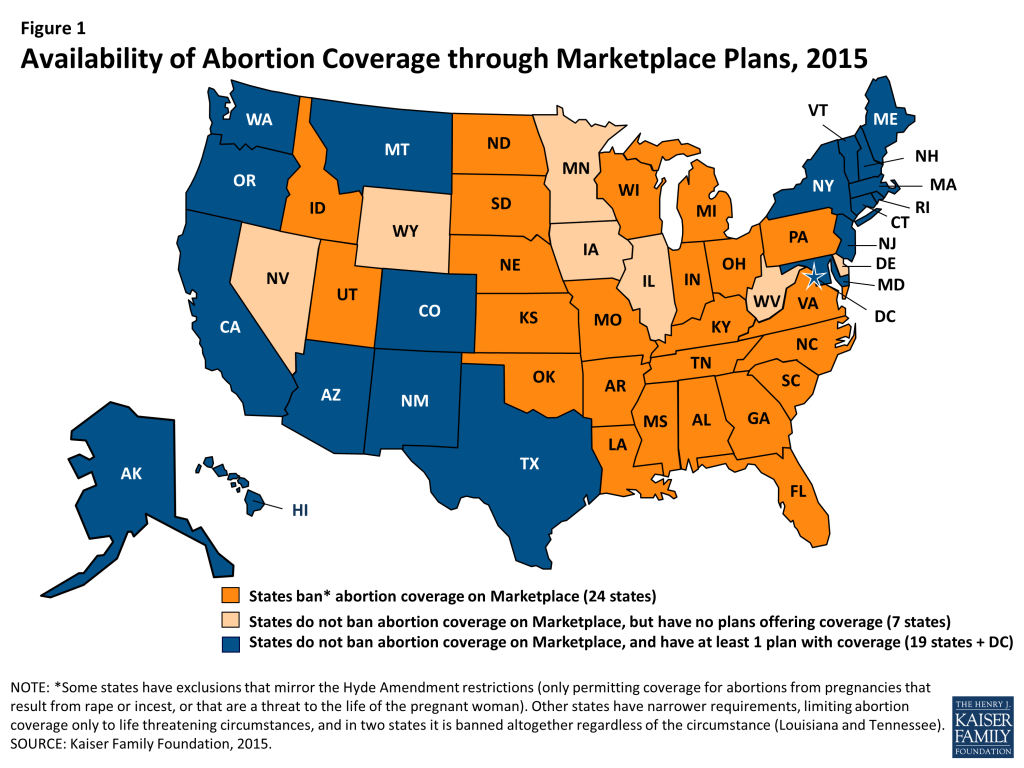
As of January 2015, 24 states1  have enacted laws banning qualified health plans available through the Marketplace from including abortion coverage to varying degrees. Some states have exclusions that mirror the Hyde Amendment restrictions (only permitting coverage for abortions from pregnancies that result from rape or incest, or that are a threat to the life of the pregnant woman). Others have even narrower requirements, limiting abortion coverage only to life threatening circumstances and prohibiting coverage in cases of rape or incest, and in some state it is banned altogether regardless of the circumstance (Louisiana and Tennessee).

Both sides of the abortion debate are unsatisfied with these rules and are carefully watching the law’s implementation. While it is clear that there is no abortion coverage available to women eligible for subsidies in the states that have barred it in the Marketplace, there has been a lot of attention about how difficult it is for consumers in the remaining states to determine whether plans include abortion coverage or not. This lack of transparency was the impetus for a U.S. General Accounting Office review of the availability of abortion coverage in 2014 Marketplace plans.

The report found that among the states without Marketplace abortion coverage bans, in five states (Connecticut, Hawaii, New Jersey, Rhode Island, and Vermont) there were no Multi-State plans offered, and all of the Marketplace plans in those states included abortion coverage. This meant that consumers in those states who wanted to secure a plan without abortion coverage did not have that option. While it is stipulated in the law that at least one Multi-State plan in each Marketplace is required to exclude abortion coverage, there is a transitional period to implement this policy (ending in 2017). In 2015, the Connecticut Marketplace now offers a Multi-State plan that excludes abortion coverage.

The GAO also identified eight states (Delaware, Illinois, Iowa, Minnesota, Nevada, New Hampshire, West Virginia, and Wyoming) that did not have laws barring abortion coverage, yet no Marketplace plans in these states included abortion coverage in 2014.  In reviewing the 2015 plans, KFF found that 7 of these 8 states still do not have any Marketplace plans which include abortion coverage (Figure 1). Abortion coverage is available in New Hampshire in 2015, presumably because the number of Marketplace issuers increased from one to five from 2014 to 2015.

Figure 1: Availability of Abortion Coverage through Marketplace Plans, 2015

As a combined result of the state laws and insurance company choices, women in 31 states do not have access to insurance coverage of abortions through a Marketplace plan – the only place where consumers can receive tax subsidies to help pay for the cost of health insurance premiums

Impact of State Policies and Insurance Carrier Choices on Women’s Access to Coverage

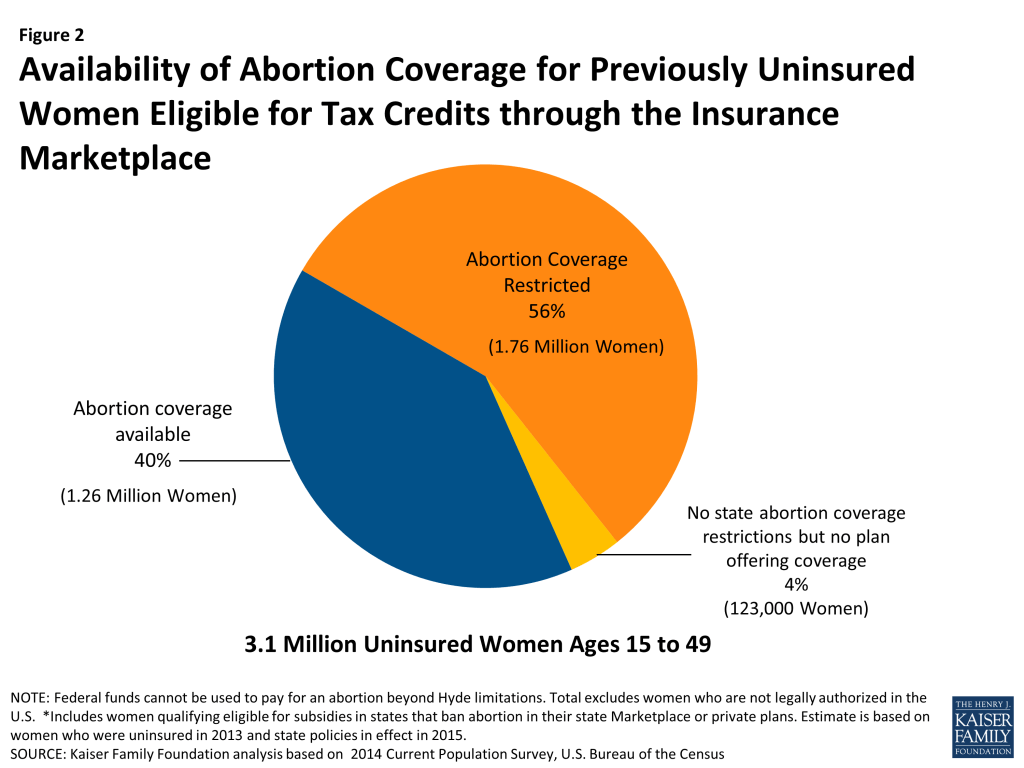
Among the estimated 3.1 million uninsured women of reproductive age who are income eligible for tax credits, 40% (1.26 million) have the option to enroll in a Marketplace plan that offers abortion coverage. Six in ten women (60%), however, do not have the option to obtain abortion coverage through their Marketplace – 56% (1.76 million) live in states that have banned abortion coverage available through Marketplace health plans and 4% (123,000) live in a state without a ban but that does not offer any plans that cover abortion (Figure 2).  For women who seek abortions, the absence of this coverage can result in sizable out-of-pocket costs. A clinic-based abortion at 10 weeks’ gestation is estimated to cost between $400 and $550, whereas an abortion at 20-21 weeks’ gestation is estimated to cost $1,100-$1,650 or more.2 

Figure 2: Availability of Abortion Coverage for Previously Uninsured Women Eligible for Tax Credits through the Insurance Marketplace

While the reasons why plans in these states have opted to exclude abortion coverage are not known, it is possible that the complexity of the requirements specific only to abortion coverage could be a deterrent to the plans. This was raised as a possible outcome during the pre-ACA abortion coverage debate. The Nelson Amendment included in the final law, requires plans to segregate funds used for abortion coverage, effectively collecting an additional fee for this coverage, and adding a layer of administrative work. Plans that choose to include abortion coverage are also subject to additional reporting standards and audit requirements. This might be the case in West Virginia, where the same insurance carrier that does not offer abortion coverage for individual policies is, however, including abortion coverage in the group policies sold to small firms through the small group marketplace plans, where the accounting rules and reporting requirements do not apply.

As the debate on abortion continues, both sides remain dissatisfied with how the law is being implemented with regard to abortion coverage. Given the polarized nature of the abortion debate in this country, the issue of access to abortion coverage will continue to be a focus of policy at both the state and national level, and increasingly shaped by choices made not just by states and federal policy makers but also by health insurers.

Endnotes

  1. Five of these states enacted laws prior to the passage of the ACA that restrict abortion coverage in private plans. Arizona law restricts abortion coverage on a State-based marketplace. However, because Arizona has not created a State-based Marketplace, this law does not limit abortion coverage for plans sold through the Federally Facilitated Marketplace in which Arizona‘s Qualified Health Plans are sold. ↩︎
  2. Jones, R and K Kooistra. (2011). Abortion Incidence and Access to Services in the United States, 2008. Perspectives on Sexual and Reproductive Health 43(1), 41-50. ↩︎
Tapping Nurse Practitioners to Meet Rising Demand for Primary Care

Authors: Amanda Van Vleet and Julia Paradise
Published: Jan 20, 2015

Issue Brief

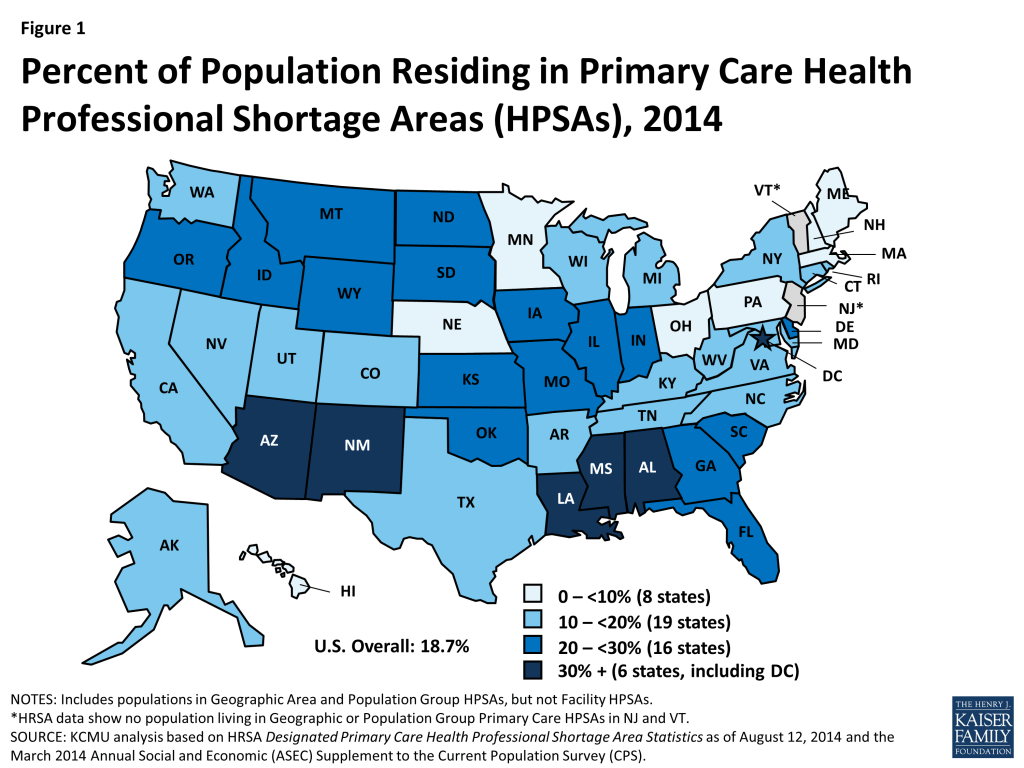
Over 58 million Americans reside in geographic areas or belong to population groups that are considered primary care shortage areas. In these areas, known officially as primary care Health Professional Shortage Areas (HPSAs), the supply of primary care physicians relative to the population falls below federally defined standards.1  The proportion of Americans living in HPSAs varies widely by state, from 1.4% (Nebraska) to 57.3% (Mississippi), but in almost half the states, it is at least 20%, including six states (including DC) where it exceeds 30% (Figure 1).

Figure 1: Percent of Population Residing in Primary Care Health Professional Shortage Areas (HPSAs), 2014

The demand for primary care is projected to rise over the next five years, due largely to population growth and aging, and to a smaller extent, to expanded health insurance.2  The Health Resources and Services Administration (HRSA), the federal agency focused on improving access to care and strengthening the health care workforce, projects a shortage of 20,400 primary care physicians in 2020, and other experts, too, have projected a large shortfall in the coming years.3  4  However, a recent Institute of Medicine (IOM) report on shaping the health care workforce for the future noted that such projections of primary care physician shortages are generally based on traditional health care delivery models and do not consider the potential of an expanded primary care role for physician assistants and advanced-practice nurses, redesign of health care, telehealth, and other innovations.5  This brief focuses on the untapped potential of one type of advanced-practice nurses – nurse practitioners – to increase access to primary care.

In 2012, about 127,000 NPs were providing patient care in the U.S., roughly half of whom – around 60,400 – were practicing in primary care settings.6  NPs are registered nurses who have completed Master’s degrees or higher level nursing degrees. Close to  90% of all NPs are prepared in primary care.7  Primary care NPs are significantly more likely than primary care physicians to practice in urban and rural areas, provide care in a wider range of community settings, and serve a high proportion of uninsured patients and other vulnerable populations.8  Studies show that NPs can manage 80-90% of care provided by primary care physicians.9  In addition, evidence from a substantial research literature shows that primary care outcomes, including disease-specific physiologic measures, improvement in pathological condition, reduction of symptoms, mortality, hospitalization and other utilization measures, and patient satisfaction, are comparable between patients served by NPs and patients served by physicians.10 

The growing number and effective integration of NPs in our health care system could help alleviate pressures on primary care capacity. It takes much less time to produce new NPs than new physicians – an average of six years of education and training, compared to 11 or 12 years for physicians, including education and residency.11  HRSA projects a 30% increase in the supply of primary care NPs over the period 2010-2020, and estimates that projected increases in NPs and physician assistants (PAs), whose numbers are also projected to grow, could potentially reduce the expected shortage of primary care providers in 2020 by about two-thirds, to 6,400, if they are effectively integrated into the health care delivery system.12 

Box: Nurse Practitioner Scope of Practice

Full Practice: State law provides for nurse practitioners (NPs) to evaluate, diagnose, treat, and prescribe under the exclusive licensure authority of the state board of nursing. This is the model recommended by the IOM.Reduced Practice: State requires NPs to have a regulated collaborative agreement with a physician in order to provide patient care, and limits NPs engagement in at least one element of NP practice.Restricted Practice: State requires supervision, delegation, or team-management by a physician in order for NPs to provide patient care, and limits NP engagement in at least one element of NP practice.

SOURCE: American Association of Nurse Practitioners, 2014 (Adapted)

However, state legislative and regulatory barriers prevent NPs in many states from practicing to their full potential. NP practice is regulated largely by the states through licensure laws and policy on “scope of practice” and prescriptive authority. Scope of practice refers to the range of services that NPs are permitted by their state to provide, and the terms on which they may provide them (Box).

The ACA included investments to expand the role of NPs in providing primary care. The law authorized up to $50 million for nurse-managed health clinics, and in 2012, the Department of Health and Human Services awarded $15 million in grants to support 10 such clinics over three years, expected to expand access to primary care and support training for more than 900 advanced-practice nurses. HHS has also used ACA funds to make grants to nursing schools to increase full-time enrollment in NP and nurse midwife programs.13 

In some states, NPs have “full practice authority,” which means that they can evaluate, diagnose, and initiate and manage the treatment of patients, including prescribing medication, under the exclusive licensure authority of the state board of nursing. NPs in full practice states consult and refer patients to physicians and other providers based on patient needs, but the state does not require physician supervision of their practice. Other states permit “reduced” or “restricted practice,” requiring different degrees of physician involvement in NP practice. NPs in these states also face limits on their ability to diagnose, treat, and/or prescribe medication for patients.

The IOM has recommended that NPs be able to practice to the full extent of their education and training. The IOM’s first recommendation in its 2011 report, The Future of Nursing: Leading Change, Advancing Health, was “Remove scope-of-practice barriers.”14  The IOM report observed, “… what nurse practitioners are able to do once they graduate varies widely for reasons that are related not to their ability, education or training, or safety concerns, but to the political decisions of the state in which they work.” The IOM called for a review of state regulations by the Federal Trade Commission and the Department of Justice to identify those with unjustified anticompetitive effects.

What is the environment for NPs today?

Fewer than half the states permit NPs full practice authority. Today, NPs in 20 states (including DC) have full practice authority (Figure 2). Nineteen states require NPs to have a formal, written collaborative agreement with a physician in order to provide care, and these states restrict NP practice in at least one domain (e.g., treatment, prescribing). In the remaining 12 states, NP practice is even more restricted. These states require physician supervision or delegation for NPs to provide care.

Figure 2: Nurse Practitioner State Practice Environment, 2014

States in the Pacific Northwest, the Mountain States, and states in upper New England, which generally have more limited primary care physician supply and large rural areas, are more likely to permit broader scope of practice for NPs. Many states in the South, even though they also have large rural areas, are among the most restrictive states.

Thus far, eight of the 22 states where at least 20% of residents live in a primary care HPSA have extended full practice authority to NPs. Mapping states’ policies on NP practice authority to the share of their populations that live in primary care HPSAs reveals interesting information and opportunities regarding primary care capacity. Currently, eight of the 22 states in which at least 1 in 5 residents live in a primary care shortage area grant NPs full practice authority (Table). However, in the other 14 states with primary care shortages on this scale, NP practice authority is either reduced (9) or restricted (5).

Medicaid fee-for-service programs cover services provided by pediatric and family NPs and pay them directly, but NPs’ situation is more complicated in Medicaid managed care. Some states pay NPs the same Medicaid fee-for-service (FFS) rates they pay physicians, but at least 20 states pay them at a lower rate, ranging from 75% to 95% of the physician fee for the same service.15  In the Medicaid managed care arena, various barriers impede the full deployment of NPs in many states. First, most but not all states (44) recognize NPs as primary care providers (PCPs) under state law or administrative policy.16  These policies affect

Table: NP Practice Authority in States with Highest (%) Primary Care HPSA Populations

State(n=22)

State Population in Primary Care HPSAs (%)NP Practice Authority
Mississippi57.3%Reduced
Louisiana42.3%Reduced
New Mexico41.2%Full
Arizona40.5%Full
Alabama37.1%Reduced
District of Columbia36.0%Full
Idaho29.3%Full
Missouri27.1%Restricted
Illinois26.5%Reduced
South Carolina26.4%Restricted
Montana25.4%Full
Oklahoma25.2%Restricted
Wyoming25.1%Full
North Dakota25.1%Reduced
Indiana25.1%Reduced
Florida23.2%Restricted
Kansas22.8%Reduced
Oregon22.7%Full
Delaware22.4%Reduced
South Dakota21.3%Reduced
Iowa20.8%Full
Georgia20.1%Restricted

the role NPs can play in Medicaid, as well as more broadly. Second, while federal Medicaid law specifically permits states to recognize pediatric and family NPs as PCPs in their Medicaid primary care case management (PCCM) programs, it does not require them to do so, leaving this matter to state discretion. Third, the law is silent regarding the inclusion of NPs in Medicaid managed care organizations’ (MCO) provider panels. As a result, whether NPs can be designated PCPs in MCOs – which now serve more than half of all Medicaid beneficiaries – depends on states’ policy choices and individual MCO credentialing policies. Some state Medicaid programs enroll NPs as PCPs, while others do not, and few states require Medicaid plans to empanel NPs.

Medicare provides for direct payment to NPs for their services. Medicare generally pays NPs 85% of the rate a physician providing the same service would get from Medicare. Under the ACA, NPs are included among the primary care providers eligible to receive a quarterly 10% Medicare bonus payment for primary care services through 2015.

One-quarter of HMOs do not recognize NPs as PCPs in their provider panels. According to a recent national survey of health maintenance organizations (HMOs), including the largest ones in each state, almost 75% of them credential NPs as PCPs, a substantial increase over previous years.17  However, about one in four HMOs do not recognize NPs as PCPs.

More states are taking action to expand the role of NPs in primary care. In 2013, more than 20 states took legislative or regulatory action favorable to NPs’ ability to practice more fully.18  These actions included steps to expand NPs’ practice authority, improvements in NP reimbursement, and other measures. Nevada and Rhode Island joined the states that grant NPs full practice authority. Eight states expanded NPs’ prescriptive authority. Oregon became the first state to mandate that private insurers pay NPs in independent practice the same rates they pay physicians for the same services.

Looking Ahead

Rising demand for primary care, attributable to population growth and aging and expanded health insurance coverage under the ACA, is increasing already sharp strains on access to primary care in our health system. In the context of a broader set of strategies to shape a health care workforce and delivery systems that meet the needs of all Americans, optimizing our existing primary care capacity by removing barriers to NPs’ full deployment is a step that states, public and private health insurance programs, and managed care plans are in a position to take in the immediate term. Fuller participation of NPs in primary care might help, in particular, to increase access in underserved rural and urban areas. Also, NPs can play an integral role in team-based and patient-centered models of care, such as medical homes, Medicaid health homes, and Accountable Care Organizations (ACOs), which are aimed at improving care especially for people with chronic and complex health care needs. Delivery system innovations along these lines, underway in pockets around the country, may provide new evidence about effective approaches to organizing care, ensuring access, and improving outcomes for patients.

Endnotes

  1. Designated Health Professional Shortage Area Statistics, Bureau of Clinician Recruitment and Service, Health Resources and Services Administration, U.S. Department of Health & Human Services, 2014, http://ersrs.hrsa.gov/ReportServer/Pages/ReportViewer.aspx?/HGDW_Reports/BCD_HPSA/BCD_HPSA_SCR50_Smry_HTML; Primary Medical Care HPSA Designation Overview, Health Resources and Services Administration, U.S. Department of Health & Human Services, 2014), http://bhpr.hrsa.gov/shortage/hpsas/designationcriteria/primarycarehpsaoverview.html ↩︎
  2. Projecting the Supply and Demand for Primary Care Practitioners Through 2020, Health Resources and Services Administration, National Center for Health Workforce, U.S. Department of Health and Human Services, Analysis, 2013, http://bhpr.hrsa.gov/healthworkforce/supplydemand/usworkforce/primarycare/ ↩︎
  3. Projecting the Supply and Demand for Primary Care Practitioners Through 2020, Health Resources and Services Administration, National Center for Health Workforce Analysis, U.S. Department of Health and Human Services, , 2013), http://bhpr.hrsa.gov/healthworkforce/supplydemand/usworkforce/primarycare/ ↩︎
  4. Physician Shortages to Worsen Without Increases in Residency Training, Association of American Medical Colleges, , https://www.aamc.org/download/153160/data/physician_shortages_to_worsen_without_increases_in_residency_tr.pdf; Stephen Petterson et al., “Projecting US Primary Care Physician Workforce Needs: 2010-2025,” Annals of Family Medicine 10 (6), November/December 2012, http://www.annfammed.org/content/10/6/503.full.pdf+html; “Pediatrician Workforce Policy Statement,” Committee on Pediatric Workforce, American Academy of Pediatrics, Pediatrics 132 (2), August 2013, http://pediatrics.aappublications.org/content/early/2013/07/23/peds.2013-1517.full.pdf+html ↩︎
  5. Graduate Medical Education That Meets the Nation’s Health Care Needs, Institute of Medicine, 2014, http://www.nap.edu/catalog/18754/graduate-medical-education-that-meets-the-nations-health-needs ↩︎
  6. Highlights from the 2012 National Sample Survey of Nurse Practitioners, Health Resources and Services Administration, Bureau of Health Professions, National Center for Health Workforce Analysis, 2014, http://bhpr.hrsa.gov/healthworkforce/supplydemand/nursing/nursepractitionersurvey/npsurveyhighlights.pdf ↩︎
  7. NP Fact Sheet, American Association of Nurse Practitioners, January 2014, http://www.aanp.org/all-about-nps/np-fact-sheet ↩︎
  8. Peter Buerhaus et al., “Practice Characteristics of Primary Care Nurse Practitioners and Physicians,” Nursing Outlook, August 2014, http://www.nursingoutlook.org/article/S0029-6554(14)00188-2/abstract ↩︎
  9. Mary Mundinger, “Advanced-Practice Nursing — Good Medicine for Physicians?” New England Journal of Medicine 330(3), January 20, 1994, http://www.nejm.org/doi/full/10.1056/NEJM199401203300314 ↩︎
  10. Mary Naylor and Ellen Kurtzman, “The Role of Nurse Practitioners in Reinventing Primary Care,” Health Affairs 29 (5), May 2010, http://content.healthaffairs.org/content/29/5/893.abstract; Miranda Laurant et al., “The Impact of Nonphysician Clinicians: Do They Improve the Quality and Cost-Effectiveness of Health Care Services?” Medical Care Research and Review 66 (6) Supplement, December 2009, http://www.ncbi.nlm.nih.gov/pubmed/19880672; Mary Mundinger et al., “Primary Care Outcomes in Patients Treated by Nurse Practitioners or Physicians,” Journal of the American Medical Association 283 (1), January 2000, http://jama.jamanetwork.com/article.aspx?articleid=192259; Sue Horrocks et al., “Systematic Review of Whether Nurse Practitioners Working in Primary Care Can Provide Equivalent Care to Doctors,” BMJ 324, April 2002, http://www.bmj.com/content/324/7341/819; Miranda Laurant et al., “Substitution of Doctors by Nurses in Primary Care” (Review), Cochrane Database of Systematic Reviews 18 (2), April 2005, http://www.ncbi.nlm.nih.gov/pubmed/15846614; Kevin Grumbach et al., “Who is Caring for the Underserved? A Comparison of Primary Care Physicians and Nonphysician Clinicians in California and Washington,” Annals of Family Medicine 1 (2) July 2003, http://www.ncbi.nlm.nih.gov/pmc/articles/PMC1466573/; Ira Wilson et al., “Quality of HIV Care Provided by Nurse Practitioners, Physician Assistants, and Physicians,” Annals of Internal Medicine 143 (10), November 2005, http://www.ncbi.nlm.nih.gov/pubmed/16287794 ↩︎
  11. Amanda Cassidy, “Nurse Practitioners and Primary Care (Updated),” Health Affairs 33 (12), May 2013, http://www.healthaffairs.org/healthpolicybriefs/brief.php?brief_id=79 ↩︎
  12. Projecting the Supply and Demand for Primary Care Practitioners Through 2020. op. cit. ↩︎
  13. NP Scope of Practice Laws, Barton Associates (Sources: American Association of Nurse Practitioners and the 2014 Pearson Report), November 2014, http://www.bartonassociates.com/nurse-practitioners/nurse-practitioner-scope-of-practice-laws/ ↩︎
  14. The Future of Nursing: Leading Change, Advancing Health, Institute of Medicine, 2011, http://www.nap.edu/catalog/12956/the-future-of-nursing-leading-change-advancing-health ↩︎
  15. Medicaid Benefits: Nurse Practitioner Services, 2012, State Health Facts, Kaiser Family Foundation, https://modern.kff.org/medicaid/state-indicator/nurse-practitioner-services/ ↩︎
  16. NP Scope of Practice Laws, Barton Associates (Sources: American Association of Nurse Practitioners and the 2014 Pearson Report), data current as of November 2014, http://www.bartonassociates.com/nurse-practitioners/nurse-practitioner-scope-of-practice-laws/ ↩︎
  17. Tine Hansen-Turton et al., “Are Managed Care Organizations in the United States Impeding the Delivery of Primary Care by Nurse Practitioners? A 2012 Update on Managed Care Organization Credentialing and Reimbursement Practices,” Population Management 16 (5), October 2013, http://www.nncc.us/site/images/pdf/NNCC2011ManagedCareReimbursementStudy.pdf ↩︎
  18. Susanne Phillips, “26th Annual Legislative Update: Progress for APRN Authority to Practice,” The Nurse Practitioner 39, 1 (January 2014): 29-52, http://journals.lww.com/tnpj/Fulltext/2014/01000/26th_Annual_Legislative_Update__Progress_for_APRN.7.aspx   ↩︎
News Release

New Kaiser 50-State Survey Provides Data on States’ Medicaid and Children’s Health Insurance Program Eligibility Levels and Enrollment, Renewal and Cost-Sharing Policies as of January 2015

Published: Jan 20, 2015

A new survey from the Kaiser Family Foundation provides a comprehensive look at where states stand with their Medicaid and Children’s Health Insurance Program (CHIP) eligibility levels and enrollment, renewal and cost-sharing policies as of January 2015, one year into implementation of the Affordable Care Act’s major coverage provisions.

The 13th annual survey, conducted by the Foundation’s Kaiser Commission on Medicaid and the Uninsured and Georgetown University’s Center for Children and Families, finds that states across the country have made it easier to apply for and enroll in the Medicaid program, updating their processes to reflect ACA requirements for a more automated, data-driven, and seamless experience for individuals.

Key findings include:

  • Online Medicaid applications are available in all states, except Tennessee, and the majority of states accept Medicaid applications by phone. States also have established policies that seek to rely on electronic data sources and minimize paperwork burdens to verify information of applicants.
  • States still have continued transition work to do under the ACA , such as enhancing information technology systems, implementing automated renewal processes and improving coordination between Medicaid and the Marketplaces.
  • As of Jan. 1, 30 states charge premiums or enrollment fees and 27 states charge cost-sharing for children. These charges are primarily in CHIP, reflecting the relatively higher family incomes of children covered by the program compared to Medicaid. No states charge premiums for parents or adults newly eligible under the ACA in traditional Medicaid, but most charge nominal cost-sharing for both adult groups.

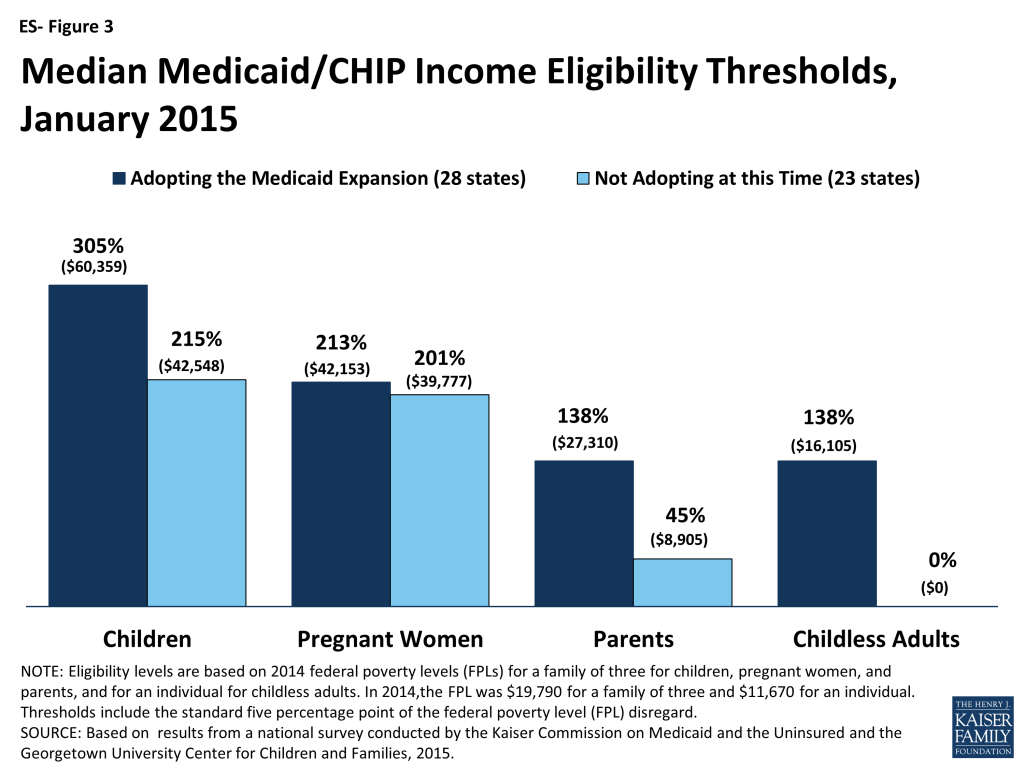
The survey also provides 2015 eligibility levels in all 50 states and the District of Columbia for children, pregnant women, and non-disabled adults in Medicaid and CHIP. The data document that the 28 states that adopted the ACA Medicaid expansion extend eligibility to parents and other adults up to 138 percent of the federal poverty level ($27,310 for a family of three or $16,105 for an individual), with two of these states extending eligibility for adults to higher levels. Among the 23 states not adopting the expansion at this time, 19 states have eligibility levels for parents that are below poverty and only one state provides Medicaid coverage to childless adults. Eligibility for children is at or above 200 percent of the federal poverty level through Medicaid and CHIP in all but two states and 33 states cover pregnant women at those income levels or higher.

The full report, Modern Era Medicaid: Findings from a 50-State Survey of Eligibility, Enrollment, Renewal, and Cost-Sharing Policies in Medicaid and CHIP as of January 2015, can be found online at kff.org. A public web briefing to discuss the key findings and take questions will be held today at 1 p.m. ET; register here to attend the briefing.

Modern Era Medicaid: Findings from a 50-State Survey of Eligibility, Enrollment, Renewal, and Cost-Sharing Policies in Medicaid and CHIP as of January 2015

Authors: Tricia Brooks, Joe Touschner, Samantha Artiga, Jessica Stephens, and Alexandra Gates
Published: Jan 20, 2015

Executive Summary

The Affordable Care Act (ACA) has contributed to a significant transformation of Medicaid, broadening it as the base of coverage for the low-income population and accelerating state efforts to move from antiquated, paper-driven enrollment processes to a new modernized enrollment experience for individuals. January 1, 2015 marks the first anniversary of key ACA Medicaid provisions, including the Medicaid expansion to low-income adults and new rules for streamlined enrollment and renewal processes that coordinate across insurance affordability programs, including Medicaid, the Children’s Health Insurance Program (CHIP), and the Health Insurance Marketplaces. Throughout 2014, states continued to develop their data-driven systems and re-engineer their business practices to fulfill the ACA’s vision. This 13th annual 50-state survey of Medicaid and CHIP eligibility, enrollment, renewal, and cost-sharing policies as of January 2015 provides a snapshot of state Medicaid and CHIP policies in place one year into the post-ACA era.

Eligibility for Adults, Children, and Pregnant Women

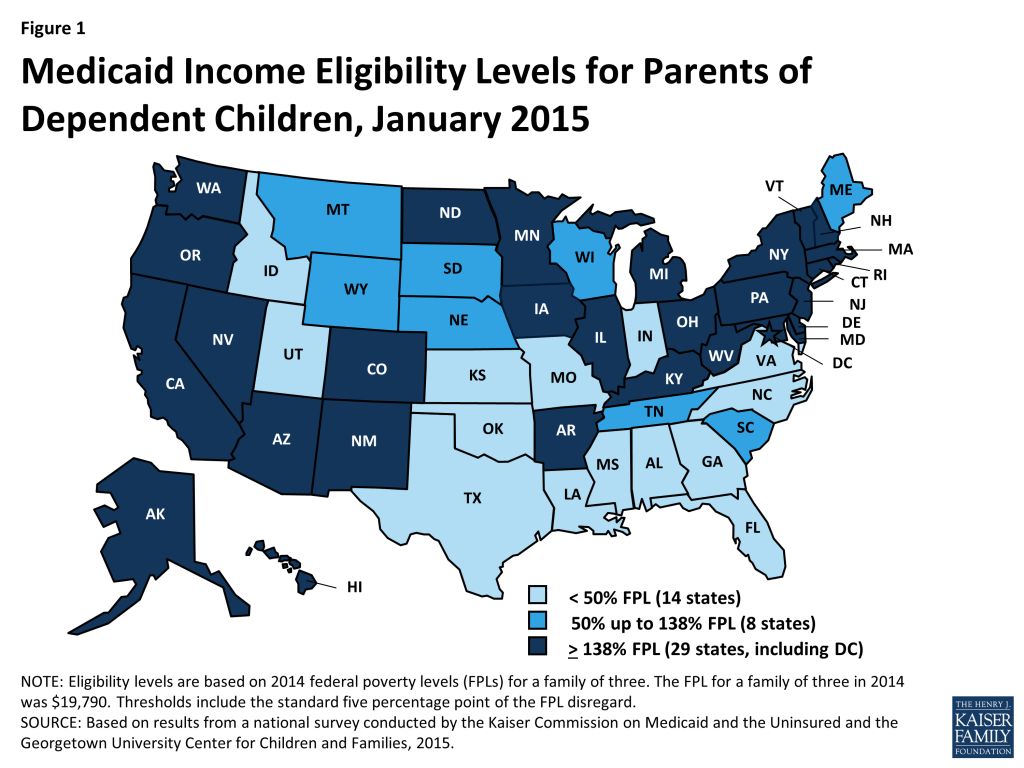
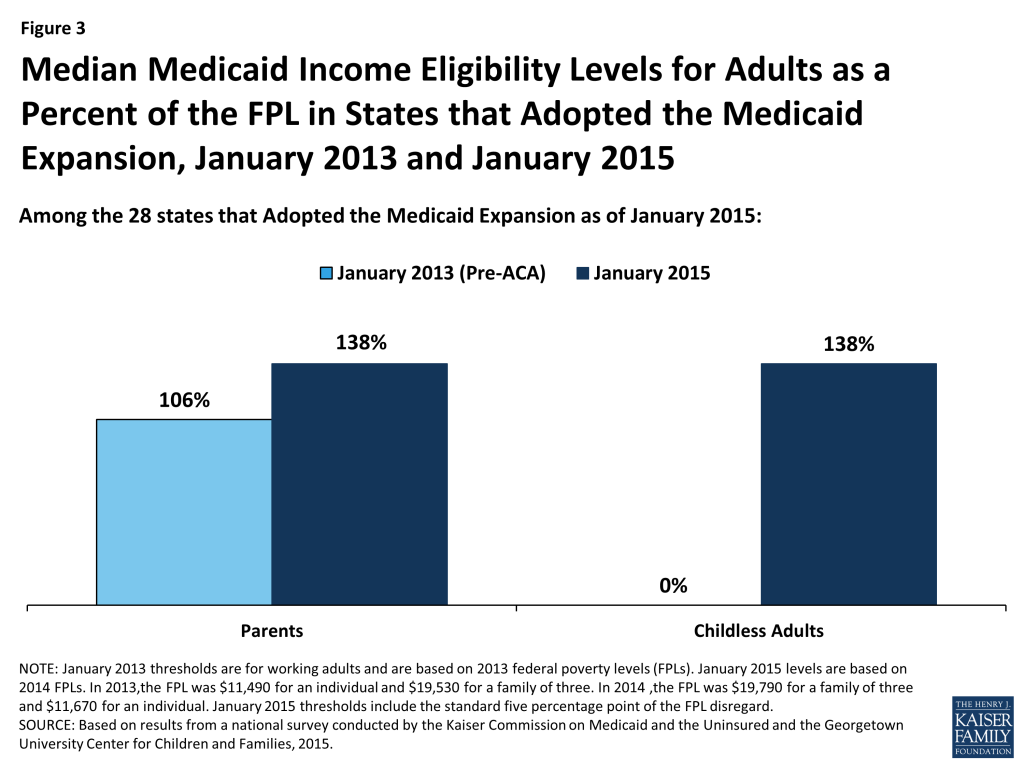
As of January 1, 2015, 28 states set their Medicaid income eligibility levels for parents and other adults to at least 138 percent of the federal poverty level (FPL), reflecting their implementation of the ACA Medicaid expansion. This count includes New Hampshire and Pennsylvania, which made decisions during 2014 to expand. Among these states, median income eligibility levels for adults have increased compared to pre-ACA levels, particularly for childless adults who were historically excluded from the Medicaid program (ES-Figure 1). There is no deadline for states to expand Medicaid, and additional states may decide to expand in the coming year.

Figure ES-1: Median Medicaid Income Eligibility Levels for Adults as a Percent of the FPL in States that Adopted the Medicaid Expansion, January 2013 and January 2015

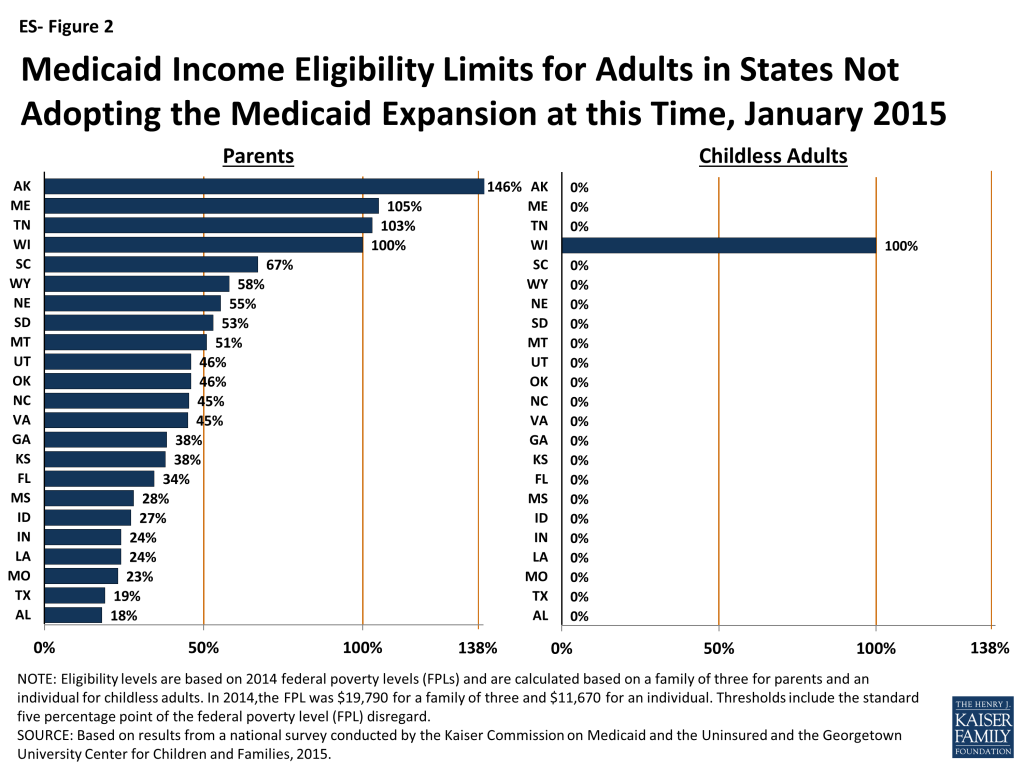
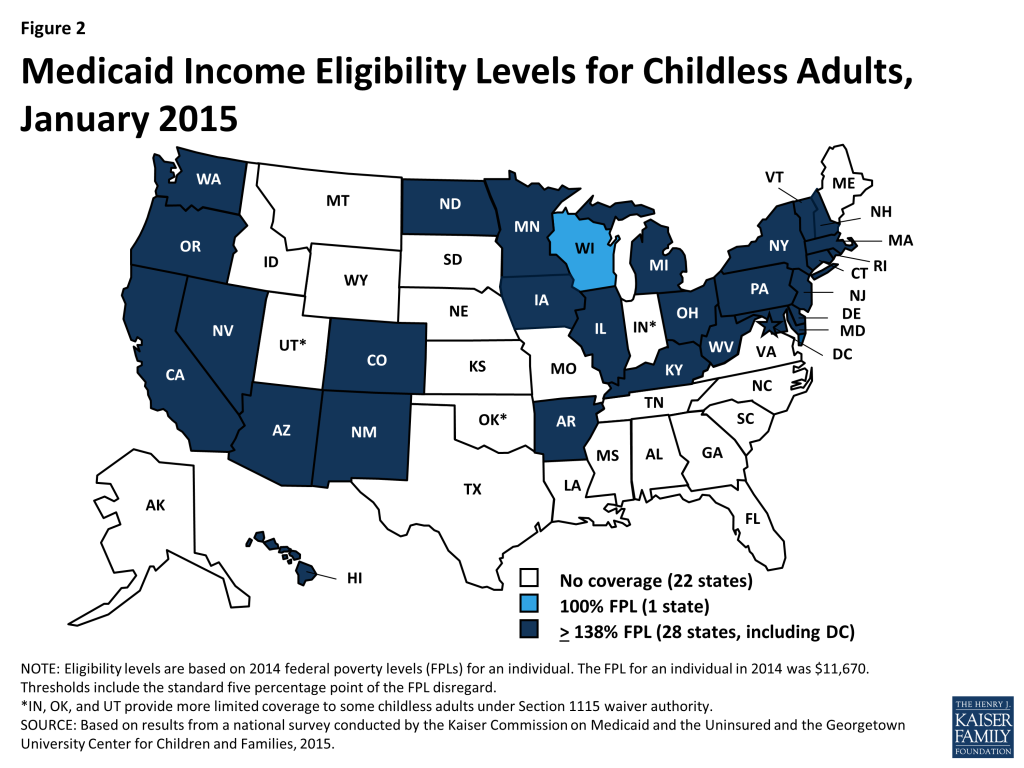
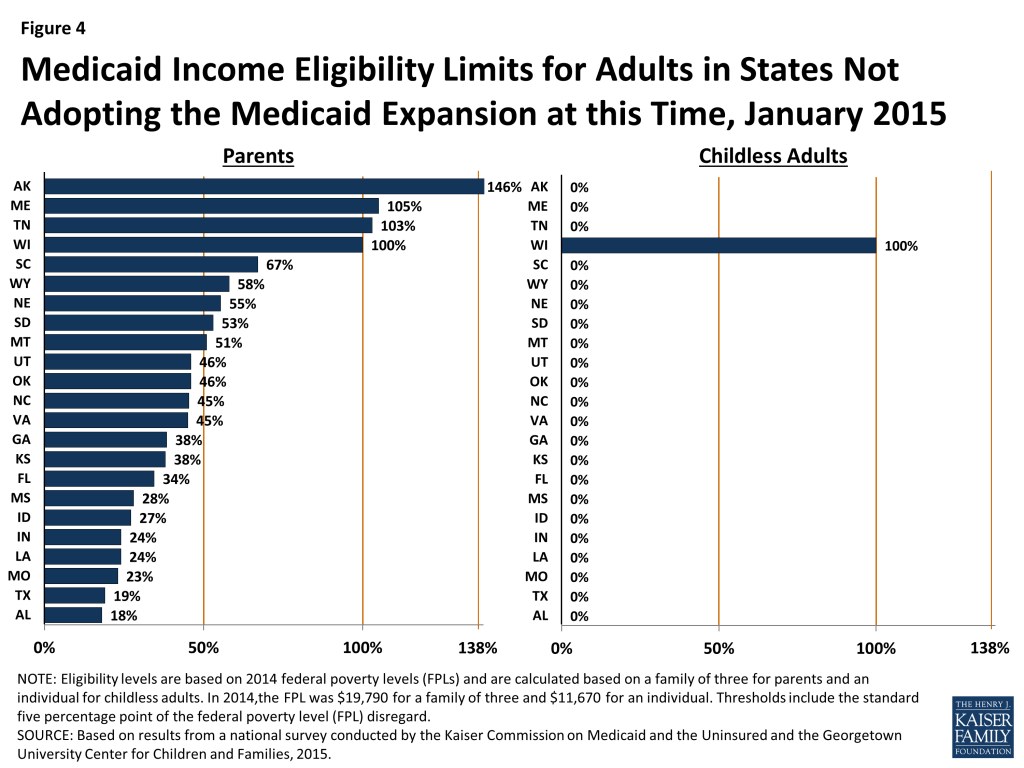
Eligibility levels remain very limited for adults in the 23 states not adopting the Medicaid expansion at this time. In all but one of these states (Wisconsin), childless adults remain ineligible for Medicaid regardless of their incomes, while Medicaid eligibility levels for parents are below poverty in 19 states (ES-Figure 2).1  In these states, many poor adults earn too much to qualify for Medicaid, but not enough to qualify for tax subsidies to purchase Marketplace coverage, which are not available to those with incomes below 100 percent of the FPL. Other Kaiser Family Foundation analysis finds that nearly four million poor uninsured adults fall into a coverage gap as a result of these limited eligibility levels.2 

Figure ES-2: Medicaid Income Eligibility Limits for Adults in States Not Adopting the Medicaid Expansion at this Time, January 2015

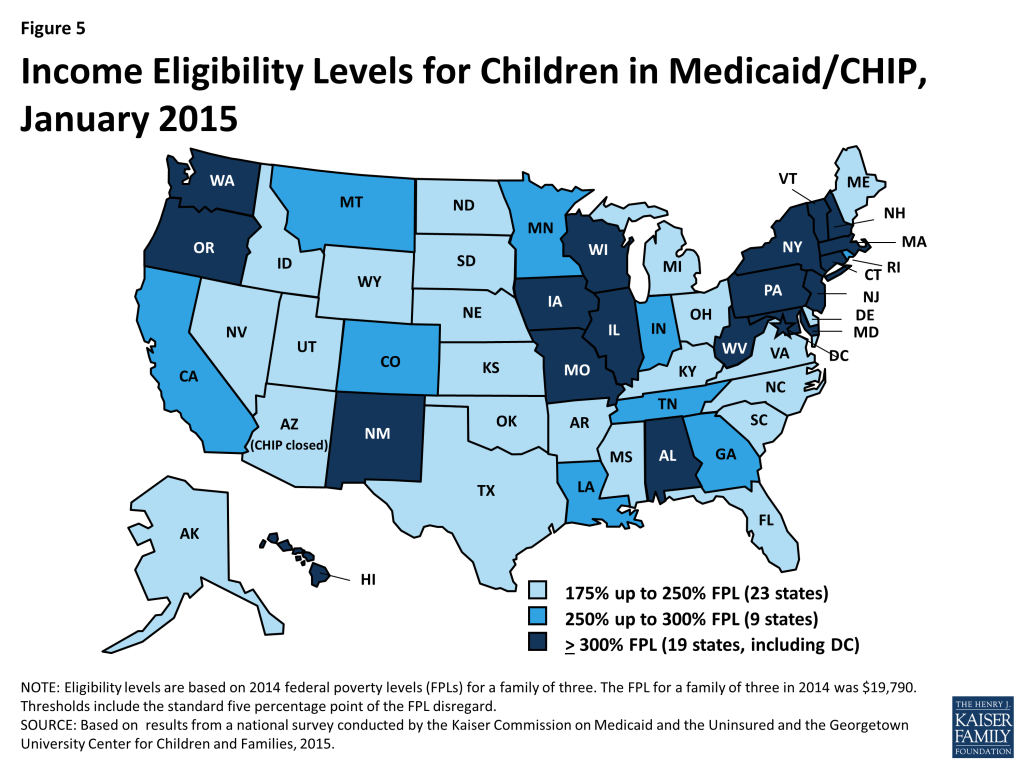
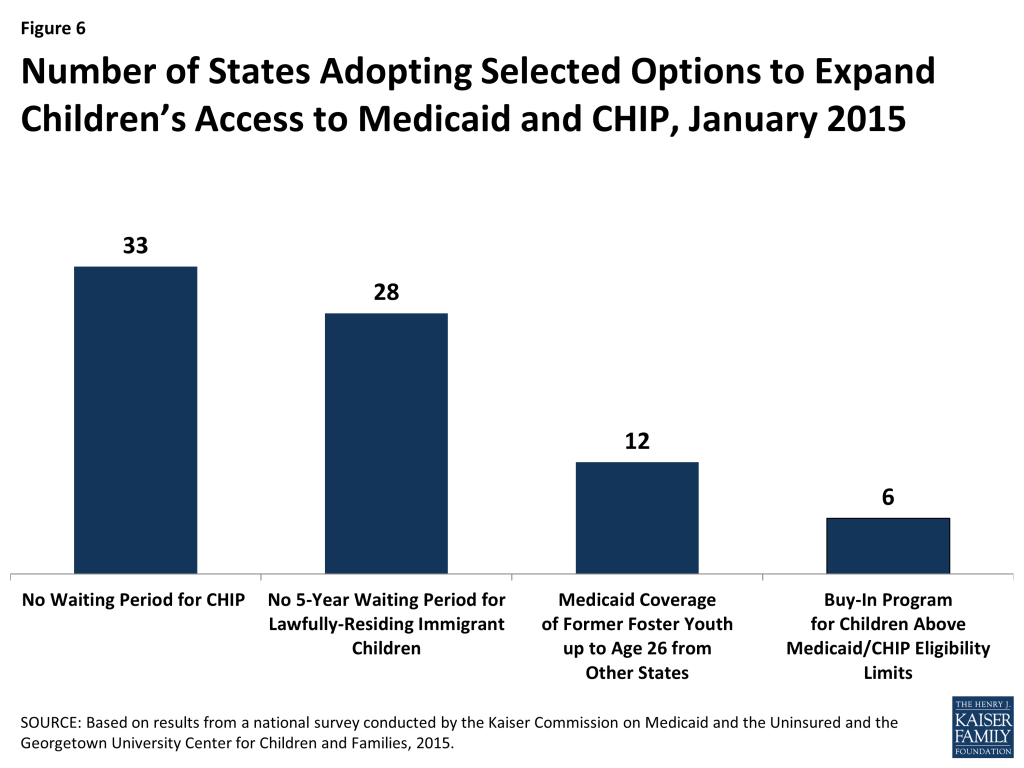
Medicaid and CHIP coverage for children and pregnant women remains strong. As of January 1, 2015, all but two states cover children at or above 200 percent of the FPL through Medicaid and CHIP with 19 states covering children at or above 300 percent of the FPL. A total of 33 states cover pregnant women at or above 200 percent of the FPL. Building on many years of progress, states also continued to take up options that expand children’s access to coverage. Consistent with the ACA’s vision of a seamless continuum of coverage options, 21 states eliminated waiting periods in CHIP, including California which transitioned its separate CHIP program into Medicaid. Illinois expanded CHIP coverage in 2013 to 317% FPL, with children above 209% FPL subject to a 3-month waiting period. Reflecting this state action, as of January 1, 2015, 33 states have no period of time that a child must be without group coverage prior to enrolling. In addition, 28 states have now eliminated the five-year waiting period for lawfully residing immigrant children, while 23 have done so for pregnant women, reflecting the recent adoption of this option in several states. Coverage for children remains protected through 2019 under ACA provisions that prohibit states from applying any restrictions in eligibility or enrollment for children.

Although eligibility levels for adults markedly increased over pre-ACA standards as a result of the Medicaid expansion, they remain well below those of children and pregnant women. Among states that expanded Medicaid, the median eligibility level for both parents and other adults is 138 percent of the FPL. However, among the 23 states that have not expanded, the median eligibility level is just 45 percent of the FPL for parents and 0 percent of the FPL for childless adults. Comparatively, the median limits for children and pregnant women are significantly higher in both expansion and non-expansion states (ES-Figure 3).

Figure ES-3: Median Medicaid/CHIP Income Eligibility Thresholds, January 2015

Progress Toward Streamlined Enrollment and Renewal Processes

States have achieved major progress implementing the modernized and streamlined enrollment and renewal processes under the ACA, but work continues in many areas. Reflecting this ongoing effort, the functionality of eligibility and enrollment systems is rapidly changing and improving on a week-to-week basis. Thus, what is reported here is a snapshot of processes and system capabilities as of January 2015.

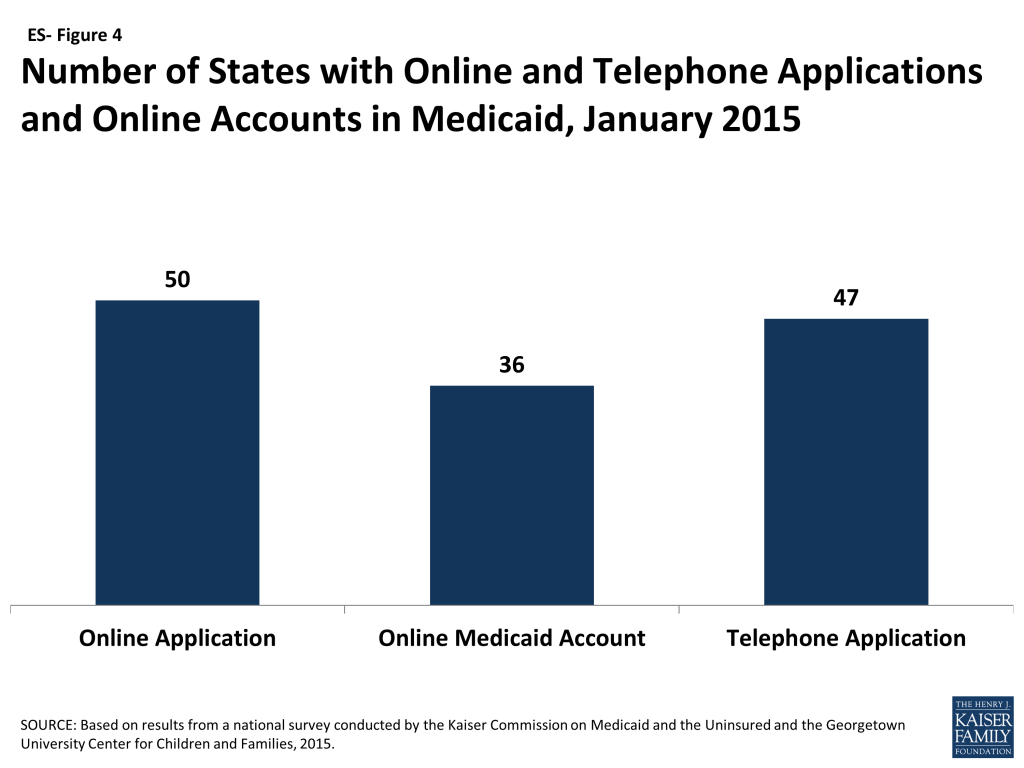
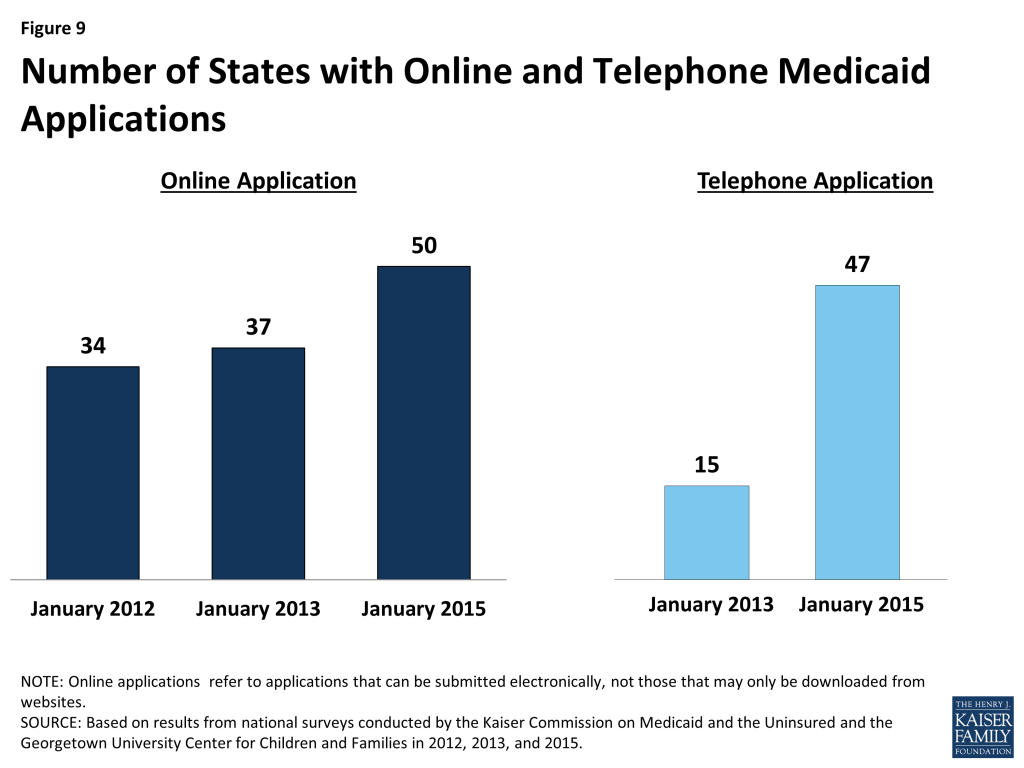
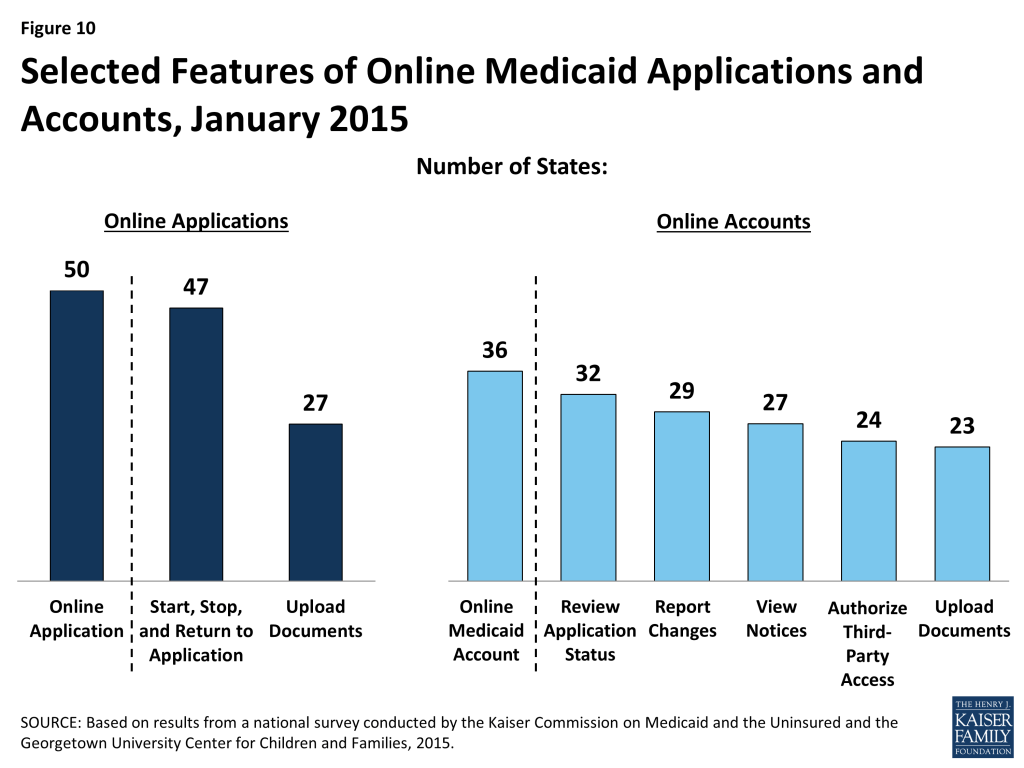
As of January 1, 2015, individuals can apply online for Medicaid at the state level in all but one state, and the majority of states are accepting Medicaid applications by phone (ES-Figure 4). Under the ACA, states must provide individuals the option to apply online for Medicaid at the state level, which currently is available in all states, except Tennessee, where individuals can only apply online through the Federally-facilitated Marketplace (FFM). Most states (36) also provide individuals the opportunity to create an online account for management of their Medicaid coverage. States continue to build features into these accounts, such as the ability to report changes, view notices, and upload documents. States also are required to provide individuals the option to apply by phone. Most states (47) accept telephone applications for Medicaid through the Medicaid agency and/or the State-based Marketplace (SBM), while the remaining states are delayed in providing this option.

Figure ES-4: Number of States with Online and Telephone Applications and Online Accounts in Medicaid, January 2015

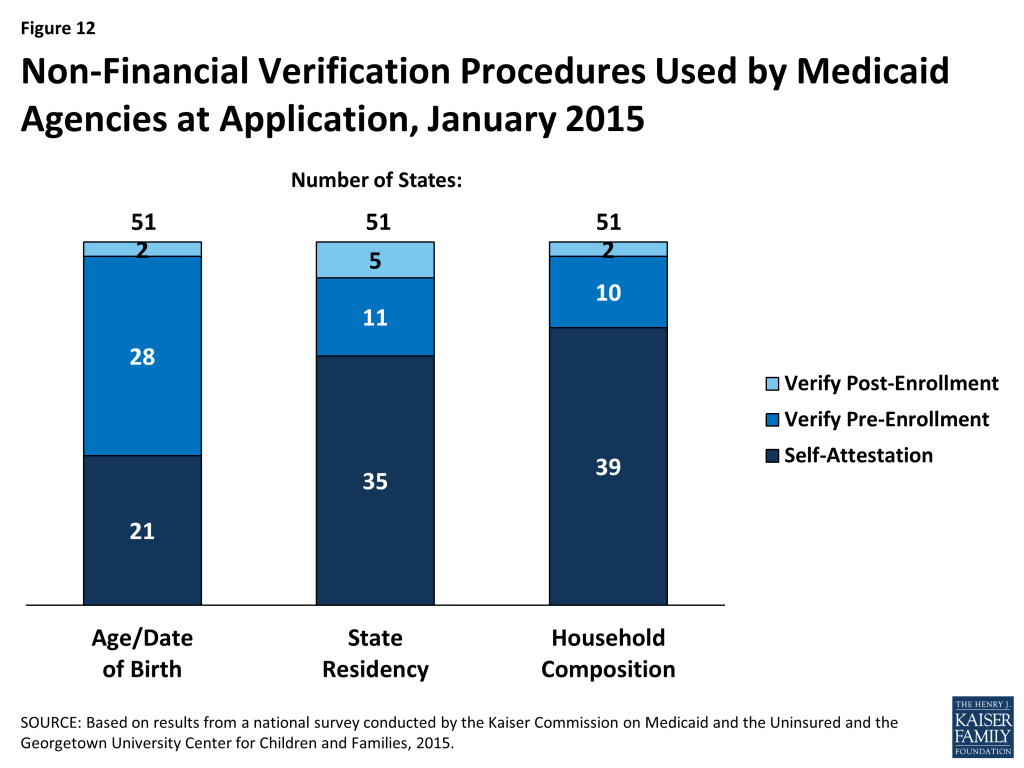
States have established eligibility verification policies that seek to rely on electronic data and minimize paperwork for individuals. As required by the ACA, all states seek to rely on electronic data sources to verify incomes of Medicaid and CHIP applicants, with 40 states verifying income prior to enrollment and 11 verifying after enrollment. Some states are relying solely on the federal data services hub, which consolidates data from the Internal Revenue Services, the Social Security Administration, the Department of Homeland Security, and a commercial wage database, while others are tapping state data sources in addition to or in lieu of the federal data hub. For cases in which there are differences between self-reported income and data from electronic sources, two-thirds of states (33) have elected to provide a broader standard than required to consider the data to be “reasonably compatible” and accept the self-reported income. Further, most states have taken up options to minimize paperwork burdens for applicants and states by relying on self-attestation of at least some non-financial eligibility criteria, such as age, state residency, and/or household size.

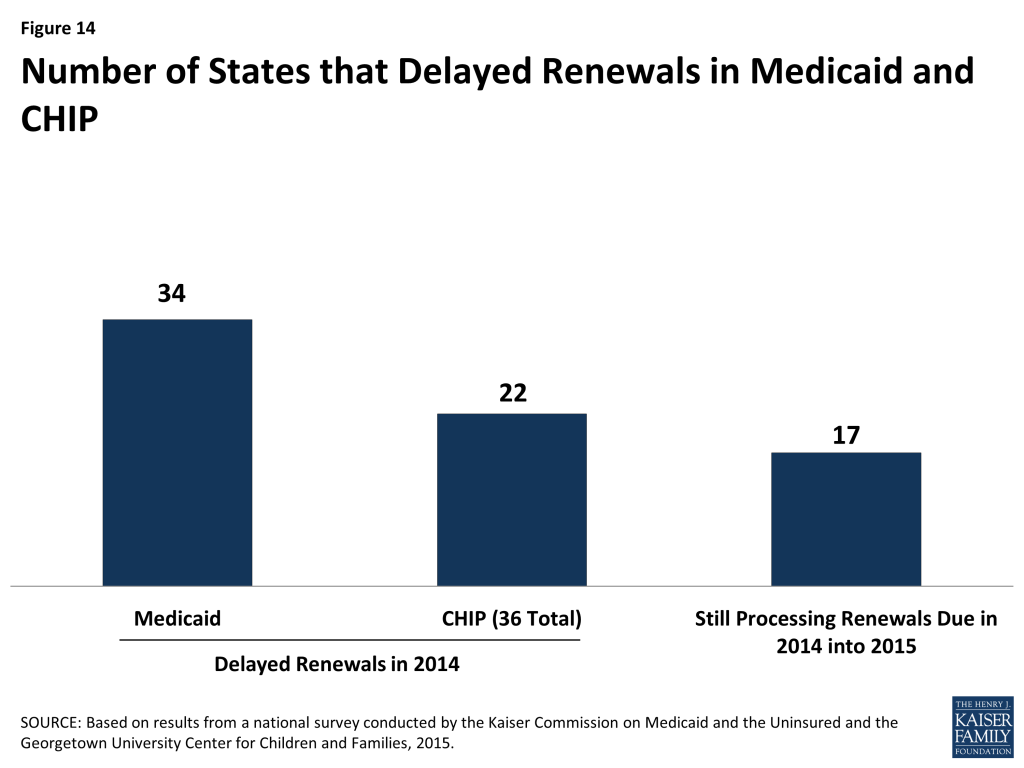
Work continues to implement streamlined renewal processes. Similar to enrollment processes, the ACA also calls for highly automated, paperless renewal procedures for Medicaid and CHIP. To ease the transition to new renewal processes, CMS offered states an option to temporarily delay renewals, which 34 states took up in Medicaid and 22 states took up in CHIP during 2014. Most states have completed all renewals that were originally due in 2014, although 17 states are extending some of these renewals into 2015. However, many states are continuing work to transition to new streamlined renewal procedures and face a range of challenges, including developing system capacity, transferring data for existing enrollees from old mainframe-based systems to their new modern technology platforms, and generating notices for individuals. In the interim, a number of states are relying on mitigation strategies such as mailing forms to individuals to request the information needed to complete renewal.

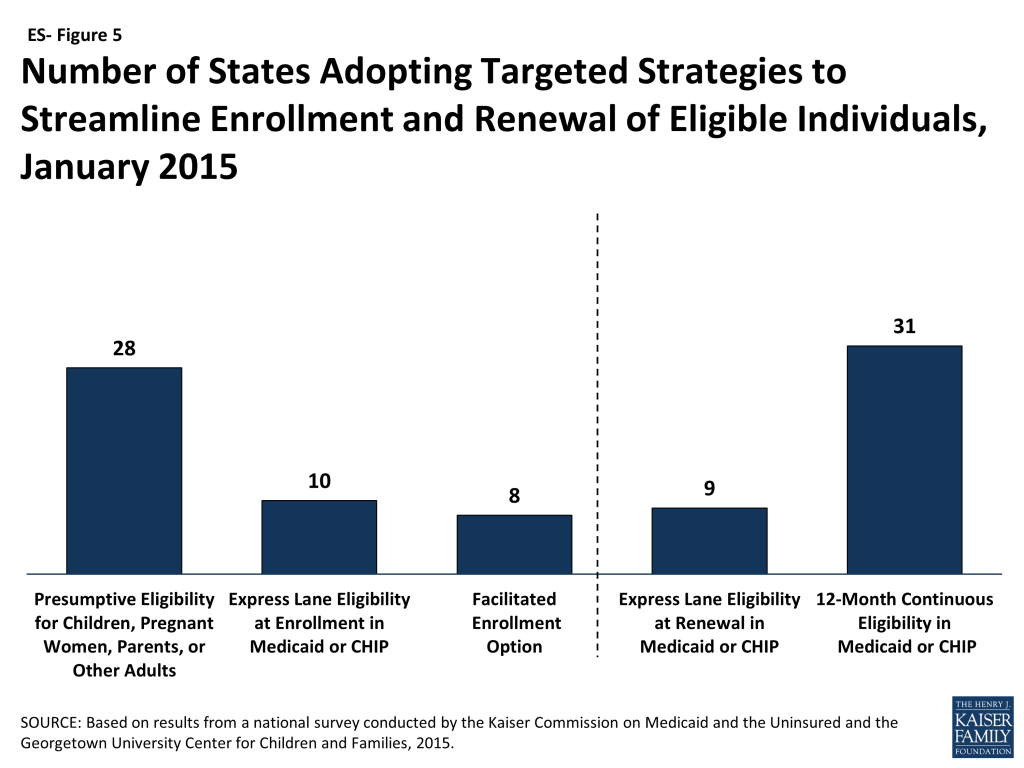
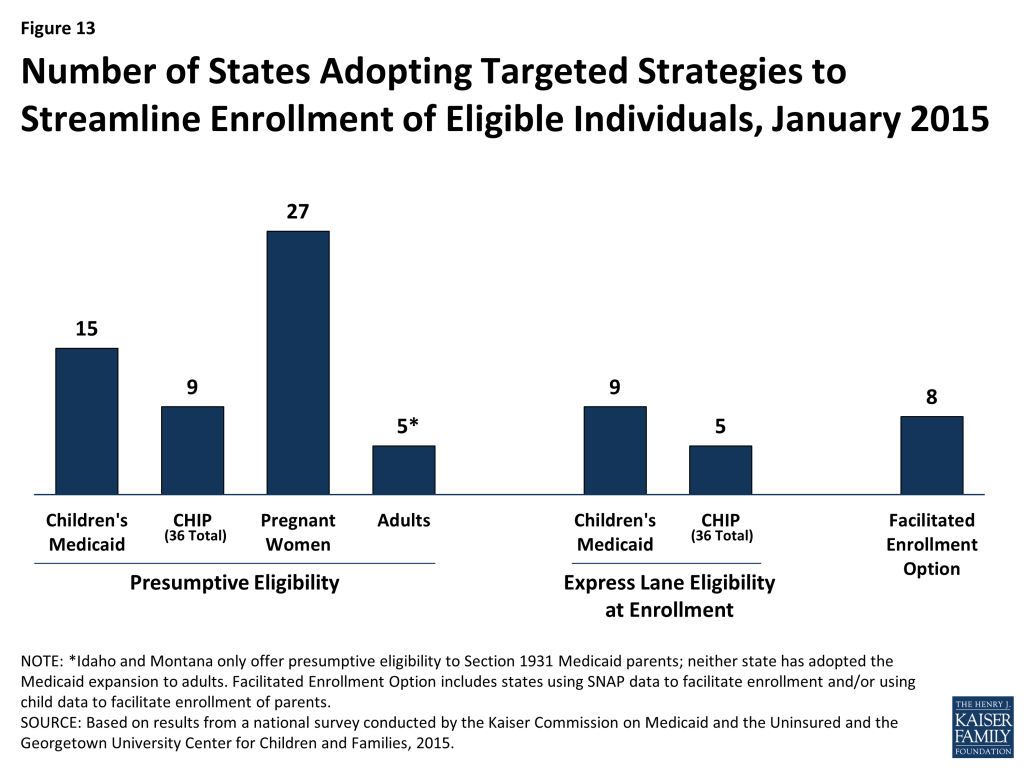
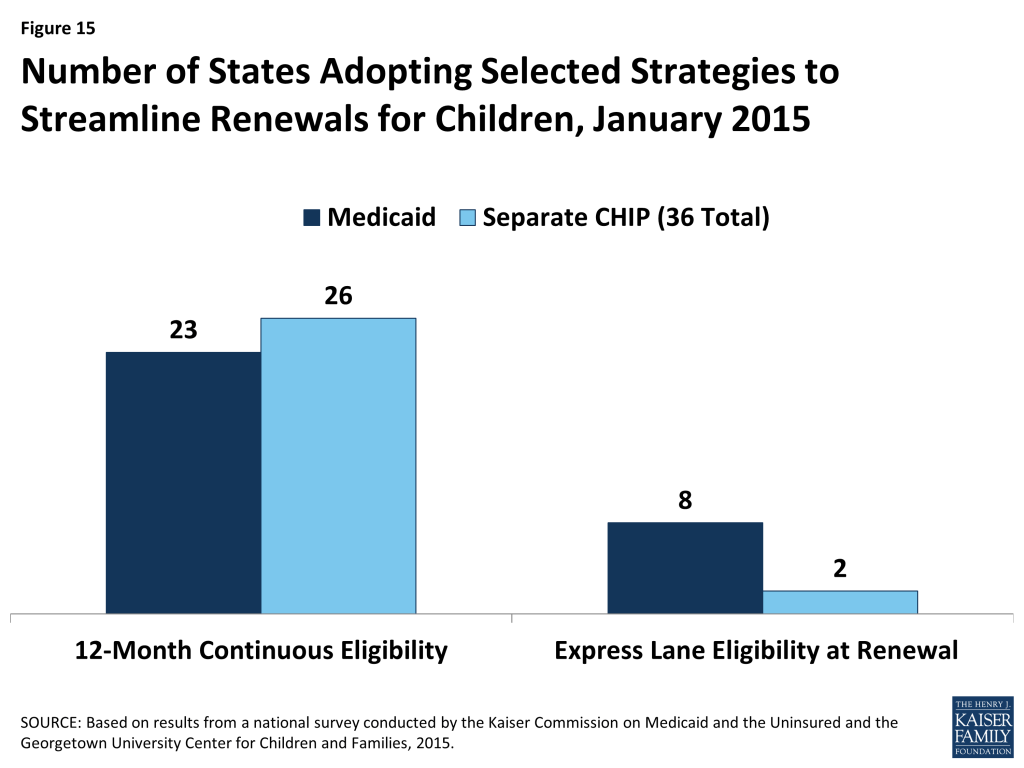
A range of additional options facilitates enrollment and renewal of eligible individuals in some states. The ACA establishes new authority for hospitals to provide temporary access to Medicaid coverage by conducting presumptive eligibility determinations while a full application is in process, which states are in varying stages of implementing. In addition, longstanding policy allows states to authorize qualified entities, such as hospitals, community health centers, and schools, to make presumptive eligibility determinations for children and pregnant women, which the ACA expanded to include parents and other adults. As of January 2015, 28 states authorize entities to conduct presumptive eligibility determinations for children, pregnant women, parents, or other adults (ES-Figure 5). Moreover, since Express Lane Eligibility (ELE) was established in 2009, states have had the option to use findings from other means-tested programs, such as the Supplemental Nutrition Assistance Program (SNAP), to determine children eligible for Medicaid or CHIP, which ten states currently utilize. In 2013, CMS offered states additional facilitated enrollment options, including using SNAP data to identify and enroll eligible individuals and using child enrollment data to expedite parent enrollment. Eight states have taken up one or both of these strategies, which have contributed to success enrolling newly eligible adults and children and reduced administrative costs.3  In addition, to support stable coverage over time, nine states utilize ELE at renewal and 31 states provide 12-month continuous eligibility for children in Medicaid or CHIP.

Figure ES-5: Number of States Adopting Targeted Strategies to Streamline Enrollment and Renewal of Eligible Individuals, January 2015

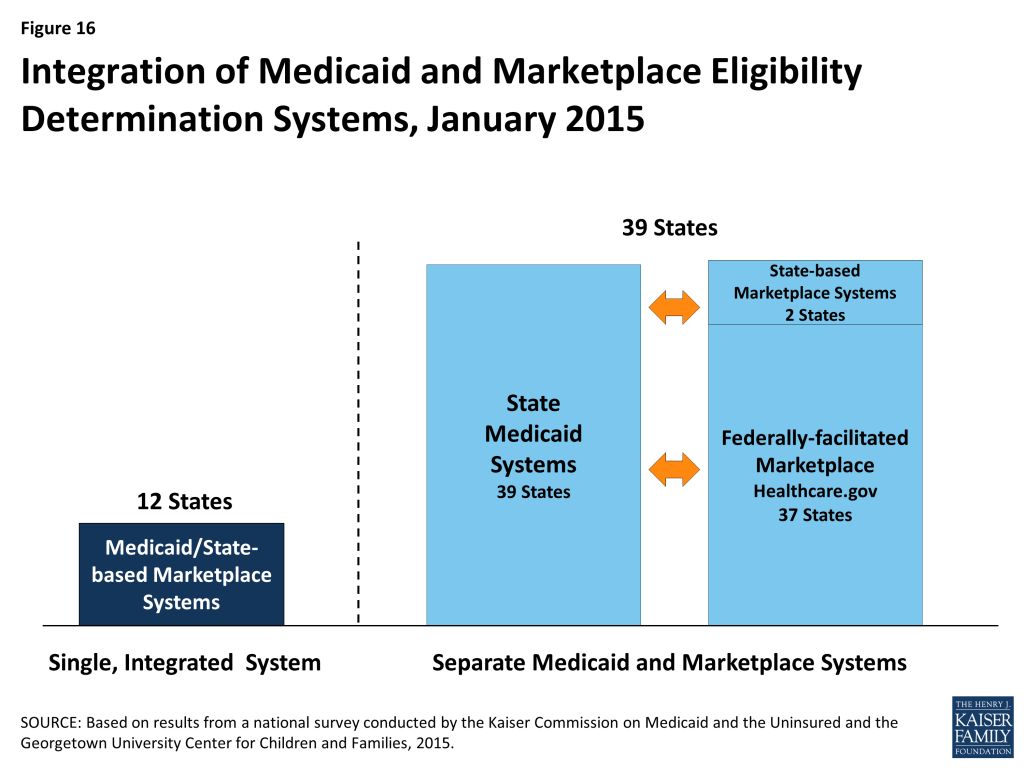
States’ choices with regard to the integration of their Medicaid and Marketplace eligibility determination systems affect coordination across coverage programs. All states must maintain a Medicaid eligibility determination system, but states with an SBM may operate a single, integrated system that determines eligibility for both Medicaid and Marketplace coverage, which 12 states do. The remaining states have separate eligibility determination systems for Medicaid and Marketplace coverage. In states with separate systems (including all 37 states relying on the FFM for eligibility and enrollment functions and 2 SBM states with separate state-level Medicaid and Marketplace systems), electronic data, known as account transfers, must be exchanged between the systems to provide a seamless enrollment experience for individuals. During 2014, difficulties with this coordination contributed to delays in Medicaid enrollment. The federal government and states have sought to address these issues, but the extra steps needed to determine eligibility, along with the higher volume of applications during open enrollment, may still result in backlogs in some states.4 

Premiums and Cost-Sharing

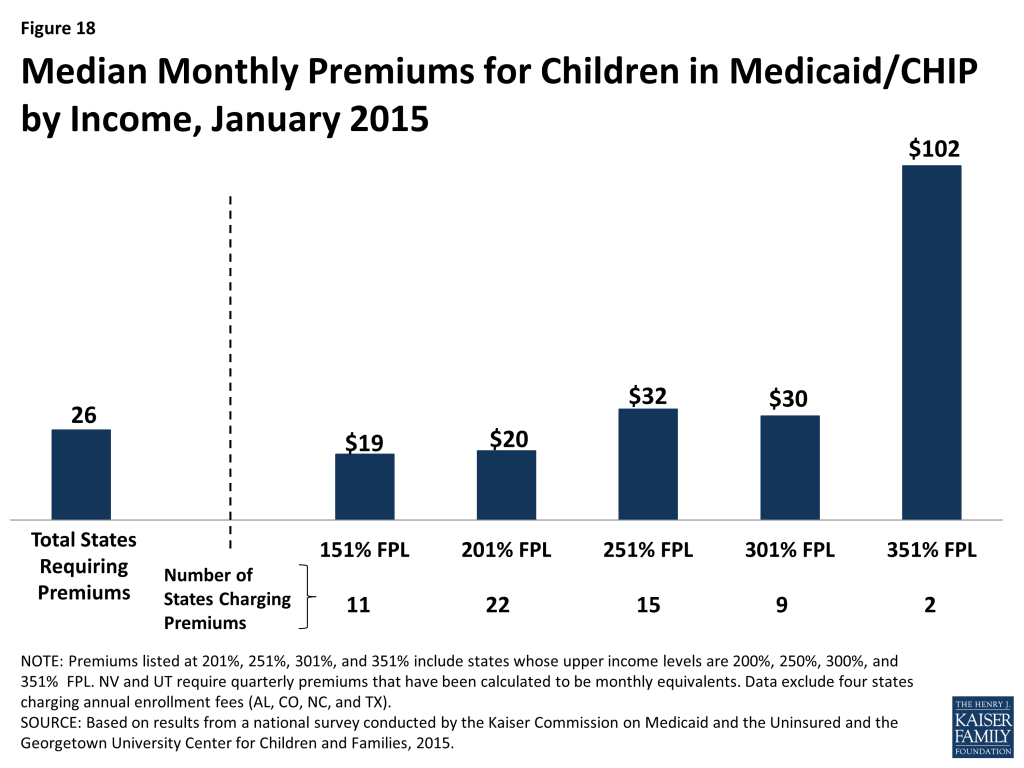
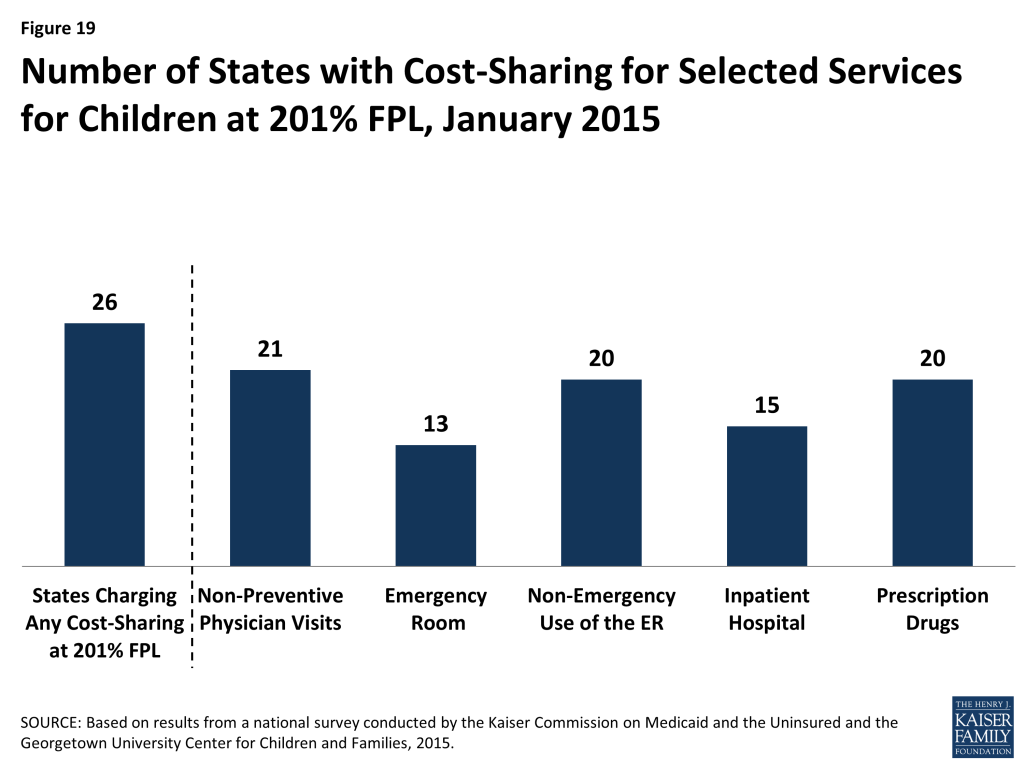
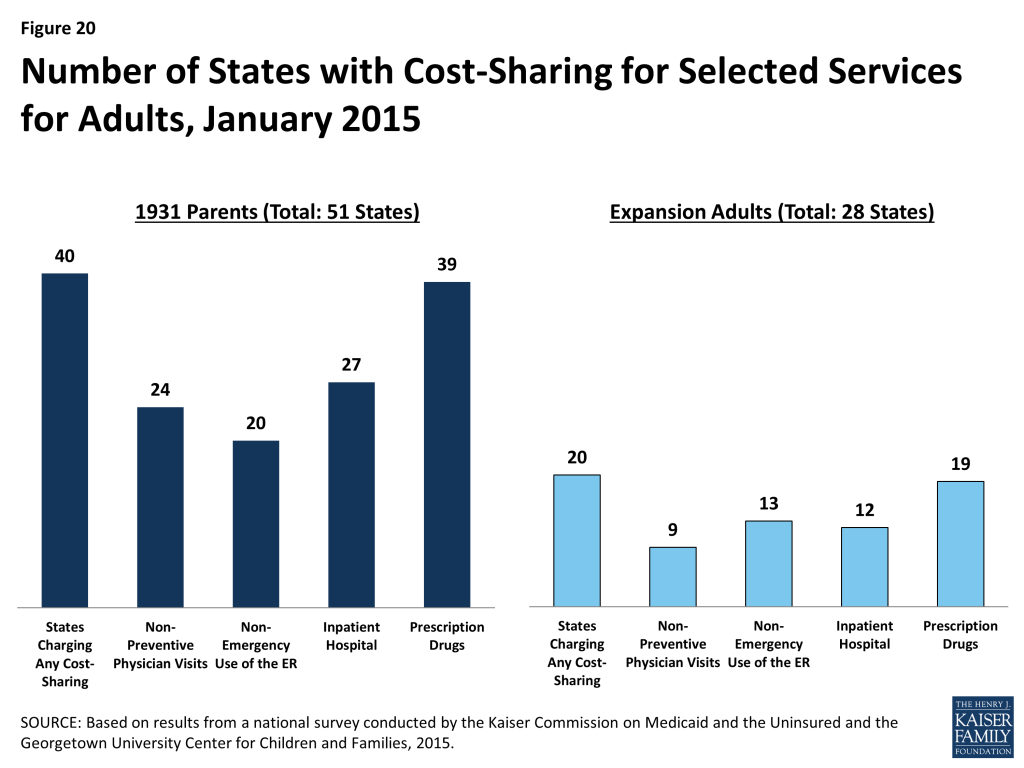
In general, premiums and cost-sharing remain limited in Medicaid and CHIP. As of January 2015, 30 states charge premiums or enrollment fees for children, primarily in CHIP, and 26 states have cost-sharing for children. No states charge premiums for parents or ACA expansion adults in traditional Medicaid, reflecting the fact that eligibility limits for adults in most states are below the level at which they can be charged under federal rules. However, four states (AR, IA, MI, and PA) have received waiver approval to charge monthly payments not otherwise allowed under federal rules for some adults. Most states charge nominal cost-sharing for low-income parents and expansion adults.

Looking Ahead

One year after the launch of the major Medicaid provisions of the ACA, there have been significant gains in coverage opportunities for low-income adults, most notably with increased eligibility levels for parents and childless adults in states that have expanded Medicaid. There is no deadline for states to expand Medicaid, and debate over the adult expansion will continue in some states in 2015. Medicaid and CHIP coverage for children and pregnant women remains strong across states, but without Congressional action there will not be continued funding for CHIP beyond September 2015. If CHIP funding expires, some children may lose coverage and some may face higher premiums and cost-sharing for coverage.5  The loss of enhanced CHIP funding would also have budgetary implications for states. On the operational and systems side, many states have achieved significant progress toward realizing the ACA’s vision of a modernized, streamlined enrollment system, but work continues in many areas, including establishing automated renewal processes as well as enhancing and expanding the functionalities of their systems.

Introduction

At the one-year anniversary of implementation of the Affordable Care Act’s (ACA) coverage provisions, states continue work to transform Medicaid and the Children’s Health Insurance Program (CHIP) to realize the ACA’s goals of expanded coverage and a streamlined enrollment system. While many states have worked to enhance access to coverage and simplify Medicaid and CHIP enrollment and renewal processes for a number of years, particularly for children, the ACA has served as a key impetus to accelerate these efforts and move the Medicaid program into a new era to serve as a broad base of coverage for the low-income population and provide a modernized enrollment experience for individuals.

Pivotal action took place in 2014, with the Centers for Medicare and Medicaid Services (CMS) and states working together to implement the ACA’s new eligibility, enrollment, and renewal rules. More than half of the states moved forward with the ACA’s Medicaid expansion to low-income adults, and states made significant headway in adopting the law’s streamlined enrollment and renewal processes. However, implementation remains a work in progress with some states further ahead than others. Looking ahead, many states are now focused on enhancing and improving system functionalities, smoothing out transitions between Medicaid and Marketplace coverage, and progressing to highly-automated renewal procedures.

This report annually surveys Medicaid and CHIP program officials to track eligibility, enrollment, renewal, and premium and cost-sharing policies. Given the fast-paced policy environment leading up to January 1, 2014, when key ACA coverage provisions went into effect, an abbreviated report based on publicly available data was released in November 2013. For this 13th annual report, we return to conducting interviews with state Medicaid and CHIP officials to gather information on key policies that are in effect as of January 1, 2015.

The report includes information on Medicaid policies for children, pregnant women, parents, and the new adult expansion group, as well as coverage for children and pregnant women under CHIP.6  Given that state eligibility and enrollment systems and ACA implementation efforts are rapidly evolving, this report provides a point-in-time view, a snapshot. Importantly, it provides a key measure of state Medicaid and CHIP policies in a new era under the ACA. The report is organized into four sections: Medicaid and CHIP Eligibility, Enrollment and Renewal Processes, Eligibility Determination Systems, and Premiums and Cost-Sharing. State-specific information is available in Tables 1 to 19 at the end of the report.

Medicaid And Chip Eligibility

As enacted, the ACA expanded Medicaid eligibility to adults with incomes at or below 138 percent of the federal poverty level (FPL) ($27,310 for a family of three in 2014), although this core provision was effectively made a state option by the Supreme Court’s 2012 ruling on the ACA. However, other eligibility changes in the law were unaffected by the Court’s decision, including establishing a new minimum coverage level of 138 percent of the FPL for children of all ages in Medicaid, helping to align Medicaid coverage across children. The ACA also changed the method for determining financial eligibility for Medicaid for children, pregnant women, parents, and adults and CHIP to a standard based on modified adjusted gross income (MAGI).7  This new approach is intended to prevent gaps in coverage between programs by largely adopting the rules for determining eligibility for subsidies to purchase Marketplace coverage. While these changes went into effect on January 1, 2014, some states continued to refine the conversion of their pre-ACA eligibility levels to MAGI-based standards. The findings below reflect eligibility levels for parents and other non-disabled adults, children, and pregnant women in Medicaid and CHIP as of January 1, 2015. They highlight Medicaid’s expanded role for low-income adults under the ACA and its continued role as a primary source of coverage for children and pregnant women.

Parents and Adults

As of January 1, 2015, 28 states set their Medicaid income eligibility levels for parents and other adults to at least 138 percent of the FPL, reflecting their implementation of the ACA Medicaid expansion (Figures 1 and 2). This count includes New Hampshire and Pennsylvania, which made decisions during 2014 to expand. Most states adopted the expansion consistent with federal rules and options provided under the ACA, but four states (AR, IA, MI, and PA) obtained Section 1115 waivers to expand Medicaid in ways that extend beyond the flexibility provided by the law.8  There is no deadline for states to expand Medicaid and additional states may decide to expand in the coming year. Two expansion states extend Medicaid income eligibility for adults to higher levels. Specifically, in the District of Columbia, parents with incomes up to 221 percent of the FPL and other adults with incomes up to 215 percent of the FPL are eligible, and Connecticut covers parents with incomes up to 201 percent of the FPL. Minnesota became the first state to implement a Basic Health Program (BHP) established by the ACA and transferred coverage for Medicaid enrollees with incomes between 138 and 200 percent of the FPL to the BHP as of January 1, 2015.

Figure 1: Medicaid Income Eligibility Levels for Parents of Dependent Children, January 2015
Figure 2: Medicaid Income Eligibility Levels for Childless Adults, January 2015

Among states that have implemented the Medicaid expansion, there have been increases in income eligibility levels for adults compared to pre-ACA levels. In these states, the median income eligibility level for parents rose from 106 percent of the FPL to 138 percent of the FPL. Increases in income eligibility levels for childless adults were even more significant, rising from a median of 0 to 138 percent of the FPL, reflecting the historic exclusion of childless adults from Medicaid prior to the ACA (Figure 3).

Figure 3: Median Medicaid Income Eligibility Levels for Adults as a Percent of the FPL in States that Adopted the Medicaid Expansion, January 2013 and January 2015

Medicaid income eligibility levels for parents remain very low, and, with only one exception, childless adults are ineligible for Medicaid in the 23 states that are not adopting the Medicaid expansion at this time. Fourteen states limit parent eligibility levels to less than half of the poverty level, and only four of the non-expansion states set their income eligibility levels for parents at or above 100 percent of the FPL, including Maine and Wisconsin, which both reduced eligibility levels for parents from pre-ACA levels (Figure 4). Wisconsin is also the only non-expansion state providing full Medicaid coverage to any childless adults, although eligibility at 100 percent of the FPL remains below the expansion level.9  In the other non-expansion states, where Medicaid income eligibility limits for adults are below poverty, many adults earn too much to qualify for Medicaid, but not enough to qualify for tax subsidies to purchase Marketplace coverage, which are not available to those with incomes below 100 percent of the FPL. Other Kaiser Family Foundation analysis finds that nearly four million poor uninsured adults fall into a coverage gap as a result of these limited eligibility levels.10  While this study reports FPL equivalents, it also is important to note that 17 non-expansion states base eligibility for parents on dollar thresholds. Most of these states do not routinely update these dollar-based standards, resulting in eligibility levels that erode over time relative to the cost of living.

Figure 4: Medicaid Income Eligibility Limits for Adults in States Not Adopting the Medicaid Expansion at this Time, January 2015

Children and Pregnant Women

Coverage for children in Medicaid and CHIP remains strong and steady with the median income eligibility limit at 255 percent of the FPL. As of January 1, 2015, 28 states cover children with family incomes at or above 250 percent of the FPL, with 19 extending coverage to 300 percent of the FPL or higher (Figure 5). Only two states (ID, ND) limit children’s eligibility to below 200 percent of the FPL. Underlying these upper limits, eligibility levels reflect the ACA’s new minimum Medicaid eligibility level of 138 percent of the FPL for children of all ages. This change resulted in the shift of older children (ages 6 up to 19) with incomes between 100 and 138 percent of the FPL from CHIP to Medicaid in 18 of the 36 states maintaining separate CHIP programs, while California, New Hampshire, and Vermont have transitioned all of the children from their separate CHIP programs to Medicaid. States still receive enhanced federal CHIP matching funds for children transferred from CHIP to Medicaid under this requirement. Enrollment remains open for children in all states with separate CHIP programs, except for Arizona, which froze enrollment in its separate CHIP program prior to the ACA. The ACA established protections that prohibit states from applying any restrictions in eligibility or enrollment for children through September 2019.

Figure 5: Income Eligibility Levels for Children in Medicaid/CHIP, January 2015

States have continued to take up options that expand children’s access to coverage. Consistent with the ACA’s vision of a seamless continuum of coverage options, 21 states eliminated waiting periods in CHIP, including California which transitioned its separate CHIP program into Medicaid, and seven states reduced their waiting periods to 90 days or less, consistent with new federal rules. Illinois expanded CHIP coverage in 2013, with the expansion group between 209% and 317% FPL subject to a three-month waiting period. Reflecting this state action, as of January 1, 2015, 33 states do not have a waiting period that requires that a child be without group coverage for a specified period of time before enrolling in CHIP (Figure 6). In addition, more than half of all states (28) have taken up the option, established in 2009, to eliminate the five-year waiting period for lawfully-residing immigrant children, with Kentucky, Ohio and, West Virginia recently adopting the option. Additionally, seven states provide fully state- or locally-funded coverage to some children regardless of their immigration status. Under the ACA, all states must provide Medicaid coverage to former foster youth up to age 26 if they were in foster care in the state and enrolled in Medicaid on their 18th birthday. Nearly a quarter of states (12) have chosen to extend this coverage to former foster youth from other states. Six states have maintained programs that allow families with incomes over the upper limit for children’s coverage to buy into Medicaid or CHIP for their children, although this number has declined from its peak of 15 in 2011, reflecting the fact that higher income families now have new coverage options through the Marketplaces.

Figure 6: Number of States Adopting Selected Options to Expand Children’s Access to Medicaid and CHIP, January 2015

Nearly two-thirds of states (33) cover pregnant women with incomes at or above 200 percent of the FPL (Figure 7). This count reflects the reinstatement of CHIP coverage for pregnant women with incomes up to 205 percent of the FPL in Virginia during 2014. Ohio, West Virginia, and Wyoming also recently took up the option to eliminate the five-year waiting period for lawfully residing immigrant pregnant women, increasing the total number of states that have adopted this option since it was established in 2009 to 23. Further, 15 states cover income-eligible pregnant women regardless of immigration status through CHIP’s unborn child option, while four states provide fully state-funded coverage to some immigrant pregnant women.

Figure 7: Income Eligibility Levels for Pregnant Women in Medicaid/CHIP, January 2015

Even with the Medicaid expansion, income eligibility levels for parents and other adults remain lower than those for children and pregnant women. The differences between parents and other adults and children and pregnant women are even starker among states that have not implemented the Medicaid expansion. In the non-expansion states, the median Medicaid income eligibility level is 45 percent of the FPL for parents and 0 percent of the FPL for other adults, compared to 138 percent of the FPL for parents and adults in expansion states and the significantly higher median Medicaid and CHIP eligibility levels for children and pregnant women in both expansion and non-expansion states (Figure 8).

Figure 8: Median Medicaid/CHIP Income Eligibility Thresholds, January 2015

Enrollment And Renewal Processes

The ACA enacted sweeping changes to transform application, enrollment, and renewal processes in Medicaid and CHIP and coordinate with the new Marketplaces. Together these processes are intended to achieve the ACA’s vision to provide “no wrong door” access to all health coverage options, minimize the paperwork burden on consumers and state agencies, and enhance the consumer experience. Specifically, under the ACA, states must provide multiple options for individuals to apply for health coverage, including online, by phone, by mail, and in person, using a single streamlined application for Medicaid, CHIP, and Marketplace coverage. In addition, states must seek to rely on electronic data to verify eligibility criteria and renew coverage based on electronic data matches. Adoption of these procedures represents major modernization in many states that previously had relied on antiquated, paper-based enrollment processes for Medicaid and CHIP. States have achieved significant progress adopting many of these processes, but work continues in many areas.

Applications

As of January 1, 2015, individuals can apply online for Medicaid at the state level in all states, except Tennessee. Most states with a State-based Marketplace (SBM) (12 of 17) provide a single integrated online application portal for Medicaid and Marketplace coverage. All states relying on the Federally-facilitated Marketplace (FFM) for Marketplace eligibility and enrollment functions maintain their own online Medicaid application separate from Healthcare.gov, as required, except Tennessee, where individuals can only apply online for Medicaid through Healthcare.gov. In about half of all states (25), an online multi-benefit application is available that allows individuals to apply simultaneously for Medicaid and other benefits, such as SNAP or Temporary Assistance for Needy Families (TANF). The availability of an online Medicaid application in nearly all states represents substantial progress from just several years ago; an online option was available in only two-thirds of states (34) as of January 2012 and 37 states as of January 2013 (Figure 9).

Figure 9: Number of States with Online and Telephone Medicaid Applications

The majority of states are accepting Medicaid applications by phone as of January 1, 2015. Medicaid applications can be submitted by telephone at the state level in most states (47) either through the Medicaid agency or the SBM call center, but work continues in the remaining states to support phone-based applications. The broad availability of a telephone application across states also represents marked progress among states in modernizing enrollment processes as only 15 provided this option as of January 2013.

There is variation across states in the functions of online applications and the availability and features of online Medicaid accounts. In most states (47), applicants can start, stop, and return to the online application, and, in just over half of states (27), the online application provides applicants the ability to upload electronic copies of documentation if it is required (Figure 10). More than two-thirds of states (36) also provide individuals the opportunity to create an online account for ongoing management of their Medicaid coverage, which may include the ability to review the status of their application (32 states), report changes (29 states), view notices (27 states), authorize third-party access (24 states), and upload documentation (23 states). Many of these states plan to add capabilities over time and additional states plan to add online accounts in 2015 or beyond.

Figure 10: Selected Features of Online Medicaid Applications and Accounts, January 2015

Verification of Eligibility Criteria

All states are developing their capacities to tap electronic data sources to verify incomes of Medicaid and CHIP applicants, as required by the ACA. States must verify income using electronic data sources to the extent possible. Forty states confirm applicants’ income prior to enrollment, while 11 states process eligibility based on an applicant’s attestation and verify after enrollment (Figure 11). To facilitate electronic verification, a federal data hub was established that allows states to access information from multiple federal agencies, including the Internal Revenue Service, the Social Security Administration, and the Department of Homeland Security. In addition, states can access other databases that collect state wage information, unemployment compensation, vital statistics, and eligibility for other public programs. Verifying eligibility elements is not only technically complicated, but also requires the establishment of data sharing agreements between agencies that protect the privacy and security of personally identifiable information. These challenges can slow state progress in accessing electronic data sources on a timely basis to verify eligibility. Looking ahead, states are continuing to enhance their data matching capabilities.

Figure 11: Income Verification Policies and Procedures in Medicaid, January 2015

Over half of states have opted to set a broader “reasonable compatibility standard” than required to address cases in which there are differences between self-reported income and data from electronic sources. Federal rules require states to disregard differences between self-reported income and an electronic data source if the difference does not affect eligibility (i.e., both are at, above, or below the Medicaid or CHIP eligibility threshold). Thirty-three states have taken up an option to establish a broader reasonable compatibility standard for cases in which self-attested income is below but electronic data sources show income above the Medicaid or CHIP eligibility limit. If the difference is within this reasonable compatibility standard, which is most often 10 percent, the self-reported income is accepted. Regardless of whether they have set a broader reasonable compatibility standard, if data are not reasonably compatible, states may accept a reasonable explanation of the difference (e.g., the individual lost a job) before requiring paper documentation, which 32 states do. Only one state (New Jersey) provides a broader reasonable compatibility standard for cases in which self-reported income is above the Medicaid or CHIP income threshold and electronic data sources show income below the threshold. In these circumstances, most states (39) determine the individual ineligible for Medicaid or CHIP and transfer the account to the Marketplace for determination of eligibility for subsidies.

Many states minimize burdens for applicants and states by relying on self-attestation of non-financial eligibility criteria. As is the case with income, states must verify citizenship and immigration status for new applicants through electronic data sources. However, states have additional options to verify other non-financial eligibility criteria, including age/date of birth, state residency, and household composition. For these criteria, states can either verify pre- or post-enrollment or accept self-attestation. Many states accept self–attestation of age/date of birth (21), state residency (35), or household size (39), although verification is required if a state has any conflicting information on file (Figure 12). The remaining states confirm these eligibility criteria prior to enrollment or post enrollment, although most do not verify the information at renewal. Accepting self-attestation simplifies the enrollment process for states and applicants, and past experience shows that reducing paperwork burdens boosts enrollment and retention.11  Historically, some states have been reluctant to minimize documentation requirements due to concerns about penalties associated with inaccurate eligibility determinations. However, moving forward, audits of state eligibility determinations will focus on validating that states’ systems and processes are consistent with the verification plans they must submit to CMS that outline their policies for determining eligibility.

Figure 12: Non-Financial Verification Procedures Used by Medicaid Agencies at Application, January 2015

Facilitated Enrollment Options

A range of additional streamlining options further facilitate enrollment of eligible individuals in some states. Under the longstanding presumptive eligibility option in Medicaid and CHIP, states can allow qualified entities to expedite access to coverage for children and pregnant women. The ACA allows states to expand this option to parents and other adults if the state offers it to children or pregnant women. States have taken mixed action with regard to providing presumptive eligibility. Since 2013, several states have eliminated presumptive eligibility for children (MA, MI and UT) or pregnant women (AR, DE, MA, MI, and OK), likely given that new data-driven enrollment processes are designed to enable faster eligibility determinations. Conversely, five states (ID, MT, NH, NJ and OH) have expanded presumptive eligibility to parents or other adults. Following this state action, as of January 2015, 15 states provide presumptive eligibility for children in Medicaid, 9 for children in CHIP, 27 for pregnant women, and 5 for adults (Figure 13). The ACA also establishes new authority for hospitals to conduct presumptive eligibility determinations, although states are in various stages of effecting this requirement. In addition, since 2009, states have had the option to utilize Express Lane Eligibility (ELE) to enroll children in Medicaid or CHIP based on eligibility findings from other programs, like SNAP. As of January 1, 2015, nine states use ELE to enroll children in Medicaid, while five use ELE to enroll CHIP-eligible children. In 2013, CMS offered states additional facilitated enrollment options, including using SNAP data to identify and enroll eligible individuals and using child enrollment data to expedite parent enrollment. To date, eight states have taken up one or both of these strategies, which analysis has shown contributed to success in enrolling newly eligible adults and children and reducing administrative costs.12  These options remain available for other states to take up moving forward.

Figure 13: Number of States Adopting Targeted Strategies to Streamline Enrollment of Eligible Individuals, January 2015

Renewal

States are making progress adopting automated renewal processes, but transition work continues. Similar to enrollment processes, the ACA calls for new highly automated, paperless renewal processes for Medicaid and CHIP. When possible, states must use available data to renew coverage automatically (also called ex parte renewal). Many states are still implementing and transitioning to these new processes, given a range of challenges including developing system capacity to process automated renewals, transferring data for existing enrollees from old legacy systems to new systems, and creating notices for individuals. In the interim, a number of states are relying on mitigation strategies such as mailing forms to individuals to request the information needed to complete renewal. To ease the transition to new renewal procedures, CMS offered states the opportunity to temporarily delay renewals, an option which 34 states took up for Medicaid and 22 states took up in CHIP during 2014 (Figure 14). About half have completed all of their delayed renewals, although 17 states have extended some of these renewals into 2015. Continued work to address the challenges of adopting new automated renewal processes will be important for preventing coverage losses and gaps and supporting more stable coverage over time.

Figure 14: Number of States that Delayed Renewals in Medicaid and CHIP

In July 2014, CMS offered states additional flexible renewal strategies. CMS clarified that states can continue to conduct renewals based on available information without collecting the additional information necessary to coordinate with Marketplace coverage, which includes tax-filing status and access to employer coverage. However, states can only affirmatively renew coverage using this approach and cannot deny coverage without collecting all required information. Additionally, states can receive expedited waiver approval from CMS to renew coverage using information from SNAP, as well as to facilitate renewals for enrollees with no change in circumstances that affect eligibility.

Some states are utilizing other policy options to boost retention and support stable coverage over time. Under the ACA, all states must conduct renewals once every 12 months. States can further support stable coverage and reduce churn resulting from small fluctuations in income by opting to provide 12-month continuous eligibility, which allows individuals to remain enrolled for a full year regardless of changes in circumstances. As of January 1, 2015, 23 states provide 12-month continuous eligibility to children in Medicaid, and 26 have adopted it in their separate CHIP programs (Figure 15). States also can extend 12-month continuous eligibility to parents and other adults under Section 1115 waiver authority, which New York has done for parents to provide consistent procedures for all enrolled family members. Another option available to states to streamline renewal is ELE, which eight states use to renew children’s Medicaid coverage and two states utilize for CHIP renewals. Massachusetts is also using ELE to renew parents in Medicaid under Section 1115 waiver authority.

Figure 15: Number of States Adopting Selected Strategies to Streamline Renewals for Children, January 2015

Eligibility And Enrollment Systems

In order to implement the new modernized, data-driven enrollment and renewal processes outlined in the ACA, most states needed to make major improvements to or build new Medicaid and CHIP eligibility determination systems, often replacing decades-old legacy systems. Harnessing technology within Medicaid and CHIP can enhance the consumer experience and improve the reliability, timeliness and administrative efficiency of eligibility determinations and ongoing case management for enrollees. To support system upgrades and builds, the federal government provided 90 percent federal funding for system design and development. This increased funding was initially set to expire at the end of 2015, but, in October 2014, CMS announced plans to extend the higher federal match permanently.13  The ongoing availability of enhanced funding will give states more time to phase in additional functionality and help systems stay current as technology evolves in the future. States have made significant progress developing efficient, interconnected eligibility and enrollment systems, but ongoing efforts will be needed to refine and enhance systems to fulfill the vision of the ACA.

States have made varied choices with regard to the integration of their Medicaid and Marketplace eligibility determination systems, largely influenced by their Marketplace structure. All states must have a Medicaid eligibility determination system, but SBM states may operate a single, integrated system that makes eligibility determinations for both Medicaid and Marketplace coverage, which 12 states do. In the remaining 39 states, separate eligibility determination systems are used for Medicaid and Marketplace coverage. These include two SBM states that have separate state-level systems, three SBM states that are relying on the FFM for Marketplace eligibility and enrollment functions, and all 34 FFM and Partnership Marketplace states (Figure 16). Nearly all states with a separate CHIP program (34 of 36) have integrated CHIP into their Medicaid eligibility determination system.

Figure 16: Integration of Medicaid and Marketplace Eligibility Determination Systems, January 2015

When systems are not integrated, coordination between Medicaid and Marketplace systems is key to smooth enrollment. The SBM states with a single integrated Medicaid and Marketplace eligibility determination system do not need to transfer accounts between systems to coordinate eligibility determinations across coverage programs, although, in some cases, transfers of data and additional actions must occur after the eligibility determination to complete enrollment. However, in states with separate systems, including all 37 states relying on the FFM for eligibility and enrollment functions, electronic data, known as account transfers, must be exchanged between systems to provide a coordinated, seamless enrollment experience for individuals, as envisioned by the ACA. Ten of the FFM states have authorized the federal system to make final Medicaid eligibility determinations, which can speed the enrollment process. Alternatively, 27 states allow the FFM only to assess rather than determine Medicaid eligibility. These states must review accounts transferred from the FFM and potentially check other data sources or gather additional information from applicants prior to making a final Medicaid eligibility determination. There were technical difficulties with Medicaid and Marketplace coordination during 2014 that contributed to some delays in Medicaid enrollment. The federal government and states have sought to address these issues for 2015, but the extra steps needed to determine eligibility, along with the higher volume of applications generated during open enrollment, may still result in backlogs in some states.14 

Many states delinked Medicaid eligibility determination systems from other benefit programs as they deployed new MAGI-based systems, but a number plan to reintegrate eligibility for other programs in the future. Prior to the ACA, the majority (45) of state Medicaid eligibility determination systems were integrated with other assistance programs, such as SNAP or TANF. As states implemented new ACA eligibility determination and enrollment processes for Medicaid and upgraded or built new eligibility systems, many delinked Medicaid from these other programs due to the large scale of the changes. As of January 1, 2015, 19 states maintain systems that administer eligibility for Medicaid and other benefit programs (Figure 17). However, this number will likely grow over time, as 12 states indicate that they plan to phase in other assistance programs in 2015 or beyond. These efforts are further supported by CMS’ intent to extend the opportunity for non-health programs to pay only the add-on costs associated with integrating into newly enhanced Medicaid systems through 2018.15 

Figure 17: Integration of MAGI-Based Medicaid Eligibility Determination Systems with Other Non-Health Programs

Premiums And Cost-sharing

Recognizing the limited family budgets of low-income individuals, federal rules set parameters in Medicaid and CHIP on the amount of premiums and cost-sharing, such as copayments, coinsurance, and deductibles, that states may charge (see Box 1). Consistent with federal rules, the findings presented below show that premiums and cost-sharing for selected services generally remain low in Medicaid and CHIP as of January 1, 2015. Even with flexibility to charge premiums and cost-sharing, many states limit charges in their programs to minimize barriers for enrollees in accessing care and reduce administrative burdens and complexities for state agencies.

Box 1: Premium and Cost-Sharing Rules for Medicaid and CHIP

States have flexibility to impose premiums and cost-sharing in Medicaid, with the maximum allowable amounts varying by income and group. Medicaid enrollees, including children, pregnant women, parents and the adult expansion group, with incomes below 150 percent of the FPL may not be charged premiums. Cost-sharing generally is not allowed for children with incomes below 133 percent of the FPL. Adults enrolled in Medicaid may be charged cost-sharing, but charges for those below 100 percent of the FPL are limited to nominal amounts. Medicaid enrollees (both children and adults) with incomes above 150 percent of the FPL can be charged premiums and relatively higher cost-sharing compared to those at lower incomes. Cost-sharing cannot be charged for preventive services for children or emergency, family planning, and pregnancy-related services in Medicaid. Overall premium and cost-sharing amounts for a family members enrolled in Medicaid may not exceed five percent of household income. States have somewhat greater flexibility to charge premiums and cost-sharing for children covered by CHIP, although there remain federal limits on the amounts that can be charged, including the overall five percent of household income cap.16 See: Premiums, Copayments, & other Cost Sharing at http://medicaid.gov/medicaid-chip-program-information/by-topics/cost-sharing/cost-sharing.html

The ACA did not make direct changes to premium and cost-sharing rules for Medicaid and CHIP, but its adjustments to eligibility thresholds impacted how some states assess premiums and cost-sharing. Specifically, the ACA’s establishment of a minimum threshold for children’s Medicaid eligibility at 138 percent of the FPL effectively raised the income level at which premiums and cost-sharing start in some states. All children, regardless of age, with family incomes between 100 and 138 percent of the FPL now fall under Medicaid’s premium and cost-sharing protections. As a result, the income threshold above which premiums begin for children increased to 138 percent of the FPL in seven states. Similarly, changes in eligibility thresholds resulted in an increase in the income level at which cost-sharing begins in 14 states that charge cost-sharing in CHIP but not Medicaid. Other states adjusted the income level at which cost-sharing begins to align with their MAGI-converted eligibility thresholds.17 

Premiums

Overall, 30 states charge premiums or enrollment fees for children in Medicaid or CHIP. This total includes three states (CA, MD and VT) that charge premiums for children in Medicaid with incomes above 150 percent of the FPL, 23 states that charge monthly or quarterly premiums in their CHIP programs, and four states that charge annual enrollment fees in CHIP. The greater prevalence of premiums and enrollment fees in CHIP reflects the relatively higher family incomes of children covered by the program as well as its more flexible premium rules. Among the 26 states charging monthly or quarterly premiums for children in Medicaid or CHIP, most (21) limit the charges to children in families with incomes at or above 150 percent of the FPL, including eight that only assess the charges at income levels at or above 200 percent of the FPL. Median premium amounts per child range from $19 at 151 percent of the FPL to $102 at 351 percent of the FPL, although only two states provide coverage at this income level (Figure 18). The ACA protects children’s coverage through 2019, and, thus, premium increases are permitted only if specific methods for raising premiums were approved in the state Medicaid or CHIP plan as of March 23, 2010.

Figure 18: Median Monthly Premiums for Children in Medicaid/CHIP by Income, January 2015

There is variation across states in policies related to non-payment of premiums.18  If states charge premiums in Medicaid, they must offer a 60-day grace period before coverage can be cancelled for nonpayment. While unpaid premiums may result in termination of Medicaid coverage, states cannot require enrollees to repay premiums as a condition for re-enrollment, nor can they prevent eligible individuals from re-enrolling immediately. In CHIP, states are required to offer a minimum grace period of 30 days. Grace periods vary across the 23 states charging monthly or quarterly premiums in CHIP, with seven states providing the minimum 30-day grace period and 17 states providing grace periods of 60 days or longer. Following cancellations of coverage for nonpayment of premiums, states may delay re-enrolling former enrollees in CHIP coverage, but the ACA limits such lock-out periods to no more than 90 days. As of January 1, 2015, 13 of 23 states that charge monthly or quarterly premiums in their separate CHIP programs have lock-out periods. This count reflects newly established lock-out periods in eight states (IN, KS, LA, MA, NV, UT, VT and WA) and the elimination of lock-out periods in four states (CT, IL, OR, and WV) since January 2013. Missouri, Pennsylvania, and Wisconsin also reduced their lock out periods for non-payment of premiums from six months to 90 days. In 16 states, families who have been dis-enrolled due to non-payment of premiums must reapply to re-enroll in coverage. Eight states allow families to receive retroactive coverage if they pay outstanding premiums.

In general, states do not charge low-income parents and other adults premiums in Medicaid. This reflects the fact that eligibility for parents and other adults is generally limited to levels below which premiums can be charged. However, four states (AR, IA, MI, and PA) have received Section 1115 waiver approval to impose monthly payments that are not otherwise permitted under federal rules for some adults covered through their Medicaid expansions. As of January 1, 2015, these payments had been implemented in Iowa and Michigan. Although the specific policies vary across the four states, payment of these monthly contributions is not always a condition of enrollment, and, in some cases, individuals do not have to make the payments if they participate in certain activities or obtain an exemption.

Cost-Sharing

Overall 26 states charge cost-sharing for children in Medicaid or CHIP. Four states charge cost-sharing for children in Medicaid, while 24 of 36 states with separate CHIP programs charge cost-sharing, although cost-sharing requirements vary by income. Cost-sharing for children begins at or above 133 percent of the FPL in all of these states, except Tennessee, which assesses cost-sharing at lower income levels under Section 1115 waiver authority. Cost-sharing also varies by service type. For example, for a child with family income at 201 percent of the FPL, 21 states charge cost-sharing for a physician visit, 13 charge for an emergency room visit, 20 charge for non-emergency use of the emergency room, 15 charge for an inpatient hospital visit, and 20 have charges for prescription drugs, although, in some cases, charges only apply to brand name or non-preferred brand name drugs (Figure 19).

Figure 19: Number of States with Cost-Sharing for Selected Services for Children at 201% FPL, January 2015

Most states (40) charge cost-sharing for Section 1931 parents in Medicaid and 20 of the 28 states that have expanded Medicaid have cost-sharing for expansion adults (Figure 20). Reflecting the low incomes of parents and adults covered by Medicaid, this cost-sharing is generally limited to nominal amounts. For parents, 24 states charge cost-sharing for a physician visit, 20 charge for non-emergency use of the emergency room, 27 charge for an inpatient hospital visit, and 39 charge for prescription drugs, although, in some cases, the charges only apply to brand name drugs. Among the 28 states with coverage for Medicaid expansion adults, 9 charge cost-sharing for a physician visit, 13 charge for non-emergency use of the emergency room, 12 charge for an inpatient hospital visit, and 19 charge for prescription drugs.

Figure 20: Number of States with Cost-Sharing for Selected Services for Adults, January 2015

Looking Ahead

Taken together, these findings show that, one year into implementation, the ACA has accelerated meaningful transformation of the Medicaid program, broadening it as a base of coverage for the low-income population and leading to substantial modernization of its enrollment processes and systems. There have been significant increases in eligibility levels for low-income adults in states that expanded Medicaid, but eligibility levels remain low in states that have not expanded, resulting in gaps in coverage. Medicaid and CHIP coverage for children and pregnant women remains strong across states. On the operational and systems side, many states have achieved notable progress toward realizing the ACA’s vision of a streamlined, technology-driven enrollment system, but work continues in many areas.

Looking ahead to 2015, state and federal officials will continue efforts to refine Medicaid and CHIP procedures and systems to move closer toward the ACA’s vision of a real-time, data-driven eligibility and enrollment experience. Enhancing information technology systems, implementing streamlined renewal processes, and improving coordination between Medicaid and the Marketplaces will be among the top priorities going forward. At the same time, other changes in Medicaid and the broader health care system, such as delivery and payment system reforms, CHIP reauthorization, and continued action related to the ACA, including the Supreme Court’s consideration of King v. Burwell regarding the provision of premium tax credits in FFM states, all have important implications for coverage. Following are key issues to consider looking ahead to 2015.

The Medicaid expansion to low-income adults will likely lead to continued gains in enrollment. Newly tracked Medicaid and CHIP eligibility and enrollment performance metric data released monthly by CMS show large gains in Medicaid enrollment across states since the initial open enrollment period for the Marketplaces began in October 2013.19  The data show that Medicaid expansion states have experienced significantly greater enrollment gains than states that have not yet expanded. However, there have been gains across nearly all states, reflecting increased enrollment among both adults made newly eligible by the expansion as well as individuals who were previously eligible but not enrolled who were reached through outreach and enrollment efforts. Emerging data also suggest that these gains in Medicaid enrollment are leading to reductions in the number of uninsured. Although data from the large federal population-based surveys are not yet available to measure changes in uninsured rates, several recent private surveys have consistently shown corresponding reductions in the uninsured rate since implementation of the ACA, and one study found that the uninsured rate dropped by 4 percentage points in expansion states, compared to 1.4 percentage points in non-expansion states.20  However, gaps in coverage remain in the 23 states that have not expanded Medicaid, leaving nearly four million poor adults without access to an affordable health coverage option. Moreover, continued progress in adopting streamlined renewal procedures will be important for preventing potential coverage losses or gaps over time.

Additional states may move forward with the Medicaid expansion. There is no deadline by which states must decide to implement the Medicaid expansion to low-income adults and debate continues in several states. However, the 100 percent federal financing for newly eligible individuals begins to phase down after 2016 to 90 percent by 2020. To date, a limited number of states have obtained or are seeking approval through Section 1115 waivers to implement the expansion in ways that extend beyond the flexibility provided by the law. Looking ahead, more states may pursue alternative models through waivers to extend coverage with federal dollars. These waivers are intended to be research and demonstration projects, and, as such, it will be important to evaluate their impacts to provide greater insight into serving Medicaid’s low-income beneficiaries. What happens with Medicaid waivers between 2014 and 2016 also will be important to inform the use of the new state innovation waiver authority available in 2017, which will allow states waive certain Marketplace provisions and may be combined with Medicaid waivers to implement state-specific health reform approaches.

As of 2015, states may also expand coverage through a new option established by the ACA, the Basic Health Program (BHP). In March 2014, CMS published final regulations that describe how states can provide coverage through a BHP for individuals who do not qualify for Medicaid or CHIP but have income under 200 percent of the FPL. This option allows states to finance a state-run program with 95 percent of the federal funding these enrollees would receive for premium tax credits and cost-sharing reductions. As noted, Minnesota became the first state to implement a BHP and converted existing Medicaid coverage for enrollees with incomes between 138 and 200 percent of the FPL to a BHP. In addition, New York has indicated plans to pursue a BHP.

States will continue work to advance enrollment and renewal processes and enhance their system functionality, supported by ongoing 90 percent federal funding for Medicaid eligibility and enrollment systems. High-performing eligibility and enrollment systems are central to moving toward a paperless process for determining eligibility for new applicants and keeping eligible enrollees covered at renewal. While challenges exist to achieving real-time, data-driven eligibility determinations, the shift from paper documentation to electronic sources will improve over time as states use the enhanced federal funds to harness technology and secure access to more data sources. Moreover, the funding will help support continued system enhancement to move states closer toward the automated, electronic data-driven renewal processes called for in the ACA, as states work to resolve challenges transitioning to new renewal processes and phase out mitigation strategies. Similarly, continued work will be important for ensuring smooth account transfers between Medicaid and Marketplaces to assure “no wrong door” access to coverage and prevent delays in enrollment. In addition, the three-year extension of flexibility to charge other public benefits programs only the added cost of consolidating eligibility determinations into the new Medicaid systems will support state efforts to phase-in integration of other programs.

Lastly, 2015 will be a pivotal year for children’s health coverage as CHIP funding will not extend beyond September 2015 without congressional action. Together, CHIP and Medicaid have led the way to historically high levels of coverage for children. When CHIP was enacted, it spurred improvements in children’s coverage, which have served as a catalyst for many of the innovations in streamlining eligibility and enrollment that were adopted by the ACA. The future of CHIP will have important implications for children’s coverage. As debates over extended funding for CHIP advances, it will be important to consider barriers to coverage as well as differences in coverage between CHIP and the Marketplace to understand the implications of CHIP funding decisions.

The authors extend our sincere appreciation to the many state officials who generously shared their time and expertise with us to participate in this survey and help us to understand the nuances of their programs.  This report would not be possible without them, and we greatly value their contributions during such a busy time. We also extend our thanks to Martha Heberlein, formerly with the Georgetown University Center for Children and Families, for her work on this report.

Tables

Table A:  Expanding Eligibility and Simplifying Enrollment: Trends in State Medicaid and CHIP Eligibility and Enrollment Policies, July 1997 to January 2015

Table 1:  Adult Income Eligibility Limits as a Percent of the Federal Poverty Level

Table 2:  Income Eligibility Limits for Children’s Health Coverage as a Percent of the Federal Poverty Level (FPL)

Table 3:  Waiting Period for CHIP Enrollment

Table 4:  Optional Medicaid and CHIP Coverage for Children

Table 5:  Medicaid and CHIP Coverage for Pregnant Women

Table 6:  Online and Telephone Medicaid Applications

Table 7:  Online Account Capabilities for Medicaid

Table 8:  Income Verification Procedures Used by Medicaid Agencies at Application

Table 9:  Non-Financial Eligibility Criteria Verification Procedures Used by Medicaid Agencies

Table 10:  Adoption of Targeted Strategies to Streamline Enrollment of Eligible Individuals

Table 11:  Renewal Delays and Targeted Strategies to Streamline Renewal

Table 12:  Integration between Eligibility Systems for Medicaid and Other Programs

Table 13:  Premium, Enrollment Fee, and Cost-Sharing Requirements for Children

Table 14:  Premiums and Enrollment Fees for Children at Selected Income Levels

Table 15:  Disenrollment Policies for Non-Payment of Premiums in Children’s Coverage

Table 16:  Cost-Sharing Amounts for Selected Services for Children at Selected Income Levels

Table 17:  Cost-Sharing Amounts for Prescription Drugs for Children at Selected Income Levels

Table 18:  Premium and Cost-Sharing Requirements for Selected Services for Section 1931 Parents

Table 19:  Cost-Sharing for Selected Services for Medicaid Expansion Adults

Endnotes

  1. Indiana, Oklahoma, and Utah provide more limited coverage to some childless adults under Section 1115 waiver authority. ↩︎
  2. R. Garfield, et al., “The Coverage Gap: Uninsured Poor Adults in State that Do Not Expand Medicaid – An Update,” Kaiser Family Foundation, November 2014. ↩︎
  3. J. Guyer, T. Schwartz, S. Artiga, “Fast Track to Coverage: Facilitating Enrollment of Eligible People into the Medicaid Expansion, Kaiser Commission on Medicaid and the Uninsured, November 2013. ↩︎
  4. Smith, V., et al.., “Medicaid in an Era of Health and Delivery System Reform: Results from a 50-State Medicaid Budget Survey for State Fiscal Years 2014 and 2015,” Kaiser Commission on Medicaid and the Uninsured, October 14, 2014, https://modern.kff.org/report-section/medicaid-in-an-era-of-health-delivery-system-reform-eligibility-and-enrollment/ ↩︎
  5. The Medicaid and CHIP Payment and Access Commission, “Report to the Congress on Medicaid and CHIP,” June 2014. ↩︎
  6. As in past reports, information is not included for low income seniors or people with disabilities covered by Medicaid. ↩︎
  7. The ACA established new standards for determining eligibility based on tax law in order to align coverage across the insurance affordability programs, including Medicaid, CHIP and subsidies in the health insurance marketplaces. MAGI rules establish specific guidelines for counting income and household size, although there are some exceptions in determining Medicaid eligibility only. States can no longer use asset tests in determining eligibility and were required to convert their pre-ACA eligibility levels accounting for the use of income disregards and deductions to the new MAGI standards, which were implemented on January 1, 2014. A standard five-percentage point disregard applies to the upper eligibility limits in determining MAGI-based eligibility. MAGI rules apply only to coverage for children, pregnant women, parents and the new expansion adult group, not to seniors or the disabled. ↩︎
  8. The newly elected governor in Pennsylvania has indicated plans to move to the state option for expansion. ↩︎
  9. Indiana, Oklahoma, and Utah provide more limited coverage to some childless adults under Section 1115 waiver authority. ↩︎
  10. R. Garfield, et al., “The Coverage Gap: Uninsured Poor Adults in State that Do Not Expand Medicaid – An Update,” Kaiser Family Foundation, November 2014. ↩︎
  11. J. Edwards, et al., “Reducing Paperwork to Improve Enrollment and Retention in Medicaid and CHIP,” Medical Institute at United Hospital Fund, October 2009. ↩︎
  12. J. Guyer, T. Schwartz, S. Artiga, “Fast Track to Coverage: Facilitating Enrollment of Eligible People into the Medicaid Expansion, Kaiser Commission on Medicaid and the Uninsured, November 2013. ↩︎
  13. CMS announced its plan in a letter dated October 28, 2014 from Cindy Mann, Director of the Center for Medicaid and CHIP Services, to the American Public Human Services Association and the National Association of Medicaid Directors. http://ccf.georgetown.edu/wp-content/uploads/2014/10/Letter-to-APHSA-and-NAMD-from-Cindy-Mann-10-28-14-.pdf ↩︎
  14. Smith, V., et al.., “Medicaid in an Era of Health and Delivery System Reform: Results from a 50-State Medicaid Budget Survey for State Fiscal Years 2014 and 2015,” Kaiser Commission on Medicaid and the Uninsured, October 14, 2014, https://modern.kff.org/report-section/medicaid-in-an-era-of-health-delivery-system-reform-eligibility-and-enrollment/ ↩︎
  15. Letter from Cindy Mann, October 28, 2014, op cit. ↩︎
  16. CHIP rules also limit the amounts that may be charged to enrollees. For families earning less than 150 percent of FPL, premiums cannot exceed $19 per month depending on income and family size while co-payments and other cost-sharing limits are slightly higher than Medicaid. No limits apply to families with income above 150 percent of the FPL, except the total annual cost-sharing cap of five percent of income, which applies to all CHIP enrollees. ↩︎
  17. An interim study published in November 2013 compares the pre-ACA eligibility levels with the MAGI-converted levels. For more information see, “Getting into Gear for 2014: Shifting New Medicaid Eligibility and Enrollment Policies into Drive.” ↩︎
  18. If states charge premiums in Medicaid, they must provide a 60-day grace period because cancelling coverage due to nonpayment of premiums. Additionally, they are prohibited from locking beneficiaries out of coverage or making them repay outstanding amounts in order to re-enroll. See 42 CFR 447.55. ↩︎
  19. CMS posts state-by-state, monthly Medicaid and CHIP application and enrollment data, which can be found at http://medicaid.gov/medicaid-chip-program-information/program-information/medicaid-and-chip-enrollment-data/medicaid-and-chip-application-eligibility-determination-and-enrollment-data.html. ↩︎
  20. L. Clemans-Cope, et al., “Increase in Medicaid under the ACA Reduces Uninsurance, According to Early Estimates,” The Urban Institute, June 25, 2014. ↩︎
News Release

New Report on the “Rising Cost of Living Longer” Details Medicare Spending by Age

Published: Jan 14, 2015

A new report from the Kaiser Family Foundation takes a detailed look at per person Medicare spending by age and by service among the nearly 30 million people covered by traditional Medicare in 2011.  This analysis examines the relationship between Medicare per person spending and advancing age, providing new data to inform ongoing federal budget discussions and efforts to improve care for an aging population. Medicare beneficiaries age 80 and older account for a disproportionate share of Medicare spending and are expected to triple as a share of the 65+ population by 2050.

Key findings from the report, The Rising Cost of Living Longer:  Analysis of Medicare Spending by Age for Beneficiaries in Traditional Medicare, include:

  • Medicare per capita spending for seniors rises with age, as expected, but does not peak until age 96— more than doubling between the ages of 70 and 96, from $7,566 to $16,145 — before declining for the small number of beneficiaries living into their late 90s and beyond.
email_alert_graphic
  • The age at which Medicare per capita spending peaks has increased over time, rising from age 92 in 2000 to age 96 in 2011.
  • The increase in spending by age is not entirely explained by end of life care; in fact, average Medicare spending per person for beneficiaries in traditional Medicare who died during 2011 declined with age, from about $43,000 among 70-year-olds to $20,000 among 100-year-olds.
  • Spending on inpatient hospital care, the largest component of per capita Medicare costs, rises with age and begins to decline only when beneficiaries reach their mid-to-late 90s.  At the same time, skilled nursing facility and hospice per capita spending increases dramatically for beneficiaries in their late 80s and 90s.  These findings raise questions as to whether the very oldest people on Medicare are receiving the appropriate mix of services and in the most appropriate setting.

These key findings are also discussed in a companion article published as a web first today in the journal Health Affairs titled, Medicare Per Capita Spending By Age and Service: New Data Highlights Oldest Beneficiaries. The analysis is based on 2000-2011 Medicare claims data from the Centers for Medicare and Medicaid Services’ Chronic Conditions Data Warehouse. The study examines spending among beneficiaries in traditional Medicare because comparable spending data are not available for beneficiaries enrolled in Medicare Advantage.  The spending figures in the analysis do not include personal or Medicaid-related spending on long-term care.

The full report, including a discussion of methodology and a link to the Health Affairs article, is available online. More Kaiser resources on the Medicare program can be found at kff.org.

The Rising Cost of Living Longer: Analysis of Medicare Spending by Age for Beneficiaries in Traditional Medicare

Authors: Tricia Neuman, Juliette Cubanski, Jennifer Huang, and Anthony Damico
Published: Jan 14, 2015

Introduction

A companion article to this report, entitled “Medicare Per Capita Spending By Age And Service: New Data Highlights Oldest Beneficiaries” has been published in the journal Health Affairs.

In the context of ongoing discussions about the federal budget and national debt, policymakers, experts, and the media have called attention to the nation’s growing aging population and the implications for Medicare and the federal budget.  At the same time, geriatricians and other providers who care for older patients are giving greater attention to the question of how best to meet the needs of an aging population.  Between 2010 and 2050, the United States population ages 65 and older will nearly double, the population ages 80 and older will nearly triple, and the number of nonagenarians and centenarians—people in their 90s and 100s—will quadruple.1   The aging of the population has important implications for future Medicare spending because beneficiaries ages 80 and older account for a disproportionate share of Medicare expenditures.  According to the Congressional Budget Office, population aging is expected to account for a larger share of spending growth on the nation’s major health care programs through 2039 than either “excess spending growth” or subsidies for the coverage expansions provided under the Affordable Care Act.2 

To inform discussions about Medicare’s role in providing coverage for an aging population and to assess the relationship between Medicare spending and advancing age, this report takes an in-depth look at patterns of Medicare spending by age, overall and by type of service.3   Using the most current Medicare spending data available for beneficiaries in traditional Medicare in 2011 and trends since 2000, the analysis explores the following questions:

  • To what extent does Medicare per capita spending rise with age among beneficiaries in traditional Medicare, and at what age does per capita spending reach its peak before starting to decline?
  • How does per capita spending for specific Medicare-covered services vary by age for beneficiaries in traditional Medicare over age 65, and how have these patterns changed over time?
  • Has Medicare per capita spending for older beneficiaries (ages 80 and older) been increasing over time, after controlling for inflation?
  • What is the pattern of per capita spending by age among decedents, and how does spending on decedents affect the pattern of per capita spending among traditional Medicare beneficiaries overall?

This analysis is based on data from a 5 percent sample of Medicare claims from the Chronic Conditions Data Warehouse (CCW) of the Centers for Medicare & Medicaid Services (CMS) from 2000 to 2011 (the most recent year available when this analysis was conducted) that includes all Medicare-covered claims for services covered under Parts A, B, and D.  The analysis excludes beneficiaries who are age 65 because some of these beneficiaries are enrolled for less than a full year; therefore, a full year of Medicare spending data is not available for all people at this year of age.  The analysis focuses on Medicare beneficiaries over age 65 rather than younger adults who qualify for Medicare because of a permanent disability to develop a better understanding of the relationship between Medicare spending and advancing age.

This study examines patterns of Medicare spending among beneficiaries in traditional Medicare rather than in Medicare Advantage plans because comparable data on Medicare spending by service are not available for this population (Medicare spending for Medicare Advantage enrollees takes the form of monthly capitation payments which are not based on actual service utilization4 ).  Because we lack comparable data for the 25 percent of beneficiaries enrolled in Medicare Advantage in 2011, it is not possible to assess whether patterns of service use and spending in traditional Medicare apply to the Medicare population overall.  More information about the data, methods, and limitations can be found in the Methodology.

Key Findings

  • Medicare’s octogenarians, nonagenarians, and centenarians account for a disproportionate share of Medicare spending. In 2011, beneficiaries ages 80 and older comprised 24 percent of the traditional Medicare population, but 33 percent of total Medicare spending on this population (Exhibit I.1).  In contrast, beneficiaries between the ages of 65 and 69 comprised 26 percent of the traditional Medicare population, but just 15 percent of total Medicare spending.
  • In 2011, overall Medicare per capita spending increased with age, peaked at age 96, and then declined gradually for the relatively small number of beneficiaries at older ages (Exhibit I.2). Average Medicare per capita spending in 2011 more than doubled between age 70 ($7,566) and age 96 ($16,145).
Exhibit I.1: People ages 80 and older accounted for 24 percent of the Medicare population and 33 percent of Medicare spending in 2011
Exhibit I.2: Traditional Medicare per capita spending increased with age in 2011 and peaked at age 96 before declining; the pattern is similar when decedents are excluded
  • The increase in Medicare per capita spending as beneficiaries age can be partially, but not completely, explained by the high cost of end-of-life care. Medicare per capita spending among survivors in 2011 (excluding beneficiaries who died during the year) also rises with age and peaks at age 96 ($14,278) before falling—but the averages are higher when decedents are included (Exhibit I.2).
  • The pattern of Medicare per capita spending for beneficiaries who died in 2011 is markedly different; it declined steadily with age, falling from $43,000 among 70-year-olds to under $20,000 among centenarians. Yet because of higher death rates among older beneficiaries, average per capita spending among beneficiaries who die at older ages has a greater influence on the estimates of average spending among all beneficiaries at older ages.
  • Between 2000 and 2011, Medicare per capita spending peaked at older ages, and was higher at the peak age in 2011 than in 2000, after controlling for inflation. Medicare per capita spending peaked at age 92 in 2000 ($9,557 in inflation-adjusted 2011 dollars), rising to age 96 by 2011 ($15,015 excluding Part D spending and $16,145 including Part D spending).
  • Over time, the difference in Medicare per capita spending between beneficiaries ages 80 and older and younger beneficiaries has widened. In 2011, Medicare per capita spending was 2.5 times greater for 85-year-olds ($13,466) and 3 times greater for 95-year-olds ($15,732) than for 66-year-olds ($5,562).
  • Between 2000 and 2011, Medicare per capita spending grew faster for beneficiaries ages 90 and older than for younger beneficiaries over age 65, both including and excluding spending on the Part D prescription drug benefit beginning in 2006. Including Part D spending, per capita spending grew at an average annual rate of 5.8 percent for beneficiaries ages 66 to 69 over these years, rising to 7.3 percent among beneficiaries ages 90 and older.
  • The amount of average Medicare per capita spending on many Medicare-covered services in 2011 generally increased with age for beneficiaries in their 70s and 80s and then began to decline for older beneficiaries; the main exceptions were skilled nursing facility (SNF) and home health per capita spending, which increased for beneficiaries in their 90s before declining, and hospice spending which generally increased with age through the 90s and beyond (Exhibits I.2 and I.3). In contrast, per capita Part D drug spending was roughly constant among beneficiaries in their 60s, 70s, 80s, and 90s.
Exhibit I.3: In 2011, Medicare per capita spending peaked at age 83 for physician and outpatient services, but at older ages for inpatient care (89), home health (96), skilled nursing facility (98), and hospice (104)
      • In 2011, Medicare per capita spending on hospital inpatient services increased more than 2.5 times from $1,848 among 66-year-olds to $4,799 among 89-year-olds before declining among older beneficiaries. While per capita inpatient spending peaks at age 89, spending on inpatient care is relatively similar for beneficiaries between the ages of 84 and 97 (plateauing at around $4,500 per beneficiary).
      • Despite a gradual reduction in Medicare per capita spending for Part B providers, services, and supplies for beneficiaries beginning in their mid to late 80s, per capita spending continues to climb into the mid-90s due to persistent levels of inpatient hospital spending and a sharp rise in skilled nursing facility and hospice spending in the late 80s and 90s. Between ages 86 and 96, Medicare per capita spending on skilled nursing facility services increased by more 50 percent (from $2,043 to $3,149) while per capita spending on hospice tripled (from $706 to $2,299).
      • The relatively high per capita spending among beneficiaries in their mid-to late-90s in 2011 is influenced by skilled nursing facility (SNF), hospice, and (to a lesser extent) home health spending; excluding spending on these services, overall per capita spending peaks at age 89.
  • Inpatient hospital care accounted for the largest share of per capita spending among traditional Medicare beneficiaries ages 66 and older in 2011, with the exception of centenarians for whom hospice spending comprised the largest share of their total Medicare per capita spending. As beneficiaries grow older, per capita spending on physician services accounts for a declining share of per capita costs.

Implications

This analysis shows Medicare per person spending rising steadily with age, more than doubling between ages 70 and 95 in 2011, and peaking at age 96, before declining for the relatively small number of beneficiaries at relatively older ages.  The cost of care for Medicare beneficiaries who died in 2011 contributes to higher average per capita Medicare costs at all ages, but does not alter the pattern of per capita spending nor does it affect the peak age of Medicare spending in 2011.  And over time, Medicare per capita spending has peaked at older ages, from age 92 in 2000 to age 96 in 2011, based on inflation-adjusted dollars.

As adults live into their 80s and beyond, they are more likely to live with multiple chronic conditions and functional limitations, and this combination (compared to having chronic conditions only) is associated with a greater likelihood of emergency department visits and inpatient hospitalizations as well as higher Medicare spending for inpatient hospital, skilled nursing facility, and home health services.5   Thus, it is not surprising that Medicare per capita spending is higher, on average, for older beneficiaries compared to those in their 60s and 70s.  At the same time, the pattern of increasing per capita spending until beneficiaries are in their mid-90s raises questions as to whether beneficiaries are getting the appropriate mix of services as they age and whether more could be done to improve the management and delivery of medical care for aging Medicare beneficiaries.

The Affordable Care Act (ACA) launched several payment and delivery system reforms that could alter patterns of care and spending for people on Medicare.  Several of these initiatives aim to maintain or improve the quality of patient care and lower costs by reducing unnecessary care, managing care for high-need, “at risk” patients, and treating beneficiaries in the most appropriate (least cost) setting.6   The ACA also included provisions that aim to reduce unnecessary, preventable hospitalizations, better manage transitions following hospitalizations, and improve care management for beneficiaries who are dually eligible for Medicare and Medicaid.7   Recently, the Centers for Medicare & Medicaid Services (CMS) announced it would provide payments to physicians who manage care for beneficiaries with two or more chronic conditions.8   These efforts potentially could lower costs and improve care for Medicare patients, including the oldest old.

Consistent with other studies documenting higher costs for patients at the end of life, this analysis shows that Medicare per capita spending was nearly 4-times greater among beneficiaries who died in 2011, on average, than among those who lived the entire year.  Yet the analysis also shows that Medicare per capita spending among decedents declines with age, suggesting that patients, families, and providers may be opting for less intensive and less costly end-of-life interventions for beneficiaries as they grow older.  This possibility is consistent with the finding that average per capita spending on hospice services among beneficiaries in traditional Medicare increases with age, due to both a larger share of beneficiaries electing hospice at older ages and higher per capita hospice costs for older than younger Medicare beneficiaries who elect hospice care.

As the U.S. population ages, the increase in the number of people on Medicare and the aging of the Medicare population are expected to increase both total and per capita Medicare spending.  The increase in per capita spending by age not only affects Medicare, but other payers as well.  In fact, other studies have documented increases in both Medicaid and out-of-pocket spending by age, primarily attributable to the cost of long-term services and supports that are not covered by Medicare.9 ,10   Further work is needed to better understand the social, medical, and long-term care needs of older Americans and how best to address those needs.  Focusing on ways to improve the management and coordination of care for high-need, high-cost patients, many of whom are among Medicare’s oldest beneficiaries, will be essential to meet the needs of an aging population.

Report: Section 1: Medicare Per Capita Spending By Age Among Traditional Medicare Beneficiaries Over Age 65, 2011 And Trends, 2000-2011

  • Between 2010 and 2050, the population ages 65 and older will double, from about 40 million to 84 million people. The number of octogenarians (people ages 80 and older) will nearly triple over these years from about 11 million to about 31 million, while the number of nonagenarians and centenarians (those in their 90s and 100s) is projected to quadruple from 2 million to 8 million by 2050.  1
  • Medicare’s octogenarians, nonagenarians, and centenarians account for a disproportionate share of Medicare spending. In 2011, beneficiaries ages 80 and older comprised 24 percent of the Medicare population but 33 percent of total Medicare spending.  In contrast, beneficiaries between the ages of 65 and 69 comprised 26 percent of the Medicare population, but just 15 percent of total Medicare spending.11   2
  • Among Medicare beneficiaries over age 65, Medicare per capita spending rises gradually with age and peaks at age 96, before declining. In 2011, average per capita Medicare spending nearly tripled between age 66 ($5,562) and age 96 ($16,145), and then fell gradually for the relatively small number of seniors who lived to older ages.12   3
  • Medicare per capita spending rises with age, even when the analysis excludes all beneficiaries who died during the year. Medicare per capita spending among Medicare beneficiaries over age 65 who survived the full year in 2011 (excluding decedents) also rises with age and peaks at age 96 ($14,278).  4
  • The increase in Medicare per capita spending by age for all Medicare beneficiaries over age 65 is not entirely attributable to end-of-life care nor to higher death rates among older beneficiaries. Medicare per capita spending is considerably higher for people who die during the year than people who survive the entire year ($33,486 versus $8,647 in 2011) and accounts for a disproportionate share of Medicare spending, yet the increase in spending by age is not entirely due to higher spending at the end of life.13 ,14   In fact, Medicare spending for beneficiaries who died during the year declined steadily with age in 2011, from a high of about $43,000 among 70-year-old decedents, to about $20,000 among centenarians who died that year.15   5  The decline in Medicare per capita spending by age among beneficiaries who died during 2011 is largely attributable to a decline in inpatient spending (see Section 2, Exhibits 2.12 and 2.13 and Table 2 for details on spending by type of service among decedents).  Yet because of higher death rates among older beneficiaries (rising from 2 percent of 70-year-olds to 13 percent of 90-year-olds and 29 percent of 100-year-olds), average per capita spending among beneficiaries who die at older ages has a greater influence on the estimates of average spending among beneficiaries overall at older ages.16 
  • Between 2000 and 2011, the age at which Medicare per capita spending reached its peak increased from age 92 to age 96. At all ages, Medicare per capita spending was higher in 2011 than in 2000, including adjustments for inflation and the introduction of the Part D prescription drug benefit.  In 2000, Medicare per capita spending peaked at $9,557 (in 2011 dollars) at age 92, while in 2011, Medicare per capita spending peaked at $16,145 (including Part D spending; $15,015 excluding Part D spending) at age 96.  6
  • The difference in Medicare per capita spending between beneficiaries ages 80 and older and younger beneficiaries over age 65 has grown wider over time. For example, in 2011, Medicare per capita spending was 2.5 times greater for 85-year-olds ($13,466) and 3 times greater for 95-year-olds ($15,732) than for 66-year-olds ($5,562).  These ratios have increased since 2000, when Medicare per capita spending was 2.3 times greater both for 85-year-olds ($8,959) and for 95-year-olds ($9,139) than for 66-year-olds ($3,908).  7
  • Medicare per capita spending grew faster for beneficiaries ages 90 and older than for younger beneficiaries over age 65 between 2000 and 2011. When spending on the Part D drug benefit is included beginning in 2006, per capita spending grew at an average annual rate of 5.8 percent for beneficiaries ages 66 to 69 between 2000 and 2011, rising to 7.3 percent among beneficiaries ages 90 and older.  (When Part D spending is excluded, the average annual growth rates are somewhat lower for each age group but the trend by age is similar.)  8  During this period, Medicare per capita spending for beneficiaries ages 90 and older increased from $8,546 in 2000 (in 2011 dollars) to $14,217 in 2011 (including Part D spending), an increase of 66 percent over these years.  This increase was greater than the 43 percent increase among beneficiaries in their 70s and the 51 percent increase among those in their 80s.9

Report: Section 2: Patterns In Traditional Medicare Per Capita Spending For Selected Medicare-covered Services In 2011 And Trends, 2000-2011

  • Medicare per capita spending for various Medicare-covered services peaked at different ages in 2011.  For example, Medicare per capita spending for inpatient care peaked at age 89, while per capita spending for both Part B providers/services/supplies and hospital outpatient services peaked at age 83.  For skilled nursing facility, home health, and hospice services, spending reached its highest level among the oldest old beneficiaries: ages 98, 96, and 104, respectively.  1
    • The relatively high per capita spending among beneficiaries in their mid-to late-90s in 2011 is influenced by skilled nursing facility (SNF), hospice, and (to a lesser extent) home health spending; excluding spending on these services, overall per capita spending peaks at age 89.
  • The amount of average Medicare per capita spending on most types of services generally rises and then falls with age, with the exception of hospice spending, which peaks among the oldest beneficiaries, and Part D prescription drug spending which is roughly similar among beneficiaries at different ages. 2  For example, in 2011:
    • Medicare per capita spending for inpatient hospital care increased more than 2.5 times from a low of $1,848 among 66-year-olds to a high of $4,799 among 89-year-olds, and then decreased somewhat to $4,432 for 95-year-olds and $4,122 for 100-year-olds. While inpatient spending peaked at age 89 in 2011, spending on inpatient care was relatively similar for beneficiaries between the ages of 84 and 97 (plateauing at around $4,500).
    • Medicare per capita spending for Part B providers, services, and supplies roughly doubled from $1,368 at age 66 to a high of $2,670 at age 83, before declining.
  • Despite a gradual reduction in Medicare per capita spending for Part B providers, services, and supplies for beneficiaries beginning in their mid to late 80s, per capita spending continues to climb into the mid-90s due to persistent levels of inpatient hospital spending and a sharp rise in skilled nursing facility and hospice spending in the late 80s and 90s.
    • Between ages 86 and 96, Medicare per capita spending on skilled nursing facility services increased by more 50 percent (from $2,043 to $3,149) while per capita spending on hospice tripled (from $706 to $2,299).
    • The increase in Medicare per capita spending on skilled nursing facility, home health, and hospice services at older ages is attributable to both a larger share of older beneficiaries using these services compared to younger beneficiaries and higher per capita costs for older users of these services compared to younger users.
  • The distribution of Medicare per capita spending on different types of Medicare-covered service varied by age in 2011. 3
    • Inpatient hospital spending was the largest component of total Medicare per capita spending for beneficiaries at all ages over age 65 in 2011, except for centenarians, for whom hospice spending comprised the largest share of total per capita spending.
    • Between the ages of 70 and 95, Medicare spending on Part B providers/services/supplies declined as a share of total per capita spending from 27 percent to 15 percent, while spending on skilled nursing facility services quadrupled as a share of total per capita spending, rising from 5 percent at age 70 to 20 percent at age 95. Between ages 70 and 95, spending on home health services doubled as a share of total per capita spending, from 4 percent to 9 percent, and spending on hospice services increased from 1 percent of total per capita spending at age 70 to 13 percent at age 95.
  • Between 2000 and 2011, Medicare per capita spending increased with age, both overall and by type of service. For example:
    • In both 2000 and 2011, Medicare per capita spending for inpatient hospital care increased with age, peaking for beneficiaries in their late 80s and early 90s. The per capita spending increase between 2000 and 2011 for inpatient care was relatively modest for most beneficiaries over age 65 compared to the increase in per capita spending for other types of services, except for the centenarians who account for a very small share of the population (~200,000 beneficiaries).  4
    • The spending pattern for Medicare per capita spending for Part B providers, services, and supplies in 2011 is similar to what it was in 2000—increasing with age and peaking for beneficiaries in their early 80s. Medicare per capita spending on Part B providers, services, and supplies was about 30 percent higher in 2011 than in 2000 for beneficiaries at all ages, after adjusting for inflation. 5
    • Medicare per capita spending on hospital outpatient services more than doubled at all ages between 2000 and 2011, after controlling for inflation. In both 2000 and 2011, Medicare per capita spending on hospital outpatient services peaked for beneficiaries in their late 70s and early 80s, but was considerably higher at all ages in 2011 than in 2000.  6
    • In 2011, Medicare per capita spending on skilled nursing facility, home health, and hospice services increased at older ages, and the increase in per capita spending on these services by age was somewhat steeper in 2011 than in 2000. For example, in 2011, between ages 85 and 95, Medicare per capita spending increased from $1,832 to $3,088 for skilled nursing facility services, from $969 to $1,415 for home health services, and from $588 to $2,063 for hospice care.  After controlling for inflation, Medicare per capita spending on skilled nursing facility services for 95-year-olds was about two times greater in 2011 than in 2000 ($3,088 versus $1,576), about two times greater for home health services ($1,415 versus $721), and nearly five times greater for hospice care in 2011 than in 2000 ($2,063 versus $414).  7 8 9
    • In both 2000 and 2011, Medicare per capita spending for Part B drugs reached its peak for beneficiaries in their late 70s and early 80s, before declining. Per capita spending on Part B drugs was 50 percent higher or more at all ages in 2011 than in 2000, after controlling for inflation. 10
    • In contrast to other services where Medicare per capita spending in 2011 increased fairly steadily with age, Medicare per capita spending on prescription drugs covered under Part D was relatively constant across different years of age, but dropped off sharply for beneficiaries beginning at around age 100. (Trend data for 2000 is not available because the Part D benefit started in 2006.)  11
  • The decline in Medicare per capita spending by age among beneficiaries who died during 2011 is largely attributable to a decline in inpatient spending. For example, Medicare per capita spending on inpatient services among beneficiaries who died in 2011 was $24,508 for 70-year-olds but $11,446 among 9o-year-olds.  Among beneficiaries over age 65 who died in 2011, Medicare per capita spending for hospice care increased gradually with age, and accounted for a larger share of Medicare per capita spending at older ages; per capita hospice spending was $2,252 for decedents age 70 and $3,821 for decedents age 90.  12 13

Tricia Neuman and Juliette Cubanski are with the Kaiser Family Foundation; Jennifer Huang was formerly with the Foundation. Anthony Damico is an independent consultant.

Methodology

Description of the data.  This analysis is based on data from a random 5 percent sample of Medicare beneficiaries from the Chronic Condition Data Warehouse (CCW) of the Centers for Medicare & Medicaid Services (CMS) from 2000 to 2011.  The CCW includes Medicare administrative enrollment for all Medicare beneficiaries and claims data for beneficiaries enrolled in traditional Medicare; encounter data is not available for beneficiaries enrolled in Medicare Advantage plans.  The CCW also contains all Part D events (prescription drug fill records) from the start of the Part D benefit in 2006, regardless of whether the beneficiary was enrolled in a Medicare Advantage plan or a stand-alone prescription drug plan.  This analysis is based on data from the Cost and Use segment of the CCW, which contains summarized patient-level utilization information, by care setting for the calendar year of the data file.  It also includes Medicare and beneficiary payment information overall and by setting.  The following types of services and settings are included in this file:  hospital outpatient, acute inpatient, non-acute inpatient, skilled nursing facility, hospice, home health, physician office services, ambulatory surgery center, evaluation and management, anesthesia, dialysis, imaging, tests, durable medical equipment, Part B drugs, other Part B procedures, other Part B claims, and Part D drugs.

Sample.  The analysis focuses on beneficiaries over age 65 in traditional Medicare, excluding beneficiaries enrolled in Medicare Advantage and those who are under age 65.  Beneficiaries age 65 were excluded from the analysis of per capita spending because the analysis is based on a comparison of full-year per capita Medicare spending at each age and many beneficiaries age 65 are enrolled in Medicare for less than a full year, depending on their month of enrollment in Medicare; therefore a full year of Medicare spending data is not available for all people at this age.  The number of unweighted cases in 2011 declined from 96,517 66-year-olds (weighted n = 1,930,340) to 245 104-year-olds (weighted n = 4,900).  The analysis excludes spending for beneficiaries enrolled in Medicare Advantage plans because Medicare spending on this population takes the form of a monthly capitation payment to private plans and is not based on actual service utilization.  The analysis excludes spending for beneficiaries under age 65 who qualify for Medicare because of a permanent disability because this analysis is focused on spending patterns by age among older beneficiaries.

Methods.  For this analysis, we calculated Medicare per capita spending for beneficiaries at each year of age overall and by type of service.  Age was determined as of December 31 in each year of the analysis (2000-2011).  If the beneficiary died, the age was determined based on age at the time of death.  We aggregated spending on certain types of services into larger categories.  Spending on Part B providers/services/supplies includes all spending on Part B physician services, other Part B carriers, durable medical equipment, tests, imaging, other procedures, dialysis, anesthesia, evaluation and management, and ambulatory surgery center services.  Spending on hospital inpatient services includes acute inpatient care and other non-acute inpatient services.  When we refer to post-acute care, we are referring to skilled nursing facility and home health services.

To adjust Medicare per capita spending estimates for the years 2000 to 2010 to 2011 dollars, we used the Bureau of Labor Statistics’ Consumer Price Index (CPI) Inflation calculator.17   The CPI inflation calculator uses the average Consumer Price Index for a given calendar year.  These data represent changes in prices of all goods and services purchased for consumption by urban households.

Limitations.  This study describes but does not explain the pattern of Medicare per capita spending by age, and is not designed to assess factors related to the recent slow growth in total and per capita Medicare spending.  Because the 5 percent sample includes Medicare spending but not spending among other payers, this analysis does not examine how Medicaid and other payers’ spending varies by age, in relation to Medicare spending.  The 5 percent sample does not include patient characteristics, such as functional impairment, so the analysis does not control for covariates that could help explain patterns in spending and service use.

Our results reflect patterns of spending among traditional Medicare beneficiaries, but not the total Medicare population.  Because we lack comparable data for the 25 percent of beneficiaries enrolled in Medicare Advantage in 2011, it is not possible to assess whether patterns of service use and spending in traditional Medicare apply to the Medicare population overall.

Appendix Tables

Table 1:  Number of Traditional Medicare Beneficiaries over Age 65,Overall and for Survivors and Decedents, by Age, 2011
OverallSurvivorsDecedents
AGEUnweightedWeightedUnweightedWeightedUnweightedWeighted
All 66+1,439,67628,793,5201,370,35127,407,02069,3251,386,500
6696,5171,930,34095,1091,902,1801,40828,160
6793,5601,871,20092,0801,841,6001,48029,600
6893,3531,867,06091,6941,833,8801,65933,180
6988,3341,766,68086,8471,736,9401,48729,740
7077,2731,545,46075,7331,514,6601,54030,800
7171,6921,433,84070,2081,404,1601,48429,680
7267,3951,347,90065,7071,314,1401,68833,760
7366,5841,331,68064,7261,294,5201,85837,160
7461,9841,239,68060,2921,205,8401,69233,840
7558,9431,178,86057,0531,141,0601,89037,800
7656,1971,123,94054,2331,084,6601,96439,280
7753,0081,060,16051,0611,021,2201,94738,940
7849,220984,40047,134942,6802,08641,720
7948,423968,46046,152923,0402,27145,420
8046,595931,90044,149882,9802,44648,920
8146,054921,08043,404868,0802,65053,000
8242,425848,50039,803796,0602,62252,440
8340,799815,98037,914758,2802,88557,700
8439,115782,30036,185723,7002,93058,600
8535,526710,52032,525650,5003,00160,020
8632,763655,26029,627592,5403,13662,720
8730,218604,36027,145542,9003,07361,460
8826,613532,26023,644472,8802,96959,380
8923,587471,74020,676413,5202,91158,220
9020,870417,40018,108362,1602,76255,240
9117,094341,88014,538290,7602,55651,120
9213,071261,42010,959219,1802,11242,240
9311,084221,6809,159183,1801,92538,500
948,472169,4406,879137,5801,59331,860
956,512130,2405,196103,9201,31626,320
964,94198,8203,87177,4201,07021,400
973,68873,7602,80956,18087917,580
982,65153,0202,02640,52062512,500
991,90338,0601,38627,72051710,340
1001,19823,96085417,0803446,880
10181916,38060812,1602114,220
10255711,1403997,9801583,160
1033937,8602795,5801142,280
1042454,9001793,580661,320
NOTE: Analysis includes beneficiaries in traditional Medicare only (excludes beneficiaries with Medicare Advantage).SOURCE: Kaiser Family Foundation analysis of a 5 percent sample of Medicare claims from the CMS Chronic Conditions Data Warehouse, 2011.


Table 2:  Amount and Distribution of Medicare Per Capita Spending Overall and By Type of Servicefor Traditional Medicare Beneficiaries over Age 65, by Age, 2011
TOTAL PER CAPITAInpatient hospitalOutpatient hospitalPart B providers/ services/ suppliesPart B and D prescription drugsSkilled nursing facilityHome healthHospice
AGE$%$%$%$%$%$%$%$%
All 66+$9,839100%$3,23033%$1,23913%$2,33624%$1,25513%$9119%$5385%$3313%
665,5621001,84833868161,494279031621941763531
676,1631002,02533972161,671279891624741993601
686,6051002,163331,043161,794271,0471626442223721
696,9981002,292331,093161,919271,0881630442363671
707,5661002,450321,159152,054271,1911634952794841
718,0461002,623331,239152,177271,2321538353024891
728,5771002,841331,279152,296271,29015428533541091
738,9631002,951331,316152,415271,29714490535541392
749,2171003,019331,333142,467271,32914543639941261
759,7601003,259331,382142,543261,33314648743241622
769,9931003,321331,398142,596261,34413695746551732
7710,6561003,536331,465142,673251,43713796752652232
7810,9511003,734341,429132,711251,37613896856252442
7911,2821003,850341,449132,763241,39912941861452662
8011,6181003,962341,440122,763241,394121,073966463223
8111,8831003,985341,420122,776231,420121,1981069763883
8212,3581004,208341,419112,825231,441121,2971076664023
8312,9781004,388341,469112,884221,467111,4831183264554
8413,3531004,521341,414112,860211,413111,7301388575304
8513,4661004,490331,372102,818211,396101,8321496975884
8613,9871004,575331,365102,838201,430102,043151,03077065
8714,1161004,657331,27692,815201,408102,078151,09687856
8814,4231004,585321,28192,773191,386102,320161,18888916
8914,8811004,799321,29092,752181,37492,451161,20981,0057
9014,7451004,573311,24282,640181,34492,583181,23381,1328
9115,0111004,633311,18382,599171,37692,667181,30791,2468
9215,3611004,575301,11772,542171,37592,857191,32991,56710
9315,6821004,778301,12672,505161,31382,900181,38991,67111
9415,6021004,571291,11172,446161,35392,890191,38491,84712
9515,7321004,432281,10472,329151,30283,088201,41592,06313
9616,1451004,514281,06272,322141,33783,149201,46292,29914
9715,4901004,3462897662,218141,27982,809181,38792,47416
9815,6201004,1292699562,165141,27083,263211,32182,47716
9914,4971003,6972686461,881131,31292,506171,29192,94720
10015,4111004,1222780852,007131,16882,953191,30483,04920
10114,0341003,3582481461,6671299472,363171,381103,45825
10213,4271003,1812475861,559121,00982,298171,08183,54126
10311,9191002,7412373261,4211291481,744151,00583,36228
10411,3371002,8612552651,1711063061,9821761053,55831
NOTE: Analysis includes beneficiaries in traditional Medicare only (excludes beneficiaries with Medicare Advantage).SOURCE: Kaiser Family Foundation analysis of a 5 percent sample of Medicare claims from the CMS Chronic Conditions Data Warehouse, 2011.


Table 3:  Amount and Distribution of Medicare Per Capita Spending Overall and By Type of Servicefor Decedents in Traditional Medicare over Age 65, by Age, 2011
TOTAL PER CAPITAInpatient hospitalOutpatient hospitalPart B providers/ services/ suppliesPart B and D prescription drugsSkilled nursing facilityHome healthHospice
AGE$%$%$%$%$%$%$%$%
All 66+$33,486100%$16,99851%$1,9986%$4,48513%$1,5825%$3,94412%$1,2454%$3,23510%
6638,52910022,209583,13485,686152,35662,05151,08632,0075
6742,13610024,748593,43586,137152,50062,223592022,1725
6841,46210023,920583,30885,981142,64862,328698722,2906
6942,56410024,651583,82296,028142,28552,54761,05722,1735
7042,93310024,508573,42686,173142,72862,71161,13532,2525
7141,22610023,471573,11886,132152,76372,57661,03022,1355
7240,38210023,336582,92275,918152,38062,60461,01332,2085
7340,50610022,793563,05685,926152,18552,99471,14432,4086
7442,07710022,898543,01776,207152,30753,65091,25032,7487
7540,37210022,410562,91675,627142,03153,43991,23232,7177
7639,24210021,375542,64075,687142,22063,36491,10132,8557
7741,14110022,296542,71375,833142,29263,75691,40432,8477
7839,34410021,153542,55875,532141,90754,105101,21432,8777
7936,95910019,919542,38265,070141,86753,642101,30942,7717
8035,79410019,075532,12664,930141,61253,773111,31742,9608
8135,09210018,059512,02564,829141,62954,002111,40643,1429
8235,02510018,444531,96564,696131,35344,230121,21633,1209
8335,25610018,326522,00264,660131,44544,550131,28042,9928
8434,05110017,016501,86154,513131,39044,772141,36743,1319
8532,43110015,958491,62654,201131,24344,668141,37343,36110
8630,99410014,826481,41954,032131,12444,678151,34143,57512
8731,30610014,753471,48754,034131,28044,809151,34243,60212
8829,48610013,680461,31243,718131,16044,749161,34353,52412
8929,14810013,415461,36353,560121,04744,816171,29543,65113
9026,68710011,446431,33053,314121,06644,314161,39653,82114
9126,38210011,083421,14843,213121,12044,589171,30153,92815
9226,24010010,871411,07142,970111,02944,890191,29554,11416
9325,71610010,900421,08742,9881288534,468171,25554,13516
9423,5081009,386401,05042,6791195044,043171,25554,14418
9521,9931008,0853788342,4241192644,004181,16254,51021
9622,8971008,8783984642,5801197043,974171,22654,42419
9721,7161008,1393784542,4291190843,745171,24964,40020
9822,0331007,9693678942,442111,09254,099191,17954,46420
9917,5181006,0563571241,8121081852,9451768244,49426
10020,3181007,0803562332,1441170734,2692193154,56322
10117,4541005,7753381651,9281166742,277131,13364,85628
10219,2381006,2053277941,783980042,464131,01256,19532
10315,0991004,9133357741,5781086462,1481493164,08827
10419,3721006,5123447721,8711062933,3481780045,73530
NOTE: Analysis includes beneficiaries in traditional Medicare only (excludes beneficiaries with Medicare Advantage).SOURCE: Kaiser Family Foundation analysis of a 5 percent sample of Medicare claims from the CMS Chronic Conditions Data Warehouse, 2011.

Endnotes

  1. The population age 80 and older was 11.3 million in 2010 and is projected to grow to 30.9 million in 2050.  The population age 90 and older was 1.9 million in 2010 and is projected to grow to 8.0 million in 2050.  2010 population estimates are from U.S. Census Bureau. Population Division. Vintage 2011: National Tables. Table 1. Annual Estimates of the Resident Population by Sex and Five-Year Age Group for the United States: April 1, 2010 to July 1, 2011 (NC-EST2011-01); 2012 May; https://www.census.gov/popest/data/national/asrh/2011/tables/NC-EST2011-01.xls.    2050 population estimates are from U.S. Census Bureau, Population Division. 2012 National Population Projections: Summary Tables. Projections of the Population by Age and Sex for the United States: 2015 to 2060 (NP2012-T12). Middle series; 2012 Dec; https://www.census.gov/population/projections/files/summary/NP2012-T12.xls. ↩︎
  2. Between 2014 and 2050, the Medicare population is projected to grow from 54 to 93 million beneficiaries, and during this time period, net Medicare spending is expected to rise from 3.0% of GDP to 5.5% in 2050; see Congressional Budget Office, “The 2014 Long-Term Budget Outlook,” available at http://www.cbo.gov/publication/45471. ↩︎
  3. This report is being released along with a companion article in the journal Health Affairs; see Patricia Neuman, Juliette Cubanski, and Anthony Damico, “Medicare Per Capita Spending By Age And Service: New Data Highlights Oldest Beneficiaries,” Health Affairs Web First January 2015; in print February 2015. ↩︎
  4. For a more detailed description of the methodology used by Medicare to pay private plans, see Medicare Payment Advisory Commission, “Medicare Advantage Program Payment System,” October 2013,  http://www.medpac.gov/documents/MedPAC_Payment_Basics_13_MA.pdf. ↩︎
  5. Harriet Komisar and Judy Feder, “HarTransforming Care for Medicare Beneficiaries with Chronic Conditions and Long-Term Care Needs: Coordinating Care Across All Services,” Georgetown University, October 2011, available at http://www.cahpf.org/docuserfiles/georgetown_trnsfrming_care.pdf. ↩︎
  6. Many of these initiatives are being run out of the newly-created Innovation Center within the Centers for Medicare & Medicaid Services (CMS); see “About the CMS Innovation Center,” http://innovation.cms.gov/About/index.html. ↩︎
  7. Congressional Budget Office, “Dual-Eligible Beneficiaries of Medicare and Medicaid: Characteristics, Health Care Spending, and Evolving Policies,” June 2013, available at http://www.cbo.gov/publication/44308. ↩︎
  8. Centers for Medicare & Medicaid Services, “Medicare Program; Revisions to Payment Policies under the Physician Fee Schedule, Clinical Laboratory Fee Schedule, Access to Identifiable Data for the Center for Medicare and Medicaid Innovation Models & Other Revisions to Part B for CY 2015,” available at http://www.ofr.gov/OFRUpload/OFRData/2014-26183_PI.pdf. ↩︎
  9. Analysis of Medicaid per enrollee spending by age group is available from Centers for Medicare & Medicaid Services, Table 25, Medicaid Per-enrollee Spending by Gender and Age Group, Calendar Years 2002, 2004, 2006, 2008, 2010, available at http://www.cms.gov/Research-Statistics-Data-and-Systems/Statistics-Trends-and-Reports/NationalHealthExpendData/Downloads/2010GenderandAgeTables.pdf. ↩︎
  10. Analysis of out-of-pocket spending by age group is available from Juliette Cubanski, Christina Swoope, Anthony Damico, and Tricia Neuman, “How Much is Enough How Much Is Enough? Out-of-Pocket Spending Among Medicare Beneficiaries: A Chartbook,” Kaiser Family Foundation, July 2014, available at https://modern.kff.org/health-costs/report/how-much-is-enough-out-of-pocket-spending-among-medicare-beneficiaries-a-chartbook/. ↩︎
  11. These estimates have changed little since 2000.  In 2000, beneficiaries ages 80 and over comprised 25 percent of the Medicare population and 33 percent of total Medicare spending; beneficiaries between the ages of 65 and 69 comprised 22 percent of the Medicare population, but just 14 percent of total Medicare spending. ↩︎
  12. These findings are generally consistent with data reported by the Congressional Budget Office (CBO) showing Medicare per capita spending for services covered under Parts A and B for beneficiaries enrolled under traditional Medicare rising from $4,500 for 66-year-olds to $8,500 for 75-year-olds and $12,500 for those ages 85 and older; see CBO, “The 2014 Long-Term Budget Outlook,” July 2014, available at http://www.cbo.gov/publication/45471.  Unlike CBO, our analysis includes Part D spending.  Our results also are consistent with analysis showing Medicare costs for beneficiaries age 65 and older rise until around age 90, when they start to decline; see Dale Yamamoto, “Health Care Costs—From Birth to Death,” Society of Actuaries, June 2013, available at  http://www.healthcostinstitute.org/files/Age-Curve-Study_0.pdf. ↩︎
  13. In 2011, 4.8 percent of beneficiaries in traditional Medicare ages 66 and over died during the year; their spending accounted for 17.5 percent of traditional Medicare spending for beneficiaries in this age group. ↩︎
  14. For an analysis of Medicare spending in the last year of life, see Steve Calfo, Jonathan Smith, and Mark Zezza, “Last Year of Life Study,” Centers for Medicare & Medicaid Services Office of the Actuary, available at https://www.cms.gov/Research-Statistics-Data-and-Systems/Research/ActuarialStudies/downloads/Last_Year_of_Life.pdf. ↩︎
  15. We examined the hypothesis that the decline in per capita spending by age among decedents could be attributed to fewer months of Medicare spending among older than younger decedents; that is, whether lower per capita spending among older than younger decedents could be due to the oldest beneficiaries surviving fewer months than younger beneficiaries.  However, we did not observe such a pattern.  On average, decedents of all ages lived about six months in the year, with virtually no variation across ages that could explain the decline in spending among decedents by age.  Due to data constraints, we were unable to look at spending among decedents in the last 12 months of life. ↩︎
  16. For example, among 70-year-olds, average Medicare per capita spending is more than six times greater for beneficiaries who died in 2011 than among beneficiaries who survived ($42,933 versus $6,847); however, just 2 percent of 70-year olds died that year, so the relatively high cost of 70-year-olds who died in 2011 increases the overall average only modestly ($7,566 for 70-year-olds overall versus $6,847 for survivors only, a difference of $719).  In contrast, among 90-year-olds, average Medicare per capita spending was two times greater among beneficiaries who died than survived in 2011 ($26,687 vs. $12,924), but because 13 percent of 90-year-olds died that year, the decedents raised average per capita spending by $1,821 ($14,745 versus $12,924 for survivors). ↩︎
  17. Available at http://www.bls.gov/data/inflation_calculator.htm. ↩︎

Explaining Armstrong v. Exceptional Child Center: The Supreme Court Considers Private Enforcement of the Medicaid Act

Author: MaryBeth Musumeci
Published: Jan 14, 2015

Issue Brief

Medicaid is the primary source of health insurance for people with low-incomes and other vulnerable populations in the United States today. The program is governed by the federal Medicaid Act, which sets out the basic legal framework that states that elect to participate must follow when administering their programs. When state actions appear to violate the federal law, Medicaid beneficiaries and/or providers historically have sued, seeking to enforce specific provisions of the Medicaid Act, which itself does not speak to the role of the federal courts. Over the years, federal courts have taken a closer look at the legal criteria that private parties, such as beneficiaries and providers, must establish before being permitted to pursue these cases. This issue — whether the parties may maintain a cause of action — has become an important procedural test that must be satisfied before a court will consider the underlying substantive claims in such lawsuits.

On January 20, 2015, the United States Supreme Court will hear oral argument in Armstrong v. Exceptional Child Center, a case that has the potential to impact the future ability of private parties to sue states in federal court to enforce the requirements of the Medicaid Act.1  The case raises the issue of whether Medicaid providers can challenge a state law in federal court on the basis that it violates the federal Medicaid Act and therefore is preempted by the Supremacy Clause of the U.S. Constitution. This issue brief examines the major questions raised by the Armstrong case, explains the parties’ legal arguments, and considers potential effects of a U.S. Supreme Court decision.

Key Questions

1. What started the Armstrong case? Who are the parties?

In 2005, the Idaho state legislature passed a law requiring the state Medicaid agency to implement a new methodology to determine provider reimbursement rates, and in 2009, the state Medicaid agency published new, higher rates based on cost studies conducted under the new methodology. The Centers for Medicare and Medicaid Services’ (CMS) approved the state’s new methodology in a waiver amendment. However, the new rates never were implemented because the state legislature failed to appropriate sufficient funding. A group of Idaho residential habilitation providers serving people with intellectual and developmental disabilities sued the Idaho state Medicaid agency, alleging that the state’s failure to implement the new rates conflicted with federal law.

2. What do the providers want from the federal courts?

The providers’ lawsuit asks the federal courts to order Idaho to implement the new reimbursement rates that were established according to the new methodology approved by CMS. The providers want the federal courts to rule that Idaho’s failure to implement the new rates violates the equal access provision of the federal Medicaid Act, which requires that states ensure payments are sufficient to attract enough providers so that services are available to Medicaid beneficiaries to the same extent that they are available to the general population in the geographic area.2  The providers also want the federal courts to recognize that they have established a cause of action to enforce the Medicaid Act in this manner.

3. Why are the providers asking the federal courts for help?

Historically, Medicaid providers and beneficiaries, and not the Secretary of the U.S. Department of Health and Human Services (HHS, the federal agency that oversees the Medicaid program), have been the parties to enforce the Medicaid Act in court when states set provider payment rates in ways that allegedly violate the equal access provision. The courts are uniquely positioned to provide injunctive relief – ordering the state to do or not do something. By contrast, the HHS Secretary only can withhold federal funds in administrative actions to enforce state compliance with the Medicaid Act.

The Idaho providers argue that the federal courts should hear their case under a preemption theory. Preemption is based on the Supremacy Clause of the U.S. Constitution, which invalidates state laws that conflict with federal laws. In the providers’ view, Idaho’s failure to implement payment rates consistent with the methodology approved by CMS exceeds the authority granted to the state under federal law and violates the standards for establishing provider payment rates under the Medicaid Act’s equal access provision. Because the existing reimbursement rates fail to “substantially reimburse providers their costs” and remain in place for “purely budgetary reasons,”3  the providers argue that injunctive relief – ordering the state to implement the new rates – is appropriate.

The providers assert that the Supreme Court has decided numerous cases over the years in which private parties have sought relief from preempted state laws under the Supremacy Clause, and the founders understood that private parties would be able to seek injunctive relief in court against government officials who exceed Constitutional limits on their authority by seeking to enforce state laws that conflict with federal law.

4. What does the state Medicaid agency want from the federal courts?

Idaho’s state Medicaid agency is asking the federal courts to rule that providers cannot sue to enforce the Medicaid Act. The state Medicaid agency argues that only Congress can determine when private parties, such as Medicaid providers, can enforce federal funding statutes, such as the Medicaid Act. To do so, Congress either must expressly authorize private lawsuits, or the statute must indicate Congress’ clear and unambiguous intent to create a private right and remedy for its violation; Idaho argues that neither condition is met in this case.

The state Medicaid agency also argues that the providers cannot bring suit to enforce the Medicaid Act based on a preemption theory under the Supremacy Clause. Idaho argues that the Supremacy Clause is not a source of federal rights but rather a rule of decision-making to resolve conflicts between federal and state laws. The state contends that private parties only can raise preemption claims as a defense to a suit where the state seeks to regulate a private party’s conduct or as an anticipatory defense in a suit challenging state law that interferes with a private party’s independent federal right.

The state also argues that the Medicaid Act’s equal access provision sets out a number of competing factors that must be balanced to determine compliance, which is an appropriate determination for CMS as the federal agency expert in this area, not the courts. The state asserts that the equal access provision does not entitle providers to anything, but rather conditions federal payments on the state’s compliance with its terms.   Idaho contends that failure to comply with a federal condition to receive federal funding under Spending Clause legislation is not a violation of federal law; instead, the remedy is the loss of federal funding for the state, imposed by the agency, not by the courts. The state points out that CMS has not initiated a compliance action based on Idaho’s failure to implement the new payment rates and alleges that allowing private parties to sue in this case would change the terms of the deal to which the state agreed when it accepted federal Medicaid funds.

5. What did the lower courts decide in this case?

The federal district court that initially heard the case ruled that the providers have a cause of action and went on to find that Idaho’s failure to implement the new provider payment rates violated the Medicaid Act’s equal access provision. The Ninth Circuit Court of Appeals upheld this decision. The Ninth Circuit observed that the providers have a private right of action to enforce the Medicaid Act’s equal access provision under the Supremacy Clause, while noting that four dissenting justices would have held otherwise when the Supreme Court last considered this issue in Douglas v. Independent Living Center in 2012.4  Subsequently, the Supreme Court granted certiorari, agreeing to hear the Armstrong case.

6. What is the issue that the Supreme Court will consider?

The Supreme Court will not consider whether Idaho’s failure to implement the new provider payment rates actually violates the federal Medicaid Act. Instead, the Court will decide a procedural issue: whether the Medicaid providers should be allowed to bring this lawsuit seeking to enforce this provision of the federal Medicaid Act.

7. What are the implications if the Supreme Court rules for the providers?

If the Supreme Court decides that the providers have established a cause of action under a preemption theory, the lawsuit can go forward, and the federal courts’ ruling on the substantive issue in the case — whether Idaho’s failure to implement new provider rates violates the Medicaid Act’s equal access provision – can take effect. The providers argue that courts that previously have considered that issue have held that the equal access provision prevents a state from basing provider payment rate reductions solely on state budgetary considerations, as they allege is the case in Idaho.

8. What are the implications if the Supreme Court rules for the state  Medicaid agency?

If the Supreme Court rules in favor of the Idaho state Medicaid agency, providers and beneficiaries will be unable to sue under a preemption theory to enforce the Medicaid Act’s equal access provision. Courts generally have not recognized another basis for private party enforcement of the equal access provision; consequently, if the Supreme Court invalidates a preemption theory as a basis for these lawsuits, Medicaid beneficiaries and providers are unlikely to be able to ask a court to compel states to set payment rates in a way that does not negatively impact beneficiary access to services.

If Medicaid providers and beneficiaries cannot go to federal court, the only way to enforce the equal access provision will be through HHS’s administrative process. The HHS Secretary must approve state Medicaid plans and plan amendments as consistent with federal requirements. If a state disagrees with the Secretary’s determination, it can request an administrative hearing for the federal agency to reconsider its decision and then seek review in federal court. In the interim, the state can keep in place the policy that is in dispute, because HHS’s administrative process does not provide for injunctive relief. By contrast, courts can stop enforcement of state laws that violate the Medicaid Act immediately, while the issue is argued on the merits. For example, in the 2012 Douglas case, the court’s injunction meant that the provider rate cuts could not be imposed while HHS was deciding whether the requirements of the equal access provision were met.

Moreover, CMS has limited resources to oversee the Medicaid program and has relied on private parties to bring suits to enforce the equal access mandate, as noted in an amicus brief in Armstrong filed by a group of former HHS officials.5  In addition, the Armstrong providers note that the remedy available to CMS – withholding of federal matching funds – can end up harming the beneficiaries that the program seeks to help.

The Supreme Court’s decision in the Armstrong case also has the potential to clarify the existing standards or establish new law regarding when private parties can sue to enforce the Medicaid Act more generally, beyond enforcement of the equal access provision. The Medicaid Act contains numerous provisions that structure how the program is administered, from who is eligible for benefits to what services must be provided to how states oversee the program. None of these protections are meaningful if they cannot be enforced, and thus the ability of Medicaid beneficiaries and providers to initiate lawsuits seeking to invalidate state laws that conflict with federal law is an important area to watch. Although there is no set timeframe within which the Supreme Court must act after the January 20,2015 oral argument, the Court is likely to issue a written opinion before the close of the current term in June, 2015.


Endnotes

  1. No. 14-15 (U.S.). For additional background, see Sara Rosenbaum, Medicaid Payments and Access to Care, 371 N. Engl. J. Med. 2345 (Dec. 18, 2014), available at http://www.nejm.org/doi/full/10.1056/NEJMp1412488; National Health Law Program, Update on Private Enforcement of the Medicaid Act: The Supremacy Clause and 42 U.S.C. § 1983 (Oct. 13, 2014), available at http://www.healthlaw.org/publications/browse-all-publications/Issue-brief-medicaid-supremacy-clause#.VK_uHE10yUk.   The briefs filed in the Armstrong case are available at http://www.scotusblog.com/case-files/cases/armstrong-v-exceptional-child-center-inc/. ↩︎
  2. 42 U.S.C. § 1396a(a)(30)(A). In 2011, CMS proposed a rule that would, for the first time, provide federal regulatory guidance on what states must do to demonstrate their compliance with the equal access provision. See Kaiser Commission on Medicaid and the Uninsured, Provider Payment and Access to Medicaid Services: A Summary of CMS’ May 6 Proposed Rule (July 2011), available at https://modern.kff.org/medicaid/issue-brief/provider-payment-and-access-to-medicaid-services/. To date, that rule has not yet been finalized. ↩︎
  3. Exceptional Child Center v. Armstrong, No. 12-35382, at 4 (9th Cir., April 4, 2014) (quoting from Stipulated Facts), available at http://www.scotusblog.com/case-files/cases/armstrong-v-exceptional-child-center-inc/. ↩︎
  4. In Douglas, Medicaid beneficiaries and providers sued the California state Medicaid agency, seeking to enjoin a number of proposed provider payment rate cuts. After the Supreme Court heard oral argument, but before it had issued its decision, CMS approved California’s state plan amendment containing the rate cuts. Consequently, the Douglas majority held that the case should be sent back to the lower courts to consider the effect of CMS’s approval of the state plan amendment, without deciding whether the beneficiaries and providers had a right to sue. Douglas v. Independent Living Center, No. 09-958 (Feb. 22, 2012), available at http://www.supremecourt.gov/opinions/11pdf/09-958.pdf. ↩︎
  5. A number of amicus briefs were filed, including those by the United States Solicitor General, some Members of Congress, 28 states, and beneficiary and provider advocacy groups. The Solicitor General contends that the Court should not recognize a private right of action to enforce the equal access provision, without deciding whether private parties can sue to enjoin state laws as preempted by federal law more generally. ↩︎