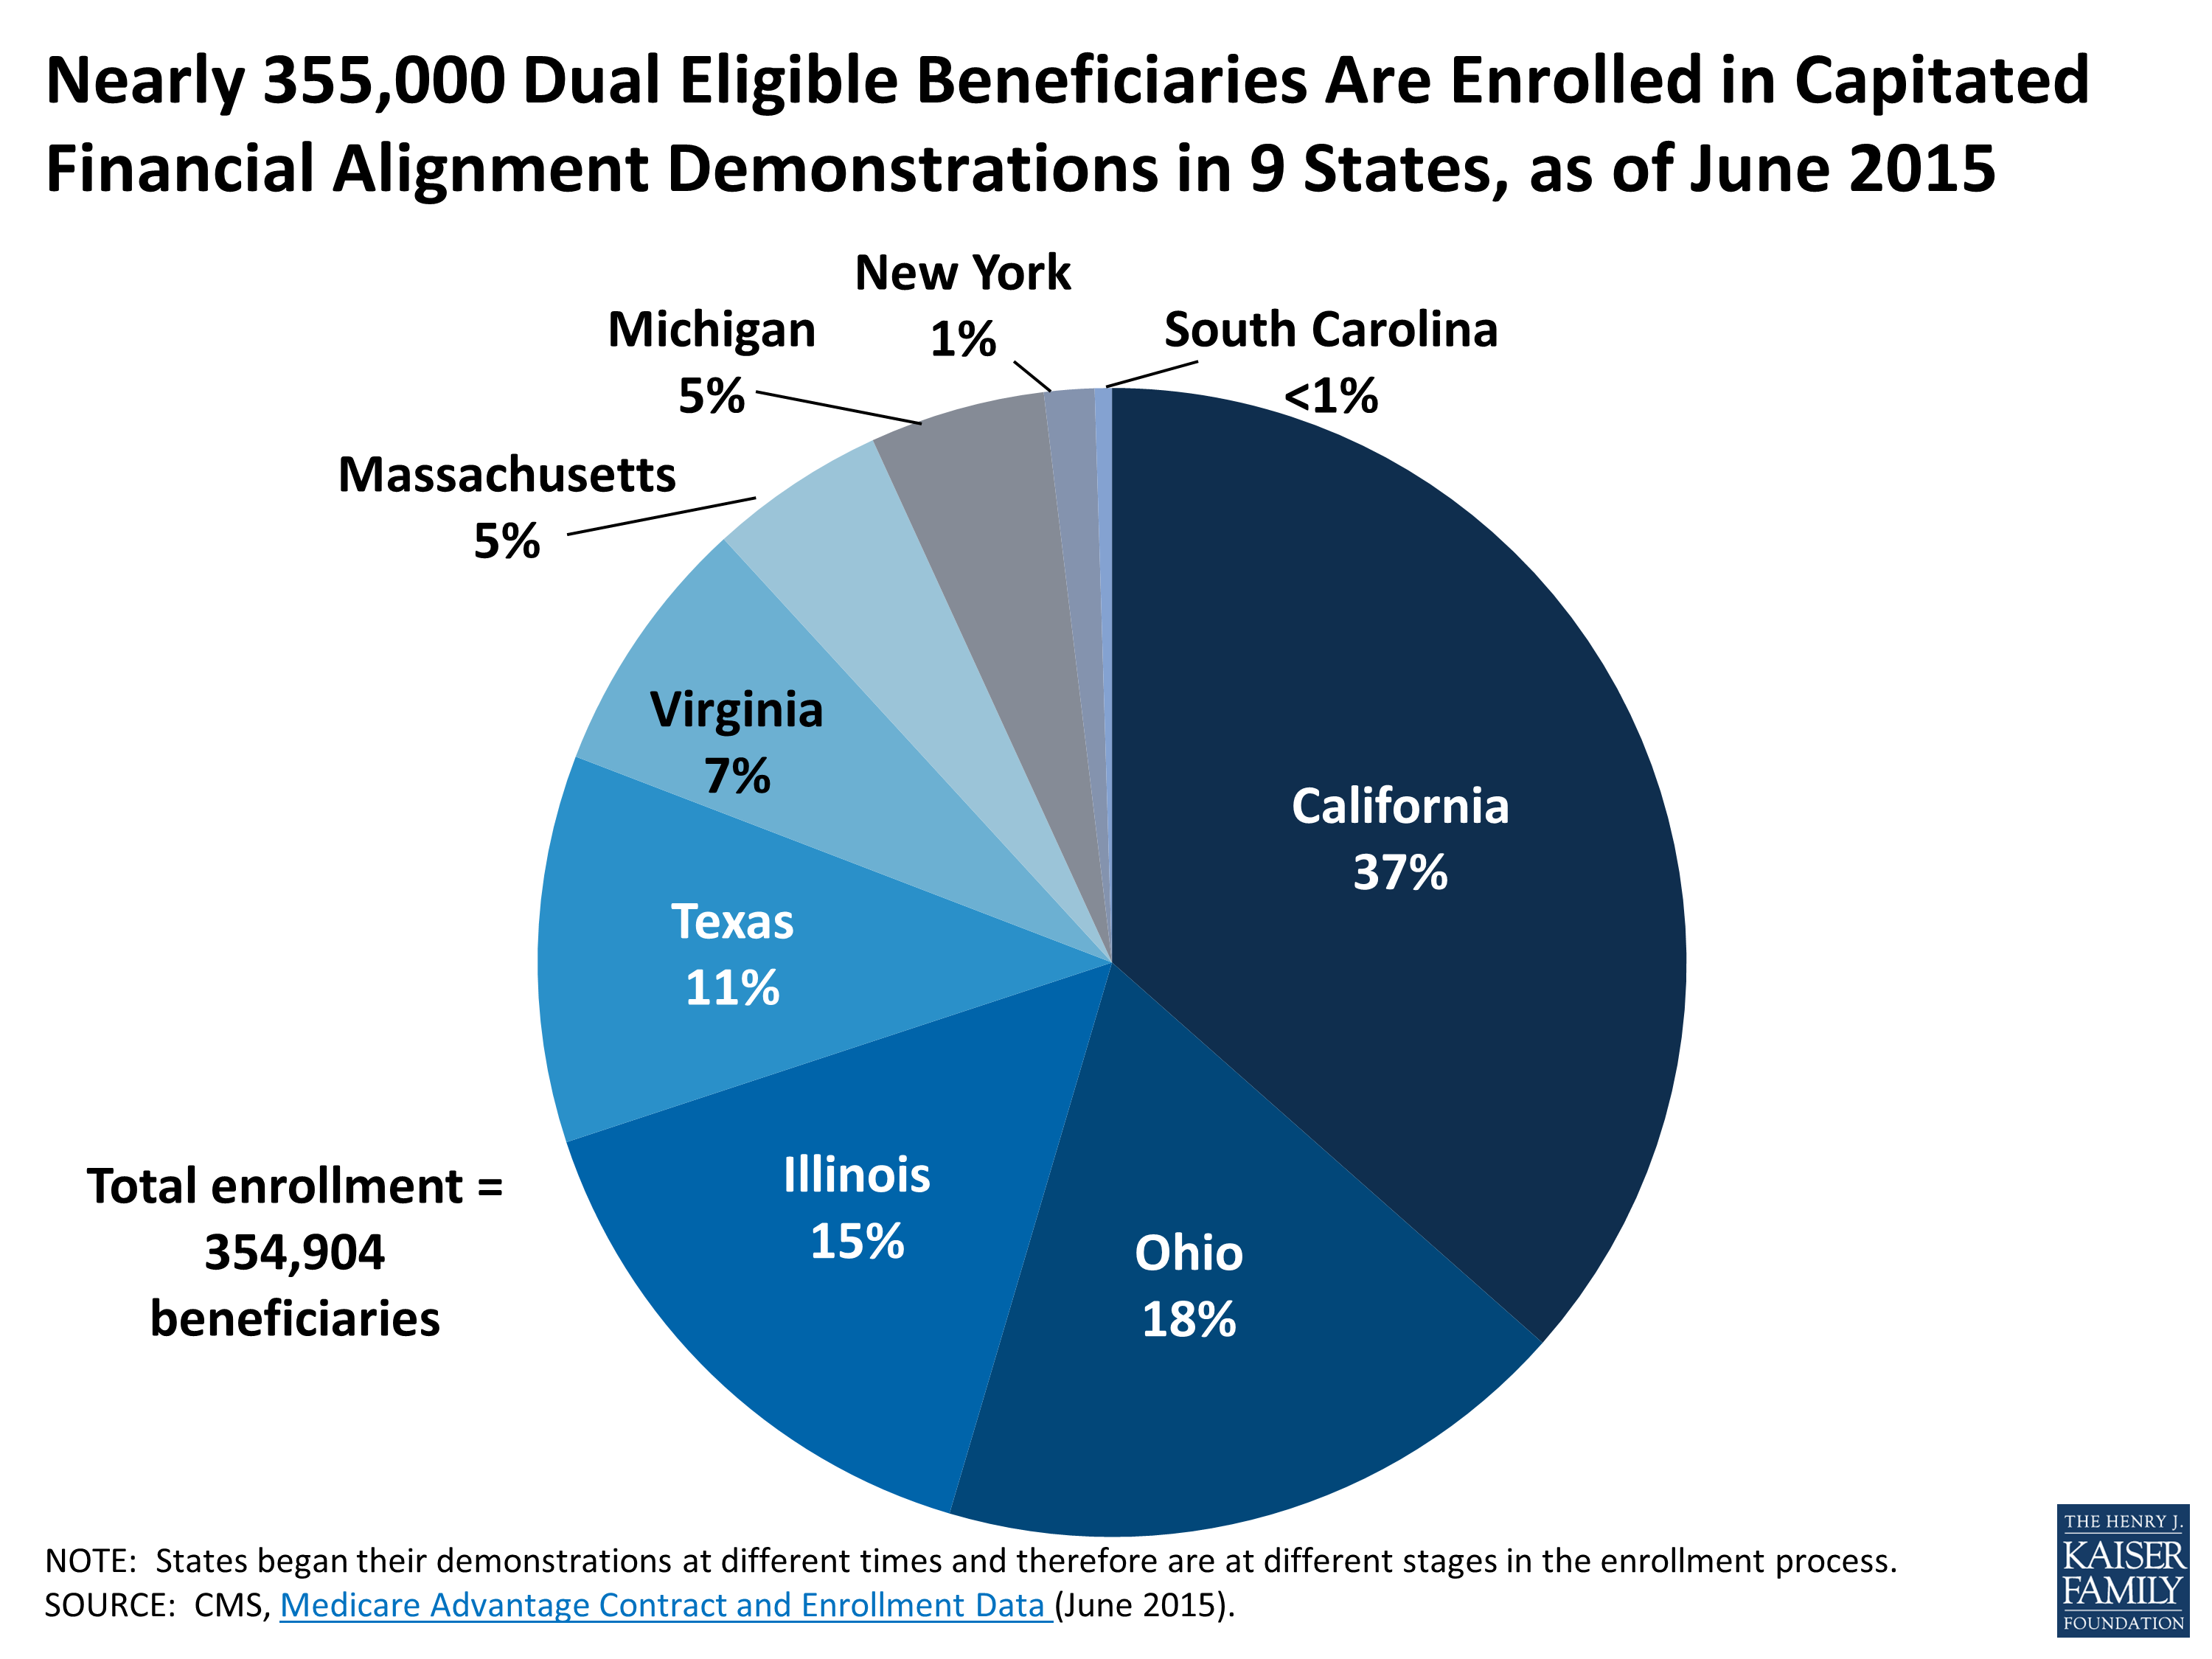
Nearly 355,000 Dual Eligible Beneficiaries Are Enrolled in Capitated Financial Alignment Demonstrations in 9 States, as of June 2015

Published: Jul 28, 2015
Enrollment in Capitated Financial Alignment Demonstrations_072815

This chart and a related fact sheet show enrollment in the capitated financial alignment demonstrations for beneficiaries who are eligible for both Medicare and Medicaid.  Nearly 355,000 seniors and non-elderly adults with disabilities are enrolled in these demonstrations in 9 states as of June 2015.

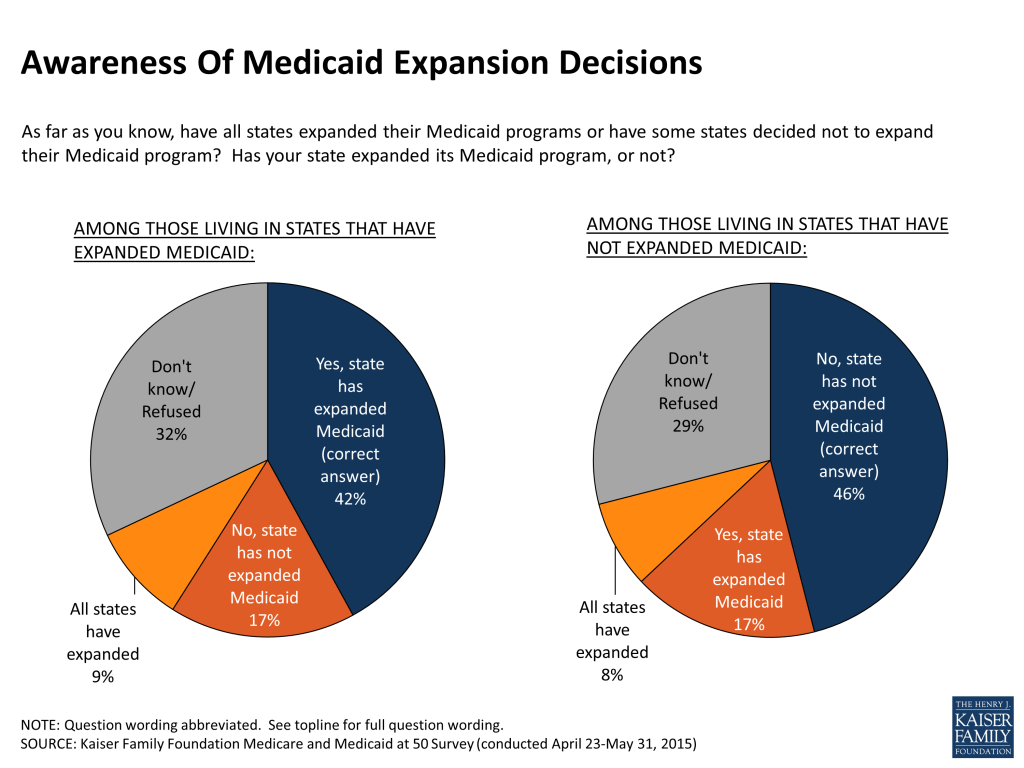
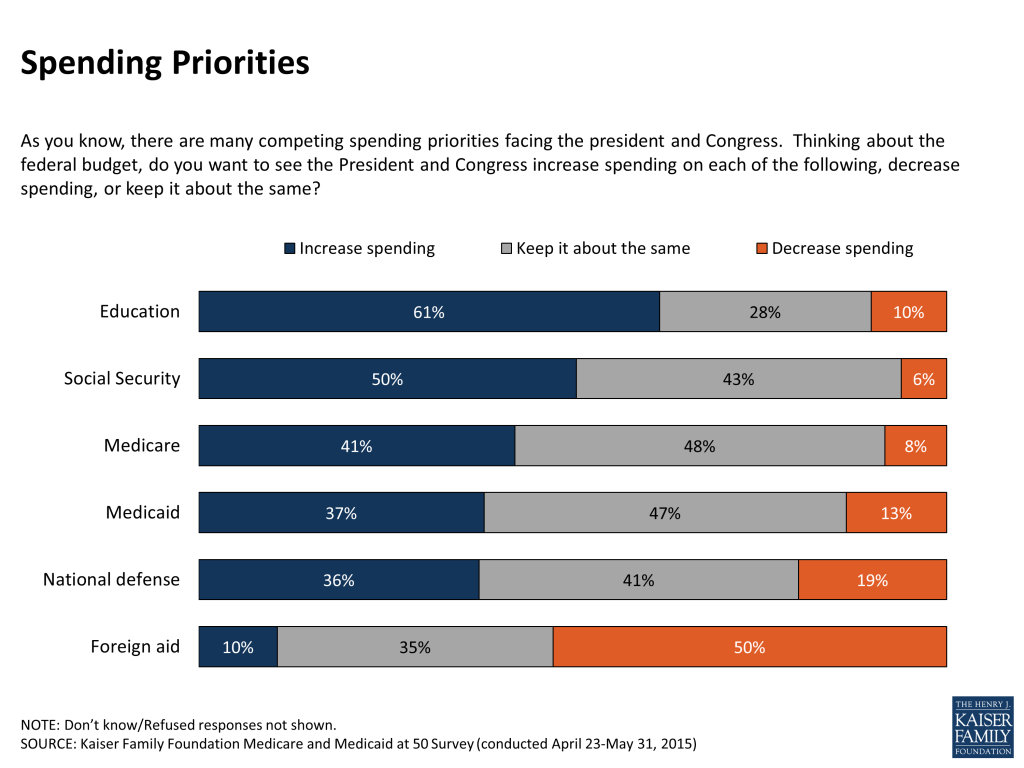
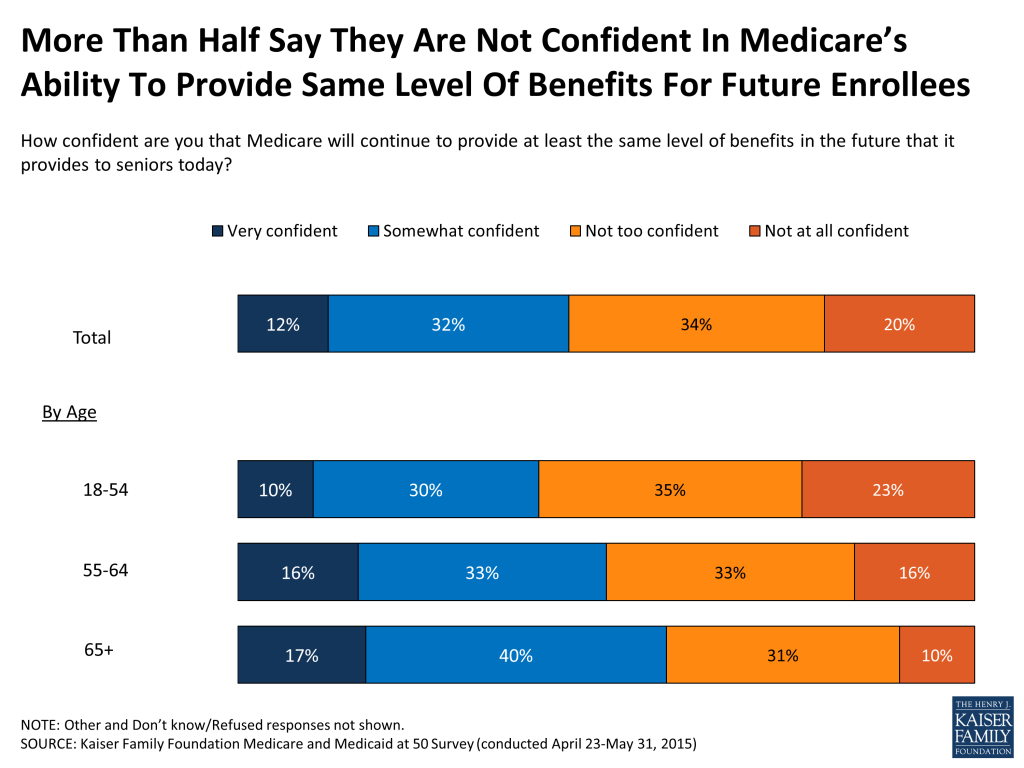
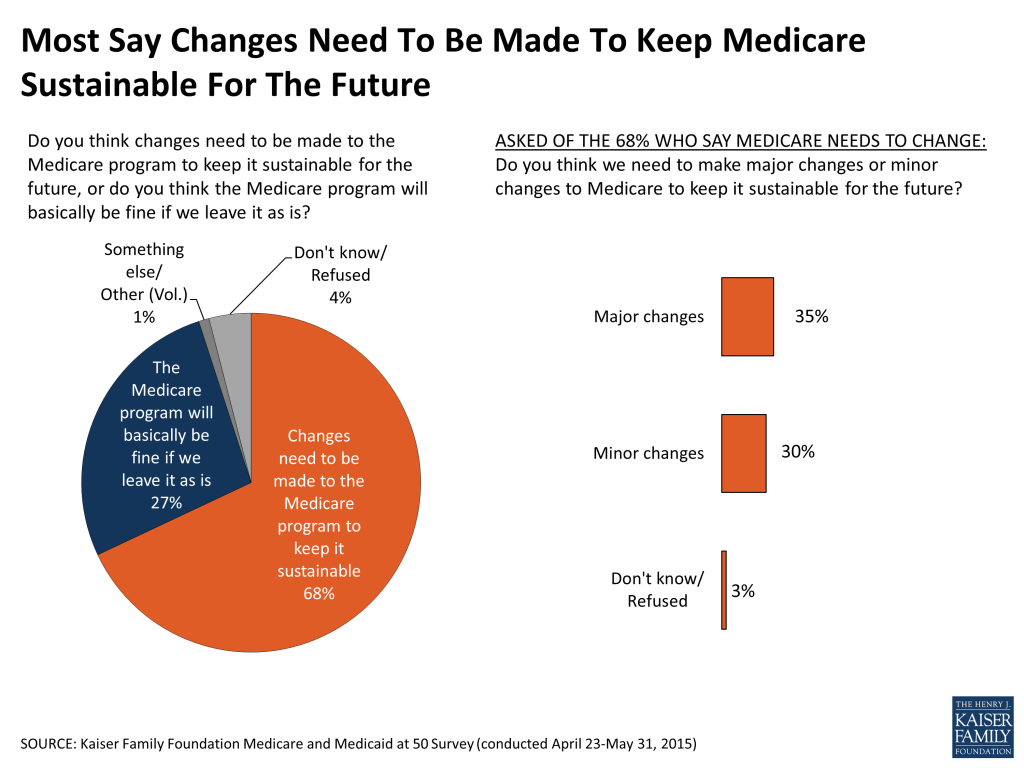
Visualizing Health Policy: Medicaid and Medicare at 50: Trends and Challenges

Published: Jul 28, 2015

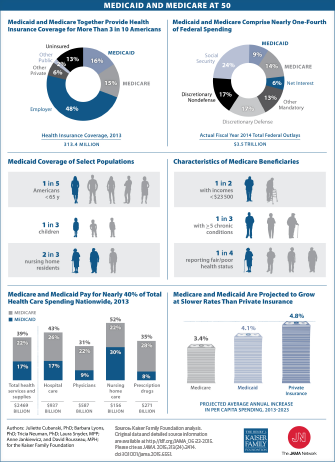
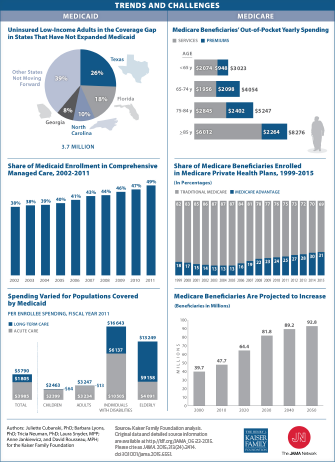
These Visualizing Health Policy infographics commemorate the 50th anniversary of the Medicaid and Medicare programs. This infographic provides details about the reach and demographics of the programs, as well as the Federal and total US health-care spending associated with them. This infographic illustrates trends and challenges going forward.

Together, Medicaid and Medicare provide health insurance coverage for more than 3 in 10 Americans. Medicaid serves a notable share of children, nursing home residents, and Americans younger than 65 years, while a significant share of Medicare beneficiaries are lower-income, have fair or poor health, or have multiple chronic conditions. Nearly 4 million uninsured, low-income adults remain in the coverage gap in states that have not expanded Medicaid under the Affordable Care Act, and the share of Medicaid enrollment in comprehensive managed care has increased. Meanwhile, the number of Medicare beneficiaries continues to increase, as does the share of beneficiaries enrolled in Medicare private health plans.


JAMA_2015july_mandmat50


JAMA_2015july_trends

Visualizing Health Policy is a monthly infographic series produced in partnership with the Journal of the American Medical Association (JAMA). The full-size infographics, Medicaid and Medicare at 50 and Trends and Challenges, are freely available on JAMA’s website and are published in the print edition of the journal.

View Source Slides

News Release

A Little-Noticed Win in Global HIV Treatment

Published: Jul 27, 2015

In his latest column for The Wall Street Journal’s Think Tank, Drew Altman discusses a recent success in global HIV treatment and how successes may get less attention than they deserve because of prevailing attitudes about the corruption in foreign aid.

All previous columns by Drew Altman are available.

Proposed Rule on Medicaid Managed Care: A Summary of Major Provisions

Authors: Julia Paradise and MaryBeth Musumeci
Published: Jul 23, 2015

Executive Summary

On June 1, 2015, the Centers for Medicare & Medicaid Services (CMS) published a Notice of Proposed Rulemaking (NPRM) to modernize federal Medicaid managed care regulations. Since the rules were last updated, in 2002, states have significantly expanded their managed care programs to include beneficiaries with more complex needs; larger geographic areas; additional services; and millions of adults newly eligible for Medicaid under the Affordable Care Act. Today, over half of all Medicaid beneficiaries are enrolled in comprehensive risk-based health plans and many also receive some services, such as behavioral health care, through limited-benefit risk-based plans. In addition, millions of beneficiaries are enrolled in managed fee-for-service arrangements.CMS has articulated several principles and goals that underlie the NPRM. In particular, the proposed rule aims to: strengthen beneficiary protections; better align Medicaid managed care rules with standards for other coverage programs; increase fiscal integrity in rate-setting; address delivery and payment system reform in the context of managed care; improve the quality of care across Medicaid delivery systems; increase health plan and state accountability; and strengthen state and federal oversight of Medicaid managed care programs.

This issue brief summarizes major provisions of the NPRM. In it, we review proposed changes in the following key areas, among others:

  • Beneficiary support and information;
  • Enrollment and disenrollment;
  • Provider network adequacy and access to care;
  • Managed long-term services and supports;
  • Appeals;
  • Capitation rate-setting;
  • Quality of care;
  • State monitoring; and
  • Program integrity

The proposed rule will affect a variety of stakeholders, including states, health plans, providers, and beneficiaries. The public comment period closes on July 27, 2015, and the provisions of the final rule may be revised in light of stakeholder input.

Issue Brief

Introduction

On June 1, 2015, the Centers for Medicare & Medicaid Services (CMS) published a Notice of Proposed Rulemaking (NPRM) to modernize federal Medicaid managed care regulations.1  The Medicaid managed care regulations were last updated in 2002. Since then, the role of managed care in Medicaid has grown significantly in both size and scope. States have come to rely increasingly on managed care programs, expanding them to include beneficiaries with more complex needs; larger geographic areas; additional services, especially behavioral health care and long-term services and supports (LTSS); and, in states that have adopted the Affordable Care Act’s (ACA) Medicaid expansion, millions of newly eligible adults. Today, over half of all Medicaid beneficiaries are enrolled in comprehensive capitated managed care organizations (MCO), the dominant form of managed care in Medicaid, and millions of beneficiaries also receive at least some Medicaid services, such as behavioral health or dental care, through capitated limited-benefit plans, known in Medicaid terminology as prepaid inpatient health plans (PIHP) and prepaid ambulatory health plans (PAHP). Millions of beneficiaries are also enrolled in primary care case management (PCCM) programs, which range from basic managed fee-for-service (FFS) arrangements to more enhanced systems that perform some of the same administrative and other functions as MCOs.

In the NPRM preamble, CMS identified a number of principles and goals that guided its development of the new rule. In particular, the proposed changes are designed to: address important service delivery and payment reforms as they relate to Medicaid managed care; strengthen beneficiary protections; better align Medicaid managed care rules with standards for Medicare Advantage (MA) plans and qualified health plans (QHP) offered through the new ACA Marketplaces to ease beneficiary transitions between coverage programs and simplify state and health plan administration; measure and improve the quality of care in managed care and across Medicaid delivery systems; increase transparency and accountability at the health plan level and the state level; and strengthen state and federal oversight of Medicaid managed care programs.

This issue brief summarizes major provisions of the NPRM that would change the current regulatory framework for Medicaid managed care programs. It is neither an exhaustive review of the proposed changes, nor an assessment of policies outlined in the rule. Rather, it is designed to serve as an informational guide to key proposed new federal expectations and requirements of states and managed care arrangements, and federal oversight interests moving forward. The 60-day period for public comment on the NPRM, which will help shape CMS’ development of a final rule, closes July 27, 2015. Major provisions of the proposed rule are discussed below.

Wider application of Medicaid managed care rules

Extension to additional Medicaid managed care entities. The NPRM would apply many new and existing Medicaid managed care standards to PAHPs as well as PIHPs and MCOs. It would also apply certain of these standards to newly defined “PCCM entities,” which, as distinct from individual FFS providers of basic PCCM services, provide a more robust set of administrative functions similar to a managed care plan, such as intensive case management, provider contracting or oversight, enrollee outreach and education, and/or performance measurement and quality improvement. Under the proposed rule, states would have to obtain CMS approval of all contracts with PCCM entities, monitor and evaluate their networks and performance, and include them in their quality strategies.

Extension to CHIP managed care plans. The proposed rule would incorporate and extend to CHIP benefits delivered through managed care many of the definitions, standards, and requirements that apply to Medicaid managed care. Medicaid managed care provisions in the following areas, among others, would carry over to CHIP: access to care and network adequacy; enrollee information requirements; enrollment and disenrollment; continuity of care; marketing activities; quality measurement and improvement; external quality review; and grievances and appeals. The minimum 85% MLR standard, discussed later, would also apply to CHIP managed care plans. The proposed rule also includes some CHIP-specific provisions, such as a requirement for state submission of CHIP MCO, PIHP, and PAHP contracts, including final contract rates, in accordance with standards specified by the HHS Secretary.

Beneficiary support and information

Beneficiary support system. The proposed rule would require states to establish a beneficiary support system to provide services to both potential enrollees in an MCO, PIHP, PAHP, PCCM, or PCCM entity and current enrollees who are changing plans. The system would be required to provide assistance by phone, internet, and in person. The beneficiary support system would offer: 1) personalized choice counseling to assist beneficiaries with evaluating their health plan options and facilitate enrollment; 2) training for health plans and network providers on community-based resources and supports that can be linked with covered benefits; 3) assistance to beneficiaries in understanding managed care; and 4) assistance for enrollees who use or wish to use long-term service and supports (LTSS). The beneficiary support system also would provide outreach. Entities providing choice counseling would be subject to existing HHS independence and conflict of interest requirements. To the extent that states already provide the required resources and functions, they could draw upon and expand them to meet the requirements of the beneficiary support system.

With respect to enrollees who use or wish to use LTSS, the beneficiary support system must provide: an access point for complaints and concerns about health plan enrollment, access to services, and related matters; education on enrollees’ grievance and appeal rights, the state fair hearing process, and beneficiary rights and responsibilities; assistance, upon request, in navigating the plan’s grievance and appeal process and in appealing adverse benefit determinations made by a health plan to a state fair hearing; and review and oversight of LTSS program data to guide the state Medicaid agency in identifying and resolving systemic issues. Assistance with navigating the appeals process would not include representation of beneficiaries in appeals.

Standards for beneficiary information. Current regulations pertaining to the information that must be made available to beneficiaries would be replaced with a more structured and coherent set of standards that would apply to states and all managed care plans, including MCOs, PIHPs, PAHPs, PCCM entities, and, to a limited extent, PCCM arrangements. Particularly in light of the expansion of managed care to people with disabilities and complex needs, and recognizing the linguistic and cultural diversity of Medicaid beneficiaries, these more robust standards are designed to improve the content and format of information available to help beneficiaries understand how managed care works and the implications of participating in managed care, and evaluate and compare their managed care options. Current requirements that beneficiary information be easily understood and readily accessible would be strengthened in numerous ways, as follows:

  • Information for potential enrollees. States would be required to provide specified information to potential enrollees, in either paper or electronic format, to help them understand the Medicaid managed care program and their options. The required information would include beneficiary disenrollment rights; basic information about managed care; populations excluded from enrollment; and each plan’s service area, covered benefits, provider directory, cost-sharing requirements, network adequacy standards, responsibilities for care coordination, and, to the extent available, quality and performance indicators, including enrollee satisfaction.
  • Information for current enrollees. Existing federal requirements regarding state and plan information for Medicaid beneficiaries already enrolled in managed care plans would continue to apply. In addition, plans would be required, within a reasonable time after an enrollee receives an enrollment notice from the state, to provide each enrollee with an enrollee handbook that compiles specified information already required under various provisions of existing regulations. Plans would also be required to provide enrollees with a provider directory and drug formulary information, as described further in the following section. States would be required to ensure, through their contracts, that all managed care plans provide all required information to enrollees. Each plan would also be required to have a mechanism to help enrollees and potential enrollees understand the plan’s requirements and benefits.
  • Standardization of information. To improve the consistency and usefulness of beneficiary information, states would be required to develop definitions of key managed care terms and model handbooks and member notices that all managed care plans would be required to use.
  • Accessibility of information. States and plans would be required to make written beneficiary materials, including, at a minimum, provider directories, network adequacy standards, member handbooks, appeal and grievance notices and other notices critical to obtaining services, available in locally prevalent non-English languages and in alternative formats. In addition, plans would be required to provide interpretation services, as well as auxiliary aids and services for enrollees and potential enrollees with disabilities, upon request and free of charge, and to notify enrollees and potential enrollees about how to access these services. Taglines in large print and in locally prevalent non-English languages would be required on all written materials to explain the availability of interpretation and translation services and provide the toll-free choice counseling number. In addition, disability is added to the list of prohibited bases of discrimination by managed care plans.
  • Availability of electronic information. States would be required to operate a Medicaid managed care website that, directly or by linking to individual plan websites, provides enrollee handbooks, provider directories, and network adequacy standards for each managed care plan. The NPRM specifies that required enrollee information may be provided electronically by the state or plans as long as it is compliant with all language, format, and disability accessibility standards, can be printed, and is available in paper form without charge upon request. These proposed new standards are similar to those applicable to the MA program and the commercial insurance market.

Provider directories and drug formulary information. In addition to currently required provider information, plans’ provider directories would be required to include four new elements for each provider: 1) its group practice/site affiliation; 2) its website URL; 3) its cultural and linguistic capabilities, including languages spoken by the provider or by a skilled medical interpreter at the provider’s office; and 4) whether the provider’s offices, exam rooms, and equipment are accessible for individuals with disabilities. Provider directories would be required to include information on pharmacies, behavioral health care providers, and LTSS providers furnishing services under the contract, as well as primary care physicians, specialists, and hospitals as required under current rules. Paper provider directories would have to be updated at least monthly and electronic directories no later than three business days after the managed care plan receives updated provider information. In addition, each plan would be required to post its directory on its website in a machine readable file and format as specified by the HHS Secretary.

Managed care plans would also be required to make information on their drug formularies available electronically or in paper form, including which medications are covered (both generic and name brand) and which tier each medication is on. They would also be required to make their formulary drug lists available on their websites in a machine readable file and format as specified by the HHS Secretary.

Marketing. The proposed rule would revise, and extend to PCCM entities, current marketing restrictions on MCOs, PIHP, PAHPs, and PCCMs, by amending the definition of “marketing” to exclude communications from a Marketplace QHP to Medicaid beneficiaries, even if the QHP issuer is also the entity providing Medicaid managed care services. This change is intended to improve coordination of coverage and care for individuals who may experience periodic transitions between Medicaid and QHP eligibility due to fluctuations in income, and families whose members are divided between Medicaid and QHP coverage. The NPRM also includes minimum marketing standards that state contracts with plans would be required to include.

Enrollment and disenrollment

The proposed rule adds a new section requiring that states have an enrollment system for both voluntary and mandatory Medicaid managed care programs. The enrollment system must meet a number of requirements, as follows:

  • Enrollment
    • Choice period. States would be required to provide a minimum 14-calendar-day “choice period” during which beneficiaries can obtain services on a FFS basis while they evaluate their plan options and make a choice. (CMS specifically seeks comment on the length of the choice period.) States would be required to send beneficiaries informational notices about the choice period at least three days before it begins. Enrollment in a plan would be effective at the end of the choice period or when the enrollee notifies the state of his or her choice, whichever comes first.
    • Voluntary managed care programs. In voluntary managed care programs in which the state uses passive enrollment (i.e., selects a plan for each potential enrollee), the enrollment notice must explain the implications of not making an active choice between managed care and FFS and declining enrollment in the plan selected by the state. In voluntary programs with passive enrollment, beneficiaries would be able, during the choice period, to accept the plan selected for them, decline it and select a different plan, or decide to remain in FFS. States would be required to send individuals who are passively enrolled confirmation of their enrollment into a plan within five calendar days of processing the enrollment, and that notice must clearly explain the enrollee’s right to disenroll within 90 days from the effective date of his or her enrollment.
    • Mandatory managed care programs. In mandatory programs with passive enrollment, the enrollment notice must explain the process for choosing and enrolling in a plan and enrollees’ right to disenroll from their assigned plan and select an alternative plan within 90 days from the effective date of their enrollment.
    • Auto-assignment. Passive enrollment processes in voluntary systems, and default enrollment processes that operate in mandatory systems when potential enrollees do not select a plan, would be required to preserve existing provider-beneficiary relationships with providers that have traditionally served Medicaid beneficiaries, or, if that is not possible, equitably distribute individuals among participating plans. States would be also be permitted to consider additional criteria, including the enrollment preferences of family members, previous plan assignment, accessibility of provider offices for people with disabilities, and other reasonable criteria in automatically assigning enrollees to plans.
  • Disenrollment
    • Under the NPRM, enrollees would have good cause to disenroll from their managed care plan if their residential, institutional, or employment supports LTSS provider leaves the managed care plan’s network.
    • The proposed rule would clarify that states have the flexibility to accept beneficiaries’ disenrollment requests orally and/or in writing. It would also clarify that disenrollment requests that are denied by a plan must be referred to the state for review. The proposed rule also provides that an enrollee may disenroll from a health plan without cause only once within 90 days following the date of the beneficiary’s initial enrollment; the enrollee would not receive additional opportunities to change plans within the 90-day disenrollment period.

Network adequacy and access to care

Time and distance standards. The proposed rule would require states that contract with MCOs, PIHPs, or PAHPs to establish and enforce network adequacy standards that, at a minimum, include time and distance standards, to be specified by each state, for certain types of providers: primary care (separate adult and pediatric), OB/GYN, behavioral health, specialists (separate adult and pediatric), hospitals, pharmacies, and pediatric dental, as well as additional provider types when it promotes the objectives of the Medicaid program. In addition, states that contract with plans that cover LTSS would be required to develop time and distance standards for LTSS providers when the enrollee must travel to the provider and network adequacy standards other than time and distance standards for LTSS providers that travel to the enrollee to deliver services. States would be permitted to vary their time and distance standards by geographic area. States would have authority to grant exceptions to the provider-specific network standards under limited circumstances. In such cases, states would be required to monitor enrollee access to the relevant provider type and include their findings in their annual program report to CMS, discussed later in this brief.

In setting network adequacy standards, states would be required to consider anticipated Medicaid enrollment and utilization, the characteristics and health needs of different populations, the supply of providers and their Medicaid participation status, providers’ ability to communicate with limited-English- proficient enrollees in their native language, and providers’ ability to ensure physical access and accessible equipment for people with physical or mental disabilities, reasonable accommodations, and culturally competent communication. In setting network adequacy standards for LTSS providers, states would also be required to consider elements that would support an enrollee’s choice of provider, strategies that would support enrollees’ community integration, and other factors that promote the interests of enrollees who need LTSS.

Plan and state assurances of plan capacity and access. Plans would be required to submit annual documentation to the state that they have the capacity to serve the expected enrollee population (in addition to providing this documentation at the time they enter into a state contract or when there is a change in their operations that would affect the adequacy of their capacity, as required now). A change in a plan’s services, geographic service area, or the composition of or payments to its network would also trigger this documentation requirement. The rule would add a requirement that, after states review the documentation provided by plans, they submit an assurance to CMS that the plans meet the state’s requirements for availability of services, including documentation of an analysis that supports the state’s certification of the adequacy of each contracted plan’s provider network. States must also ensure that each plan contract requires the plan to meet state standards for timely access to care, participate in the state’s efforts to promote linguistically and culturally competent care, and provide physical access, accommodations, and accessible equipment for enrollees with disabilities.

Criteria for “medical necessity” definitions. Under the proposed rule, state contracts with MCOs, PIHPs, and PAHPs must use criteria for defining “medical necessity” that comply with federal EPSDT law. The EPSDT medical necessity standard requires the provision of all services for beneficiaries up to age 21 necessary to identify physical and mental health problems, and treatment to correct or ameliorate those conditions, regardless of whether those services are covered under the state Medicaid plan benefit package for adults. The medical necessity definition specified in state contracts with plans would also be required to address the extent to which the plan is responsible for covering services that address the opportunity for enrollees receiving LTSS to have access to the benefits of community living.

Authorization of services and utilization management. States would be required to ensure, through their contracts with MCOs, PIHPs, and PAHPs, that each plan’s utilization management strategies are applied so that services are authorized in a manner that is appropriate for and does not disadvantage individuals who have ongoing or chronic conditions or ongoing needs for LTSS. In addition, utilization controls must not interfere with enrollees’ freedom to choose their method of family planning. The proposed rule would also add a contract standard to require that plans authorize LTSS based on the enrollee’s current needs assessment and, in the case of states that require health plans to establish a person-centered service plan for each enrollee, consistent with his or her person-centered service plan. It would also include a corresponding requirement that decisions to deny authorization for a service or authorize a scope of services less than requested be made by health care professionals who have appropriate expertise in addressing the enrollee’s medical, behavioral health, or LTSS needs. The rule would also change the required timeframe in which plans must make expedited authorization decisions from three working days, as current regulations provide, to 72 hours after receipt of the request for the service; this change would align the Medicaid standard with MA and commercial standards.

Care coordination. The proposed rule would, effectively, broaden current care coordination requirements to ensure that MCO, PIHP, and PAHP enrollees have access to ongoing sources of all care appropriate to their needs, including not only primary care but also behavioral health services and LTSS. Federal standards for care coordination would also be expanded to encompass coordination between settings and with services provided outside the plan by a different plan or through FFS. MCOs, PIHPs, and PAHPs would be required to make their best effort to conduct a health risk assessment within 90 days of enrollment for all new enrollees.

Continued services during transitions. States would be required to have a continuity of care policy to ensure continued access to services during beneficiary transitions from FFS to a managed care plan (including PCCM and PCCM entities) or from one plan to another when, absent continued services, an enrollee would suffer serious health consequences or a risk of hospitalization or institutionalization. The continuity of care policy must, among other requirements, ensure access to services consistent with the access that enrollees previously had and permit enrollees to retain their current provider for a period of time (to be specified by the state) if that provider is not in the managed care plan’s network. State contracts would have to require that MCOs, PIHPs, and PAHPs implement continuity of care policies that meet these standards. States would also be required to make their continuity of care policy publicly available and instruct enrollees and potential enrollees about how to access continued services during a transition.

Prescription drug coverage. The proposed rule would clarify that MCOs, PIHPs, and PAHPs whose contracts include covered outpatient prescription drugs are required to meet federal Medicaid FFS standards regarding the availability and prior authorization of these drugs as if these standards applied directly to the health plans.

Capitation payments for enrollees with short stays in IMDs. The proposed rule would permit states to make a monthly capitation payment (and receive federal matching funds) to an MCO or PIHP for an enrollee age 21-64 who is a patient in an institution for mental disease (IMD), if the facility is a hospital providing psychiatric or substance use disorder (SUD) inpatient care or sub-acute facility providing psychiatric or SUD crisis residential services, and the stay in the IMD is for no more than 15 days in that month. This proposed policy departs from current rules, which prohibit capitation payments on behalf of adult Medicaid enrollees who are patients in an IMD. CMS’ stated purpose in proposing this change is to improve access to short-term inpatient psychiatric and SUD treatment for Medicaid managed care enrollees when cost-effective and medically appropriate, and to improve the coordination and management of psychiatric and SUD treatment for managed care enrollees who need such care.

Managed long-term services and supports (MLTSS)

For the first time, CMS proposes standards specific to the provision of MLTSS, acknowledging the significant expansion of this delivery system model since the Medicaid managed care regulations were last revised. CMS proposes a definition of LTSS and throughout the NPRM, includes references to LTSS in existing regulations that currently apply to the provision of medical services by health plans, discussed in the other sections of this brief. In addition, CMS also proposes some new requirements particular to MLTSS, detailed below. Many of the provisions in the NPRM seek to codify the best practices in MLTSS programs identified by CMS in guidance issued in 2013.2 

Identification and assessment of enrollees with LTSS needs. States would be required to have mechanisms to identify enrollees with LTSS needs, and MCOs, PIHPs, and PAHPs would be required to implement comprehensive assessments by appropriate health professionals to identify ongoing special conditions of these enrollees that require a course of treatment or regular care monitoring.

Person-centered process. The proposal would require that, when an MCO, PIHP, or PAHP authorizes LTSS for an enrollee, it take into account the enrollee’s current needs assessment and person-centered service plan.

Services to be provided in home and community-based settings. CMS proposes that plan contracts that include MLTSS comply with the recent home and community-based services settings rules.3 

Provider credentialing. CMS proposes that the state’s provider credentialing process must address behavioral health and LTSS providers.

Stakeholder engagement. New rules would require states to create and maintain a stakeholder group to solicit the opinions of beneficiaries, providers, and other stakeholders in the design, implementation, and oversight of a state’s MLTSS program, consistent with CMS’ 2013 guidance. In addition, plans providing MLTSS would be required to have a member advisory committee, which must include at least a reasonably representative sample of the populations receiving LTSS covered by the plan.

Appeals

The proposed rule includes provisions intended to better align the Medicaid managed care appeals process with the processes required for Marketplace and MA plans.

Timeframes for requesting and resolving appeals. The NPRM would change the timeframes for several components of the appeals process, as summarized below in Table 1.

Internal plan appeal process and access to state fair hearing. The NPRM would allow plans to offer only one level of internal plan appeals for enrollees. Once an enrollee exhausts this single level of internal appeal, the enrollee would be able to request a state fair hearing. CMS also proposes to remove the existing regulation that allows states to determine whether enrollees can bypass the internal plan appeal process and instead proceed directly to a state fair hearing; under the proposed rule, all enrollees would have to exhaust the internal plan appeal process.

Table 1: Proposed Changes to Timeframes for Service Authorization and Appeals Processes
ProcessCurrent RuleProposed Rule
Beneficiary request for an internal plan appealState selects a period between 20 and 90 days from notice of adverse benefit determination60 calendar days from receipt of the notice of adverse benefit determination
Standard timeframe for decision on an internal plan appeal45 days from receipt of appeal30 calendar days from receipt of appeal
Notice of expedited resolution of an appeal by health plan3 working days from plan receipt of appeal72 hours from plan receipt of appeal
Beneficiary request for a state fair hearingState selects a period between 20 and 90 days from notice of adverse benefit determination; state option about whether beneficiaries can bypass internal plan appeal and go directly to fair hearing120 calendar days from the date of the notice of internal plan appeal resolution; beneficiaries must exhaust internal plan appeal before accessing fair hearing
Implementation of state fair hearing decision by health plan when an adverse benefit determination is overturned on appeal3 working days from receipt of notice of state fair hearing decision72 hours from receipt of notice of state fair hearing decision

Continuation of benefits during appeals. In the preamble to the NPRM, CMS indicates that it seeks to modify existing regulations to enable beneficiaries to continue to receive services while an appeal of a plan’s decision to terminate existing services is pending, regardless of whether the original service authorization period has expired. However, the language in the proposed regulation does not exactly track CMS’ stated intention in the preamble and may not extend to all circumstances in which beneficiaries seek continued services while appeals are pending if an authorized period for the services at issue has expired.

If an enrollee loses an appeal and had received continued services during the appeal, the plan can recoup the cost of the continued services, but the proposed rule specifies that a plan can do so only to the extent that the state does so in FFS.

Beneficiary access to documents and records. The proposed rule clarifies that beneficiaries must have timely access, free of charge, to documents, records, and other information relevant to their claims for benefits, including medical necessity criteria and any processes, strategies, or evidentiary standards used by the plan in setting coverage limits.

Information considered during appeals. The proposed rule clarifies that plans must consider all information submitted by beneficiaries in appeals, regardless of whether the information was considered in the plan’s initial decision.

Recordkeeping. The proposed rule sets minimum standards for the types of information that states, through their contracts, must require plans to include in their appeals records. The rule also clarifies that states must review these records as part of their ongoing monitoring and oversight procedures.

Capitation rate-setting

The proposed rule seeks to strengthen federal requirements pertaining to the development of capitation rates for MCOs, PIHPs, and PAHPs to better assure fiscal integrity, increase transparency in the rate-setting process, ensure beneficiary access to care, increase state accountability, and support federal oversight.

Actuarial soundness standards. The proposed rule establishes new standards for the development of actuarially sound capitation rates, which states must meet and CMS would apply in its review and approval of rates. Capitation payment amounts must be adequate to enable plans to efficiently deliver covered services to enrollees in a manner that complies with all contractual requirements (e.g., requirements to assure availability of and timely access to services, adequate networks, and coordination and continuity of care).

Minimum medical loss ratio (MLR). A MLR is the ratio of a health plan’s incurred claims and expenditures for health care quality improvement activities to the plan’s adjusted premium revenue. Under the proposed rule, states would be required to use the MLRs of their contracted MCOs, PIHPs, and PAHPs in the development of actuarially sound capitation rates and would be required to set capitation rates such that the health plans can reasonably achieve a minimum MLR of at least 85% in the rate year. The MLR provisions would apply to states for contracts starting on or after January 1, 2017. The minimum MLR of 85% is consistent with the standard that applies in the MA and private health insurance markets under the ACA. However, while MA and Marketplace plans that do not meet the minimum MLR must remit payments to CMS and make rebates to consumers, respectively, the proposed rule does not require Medicaid managed care plans whose actual experience does not meet the MLR standard to remit payment to the state. If a state does elect to mandate a minimum MLR (i.e., require remittances) for its Medicaid managed care plans, the minimum must be at least 85%.

Consistent with the proposed requirement for states to consider MLRs in the rate-setting process, the proposed rule would require contracted MCOs, PIHPs, and PAHPs to calculate and report their MLR to the state annually. The proposed rule sets forth standards regarding how the MLR for Medicaid managed care plans must be calculated, and it specifies the information that health plans must include in the required MLR report that they must submit to the state. Health plans would be required to attest to the accuracy of the calculation of their MLR in accordance with the federal specifications.

Specificity of capitation rates. The rule would require that capitation rates be specific to each rate cell under the contract (i.e., the payment rate under one rate cell must not subsidize the payment rate under any other). Also, states would have to certify a specific rate, rather than a rate range, for each rate cell.

Certification and documentation requirements. States would have to certify each individual rate paid under each contract as actuarially sound and document in their rate certification submissions to CMS the data, assumptions, and methodologies underlying the rates in sufficient detail to permit CMS to understand and assess them. The NPRM specifically defines the documentation that states would be required to include in the rate certifications they submit for CMS review and approval concurrent with their submission of contracts for CMS review and approval.

Delivery system and provider payment incentives. The proposed rule would codify longstanding CMS policy on the (limited) extent to which states may direct health plan spending under a risk contract. At the same time, it would explicitly establish that states may require plans to implement value-based purchasing models for provider payment, participate in multi-payer delivery system reform or quality improvement initiatives, adopt a minimum fee schedule for providers, or raise provider payment rates.

The proposed rule would also modify and build on current rules and standards regarding special contract provisions related to payment to MCOs, PIHPs, and PAHPs, specifically, risk-sharing mechanisms, incentive arrangements, and withhold arrangements. Under the proposed standards, incentive arrangements would have to be necessary to support initiatives tied to performance and quality improvement. Contracts that provide for withhold arrangements would be required to ensure that the capitation payment minus any portion of the withhold that is not reasonably achievable is actuarially sound.

Quality of care

CMS proposes a number of changes in and additions to existing requirements to strengthen quality measurement and improvement efforts in Medicaid managed care. The proposed rule articulates three principles that underlie these changes: increased transparency of plan quality to Medicaid beneficiaries; alignment of quality standards for Medicaid managed care with MA and Marketplace standards where appropriate, to create a more integrated approach across programs and states; and consumer and stakeholder engagement in developing state strategies for measuring and improving quality in Medicaid managed care programs, including those delivering LTSS (discussed above).

State comprehensive quality strategy. The NPRM would establish a new requirement that each state draft and implement a written comprehensive quality strategy for assessing and improving the quality of care and services provided to all Medicaid beneficiaries across all delivery systems, including FFS as well as managed care. The comprehensive quality strategy would be required to include the state’s goals and objectives for continuous and measurable quality improvements, and the metrics and targets to be used in assessing performance and improvement. It must also identify the measures and outcomes that the state will publish at least annually on its Medicaid website. States would also be required to make their comprehensive quality strategy available on their Medicaid website.

States contracting with MCOs, PIHPs, or PAHPs would be required to incorporate specified managed care elements into their comprehensive quality strategy, including the state’s network adequacy and availability of care standards, quality metrics and performance improvement targets, arrangements for annual external reviews of quality and access under each contract, and other elements. The rule would require that states review and update their comprehensive quality strategy at least every three years and publish the results of their reviews on their Medicaid website.

State review and approval of plans. The proposed rule would establish a new requirement that, to enter into a contract with a state, MCOs, PIHPs, and PAHPs must be reviewed and approved by the state on the basis of performance, using standards at least as stringent as those used by a private accreditation entity recognized by CMS to accredit MA and Marketplace plans. Plans would also have to be reviewed and reapproved at least once every three years. States would have the option to deem compliance of plans with the required standards based on accreditation by a private independent entity.

Quality assessment and performance improvement (QAPI) programs. CMS would expand the scope of the requirements for QAPI programs that currently apply to state contracts with MCOs and PIHPs, and would extend them to apply to PAHPs as well. Through a public notice and comment process, CMS would specify a core set of standardized performance metrics and topics for performance improvement projects to be included along with state-selected standard measures and topics included in state contracts with plans.

In addition, states would need to ensure through contracts that plans have mechanisms to address the quality and appropriateness of care provided to enrollees needing LTSS. These mechanisms would have to address how the needs of these individuals are met when transitioning between care settings and compare the services these individuals receive with those recommended in their treatment plan. Additionally, in their contracts with plans that provide LTSS, states would be required to include performance measures that assess beneficiaries’ quality of life and the outcomes of rebalancing and community integration for beneficiaries receiving LTSS.

Medicaid managed care quality rating system. Each state contracting with MCO, PIHP, or PAHPs would be required to establish a quality rating system for such plans. The rating system would address plan quality in three domains: clinical quality management; member experience; and plan efficiency, affordability, and management. States’ systems would be required to use the standardized performance measures specified by CMS, as described above, as well as any additional measures specified by the state. Under the rule, CMS would establish a methodology for calculating quality ratings and states would be required to collect performance data from contracted plans to support the rating system; with CMS approval, states could opt to implement an alternative quality rating system that uses different domains or measures or applies a different methodology. States would be permitted to use the MA five-star rating system for plans that serve dually eligible beneficiaries exclusively. States would be required to prominently display each plan’s quality rating on its Medicaid managed care website.

External quality review (EQR). The rule would expand the mandatory activities of EQR entities to include validation of MCO, PIHP, and PAHP network adequacy during the previous 12-month period. The rule would preclude an accrediting body from serving as an External Quality Review Organization (EQRO) for a plan that it has accredited within the previous three years, to be consistent with another proposed provision that would allow an EQRO to use the results of an accreditation review to perform the final EQR analysis. It would also require states to submit EQRO contracts to CMS before claiming the 75% federal match for EQR-related activities related to MCOs, and establish that the federal match for such activities related to PIHPs and PAHPs is 50%.

State monitoring standards

State monitoring system. States would be required to have a state monitoring system, including oversight responsibilities, for all its managed care programs. The proposed rule specifies that this monitoring system would have to address the performance of the state’s managed care program in virtually every aspect of its operations and management. The rule would require further that states use data collected from their monitoring activities to improve the performance of their managed care programs, and it specifies minimum requirements regarding the data states must collect.

Readiness reviews. States would be required to conduct readiness reviews of MCOs, PIHPs, PAHPs, and PCCM entities before they implement a managed care program; when a specific plan has not previously contracted with the state; and when any currently contracted plan adds new eligibility groups, benefits, or geographic areas to its scope. Readiness reviews must include both desk reviews and onsite reviews for each plan, and must be submitted to CMS for the agency’s review and approval of all MCO, PIHP, PAHP, and PCCM entity contracts.

Annual program report to CMS. States would be required to submit a report to CMS on each managed care program they operate, after each contract year. The report would have to provide information on and an assessment of the operation of the managed care program, including at a minimum: the financial performance of each risk-based plan; grievances, appeals, and state fair hearings for the program; availability and accessibility of covered services; evaluation of performance on quality measures; and other specified elements. States would be required to post the annual program report on their Medicaid managed care website, and provide it to the Medical Care Advisory Group and, if applicable, the LTSS stakeholder consultation group.

Program integrity

The proposed rule would strengthen and add to program integrity requirements for states and managed care plans. Program integrity and compliance plan requirements would be extended to PAHPs and plan subcontractors. Plans would be required, through state contracts, to submit specified data to the state, including encounter data; data related to capitation rates, assessments of compliance with the minimum MLR, and insolvency protections; and other data. All data, documentation, and information provided by plans would have to be certified by the plans’ CEO or CFO. Plans’ procedures to detect and prevent fraud, waste, and abuse would be required to include a compliance program that meets specified standards and, among other requirements, provides for mandatory reporting to the state of potential fraud or improper payments and changes that may affect an enrollee’s eligibility or a provider’s eligibility to participate (e.g., termination of the provider agreement).

States would be required to monitor plan compliance with the data, information, and documentation requirements and plan certification of all such matters, as well as plan compliance with required program integrity activities, and to make plan program integrity information, as described above, publically available on state’s Medicaid managed care website. States would also be required to screen and enroll all network providers of Medicaid managed care plans and to conduct monthly federal database checks for excluded managed care plans and subcontractors.

Encounter data. The NPRM would define enrollee encounter data and add enrollee encounter data standards that would have to be incorporated in all MCO, PIHP, and PAHP contracts. Contracts would be required to specify that enrollee encounter data include information about the provider rendering services, be submitted in compliance with CMS specifications regarding accuracy and completeness, and be submitted to the state in a format consistent with the industry standard. The rule would also add a new section to implement the requirement that states report encounter data to CMS. CMS intends to issue future guidance about the required specificity of encounter data that plans must report.

The proposed rule would also clarify that federal matching payments would not be available for states that do not meet data submission benchmarks for accuracy, completeness, and timeliness. Under the NPRM, CMS could issue partial deferrals or disallowances of federal matching payments for failure to report enrollee encounter data, on a per-enrollee basis and based on the type of service for which the reported encounter data do not meet the requirements. Within 90 days of the effective date of the final regulation, states would be required to submit to CMS a detailed plan of their procedures for ensuring that complete and accurate enrollee encounter data are being submitted on a timely basis.

Partial deferrals and disallowances. Under a proposed new section, CMS state Medicaid agencies could defer or disallow federal matching payments for spending under a managed care contract when it does not comply with applicable statute and rules, including standards for actuarial soundness of payment rates. CMS has previously interpreted the federal Medicaid managed care statute to mean that, if a state fails to comply with any of required conditions, there could be no federal matching at all for payments under the contract, even for amounts associated with services for which there was full compliance with all requirements. CMS proposes, in the new section, to interpret the law to condition federal matching payments on a service-by-service basis, so that, for example, if a violation involved the payment amount associated with inpatient hospital costs and that was the only portion of the payment amount that was not actuarially sound, then only federal matching payments for that portion of the payment would be deferred or disallowed.

Looking ahead

The Medicaid managed care NPRM represents an effort by CMS to update the federal regulatory framework for the structure, operation, accountability, quality, and oversight of Medicaid managed care programs. The 60-day public comment period for the NPRM closes on July 27, 2015. In light of the scope of the proposed rule, CMS’ solicitation of public input on numerous issues, and the diverse stakeholder interests in Medicaid managed care, the volume of comments on the NPRM is likely to be great. Based on CMS’ consideration of the public comments, the final rule that is issued could reflect some rethinking or refinement of the policies set forth in the proposed rule to govern this large and growing sector of the Medicaid program.

Assistance in preparing this issue brief was provided by Health Policy Alternatives, Inc.
 

Endnotes

  1. 80 Fed. Reg. 31098-31297 (June 1, 2015), available at https://www.federalregister.gov/articles/2015/06/01/2015-12965/medicaid-and-childrens-health-insurance-program-chip-programs-medicaid-managed-care-chip-delivered. ↩︎
  2. Centers for Medicare and Medicaid Services, Guidance to States using 1115 Demonstrations or 1915(b) Waivers for Managed Long Term Services and Supports Programs (May 2013), available at http://www.medicaid.gov/Medicaid-CHIP-Program-Information/By-Topics/Delivery-Systems/Downloads/1115-and-1915b-MLTSS-guidance.pdf; see also Kaiser Commission on Medicaid and the Uninsured, Key Themes in Capitated Medicaid Managed Long-Term Services and Supports Waivers (Nov. 2014), available at https://modern.kff.org/medicaid/issue-brief/key-themes-in-capitated-medicaid-managed-long-term-services-and-supports-waivers/. ↩︎
  3. 79 Fed. Reg. 2948-3039 (Jan. 16, 2014), available at http://www.gpo.gov/fdsys/pkg/FR-2014-01-16/pdf/2014-00487.pdf.     ↩︎
News Release

Will the Iran Debate Defuse Partisan Battles Over Obamacare?

Published: Jul 23, 2015

In his latest column for The Wall Street Journal’s Think Tank, Drew Altman discusses whether the debate about the Iran deal may bring a respite for the Affordable Care Act from politics as usual, and how long it might last.

All previous columns by Drew Altman are available.

The Role of NGOs in the U.S. Global Health Response

Published: Jul 21, 2015

Non-governmental organizations (NGOs) are key implementers of U.S. global health programs, yet in the past, little has been known about the scope of their role. To help shed light on this issue, two recent Kaiser Family Foundation reports assessed NGO engagement in U.S. global health efforts, looking first at U.S.-based NGOs1  and then at those based outside the U.S.2  that received U.S. government funding from the U.S. Agency for International Development (USAID) (the largest U.S. global health implementing agency as measured by funding). While these individual analyses provided new windows into the respective roles of NGOs in and outside of the U.S. – showing, for example, that U.S.-based NGOs were headquartered in 25 states and the District of Columbia3  – this data note pulls them together with updated data to paint a more comprehensive picture.4  This analysis found that NGOs received a significant share of U.S. government (USG) global health funding disbursed by USAID in FY 2014. While the majority of these NGOs were based outside the U.S., most funding went to those based in the U.S. Specifically, the analysis found that:

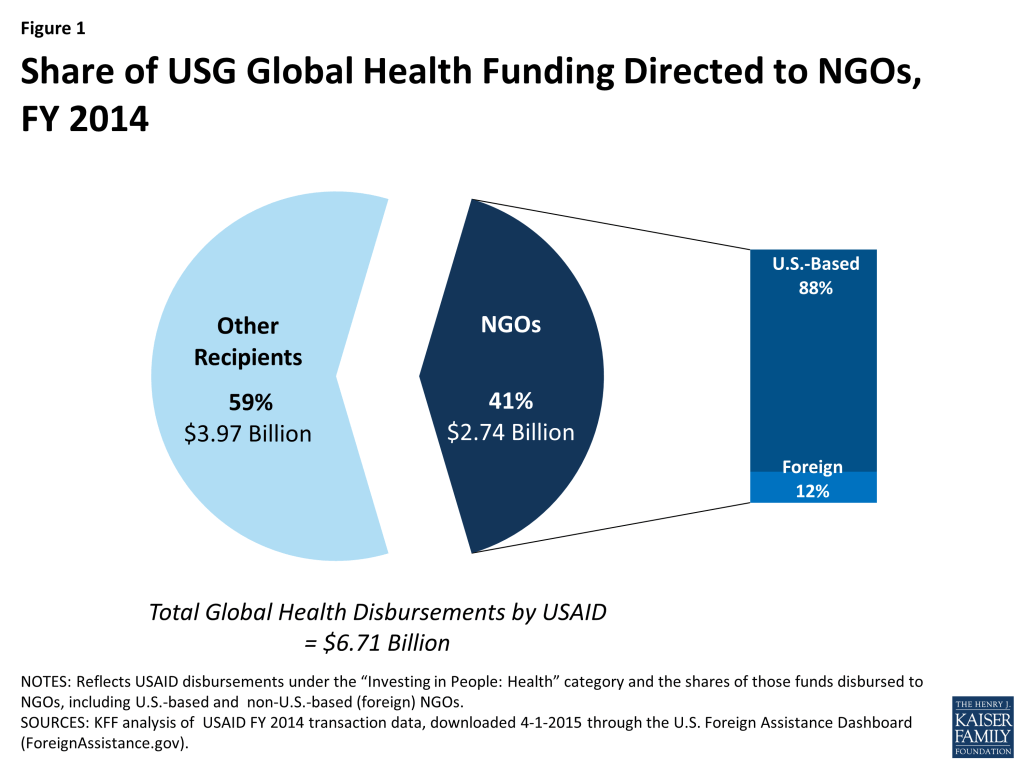
  • Of the more than $6.71 billion disbursed by USAID in FY 2014 for global health activities, 41% ($2.74 billion) was provided to more than 300 NGOs. See Figure 1.
Figure 1: Share of USG Global Health Funding Directed to NGOs, FY 2014
  • More than half (59%, 179) of these NGOs were based outside the U.S.; the rest (41%, 125) were U.S.-based. On the other hand, most funding went to U.S.-based NGOs, which accounted for almost $9 of every $10 (88%); the remaining 12% went to NGOs based outside the U.S. See Figure 1 and Table 1.
  • Funding overall was concentrated among a small group of NGOs – 20 NGOs received 80% ($2.2 billion) of funding going to NGOs; of these, 17 were U.S. based. See Table 2.
  • Most NGOs, however, received much smaller amounts of funding, including 198 NGOs that received $1 million or less.
  • NGOs carried out U.S. global health activities in all major program areas – HIV; tuberculosis (TB); malaria; family planning and reproductive health (FP/RH); maternal and child health (MCH); nutrition; other public health threats (which includes neglected tropical diseases or NTDs); pandemic influenza and other emerging threats (PIOET); and water supply and sanitation.
  • Most though (210 NGOs) received funding in just a single program area; less than a third (94) received funding in two or more areas.
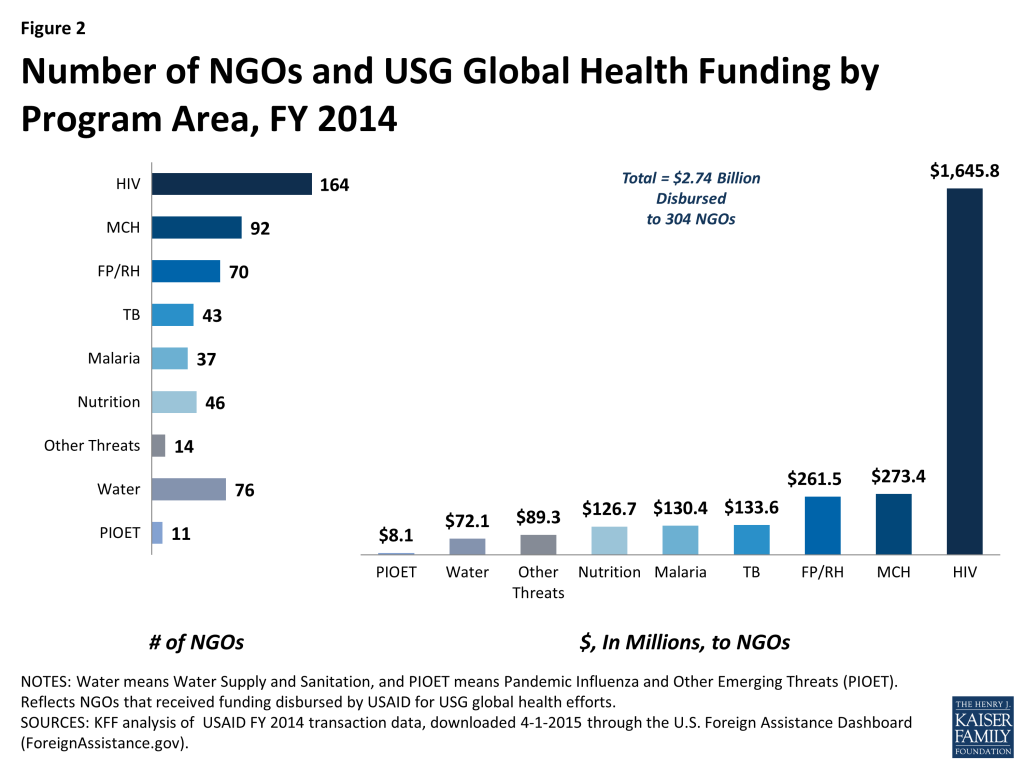
  • HIV had the greatest number of NGOs (164) and accounted for the most funding ($1.65 billion), followed by MCH; see Figure 2.
Figure 2: Number of NGOs and USG Global Health Funding by Program Area, FY 2014
  • HIV was the only program area with more non-U.S.-based than U.S.-based NGOs, while TB was the only program area that provided more funding to non-U.S.-based than U.S.-based NGOs. See Tables 1 and 3.
  • Overall, NGO efforts were carried out in close to 80 countries, though most NGOs received funding for activities in a single country.5  Both U.S.-based NGOs and those based outside the U.S. were most likely to be working in Africa, where most funding was directed. See Table 1.
  • In more than a third of the countries reached, 10 or more NGOs received U.S. support.6 

While this analysis provides new information on the role of NGOs in U.S. global health activities, it also raises several questions and issues for U.S. global health policy, including the following:

  • Although the U.S. government has signaled its intention to work more directly with in-country partners, strengthen local capacity, and support country ownership, this analysis shows that most U.S. global health funding for NGOs was directed to those based in the U.S.7  Will this distribution shift going forward? Does it need to? And what effects might such a shift have on the impact of U.S. global health efforts?
  • Similarly, while this analysis shows that most NGO recipients were not based in the U.S., it is unclear how many of these NGOs are actually local organizations,8  versus international NGOs akin to their U.S.-based counterparts. What is the mix of local and international NGOs among recipients, and will this mix, as well as the respective roles of these NGOs, change in coming years?
  • In some sense, this analysis captures just the first couple of steps of the U.S. global health funding process – the funding provided by USAID to NGOs. What happens to the funding then? Does the recipient NGO carry out global health efforts directly, or does it contract further with other entities, including other NGOs?
  • Finally, how has the U.S. leveraged its support for NGOs to strengthen civil society in some countries and to develop technical networks of NGOs working in certain areas of global health or networks of NGOs working in global health more generally?
Table 1: Number of NGOs and USG Global Health Funding, FY 20149 
Region# of NGOsRegionFunding (in $ millions)
OverallU.S.ForeignOverallU.S.Foreign
Total304125179Total2,7412,404337
By RegionBy Region
   Africa20078122   Africa1,5191,260259
   Asia*723537   Asia*30124556
   Europe & Eurasia19163   Europe & Eurasia1110<1
   Latin America & the Caribbean352510   Latin America & the Caribbean67624
   Middle East1293   Middle East33321
   “Worldwide”786612   “Worldwide”81079416
By Program AreaBy Program Area
   HIV16462102   HIV1,6461,453193
   MCH926230   MCH27325617
   FP/RH704228   FP/RH26121943
   TB432419   TB1346469
   Malaria372611   Malaria1301292
   Nutrition463511   Nutrition1271225
   Other Public Health Threats^14140   Other Public Health Threats^89890
   Water Supply and Sanitation764036   Water Supply and Sanitation72648
   PIOET1192   PIOET88<1
NOTES:  Reflects NGOs that received funding disbursed by USAID for USG global health efforts and funding disbursed by USAID to NGOs for activities in specific regions and “worldwide”, which is a “benefitting location” designated by USAID in the data. Regions align to USAID Bureaus of the same names, reflecting countries addressed by and regional programs overseen by these bureaus (except * indicates includes Afghanistan and Pakistan, which has a separate USAID office). Additional NGOs operating “worldwide” efforts may also operate in specific regions. ^ indicates includes NTDs. # of NGOs by region/program area will not sum to equal overall # of NGOS, as some NGOs work in more than one region/program area. Funding subtotals may not sum to equal overall funding due to rounding.


Table 2: Top 20 NGOs by USG Global Health Funding, FY 2014 (in millions)10 
Partnership for Supply Chain Management ~523.7IntraHealth International56.2
FHI Development 360346.0World Vision51.9
Management Sciences for Health (MSH)224.9Save the Children45.2
Jhpiego206.8Right to Care37.9
Population Services International (PSI)161.5PACT33.3
Research Triangle Institute (RTI International)102.4EngenderHealth31.7
Program for Appropriate Technology in Health (PATH)72.8CARE31.5
JSI Research & Training Institute67.8Elizabeth Glaser Pediatric AIDS Foundation29.9
Pathfinder International62.2Marie Stopes International (MSI)28.7
KNCV Tuberculosis Foundation59.7International AIDS Vaccine Initiative (IAVI)28.3
NOTES: Non-U.S.-based (foreign) NGOs are highlighted in bold.  Other NGOs are U.S.-based.  ~ indicates NGO is a separate legal entity established by JSI Research & Training Institute and MSH to implement specific work. Reflects NGOs that received funding disbursed by USAID for USG global health efforts.


Table 3: NGOs by Program Area and Type, FY 201411 
HIV
U.S.-Based NGOsForeign NGOs
  • Academy for Educational Development
  • Africare
  • AIDS Vaccine Advocacy Coalition
  • American Council on Education
  • Amref Health Africa in the USA
  • Ananda Marga Universal Relief Team
  • Axios Foundation
  • CARE
  • Caris Foundation International
  • Catholic Relief Services
  • Center for Human Services
  • ChildFund International USA
  • Citizens Network for Foreign Affairs
  • Education Development Center
  • Elizabeth Glaser Pediatric AIDS Foundation
  • EngenderHealth
  • Feed the Children
  • FHI Development 360
  • FXB USA (Association Francois-Xavier Bagnoud USA)
  • Global AIDS Interfaith Alliance
  • Global Communities
  • Gorongosa Restoration Project (Gregory C. Carr Foundation)
  • Health Through Walls
  • Heartland Alliance for Human Needs & Human Rights
  • HOPE worldwide
  • International AIDS Vaccine Initiative (IAVI)
  • International Partnership for Microbicides
  • International Relief and Development
  • International Youth Foundation
  • Internews Network
  • IntraHealth International
  • James R. Jordan Foundation
  • Jhpiego
  • JSI Research & Training Institute
  • Management Sciences for Health
  • mothers2mothers
  • NetHope
  • Opportunity International
  • PACT
  • Partners In Health
  • Partnership for Supply Chain Management
  • PATH
  • Pathfinder International
  • Plan International USA
  • Population Council
  • Population Services International
  • Project Concern
  • Project HOPE
  • Public Health Institute
  • RTI International
  • Save the Children
  • Search for Common Ground
  • Sesame Workshop
  • South Africa Partners
  • Synergos Institute
  • TechnoServe
  • Touch Foundation
  • U.S. Pharmacopeial Convention
  • WomanCare Global
  • World Education
  • World Learning
  • World Vision
  • ADEMAS
  • ADPP Angola
  • Africa Health Placements
  • African Enterprise
  • African Palliative Care Association
  • AgriAIDS SA
  • Agribusiness in Sustainable Natural African Plant
  • AIDS Foundation East-West
  • AIDS Support Organization, The (TASO)
  • Akphivath Neary Khmer Organization
  • All-Ukrainian Network of People Living with HIV/AIDS
  • Anova Health Institute
  • ARCAD-SIDA
  • Associacao Espaco de Prevencao e Atencao Humanizada (EPAH)
  • Associacao Nacional des Enfermeiros de Moçambique (ANEMO)
  • Association of Private Health Facilities in Tanzania
  • Aurum Institute, The
  • Banja La Mtsogolo
  • British Council
  • Caribbean HIV/AIDS Alliance
  • Caritas Rwanda
  • Catholic AIDS Action
  • Center for Community Health Research and Development
  • Centre for Promotion of Quality of Life
  • Centre International de Developpement et de Recherche
  • CHAMP
  • Child Welfare Bloemfontein & Childline Free State
  • Childline Mpumalanga
  • Children in Distress Network
  • Church Alliance for Orphans
  • Dasra
  • Dignitas International
  • Equity Group Foundation
  • Ethiopian Society of Sociologists, Social Workers, and Anthropologists
  • Expanded Church Response
  • Fondazione AVSI
  • Fundacao para o Desenvolvimento da Comunidade
  • Future Families
  • GECHAAN
  • Ghana – West Africa Project to Combat AIDS and STI
  • GHESKIO Centers
  • Health Insurance Fund
  • HIVSA
  • Hope for Children
  • Hospice Africa Uganda
  • Hospice Palliative Care Association of South Africa
  • IKP Knowledge Park
  • Indonesian International Education Foundation
  • International Centre for Reproductive Health
  • International HIV/AIDS Alliance
  • Inter-Religious Council of Uganda
  • Jembi Health Systems
  • Johns Hopkins Health and Education in South Africa
  • Joint Medical Store
  • KAYEC Trust
  • Kenya Community Development Foundation
  • KHANA
  • Kheth’Impilo AIDS Free Living
  • Khmer’s Women Cooperation for Development
  • KNCV Tuberculosis Foundation
  • Lifeline/Childline Namibia
  • Lifeskills Promoters
  • Lilongwe Medical Relief Fund Trust
  • Luapula Foundation
  • Marie Stopes International
  • Maritime Life Precious Foundation
  • N’weti – Health Communication
  • National Association of Child Care Workers
  • National Council of People Living with HIV and AIDS (NACOPHA)
  • National Network of Positive Women Ethiopians
  • NawaLife Trust – Namibian Centre for Communication Programmes
  • Nepal CRS Company
  • Network on Ethics/Human Rights, Law, HIV/AIDS – Prevention, Support & Care
  • Networking HIV/AIDS Community of South Africa
  • Nyumbani
  • Organization for Public Health Interventions and Development
  • Partners in Hope
  • PASADA
  • PharmAccess Foundation
  • Population and Community Development Association
  • Profamilia
  • Pro-Health International
  • Reencontro
  • Reformed Church of East Africa
  • Regional Centre for Quality of Healthcare
  • Reproductive Health Uganda
  • REPSSI
  • Right to Care
  • Society for Family Health Namibia
  • Society for Family Health Nigeria
  • Society for Family Health Rwanda
  • Solutions for Innovative Policies, Programs, and Technologies
  • Soutoura Association
  • Thembalethu Development
  • Tovwirane HIV/AIDS Organisation
  • Uganda Health Marketing Group
  • University Research South Africa
  • Vodafone Foundation
  • Witkoppen Health and Welfare Centre
  • Women and Law in Southern Africa – Zambia
  • Women in Law and Development in Africa  (WILDAF)
  • Zambia Centre for Communication Programmes
Maternal and Child Health (MCH)Family Planning and Reproductive Health (FP/RH)
U.S.-Based NGOsForeign NGOsU.S.-Based NGOsForeign NGOs
  • ACDI/VOCA
  • American Association for the Advancement of Science
  • Adventist Development and Relief Agency
  • Africa-America Institute
  • Africare
  • Aga Khan Foundation
  • American Council on Education
  • American Refugee Committee
  • Amref Health Africa in the USA
  • CARE
  • Catholic Relief Services
  • Center for Human Services
  • ChildFund International USA
  • Citizens Network for Foreign Affairs
  • Concern Worldwide US
  • Counterpart International
  • Curamericas Global
  • D-REV
  • Elizabeth Glaser Pediatric AIDS Foundation
  • EngenderHealth
  • FHI Development 360
  • Future Generations
  • Global Environment and Technology Foundation
  • Grameen Foundation USA
  • Health Alliance International
  • Health Partners
  • Health Right International
  • Health Through Walls
  • Helen Keller International
  • International Aid
  • International Relief and Development
  • International Rescue Committee
  • Internews Network
  • IntraHealth International
  • James R. Jordan Foundation
  • Jhpiego
  • JSI Research & Training Institute
  • Management Sciences for Health
  • Medical Care Development
  • Medical Teams International
  • Mercy Corps
  • National Collegiate Inventors and Innovators Alliance
  • New Venture Fund
  • Partners for Development
  • Partnership for Child Health Care
  • Partnership for Supply Chain Management
  • PATH
  • Pathfinder International
  • Plan International USA
  • Population Council
  • Population Reference Bureau
  • Population Services International
  • Public Health Institute
  • RTI International
  • Save the Children
  • Sesame Workshop
  • Touch Foundation
  • U.S. Pharmacopeial Convention
  • World Learning
  • World Relief
  • World Renew
  • World Vision
  • ADEMAS
  • Ariel Glaser Pediatric AIDS Healthcare Initiative
  • Asociacion Benefica PRISMA
  • Asociacion Los Andes Cajamarca (ALAC)
  • Association de Soutien au Developpement des Activites de Population
  • Caritas Rwanda
  • Christian Health Association of Malawi
  • CPTAFE
  • Dasra
  • Federacion Red Nicasalud
  • Federation of Indian Chambers of Commerce and Industry
  • Health Insurance Fund
  • Indonesian International Education Foundation
  • Institut Pasteur
  • Integrated Midwives’ Association of the Philippines
  • International Union Against Tuberculosis and Lung Disease
  • Joint Medical Store
  • KHANA
  • KNCV Tuberculosis Foundation
  • Lifeline Nepal
  • Marie Stopes International
  • Nepal CRS Company
  • Population Foundation of India
  • Regional Centre for Quality of Health Care
  • Reproductive Health Association of Cambodia
  • Social Marketing Company
  • Society for Family Health Nigeria
  • Society for Family Health Rwanda
  • Women’s League of Creative Initiative
  • Zuellig Family Foundation
  • American Association for the Advancement of Science
  • American Council on Education
  • Amref Health Africa in the USA
  • Aspen Institute, The
  • CARE
  • Center for Human Services
  • ChildFund International USA
  • Conservation International Foundation
  • Counterpart International
  • Education Development Center
  • EngenderHealth
  • FHI Development 360
  • Helen Keller International
  • Innovations for Poverty Action
  • International Center for Research on Women
  • International Medical Corps
  • International Partnership for Microbicides
  • International Rescue Committee
  • Internews Network
  • IntraHealth International
  • Jhpiego
  • JSI Research & Training Institute
  • Management Sciences for Health
  • Mercy Corps
  • Partnership for Child Health Care
  • Partnership for Supply Chain Management
  • PATH
  • Pathfinder International
  • Plan International USA
  • Population Council
  • Population Reference Bureau
  • Population Services International
  • Public Health Institute
  • RAND Corporation
  • RTI International
  • Save the Children
  • Touch Foundation
  • Volunteers for Economic Growth Alliance
  • WomanCare Global
  • World Education
  • World Learning
  • World Vision
  • ADEMAS
  • Ariel Glaser Pediatric AIDS Healthcare Initiative
  • Ashonplafa
  • Caritas Rwanda
  • Confederation of Ethiopian Trade Unions
  • Dasra
  • Federation of Indian Chambers of Commerce and Industry
  • Health Insurance Fund
  • Ifakara Health Institute
  • Integrated Midwives’ Association of the Philippines
  • International Planned Parenthood Foundation
  • Kazakhstan Association on Sexual and Reproductive Health
  • KHANA
  • Malawi Adventist Health Services
  • Marie Stopes International
  • N’weti – Health Communication
  • Nepal CRS Company
  • Organization for Development in Action
  • Population Services Zimbawe
  • Regional Centre for Quality of Healthcare
  • Reproductive and Child Health Alliance (RACHA)
  • Reproductive Health Association of Cambodia
  • Rohi Weddu Pastoral Women Development Organization
  • Social Marketing Company
  • Society for Family Health Nigeria
  • Society for Family Health Rwanda
  • T-MARC Tanzania
  • Zuellig Family Foundation
Tuberculosis (TB)Malaria
U.S.-Based NGOsForeign NGOsU.S.-Based NGOsForeign NGOs
  • American Association for the Advancement of Science
  • Africa-America Institute
  • CARE
  • Center for Human Services
  • Elizabeth Glaser Pediatric AIDS Foundation
  • FHI Development 360
  • Global Alliance for TB Drug Development
  • International Relief and Development
  • IntraHealth International
  • Jhpiego
  • JSI Research & Training Institute
  • Management Sciences for Health
  • Partnership for Supply Chain Management
  • PATH
  • Pathfinder International
  • Plan International USA
  • Population Services International
  • Project HOPE
  • Public Health Institute
  • U.S. Pharmacopeial Convention
  • Volunteers for Economic Growth Alliance
  • World Learning
  • World Relief
  • World Vision
  • Anova Health Institute
  • Centre for Health Solutions – Kenya
  • GHESKIO Centers
  • Hospice Palliative Care Association of South Africa
  • Indonesian International Education Foundation
  • International Union Against Tuberculosis and Lung Disease
  • Jaringan Kesejahteraan/Kesehatan Masyarakat
  • KHANA
  • KNCV Tuberculosis Foundation
  • Lembaga Kesehatan Nahdlatul Ulama (LKNU)
  • NawaLife Trust – Namibian Centre for Communication Programmes
  • Operation ASHA
  • Penabulu Alliance
  • Philippine Business for Social Progress
  • Regional Centre for Quality of Healthcare
  • Reproductive Health Association of Cambodia
  • Roman Catholic Diocese of Timika
  • Social Marketing Company
  • Trust for Democratic Education and Accountability
  • American Association for the Advancement of Science
  • Adventist Development and Relief Agency
  • American Council on Education
  • Catholic Relief Services
  • Center for Human Services
  • ChildFund International USA
  • Concern Worldwide US
  • Episcopal Relief & Development
  • FHI Development 360
  • IntraHealth International
  • Jhpiego
  • JSI Research & Training Institute
  • Lutheran World Relief
  • Management Sciences for Health
  • Medical Care Development
  • Mennonite Economic Development Associates
  • PATH
  • Pathfinder International
  • Plan International USA
  • Population Services International
  • Public Health Institute
  • RTI International
  • Save the Children
  • U.S. Pharmacopeial Convention
  • World Learning
  • World Vision
  • Community Health and Development Action
  • Equip Liberia
  • Health, Development and Anti-Malaria Association
  • Innovative Vector Control Consortium
  • Institut Pasteur
  • Kenan Institute Asia
  • Malaria Consortium
  • Medicines for Malaria Venture
  • Mentor Initiative, The
  • Society for Family Health Nigeria
  • Society for Family Health Rwanda
Pandemic Influenza and Other Emerging Threats (PIOET)Other Public Health Threats, Including Neglected Tropical Diseases (NTDs)
U.S.-Based NGOsForeign NGOsU.S.-Based NGOsForeign NGOs
  • American Association for the Advancement of Science
  • Adventist Development and Relief Agency
  • Citizens Network for Foreign Affairs
  • FHI Development 360
  • International Medical Corps
  • Management Sciences for Health
  • Mercy Corps
  • Public Health Institute
  • U.S. Pharmacopeial Convention
  • Indonesian International Education Foundation
  • Kenan Institute Asia
  • Armenian American Cultural Association
  • Armenian EyeCare Project
  • Carter Center, The
  • Center for Human Services
  • ChildFund International USA
  • FHI Development 360
  • Innovations for Poverty Action
  • International Virtual e-Hospital Foundation
  • IntraHealth International
  • JSI Research & Training Institute
  • Management Sciences for Health
  • Project C.U.R.E.
  • RTI International
  • Vishnevskaya-Rostropovich Foundation
Water Supply and SanitationNutrition
U.S.-Based NGOsForeign NGOsU.S.-Based NGOsForeign NGOs
  • A Glimmer of Hope Foundation
  • ACDI/VOCA
  • Adventist Development and Relief Agency
  • American Council on Education
  • American Near East Refugee Aid
  • American Refugee Committee
  • Amref Health Africa in the USA
  • Catholic Relief Services
  • Citizens Network for Foreign Affairs
  • FHI Development 360
  • Global Communities
  • Global Environment and Technology Foundation
  • Green Empowerment
  • Hispanic Association of Colleges and Universities
  • Innovations for Poverty Action
  • International City/County Management Association
  • International Relief and Development
  • International Rescue Committee
  • Jhpiego
  • JSI Research & Training Institute
  • Lifewater International
  • Management Sciences for Health
  • Mercy Corps
  • Mercy-USA for Aid and Development
  • Millennium Water Alliance
  • mWater
  • National Cooperative Business Association CLUSA International
  • Pacific Institute for Studies in Development, Environment and Security
  • PACT
  • Palms for Life Fund
  • Pathfinder International
  • PCI-Media Impact
  • Plan International USA
  • Population Services International
  • Relief International
  • RTI International
  • Save the Children
  • Winrock International
  • World Concern
  • World Vision
  • ACTED
  • ADECA
  • ADPP Angola
  • African Water Association
  • Areopagus
  • Association Centrafricaine pour le Bien-Etre Familial
  • Association for the Development and Protection of the Environment Aghbalou
  • Caritas Senegal
  • CCAP Nkhoma Synod Relief and Development
  • Congress of Local Authorities from Moldova
  • Cooperative Agricola de Cangombe
  • DAPP Zambia
  • Development Workshop
  • Environment and Public Health Organization
  • Federation of Indian Chambers of Commerce and Industry
  • FIELD Indonesia
  • Fundacion REDDOM
  • Groupe d’Action pour le Developpement Communautaire
  • Hararghe Catholic Secretariat
  • Hospice Palliative Care Association of South Africa
  • Humana People to People – Congo
  • Indonesian International Education Foundation
  • Institute of Natural Resources
  • International Center for Biosaline Agriculture
  • International Water Management Institute
  • Kigezi Diocese Water and Sanitation Programme
  • Laikipia Wildlife Forum
  • Oromo Self-Help Organization
  • PALM Foundation
  • Population Foundation of India
  • SEBAC Nepal
  • St. Lucy Filippini Home Economic School
  • Water & Sanitation for the Urban Poor
  • Wildlife and Environment Society of South Africa
  • Women Farmers Advancement Network
  • Yayasan Cipta Cara Padu
  • American Association for the Advancement of Science
  • ACDI/VOCA
  • Africare
  • Amref Health Africa in the USA
  • CARE
  • Catholic Relief Services
  • Center for Human Services
  • ChildFund International USA
  • Citizens Network for Foreign Affairs
  • Concern Worldwide US
  • Curamericas Global
  • FHI Development 360
  • Future Generations
  • Global Communities
  • Health Through Walls
  • Helen Keller International
  • International Relief and Development
  • IntraHealth International
  • Jhpiego
  • JSI Research & Training Institute
  • Management Sciences for Health
  • Mercy Corps
  • National Collegiate Inventors and Innovators Alliance
  • National Cooperative Business Association CLUSA International
  • Partners of the Americas
  • Partnership for Supply Chain Management
  • PATH
  • Pathfinder International
  • Plan International USA
  • Public Health Institute
  • RTI International
  • Save the Children
  • Winrock International
  • World Relief
  • World Vision
  • ADEMAS
  • Asociacion Los Andes Cajamarca (ALAC)
  • Association de Soutien au Developpement des Activites de Population (ASDAP)
  • Caritas Rwanda
  • Global Alliance for Improved Nutrition, The (GAIN)
  • Nepal CRS Company
  • Regional Centre for Quality of Health Care
  • Relief Society of Tigray
  • Reproductive Health Association of Cambodia
  • Society for Family Health Nigeria
  • Society for Family Health Rwanda
NOTES: Reflects NGOs that received funding disbursed by USAID for USG global health efforts by program area.
  1. Kaiser Family Foundation (KFF), NGO Engagement in U.S. Global Health Efforts: U.S.-Based NGOs Receiving USG Support Through USAID, Dec. 2014, https://modern.kff.org/global-health-policy/report/ngo-engagement-in-u-s-global-health-efforts-u-s-based-ngos-receiving-usg-support-through-usaid/. ↩︎
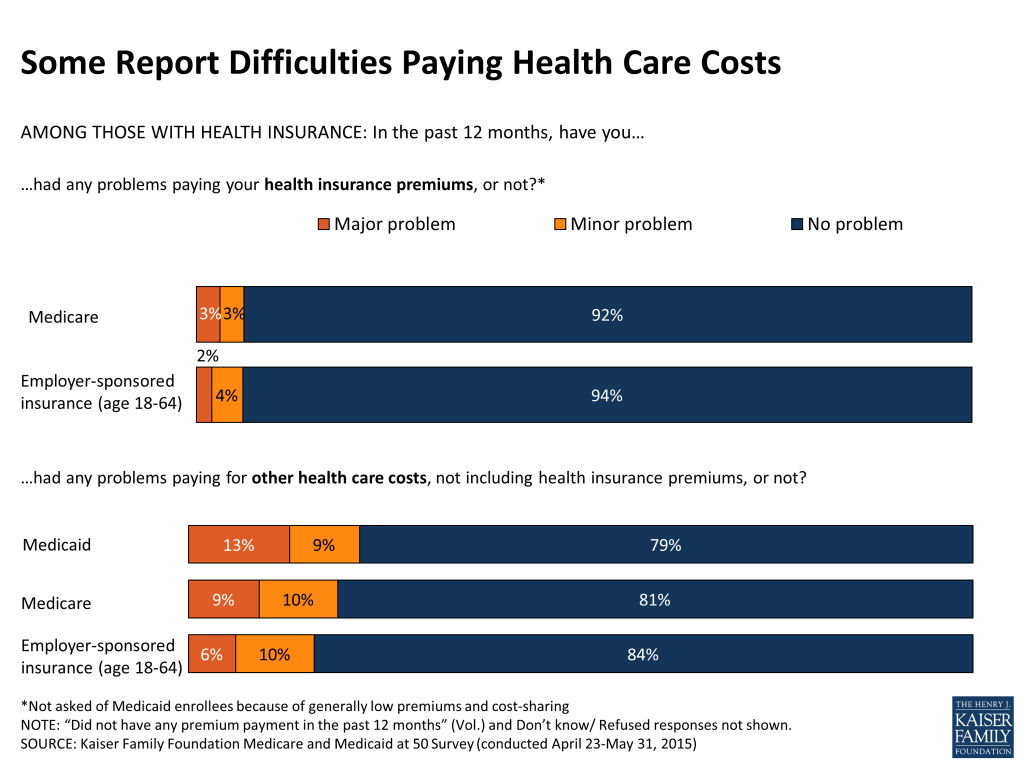
  2. KFF, Foreign NGO Engagement in U.S. Global Health Efforts: Foreign NGOs Receiving USG Support Through USAID, May 2015, https://modern.kff.org/global-health-policy/report/foreign-ngo-engagement-in-u-s-global-health-efforts-foreign-ngos-receiving-usg-support-through-usaid/. ↩︎
  3. KFF, NGO Engagement in U.S. Global Health Efforts: U.S.-Based NGOs Receiving USG Support Through USAID, Dec. 2014, https://modern.kff.org/global-health-policy/report/ngo-engagement-in-u-s-global-health-efforts-u-s-based-ngos-receiving-usg-support-through-usaid/. ↩︎
  4. KFF analysis of USAID FY 2014 transaction data, downloaded 4-1-15 from the U.S. Foreign Assistance Dashboard, www.ForeignAssistance.gov. ↩︎
  5. Specifically, 203 NGOs received country-specific funding in a single country, among 257 NGOs who received funding for global health activities in a specific country(s). These NGOs, and others, may have received non-country-specific funding as well or instead (e.g. regional funding and “worldwide” funding). KFF analysis of USAID FY 2014 transaction data, downloaded 4-1-15 from the U.S. Foreign Assistance Dashboard, www.ForeignAssistance.gov. ↩︎
  6. Of the 79 countries, 17 countries had 1 NGO that received funding, 33 countries had 2-9 NGOs, and 29 countries had 10 or more NGOs. Additional NGOs may have operated in these countries with USG regional and “worldwide” support. KFF analysis of USAID FY 2014 transaction data, downloaded 4-1-15 from the U.S. Foreign Assistance Dashboard, www.ForeignAssistance.gov. ↩︎
  7. USAID, Local Systems: A Framework for Supporting Sustained Development, April 2014, http://www.usaid.gov/policy/local-systems-framework; USAID, USAID Policy Framework 2011- 2015, 2011, http://www.usaid.gov/documents/1870/usaid-policy-framework-2011-2015; U.S. Government, U.S. Government Interagency Paper on Country Ownership, July 2012, http://www.ghi.gov/principles/docs/ownershipInteragencyPaper.pdf. ↩︎
  8. USAID, Local Capacity Development: Suggested Approaches – An Additional Help Document for ADS 201, July 22, 2013, http://www.usaid.gov/sites/default/files/documents/1870/201saf.pdf. ↩︎
  9. KFF analysis of USAID FY 2014 transaction data, downloaded 4-1-15 from the U.S. Foreign Assistance Dashboard, www.ForeignAssistance.gov. ↩︎
  10. KFF analysis of USAID FY 2014 transaction data, downloaded 4-1-15 from the U.S. Foreign Assistance Dashboard, www.ForeignAssistance.gov. ↩︎
  11. KFF analysis of USAID FY 2014 transaction data, downloaded 4-1-15 from the U.S. Foreign Assistance Dashboard, www.ForeignAssistance.gov. ↩︎

To Switch or Be Switched: Examining Changes in Drug Plan Enrollment among Medicare Part D Low-Income Subsidy Enrollees

Authors: Jack Hoadley, Laura Summer, Elizabeth Hargrave, Samuel Stromberg, Juliette Cubanski, and Tricia Neuman
Published: Jul 17, 2015

Introduction

Study Highlights

During the Medicare Part D annual enrollment period from October 15 to December 7, people on Medicare can review and compare stand-alone prescription drug plans (PDPs) and Medicare Advantage plans and switch plans if they choose.  Low-income beneficiaries who receive premium and cost-sharing assistance through the Part D Low-Income Subsidy (LIS) program have a subset of premium-free PDPs (benchmark plans) available to them, but can also choose to enroll in a non-benchmark plan and pay a premium. Each year, the list of premium-free PDPs changes. When PDPs lose their premium-free status, the Centers for Medicare & Medicaid Services (CMS) automatically reassigns many of their LIS enrollees to another premium-free PDP; however, CMS does not reassign LIS enrollees who have chosen a plan other than their assigned PDP.  LIS Part D plan enrollees, unlike non-LIS enrollees, are also permitted to switch plans at any time outside the annual enrollment period.

This analysis examines plan changes among LIS enrollees in PDPs between 2006 and 2010.1  About 58 percent of LIS PDP enrollees in 2010 were eligible for reassignment by CMS. The question of how many LIS enrollees change plans during the annual enrollment period when their plan loses benchmark status has both coverage and cost implications. Reassignment helps LIS enrollees maintain their premium-free PDP enrollment but also has the potential to disrupt coverage. At the same time, LIS enrollees who are not reassigned could pay higher premiums unless they choose another premium-free plan.

Key findings from this analysis are:

  • Overall, LIS enrollees changed PDPs at a higher rate than non-LIS enrollees for the 2010 plan year (19 percent versus 11 percent), but the higher rate among LIS enrollees was primarily a result of reassignment to new plans by CMS.
    • The 19 percent of LIS enrollees who changed plans for 2010 includes 15 percent who were reassigned by CMS and 4 percent who voluntarily switched to a new PDP—a significantly lower voluntary switching rate than the 11 percent rate among non-LIS enrollees.
    • The pattern of plan changes for LIS enrollees—both voluntary switching and reassignments—varied considerably from year to year, primarily due to turnover in premium-free plan availability. A larger share of LIS enrollees were reassigned to new PDPs in 2008 and 2009 than in 2010.
  • Among those LIS enrollees who were not eligible for reassignment by CMS and whose plans lost benchmark status for 2010, a relatively small share (14 percent) voluntarily switched during the annual enrollment period for 2010, despite being notified by CMS that they would face premiums if they did not switch plans.
  • Most LIS enrollees who were reassigned by CMS accepted that assignment, but 10 percent of them either elected to stay in their current plan or chose a different plan than the one assigned by CMS.Nearly three-fourths of LIS beneficiaries who were continuously enrolled in stand-alone PDPs changed plans (either voluntarily switched or were reassigned) at least once over the five years from 2006 to 2010. By contrast, only one-third of non-LIS enrollees switched plans once or more over the same period. A larger share of LIS enrollees eligible for reassignment changed plans 2 or more times compared to those not eligible for reassignment (41 percent versus 18 percent).
  • Among the relatively small share (14 percent) of LIS PDP enrollees who voluntarily switched out of a non-benchmark plan, most (90 percent) switched to a premium-free plan. Over time, LIS enrollees who are ineligible for reassignment and who have remained in non-benchmark plans have faced increasingly higher premiums.

The CMS policy for determining which LIS enrollees will be automatically reassigned attempts to balance the desire to ensure that LIS beneficiaries are not required to pay premiums and the desire to respect voluntary enrollment decisions made by some LIS beneficiaries. This policy has shielded many low-income beneficiaries from incurring premium costs for Part D coverage, but as our analysis shows, it has the potential to reduce the financial protection available through the LIS program for the share of LIS enrollees who have chosen their own plans.

Introduction and Background

The Medicare Part D Low-Income Subsidy (LIS) program helps reduce overall out-of-pocket costs for beneficiaries with low incomes, generally those with incomes of less than 150 percent of the federal poverty level and limited resources. LIS beneficiaries are entitled to premium-free coverage and significantly reduced cost sharing.2  In 2015, beneficiaries qualify for these subsidies if they are enrolled for Medicaid through Medicare Savings Programs or if they have incomes less than $17,655 and assets less than $13,640 (these amounts are $23,895 and $27,250, respectively, for couples). In 2015, 11.7 million Part D enrollees (30 percent of all Part D enrollees) were receiving the LIS; of this total 8.0 million (68 percent) were enrolled in stand-alone prescription drug plans (PDPs) and 3.7 million (32 percent) in Medicare Advantage drug plans (MA-PDs).3 

During the Medicare Part D annual enrollment period, which runs from October 15 to December 7, all Medicare beneficiaries are encouraged to review and compare their options for the coming year and choose a plan that best meets their needs.4  Part D enrollees who receive the LIS are also permitted to switch plans at any time outside the annual enrollment period, while non-LIS enrollees may only switch plans outside the annual enrollment period in special circumstances.5 

LIS enrollees may choose to enroll in any plan in their area, but the subsidy makes premium-free coverage available only from a designated set of PDPs with a premium amount below a specific benchmark.6  The benchmark amount in each area—and thus the subset of plans that are premium free for LIS enrollees—changes annually (see Appendix 2: Benchmark Plans).7  In the annual enrollment period for the 2008 plan year, for example, nearly one-third of all LIS beneficiaries were enrolled in premium-free PDPs in 2007 that would not be premium-free in 2008 or were exiting the Part D market entirely.8  If LIS enrollees remain in plans that lose benchmark status, they are exposed to higher costs unless they change to another zero-premium (benchmark) drug plan.

To help ensure that LIS enrollees avoid added premium costs as the availability of benchmark plans changes, CMS conducts a reassignment process each year (Figure 1). LIS enrollees whose current plan would charge them a premium for the coming year are eligible for reassignment only if they were assigned to that plan by CMS. CMS randomly reassigns these beneficiaries to one of the benchmark plans in their region.

Figure 1: Medicare Part D LIS and Non-LIS enrollment categories and eligibility for CMS reassignment process

In contrast to LIS beneficiaries who are assigned by CMS, some LIS beneficiaries whose plans are losing benchmark status are in that plan because they actively chose it, either on their own or with the help of a counselor or a state program. These beneficiaries—referred to by CMS as “choosers”—are not eligible for reassignment as long as their current plan does not exit the market completely. CMS sends a notice to beneficiaries in this group if their current plan is scheduled to have a premium for LIS beneficiaries in the next year. The notice informs them of the premium-free options available to them and the steps required to switch to one of those plans.9 

This analysis examines plan changes among LIS enrollees in stand-alone PDPs between 2006 and 2010. The question of how many LIS enrollees change plans during the annual enrollment period has both coverage and cost implications. Reassignment by CMS helps LIS enrollees maintain their premium-free PDP enrollment, but also has the potential to disrupt coverage. At the same time, LIS enrollees who are not reassigned could pay higher premiums unless they choose another premium-free plan.

Data and Methods

This analysis is based on data from a 5-percent random sample of Medicare beneficiaries, obtained from CMS, for each year from 2006 to 2010 (see Appendix 1: Study Methodology for more information on the datasets used and definitions of variables). The dataset includes information on the characteristics of beneficiaries and Part D plan information. We obtained an additional customized dataset from CMS that indicates whether or not LIS beneficiaries are eligible for reassignment by CMS in each month. Our analysis focuses on LIS beneficiaries who are enrolled in a PDP,10  who are eligible for a full premium subsidy,11  and who are not in an employer plan. We matched LIS PDP beneficiaries across years to build four samples of beneficiaries who met these criteria throughout each of four two-year periods (2006-07, 2007-08, 2008-09, and 2009-10) and one sample of LIS beneficiaries who were enrolled in PDPs throughout the entire five-year (2006-10) period. Between 6.5 million and 6.9 million LIS PDP enrollees are represented by samples of beneficiaries meeting the qualifications for the two-year periods—compared to a total of about 8 million LIS PDP enrollees. About 4.8 million continuously enrolled LIS PDP beneficiaries are represented by the five-year sample. We compare some of the results from this analysis of LIS enrollees with results for non-LIS enrollees published in our earlier report.12 

We define a change of plans during the annual open enrollment period based on enrollment in a different plan in January of the second year, compared to December of the first year. We distinguish between plan changes that reflect voluntary plan switches by LIS enrollees and changes due to reassignment by CMS. We define plan changes at other points during the year based on enrollment in a different plan in a given month compared to the previous month. In general, we do not count plan changes under two circumstances: (1) an enrollee whose plan changes during the annual enrollment period, but for whom the old plan and the new plan are matched (“crosswalked”) by the plan sponsor, and the enrollee is automatically transferred from the old plan to the new plan; and (2) an enrollee whose plan exits the program without any matched plan and who therefore has to select a new plan to remain in Part D.

Key Findings

Key Findings

Of the LIS beneficiaries enrolled in PDPs at the end of 2009, a majority (58 percent) were eligible for reassignment to new PDPs by CMS in the event that their plan lost its premium-free (benchmark) status, while four in ten (42 percent) were not eligible for reassignment because they had voluntarily chosen to enroll in their current plan.

In December 2009, an estimated 3.9 million LIS beneficiaries in PDPs (out of about 6.7 million who met our analysis criteria) were eligible for reassignment to new PDPs by CMS if their plans no longer qualified as premium-free plans for 2010. The remaining 2.8 million LIS PDP beneficiaries were ineligible for CMS reassignment and were responsible for considering their own options for switching to new plans.

More than half (54 percent) of LIS enrollees ineligible for reassignment (“choosers”) were in PDPs losing benchmark status for 2010, compared to only 28 percent of LIS enrollees eligible for reassignment (Figure 2).13  In other words, most (72 percent) LIS enrollees eligible for reassignment were in PDPs maintaining their premium-free benchmark status for 2010, compared to less than half (45 percent) of LIS enrollees not eligible for reassignment. The implication of this is that a greater share of LIS enrollees not eligible for reassignment would have to take action if they wanted to receive premium-free Part D coverage.

Figure 2: Distribution of LIS enrollees by eligibility for CMS reassignment process and benchmark plan changes

The share of LIS beneficiaries eligible for reassignment was somewhat higher (70 percent) at the end of the program’s first year, but was fairly constant from December 2007 through the end of 2010 (Table 1). The share in this category appears to have stabilized as the numbers newly selecting a plan on their own are offset by the entry of new Part D enrollees being assigned to a plan for the first time.14 

Table 1: Distribution of Part D LIS PDP Enrollees, by Eligibility for Reassignment, 2006-2010
December 2006December 2007December 2008December 2009December 2010
Percent eligible for reassignment70%54%58%58%56%
Percent ineligible for reassignment30%46%42%42%43%
Number eligible for reassignment4.8 million3.5 million3.9 million3.9 million3.8 million
Number ineligible for reassignment2.1 million3.0 million2.8 million2.8 million2.9 million
TOTAL6.9 million6.5 million6.6 million6.7 million6.7 million
NOTE: LIS is low income subsidy. Estimates may not sum to totals due to rounding. Numerical counts are projected from the 5 percent sample and are smaller than the total number of LIS PDP beneficiaries because of sample exclusions and a small number of beneficiaries whose reassignment status could not be classified. The share of those eligible for reassignment may be somewhat understated, especially in 2007 and 2008, because of the incorrect assignment of enrollment status in the preliminary CMS dataset used in this study. See Appendix 1: Study Methodology.SOURCE: Georgetown/NORC/Kaiser Family Foundation analysis of Medicare Beneficiary Summary Files and Plan Characteristics Files, 2006-2010.

Overall, LIS beneficiaries in PDPs changed drug plans at a higher rate than non-LIS enrollees in 2010 (19 percent versus 11 percent), but this was primarily a result of assignment to a new plan by CMS rather than voluntary switching.

The 19 percent of LIS beneficiaries in PDPs who changed plans for 2010 includes 15 percent of LIS enrollees who were reassigned by CMS to new plans and 4 percent who switched plans voluntarily (Figure 3). Excluding plan changes resulting from the reassignment process, a much smaller share of LIS enrollees than non-LIS enrollees in PDPs switched plans on a voluntary basis (4 percent versus 11 percent). Factoring in plan changes resulting from the CMS reassignment process, however, results in a higher overall rate of plan changes among LIS enrollees in 2010.

Figure 3: A greater share of Medicare PDP LIS enrollees changed plans than non-LIS enrollees, mainly due to reassignment

The pattern of voluntary switching and plan reassignments for LIS beneficiaries has varied considerably from year to year—especially the rate of being reassigned to new plans by CMS—due primarily to the changing availability of benchmark plans (Figure 4). Loss of premium-free (benchmark) plan status, resulting from the changing availability of benchmark plans, is the criterion used by CMS to reassign eligible LIS beneficiaries to new plans and is also likely a key factor in voluntary switching decisions by those LIS enrollees who are not eligible for reassignment because they have chosen their current plans. In our study period, 2008 had the highest rate of turnover in benchmark plan availability, and this year also had the highest combined rate of reassignment and voluntary switching among LIS beneficiaries.15  In 2008, one in three LIS beneficiaries (32 percent) were reassigned or switched to a new plan, compared to one in five in 2006 (20 percent) and 2010 (19 percent). 2008 also saw the greatest change in the availability of benchmark plans, affecting 29 percent of all LIS beneficiaries. By contrast, changing plan availability affected only 12 percent of LIS beneficiaries in 2007 and 18 percent in 2010 (see Appendix 1: Benchmark Plans for more information on benchmark plan availability).

Figure 4: The share of LIS enrollees changing PDPs in any given year was related to the share losing their premium-free (benchmark) PDP

The share of LIS enrollees changing plans is higher among LIS beneficiaries who are eligible for reassignment to premium-free plans than among those who are not eligible for reassignment, who must make a voluntary decision to change plans (Figure 5). In 2010, three times as many LIS enrollees eligible for reassignment experienced a change of plans than LIS enrollees not eligible for reassignment; among the former group, 25 percent were reassigned to a new plan by CMS and 1 percent voluntarily chose a new plan, while among the latter group 9 percent voluntarily switched to a new PDP. Rates of changing plans were higher for both groups of LIS enrollees in 2008 and 2009, compared to 2010.16 

Figure 5: The share of LIS enrollees changing PDPs in any given year was driven by whether they were eligible for reassignment by CMS

Among the subgroup of LIS beneficiaries who were not eligible for reassignment and whose plans were losing benchmark status for 2010 (about one-fourth of all LIS enrollees in PDPs), few (14 percent) switched voluntarily during the annual enrollment period for 2010, despite receiving notices from CMS reminding them that they would face premiums if they did not switch plans. Most who were eligible for reassignment by CMS accepted that assignment.

Only 14 percent of those LIS beneficiaries who faced a premium payment for the next year and who were not eligible for reassignment by CMS voluntarily switched PDPs for 2010 (Figures 6 and 7). The remaining 86 percent of this group stayed in their current plan and paid a monthly premium, despite being eligible for premium-free coverage through benchmark plans.17  A higher share (22 percent) of LIS enrollees not eligible for reassignment voluntarily switched plans in 2009, consistent with greater turnover in benchmark plan availability that year.18 

Figure 6: The share of LIS enrollees changing plans for the 2010 plan year was driven by eligibility for reassignment and benchmark plan status
Figure 7: Among LIS enrollees who were not eligible for reassignment and whose PDPs were losing benchmark status, most did not voluntarily switch plans

All beneficiaries not eligible for reassignment in 2009 or 2010 received a notice from CMS (referred to as a “chooser notice”) at the start of the annual enrollment period. The notice informed them that they were subject to paying a monthly premium for Part D coverage in the coming year if they remained in their current plan and stated the amount instructions on how to make a switch and listed all the available premium-free plans in their region. Despite this information, most beneficiaries in this situation maintained enrollment in their current plans and thus paid a premium.

Among the subgroup of LIS beneficiaries who were eligible for reassignment by CMS and who were not slated to be in a benchmark plan in 2010 (about 1 in 6 LIS enrollees in PDPs), the vast majority (90 percent) accepted their reassignment by CMS to a new plan (Figures 6 and 8). These LIS enrollees received a notice from CMS at the start of the annual enrollment period informing them that they would be reassigned to a new PDP chosen randomly among eligible benchmark plans and of their right to pick a different plan to ensure the best coverage of the drugs they take. Accepting the reassigned plan means changing from one plan to another; doing so ensures that these LIS enrollees will maintain their premium-free PDP coverage but typically means a change in formulary. The Affordable Care Act added a requirement that CMS send a second letter in December identifying which of the individual’s drugs are covered under the plan to which the beneficiary has been assigned, with another reminder that they can still elect a different plan.

Figure 8: Among LIS enrollees who were eligible for reassignment and whose PDPs were losing benchmark status, most accepted the reassignment

About 10 percent of LIS enrollees who received a reassignment notice exercised their right to make a voluntary enrollment decision for 2010 rather than accept the reassignment by CMS to a new plan: 3 percent selected a new plan other than the one to which they were assigned by CMS and 7 percent chose proactively to stay in their current plan even though it was losing benchmark status and would require paying a premium.19  As a result of their voluntary enrollment decisions, these LIS enrollees lost their eligibility for reassignment to new plans in future years.

Nearly three-fourths of LIS beneficiaries who were continuously enrolled in stand-alone PDPs changed plans (either voluntarily switched or were reassigned by CMS) at least once over the five years from 2006 to 2010. By contrast, only one-third of non-LIS enrollees voluntarily switched plans one or more times over the same period.

The 72 percent of LIS enrollees who changed PDPs at least once over the five-year period consists of 38 percent who experienced one plan change and 34 percent who had two or more plan changes (Figure 9).20  By contrast, far fewer (32 percent) non-LIS PDP enrollees made one or more voluntary plan switches between 2006 and 2010 (21 percent switched plans once and 11 percent switched plans two or more times).

Figure 9: 7 out of 10 LIS enrollees experienced 1 or more plan changes between 2006 and 2010, compared to 3 out of 10 non-LIS enrollees

Among LIS enrollees, a larger share of those who were eligible for reassignment experienced two or more plan changes between 2006 and 2010, compared to LIS enrollees who were not eligible for reassignment (41 percent versus 11 percent). This higher rate is because those LIS enrollees who are eligible for reassignment will be automatically assigned to a new plan whenever their current plan loses benchmark status. Yet, despite the year-to-year turnover in benchmark plan availability, the share of LIS beneficiaries who experienced frequent plan changes is relatively small—only 3 percent changed plans four or more times (that is, at least once a year between 2006 and 2010).

LIS beneficiaries who are not eligible for reassignment were also more likely than non-LIS beneficiaries to change plans at least once over a five-year period between 2006 and 2010 (53 percent versus 32 percent). One possible explanation for this higher rate is that these LIS enrollees received a notice from CMS during the annual enrollment period informing them that their premium would increase if they stayed in their current plan. The notice also informed them about their eligibility for other plans that were premium free. Non-LIS enrollees do not receive similar targeted information from CMS. Some may also have benefitted from state-based programs that helped them chose a new plan. And some may have taken advantage of their right to switch plans outside of the annual enrollment period.

As was the case in any given year in our study period, reassignment by CMS was the main cause for plan changes among LIS enrollees continuously enrolled over a multiple-year period (Figure 10). The 63 percent of LIS beneficiaries who were continuously enrolled in PDPs from 2008 to 2010 who also experienced a change in plans at least once across the three-year period consists of 41 percent who changed plans as a result of a reassignment by CMS and 22 percent who voluntarily switched to a new plan.21 

Figure 10: Among LIS enrollees in PDPs from 2008 to 2010, two-thirds of those who changed plans at least once were reassigned by CMS

In any given year between 2007 and 2010, only a small share of LIS enrollees (no more than 4 percent) took advantage of their right to switch plans outside of the annual enrollment period.

Between February and December 2010, only 3 percent of LIS PDP enrollees switched to a different plan (Figure 11). All LIS beneficiaries have the right to switch plans at any time during the year, an option not available to non-LIS beneficiaries.22  But the average switching rate for LIS PDP enrollees outside the annual enrollment period was 0.3 percent per month, adding up to 3 percent to 4 percent of beneficiaries per year with a mid-year switch. LIS enrollees who were assigned to their current plan by CMS were less likely to switch to a different plan outside the annual enrollment period than those LIS enrollees who voluntarily selected their current plan.23  LIS beneficiaries were about twice as likely to switch plans in February and March, compared to later in the year. These higher switching rates most likely represent situations where beneficiaries responded to changes to either their plan assignments or plan features (such as formulary changes) that became effective in January after the annual enrollment period had ended. Although the rationale for these switches cannot be determined from administrative data, it is possible that beneficiaries encountered difficulties obtaining medications on their initial visits to the pharmacy after the plan changes were effective. In this case, some beneficiaries may find it easier to switch plans than to apply for a formulary exception or request a prior authorization.

Figure 11: A small share of LIS PDP enrollees changed plans outside the annual enrollment period in any given year

Over the period from mid-2006 to 2010, about 14 percent of continuously enrolled LIS PDP enrollees changed plans at least once outside the annual enrollment period. Although only a small share of LIS beneficiaries exercise their right to switch plans outside of the annual enrollment period in any one year, one in seven made such a switch at least once in a five-year period.24  Most of these beneficiaries had only a single plan change outside open enrollment between August 2006 and December 2010.25  The maximum number of plan switches outside the annual enrollment period by any LIS beneficiary in the sample was 10 switches.

After CMS sent a “nudge notice” in August 2010, about 5 percent of notice recipients changed plans. In June 2010, CMS mailed a notice to all LIS beneficiaries who were paying a premium advising them that other plan options were available for no premium. In August and September 2010, an estimated 36,000 beneficiaries (less than 0.5 percent of LIS beneficiaries, but about 5 percent of those receiving the notice) responded to this notice by switching plans, a rate modestly higher than in similar months.26  CMS repeated use of a reminder notice in May 2011, but did not send them in more recent years.

Among the relatively small share of LIS enrollees ineligible for reassignment who were in plans losing benchmark status and who voluntarily switched plans, a majority lowered their premiums by switching plans. Those LIS enrollees who are ineligible for reassignment and are enrolled in non-benchmark plans have been paying higher premiums over time.

Among the LIS enrollees who were both not eligible for reassignment and enrolled in PDPs that would not be premium-free in 2010, 90 percent of those who voluntarily switched PDPs chose a premium-free plan (Figure 12). Only 5 percent selected a plan with a monthly premium of at least $5. By contrast, 72 percent of LIS enrollees who were both not eligible for reassignment by CMS and who stayed in a non-benchmark plan paid premiums of at least $5 per month in 2010, and one-third paid premiums of $10 or more as a result of staying in their same plan and not switching to a premium-free benchmark plan. Our previous study showed that the relatively few non-LIS enrollees who switched plans between 2006 and 2010 were more likely than those who did not switch to end up in a plan that lowered their costs.27  But the LIS enrollees who switched plans saved themselves money more often than their non-LIS counterparts. Many in both groups would have saved money on premiums by changing plans more often.28  By contrast, LIS beneficiaries who are eligible for reassignment are almost always switched into a new plan when it would lower their premium costs.29 

Figure 12: Among LIS enrollees ineligible for reassignment who were enrolled in PDPs that would not be premium-free and who switched plans, most changed to a premium-free plan

LIS enrollees who are not eligible for reassignment and who remain in non-benchmark plans have tended to pay increasingly higher premiums over time. The share of LIS beneficiaries in non-benchmark plans (eligible for but not receiving Part D coverage for no premium) paying at least $10 a month increased from 12 percent to 33 percent between 2008 and 2010, despite the fact that all of these LIS enrollees had at least one premium-free plan available to them in their area.

Discussion

All LIS Part D beneficiaries have the opportunity to switch plans voluntarily both during the annual enrollment period and at other times of the year. In addition, beneficiaries who were assigned to their current plans by CMS may be reassigned to a new plan if their plan no longer qualifies as premium-free. In any one year, most LIS beneficiaries do not change plans—but due to reassignments, plan changes are much more common among LIS beneficiaries than among non-LIS beneficiaries.

For those not eligible for reassignment by CMS, the switching rate for LIS enrollees is similar to that for non-LIS beneficiaries and for enrollees in other health insurance programs, such as the health benefits offered to federal employees or workers in private firms that offer a choice of plans.30  It varies from year to year, in line with turnover in benchmark plan availability.

The switching rate among LIS enrollees not eligible for reassignment by CMS is lower than the 29 percent switching rate for marketplace enrollees who used the national healthcare.gov system created under the Affordable Care Act.31  This is notable because marketplace enrollees who did not shop for new plans were automatically re-enrolled in the same plan, regardless of whether they would receive the maximum subsidy available to them. There was no process for automatic reassignment to new plans like that which is in place for some Part D enrollees.

The CMS policy for determining which LIS enrollees will be automatically reassigned attempts to balance the desire to ensure that LIS beneficiaries are not required to pay premiums and the desire to respect voluntary enrollment decisions made by some LIS beneficiaries. Reassignments by CMS have shielded many low-income beneficiaries from incurring premium costs for Part D coverage, but the policy has the consequence of reducing the financial protection available through the LIS program for the share of LIS enrollees who have chosen their own plans. As our analysis shows, these LIS enrollees are less likely to change plans and thus more likely to pay a premium than the other 3.9 million (58 percent) LIS enrollees who were eligible for reassignment to another plan by CMS for 2010.

Impact on Part D LIS Enrollees

There are two main consequences for Part D LIS enrollees who do not reexamine their plan choices on a regular basis: they may be missing an opportunity to avoid premiums, and they may be enrolled in a plan that does not offer optimal coverage for their drugs. Turnover in the availability of benchmark plans increases both the risk that an LIS enrollee not eligible for reassignment will pay a premium and the risk that an LIS enrollee who is reassigned to a new plan will end up in a plan that does not provide the optimal coverage for her drugs.

The data available for this study do not allow an analysis of why LIS beneficiaries shop for new plans, only whether they actually elect to change plans. Possible reasons for not shopping include a preference for the status quo even if it means modestly higher costs, a concern that shopping for a plan is confusing and difficult, and a lack of awareness that switching could result in lower costs.32  Those who do compare their plan options still may not switch plans because their current plan best meets their needs even if it has a premium (based on the match between plan formularies and current drug needs), because they find available resources are inadequate for assessing plan differences, or they prefer not to “rock the boat.”

LIS Enrollees Not Eligible for Reassignment

The CMS approach to reassignment reduces the number of LIS beneficiaries who pay premiums, but the rules about qualifying for reassignment exclude those who voluntarily chose their current plan. The latter includes not only LIS enrollees who made a choice on their own but also those who chose their current plan on the advice of a counselor, a state pharmacy assistance program, or some other helper—help that may have occurred years earlier. To the extent that such assistance may no longer be available to these enrollees, CMS could consider helping a larger share of those now regarded as ineligible for reassignment.

Many LIS beneficiaries who are not eligible for reassignment by CMS are in plans that are not premium-free for LIS enrollees, meaning they are missing an opportunity to save money. In 2014, LIS beneficiaries not in premium-free plans paid an average of $17.85 per month in premiums, and 13 percent of those paying a premium paid more than $25 per month.33  Some LIS beneficiaries, however, may be choosing to pay a premium to get more of their drugs on formulary or fewer formulary restrictions. Administrative data do not allow us to determine whether these enrollees are in fact examining their options and making a deliberate choice to pay premiums, but it seems likely that many are not shopping on a regular basis—similar, in fact, to behavior among non-LIS enrollees. The CMS “chooser notices” do not appear to be inducing many of those who are scheduled to pay a premium to switch plans. While beneficiaries who get notices about their upcoming premium increase are more likely than non-LIS beneficiaries to change plans, most of those getting these notices do not make a change of plans. CMS may want to evaluate whether there are better ways to encourage shopping or to nudge enrollees into changing plans when appropriate, although one CMS test of a nudge notice failed to generate much response.

Our analysis finds that most LIS beneficiaries who voluntarily switched plans selected a plan with no premium. Other factors may have influenced their decisions as well, including the drugs available on plan formularies, restrictions on filling prescriptions such as prior authorization, availability of pharmacies in plan networks,34  plan quality ratings, or the general reputation of plans. Since cost sharing for LIS beneficiaries is by statute the same for all plans, out-of-pocket drug costs do not vary based on tier placement or whether a pharmacy offers preferred cost sharing but only if drugs are excluded from plan formularies.

LIS Enrollees Eligible for Reassignment

The circumstances are quite different for LIS beneficiaries who are eligible for reassignment, who represent a majority of all LIS beneficiaries. Depending on the year, CMS has reassigned between 500,000 and 2 million LIS beneficiaries to new plans to maintain their enrollment in premium-free plans. Between 2006 and 2010, most of these LIS enrollees accepted their reassignment. Although it is possible for some LIS beneficiaries to be reassigned to new plans from year to year, there has been less overall churning than might have been expected based on the number of plans that have lost benchmark status every year. According to our analysis, although 41 percent of LIS enrollees were reassigned two times out of the four enrollment periods between 2006 and 2010, only 3 percent were reassigned for four years in a row.

CMS makes reassignments to new plans on a random basis among available benchmark plans, a process which does not incorporate available information on enrollees’ use of drugs and pharmacies. Although this analysis did not consider which plan best meets a beneficiary’s needs, other work suggests that a system of beneficiary-centered assignment, including options of making assignments to enhanced plans with low premiums, could lower costs for beneficiaries and even for the government.35 

Turnover in Benchmark Plan Availability

Our findings show that more beneficiaries change plans in years where there is greater turnover in the availability of benchmark plans. Although these changes usually lower overall costs for beneficiaries, there is also the potential for disruption resulting from different formularies, coverage restrictions, and administrative procedures. In recent years, CMS has adopted policies to reduce the annual turnover in benchmark plan availability. For example, the Affordable Care Act gave CMS the authority to allow LIS beneficiaries to remain in plans that miss benchmark status by a de minimis amount (usually $2 or less) without paying a premium—a policy that was tested on a demonstration basis in 2007 and 2008. In 2007, for example, one-fourth of all benchmark plans achieved that status through the de minimis policy. As a result, fewer reassignments were required. Other policies could increase the availability of benchmark plans, such as allowing LIS beneficiaries to enroll without a premium in enhanced plans that are below the benchmark.36 

Lessons for the ACA

Subsidy-eligible marketplace enrollees are in a situation that partially resembles LIS enrollees, in that the value of their subsidy is maximized by enrolling in one of the lower-cost silver plans (similar to benchmark plans in LIS). In 2015, 29 percent of renewing marketplace enrollees switched plans on the federally facilitated marketplace, a substantially larger voluntary switching rate than among Part D LIS enrollees in the years we studied.37  Results varied in some of the state-based marketplaces. In Covered California, where premiums were relatively stable, only 6 percent of renewing enrollees switched plans,38  whereas 62 percent changed plans in HealthSource Rhode Island, where automatic renewal was not an option for consumers.39 

Consumers who receive marketplace subsidies have higher incomes (always above 138 percent of the federal poverty line or FPL) than Part D LIS beneficiaries, nearly all of whom have incomes below 150 percent of FPL.40  However, the potential dollars at stake for consumers in the marketplaces tend to be much greater, since overall premiums for marketplace plans are much larger than premiums for stand-alone PDPs. Thus, the financial consequences of paying a premium could be greater for Part D LIS beneficiaries when considering premium payments as a share of income. Also, plan differences may matter more to marketplace enrollees. For example, plan networks may affect their relationships with all of their health care providers, not only pharmacies. And those who shop may find that marketplace plan networks are narrower overall than Part D pharmacy networks or Part D plan formularies, so that the risk of a poor match is greater.

The federally-facilitated marketplace and most state-based marketplaces implemented an automatic re-enrollment process for 2015 that allowed most people with coverage in 2014 to maintain that coverage in 2015, but the automatic renewal process did not necessarily obtain the coverage that maximized the value of the enrollees’ subsidy.41  In particular, the automatic renewal did not take into account the changes in premiums, and did not offer enrollees any equivalent of the Part D method for reassigning some beneficiaries to new plans. CMS issued a proposed rule that outlined some alternative approaches for the future, including the possibility of reassignments by the marketplaces. For reasons noted above, reassignment raises a more complex set of issues for plans that provide a full set of benefits than for plans that are limited to prescription drug coverage. Although CMS chose not to pursue this approach in its final rule, the agency indicated that it would welcome efforts by states to test such approaches. The experience of Part D LIS enrollees may offer insights into these options for the marketplaces, and the marketplace might offer some lessons for Part D.

The authors thank Christopher Powers at the Centers for Medicare & Medicaid Services for invaluable assistance with data acquisition.

Appendix

Appendix 1: Study Methodology

The analysis for this study is based on a 5-percent random sample of Medicare beneficiaries, obtained from the Centers for Medicare & Medicaid Services (CMS), for each year from 2006 to 2010. The sample dataset includes information on the characteristics of beneficiaries from the Master Beneficiary Summary File and Part D plan information from the Part D Plan Characteristics Files. Certain identifying information for both beneficiaries and drug plans, including the plan name, are encrypted. These standard CMS datasets were supplemented by a customized CMS dataset with supplemental data on the beneficiary enrollment decisions. The latter file was a preliminary version of a file being developed by CMS for use by researchers; the production version of the file has been recreated with the correct reassignment codes for 2007, but was not available in time for this study. The additional information in the customized dataset was essential to studying plan switching by LIS beneficiaries, some of whom are enrolled in new plans as a result of reassignments by CMS.

Defining LIS Status

Defining a sample of LIS beneficiaries has additional complexities because there are multiple versions of the Low-Income Subsidy and different ways to qualify. Medicare beneficiaries who qualify for full Medicaid benefits (dual eligibles), those enrolled in Medicare Savings Programs (e.g., Qualified Medicare Beneficiary (QMB), the Specified Low-Income Medicare Beneficiary (SLMB), Qualifying Individual (QI), or Qualified Disabled and Working Individuals (QDWI) programs), and those receiving Supplemental Security Income (SSI) are deemed eligible for the LIS and are not required to apply. Using data for December 2009, 87 percent of all LIS beneficiaries qualified in one of these ways (Table A1). Those with deemed coverage are all eligible for premium-free coverage provided they enroll in a benchmark plan. Some (11 percent of all LIS beneficiaries) are exempt from all cost sharing based on residence in a nursing facility or (starting in 2012) those receiving Medicaid home and community based services. Others with deemed coverage receive lower or higher copay levels, based on whether their incomes are below or above 100 percent of the federal poverty level (FPL). Other beneficiaries may apply for LIS status based on meeting income and asset requirements. About 10 percent of all LIS beneficiaries qualified via the application route for full LIS status, based on incomes up to 135 percent of the FPL. Applicants with incomes between 135 percent and 150 percent (who also meet asset requirements) qualify for partial LIS status (about 4 percent of all LIS beneficiaries), which provides different levels of premium support depending on incomes and limit cost sharing to 15 percent of a drug’s cost. For this study, we include only those partial LIS beneficiaries who qualify for full premium support. In total, the sample criteria include about 97 percent of all LIS beneficiaries.

Table A1: Part D Low Income Subsidy Program Enrollment Status, as of December 2009
CodeStatusPremiumCost SharingPercent of All LIS EnrolleesIncluded in Sample
01Deemed; institutional residence$0None10.7%Yes
02Deemed, <=100% FPL$0Low55.0%Yes
03Deemed, >100% FPL$0High20.9%Yes
04LIS, not deemed, <135% FPL$0High9.8%Yes
05Partial LIS, >135% FPL$015%0.9%Yes
06Partial LIS, >135% FPL25%15%1.0%No
07Partial LIS, >135% FPL50%15%0.9%No
08Partial LIS, >135% FPL75%15%0.7%No
NOTE: LIS is low income subsidy. FPL is federal poverty level.

We also require that beneficiaries maintain full LIS premium support over the time period for any particular sample. Most beneficiaries (96.3 percent) had no change in their LIS status (full LIS, partial LIS, or not LIS) over a two-year period from January 2009 to December 2010. Of those who made some change, 3.3 percent had only a single change in status, while 0.4 percent had two or more changes. To understand the nature of the exclusions, we determined that in the same two-year period (2009-2010), only 1.6 percent of those with LIS status in January 2009 lost that status at least once in the next 23 months. Thus, a larger share of those without continuous LIS status consisted of beneficiaries who gained LIS status after January 2009, whether through applying or gaining Medicaid eligibility. Elsewhere we have discussed the fact that LIS eligibility assessments and reassessments may affect participation rates, since eligibility from one year to the next is not always automatic. Of those who were LIS in December 2009, our data show that 1.9 percent lost LIS status as of January 2010 (most redeterminations are due on the first of the year). One-third (31 percent) of that group then regained their LIS status by the end of 2010. It is possible that these LIS beneficiaries, excluded because of changes in their LIS status, may change plans more often than those with continuous LIS status.

Defining Two-Year and Five-Year Samples of LIS Beneficiaries

From the one-year samples for the five years that constituted the overall dataset, we matched beneficiaries across years to build a series of samples of beneficiaries who were enrolled in the Part D program for each of four two-year periods (2006-07, 2007-08, 2008-09, and 2009-10) (Table A2). To be included in a two-year sample, beneficiaries (1) must have been alive and enrolled in a non-employer Part D plan42  continuously throughout the two-year period (or from July 2006 in the case of the 2006-07 file);43  (2) must have been eligible for full-premium LIS support (codes 01-05 in Table A1) in all months for which they were enrolled in a drug plan; and (3) must have been enrolled in a PDP during the entire time they were enrolled in Part D.

Table A2: Number of Part D Enrollees in Two-Year Samples, by Exclusion Criteria
 2006-072007-082008-092009-10
Total in 5% sample2,431,1582,475,1222,519,6342,565,873
Part D enrollment, December of Year 11,307,3911,380,8971,444,5341,500,204
Part D enrollment, January of Year 21,354,0751,424,6881,479,2021,521,299
Total LIS enrollees continuously enrolled in Part D and with full-premium LIS status (including both PDP and MA-PD enrollment)424,099408,442421,140432,989
LIS beneficiaries in PDPs and not employer plans = final two-year samples345,824324,986332,901335,057
Projected total enrollment for this sample6.9 million6.5 million6.7 million6.7 million

We also report in Table A2 the projected number of total LIS PDP enrollees who meet all the criteria for this analysis. These numbers are modestly lower than the actual numbers of LIS PDP enrollees due to the exclusions delineated above. Depending on the year, about 16 percent of LIS PDP enrollees are excluded from our analysis.

We built another sample of beneficiaries who were enrolled in the program for the entire 2006-2010 period (Table A3). To be included in the five-year sample, beneficiaries (1) must have been alive and enrolled in a non-employer Part D plan continuously from July 2006 through December 2010; (2) must have been eligible for full-premium LIS support during all these months; and (3) must have been enrolled in PDPs throughout all months of this time period. Of the sample that meets the first two criteria (continuous Part D enrollment with full-premium LIS support), 76 percent were in PDPs for five years (thus qualifying for the analysis sample), whereas 10 percent were in MA-PD plans for the entire five years, and 14 percent spent some time enrolled in each type of plan.

Table A3: Number of Part D Enrollees in the Five-Year Sample(July 2006-December 2010)
Description of SampleNumber
Total LIS enrollees continuously enrolled in Part D and with full-premium LIS status (includes both PDP and MA-PD enrollment)313,422
Total LIS enrollees continuously enrolled only in PDPs and not employer plans with full-premium LIS status = final five-year sample239,221
Projected total enrollment for this sample4.8 million

For comparisons, we use a sample of those who are non-LIS beneficiaries for the entire analysis period, the same sample as in our earlier report.44  For the five-year file, the N is 586,897 for the full sample and 313,418 for the PDP-only sample. For the most part, non-LIS results are drawn from our previous report on switching by non-LIS Part D enrollees.

Defining Part D Enrollment Status

The Master Beneficiary Summary File identifies the plan in which a beneficiary is enrolled in any given month, but does not distinguish when the enrollment results from a beneficiary election as opposed to an assignment or reassignment by CMS. The supplemental file we received from CMS was created to capture from internal transaction files, for each month, the beneficiary enrollment code for the most recent enrollment transaction. The key enrollment codes in this file whether a beneficiary’s plan for a given months was the result of a beneficiary election (the beneficiary made an active choice of the plan), assignment by CMS (usually applied to the first time an LIS beneficiary was assigned to a plan), or reassignment by CMS (usually applied when an LIS beneficiary who reassigned to a new plan).45 

Specifically, the enrollment status variable supplied by CMS defines, for each month during the analysis period, the “enrollment type” of the most recent change in enrollment (Table A4). The code is updated each time a new enrollment occurs. In January 2010, a “B” code means that a beneficiary selected a plan on her own either in the most enrollment period or the last time she changed plans. An “A” code means that the beneficiary remains in the same plan to which she was initially auto-enrolled by CMS. A “C” code captures facilitated enrollment, which have the same result as auto-enrollments. Facilitated enrollments are generally used for non-deemed LIS beneficiaries who are given the opportunity to enroll on their own before being assigned to a plan by CMS (deemed LIS beneficiaries are assigned to a plan, but retain the ability to switch to a plan on their own). These “A” and “C” codes are retained until the beneficiary is reassigned or selects a plan on her own, in which case her code would change to another code. An “H” code means that the beneficiary was reassigned by CMS to a different plan. Other codes identify less common situations, such as “E” or “F” codes (when the plan submits the auto-enrollment, generally in situations where one plan sponsor has multiple benchmark plans) or “D” codes (when a beneficiary is placed into a different plan as a result of a CMS-approved crosswalk, for example, when a sponsor consolidates existing plans). For most analytic purposes, the codes A, C, E, and F are combined as “A” for an initial CMS plan assignment. Where possible, beneficiaries with “D” codes (6 percent of the sample) are reassigned to the previous code, because a rollover election can occur to beneficiaries who elected their previous plan or were assigned to it. The few beneficiaries with “G” and “I” codes are combined as other and are generally excluded from tables that rely on enrollment status.

Table A4: Low Income Subsidy Enrollment Status Codes
CodeType of EnrollmentPercent of All LIS Enrolleesi
AAuto-enrolled by CMS (generally applies to dual eligibles)11.3%15.7%
CFacilitated enrollment by CMS (generally applies to other LIS)4.4%
EPlan-submitted auto-enrollment<0.1%
FPlan-submitted facilitated enrollment<0.1%
HRe-assigned by CMS25.4%25.4%
BBeneficiary election52.3%52.3%
DRollover election: plan change as a result of a crosswalk between plans offered by the same plan sponsor6.2%6.2%
IOther plan-submitted enrollment0.3%0.3%
GEnrollment by the point-of-service vendor that serves LIS beneficiaries who lack a plan<0.1%
 TOTAL100%100%
NOTE: iPercent of LIS enrollees as of December 2009.

Defining Plan SwitchesThere is one significant limitation in the preliminary supplemental file available for this study. A substantial number of the reassignments by CMS that were effective in January 2007 were incorrectly coded in the transaction files as beneficiary elections. Thus, a beneficiary who was reassigned to a new plan effective January 2007 was coded “B” instead of “H.” Because codes are retained until the next transaction, the legacy of these incorrect codes continues through the end of the study period (December 2010), although its effect gradually diminishes over time. In the sample, about two-thirds of those eligible for reassignment and in a new plan in January 2007 are coded as if they selected the new plan, whereas in 2008 the similar share was 5 percent. Where noted in this report, certain results (especially for January 2007 or January 2008) are affected by this incorrect coding. CMS has recreated this file with the correct codes, but the new version was not available for this analysis.

For the LIS Part D enrollees in each two-year sample or the five-year sample, we define a year-end plan switch based on enrollment in a different plan in January of the second year, compared to December of the first year (plan elections and reassignments made at any time during the annual enrollment period are effective on January 1). Plan switches are further coded as either a switch by beneficiary choice or a switch by CMS assignment based on the enrollment status code for January. In a small number of cases, the type of switch cannot be determined.

We do not count year-end plan switches that are involuntary under the following two circumstances: (1) a plan enrollee whose plan (as designated by the contract ID and plan ID combination) changes, but where the old plan and the new plan are matched (“crosswalked”), and who accepts the automatic transfer to the crosswalked plan;46  and (2) any plan enrollee whose plan exits the program without any crosswalked plan and who therefore must select a new plan to remain in Part D.47 

We also consider plan switches that occur outside the annual enrollment period, which include switches effective in any month other than January. For LIS beneficiaries, beneficiary elections may generally be made in any month. As with year-end switches, these switches are classified as either switches by beneficiary choice or switches by CMS assignment. The latter occur in several circumstances, such as when a beneficiary moves to a different region. Even beneficiaries who previously selected their own plans will be assigned to a plan by CMS if they do not select a plan in the new region. In addition, beneficiaries in a plan that exits the market in midyear are reassigned to a new plan if they do not select one. In 2010, one plan was excluded from the program, resulting in the reassignment of its enrollees. Tables in this report that show rates of plan switching outside the annual enrollment period exclude those reassigned to new plans, whereas tables showing total plan changes over five years include both types of switches outside the annual enrollment period.

Other Methods Considerations

Because the switching analysis presented here is based on individual decisions, the sample of beneficiaries for the analysis of each two-year file excludes newly eligible beneficiaries, beneficiaries who died during the relevant time period, and others who did not participate in Part D in both years. In addition, this analysis excludes from the estimate of switching rates various types of involuntary switches. As a result, the results reported here cannot be used to project the total net enrollment change from one year to the next. The net enrollment change is a product of how many people switch plans voluntarily, those who switch involuntarily as a result of plan exits, new enrollees to Part D, and those who have died or disenrolled from Part D.

The encryption of plan identifiers imposes some limitations on our study. Some plan sponsors operate under multiple contract numbers, often because they acquire the contract number from another plan sponsor through a corporate merger or acquisition. As a result, we cannot reliably distinguish between switches within plans offered by the same sponsor and those across plan sponsors. In addition, the use of encrypted plan identifiers makes it difficult to analyze plan characteristics that are not reported in the plan characteristics files.

In addition, the study is limited to the plan and beneficiary characteristics in the Medicare Beneficiary Summary File. We did not obtain for this study the prescription drug events (claims) for beneficiaries or claims from Medicare Parts A and B. Thus, we cannot calculate beneficiary risk scores or use measures of drug spending or other Medicare spending beyond the summary measures available in the Master Beneficiary Summary File.

Appendix 2: Benchmark Plans

LIS beneficiaries may choose to enroll in any plan, but premium-free coverage is only available from a designated set of “benchmark” plans that change annually.48  Each year, the benchmark is calculated separately for each of the 34 PDP regions based on the enrollment-weighted average premium bid submitted by stand-alone PDPs and MA-PDs or is set at the premium of the lowest-cost stand-alone PDP if no plan has a premium below the average. This average is a weighted average of premiums for PDPs and most MA-PD plans for the basic Part D benefit. Thus premiums corresponding to enhanced benefits are excluded, as are the value of any Part A/B rebate used by MA-PD plans. The weight for each PDP and MA-PD plans is based on the number of LIS beneficiaries enrolled in each plan.

In certain years, Part D sponsors have been permitted to waive a de minimis amount of the premium above the LIS benchmark for an LIS enrollee ($2 in 2007, $1 in 2008, and $2 in 2011 and thereafter) in order to retain enrollees in their premium-free status from the prior year. The de minimis policy was instituted by CMS on a demonstration basis for 2007 and 2008; it was made permanent by the Affordable Care Act, effective in 2011 (CMS has designated the amount as $2 each year). Plans may volunteer to waive the portion of their monthly premium that is a de minimis amount above the benchmark for eligible individuals, and thus CMS will not reassign enrollees away from these plans.

The availability of premium-free coverage for LIS Part D enrollees fluctuates from year to year, potentially exposing Part D LIS enrollees to higher costs unless they change to another zero-premium (“benchmark) drug plan.49  The total number of benchmark plans offered peaked at 640 in 2007 and dropped as low as 307 in 2010. Only 65 plans, however, retained benchmark status over the entire period from 2006 to 2010. Table A5 identifies on a national basis the number of benchmark plans available each year, as well as the how many of those plans lost benchmark status for the following year.

Table A5: Availability of Part D LIS Benchmark Plans and Changes over Time, 2006-2010
Annual enrollment period2006-072007-082008-092009-102010
Number of benchmark plans in Year 1409640*495**308307
Net change in benchmark plans, Year 1 to Year 2+231*-145**-187-1NA
Number of plans losing benchmark status, Year 1 to Year 29024021893NA
Percent of plans losing benchmark status, Year 1 to Year 222%38%44%30%NA
Number of enrollees in plans losing benchmark status, Year 1 to Year 21.6 mil3.7 mil2.5 mil1.5 milNA
Percent of enrollees in plans losing benchmark status, Year 1 to Year 220.0%46.1%31.8%18.4%NA
Percent of enrollees in plans losing benchmark status, Year 1 to Year 2 (adjusted for other plans from sponsor)11.7%28.9%25.6%18.4%NA
NOTE: NA = Not applicable for this study. mil is million.* Amount includes 157 plans qualifying in 2007 through the de minimis policy. Otherwise, there would have been 483 benchmark plans in 2007, up 74 from 2006.** Amount includes 53 plans qualifying in 2008 through the de minimis policy. Otherwise, there would have been 442 benchmark plans in 2007, down 198 from 2007.

The year-to-year variation has been substantial. Between 2007 and 2008, the number of benchmark plans rose by 50 percent, but at the same time, over one-third of the benchmark plans in 2007 lost that status for 2008. A similar number of plans lost their benchmark status between 2008 and 2009, but the total number of benchmark plans decreased. The high volatility in these two years probably represents several factors, including strategic decisions by some large plan sponsors around the structure of their plan offerings and the level of premiums charged by different plans. In later years, various rules and guidelines from CMS have reduced somewhat the volatility in the market for benchmark plans.

The volatility in the availability of benchmark plans has differed by plan sponsor and by region. For example, benchmark plan offerings by UnitedHealth, the program’s largest plan sponsor, dropped from 34 regions to 10 regions and rose back to 25 regions between 2007 and 2009. Humana, the second largest plan sponsor, had benchmark plans in all 34 regions in 2007, but had no benchmark plans in 2009 and only three in 2010.

All LIS enrollees in the plans losing benchmark status are subject to paying a premium the next year, but some of them are eligible for reassignment to a new benchmark plan during the annual enrollment period. Table A5 shows how many LIS beneficiaries are in plans losing benchmark status across the period studied for this report. The largest number of beneficiaries affected came in 2008, when nearly half of all LIS beneficiaries enrolled in PDPs were affected. One complicating factor has been the reorganization by many plan sponsors of their overall array of plan offerings (for some, partly in response to acquisitions of other plan sponsors). Thus, some benchmark plans were effectively replaced by other offerings of the same sponsor.50  The share of LIS beneficiaries affected in 2008 is reduced considerably (from 46 percent to 29 percent) if we exclude situations where another benchmark plan option is available from the same sponsor. However, these transfers between plans may not occur automatically.

Endnotes

  1. A similar analysis of switching for non-LIS Part D enrollees is found in our earlier report. Jack Hoadley et al., “To Switch or Not to Switch: Are Medicare Beneficiaries Switching Drug Plans to Save Money?” October 2013. https://modern.kff.org/report-section/to-switch-or-not-to-switch-issue-brief/. ↩︎
  2. Most beneficiaries are deemed automatically eligible for the LIS based on being enrolled in both Medicare and Medicaid (or receiving benefits from Supplemental Security Income as well as Medicare). See Appendix 1: Study Methodology for more information. ↩︎
  3. In 2010 (the end of the period covered in this study), a somewhat larger share of Part D enrollees qualified as LIS beneficiaries: 9.9 million beneficiaries or 36 percent of all Part D enrollees. The share of LIS beneficiaries in PDPs (81 percent) was somewhat higher in 2010 than in 2015. The decline in the share of LIS beneficiaries from 2010 to 2015 is partly a result of employers transferring their retirees into Part D plans, thus increasing the total number of Part D enrollees, as well as growing enrollment in LIS Medicare Advantage enrollment through the Financial and Administrative Alignment Demonstration for Dual Eligible Beneficiaries (308,000 as of April 2015). ↩︎
  4. In the program’s first five years (2006 to 2010), annual enrollment periods ran from November 15 to December 31. Starting in 2011 for enrollments effective in 2012, the dates were moved earlier in the year to ensure that coverage could be effective on January 1 of the next year. ↩︎
  5. Examples of such circumstances are if the enrollee moves outside the plan’s service area or if the plan changes its contract with Medicare in certain ways. ↩︎
  6. Each year, the amount of the benchmark is calculated separately in each of the 34 PDP regions based on the enrollment-weighted average premiums submitted by stand-alone PDPs and MA-PDs, or is set at the premium of the lowest-cost stand-alone PDP if no plan has a premium below the average of PDP and MA-PD premiums. ↩︎
  7. Although LIS beneficiaries must be enrolled in a benchmark plan to avoid paying a premium, they have lower cost sharing and no coverage gap even if enrolled in a non-benchmark plan. ↩︎
  8. Additional LIS beneficiaries were in plans losing their benchmark status in 2008, but were transferred to other plans offered by the same plan sponsor – resulting in less disruption than if reassigned to a plan offered by a different sponsor. ↩︎
  9. These so-called chooser notices were not sent for the annual enrollment period at the end of the program’s first year; the practice was initiated in the fall of 2007 for the 2008 plan year. In this first round of notices, only those who had no premium liability when they joined their plan, but were subject to a premium in 2008, received this notice. In later years, all LIS beneficiaries who were subject to a premium in the next year have received notices. ↩︎
  10. Beneficiaries enrolled in Medicare Advantage drug plans are excluded because the enrollment dynamics and factors affecting plan switches are different for these two segments of the program and because CMS does not reassign LIS beneficiaries to Medicare Advantage plans. ↩︎
  11. There are different types of LIS assistance available in Part D. Beneficiaries who qualify because they are full-benefit dual eligibles or are enrolled in the Medicare Savings Program and those who qualify with incomes below 135 percent of the federal poverty level (FPL) and assets below specified levels pay no premiums if enrolled in a benchmark plan. Other beneficiaries with incomes between 135 percent and 150 percent of FPL qualify for partial subsidies and are generally excluded from the analysis. See Appendix 1: Study Methodology for more information on these other groups. ↩︎
  12. These results are generally taken from our previous report. Jack Hoadley et al., “To Switch or Not to Switch: Are Medicare Beneficiaries Switching Drug Plans to Save Money?” October 2013. https://modern.kff.org/report-section/to-switch-or-not-to-switch-issue-brief/. In a few cases, we recalculated results from that report to match the particular definitions used in this report (noted in footnotes). ↩︎
  13. The share of those eligible for reassignment was calculated from the subset of full-subsidy LIS beneficiaries who were enrolled continuously in PDPs for any particular two-year period. ↩︎
  14. See Appendix 1: Study Methodology for an explanation of the coding inconsistencies in the data with regard to beneficiaries’ enrollment status. ↩︎
  15. For plan changes effective in January 2007, the CMS preliminary dataset made available for this project did not include information on whether the changes resulted from beneficiary elections or CMS reassignments (see Appendix 1: Study Methodology). ↩︎
  16. The rate of reassignments was also lower in 2007 (not shown in Figure 4). Most reassignments to new plans made by CMS effective in January 2007 were incorrectly coded as beneficiary elections in the preliminary file available for this analysis. Thus we cannot classify 2007 plan changes as reassigned or voluntary. In addition, some beneficiaries are incorrectly classified as not eligible for reassignment in December 2007 (and to a lesser degree in later years) because they look as if they voluntarily chose their 2007 plan. As a result, the rate of changing plans for 2008 is artificially high for the “not eligible for reassignment” group. In other words, nearly all the 13.2 percent shown as reassigned (as well as some who were not reassigned) likely belong in the “eligible for reassignment” group. As a result, the rate of changing plans may also be affected for the “eligible for reassignment” group. See Appendix 1: Study Methodology. ↩︎
  17. A small number of those not eligible for reassignment to a new plan (0.2 percent in 2010 and 1.9 percent in 2009) were in fact assigned to a new plan by CMS, in most cases because their plan had exited from the market and no comparable plan was available from the same plan sponsor. ↩︎
  18. Figures are not shown for 2007 or 2008 because of the incorrect coding in January 2007 in the preliminary file available for this analysis. In addition, some switches recorded as voluntary (especially in January 2007) may have been switches between different plans offered by the same plan sponsor; these switches may have been facilitated by the plan sponsor and accomplished with minimal input from plan enrollees. See Appendix 1: Study Methodology. ↩︎
  19. These findings are consistent with those from an evaluation of the transition process between 2007 and 2008, which indicated that among the 1.9 million LIS beneficiaries who received letters from CMS indicating that they would be reassigned if they did not choose a new plan, only 10 percent acted on the letter and made a choice. The other 90 percent were randomly reassigned to new plans for 2008. Grecia Marrufo et al., “Evaluation of the Medicare Demonstration to Transition Enrollment of Low Income Subsidy Beneficiaries,” Acumen, LLC, June 2009, http://www.cms.gov/reports/downloads/Marrufo_PartD_LIS_2009.pdf. ↩︎
  20. We count changes in plan enrollment starting in August 2006 in order to avoid the effects of the first annual enrollment period, which was open until May 15, 2006, with late enrollments effective in June 2006. We excluded July 2006 to allow the possibility that some enrollments in the annual enrollment had a delayed effective date in July. ↩︎
  21. This comparison is restricted to the three-year period from 2008 to 2010 to avoid complications resulting from the incomplete coding for January 2007 in the preliminary file available for this analysis. ↩︎
  22. In this analysis, we excluded switches outside the annual enrollment that were accomplished as reassignments by CMS. These mostly occur in situations where a beneficiary moves to a different PDP region, thus triggering a special enrollment period. ↩︎
  23. In 2010, 1.4 percent of those who were assigned to their current plan elected a new plan between February and December compared to 5.1 percent of those who chose their prior plan. Rates were similar in 2008 (2.7 versus 5.5) and 2009 (1.5 versus 4.7). ↩︎
  24. This total also includes some plan changes resulting from specific circumstances such as moving to another state. Other circumstances include one instance in 2010 were a PDP contract was terminated and its enrollees were assigned to other PDPs or chose one on their own. ↩︎
  25. The period of investigation for switching outside of the annual enrollment period starts in enrollment with enrollment decisions effective August 2006 in order to exclude all switches during the longer annual enrollment period in the program’s first year. The 14.4 percent changing plans at least one time includes 3.7 percent who did so two or more times. ↩︎
  26. During the last half of 2010, the share of LIS beneficiaries in PDPs who made a voluntary switch of plans in any month was generally about 0.2 percent. In August 2010, plan switches were effective for 0.6 percent of LIS beneficiaries in PDPs (and about 0.3 percent in September). These shares project to about 30,000 LIS beneficiaries responding to the “nudge notice” in August and another 6,000 in September. ↩︎
  27. Jack Hoadley et al., “To Switch or Not to Switch: Are Medicare Beneficiaries Switching Drug Plans to Save Money?” October 2013. https://modern.kff.org/report-section/to-switch-or-not-to-switch-issue-brief/. ↩︎
  28. Neither of these analyses of premium costs fully account for the fact that some beneficiaries may face quite different costs for the set of drugs that they take in one plan compared to another, including both whether their drugs are on formulary and any variations in cost sharing for non-LIS beneficiaries. In some cases these cost-sharing differences may be enough to offset premium savings. ↩︎
  29. In this analysis, beneficiaries are classified whether they were eligible for reassignment as of the start of the measurement period (August 2006). Because some switch classifications over time, mostly from eligible to not eligible, this approach may weaken the differences. But it also has the advantage of mostly avoiding the impact of the misclassification issue in January 2007. ↩︎
  30. Adam Atherly, Curtis S. Florence, and Kenneth E. Thorpe, ‘‘Health Plan Switching among Members of the Federal Employees Health Benefits Program,’’ Inquiry 42(3): 255–65, 2005. Peter J. Cunningham, “Few Americans Switch Employer Health Plans for Better Quality, Lower Costs,” NIHCR Research Brief No. 12, Center for Studying Health System Change, January 2013. ↩︎
  31. Health Insurance Marketplaces 2015 Open Enrollment Period: March Enrollment Report, March 10, 2015. http://aspe.hhs.gov/health/reports/2015/MarketPlaceEnrollment/Mar2015/ib_2015mar_enrollment.pdf. ↩︎
  32. Elizabeth Hargrave, Bhumika Piya, Jack Hoadley, Laura Summer, and Jennifer Thompson, “Experiences Obtaining Drugs under Part D: Focus Groups with Beneficiaries, Physicians, and Pharmacists,” Contractor report submitted to the Medicare Payment Advisory Commission, March 2008. http://www.medpac.gov/documents/contractor-reports/May08_PartDFocusGroup_CONTRACTOR_JS.pdf. Gretchen Jacobson, Christina Swoope, Michael Perry, and Mary C. Slosar, How are Seniors Choosing and Changing Health Insurance Plans? https://modern.kff.org/medicare/report/how-are-seniors-choosing-and-changing-health-insurance-plans/. ↩︎
  33. Jack Hoadley et al., “ Medicare Part D in Its Ninth Year: The 2014 Marketplace and Key Trends, 2006-2014,”August 2014, https://modern.kff.org/medicare/report/medicare-part-d-in-its-ninth-year-the-2014-marketplace-and-key-trends-2006-2014/. ↩︎
  34. Most plans include at least 90 percent of all pharmacies in their networks, so pharmacy availability is usually not an issue. Even though there has been a rise in plans’ of pharmacy tiers with different cost-sharing levels, LIS beneficiaries pay the same cost sharing regardless of pharmacies’ network status. ↩︎
  35. Laura Summer, Jack Hoadley, and Elizabeth Hargrave, “The Medicare Part D Low-Income Subsidy Program: Experience to Date and Policy Issues for Consideration,” Kaiser Family Foundation, September 2010,” available at https://modern.kff.org/medicare/issue-brief/the-medicare-part-d-low-income-subsidy/. Jack Hoadley et al., “The Role of Beneficiary-Centered Assignment for Medicare Part D,” contractor report for MedPAC, June 2007, http://www.medpac.gov/documents/contractor-reports/June07_Bene_centered_assignment_contractor.pdf  Jack Hoadley, Elizabeth Hargrave, Katie Merrell and Laura Summer, “Beneficiary-Centered Assignment and Medicare Part D,” presentation to MedPAC, September 4, 2008, https://georgetown.app.box.com/s/rg9g4wzpqs3drcs5fc1taxtahxopno1d. Yuting Zhang, Chao Zhou, and Seo Hyon Baik, “A Simple Change To The Medicare Part D Low-Income Subsidy Program Could Save $5 Billion,” Health Affairs 33(6):940-945, June 2014. ↩︎
  36. Laura Summer, Jack Hoadley, and Elizabeth Hargrave, “The Medicare Part D Low-Income Subsidy Program: Experience to Date and Policy Issues for Consideration,” Kaiser Family Foundation, September 2010,” available at https://modern.kff.org/medicare/issue-brief/the-medicare-part-d-low-income-subsidy/. ↩︎
  37. The 29 percent is a share of all enrollees who renewed coverage, regardless of whether they received a subsidy, but overall 87 percent of all enrollees in the federal marketplace were eligible for subsidies.   “Health Insurance Marketplaces 2015 Open Enrollment Period: March Enrollment Report,” Department of Health and Human Services, ASPE Issue Brief, March 10, 2015, http://aspe.hhs.gov/health/reports/2015/MarketPlaceEnrollment/Mar2015/ib_2015mar_enrollment.pdf. ↩︎
  38. http://news.coveredca.com/2015/01/covered-california-has-taken-steps-to.html. ↩︎
  39. http://www.healthsourceri.com/press-releases/healthsource-ri-releases-enrollment-demographic-and-volume-data-through-february-23-2015/. ↩︎
  40. Marketplace consumers with incomes in the range of Part D LIS beneficiaries do not qualify for marketplace subsidies, but should qualify for Medicaid in the states that have enacted Medicaid expansions. ↩︎
  41. Sabrina Corlette, Jack Hoadley, and Sandy Ahn, “Marketplace Renewals: State Efforts to Maximize Enrollment into Affordable Health Plan Options,” Robert Wood Johnson Foundation, December 2014, http://www.rwjf.org/en/library/research/2014/12/marketplace-renewals–state-efforts-to-maximize-enrollment-into-.html. ↩︎
  42. We exclude any enrollees in plans that are open exclusively to beneficiaries who are former employees of a particular employer or union. In 2010, only 0.4 percent of LIS beneficiaries were in employer plans. ↩︎
  43. The continuous enrollment criterion for the 2006-07 file allows inclusion of beneficiaries who entered the program during the full annual enrollment period for 2006, which extended from November 15, 2005 until May 15, 2006. ↩︎
  44. Jack Hoadley et al., “To Switch or Not to Switch: Are Medicare Beneficiaries Switching Drug Plans to Save Money?” October 2013. https://modern.kff.org/report-section/to-switch-or-not-to-switch-issue-brief/. ↩︎
  45. The supplemental file included two other variables: the date of this most recent enrollment type and the history of enrollment types for the month in which the decision was made. Thus, if a beneficiary is randomly reassigned, then picks a plan on her own, and then changes her mind and picks another plan (all to go effect in January), the history variable would record “HBB.” We used these variables for testing purposes. ↩︎
  46. These are mostly situations where a plan sponsor has reorganized plan offerings as a result of acquiring plans from another sponsor, dropping some of its plans, or adding new plans. ↩︎
  47. These situations have occurred relatively rarely in the Part D program to date. ↩︎
  48. The value of the LIS depends on income. A few LIS beneficiaries (2.6 percent) are entitled to a reduced premium instead of premium-free coverage. The so-called partial LIS beneficiaries also receive more limited relief for cost sharing. See Appendix 1: Study Methodology for more numbers. ↩︎
  49. See LIS report for a more detailed discussion of benchmark plans. Laura Summer, Jack Hoadley, and Elizabeth Hargrave, “The Medicare Part D Low-Income Subsidy Program: Experience to Date and Policy Issues for Consideration,” Kaiser Family Foundation, September 2010,” available at https://modern.kff.org/medicare/issue-brief/the-medicare-part-d-low-income-subsidy/. ↩︎
  50. In some cases, CMS approves a formal crosswalk of enrollment, by which enrollees in one plan are transferred to another plan offered by the same sponsors. We do not count these as plan switches. In other cases, it may be that transfers among plans are made by plan sponsors by other procedures, such as a letter to the enrollees. ↩︎
Poll Finding

Medicare And Medicaid At 50

Authors: Mira Norton, Bianca DiJulio, and Mollyann Brodie
Published: Jul 17, 2015

Medicare And Medicaid At 50 Findings

Introduction

Medicare and Medicaid were signed into law by President Lyndon Johnson on July 30, 1965 in a bipartisan effort to provide health insurance coverage for low-income, disabled, and elderly Americans. In their 50 year history, each of these programs has come to play a key role in providing health coverage to millions of Americans today and make up a significant component of federal and state budgets. Medicare, a federal government program, provides health insurance coverage for Americans age 65 and older, regardless of income, as well as those under age 65 with permanent disabilities. Medicaid provides coverage for medical care and long-term care services to low-income people and is jointly financed by federal and state governments, with each state deciding how to structure benefits, eligibility, and care delivery within guidelines set by the federal government. Medicaid is also one of the primary ways the Affordable Care Act expanded coverage to millions more low-income, uninsured adults. Today, both programs cover 111 million Americans and cost an estimated $1,035 billion this year.1 

Over the past five decades, both programs have adapted to a changing health care landscape. As major programs both in size and scope, their role and the ways in which they operate are often debated by policymakers and the public alike. While the public generally values these programs, policymakers are faced with budget constraints as well as competing priorities and interests, and as a result, there are often debates about the effectiveness of the programs and the directions they should take. As the programs reach their 50th year, the Kaiser Family Foundation conducted a nationally representative survey of Americans to explore the public’s views of these programs, their experiences as beneficiaries, and their opinions on proposals for future changes.

Section 1: Views Of The Importance Of Medicare And Medicaid

Most View Medicare And Medicaid As Very Important Programs

Medicare and Medicaid are viewed by the public as important government programs. More than three-quarters (77 percent) say Medicare is a very important program, ranking just below Social Security (83 percent) and similar to the shares who say federal aid to public schools (75 percent), and the defense and military (73 percent) are very important. More than six in ten (63 percent) say Medicaid is very important, about the same as loans for college students (64 percent). Surveys dating back to 1999 have found that similar shares over time express the importance of Medicare and Medicaid as government programs.2 

Figure 1

Although these programs are popular with large segments of the public, as large government-financed programs, this survey finds some partisan divisions in views about Medicare and Medicaid. About seven in ten Republicans and independents and about nine in ten Democrats say the Medicare program is very important. Among people ages 65 and older, virtually all of whom are covered by Medicare, support is broad across party lines, with 85 percent of Republicans, 89 percent of independents, and 92 percent of Democrats saying the program is very important. Views of Medicaid are somewhat more divided. Majorities of Democrats (78 percent) and independents (62 percent) feel the program is very important, while less than half of Republicans (47 percent) say the same.

Figure 2

Despite the fairly pervasive view that these programs are “very important”, the public is ambivalent about the role of the federal government in making the health care system work well. Even among the majorities of the public who says Medicare and Medicaid are very important programs, over four in ten say the federal or state governments should have no role or only a minor role in the health care system. And, among those who say Medicare and Medicaid are not very important government programs, more than three in ten say that the federal government should have no role in the health care system at all, and roughly another third say the role should be minor. Similar shares see no role or only a minor role for state governments in health care.

Importance As Government Programs
TotalMedicareMedicaid
Very important government program (77%)Not very important government program (21%)Very important government program (63%)Not very important government program (34%)
When it comes to making the health care system in America work well, do you think the Federal government should play a major role, a minor role or no role?
Major role47%52%27%57%28%
Minor role3130362839
No role2015361331
When it comes to making the health care system work well, do you think state governments should play a major role, a minor role or no role?
Major role4751325434
Minor role3937483547
No role121020819
NOTE: Don’t know and Refused responses not shown.

Most Say Programs Are Working Well

In terms of the public’s perceptions of how well the Medicare and Medicaid programs are working, most Americans (60 percent) say Medicare is working well for most seniors and half (50 percent) say Medicaid is working well for most low-income people covered by the program, although about three in ten say the programs are not working well. Those currently covered by each program are more likely to say they are working well, including three-quarters of people covered by Medicare (75 percent) and about two-thirds of those currently covered by Medicaid (65 percent).3  While most of those covered by the programs say they are working well, views of the programs may be informed by their own personal experience with their health coverage. Those who say they have experienced a variety of problems – such as difficulty affording health care or having had to delay or forego medical care because of the cost – are more likely than those who haven’t reported such problems to say Medicare and Medicaid are not working well (see Section 4 for more details).

Figure 3

Large Shares Say Programs Are Personally Important

Many Americans say that the programs are important to them personally, including three-quarters (76 percent) overall who cite Medicare as important to them and their family and about half (51 percent) who say the same for Medicaid. Democrats are more likely than Republicans and independents to say Medicare is personally important to them, but still about seven in ten Republicans say the program is personally important. There is more variation across parties on the personal importance of Medicaid. Six in ten Democrats (61 percent) say Medicaid is personally important to them, in contrast with about the same share of Republicans (63 percent) who say the opposite. Independents fall in the middle with 53 percent saying the program is personally important and 46 percent saying it is not.

Figure 4

When asked why Medicare is important to them, over nine in ten say they like knowing the program exists for seniors and younger adults with long-term disabilities (94 percent), and that either they, or someone else in their family, may need Medicare benefits in the future (93 percent). A large majority also say it is important to them because they or someone they know has received health care paid for by Medicare (80 percent).

Figure 5

Reasons for Medicaid’s importance are similar, with roughly nine in ten saying they like knowing the program protects low-income people who cannot afford needed medical care (93 percent) or they or a family member may need the benefits in the future (89 percent). Three-quarters (74 percent) also say it is important to them because they have personal experience with the program and about half (52 percent) say Medicaid is personally important because it has helped them or someone they know pay for long-term care services.

Figure 6

Medicare And Medicaid Impact A Large Share Of Americans

Over the past five decades, Medicare and Medicaid have become woven into the fabric of American life both politically and personally due to the large numbers of people the programs cover. Medicare’s impact is far-reaching and nearly universal, as most Americans are either covered by the program themselves, know someone in their family who is covered, or will be covered at some point in their lives. Although its impact is perhaps less well known, this survey finds that Medicaid also impacts large shares of Americans across the country.

Overall, nearly two-thirds of Americans (64 percent) report some connection with the Medicaid program, either because they personally have received some assistance from Medicaid (27 percent), or they have close friends or family who have (37 percent).

Figure 7

Personal Characteristics Tied To Opinion Of Programs

While many feel these programs are important nationally or on a personal level, high levels of support are not entirely universal. Those who are more likely to say the programs are not important are those often less affected by the programs. Roughly three in ten with coverage through an employer say Medicare is not a very important government program (29 percent) or is not personally important (35 percent), compared to fewer than one in ten covered by Medicare (9 percent and 4 percent, respectively). As a program for nearly all adults 65 and older, younger people under age 65 are more likely than seniors to say it is not a very important government program (25 percent versus 11 percent) and that it’s not personally important to them (28 percent versus 7 percent). In addition, roughly three in ten people who report higher incomes or higher levels of education say Medicare is not a very important government program or is not personally important, compared to fewer than one in five of those with lower levels of income or education (See Appendix Table 1 for more details).

Similarly, those who do not see Medicaid as important are also generally those with little experience with the program. Those who report no personal experience with the program, those covered through an employer, and those with higher incomes are more likely to say Medicaid is not a very important government program by more than 15 percentage points. These differences are even greater for views of the program’s personal importance. At least six in ten of those who have never personally been covered by the program, have coverage through an employer, or report higher levels of income say that Medicaid is not personally important to them, compared to 16 percent of those who have ever been covered by the program, 5 percent of those currently covered by the program, and about a quarter of those with low incomes. Additionally, those who say they have better health or higher levels of education are also more likely to say that Medicaid is not important personally (See Appendix Table 2 for more details).

There are fewer differences across demographic groups in terms of how well the programs are working for those they serve. Although many say the programs are working well, those under age 65 are more likely than seniors to say either program is not working well (33 percent versus 18 percent for Medicare, 35 percent versus 27 percent for Medicaid). Republicans and independents (32 percent each) are more likely than Democrats (24 percent) to say Medicare isn’t working well; however, there is no partisan difference in perceptions of how well Medicaid is working. (See Appendix Tables 1 and 2 for more details).

The Vast Majority Say They Would Enroll In Medicaid If They Needed To

The survey finds little evidence that stigma is a major barrier to signing up for Medicaid. When presented with a hypothetical situation of being uninsured and needing medical care, a large majority (85 percent) of those not currently enrolled in Medicaid say they would enroll in the program. A similar share (88 percent) say that they would enroll an eligible child in Medicaid if needed. Still, roughly one in ten say they would not enroll themselves or a child on Medicaid, a share that increases to about 1 in 6 of those with no connection to the program.

Figure 8

Section 2: Knowledge Of The Medicare And Medicaid Programs

Knowledge Of Programs

A large share (72 percent) of the public, including 85 percent of those 65 and older, is aware that Medicare is the primary source of health insurance for people ages 65 and older, although 17 percent say that Medicaid is the primary source of insurance for this group and an additional 11 percent say it’s some other program or say they don’t know. Similarly, about two-thirds (65 percent) know that Medicaid is the primary source of health insurance for low-income people, although nearly one in five (18 percent) say the program is Medicare, and about the same share (17 percent) say it’s a different program or say they don’t know.

Figure 9

When asked a more specific question about which government program – Medicare or Medicaid – pays for nursing home care and other extended long-term care services for low-income, elderly and disabled people, only about a third (36 percent) correctly name Medicaid, while a similar share (37 percent) say Medicare routinely pays for extended nursing home care, and roughly a quarter (27 percent) say it’s a different program, or say they don’t know. Seniors are slightly more likely to be aware that Medicaid covers extended long-term care services than adults under age 65 (42 percent versus 34 percent).

About three-quarters of the public (74 percent) is aware that Medicare is a federal government program, although nearly one in five (17 percent) incorrectly say it’s a state government program. A majority (57 percent) are aware that Medicaid is a joint state and federal government program, although one in five (21 percent) say it is primarily a federal program, and 15 percent say it’s primarily a state program.

Figure 10

Most Medicare beneficiaries pay the standard monthly premium, but a relatively small share of beneficiaries (around 6 percent in 2015) with higher incomes are required to pay higher premiums for their Medicare coverage.4  Three in ten (30 percent) of the public are aware that higher-income seniors pay higher premiums than other seniors for their Medicare coverage, while nearly half (46 percent) say they do not, and an additional quarter (24 percent) say they don’t know. Surprisingly, those ages 65 and older are no more likely than non-elderly adults to know that higher-income seniors currently pay higher premiums, although seniors earning $75,000 or more annually are more aware of Medicare’s income-related premiums than seniors earning less (40 percent versus 21 percent).

Knowledge Of State Medicaid Expansion

Although many know basic facts about Medicare and Medicaid, an area of general confusion is Medicaid’s expansion under the ACA. When signed into law, the ACA included a provision that states expand their Medicaid programs to cover more low-income uninsured adults, a group that had not been eligible for Medicaid previously. However, a 2012 Supreme Court ruling effectively made it optional for states to expand, and 21 states have opted not to do so as of June 2015.5  About six in ten Americans (62 percent) are aware that some states have not expanded their Medicaid program to cover more low-income uninsured adults. About one in ten (9 percent) incorrectly say that all states have expanded their programs, and about three in ten (29 percent) say they don’t know.

When asked whether or not their state has expanded Medicaid, more than four in ten correctly know their state’s expansion status, including 46 percent of those in states that have not expanded their Medicaid programs and 42 percent of those in states that have expanded. Seventeen percent in both groups incorrectly say their state has expanded Medicaid when it hasn’t, or vice versa. About three in ten say they don’t know their state’s expansion status and about one in ten incorrectly say that all states have expanded their Medicaid programs. The people targeted by Medicaid, those with lower incomes, are no more likely to be aware of their state’s expansion status. In fact, those with higher incomes (earning at least $75,000 annually) are more likely than those earning less to be aware of their state’s expansion status (54 percent versus 42 percent for those earning between $30,000-$75,000 annually and 37 percent for those earning less than $30,000 annually).

Figure 11

In addition to some confusion regarding the status of their state’s Medicaid expansion, many don’t know how this expansion is being financed. One in four (26 percent) recognize that the federal government pays nearly all the costs of expanding the Medicaid program, while one in five (20 percent) incorrectly say the states themselves pay nearly all the costs. The largest share, 42 percent, mistakenly say that both the federal government and the states share the costs equally.

Section 3: National Priorities and the Future of Medicare and Medicaid

Spending Priorities

Reflecting the high regard the public holds for these programs, Americans are generally opposed to cutting back federal spending on Medicare or Medicaid, as previous surveys have found. Nearly half say they’d like to see the President and Congress keep Medicare and Medicaid spending about the same, while roughly four in ten say they would support an increase in spending. Support for spending increases for Medicare and Medicaid fall just below support for such increases in education and Social Security. Relatively few support cuts to either program.

Figure 12

Democrats say they favor increased government spending on Medicare (54 percent) and Medicaid (53 percent), while Republicans favor keeping spending about the same (61 percent for Medicare, 54 percent for Medicaid). In terms of people’s connection to the programs, those covered by Medicare are no more likely than those with employer coverage to support increases in Medicare spending. However, for Medicaid, roughly half (45 percent) of those covered by Medicaid say they support increased spending for the program, while a similar share (46 percent) of those with coverage through an employer say they would like spending to remain as it is. Those who say they have no personal experience with Medicaid and no close friends or family who have are somewhat more likely to support cuts to Medicaid (18 percent versus 10 percent). (See Appendix Table 3 for details).

Financial Future Of Medicare

As health care costs rise and the elderly population grows, there is some concern among the public about Medicare’s financial sustainability. A slim majority (54 percent) of the public says they are not confident in the program’s ability to continue to provide future beneficiaries the same level of benefits that seniors receive today, while 44 percent saying they are confident. Fewer Americans under age 65 than those ages 65 and older express confidence in Medicare’s ability to provide the same level of benefits for future beneficiaries.

Figure 13

Echoing this concern about Medicare’s future, roughly two-thirds (68 percent) say changes need to be made to the Medicare program to keep it sustainable for the future, while only about a quarter (27 percent) say the program will basically be fine if left as is. Adults under age 65 are more likely than seniors to say changes need to be made to keep it sustainable (71 percent versus 54 percent). When it comes to the extent of those changes, however, the public is divided, with about a third (35 percent) saying major changes are needed to keep Medicare sustainable for the future, while three in ten (30 percent) say the changes needed are minor.

Figure 14

Proposed Changes To Medicare

Proposals to keep Medicare financially sustainable have taken a variety of forms in recent years. When asked about several specific proposals, this survey finds strong public support across age groups and party lines for allowing the federal government to negotiate lower prices with drug companies. About six in ten (58 percent) favor increasing Medicare premiums for wealthier seniors, but much fewer (31 percent) support increasing Medicare premiums for all seniors. While about half of the public overall (51 percent) support reducing Medicare payments to private insurance companies that provide Medicare benefits, this garners less support from older adults (39 percent). Compared to other, more popular proposals, fewer people support gradually raising the age of eligibility from 65 to 67 (39 percent overall), or increasing cost-sharing for future Medicare beneficiaries (24 percent overall). Raising the age of Medicare eligibility is supported by a smaller share of younger adults than adults ages 65 and older, who are already covered by Medicare and would not be affected by this change.

Figure 15

One proposal discussed in Congress would change the structure of Medicare so that the government would guarantee each senior a fixed contribution toward the cost of their insurance, rather than a defined set of benefits. Under this proposal, which is often called premium support, seniors would apply a certain amount toward the purchase of coverage from either traditional Medicare or from a list of private health plans. Most Americans, however, say they prefer the current system, with seven in ten (70 percent) saying Medicare should continue as it is today, with the government guaranteeing seniors’ health insurance and making sure that everyone can get the same defined set of benefits. A quarter (26 percent) say they prefer to see Medicare changed to a premium support system. Those under age 65 are somewhat more likely than seniors to support changing to such a structure (28 percent versus 18 percent). A majority of seniors, regardless of political party identification, prefer to see Medicare stay as is, seniors who identify as Democrats are somewhat less supportive of this change to Medicare (11 percent) than seniors who are independents (22 percent) or Republicans (27 percent).

Figure 16

Proposed Changes To Medicaid

Some policymakers have proposed reforming the payment model for the Medicaid program in the form of a block grant. Currently, the federal government matches state spending on an open-ended basis. Under a block grant structure, the federal government would limit the amount it gives states to help pay for Medicaid coverage but could allow states more flexibility in determining which groups of people and what services are covered under the program. Here again, most Americans prefer the status quo, with roughly six in ten (62 percent) saying the program should continue as it is today, with the federal government guaranteeing coverage for low income people, matching state spending on the program, and setting standards for who gets covered under the program and what benefits are offered. About a third (32 percent) say that, instead, Medicaid should be changed to a block grant structure rather than matching state Medicaid spending.

Block grant proposals are generally made by Republicans in Congress in the context of federal deficit reduction proposals, and this survey finds that there is broader support for this proposal among Republicans than Democrats across the country (50 percent versus 20 percent). Still, Republicans are somewhat divided in how they envision the future of Medicaid, with more than four in ten saying Medicaid should continue as it is today (43 percent). Democrats overwhelmingly favor the current arrangement (76 percent) over a change to a block grant system (20 percent).

Figure 17

Partisan Divisions On Who Americans Trust To Handle Programs

When asked which political party Americans trust more with these programs, over four in ten say they trust Democrats to do a better job handling both Medicare (44 percent) and Medicaid (46 percent), and roughly three in ten say they trust Republicans, while nearly 1 in 5 say they trust neither group. These findings have been relatively stable over the past five years. However trust in Democrats’ handling of Medicare has narrowed in recent years, particularly among older adults. In 1998, 46 percent of those ages 65 and older said they trusted Democrats and 22 percent chose Republicans, a gap of 24 percentage points; by 2015 those percentages are 44 and 34 percent, respectively, narrowing the gap to 10 points.6 

As expected, there is sharp partisan divide on this question, although those who don’t identify with either party – political independents – are more likely to say they trust Democrats more than Republicans with both programs (36 percent versus 27 percent for Medicare, 40 percent versus 23 percent for Medicaid). Still about three in ten independents say they trust neither party.

Figure 18

Section 4: Experiences With Medicare And Medicaid

This survey also explores the experiences of those currently enrolled in Medicare and Medicaid, including how financially protected they feel by their insurance, and what difficulties, if any, they’ve experienced with their coverage. Although most report few problems with their coverage, some report difficulty affording and accessing medical care. These findings often reflect the different groups of people covered by the programs. For example, those with employer-sponsored insurance tend to have higher incomes, while by definition, those with Medicaid have lower incomes and seniors covered by Medicare tend to have lower incomes as well.

Most Report Positive Experiences With Medicare And Medicaid And Feel Well-Protected

Overall, roughly nine in ten people covered by Medicare (91 percent) and Medicaid (86 percent) say their experiences with their health insurance has been positive, similar to the 87 percent of those with coverage through an employer who say the same. Echoing largely positive experiences with their plans, more than eight in ten people covered by Medicare and Medicaid say they feel well-protected by their health insurance coverage, including roughly four in ten who say they feel very well-protected.

Figure 19

Some Report Financial Hardships

Although many feel well-protected, some report financial hardships. Reflective of the fact that people served by these programs have relatively low incomes, one in five current Medicaid enrollees (19 percent) and one in seven people currently covered by Medicare (14 percent) say that in the past 12 months they or a family member have spent less money on food, heat, or other basic needs so that they would have enough money to pay for health care. More than one in four without insurance in the past year say they or a family member have had to sacrifice basic needs in order to pay for health care, and about one in ten with employer-sponsored coverage say the same.

Figure 20

Six percent of both those covered by Medicare and those with employer-sponsored insurance say they’ve had problems paying their insurance premiums in the past 12 months.7   Larger shares say they’ve had problems paying for other health care costs, including about one in five Medicare beneficiaries and one in six with employer-sponsored insurance. People with Medicaid pay little or no costs for health care services covered by the program and, as their incomes change throughout the year, they may move on and off Medicaid more frequently than those with other types of insurance. More than one in five current Medicaid enrollees report that they have had problems paying health care costs in the past 12 months. Some of those reporting problems paying for care may have had trouble paying for services not covered by their health insurance or during a period in the past year when they did not have their current insurance.

Figure 21

Some Report Problems With Coverage Or Finding Providers

Some insured Americans report difficulty getting their health insurance to pay for care, finding a provider willing to accept their insurance, or getting a referral or appointment to see a specialist. Those with Medicaid are more likely to say they’ve had each of these problems than those with Medicare or employer-sponsored coverage. Nearly a quarter (23 percent) of those with Medicaid report trouble finding a health care provider willing to accept their insurance, compared to about one in ten among those with employer-sponsored insurance or Medicare (9 percent each). More than a third of Medicaid enrollees (37 percent) report having any problems with their coverage, compared to roughly one in five people either covered by Medicare (18 percent) or an employer-sponsored plan (20 percent).

Figure 22

Costs Remain A Barrier To Care, Especially For Uncovered Services

Although large shares say that they haven’t experienced certain barriers to care, still 13 percent of people with Medicaid, and 9 percent of people covered by Medicare, as well as 10 percent of people with employer coverage say that in the past 12 months they’ve delayed or gone without doctor visits because of the cost.

Coverage for dental, vision, and hearing aids is often not included or limited in Medicare, Medicaid and private insurance. Although sometimes covered by Medicare Advantage plans, they are not required benefits, and when plans do offer coverage, it is generally modest. As such, higher shares report delaying or going without dental services, including about three in ten Medicaid enrollees (31 percent) and roughly one in five covered by Medicare (23 percent) or employer-sponsored insurance (19 percent). Similar shares say the same about delaying getting vision care, eyeglasses or hearing aids because of the cost. Fewer Medicare beneficiaries report delaying or foregoing these services because of the cost, compared to those enrolled in Medicaid.

Those without health insurance are particularly vulnerable to cost-related access problems, with more than half (53 percent) saying they’ve had to delay dental care because of the cost, and four in ten (42 percent) saying they’ve had to delay a doctor visit (42 percent) or delay getting eyeglasses or hearing aids (38 percent).

Figure 23

Problems And Affordability Relate To Views Of The Programs

The experiences of those covered by Medicare and Medicaid are linked to their opinions of them. Although relatively small shares overall, people with Medicare or Medicaid who say they’ve had problems with their insurance in the past 12 months are more critical of how well the programs are working. As a group, they are less likely to say each program is working well, although no less likely to express its importance.

Medicare beneficiaries who report experiencing problems with affordability8  (28 percent of those covered by Medicare) say Medicare is not working well at about twice the rate as other Medicare beneficiaries. For instance, about four in ten (41 percent) beneficiaries with affordability issues say the program is not working well, compared to just 14 percent of those who do not report affordability issues. A similar pattern holds for those who report delaying care due to cost or experiencing problems with their coverage such as trouble accessing providers or with covered services.

Looking specifically at Medicaid enrollees, those who say they have had problems affording care (31 percent of those covered by Medicaid) are much more likely than those who don’t report problems to say the Medicaid program is not working well for most low-income people (45 percent versus 20 percent). Similarly, among those covered by Medicaid who report problems with their health coverage (37 percent) or having to delay getting care because of the cost (46 percent), about four in ten say Medicaid is not working well, compared to closer to two in ten who don’t report difficulties.

Views Among People Covered By The Programs Who Report Problems
Percent of people covered by Medicare in each group who say Medicare is working well for most seniors
Yes, working wellNo, not working wellDon’t know
Problems affording care in past 12 months   
Any problems (28 percent)58%41%1%
No problems (72 percent)82%14%4%
Problems accessing providers or with covered services in past 12 months   
Any problems (18 percent)59%39%2%
No problems (82 percent)78%18%4%
Delay in care in past 12 months   
Any delay (32 percent)61%35%4%
No delay (68 percent)82%15%3%
Percent of people covered by Medicaid in each group who say Medicaid is working well for most low-income people
Yes, working wellNo, not working wellDon’t know
Problems affording care in past 12 months   
Any problems (31 percent)50%45%6%
No problems (69 percent)73%20%7%
Problems accessing providers or with covered services in past 12 months   
Any problems (37 percent)55%37%8%
No problems (63 percent)71%23%6%
Delay in care in past 12 months   
Any delay (46 percent)60%37%3%
No delay (54 percent)70%20%10%

Conclusion

Medicare and Medicaid are government financed programs largely valued by the general public and many say they are personally important because of the role they play in providing coverage for seniors, adults with disabilities and those with low-incomes. Many say the programs are working well, however the minority of people who report difficulties paying for care or accessing services are more likely to say the programs are not working well, demonstrating some of the ongoing challenges the programs face. Over the last 50 years, the programs have changed and evolved and are often the subject of political controversy as lawmakers debate who and what the programs should cover as well as how they should be financed. While the public generally would like to see federal spending on the programs increase or stay the same and prefers the status quo over restructuring the programs, policymakers must grapple with competing priorities and visions for the nation’s health care system that can sometimes be at odds with the public’s preferences.

Medicare And Medicaid At 50 Methodology

The Medicare and Medicaid at 50 survey was designed and analyzed by researchers at the Kaiser Family Foundation (KFF). The survey was conducted by telephone from April 23 through May 31, 2015 among a nationally representative random digit dial sample of 1,849 adults ages 18 or older living in the U.S., including Alaska and Hawaii (note: persons without a telephone could not be included in the random selection process). Computer-assisted telephone interviews conducted by landline (748) and cell phone (1101, including 646 who had no landline telephone) were carried out in English and Spanish by SSRS. SSRS collaborated with KFF researchers on sample design, weighting, pretesting, and supervised the fieldwork. KFF paid for all costs associated with the survey.

To capture the views and experiences of those most impacted by Medicare and Medicaid, the survey included oversamples of people ages 65 and older, people between the ages of 55 and 64, and those who are either personally covered by Medicaid or whose children are covered by Medicaid. To oversample these populations, the sample plan consisted of three elements: (1) general population respondents reached by RDD landline (n=617) or cell phone (n=989); (2) respondents reached by RDD landline, but interviewed only if they were 65 or older (n=27); (3) respondents reached by calling back phone numbers where respondents previously interviewed indicated that they or their child were covered by Medicaid (n=216).  Both the random digit dial landline and cell phone samples were provided by Marketing Systems Group (MSG).

A multi-stage weighting process was applied to ensure an accurate representation of the national adult population. The first stage of weighting involved corrections for sample design, including accounting for the likelihood of non-resonse for the re-contact sample, number of eligible household numbers for those reached via landline, and a correction to account for the fact that respondents with both a landline and cell phone have a higher probability of selection. In the second weighting stage, the sample was weighted to match estimates for the national population using data from the Census Bureau’s 2014 March supplement of the Current Population Survey (CPS), and the distribution of phone use was estimated based on the CDC’s National Health Interview Survey (NHIS). The weighting parameters used were age and gender, race/ethnicity, education, marital status, census region, population density of the respondent’s county, and telephone use. Through the weighting process, each oversample is adjusted so that the group is represented in proportion to their actual share of the population.

The margin of sampling error including the design effect for the full sample is plus or minus 3 percentage points. Numbers of respondents and margins of sampling error for key subgroups are shown in the table below. For results based on other subgroups, the margin of sampling error may be higher. Sample sizes and margins of sampling error for other subgroups are available by request. Note that sampling error is only one of many potential sources of error in this or any other public opinion poll. Kaiser Family Foundation public opinion and survey research is a charter member of the Transparency Initiative of the American Association for Public Opinion Research.

GroupUnweighted NMargin of sampling error
Total1849±3 percentage points
Coverage Type
Covered by Medicare624±5 percentage points
Covered by Medicaid391±6 percentage points
Covered by employer-sponsored insurance, under 65 years old658±4 percentage points
Uninsured, under 65 years old167±9 percentage points
Age
Age 18-54931±4 percentage points
Age 55-64395±6 percentage points
Age 65+512±5 percentage points
Half Samples
Sample A927±4 percentage points
Sample B922±4 percentage points
Political Party
Democrat628±5 percentage points
Independent588±5 percentage points
Republican422±6 percentage points

Medicare And Medicaid At 50 Appendix

TABLES

Table 1: Medicare
Percent in each category who say Medicare is …An important government programImportant for you and your familyWorking well for most seniors
Very important government programNot very important government programVery/Somewhat personally importantNot personally importantYes, working wellNo, not working wellDon’t know
TOTAL77%21%76%23%60%30%10%
Party identification       
Democrat89%10%83%15%67%24%8%
Independent72%26%73%27%59%32%9%
Republican69%32%71%28%59%32%9%
Annual household income       
Less than $30,00084%13%87%12%60%30%9%
$30,000 to less than$75,00076%23%76%23%59%31%9%
$75,000 or more71%29%63%36%60%29%11%
Self-reported disability       
Disability87%11%88%12%56%37%7%
No disability74%25%72%27%61%28%11%
Self-reported health status       
Excellent/very good/good health75%25%73%27%61%29%10%
Fair/poor health84%14%84%14%57%34%8%
Insurance coverage       
Covered by Medicaid(incl. duals)86%12%88%10%62%31%6%
Covered by Medicare(incl. duals)91%9%95%4%75%22%3%
Uninsured(age 18-64)81%16%83%16%56%29%14%
Employer-sponsored insurance(age 18-64)70%29%64%35%57%32%11%
Age       
Age 18-6474%25%72%28%57%33%11%
Age 65+89%11%93%7%76%18%6%
Education       
High school or less81%17%85%14%62%29%9%
Some college77%20%72%27%60%31%10%
College or more69%30%65%34%58%30%11%
Note: Don’t know/Refused not shown for questions on national or personal importance
Table 2: Medicaid
Percent in each category who say Medicaid is …An important government programImportant for you and your familyWorking well for most low-income people
Very important government programNot very important government programVery/ Somewhat personally importantNot personally importantYes, working wellNo, not working wellDon’t know
Total63%34%51%47%50%33%16%
Party identification       
Democrat78%20%61%39%55%30%14%
Independent62%36%53%46%49%35%15%
Republican47%49%35%63%49%34%17%
Annual household income       
Less than $30,00072%22%73%23%56%32%12%
$30,000 to less than $75,00060%38%50%49%51%33%16%
$75,000 or more59%39%31%69%45%37%19%
Self-reported disability       
Disability72%23%64%33%47%37%15%
No disability60%36%48%51%51%32%16%
Self-reported health status       
Excellent/very good/good health60%37%46%52%50%33%16%
Fair/poor health73%22%69%28%51%35%14%
Insurance coverage       
Covered by Medicaid (incl. duals)82%16%95%5%65%28%7%
Covered by Medicare(incl. duals)60%35%49%48%50%30%20%
Uninsured(age 18-64)74%23%71%26%54%37%9%
Employer-sponsored insurance(age 18-64)60%38%39%60%47%36%17%
Age       
Age 18-6464%33%53%46%51%35%14%
Age 65+57%37%44%53%48%27%26%
Education       
High school or less67%29%68%31%56%31%13%
Some college61%35%45%52%52%33%15%
College or more59%38%33%66%41%38%20%
Connection with Medicaid       
Any connection with Medicaid (including self, child, friends, family)70%29%64%35%57%32%11%
No connection with Medicaid51%43%29%69%39%35%25%
Personal experience with Medicaid       
Ever personally on Medicaid80%18%83%16%64%29%7%
Never personally on Medicaid57%40%40%59%45%35%19%
Note: Don’t know/Refused not shown for questions on national or personal importance
Table 3: Views On Federal Spending For Medicare and Medicaid
 Thinking about the federal budget, do you want to see the president and Congress increase spending on Medicare decrease spending, or keep it about the same?
Percent in each group who say…Increase spendingDecrease spendingKeep it about the same
Party identification   
Democrat54%3%41%
Independent38%9%49%
Republican25%13%61%
Insurance coverage   
Covered by Medicaid (incl. duals)49%5%44%
Covered by Medicare (incl. duals)41%4%52%
Uninsured (age 18-64)49%5%43%
Employer-sponsored insurance(age 18-64)38%10%48%
Thinking about the federal budget, do you want to see the president and Congress increase spending on Medicaid decrease spending, or keep it about the same?
Percent in each group who say…Increase spendingDecrease spendingKeep it about the same
Party identification   
Democrat53%2%43%
Independent34%16%48%
Republican22%22%54%
Insurance coverage   
Covered by Medicaid (incl. duals)45%5%49%
Covered by Medicare (incl. duals)35%10%49%
Uninsured (age 18-64)44%8%45%
Employer-sponsored insurance(age 18-64)36%16%46%
Connection with Medicaid
Any connection with Medicaid (including self, child, friends, family)42%10%47%
No connection with Medicaid28%18%49%
Personal experience with Medicaid
Ever personally on Medicaid46%7%46%
Never personally on Medicaid34%15%48%
Note: Don’t know/Refused not shown

Endnotes

  1. Congressional Budget Office. Updated Budget Projections: 2015-2025. Washington, DC: Congressional Budget Office; 2015. Data combine average monthly enrollment projections for Medicare and Medicaid published in the Medicare and Medicaid baselines, adjusted to account for Dual eligible beneficiaries (which are assumed to grow at the same rate projected for elderly Medicaid beneficiaries). ↩︎
  2. See topline for more details. ↩︎
  3. Five percent of people reported having coverage through both Medicare and Medicaid. This group, often referred to as “dual eligible,” is included throughout the report in both Medicare and Medicaid categories. Including them in both categories does not substantially impact comparisons between the two groups. ↩︎
  4. Kaiser Family Foundation, Medicare’s Income-Related Premiums: A Data Note, June 2015. https://modern.kff.org/medicare/issue-brief/medicares-income-related-premiums-a-data-note/ ↩︎
  5. Kaiser Family Foundation, Status of State Action on the Medicaid Expansion Decision, data as of June 22, 2015, https://modern.kff.org/health-reform/state-indicator/state-activity-around-expanding-medicaid-under-the-affordable-care-act/ ↩︎
  6. Kaiser Family Foundation/Harvard School of Public Health Medicare Policy Options Survey (conducted Aug 14-Sept 20, 1998). ↩︎
  7. Question about health insurance premiums not asked of Medicaid enrollees because of generally low premiums and cost-sharing. ↩︎
  8. The shares with problems affording care includes those who say they had problems paying for premiums or other health care costs or say they had to cut back basics like food or heat to pay for health care. ↩︎
News Release

With Medicare and Medicaid Getting High Marks from the Public and Beneficiaries, Majorities Favor Status Quo over Major Structural Changes Such As Premium Supports or Block Grants

Published: Jul 17, 2015

Among Medicare Changes, Strongest and Broadest Support Is for Negotiating Drug Prices

People With Medicare, Medicaid and Employer Plans Give Their Coverage Similar Ratings, But Some Report Affordability and Physician Access Problems

Fifty years after President Lyndon Johnson signed the law creating the Medicare and Medicaid programs, a new Kaiser Family Foundation poll finds a majority of the public and the vast majority of program beneficiaries view the two programs positively. Likely as a result, the public starts with a preference for the status quo over major structural changes that would reshape how the programs serve beneficiaries.

A strong majority (70%) say that Medicare should continue to ensure all seniors get the same defined set of benefits. Far fewer (26%) say that the program should be changed to instead guarantee each senior a fixed contribution to the cost of their health insurance – a system known as premium support that has been proposed to address Medicare’s long-term financing challenges.

By at least two-to-one margins, majorities of Democrats, Republicans and independents favor keeping Medicare as is rather than changing to a premium support program. Adults under 65 years old are somewhat more likely than seniors to favor premium support (28% compared to 18%), though large majorities in all age groups prefer Medicare’s current structure.

Despite the public’s lack of support for this change, a majority (54%) worry that Medicare will not be able to provide the same level of benefits to future enrollees, and two thirds (68%) say that changes are needed to keep Medicare sustainable for the future.

The poll finds that the public opposes changes to Medicaid that would turn the program into a block grant to states by nearly a two-to-one margin (62% opposed, 32% in favor). Some Republicans in Congress have supported Medicaid block grants in the past, and the poll finds a big partisan divide on the question: Half of Republicans support block grants, while only one in five Democrats do.

By far the most popular change to Medicare is allowing the federal government to negotiate with drug companies. Overall, 87% of the public supports such an option, including majorities of Democrats, Republicans and independents and across generations.

Smaller majorities favor increasing Medicare premiums for wealthier seniors (58%), which already occurs and was expanded earlier this year as part of Medicare’s physician payment reforms; and reducing payments to Medicare Advantage plans (51%). Fewer support raising Medicare’s age of eligibility from 65 to 67 (39%), raising premiums for all Medicare beneficiaries (31%), or increasing cost-sharing for future Medicare beneficiaries (24%).

Release_chart_1_FINAL

Attitudes toward Medicare and Medicaid programs

The poll finds most Americans consider Medicare (77%) and Medicaid (63%) very important programs, with some partisan differences. Strong majorities among Democrats (89%), Republicans (69%) and independents (72%) view Medicare as very important; most Democrats (78%) and independents (62%) say Medicaid is very important, while a plurality of Republicans (47%) say so.

Most Americans (60%) also say Medicare is working well for most seniors, while half (50%) say Medicaid is working well for most low-income people covered by the program. Fewer say Medicare (30%) and Medicaid (33%) are not working well. Those who are currently covered by the programs are more likely to say the programs are working well for beneficiaries.

The survey shows Medicaid now has a broad reach, as nearly two thirds (64%) of the public report a personal connection to the program either because they are or have been covered or have close friends or family members who are or have been covered. Medicaid’s image does not appear to be a major barrier to enrollment, with a large majority (85%) of those not enrolled saying they would sign up if they needed it.

Beneficiaries’ experiences

The survey also explores the experiences of those currently covered by Medicare and Medicaid. Very large majorities of those covered report positive experiences with Medicare (91%) and with Medicaid (86%), shares similar to what people with employer coverage say (87% positive).

Similar majorities also say they feel well-protected financially by their coverage, though minorities report some financial hardships, which may reflect beneficiaries’ relatively low incomes. About one in five Medicaid enrollees (19%) and one in seven Medicare beneficiaries (14%) say that in the past 12 months they or a family member have had to spend less money on food, heat or other basic needs to pay for health care. In comparison, about one in four of those without insurance (27%) and one in 10 of those with employer coverage (11%) report such hardships.

The survey finds some adult beneficiaries report delaying or going without various types of health care in the past 12 months due to cost, often for services such as dental or vision care that aren’t covered by the programs. For instance, relatively small numbers say they delayed or skipped going to the doctor (13% for Medicaid enrollees; 9% for Medicare), but larger shares say they did so for dental care (31% for Medicaid enrollees, 23% for Medicare). Each program’s beneficiaries are far less likely than the uninsured to report these problems.

Release_chart_2_FINAL

The survey also finds that the low-income adults covered by Medicaid are somewhat more likely than those with other types of insurance to report access issues in the past 12 months. For instance, 23 percent of Medicaid beneficiaries say they had trouble finding a provider willing to accept their insurance. Fewer with Medicare (9%) or employer coverage (9%) report this problem. Similarly, a larger share of people with Medicaid (15%) than Medicare (6%) or employer coverage (5%) say they had a problem getting a referral or appointment to see a specialist in the past year.

Visit our Medicare and Medicaid at 50 resource page for more relevant research, articles and videos.

METHODOLOGY

The poll was designed and analyzed by public opinion researchers at the Kaiser Family Foundation and was conducted from April 23-May 31, 2015 among a nationally representative random digit dial telephone sample of 1,849 adults, including oversamples of people ages 55-64 (n=395), people 65 or older (n=512) and people who report currently having Medicaid coverage (n=391). Interviews were conducted in English and Spanish by landline (748) and cell phone (1,101). The margin of sampling error is plus or minus 3 percentage points for the full sample. For results based on other subgroups, the margin of sampling error may be higher.