Visualizing Health Policy: Medicaid and Medicare at 50: Trends and Challenges
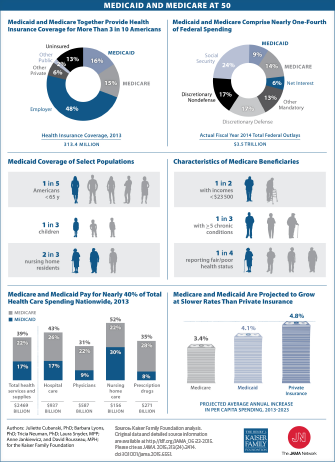
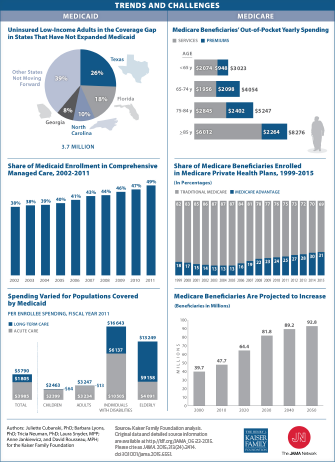
These Visualizing Health Policy infographics commemorate the 50th anniversary of the Medicaid and Medicare programs. This infographic provides details about the reach and demographics of the programs, as well as the Federal and total US health-care spending associated with them. This infographic illustrates trends and challenges going forward.
Together, Medicaid and Medicare provide health insurance coverage for more than 3 in 10 Americans. Medicaid serves a notable share of children, nursing home residents, and Americans younger than 65 years, while a significant share of Medicare beneficiaries are lower-income, have fair or poor health, or have multiple chronic conditions. Nearly 4 million uninsured, low-income adults remain in the coverage gap in states that have not expanded Medicaid under the Affordable Care Act, and the share of Medicaid enrollment in comprehensive managed care has increased. Meanwhile, the number of Medicare beneficiaries continues to increase, as does the share of beneficiaries enrolled in Medicare private health plans.
Visualizing Health Policy is a monthly infographic series produced in partnership with the Journal of the American Medical Association (JAMA). The full-size infographics, Medicaid and Medicare at 50 and Trends and Challenges, are freely available on JAMA’s website and are published in the print edition of the journal.


