To Switch or Be Switched: Examining Changes in Drug Plan Enrollment among Medicare Part D Low-Income Subsidy Enrollees
Introduction
Study Highlights
During the Medicare Part D annual enrollment period from October 15 to December 7, people on Medicare can review and compare stand-alone prescription drug plans (PDPs) and Medicare Advantage plans and switch plans if they choose. Low-income beneficiaries who receive premium and cost-sharing assistance through the Part D Low-Income Subsidy (LIS) program have a subset of premium-free PDPs (benchmark plans) available to them, but can also choose to enroll in a non-benchmark plan and pay a premium. Each year, the list of premium-free PDPs changes. When PDPs lose their premium-free status, the Centers for Medicare & Medicaid Services (CMS) automatically reassigns many of their LIS enrollees to another premium-free PDP; however, CMS does not reassign LIS enrollees who have chosen a plan other than their assigned PDP. LIS Part D plan enrollees, unlike non-LIS enrollees, are also permitted to switch plans at any time outside the annual enrollment period.
This analysis examines plan changes among LIS enrollees in PDPs between 2006 and 2010.1 About 58 percent of LIS PDP enrollees in 2010 were eligible for reassignment by CMS. The question of how many LIS enrollees change plans during the annual enrollment period when their plan loses benchmark status has both coverage and cost implications. Reassignment helps LIS enrollees maintain their premium-free PDP enrollment but also has the potential to disrupt coverage. At the same time, LIS enrollees who are not reassigned could pay higher premiums unless they choose another premium-free plan.
Key findings from this analysis are:
- Overall, LIS enrollees changed PDPs at a higher rate than non-LIS enrollees for the 2010 plan year (19 percent versus 11 percent), but the higher rate among LIS enrollees was primarily a result of reassignment to new plans by CMS.
- The 19 percent of LIS enrollees who changed plans for 2010 includes 15 percent who were reassigned by CMS and 4 percent who voluntarily switched to a new PDP—a significantly lower voluntary switching rate than the 11 percent rate among non-LIS enrollees.
- The pattern of plan changes for LIS enrollees—both voluntary switching and reassignments—varied considerably from year to year, primarily due to turnover in premium-free plan availability. A larger share of LIS enrollees were reassigned to new PDPs in 2008 and 2009 than in 2010.
- Among those LIS enrollees who were not eligible for reassignment by CMS and whose plans lost benchmark status for 2010, a relatively small share (14 percent) voluntarily switched during the annual enrollment period for 2010, despite being notified by CMS that they would face premiums if they did not switch plans.
- Most LIS enrollees who were reassigned by CMS accepted that assignment, but 10 percent of them either elected to stay in their current plan or chose a different plan than the one assigned by CMS.Nearly three-fourths of LIS beneficiaries who were continuously enrolled in stand-alone PDPs changed plans (either voluntarily switched or were reassigned) at least once over the five years from 2006 to 2010. By contrast, only one-third of non-LIS enrollees switched plans once or more over the same period. A larger share of LIS enrollees eligible for reassignment changed plans 2 or more times compared to those not eligible for reassignment (41 percent versus 18 percent).
- Among the relatively small share (14 percent) of LIS PDP enrollees who voluntarily switched out of a non-benchmark plan, most (90 percent) switched to a premium-free plan. Over time, LIS enrollees who are ineligible for reassignment and who have remained in non-benchmark plans have faced increasingly higher premiums.
The CMS policy for determining which LIS enrollees will be automatically reassigned attempts to balance the desire to ensure that LIS beneficiaries are not required to pay premiums and the desire to respect voluntary enrollment decisions made by some LIS beneficiaries. This policy has shielded many low-income beneficiaries from incurring premium costs for Part D coverage, but as our analysis shows, it has the potential to reduce the financial protection available through the LIS program for the share of LIS enrollees who have chosen their own plans.
Introduction and Background
The Medicare Part D Low-Income Subsidy (LIS) program helps reduce overall out-of-pocket costs for beneficiaries with low incomes, generally those with incomes of less than 150 percent of the federal poverty level and limited resources. LIS beneficiaries are entitled to premium-free coverage and significantly reduced cost sharing.2 In 2015, beneficiaries qualify for these subsidies if they are enrolled for Medicaid through Medicare Savings Programs or if they have incomes less than $17,655 and assets less than $13,640 (these amounts are $23,895 and $27,250, respectively, for couples). In 2015, 11.7 million Part D enrollees (30 percent of all Part D enrollees) were receiving the LIS; of this total 8.0 million (68 percent) were enrolled in stand-alone prescription drug plans (PDPs) and 3.7 million (32 percent) in Medicare Advantage drug plans (MA-PDs).3
During the Medicare Part D annual enrollment period, which runs from October 15 to December 7, all Medicare beneficiaries are encouraged to review and compare their options for the coming year and choose a plan that best meets their needs.4 Part D enrollees who receive the LIS are also permitted to switch plans at any time outside the annual enrollment period, while non-LIS enrollees may only switch plans outside the annual enrollment period in special circumstances.5
LIS enrollees may choose to enroll in any plan in their area, but the subsidy makes premium-free coverage available only from a designated set of PDPs with a premium amount below a specific benchmark.6 The benchmark amount in each area—and thus the subset of plans that are premium free for LIS enrollees—changes annually (see Appendix 2: Benchmark Plans).7 In the annual enrollment period for the 2008 plan year, for example, nearly one-third of all LIS beneficiaries were enrolled in premium-free PDPs in 2007 that would not be premium-free in 2008 or were exiting the Part D market entirely.8 If LIS enrollees remain in plans that lose benchmark status, they are exposed to higher costs unless they change to another zero-premium (benchmark) drug plan.
To help ensure that LIS enrollees avoid added premium costs as the availability of benchmark plans changes, CMS conducts a reassignment process each year (Figure 1). LIS enrollees whose current plan would charge them a premium for the coming year are eligible for reassignment only if they were assigned to that plan by CMS. CMS randomly reassigns these beneficiaries to one of the benchmark plans in their region.
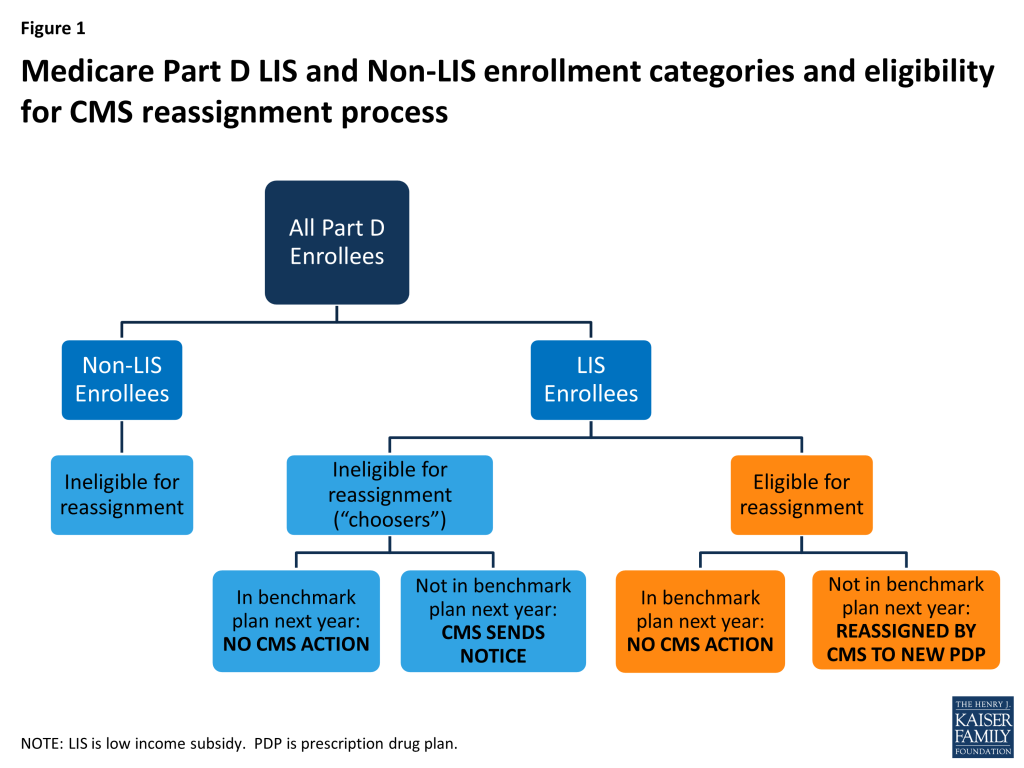
In contrast to LIS beneficiaries who are assigned by CMS, some LIS beneficiaries whose plans are losing benchmark status are in that plan because they actively chose it, either on their own or with the help of a counselor or a state program. These beneficiaries—referred to by CMS as “choosers”—are not eligible for reassignment as long as their current plan does not exit the market completely. CMS sends a notice to beneficiaries in this group if their current plan is scheduled to have a premium for LIS beneficiaries in the next year. The notice informs them of the premium-free options available to them and the steps required to switch to one of those plans.9
This analysis examines plan changes among LIS enrollees in stand-alone PDPs between 2006 and 2010. The question of how many LIS enrollees change plans during the annual enrollment period has both coverage and cost implications. Reassignment by CMS helps LIS enrollees maintain their premium-free PDP enrollment, but also has the potential to disrupt coverage. At the same time, LIS enrollees who are not reassigned could pay higher premiums unless they choose another premium-free plan.
Data and Methods
This analysis is based on data from a 5-percent random sample of Medicare beneficiaries, obtained from CMS, for each year from 2006 to 2010 (see Appendix 1: Study Methodology for more information on the datasets used and definitions of variables). The dataset includes information on the characteristics of beneficiaries and Part D plan information. We obtained an additional customized dataset from CMS that indicates whether or not LIS beneficiaries are eligible for reassignment by CMS in each month. Our analysis focuses on LIS beneficiaries who are enrolled in a PDP,10 who are eligible for a full premium subsidy,11 and who are not in an employer plan. We matched LIS PDP beneficiaries across years to build four samples of beneficiaries who met these criteria throughout each of four two-year periods (2006-07, 2007-08, 2008-09, and 2009-10) and one sample of LIS beneficiaries who were enrolled in PDPs throughout the entire five-year (2006-10) period. Between 6.5 million and 6.9 million LIS PDP enrollees are represented by samples of beneficiaries meeting the qualifications for the two-year periods—compared to a total of about 8 million LIS PDP enrollees. About 4.8 million continuously enrolled LIS PDP beneficiaries are represented by the five-year sample. We compare some of the results from this analysis of LIS enrollees with results for non-LIS enrollees published in our earlier report.12
We define a change of plans during the annual open enrollment period based on enrollment in a different plan in January of the second year, compared to December of the first year. We distinguish between plan changes that reflect voluntary plan switches by LIS enrollees and changes due to reassignment by CMS. We define plan changes at other points during the year based on enrollment in a different plan in a given month compared to the previous month. In general, we do not count plan changes under two circumstances: (1) an enrollee whose plan changes during the annual enrollment period, but for whom the old plan and the new plan are matched (“crosswalked”) by the plan sponsor, and the enrollee is automatically transferred from the old plan to the new plan; and (2) an enrollee whose plan exits the program without any matched plan and who therefore has to select a new plan to remain in Part D.
Key Findings
Key Findings
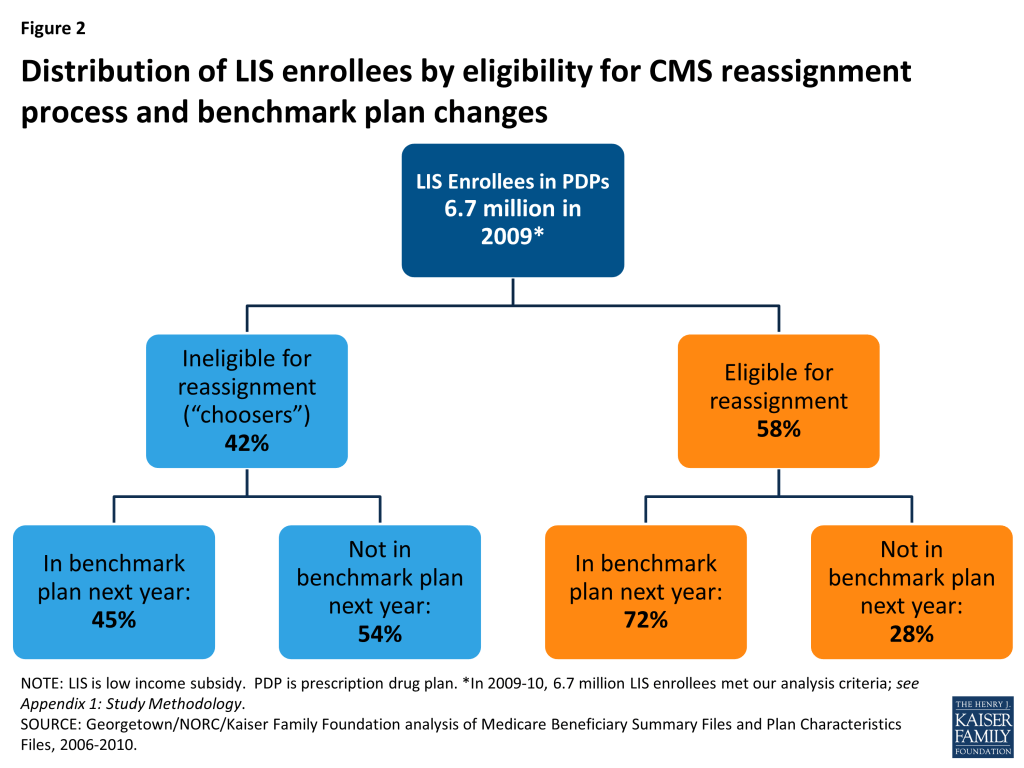
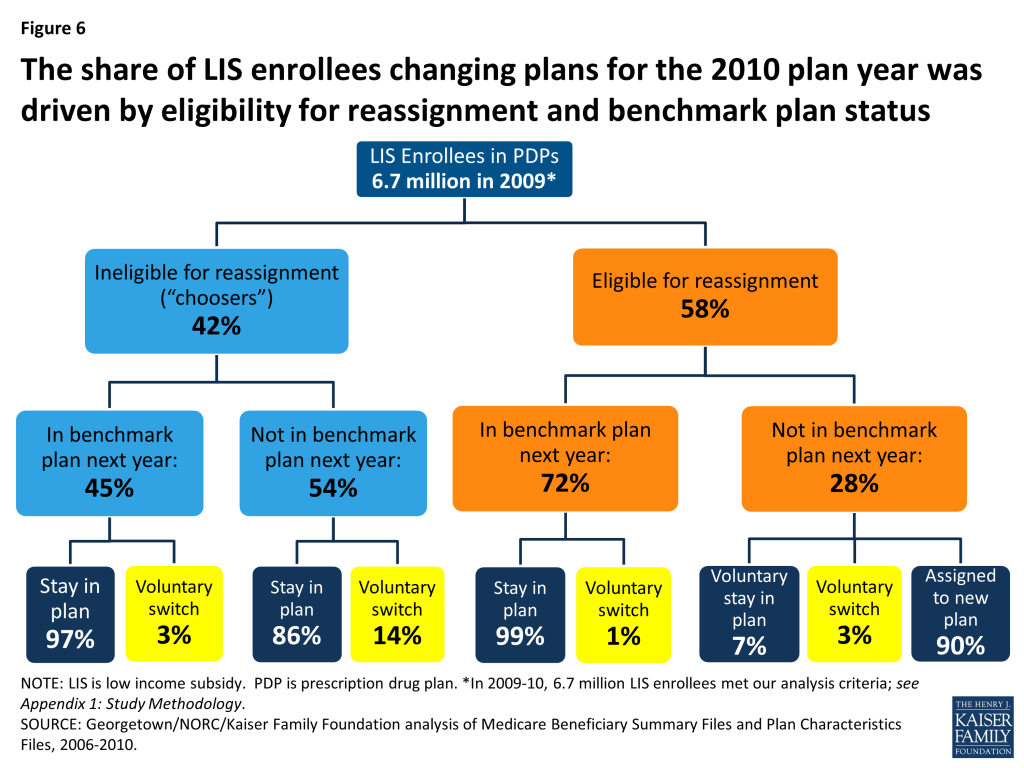
Of the LIS beneficiaries enrolled in PDPs at the end of 2009, a majority (58 percent) were eligible for reassignment to new PDPs by CMS in the event that their plan lost its premium-free (benchmark) status, while four in ten (42 percent) were not eligible for reassignment because they had voluntarily chosen to enroll in their current plan.
In December 2009, an estimated 3.9 million LIS beneficiaries in PDPs (out of about 6.7 million who met our analysis criteria) were eligible for reassignment to new PDPs by CMS if their plans no longer qualified as premium-free plans for 2010. The remaining 2.8 million LIS PDP beneficiaries were ineligible for CMS reassignment and were responsible for considering their own options for switching to new plans.
More than half (54 percent) of LIS enrollees ineligible for reassignment (“choosers”) were in PDPs losing benchmark status for 2010, compared to only 28 percent of LIS enrollees eligible for reassignment (Figure 2).13 In other words, most (72 percent) LIS enrollees eligible for reassignment were in PDPs maintaining their premium-free benchmark status for 2010, compared to less than half (45 percent) of LIS enrollees not eligible for reassignment. The implication of this is that a greater share of LIS enrollees not eligible for reassignment would have to take action if they wanted to receive premium-free Part D coverage.
The share of LIS beneficiaries eligible for reassignment was somewhat higher (70 percent) at the end of the program’s first year, but was fairly constant from December 2007 through the end of 2010 (Table 1). The share in this category appears to have stabilized as the numbers newly selecting a plan on their own are offset by the entry of new Part D enrollees being assigned to a plan for the first time.14
| Table 1: Distribution of Part D LIS PDP Enrollees, by Eligibility for Reassignment, 2006-2010 | |||||
| December 2006 | December 2007 | December 2008 | December 2009 | December 2010 | |
| Percent eligible for reassignment | 70% | 54% | 58% | 58% | 56% |
| Percent ineligible for reassignment | 30% | 46% | 42% | 42% | 43% |
| Number eligible for reassignment | 4.8 million | 3.5 million | 3.9 million | 3.9 million | 3.8 million |
| Number ineligible for reassignment | 2.1 million | 3.0 million | 2.8 million | 2.8 million | 2.9 million |
| TOTAL | 6.9 million | 6.5 million | 6.6 million | 6.7 million | 6.7 million |
| NOTE: LIS is low income subsidy. Estimates may not sum to totals due to rounding. Numerical counts are projected from the 5 percent sample and are smaller than the total number of LIS PDP beneficiaries because of sample exclusions and a small number of beneficiaries whose reassignment status could not be classified. The share of those eligible for reassignment may be somewhat understated, especially in 2007 and 2008, because of the incorrect assignment of enrollment status in the preliminary CMS dataset used in this study. See Appendix 1: Study Methodology.SOURCE: Georgetown/NORC/Kaiser Family Foundation analysis of Medicare Beneficiary Summary Files and Plan Characteristics Files, 2006-2010. | |||||
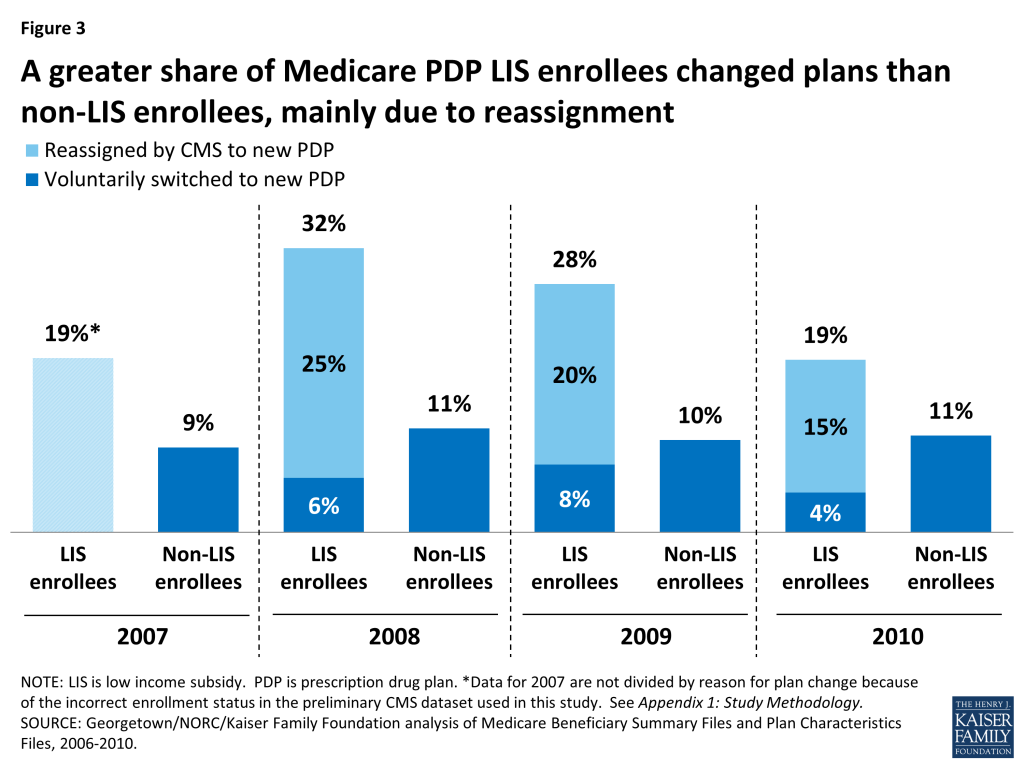
Overall, LIS beneficiaries in PDPs changed drug plans at a higher rate than non-LIS enrollees in 2010 (19 percent versus 11 percent), but this was primarily a result of assignment to a new plan by CMS rather than voluntary switching.
The 19 percent of LIS beneficiaries in PDPs who changed plans for 2010 includes 15 percent of LIS enrollees who were reassigned by CMS to new plans and 4 percent who switched plans voluntarily (Figure 3). Excluding plan changes resulting from the reassignment process, a much smaller share of LIS enrollees than non-LIS enrollees in PDPs switched plans on a voluntary basis (4 percent versus 11 percent). Factoring in plan changes resulting from the CMS reassignment process, however, results in a higher overall rate of plan changes among LIS enrollees in 2010.
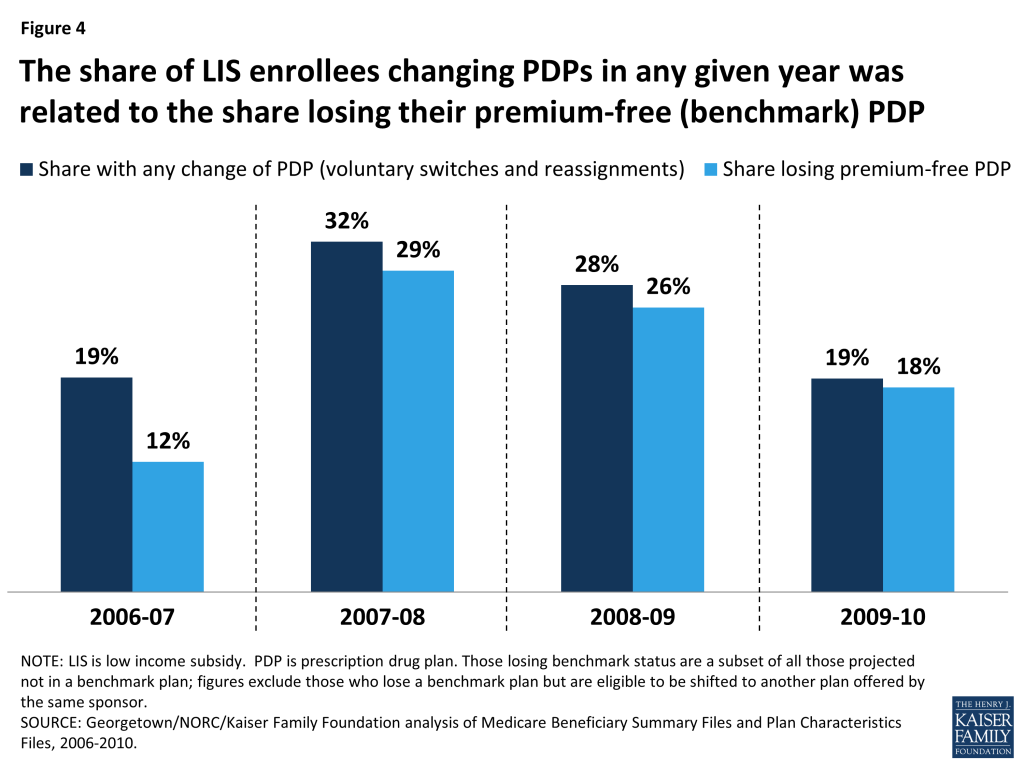
The pattern of voluntary switching and plan reassignments for LIS beneficiaries has varied considerably from year to year—especially the rate of being reassigned to new plans by CMS—due primarily to the changing availability of benchmark plans (Figure 4). Loss of premium-free (benchmark) plan status, resulting from the changing availability of benchmark plans, is the criterion used by CMS to reassign eligible LIS beneficiaries to new plans and is also likely a key factor in voluntary switching decisions by those LIS enrollees who are not eligible for reassignment because they have chosen their current plans. In our study period, 2008 had the highest rate of turnover in benchmark plan availability, and this year also had the highest combined rate of reassignment and voluntary switching among LIS beneficiaries.15 In 2008, one in three LIS beneficiaries (32 percent) were reassigned or switched to a new plan, compared to one in five in 2006 (20 percent) and 2010 (19 percent). 2008 also saw the greatest change in the availability of benchmark plans, affecting 29 percent of all LIS beneficiaries. By contrast, changing plan availability affected only 12 percent of LIS beneficiaries in 2007 and 18 percent in 2010 (see Appendix 1: Benchmark Plans for more information on benchmark plan availability).
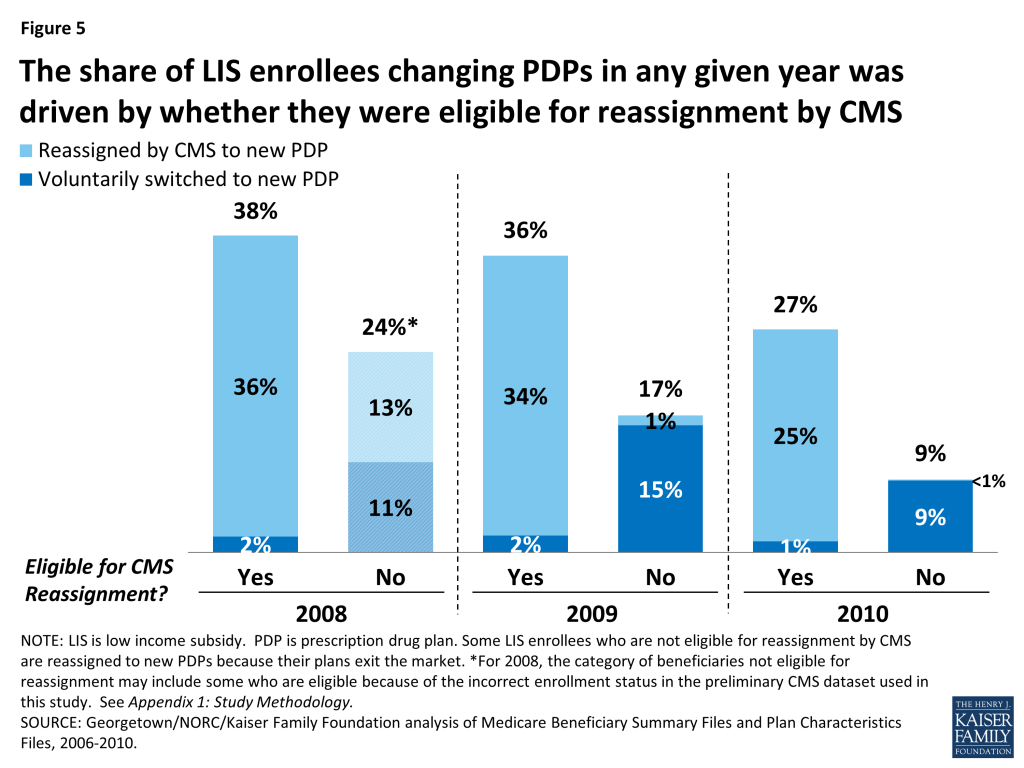
The share of LIS enrollees changing plans is higher among LIS beneficiaries who are eligible for reassignment to premium-free plans than among those who are not eligible for reassignment, who must make a voluntary decision to change plans (Figure 5). In 2010, three times as many LIS enrollees eligible for reassignment experienced a change of plans than LIS enrollees not eligible for reassignment; among the former group, 25 percent were reassigned to a new plan by CMS and 1 percent voluntarily chose a new plan, while among the latter group 9 percent voluntarily switched to a new PDP. Rates of changing plans were higher for both groups of LIS enrollees in 2008 and 2009, compared to 2010.16
Among the subgroup of LIS beneficiaries who were not eligible for reassignment and whose plans were losing benchmark status for 2010 (about one-fourth of all LIS enrollees in PDPs), few (14 percent) switched voluntarily during the annual enrollment period for 2010, despite receiving notices from CMS reminding them that they would face premiums if they did not switch plans. Most who were eligible for reassignment by CMS accepted that assignment.
Only 14 percent of those LIS beneficiaries who faced a premium payment for the next year and who were not eligible for reassignment by CMS voluntarily switched PDPs for 2010 (Figures 6 and 7). The remaining 86 percent of this group stayed in their current plan and paid a monthly premium, despite being eligible for premium-free coverage through benchmark plans.17 A higher share (22 percent) of LIS enrollees not eligible for reassignment voluntarily switched plans in 2009, consistent with greater turnover in benchmark plan availability that year.18

All beneficiaries not eligible for reassignment in 2009 or 2010 received a notice from CMS (referred to as a “chooser notice”) at the start of the annual enrollment period. The notice informed them that they were subject to paying a monthly premium for Part D coverage in the coming year if they remained in their current plan and stated the amount instructions on how to make a switch and listed all the available premium-free plans in their region. Despite this information, most beneficiaries in this situation maintained enrollment in their current plans and thus paid a premium.
Among the subgroup of LIS beneficiaries who were eligible for reassignment by CMS and who were not slated to be in a benchmark plan in 2010 (about 1 in 6 LIS enrollees in PDPs), the vast majority (90 percent) accepted their reassignment by CMS to a new plan (Figures 6 and 8). These LIS enrollees received a notice from CMS at the start of the annual enrollment period informing them that they would be reassigned to a new PDP chosen randomly among eligible benchmark plans and of their right to pick a different plan to ensure the best coverage of the drugs they take. Accepting the reassigned plan means changing from one plan to another; doing so ensures that these LIS enrollees will maintain their premium-free PDP coverage but typically means a change in formulary. The Affordable Care Act added a requirement that CMS send a second letter in December identifying which of the individual’s drugs are covered under the plan to which the beneficiary has been assigned, with another reminder that they can still elect a different plan.
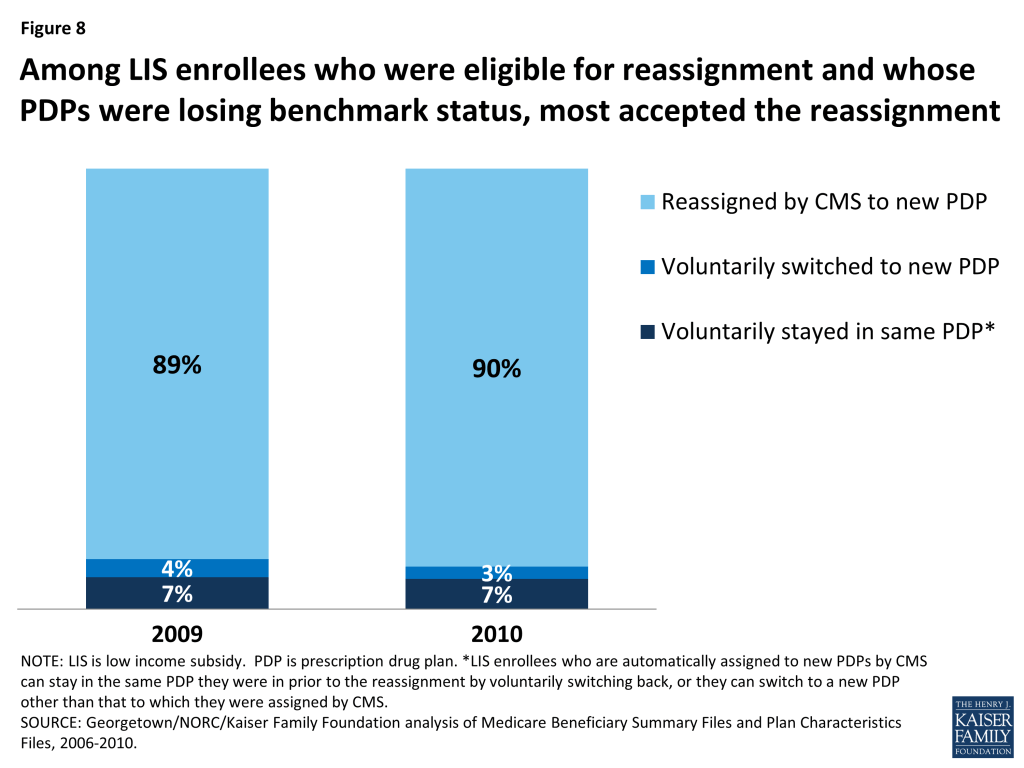
About 10 percent of LIS enrollees who received a reassignment notice exercised their right to make a voluntary enrollment decision for 2010 rather than accept the reassignment by CMS to a new plan: 3 percent selected a new plan other than the one to which they were assigned by CMS and 7 percent chose proactively to stay in their current plan even though it was losing benchmark status and would require paying a premium.19 As a result of their voluntary enrollment decisions, these LIS enrollees lost their eligibility for reassignment to new plans in future years.
Nearly three-fourths of LIS beneficiaries who were continuously enrolled in stand-alone PDPs changed plans (either voluntarily switched or were reassigned by CMS) at least once over the five years from 2006 to 2010. By contrast, only one-third of non-LIS enrollees voluntarily switched plans one or more times over the same period.
The 72 percent of LIS enrollees who changed PDPs at least once over the five-year period consists of 38 percent who experienced one plan change and 34 percent who had two or more plan changes (Figure 9).20 By contrast, far fewer (32 percent) non-LIS PDP enrollees made one or more voluntary plan switches between 2006 and 2010 (21 percent switched plans once and 11 percent switched plans two or more times).
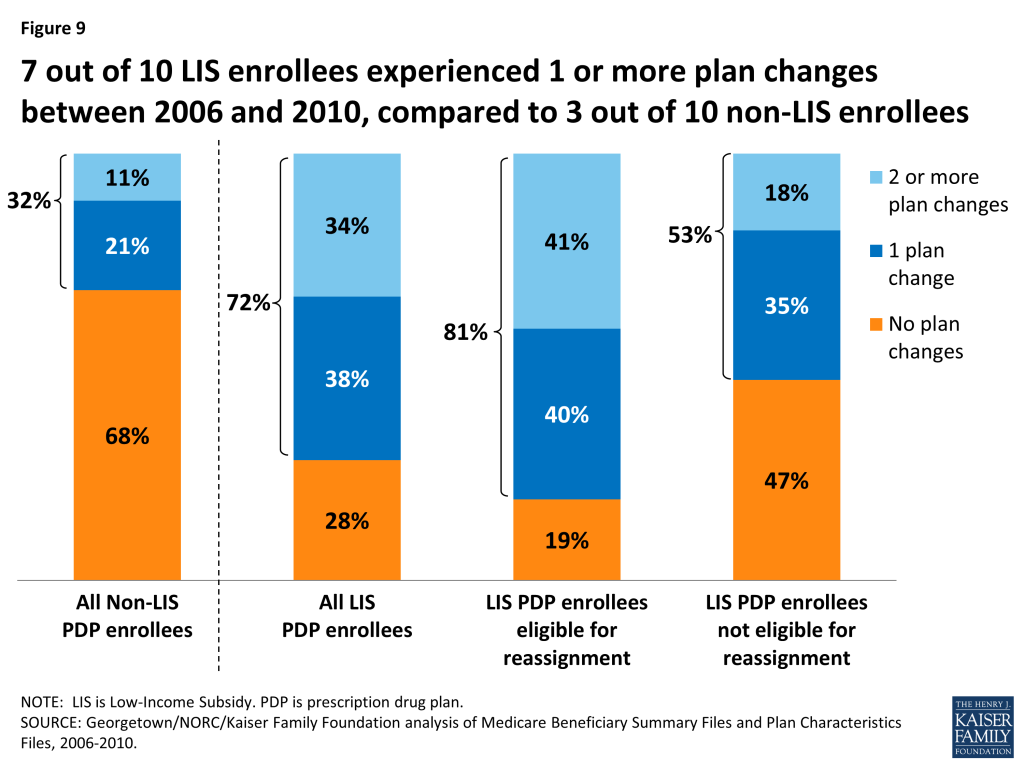
Among LIS enrollees, a larger share of those who were eligible for reassignment experienced two or more plan changes between 2006 and 2010, compared to LIS enrollees who were not eligible for reassignment (41 percent versus 11 percent). This higher rate is because those LIS enrollees who are eligible for reassignment will be automatically assigned to a new plan whenever their current plan loses benchmark status. Yet, despite the year-to-year turnover in benchmark plan availability, the share of LIS beneficiaries who experienced frequent plan changes is relatively small—only 3 percent changed plans four or more times (that is, at least once a year between 2006 and 2010).
LIS beneficiaries who are not eligible for reassignment were also more likely than non-LIS beneficiaries to change plans at least once over a five-year period between 2006 and 2010 (53 percent versus 32 percent). One possible explanation for this higher rate is that these LIS enrollees received a notice from CMS during the annual enrollment period informing them that their premium would increase if they stayed in their current plan. The notice also informed them about their eligibility for other plans that were premium free. Non-LIS enrollees do not receive similar targeted information from CMS. Some may also have benefitted from state-based programs that helped them chose a new plan. And some may have taken advantage of their right to switch plans outside of the annual enrollment period.
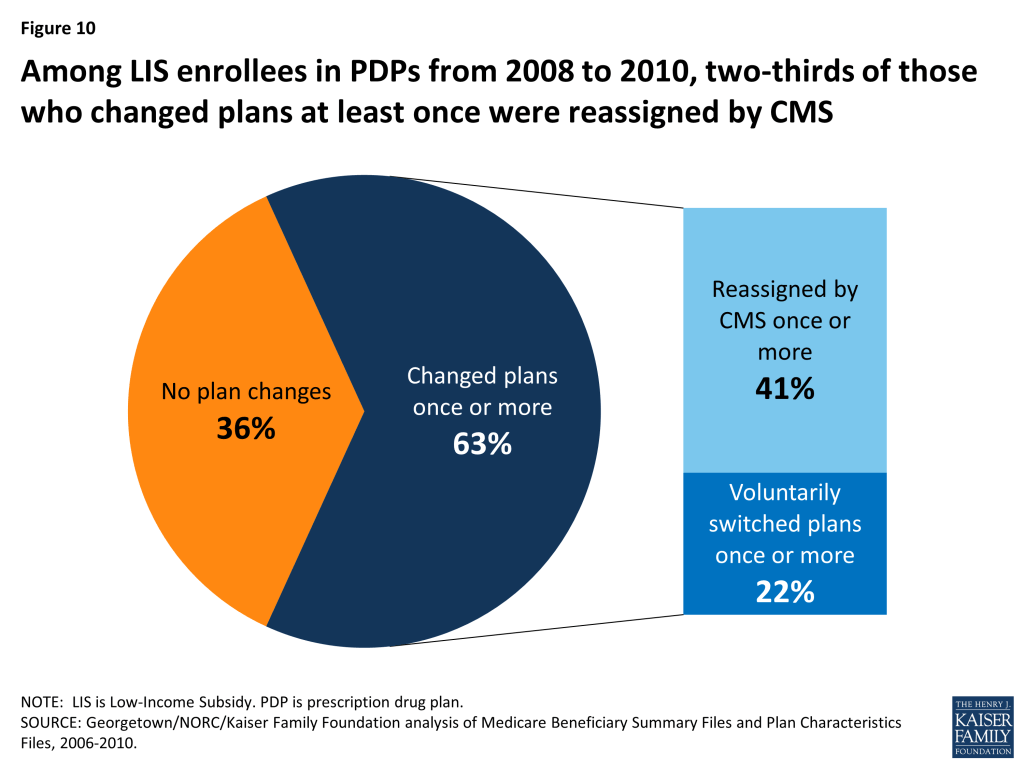
As was the case in any given year in our study period, reassignment by CMS was the main cause for plan changes among LIS enrollees continuously enrolled over a multiple-year period (Figure 10). The 63 percent of LIS beneficiaries who were continuously enrolled in PDPs from 2008 to 2010 who also experienced a change in plans at least once across the three-year period consists of 41 percent who changed plans as a result of a reassignment by CMS and 22 percent who voluntarily switched to a new plan.21
In any given year between 2007 and 2010, only a small share of LIS enrollees (no more than 4 percent) took advantage of their right to switch plans outside of the annual enrollment period.
Between February and December 2010, only 3 percent of LIS PDP enrollees switched to a different plan (Figure 11). All LIS beneficiaries have the right to switch plans at any time during the year, an option not available to non-LIS beneficiaries.22 But the average switching rate for LIS PDP enrollees outside the annual enrollment period was 0.3 percent per month, adding up to 3 percent to 4 percent of beneficiaries per year with a mid-year switch. LIS enrollees who were assigned to their current plan by CMS were less likely to switch to a different plan outside the annual enrollment period than those LIS enrollees who voluntarily selected their current plan.23 LIS beneficiaries were about twice as likely to switch plans in February and March, compared to later in the year. These higher switching rates most likely represent situations where beneficiaries responded to changes to either their plan assignments or plan features (such as formulary changes) that became effective in January after the annual enrollment period had ended. Although the rationale for these switches cannot be determined from administrative data, it is possible that beneficiaries encountered difficulties obtaining medications on their initial visits to the pharmacy after the plan changes were effective. In this case, some beneficiaries may find it easier to switch plans than to apply for a formulary exception or request a prior authorization.
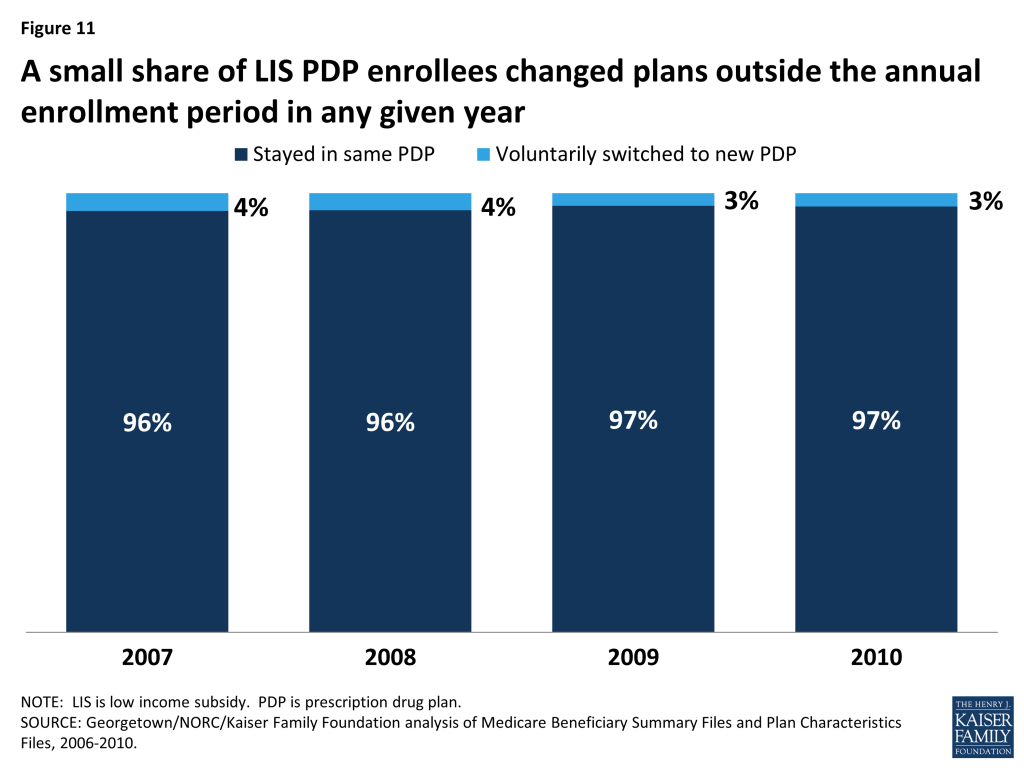
Over the period from mid-2006 to 2010, about 14 percent of continuously enrolled LIS PDP enrollees changed plans at least once outside the annual enrollment period. Although only a small share of LIS beneficiaries exercise their right to switch plans outside of the annual enrollment period in any one year, one in seven made such a switch at least once in a five-year period.24 Most of these beneficiaries had only a single plan change outside open enrollment between August 2006 and December 2010.25 The maximum number of plan switches outside the annual enrollment period by any LIS beneficiary in the sample was 10 switches.
After CMS sent a “nudge notice” in August 2010, about 5 percent of notice recipients changed plans. In June 2010, CMS mailed a notice to all LIS beneficiaries who were paying a premium advising them that other plan options were available for no premium. In August and September 2010, an estimated 36,000 beneficiaries (less than 0.5 percent of LIS beneficiaries, but about 5 percent of those receiving the notice) responded to this notice by switching plans, a rate modestly higher than in similar months.26 CMS repeated use of a reminder notice in May 2011, but did not send them in more recent years.
Among the relatively small share of LIS enrollees ineligible for reassignment who were in plans losing benchmark status and who voluntarily switched plans, a majority lowered their premiums by switching plans. Those LIS enrollees who are ineligible for reassignment and are enrolled in non-benchmark plans have been paying higher premiums over time.
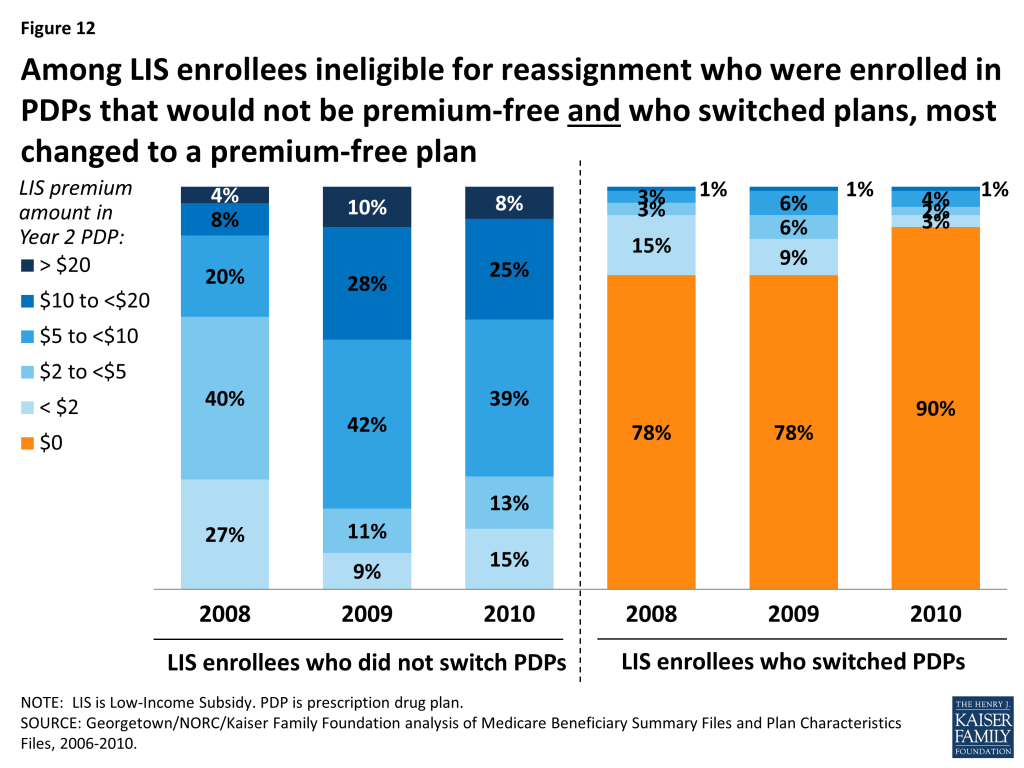
Among the LIS enrollees who were both not eligible for reassignment and enrolled in PDPs that would not be premium-free in 2010, 90 percent of those who voluntarily switched PDPs chose a premium-free plan (Figure 12). Only 5 percent selected a plan with a monthly premium of at least $5. By contrast, 72 percent of LIS enrollees who were both not eligible for reassignment by CMS and who stayed in a non-benchmark plan paid premiums of at least $5 per month in 2010, and one-third paid premiums of $10 or more as a result of staying in their same plan and not switching to a premium-free benchmark plan. Our previous study showed that the relatively few non-LIS enrollees who switched plans between 2006 and 2010 were more likely than those who did not switch to end up in a plan that lowered their costs.27 But the LIS enrollees who switched plans saved themselves money more often than their non-LIS counterparts. Many in both groups would have saved money on premiums by changing plans more often.28 By contrast, LIS beneficiaries who are eligible for reassignment are almost always switched into a new plan when it would lower their premium costs.29
LIS enrollees who are not eligible for reassignment and who remain in non-benchmark plans have tended to pay increasingly higher premiums over time. The share of LIS beneficiaries in non-benchmark plans (eligible for but not receiving Part D coverage for no premium) paying at least $10 a month increased from 12 percent to 33 percent between 2008 and 2010, despite the fact that all of these LIS enrollees had at least one premium-free plan available to them in their area.
Discussion
All LIS Part D beneficiaries have the opportunity to switch plans voluntarily both during the annual enrollment period and at other times of the year. In addition, beneficiaries who were assigned to their current plans by CMS may be reassigned to a new plan if their plan no longer qualifies as premium-free. In any one year, most LIS beneficiaries do not change plans—but due to reassignments, plan changes are much more common among LIS beneficiaries than among non-LIS beneficiaries.
For those not eligible for reassignment by CMS, the switching rate for LIS enrollees is similar to that for non-LIS beneficiaries and for enrollees in other health insurance programs, such as the health benefits offered to federal employees or workers in private firms that offer a choice of plans.30 It varies from year to year, in line with turnover in benchmark plan availability.
The switching rate among LIS enrollees not eligible for reassignment by CMS is lower than the 29 percent switching rate for marketplace enrollees who used the national healthcare.gov system created under the Affordable Care Act.31 This is notable because marketplace enrollees who did not shop for new plans were automatically re-enrolled in the same plan, regardless of whether they would receive the maximum subsidy available to them. There was no process for automatic reassignment to new plans like that which is in place for some Part D enrollees.
The CMS policy for determining which LIS enrollees will be automatically reassigned attempts to balance the desire to ensure that LIS beneficiaries are not required to pay premiums and the desire to respect voluntary enrollment decisions made by some LIS beneficiaries. Reassignments by CMS have shielded many low-income beneficiaries from incurring premium costs for Part D coverage, but the policy has the consequence of reducing the financial protection available through the LIS program for the share of LIS enrollees who have chosen their own plans. As our analysis shows, these LIS enrollees are less likely to change plans and thus more likely to pay a premium than the other 3.9 million (58 percent) LIS enrollees who were eligible for reassignment to another plan by CMS for 2010.
Impact on Part D LIS Enrollees
There are two main consequences for Part D LIS enrollees who do not reexamine their plan choices on a regular basis: they may be missing an opportunity to avoid premiums, and they may be enrolled in a plan that does not offer optimal coverage for their drugs. Turnover in the availability of benchmark plans increases both the risk that an LIS enrollee not eligible for reassignment will pay a premium and the risk that an LIS enrollee who is reassigned to a new plan will end up in a plan that does not provide the optimal coverage for her drugs.
The data available for this study do not allow an analysis of why LIS beneficiaries shop for new plans, only whether they actually elect to change plans. Possible reasons for not shopping include a preference for the status quo even if it means modestly higher costs, a concern that shopping for a plan is confusing and difficult, and a lack of awareness that switching could result in lower costs.32 Those who do compare their plan options still may not switch plans because their current plan best meets their needs even if it has a premium (based on the match between plan formularies and current drug needs), because they find available resources are inadequate for assessing plan differences, or they prefer not to “rock the boat.”
LIS Enrollees Not Eligible for Reassignment
The CMS approach to reassignment reduces the number of LIS beneficiaries who pay premiums, but the rules about qualifying for reassignment exclude those who voluntarily chose their current plan. The latter includes not only LIS enrollees who made a choice on their own but also those who chose their current plan on the advice of a counselor, a state pharmacy assistance program, or some other helper—help that may have occurred years earlier. To the extent that such assistance may no longer be available to these enrollees, CMS could consider helping a larger share of those now regarded as ineligible for reassignment.
Many LIS beneficiaries who are not eligible for reassignment by CMS are in plans that are not premium-free for LIS enrollees, meaning they are missing an opportunity to save money. In 2014, LIS beneficiaries not in premium-free plans paid an average of $17.85 per month in premiums, and 13 percent of those paying a premium paid more than $25 per month.33 Some LIS beneficiaries, however, may be choosing to pay a premium to get more of their drugs on formulary or fewer formulary restrictions. Administrative data do not allow us to determine whether these enrollees are in fact examining their options and making a deliberate choice to pay premiums, but it seems likely that many are not shopping on a regular basis—similar, in fact, to behavior among non-LIS enrollees. The CMS “chooser notices” do not appear to be inducing many of those who are scheduled to pay a premium to switch plans. While beneficiaries who get notices about their upcoming premium increase are more likely than non-LIS beneficiaries to change plans, most of those getting these notices do not make a change of plans. CMS may want to evaluate whether there are better ways to encourage shopping or to nudge enrollees into changing plans when appropriate, although one CMS test of a nudge notice failed to generate much response.
Our analysis finds that most LIS beneficiaries who voluntarily switched plans selected a plan with no premium. Other factors may have influenced their decisions as well, including the drugs available on plan formularies, restrictions on filling prescriptions such as prior authorization, availability of pharmacies in plan networks,34 plan quality ratings, or the general reputation of plans. Since cost sharing for LIS beneficiaries is by statute the same for all plans, out-of-pocket drug costs do not vary based on tier placement or whether a pharmacy offers preferred cost sharing but only if drugs are excluded from plan formularies.
LIS Enrollees Eligible for Reassignment
The circumstances are quite different for LIS beneficiaries who are eligible for reassignment, who represent a majority of all LIS beneficiaries. Depending on the year, CMS has reassigned between 500,000 and 2 million LIS beneficiaries to new plans to maintain their enrollment in premium-free plans. Between 2006 and 2010, most of these LIS enrollees accepted their reassignment. Although it is possible for some LIS beneficiaries to be reassigned to new plans from year to year, there has been less overall churning than might have been expected based on the number of plans that have lost benchmark status every year. According to our analysis, although 41 percent of LIS enrollees were reassigned two times out of the four enrollment periods between 2006 and 2010, only 3 percent were reassigned for four years in a row.
CMS makes reassignments to new plans on a random basis among available benchmark plans, a process which does not incorporate available information on enrollees’ use of drugs and pharmacies. Although this analysis did not consider which plan best meets a beneficiary’s needs, other work suggests that a system of beneficiary-centered assignment, including options of making assignments to enhanced plans with low premiums, could lower costs for beneficiaries and even for the government.35
Turnover in Benchmark Plan Availability
Our findings show that more beneficiaries change plans in years where there is greater turnover in the availability of benchmark plans. Although these changes usually lower overall costs for beneficiaries, there is also the potential for disruption resulting from different formularies, coverage restrictions, and administrative procedures. In recent years, CMS has adopted policies to reduce the annual turnover in benchmark plan availability. For example, the Affordable Care Act gave CMS the authority to allow LIS beneficiaries to remain in plans that miss benchmark status by a de minimis amount (usually $2 or less) without paying a premium—a policy that was tested on a demonstration basis in 2007 and 2008. In 2007, for example, one-fourth of all benchmark plans achieved that status through the de minimis policy. As a result, fewer reassignments were required. Other policies could increase the availability of benchmark plans, such as allowing LIS beneficiaries to enroll without a premium in enhanced plans that are below the benchmark.36
Lessons for the ACA
Subsidy-eligible marketplace enrollees are in a situation that partially resembles LIS enrollees, in that the value of their subsidy is maximized by enrolling in one of the lower-cost silver plans (similar to benchmark plans in LIS). In 2015, 29 percent of renewing marketplace enrollees switched plans on the federally facilitated marketplace, a substantially larger voluntary switching rate than among Part D LIS enrollees in the years we studied.37 Results varied in some of the state-based marketplaces. In Covered California, where premiums were relatively stable, only 6 percent of renewing enrollees switched plans,38 whereas 62 percent changed plans in HealthSource Rhode Island, where automatic renewal was not an option for consumers.39
Consumers who receive marketplace subsidies have higher incomes (always above 138 percent of the federal poverty line or FPL) than Part D LIS beneficiaries, nearly all of whom have incomes below 150 percent of FPL.40 However, the potential dollars at stake for consumers in the marketplaces tend to be much greater, since overall premiums for marketplace plans are much larger than premiums for stand-alone PDPs. Thus, the financial consequences of paying a premium could be greater for Part D LIS beneficiaries when considering premium payments as a share of income. Also, plan differences may matter more to marketplace enrollees. For example, plan networks may affect their relationships with all of their health care providers, not only pharmacies. And those who shop may find that marketplace plan networks are narrower overall than Part D pharmacy networks or Part D plan formularies, so that the risk of a poor match is greater.
The federally-facilitated marketplace and most state-based marketplaces implemented an automatic re-enrollment process for 2015 that allowed most people with coverage in 2014 to maintain that coverage in 2015, but the automatic renewal process did not necessarily obtain the coverage that maximized the value of the enrollees’ subsidy.41 In particular, the automatic renewal did not take into account the changes in premiums, and did not offer enrollees any equivalent of the Part D method for reassigning some beneficiaries to new plans. CMS issued a proposed rule that outlined some alternative approaches for the future, including the possibility of reassignments by the marketplaces. For reasons noted above, reassignment raises a more complex set of issues for plans that provide a full set of benefits than for plans that are limited to prescription drug coverage. Although CMS chose not to pursue this approach in its final rule, the agency indicated that it would welcome efforts by states to test such approaches. The experience of Part D LIS enrollees may offer insights into these options for the marketplaces, and the marketplace might offer some lessons for Part D.
The authors thank Christopher Powers at the Centers for Medicare & Medicaid Services for invaluable assistance with data acquisition.
Appendix
Appendix 1: Study Methodology
The analysis for this study is based on a 5-percent random sample of Medicare beneficiaries, obtained from the Centers for Medicare & Medicaid Services (CMS), for each year from 2006 to 2010. The sample dataset includes information on the characteristics of beneficiaries from the Master Beneficiary Summary File and Part D plan information from the Part D Plan Characteristics Files. Certain identifying information for both beneficiaries and drug plans, including the plan name, are encrypted. These standard CMS datasets were supplemented by a customized CMS dataset with supplemental data on the beneficiary enrollment decisions. The latter file was a preliminary version of a file being developed by CMS for use by researchers; the production version of the file has been recreated with the correct reassignment codes for 2007, but was not available in time for this study. The additional information in the customized dataset was essential to studying plan switching by LIS beneficiaries, some of whom are enrolled in new plans as a result of reassignments by CMS.
Defining LIS Status
Defining a sample of LIS beneficiaries has additional complexities because there are multiple versions of the Low-Income Subsidy and different ways to qualify. Medicare beneficiaries who qualify for full Medicaid benefits (dual eligibles), those enrolled in Medicare Savings Programs (e.g., Qualified Medicare Beneficiary (QMB), the Specified Low-Income Medicare Beneficiary (SLMB), Qualifying Individual (QI), or Qualified Disabled and Working Individuals (QDWI) programs), and those receiving Supplemental Security Income (SSI) are deemed eligible for the LIS and are not required to apply. Using data for December 2009, 87 percent of all LIS beneficiaries qualified in one of these ways (Table A1). Those with deemed coverage are all eligible for premium-free coverage provided they enroll in a benchmark plan. Some (11 percent of all LIS beneficiaries) are exempt from all cost sharing based on residence in a nursing facility or (starting in 2012) those receiving Medicaid home and community based services. Others with deemed coverage receive lower or higher copay levels, based on whether their incomes are below or above 100 percent of the federal poverty level (FPL). Other beneficiaries may apply for LIS status based on meeting income and asset requirements. About 10 percent of all LIS beneficiaries qualified via the application route for full LIS status, based on incomes up to 135 percent of the FPL. Applicants with incomes between 135 percent and 150 percent (who also meet asset requirements) qualify for partial LIS status (about 4 percent of all LIS beneficiaries), which provides different levels of premium support depending on incomes and limit cost sharing to 15 percent of a drug’s cost. For this study, we include only those partial LIS beneficiaries who qualify for full premium support. In total, the sample criteria include about 97 percent of all LIS beneficiaries.
| Table A1: Part D Low Income Subsidy Program Enrollment Status, as of December 2009 | |||||
| Code | Status | Premium | Cost Sharing | Percent of All LIS Enrollees | Included in Sample |
| 01 | Deemed; institutional residence | $0 | None | 10.7% | Yes |
| 02 | Deemed, <=100% FPL | $0 | Low | 55.0% | Yes |
| 03 | Deemed, >100% FPL | $0 | High | 20.9% | Yes |
| 04 | LIS, not deemed, <135% FPL | $0 | High | 9.8% | Yes |
| 05 | Partial LIS, >135% FPL | $0 | 15% | 0.9% | Yes |
| 06 | Partial LIS, >135% FPL | 25% | 15% | 1.0% | No |
| 07 | Partial LIS, >135% FPL | 50% | 15% | 0.9% | No |
| 08 | Partial LIS, >135% FPL | 75% | 15% | 0.7% | No |
| NOTE: LIS is low income subsidy. FPL is federal poverty level. | |||||
We also require that beneficiaries maintain full LIS premium support over the time period for any particular sample. Most beneficiaries (96.3 percent) had no change in their LIS status (full LIS, partial LIS, or not LIS) over a two-year period from January 2009 to December 2010. Of those who made some change, 3.3 percent had only a single change in status, while 0.4 percent had two or more changes. To understand the nature of the exclusions, we determined that in the same two-year period (2009-2010), only 1.6 percent of those with LIS status in January 2009 lost that status at least once in the next 23 months. Thus, a larger share of those without continuous LIS status consisted of beneficiaries who gained LIS status after January 2009, whether through applying or gaining Medicaid eligibility. Elsewhere we have discussed the fact that LIS eligibility assessments and reassessments may affect participation rates, since eligibility from one year to the next is not always automatic. Of those who were LIS in December 2009, our data show that 1.9 percent lost LIS status as of January 2010 (most redeterminations are due on the first of the year). One-third (31 percent) of that group then regained their LIS status by the end of 2010. It is possible that these LIS beneficiaries, excluded because of changes in their LIS status, may change plans more often than those with continuous LIS status.
Defining Two-Year and Five-Year Samples of LIS Beneficiaries
From the one-year samples for the five years that constituted the overall dataset, we matched beneficiaries across years to build a series of samples of beneficiaries who were enrolled in the Part D program for each of four two-year periods (2006-07, 2007-08, 2008-09, and 2009-10) (Table A2). To be included in a two-year sample, beneficiaries (1) must have been alive and enrolled in a non-employer Part D plan42 continuously throughout the two-year period (or from July 2006 in the case of the 2006-07 file);43 (2) must have been eligible for full-premium LIS support (codes 01-05 in Table A1) in all months for which they were enrolled in a drug plan; and (3) must have been enrolled in a PDP during the entire time they were enrolled in Part D.
| Table A2: Number of Part D Enrollees in Two-Year Samples, by Exclusion Criteria | ||||
| 2006-07 | 2007-08 | 2008-09 | 2009-10 | |
| Total in 5% sample | 2,431,158 | 2,475,122 | 2,519,634 | 2,565,873 |
| Part D enrollment, December of Year 1 | 1,307,391 | 1,380,897 | 1,444,534 | 1,500,204 |
| Part D enrollment, January of Year 2 | 1,354,075 | 1,424,688 | 1,479,202 | 1,521,299 |
| Total LIS enrollees continuously enrolled in Part D and with full-premium LIS status (including both PDP and MA-PD enrollment) | 424,099 | 408,442 | 421,140 | 432,989 |
| LIS beneficiaries in PDPs and not employer plans = final two-year samples | 345,824 | 324,986 | 332,901 | 335,057 |
| Projected total enrollment for this sample | 6.9 million | 6.5 million | 6.7 million | 6.7 million |
We also report in Table A2 the projected number of total LIS PDP enrollees who meet all the criteria for this analysis. These numbers are modestly lower than the actual numbers of LIS PDP enrollees due to the exclusions delineated above. Depending on the year, about 16 percent of LIS PDP enrollees are excluded from our analysis.
We built another sample of beneficiaries who were enrolled in the program for the entire 2006-2010 period (Table A3). To be included in the five-year sample, beneficiaries (1) must have been alive and enrolled in a non-employer Part D plan continuously from July 2006 through December 2010; (2) must have been eligible for full-premium LIS support during all these months; and (3) must have been enrolled in PDPs throughout all months of this time period. Of the sample that meets the first two criteria (continuous Part D enrollment with full-premium LIS support), 76 percent were in PDPs for five years (thus qualifying for the analysis sample), whereas 10 percent were in MA-PD plans for the entire five years, and 14 percent spent some time enrolled in each type of plan.
| Table A3: Number of Part D Enrollees in the Five-Year Sample(July 2006-December 2010) | |
| Description of Sample | Number |
| Total LIS enrollees continuously enrolled in Part D and with full-premium LIS status (includes both PDP and MA-PD enrollment) | 313,422 |
| Total LIS enrollees continuously enrolled only in PDPs and not employer plans with full-premium LIS status = final five-year sample | 239,221 |
| Projected total enrollment for this sample | 4.8 million |
For comparisons, we use a sample of those who are non-LIS beneficiaries for the entire analysis period, the same sample as in our earlier report.44 For the five-year file, the N is 586,897 for the full sample and 313,418 for the PDP-only sample. For the most part, non-LIS results are drawn from our previous report on switching by non-LIS Part D enrollees.
Defining Part D Enrollment Status
The Master Beneficiary Summary File identifies the plan in which a beneficiary is enrolled in any given month, but does not distinguish when the enrollment results from a beneficiary election as opposed to an assignment or reassignment by CMS. The supplemental file we received from CMS was created to capture from internal transaction files, for each month, the beneficiary enrollment code for the most recent enrollment transaction. The key enrollment codes in this file whether a beneficiary’s plan for a given months was the result of a beneficiary election (the beneficiary made an active choice of the plan), assignment by CMS (usually applied to the first time an LIS beneficiary was assigned to a plan), or reassignment by CMS (usually applied when an LIS beneficiary who reassigned to a new plan).45
Specifically, the enrollment status variable supplied by CMS defines, for each month during the analysis period, the “enrollment type” of the most recent change in enrollment (Table A4). The code is updated each time a new enrollment occurs. In January 2010, a “B” code means that a beneficiary selected a plan on her own either in the most enrollment period or the last time she changed plans. An “A” code means that the beneficiary remains in the same plan to which she was initially auto-enrolled by CMS. A “C” code captures facilitated enrollment, which have the same result as auto-enrollments. Facilitated enrollments are generally used for non-deemed LIS beneficiaries who are given the opportunity to enroll on their own before being assigned to a plan by CMS (deemed LIS beneficiaries are assigned to a plan, but retain the ability to switch to a plan on their own). These “A” and “C” codes are retained until the beneficiary is reassigned or selects a plan on her own, in which case her code would change to another code. An “H” code means that the beneficiary was reassigned by CMS to a different plan. Other codes identify less common situations, such as “E” or “F” codes (when the plan submits the auto-enrollment, generally in situations where one plan sponsor has multiple benchmark plans) or “D” codes (when a beneficiary is placed into a different plan as a result of a CMS-approved crosswalk, for example, when a sponsor consolidates existing plans). For most analytic purposes, the codes A, C, E, and F are combined as “A” for an initial CMS plan assignment. Where possible, beneficiaries with “D” codes (6 percent of the sample) are reassigned to the previous code, because a rollover election can occur to beneficiaries who elected their previous plan or were assigned to it. The few beneficiaries with “G” and “I” codes are combined as other and are generally excluded from tables that rely on enrollment status.
| Table A4: Low Income Subsidy Enrollment Status Codes | |||
| Code | Type of Enrollment | Percent of All LIS Enrolleesi | |
| A | Auto-enrolled by CMS (generally applies to dual eligibles) | 11.3% | 15.7% |
| C | Facilitated enrollment by CMS (generally applies to other LIS) | 4.4% | |
| E | Plan-submitted auto-enrollment | <0.1% | |
| F | Plan-submitted facilitated enrollment | <0.1% | |
| H | Re-assigned by CMS | 25.4% | 25.4% |
| B | Beneficiary election | 52.3% | 52.3% |
| D | Rollover election: plan change as a result of a crosswalk between plans offered by the same plan sponsor | 6.2% | 6.2% |
| I | Other plan-submitted enrollment | 0.3% | 0.3% |
| G | Enrollment by the point-of-service vendor that serves LIS beneficiaries who lack a plan | <0.1% | |
| TOTAL | 100% | 100% | |
| NOTE: iPercent of LIS enrollees as of December 2009. | |||
Defining Plan SwitchesThere is one significant limitation in the preliminary supplemental file available for this study. A substantial number of the reassignments by CMS that were effective in January 2007 were incorrectly coded in the transaction files as beneficiary elections. Thus, a beneficiary who was reassigned to a new plan effective January 2007 was coded “B” instead of “H.” Because codes are retained until the next transaction, the legacy of these incorrect codes continues through the end of the study period (December 2010), although its effect gradually diminishes over time. In the sample, about two-thirds of those eligible for reassignment and in a new plan in January 2007 are coded as if they selected the new plan, whereas in 2008 the similar share was 5 percent. Where noted in this report, certain results (especially for January 2007 or January 2008) are affected by this incorrect coding. CMS has recreated this file with the correct codes, but the new version was not available for this analysis.
For the LIS Part D enrollees in each two-year sample or the five-year sample, we define a year-end plan switch based on enrollment in a different plan in January of the second year, compared to December of the first year (plan elections and reassignments made at any time during the annual enrollment period are effective on January 1). Plan switches are further coded as either a switch by beneficiary choice or a switch by CMS assignment based on the enrollment status code for January. In a small number of cases, the type of switch cannot be determined.
We do not count year-end plan switches that are involuntary under the following two circumstances: (1) a plan enrollee whose plan (as designated by the contract ID and plan ID combination) changes, but where the old plan and the new plan are matched (“crosswalked”), and who accepts the automatic transfer to the crosswalked plan;46 and (2) any plan enrollee whose plan exits the program without any crosswalked plan and who therefore must select a new plan to remain in Part D.47
We also consider plan switches that occur outside the annual enrollment period, which include switches effective in any month other than January. For LIS beneficiaries, beneficiary elections may generally be made in any month. As with year-end switches, these switches are classified as either switches by beneficiary choice or switches by CMS assignment. The latter occur in several circumstances, such as when a beneficiary moves to a different region. Even beneficiaries who previously selected their own plans will be assigned to a plan by CMS if they do not select a plan in the new region. In addition, beneficiaries in a plan that exits the market in midyear are reassigned to a new plan if they do not select one. In 2010, one plan was excluded from the program, resulting in the reassignment of its enrollees. Tables in this report that show rates of plan switching outside the annual enrollment period exclude those reassigned to new plans, whereas tables showing total plan changes over five years include both types of switches outside the annual enrollment period.
Other Methods Considerations
Because the switching analysis presented here is based on individual decisions, the sample of beneficiaries for the analysis of each two-year file excludes newly eligible beneficiaries, beneficiaries who died during the relevant time period, and others who did not participate in Part D in both years. In addition, this analysis excludes from the estimate of switching rates various types of involuntary switches. As a result, the results reported here cannot be used to project the total net enrollment change from one year to the next. The net enrollment change is a product of how many people switch plans voluntarily, those who switch involuntarily as a result of plan exits, new enrollees to Part D, and those who have died or disenrolled from Part D.
The encryption of plan identifiers imposes some limitations on our study. Some plan sponsors operate under multiple contract numbers, often because they acquire the contract number from another plan sponsor through a corporate merger or acquisition. As a result, we cannot reliably distinguish between switches within plans offered by the same sponsor and those across plan sponsors. In addition, the use of encrypted plan identifiers makes it difficult to analyze plan characteristics that are not reported in the plan characteristics files.
In addition, the study is limited to the plan and beneficiary characteristics in the Medicare Beneficiary Summary File. We did not obtain for this study the prescription drug events (claims) for beneficiaries or claims from Medicare Parts A and B. Thus, we cannot calculate beneficiary risk scores or use measures of drug spending or other Medicare spending beyond the summary measures available in the Master Beneficiary Summary File.
Appendix 2: Benchmark Plans
LIS beneficiaries may choose to enroll in any plan, but premium-free coverage is only available from a designated set of “benchmark” plans that change annually.48 Each year, the benchmark is calculated separately for each of the 34 PDP regions based on the enrollment-weighted average premium bid submitted by stand-alone PDPs and MA-PDs or is set at the premium of the lowest-cost stand-alone PDP if no plan has a premium below the average. This average is a weighted average of premiums for PDPs and most MA-PD plans for the basic Part D benefit. Thus premiums corresponding to enhanced benefits are excluded, as are the value of any Part A/B rebate used by MA-PD plans. The weight for each PDP and MA-PD plans is based on the number of LIS beneficiaries enrolled in each plan.
In certain years, Part D sponsors have been permitted to waive a de minimis amount of the premium above the LIS benchmark for an LIS enrollee ($2 in 2007, $1 in 2008, and $2 in 2011 and thereafter) in order to retain enrollees in their premium-free status from the prior year. The de minimis policy was instituted by CMS on a demonstration basis for 2007 and 2008; it was made permanent by the Affordable Care Act, effective in 2011 (CMS has designated the amount as $2 each year). Plans may volunteer to waive the portion of their monthly premium that is a de minimis amount above the benchmark for eligible individuals, and thus CMS will not reassign enrollees away from these plans.
The availability of premium-free coverage for LIS Part D enrollees fluctuates from year to year, potentially exposing Part D LIS enrollees to higher costs unless they change to another zero-premium (“benchmark) drug plan.49 The total number of benchmark plans offered peaked at 640 in 2007 and dropped as low as 307 in 2010. Only 65 plans, however, retained benchmark status over the entire period from 2006 to 2010. Table A5 identifies on a national basis the number of benchmark plans available each year, as well as the how many of those plans lost benchmark status for the following year.
| Table A5: Availability of Part D LIS Benchmark Plans and Changes over Time, 2006-2010 | |||||
| Annual enrollment period | 2006-07 | 2007-08 | 2008-09 | 2009-10 | 2010 |
| Number of benchmark plans in Year 1 | 409 | 640* | 495** | 308 | 307 |
| Net change in benchmark plans, Year 1 to Year 2 | +231* | -145** | -187 | -1 | NA |
| Number of plans losing benchmark status, Year 1 to Year 2 | 90 | 240 | 218 | 93 | NA |
| Percent of plans losing benchmark status, Year 1 to Year 2 | 22% | 38% | 44% | 30% | NA |
| Number of enrollees in plans losing benchmark status, Year 1 to Year 2 | 1.6 mil | 3.7 mil | 2.5 mil | 1.5 mil | NA |
| Percent of enrollees in plans losing benchmark status, Year 1 to Year 2 | 20.0% | 46.1% | 31.8% | 18.4% | NA |
| Percent of enrollees in plans losing benchmark status, Year 1 to Year 2 (adjusted for other plans from sponsor) | 11.7% | 28.9% | 25.6% | 18.4% | NA |
| NOTE: NA = Not applicable for this study. mil is million.* Amount includes 157 plans qualifying in 2007 through the de minimis policy. Otherwise, there would have been 483 benchmark plans in 2007, up 74 from 2006.** Amount includes 53 plans qualifying in 2008 through the de minimis policy. Otherwise, there would have been 442 benchmark plans in 2007, down 198 from 2007. | |||||
The year-to-year variation has been substantial. Between 2007 and 2008, the number of benchmark plans rose by 50 percent, but at the same time, over one-third of the benchmark plans in 2007 lost that status for 2008. A similar number of plans lost their benchmark status between 2008 and 2009, but the total number of benchmark plans decreased. The high volatility in these two years probably represents several factors, including strategic decisions by some large plan sponsors around the structure of their plan offerings and the level of premiums charged by different plans. In later years, various rules and guidelines from CMS have reduced somewhat the volatility in the market for benchmark plans.
The volatility in the availability of benchmark plans has differed by plan sponsor and by region. For example, benchmark plan offerings by UnitedHealth, the program’s largest plan sponsor, dropped from 34 regions to 10 regions and rose back to 25 regions between 2007 and 2009. Humana, the second largest plan sponsor, had benchmark plans in all 34 regions in 2007, but had no benchmark plans in 2009 and only three in 2010.
All LIS enrollees in the plans losing benchmark status are subject to paying a premium the next year, but some of them are eligible for reassignment to a new benchmark plan during the annual enrollment period. Table A5 shows how many LIS beneficiaries are in plans losing benchmark status across the period studied for this report. The largest number of beneficiaries affected came in 2008, when nearly half of all LIS beneficiaries enrolled in PDPs were affected. One complicating factor has been the reorganization by many plan sponsors of their overall array of plan offerings (for some, partly in response to acquisitions of other plan sponsors). Thus, some benchmark plans were effectively replaced by other offerings of the same sponsor.50 The share of LIS beneficiaries affected in 2008 is reduced considerably (from 46 percent to 29 percent) if we exclude situations where another benchmark plan option is available from the same sponsor. However, these transfers between plans may not occur automatically.
Endnotes
- A similar analysis of switching for non-LIS Part D enrollees is found in our earlier report. Jack Hoadley et al., “To Switch or Not to Switch: Are Medicare Beneficiaries Switching Drug Plans to Save Money?” October 2013. https://modern.kff.org/report-section/to-switch-or-not-to-switch-issue-brief/. ↩︎
- Most beneficiaries are deemed automatically eligible for the LIS based on being enrolled in both Medicare and Medicaid (or receiving benefits from Supplemental Security Income as well as Medicare). See Appendix 1: Study Methodology for more information. ↩︎
- In 2010 (the end of the period covered in this study), a somewhat larger share of Part D enrollees qualified as LIS beneficiaries: 9.9 million beneficiaries or 36 percent of all Part D enrollees. The share of LIS beneficiaries in PDPs (81 percent) was somewhat higher in 2010 than in 2015. The decline in the share of LIS beneficiaries from 2010 to 2015 is partly a result of employers transferring their retirees into Part D plans, thus increasing the total number of Part D enrollees, as well as growing enrollment in LIS Medicare Advantage enrollment through the Financial and Administrative Alignment Demonstration for Dual Eligible Beneficiaries (308,000 as of April 2015). ↩︎
- In the program’s first five years (2006 to 2010), annual enrollment periods ran from November 15 to December 31. Starting in 2011 for enrollments effective in 2012, the dates were moved earlier in the year to ensure that coverage could be effective on January 1 of the next year. ↩︎
- Examples of such circumstances are if the enrollee moves outside the plan’s service area or if the plan changes its contract with Medicare in certain ways. ↩︎
- Each year, the amount of the benchmark is calculated separately in each of the 34 PDP regions based on the enrollment-weighted average premiums submitted by stand-alone PDPs and MA-PDs, or is set at the premium of the lowest-cost stand-alone PDP if no plan has a premium below the average of PDP and MA-PD premiums. ↩︎
- Although LIS beneficiaries must be enrolled in a benchmark plan to avoid paying a premium, they have lower cost sharing and no coverage gap even if enrolled in a non-benchmark plan. ↩︎
- Additional LIS beneficiaries were in plans losing their benchmark status in 2008, but were transferred to other plans offered by the same plan sponsor – resulting in less disruption than if reassigned to a plan offered by a different sponsor. ↩︎
- These so-called chooser notices were not sent for the annual enrollment period at the end of the program’s first year; the practice was initiated in the fall of 2007 for the 2008 plan year. In this first round of notices, only those who had no premium liability when they joined their plan, but were subject to a premium in 2008, received this notice. In later years, all LIS beneficiaries who were subject to a premium in the next year have received notices. ↩︎
- Beneficiaries enrolled in Medicare Advantage drug plans are excluded because the enrollment dynamics and factors affecting plan switches are different for these two segments of the program and because CMS does not reassign LIS beneficiaries to Medicare Advantage plans. ↩︎
- There are different types of LIS assistance available in Part D. Beneficiaries who qualify because they are full-benefit dual eligibles or are enrolled in the Medicare Savings Program and those who qualify with incomes below 135 percent of the federal poverty level (FPL) and assets below specified levels pay no premiums if enrolled in a benchmark plan. Other beneficiaries with incomes between 135 percent and 150 percent of FPL qualify for partial subsidies and are generally excluded from the analysis. See Appendix 1: Study Methodology for more information on these other groups. ↩︎
- These results are generally taken from our previous report. Jack Hoadley et al., “To Switch or Not to Switch: Are Medicare Beneficiaries Switching Drug Plans to Save Money?” October 2013. https://modern.kff.org/report-section/to-switch-or-not-to-switch-issue-brief/. In a few cases, we recalculated results from that report to match the particular definitions used in this report (noted in footnotes). ↩︎
- The share of those eligible for reassignment was calculated from the subset of full-subsidy LIS beneficiaries who were enrolled continuously in PDPs for any particular two-year period. ↩︎
- See Appendix 1: Study Methodology for an explanation of the coding inconsistencies in the data with regard to beneficiaries’ enrollment status. ↩︎
- For plan changes effective in January 2007, the CMS preliminary dataset made available for this project did not include information on whether the changes resulted from beneficiary elections or CMS reassignments (see Appendix 1: Study Methodology). ↩︎
- The rate of reassignments was also lower in 2007 (not shown in Figure 4). Most reassignments to new plans made by CMS effective in January 2007 were incorrectly coded as beneficiary elections in the preliminary file available for this analysis. Thus we cannot classify 2007 plan changes as reassigned or voluntary. In addition, some beneficiaries are incorrectly classified as not eligible for reassignment in December 2007 (and to a lesser degree in later years) because they look as if they voluntarily chose their 2007 plan. As a result, the rate of changing plans for 2008 is artificially high for the “not eligible for reassignment” group. In other words, nearly all the 13.2 percent shown as reassigned (as well as some who were not reassigned) likely belong in the “eligible for reassignment” group. As a result, the rate of changing plans may also be affected for the “eligible for reassignment” group. See Appendix 1: Study Methodology. ↩︎
- A small number of those not eligible for reassignment to a new plan (0.2 percent in 2010 and 1.9 percent in 2009) were in fact assigned to a new plan by CMS, in most cases because their plan had exited from the market and no comparable plan was available from the same plan sponsor. ↩︎
- Figures are not shown for 2007 or 2008 because of the incorrect coding in January 2007 in the preliminary file available for this analysis. In addition, some switches recorded as voluntary (especially in January 2007) may have been switches between different plans offered by the same plan sponsor; these switches may have been facilitated by the plan sponsor and accomplished with minimal input from plan enrollees. See Appendix 1: Study Methodology. ↩︎
- These findings are consistent with those from an evaluation of the transition process between 2007 and 2008, which indicated that among the 1.9 million LIS beneficiaries who received letters from CMS indicating that they would be reassigned if they did not choose a new plan, only 10 percent acted on the letter and made a choice. The other 90 percent were randomly reassigned to new plans for 2008. Grecia Marrufo et al., “Evaluation of the Medicare Demonstration to Transition Enrollment of Low Income Subsidy Beneficiaries,” Acumen, LLC, June 2009, http://www.cms.gov/reports/downloads/Marrufo_PartD_LIS_2009.pdf. ↩︎
- We count changes in plan enrollment starting in August 2006 in order to avoid the effects of the first annual enrollment period, which was open until May 15, 2006, with late enrollments effective in June 2006. We excluded July 2006 to allow the possibility that some enrollments in the annual enrollment had a delayed effective date in July. ↩︎
- This comparison is restricted to the three-year period from 2008 to 2010 to avoid complications resulting from the incomplete coding for January 2007 in the preliminary file available for this analysis. ↩︎
- In this analysis, we excluded switches outside the annual enrollment that were accomplished as reassignments by CMS. These mostly occur in situations where a beneficiary moves to a different PDP region, thus triggering a special enrollment period. ↩︎
- In 2010, 1.4 percent of those who were assigned to their current plan elected a new plan between February and December compared to 5.1 percent of those who chose their prior plan. Rates were similar in 2008 (2.7 versus 5.5) and 2009 (1.5 versus 4.7). ↩︎
- This total also includes some plan changes resulting from specific circumstances such as moving to another state. Other circumstances include one instance in 2010 were a PDP contract was terminated and its enrollees were assigned to other PDPs or chose one on their own. ↩︎
- The period of investigation for switching outside of the annual enrollment period starts in enrollment with enrollment decisions effective August 2006 in order to exclude all switches during the longer annual enrollment period in the program’s first year. The 14.4 percent changing plans at least one time includes 3.7 percent who did so two or more times. ↩︎
- During the last half of 2010, the share of LIS beneficiaries in PDPs who made a voluntary switch of plans in any month was generally about 0.2 percent. In August 2010, plan switches were effective for 0.6 percent of LIS beneficiaries in PDPs (and about 0.3 percent in September). These shares project to about 30,000 LIS beneficiaries responding to the “nudge notice” in August and another 6,000 in September. ↩︎
- Jack Hoadley et al., “To Switch or Not to Switch: Are Medicare Beneficiaries Switching Drug Plans to Save Money?” October 2013. https://modern.kff.org/report-section/to-switch-or-not-to-switch-issue-brief/. ↩︎
- Neither of these analyses of premium costs fully account for the fact that some beneficiaries may face quite different costs for the set of drugs that they take in one plan compared to another, including both whether their drugs are on formulary and any variations in cost sharing for non-LIS beneficiaries. In some cases these cost-sharing differences may be enough to offset premium savings. ↩︎
- In this analysis, beneficiaries are classified whether they were eligible for reassignment as of the start of the measurement period (August 2006). Because some switch classifications over time, mostly from eligible to not eligible, this approach may weaken the differences. But it also has the advantage of mostly avoiding the impact of the misclassification issue in January 2007. ↩︎
- Adam Atherly, Curtis S. Florence, and Kenneth E. Thorpe, ‘‘Health Plan Switching among Members of the Federal Employees Health Benefits Program,’’ Inquiry 42(3): 255–65, 2005. Peter J. Cunningham, “Few Americans Switch Employer Health Plans for Better Quality, Lower Costs,” NIHCR Research Brief No. 12, Center for Studying Health System Change, January 2013. ↩︎
- Health Insurance Marketplaces 2015 Open Enrollment Period: March Enrollment Report, March 10, 2015. http://aspe.hhs.gov/health/reports/2015/MarketPlaceEnrollment/Mar2015/ib_2015mar_enrollment.pdf. ↩︎
- Elizabeth Hargrave, Bhumika Piya, Jack Hoadley, Laura Summer, and Jennifer Thompson, “Experiences Obtaining Drugs under Part D: Focus Groups with Beneficiaries, Physicians, and Pharmacists,” Contractor report submitted to the Medicare Payment Advisory Commission, March 2008. http://www.medpac.gov/documents/contractor-reports/May08_PartDFocusGroup_CONTRACTOR_JS.pdf. Gretchen Jacobson, Christina Swoope, Michael Perry, and Mary C. Slosar, How are Seniors Choosing and Changing Health Insurance Plans? https://modern.kff.org/medicare/report/how-are-seniors-choosing-and-changing-health-insurance-plans/. ↩︎
- Jack Hoadley et al., “ Medicare Part D in Its Ninth Year: The 2014 Marketplace and Key Trends, 2006-2014,”August 2014, https://modern.kff.org/medicare/report/medicare-part-d-in-its-ninth-year-the-2014-marketplace-and-key-trends-2006-2014/. ↩︎
- Most plans include at least 90 percent of all pharmacies in their networks, so pharmacy availability is usually not an issue. Even though there has been a rise in plans’ of pharmacy tiers with different cost-sharing levels, LIS beneficiaries pay the same cost sharing regardless of pharmacies’ network status. ↩︎
- Laura Summer, Jack Hoadley, and Elizabeth Hargrave, “The Medicare Part D Low-Income Subsidy Program: Experience to Date and Policy Issues for Consideration,” Kaiser Family Foundation, September 2010,” available at https://modern.kff.org/medicare/issue-brief/the-medicare-part-d-low-income-subsidy/. Jack Hoadley et al., “The Role of Beneficiary-Centered Assignment for Medicare Part D,” contractor report for MedPAC, June 2007, http://www.medpac.gov/documents/contractor-reports/June07_Bene_centered_assignment_contractor.pdf Jack Hoadley, Elizabeth Hargrave, Katie Merrell and Laura Summer, “Beneficiary-Centered Assignment and Medicare Part D,” presentation to MedPAC, September 4, 2008, https://georgetown.app.box.com/s/rg9g4wzpqs3drcs5fc1taxtahxopno1d. Yuting Zhang, Chao Zhou, and Seo Hyon Baik, “A Simple Change To The Medicare Part D Low-Income Subsidy Program Could Save $5 Billion,” Health Affairs 33(6):940-945, June 2014. ↩︎
- Laura Summer, Jack Hoadley, and Elizabeth Hargrave, “The Medicare Part D Low-Income Subsidy Program: Experience to Date and Policy Issues for Consideration,” Kaiser Family Foundation, September 2010,” available at https://modern.kff.org/medicare/issue-brief/the-medicare-part-d-low-income-subsidy/. ↩︎
- The 29 percent is a share of all enrollees who renewed coverage, regardless of whether they received a subsidy, but overall 87 percent of all enrollees in the federal marketplace were eligible for subsidies. “Health Insurance Marketplaces 2015 Open Enrollment Period: March Enrollment Report,” Department of Health and Human Services, ASPE Issue Brief, March 10, 2015, http://aspe.hhs.gov/health/reports/2015/MarketPlaceEnrollment/Mar2015/ib_2015mar_enrollment.pdf. ↩︎
- http://news.coveredca.com/2015/01/covered-california-has-taken-steps-to.html. ↩︎
- http://www.healthsourceri.com/press-releases/healthsource-ri-releases-enrollment-demographic-and-volume-data-through-february-23-2015/. ↩︎
- Marketplace consumers with incomes in the range of Part D LIS beneficiaries do not qualify for marketplace subsidies, but should qualify for Medicaid in the states that have enacted Medicaid expansions. ↩︎
- Sabrina Corlette, Jack Hoadley, and Sandy Ahn, “Marketplace Renewals: State Efforts to Maximize Enrollment into Affordable Health Plan Options,” Robert Wood Johnson Foundation, December 2014, http://www.rwjf.org/en/library/research/2014/12/marketplace-renewals–state-efforts-to-maximize-enrollment-into-.html. ↩︎
- We exclude any enrollees in plans that are open exclusively to beneficiaries who are former employees of a particular employer or union. In 2010, only 0.4 percent of LIS beneficiaries were in employer plans. ↩︎
- The continuous enrollment criterion for the 2006-07 file allows inclusion of beneficiaries who entered the program during the full annual enrollment period for 2006, which extended from November 15, 2005 until May 15, 2006. ↩︎
- Jack Hoadley et al., “To Switch or Not to Switch: Are Medicare Beneficiaries Switching Drug Plans to Save Money?” October 2013. https://modern.kff.org/report-section/to-switch-or-not-to-switch-issue-brief/. ↩︎
- The supplemental file included two other variables: the date of this most recent enrollment type and the history of enrollment types for the month in which the decision was made. Thus, if a beneficiary is randomly reassigned, then picks a plan on her own, and then changes her mind and picks another plan (all to go effect in January), the history variable would record “HBB.” We used these variables for testing purposes. ↩︎
- These are mostly situations where a plan sponsor has reorganized plan offerings as a result of acquiring plans from another sponsor, dropping some of its plans, or adding new plans. ↩︎
- These situations have occurred relatively rarely in the Part D program to date. ↩︎
- The value of the LIS depends on income. A few LIS beneficiaries (2.6 percent) are entitled to a reduced premium instead of premium-free coverage. The so-called partial LIS beneficiaries also receive more limited relief for cost sharing. See Appendix 1: Study Methodology for more numbers. ↩︎
- See LIS report for a more detailed discussion of benchmark plans. Laura Summer, Jack Hoadley, and Elizabeth Hargrave, “The Medicare Part D Low-Income Subsidy Program: Experience to Date and Policy Issues for Consideration,” Kaiser Family Foundation, September 2010,” available at https://modern.kff.org/medicare/issue-brief/the-medicare-part-d-low-income-subsidy/. ↩︎
- In some cases, CMS approves a formal crosswalk of enrollment, by which enrollees in one plan are transferred to another plan offered by the same sponsors. We do not count these as plan switches. In other cases, it may be that transfers among plans are made by plan sponsors by other procedures, such as a letter to the enrollees. ↩︎