KFF designs, conducts and analyzes original public opinion and survey research on Americans’ attitudes, knowledge, and experiences with the health care system to help amplify the public’s voice in major national debates.
For the last eight years, states have been helping Medicaid beneficiaries move from institutions to the community through the Money Follows the Person (MFP) demonstration. MFP is aimed at reducing the Medicaid program’s institutional bias, which exists because nursing facility services must be covered while most home and community-based services (HCBS) are provided at state option The program seeks to help beneficiaries overcome barriers to returning to community living, which arise because housing and other community supports often are lost after residing in an institution for a period of time. The first MFP programs began transitioning beneficiaries to the community in 2008, and 44 states are participating in MFP as of 2015. Federal funding for the program expires in September 2016,1 although states have until 2020 to spend their grants.
The Kaiser Family Foundation’s Commission on Medicaid and the Uninsured has periodically surveyed MFP states since 2008.2 We also have conducted case studies taking a closer look at programs in specific states3 and profiled the experiences of individual MFP beneficiaries.4 Based on the information and data collected in our six surveys, we have identified some lessons learned from the program that could inform future policy-making seeking to rebalance Medicaid long-term services and supports (LTSS) spending in favor of HCBS over institutional care.
First, transitioning people from institutions to the community is a complex undertaking that takes time and resources to implement. States reported that MFP implementation required extensive planning at the state level in addition to collaboration with CMS. States that did not already have nursing facility transition programs in place needed time to further develop the necessary service and provider infrastructure to support beneficiaries in the community before beneficiaries were able to transition. Once the initial planning and resources were in place, MFP transition progress has been slow but steady. States reported 349 completed transitions as of summer 2008. This increased to 9,000 cumulative transitions as of 2010, nearly 17,000 in 2011, over 25,000 in 2012, over 35,000 in 2013, and over 52,000 as of mid-2015. While seniors and people with physical disabilities remain the majority of MFP beneficiaries, states have been able to focus more efforts on reaching populations with higher needs after having several years of experience with MFP by identifying the outreach strategies proven to be most effective and the services that beneficiaries need to support their transitions. Notably, states have steadily increased MFP transitions for people with mental illness in recent years, realizing a 77% increase in cumulative transitions for this population from 2013 to mid-2015.
Second, case management services are a critical part of supporting beneficiaries in the community, before, during, and after transitions. Numerous issues can arise when planning for transitions, such as locating a place to live, connecting utilities, obtaining household furnishings, finding community-based providers, and putting back-up systems in place. Navigating these issues often requires individualized assistance from someone who is knowledgeable about available community-based resources. Post-transition case management support can help keep beneficiaries in the community by ensuring that services are provided and navigating any issues that arise, which is particularly important when beneficiaries rely on services like personal care to help them with daily activities such as eating and dressing. In addition to the HCBS that support beneficiaries’ daily living, other key services offered by MFP including modifications to make housing accessible, assistive technology, and one-time transition expenses such as security and utility deposits and purchasing household furnishings. In recent years, some states have been able to think more holistically about beneficiaries’ quality of life and community integration by offering supported employment services, like job coaching and non-medical transportation, for beneficiaries who want to work.
Finally, access to affordable and accessible community-based housing has been a consistent challenge since the program’s inception. Medicaid beneficiaries have low incomes, which limits their ability to pay market rents, and there is an inadequate supply of affordable housing in the community often with long waiting lists for housing subsidies. While Medicaid can fund services needed to support beneficiaries with disabilities living in the community, Medicaid does not cover housing costs, making a lack of housing the main barrier to transitions. To address this issue, 31 states used MFP funds to hire housing coordinators as of 2015. This has enabled state Medicaid agencies to form and strengthen partnerships with state and local housing authorities, landlords, and developers to identify and develop affordable housing resources, increase access to housing subsidies targeted to seniors and people with disabilities transitioning from institutions to the community, and provide information about available housing options to beneficiaries identified as candidates for transition.
MFP has had a substantial impact on the lives of over 52,000 beneficiaries who have been supported in moving from institutions to the community during the last eight years. The program has helped states establish and strengthen the services, staffing, and strategies necessary to help beneficiaries transition. The program also has helped states control LTSS costs, as most states report that serving beneficiaries in the community costs less than institutional care, and no state has found that institutional care is less expensive than HCBS for MFP participants. States also have been able to use their MFP experience and funding to develop other Medicaid HCBS options provided by the Affordable Care Act, such as the Balancing Incentive Program. All of these efforts have contributed to tipping the balance of LTSS funds, with 2013 marking the first year that HCBS is a majority of LTSS spending, after years of steady progress.
There are some areas in which states’ rebalancing efforts could be further strengthened. While states have made progress in increasing access to HCBS, an unmet need remains with over 500,000 people on Medicaid HCBS waiver waiting lists in 2013. Greater access to services in the community could help to divert people from nursing homes in the first place and prevent their needs from deteriorating and becoming more costly in the future. In addition, an increasing number of states are implementing capitated managed LTSS programs, which must be coordinated with institutional to community transitions; a small but growing number of states reported encountering challenges in this area. Efforts to support an adequate supply of direct care workers also are important to transition efforts, and this remains an area of concern for some states. Finally, states are working to develop quality measures that better reflect beneficiaries’ quality of life and capture progress in rebalancing to evaluate the relative success of various initiatives.
With federal MFP funding set to expire in 2016, questions remain about states’ ability to continue to build on what they have learned from their MFP experiences in the future. States are engaged in sustainability planning to determine which MFP services and activities can be continued if the program is not re-authorized. While some HCBS can be offered through existing Medicaid authorities, states report that other demonstration services will end when the program expires. In addition, whether states can obtain funding to continue staff positions to support transitions, such as housing coordinators, remains uncertain and will be subject to administrative and budgetary priorities at the state level. With the upcoming expiration of the MFP demonstration, it will be important to examine what states have learned from the program when developing future LTSS policy initiatives and to consider how states can continue in their efforts to help beneficiaries move from institutions to the community.
Money Follows the Person (MFP) is a federal Medicaid demonstration designed to incentivize states to shift Medicaid long-term services and supports spending from institutional to home and community-based settings. MFP was first authorized in the Deficit Reduction Act of 2005, and then extended through 2016 in the Affordable Care Act. Under the demonstration, participating states receive one year of enhanced federal funding for home and community-based and transition services for every Medicaid beneficiary who moves from an institution to a community-based setting. Currently, 44 states (including the District of Columbia) are participating in MFP. A companion report, Money Follows the Person: A 2015 State Survey of Transitions, Services, and Costs, summarizes 2015 survey data on enrollment trends, services, and per capita spending and describes the interactions between MFP and new and expanded home and community-based services options under the Affordable Care Act as well as managed long-term services and supports.
Based on interviews conducted in spring 2015, the profiles of five MFP participants residing in Colorado, Iowa, Pennsylvania, and Texas are presented here to highlight the diverse experiences of people with long-term services and supports needs who transition from nursing facilities to the community. These personal stories add a human dimension to the ongoing conversations among federal and state policymakers about supported transition, community integration, and expanding access to Medicaid home and community-based services. We extend our appreciation to the individuals who helped coordinate the interviews and the MFP participants who so generously shared their time and stories.
Profiles
Silas, age 63
Denver, CO
Silas worked for many years as a warehouse manager and forklift operator, but he was forced to retire early as a result of a serious head injury sustained when he was the victim of a violent crime. After the attack, he was hospitalized and in a coma for one month. Upon discharge from the hospital, Silas entered a nursing facility to receive physical and speech therapies. Silas recalled that while he was pleased with his rehabilitation progress over his one-year stay in the nursing facility, he had a strong desire to return to the community.
“My [MFP] transition coordinator is the first person I would call if I had any problems.” – Silas
Silas first heard about the Colorado MFP program when a transition coordinator visited the nursing facility and felt the program would be a good fit given his desire to return to living in the community. For Silas, his six-month transition process felt “slow,” and locating affordable, community-based housing was the primary transition barrier. He noted that returning to the community would have been difficult without the transition support and services provided by MFP. With the help of his MFP transition coordinator, Silas secured a housing subsidy and was able to move into an apartment, which he will share with a roommate. Silas furnished his bedroom and common areas with items that were in storage. Using MFP funds, Silas’ transition coordinator purchased housewares such as pots, pans, and dishes. Silas currently receives personal care services for 2 hours per day, five days per week to help with cooking and household chores.
Silas shared that he is in good health overall and feels he is at “about 75%” compared to before the attack. He takes medication for high blood pressure and has recently started experiencing periodic episodes of numbness in his feet due to poor circulation. Silas began having seizures while in the nursing facility but takes anti-seizure medication and has not had a seizure since transitioning to the community. For exercise and social interaction with neighbors, Silas enjoys walking around his neighborhood.
Silas is certain that he could not afford the care he needs without Medicaid, given his limited income. As questions or issues arise, Silas feels comfortable contacting his MFP transition coordinator, who is in touch with him about twice a month. For Silas, the best part about being home is that he is free to come and go as he pleases. Looking to “get away from city life,” Silas hopes to move to a rural Colorado county in the future to be closer to friends. He also hopes to continue his automobile repair hobby.
Stephen, age 47
Hamburg, PA
Stephen has a significant mobility impairment that resulted from mosquito-borne encephalitis at age 9. As a younger adult, Stephen lived alone, worked, and was able to get around on one crutch. Over the years, walking became increasingly difficult for Stephen, and he was no longer able to work. Stephen now uses a wheelchair to get around.
Prior to moving into a nursing facility, Stephen lived with his sister and her family because he could no longer afford to live alone. Stephen moved to a nursing facility when space constraints in his sister’s home made it difficult for him to complete his physical therapy exercises. While Stephen was pleased with the care he received during his 11-month stay in the nursing facility, he knew he wanted to return to the community. For Stephen, locating affordable and accessible community-based housing was the primary barrier to his transition.
Stephen first learned about Pennsylvania’s MFP program from a nursing facility social worker. A case manager from the local Center for Independent Living helped Stephen navigate the MFP transition process. After securing a public housing subsidy, Stephen moved to his current apartment where he receives home health aide services eight hours daily. With MFP transition funds, Stephen was able to purchase some household items, such as bed and bath linens. Stephen noted that he would not have enough money to live independently in the community without Medicaid.
“I have a life to live … I am still a young man.” – Stephen
Stephen shared that he was happy with his overall MFP transition experience. For Stephen, the best part about living in the community is “the freedom to come and go” and the ability to see his 12-year old son on a regular basis. While in the nursing facility, Stephen missed being able to play his favorite heavy metal music at full volume and entertain loved ones in his home. Stephen will continue to focus on increasing his physical strength and would like to get married someday.
Becca, age 42
Evansdale, IA
Becca has diabetes and a mental health condition. According to Becca’s mother, Becca has experienced challenges with managing her diet and prescription medications, and last year she lapsed into a diabetic coma while living alone. Becca recovered from the coma, and upon hospital discharge, she entered a nursing facility to regain her strength and improve her balance.
Becca’s mother felt that Becca received good care in the nursing facility, and with assistance from the staff, Becca developed many of the self-care skills she needed to live independently in the community. With the help of her mother, nursing facililty staff, and an Iowa MFP transition specialist, Becca moved into a small group home approximately one year after entering the nursing facility. Using MFP transition funds, Becca was able to have kitchen utencils, bedding, and towels available on move-in day. Becca lives with two housemates, and enjoys her independence. Becca participates in shared household chores, does her own grocery shopping, and is able to prepare simple meals. Becca also receives Medicaid adult day health care services six hours a day, five days per week.
“We are so fortunate to have access to MFP.” – Melanie, Becca’s mother and legal guardian
In her free time, Becca enjoys solving word search puzzles and listening to country music. Becca and her mom speak by phone often, and Becca enjoys gathering with family at her mother’s home. Becca is also in regular contact with the MFP transition specialist who, according to Becca’s mother, was a “tremendous help” during the smooth transition process. Without Medicaid and MFP, Becca’s mother is not sure how long it would have taken Becca to move back to the community. It gives Becca’s mother peace of mind to know that Becca lives in a safe community and has help managing her diabetes.
Danny, age 48
Fort Worth, TX
At age 22, Danny had an accident at his home that resulted in partial quadriplegia. In 2014, Danny and his brother were in a serious car accident; Danny was hospitalized with a broken right leg and ankle. Shortly thereafter, following a re-hospitalization for an embolism and an infection, Danny was transferred to a nursing facility. He stayed in the nursing facility for three months before transitioning to the community via the Texas MFP program.
“Without supports for Danny, the future is not too bright. Without MFP, we couldn’t have gotten things in place for him.” – Carrie, Danny’s mother and caregiver
Through MFP, Danny moved to a house with his mother, who is retired. In preparation for Danny’s transition, his family built an outdoor wheelchair ramp and converted the first floor living room into a bedroom. Despite some transportation challenges – Danny’s wheelchair-accessible van is in need of repair – Danny is pleased to be back in the community.
Danny home health aide services, including assistance with bathing, eating, and dressing. Prior to the car accident, Danny was able to manage his personal finances; now his mother manages his bills.
His mother described Danny’s current health status as good. Danny is able to control his muscle spasms with medication but is frustrated that he is not more independent at this point. Danny recently fulfilled a personal goal of locating his late father’s biological family (his father was adopted at a young age) and is looking forward to meeting these relatives in the near future. Danny also wants to return to work, preferably in a setting like a Boys & Girls Club where he worked prior to the car accident, and enroll in college to study information technology.
For Danny, the best aspect of living in the community is that he is able to be closer to his siblings, children, and grandchildren. Danny’s mother shared that Danny “lights up” when he is surrounded by his family and that she is grateful to Medicaid and MFP for giving her son a chance to thrive.
DeAnn, age 50
Waterloo, IA
Known for her sense of humor, DeAnn moved to a small community-based group home for people with intellectual and developmental disabilities in 2014 with the help of MFP, following an almost six-month stay in a nursing facility for rehabilitation post-knee replacement surgery. According to DeAnn’s legal guardian, DeAnn received good care in the nursing facility. While DeAnn enjoyed making new friends and participating in group activities at the nursing facility, her goal was to return to the community as soon as possible.
DeAnn’s legal guardian first heard about Iowa’s MFP program from the county mental health office administrator who put her in touch with an MFP transition specialist. DeAnn’s legal guardian described the transition specialist as helpful and efficient throughout DeAnn’s month-long transition process; the transition specialist continues to be in contact with DeAnn at least monthly. DeAnn’s physician also was very suppportive of the transition.
Aside from arthritis and ongoing issues with her knee that affect her gait and balance, DeAnn is in good physical health. In addition to an intellectual disability, she also has a mental health condition. In the home she shares with two roommates, DeAnn receives assistance with laundry and managing her prescription medications. DeAnn makes full use of the household items, such as furnishings and basic kitchen supplies, purchased with MFP transition funds.
“DeAnn received good care at the nursing facility but wanted to get back to life as she knew it could be.” – Peg, DeAnn’s legal guardian
DeAnn works part-time at a local Goodwill retail store, and Medicaid funds door-to-door transportation for her to get to and from work. In her free time, DeAnn enjoys making plastic canvas crafts for gifts. DeAnn’s legal guardian noted that DeAnn also loves to get out into the community, attend concerts, and participate in church activities. For DeAnn, the best part about spending time in the community is her independence and interactions with people in her neighborhood. DeAnn’s legal guardian notes that without Medicaid and MFP, DeAnn would not have been able to move back to the community.
There are currently 44 states, including the District of Columbia, participating in the Money Follows the Person (MFP) demonstration. MFP provides states with enhanced federal Medicaid matching funds for 12 months for each Medicaid beneficiary who transitions from an institution to the community. The current funding allocation for MFP is set to expire in 2016, leaving some questions about whether states will be able to continue to offer all of the services that MFP funds if the program is not re-authorized. Nevertheless, states will continue to rely on the lessons learned from the MFP demonstration to help shape the future of long-term services and supports (LTSS) as well as broader health system reforms. This report is based on a survey of MFP states conducted by the Kaiser Family Foundation’s Commission on Medicaid and the Uninsured in the spring and summer of 2015.
Key Findings
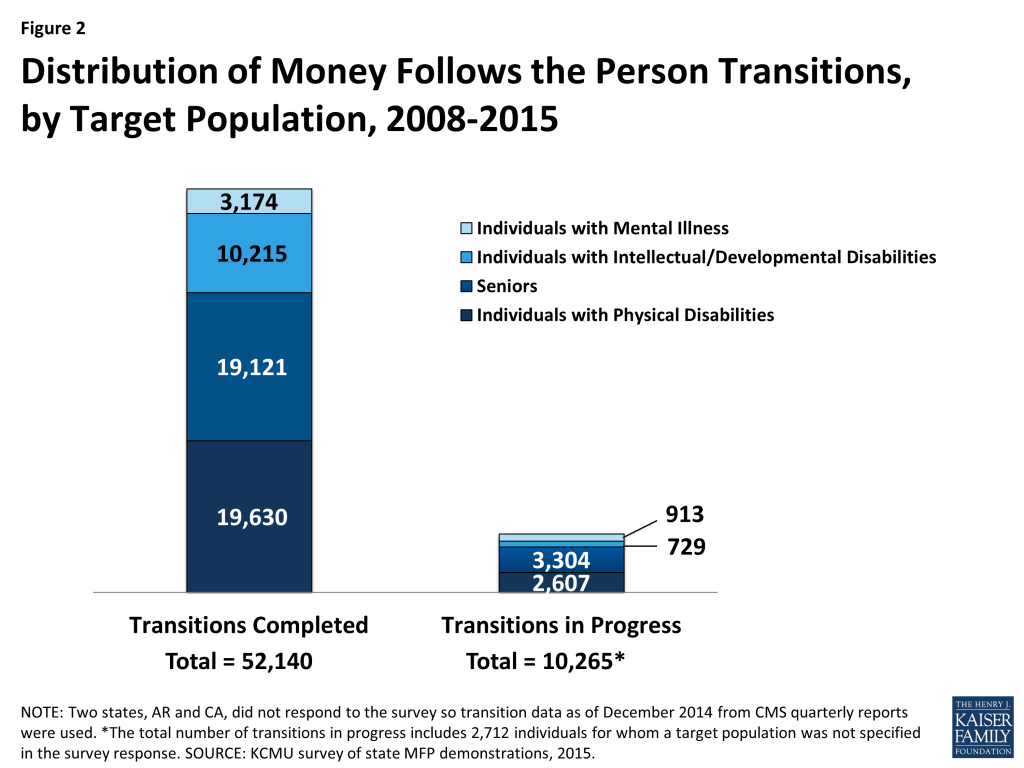
As of mid-2015, 52,140 Medicaid beneficiaries had enrolled in MFP and another 10,265 transitions were in progress. The majority of MFP participants are individuals with physical disabilities (38%) and seniors (37%), while one in five MFP participants is an individual with an intellectual/developmental disability (I/DD). On average, MFP participants were 57 years old, took four months to transition, and most often moved to an apartment. States reported an eight percent average reinstitutionalization rate across all target populations.
States are steadily increasing transitions among individuals with mental illness, realizing a 77 percent increase in cumulative transitions for this population in less than two years. Just under half (19) of MFP states reported trying to increase the number of transitions for people with mental illness, relying on a number of strategies to do so. These include outreach to nursing facilities; adding new demonstration services such as substance abuse treatment, peer support, and enhanced adult foster care; working with managed care organizations to coordinate services and prioritize transitions for this population; and leveraging financial incentives by using enhanced funding from MFP and the Balancing Incentive Program (BIP).
States identified service coordination/case management as the most critical service for MFP beneficiaries both pre- and post-transition. Just over half of the states reported making changes to MFP benefits over the past year, with 16 states expanding services and seven states eliminating services or reporting a neutral change. Forty states are offering self-directed services, but only an estimated 16 percent of MFP participants chose this option in 2015, with self-direction participation rates varying widely across the states.
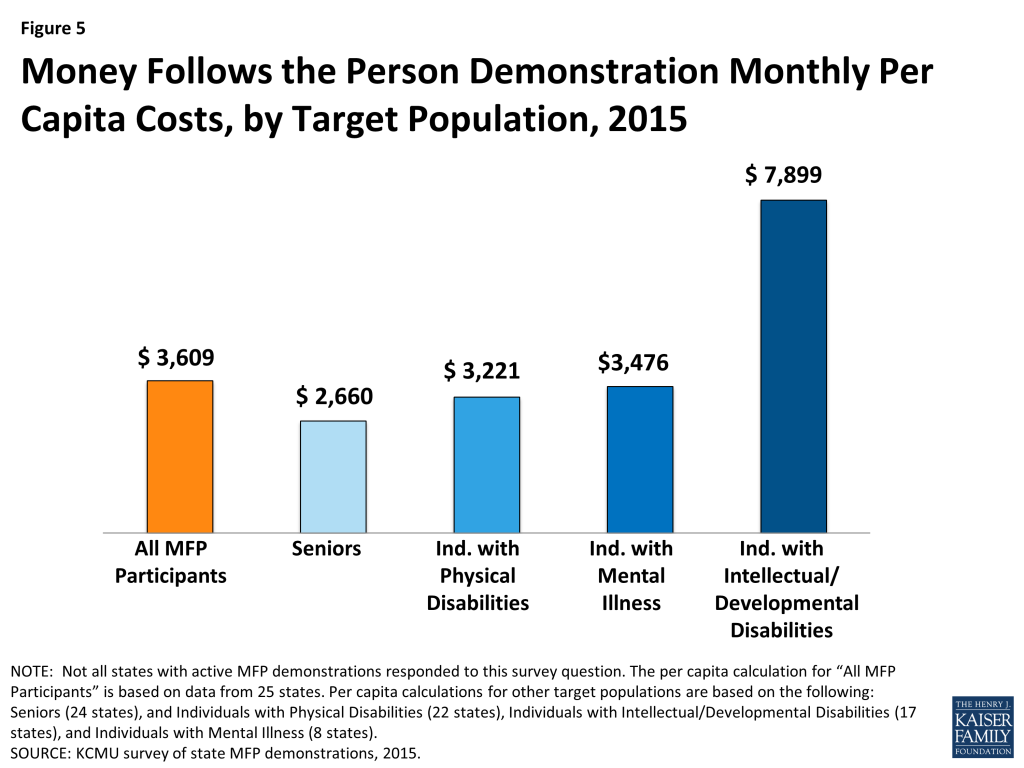
The average monthly per capita cost of serving an MFP participant in the community was $3,609 in 2015, down from an average of $3,934 in 2013 and $4,432 in 2012. Average monthly MFP costs were highest for people with I/DD ($7,899) followed by individuals with mental illness ($3,476), individuals with physical disabilities ($3,221), and seniors ($2,660). No state reported that institutional care was less expensive than HCBS for MFP participants.
States are focused on helping MFP beneficiaries find housing, administering MFP within the context of managed LTSS programs, and leveraging MFP funds and experience to strengthen other rebalancing efforts. Twenty-five states reported finding affordable, accessible housing to be the number one barrier to transitions.Housing has remained a consistent challenge since the inception of MFP, and 31 states use MFP funds to employ one or more housing coordinators. States also are focused on coordinating MFP with managed LTSS programs, with 23 states operating or planning to operate such a program and five states reporting challenges coordinating a managed LTSS program with MFP. States also credit MFP with creating or expanding nursing facility diversion or transition programs by increasing the availability of HCBS and the number of state staff in such programs. Eighteen states participate in both MFP and BIP and report using MFP funds to build on the LTSS delivery system infrastructure changes required by BIP. States also are using lessons learned from MFP in designing the service package included in the Community First Choice (CFC) attendant care benefit.
While MFP has helped states make progress in LTSS rebalancing, the impending expiration of the program in FY 2016 creates some questions about the sustainability of transition activities going forward. Loss of enhanced federal funds for pre- and post-transition services and the loss of administrative funding for staffing, such as outreach and housing coordinators, were the most frequently cited concerns about MFP’s expiration. A number of states reported plans to add key demonstration services, such as transition coordination, to their Section 1915(c) waivers and the CFC option to continue transitions when MFP expires. States also noted that some demonstration services will terminate when MFP expires. States were hopeful that they could sustain MFP staff positions through their legislative processes; however, all future funding commitments are subject to administration and budgetary priorities once MFP funding ends.
Conclusion
MFP states have collectively transitioned over 52,000 Medicaid beneficiaries from institutions to a community home over the course of the last eight years with the help of enhanced federal funding under MFP. MFP has given states a foundation upon which to improve existing transition programs, launch new strategies, and continue to rebalance LTSS in favor of community-based services. Despite steady growth in the number of transitions, states also face transition challenges related to lack of safe, affordable, and accessible housing, low participation rates in self-directed service options, and sustainability of the demonstration as federal funding expires. MFP funding runs through September 2016, and although states can continue to transition individuals through 2018 (with CMS approval) and have through 2020 to use their remaining funding, states may be pressed to continue funding at current service levels and with existing staffing once MFP expires. MFP Project Directors reported working to sustain successful elements of the demonstration, such as strong transition coordination and continued inter-agency coordination, to continue to support transitions beyond MFP and to strengthen ongoing LTSS rebalancing efforts.
Introduction
There are currently 44 states, including the District of Columbia, participating in the Money Follows the Person (MFP) demonstration (Figure 1). Authorized as part of the Deficit Reduction Act of 2005, MFP has bolstered state efforts to increase spending on home and community-based services (HCBS) and helped transition thousands of Medicaid beneficiaries from an institutional setting to a community home. The MFP demonstration provides states with enhanced federal matching funds for 12 months for each Medicaid beneficiary who transitions from an institution to the community. To qualify for an MFP transition, individuals must reside in an institution for more than 90 consecutive days. MFP participants must transition to a qualified community setting including a house, apartment, or group home with less than four non-related residents. States have used MFP funding to test the services and strategies that best contribute to a successful transition. The current funding allocation for MFP is set to expire in 2016, leaving some questions about whether states will be able to continue to offer all of the services that MFP funds if the program is not re-authorized. Nevertheless, states will continue to rely on the lessons learned from the MFP demonstration to help shape the future of long-term services and supports (LTSS) as well as broader health system reforms.
Figure 1: Money Follows the Person Demonstration Status, by State, as of July 2015
As of March 2015, 33 (of 43) MFP states reported earning $1.7 billion in federal matching payments. Under the Affordable Care Act (ACA), MFP was extended by five years, through September 2016, and an additional $2.25 billion in federal funds ($450 million for each federal fiscal year from 2012-2016) was allocated for the demonstration. Funding is available to states for the fiscal year they receive the award and four subsequent years. Any unused grant funds awarded in 2016 can be used until 2020. This report is based on data collected through a national survey of MFP states conducted by the Kaiser Family Foundation’s Commission on Medicaid and the Uninsured. For more information about the survey see the methodology text box at the end of this report and Appendix A. A companion paper, Medicaid’s Money Follows the Person Demonstration: Helping Beneficiaries Return Home, profiles the experiences of five MFP participants.
Report
Key Findings
Transitions
Total cumulative transitions surpassed 52,000 individuals by early 2015, as MFP states continue to increase the number of transitions each year and expand LTSS options in favor of HCBS. As of mid-2015, 52,140 Medicaid beneficiaries had enrolled in MFP and another 10,265 transitions were in progress (Figure 2). This represents an increase in cumulative enrollment of 16,740 individuals since 2013, up from 35,400 in 2013 and nearly 17,000 in 2011 (Figure 3). Most transitions (38%) occurred in three states (TX, OH and WA). These three states have consistently been the leading states in cumulative transitions since the demonstration began. MFP participant numbers vary widely across states, depending on factors such as length of program operation, size of eligible population, and state capacity and experience in operating transition programs. States with newer demonstrations, such as South Dakota and Montana, had the fewest number of cumulative transitions in 2015.
Figure 2: Distribution of Money Follows the Person Transitions, by Target Population, 2008-2015Figure 3: Medicaid Money Follows the Person Demonstration, Cumulative Transitions, 2008-2015
The majority of states (30 of 43) reported being on pace with annual transition targets. Thirteen states reported that they were not on pace to meet their annual projections. Reasons for this included lack of safe, affordable, accessible housing, higher acuity of nursing facility residents, provider capacity issues, and successful diversion efforts. Newer grantee states, those implementing after 2013, were more likely to report coming up short with annual transition projections compared to more established MFP states. These states may have faced initial transition hurdles in the early phase of the demonstration when MFP programs were not yet fully staffed and provider capacity and other community resources were first being tested.
Twenty-one states expect the rate of enrollment growth to increase over the next year, down from 34 states in 2013. Thirteen states anticipated no change in annual enrollment, and eight states did not know. No state anticipated a decrease in enrollment. Among the top 10 states in cumulative MFP enrollment that responded to the survey (including TX, OH, WA, CT, MI, MD, PA, IL, GA, and NY), Illinois experienced the largest change in cumulative enrollment since 2013 (97%) while Georgia experienced the smallest enrollment growth (6%) since 2013. Illinois credited its transition increase to the use of a cloud-based care management system that allowed for improved interagency communication, more efficient follow-up with referrals, and expanded access to case-specific information. Georgia attributed its slowed progress to a moratorium on transitions during 2014 that delayed the transition of individuals with behavioral health needs and developmental disabilities living in state institutions. Nine of these ten states experienced enrollment growth greater than 25 percent between 2013 and April 2015.
“The benchmark for this year has increased, as it will for next year, but attainment of even higher MFP transition rates is becoming less assured.” – MFP Project Director
In 2014, the Centers for Medicare and Medicaid Services (CMS) awarded additional funding to five states (MN, ND, OK, WA, and WI) for the MFP Tribal Initiative to help tribal groups in their states establish transition programs for their communities. The MFP Tribal Initiative offers existing MFP states and tribal partners the resources to build sustainable community-based LTSS specifically for Indian country. Most states were still in the planning phases of the Tribal Initiative at the time of this survey. Minnesota was the only state to report transitioning a participant through a Tribal Initiative.
Participant Characteristics
In 2015, MFP Project Directors reported the following characteristics of MFP participants:
The majority of MFP participants are individuals with physical disabilities (38%) and seniors (37%), while one in five MFP participants is an individual with an intellectual/developmental disability (I/DD). Seniors and people with physical disabilities also lead the number of transitions in progress.
The average age of MFP participants was 57 years old. The average age of senior MFP participants was 75. MFP participants with I/DD were younger (on average 42 years old) than individuals with a mental illness or a physical disability, who averaged 44 and 51 years old, respectively.
MFP participants averaged four months to transition back to the community, up from 3.5 months reported in 2013 and 2012. Individuals with I/DD, mental illness and people with physical disabilities took longer to transition home compared to seniors.
MFP participants most often transitioned to an apartment. Seniors were more likely to transition to a house (their own or a family member’s) or an apartment, whereas individuals with I/DD more often transitioned to a small group home with four or fewer residents.
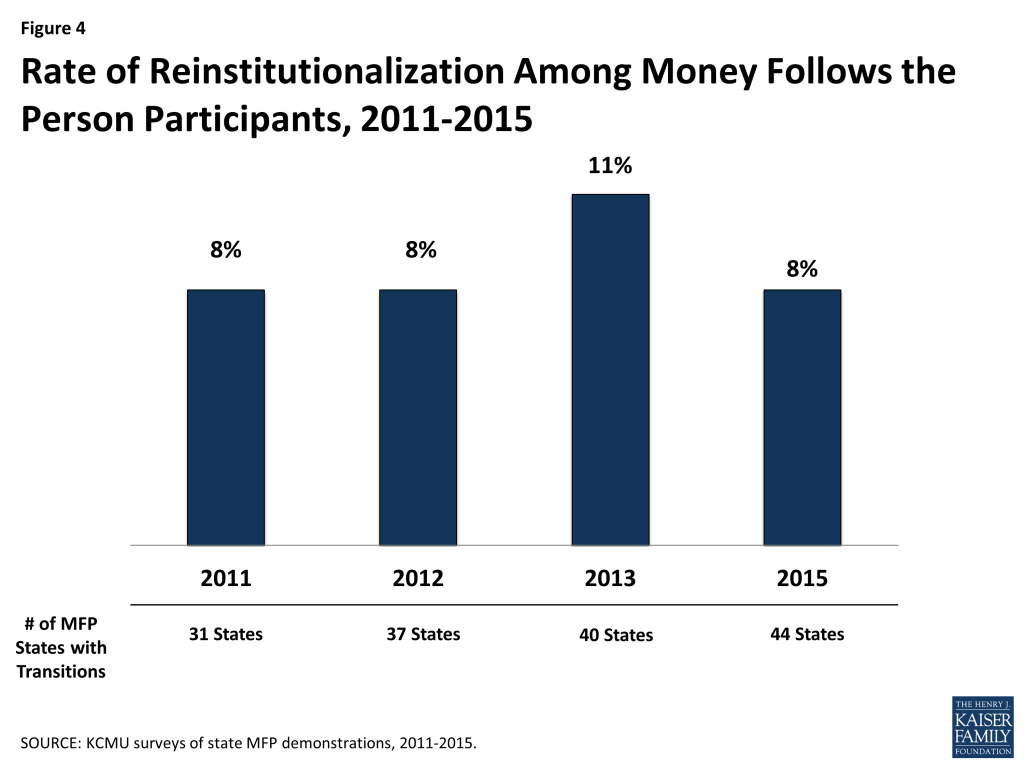
The average reinstitutionalization rate was eight percent, down from 11 percent reported in 2013 and on par with what states reported in 2011 and 2012 (Figure 4). Reinstitutionalization is defined as returning to a nursing facility, hospital, or ICF/DD, regardless of length of stay, during the beneficiary’s MFP participation year. Across all target populations, seniors were most likely to be reinstitutionalized, and individuals with I/DD were the least likely to return to an institutional setting.
Figure 4: Rate of Reinstitutionalization Among Money Follows the Person Participants, 2011-2015
Transitions for Beneficiaries with Mental Illness
States are steadily increasing transitions among individuals with mental illness, realizing a 77 percent increase in cumulative transitions for this population in less than two years. While individuals with mental illness (along with those with I/DD) represent a smaller percentage of MFP participants due to their typically more extensive medical and LTSS needs, as of mid-2015, the overall number of transitions climbed to 3,174 for individuals with mental illness (up from 1,790 in 2013). Over time, the percentage of MFP participants with mental illness has risen from just 1.4 percent in 2010 to 6 percent of total MFP transitions in 2015.
Just under half (19) of MFP states reported trying to increase the number of transitions for people with mental illness, relying on a number of strategies to do so. States cited increased outreach and education to nursing facilities as a way to generate MFP transitions for this population. Maryland hired a behavioral health specialist who is responsible for building relationships with behavioral health providers, advocates, and consumers; training providers on coordinating behavioral health services; and providing direct support to beneficiaries during the transition process. Other state efforts to target people with mental illness include adding new demonstration services such as substance abuse, peer support services, and enhanced adult foster care services (such as overnight care and medication support). Ohio is a leading state in transitioning individuals with mental illness, helping over 1,900 individuals return to community living under MFP. Ohio’s MFP program works closely with the Ohio Department of Mental Health & Addiction Services through the “Recovery Requires a Community” program that provides additional non-Medicaid services such as debt elimination to MFP participants who have mental health or substance abuse issues. Due to demand and population size, Ohio expects transitions for those with mental illness to continue to increase.
States with managed LTSS (MLTSS) programs reported working with managed care organizations (MCOs) to help coordinate service provision and to prioritize transitions for this population. For example, in Texas, MCOs are now responsible for providing mental health rehabilitative services, mental health targeted case management, and nursing facility services, in addition to being responsible for transitions. By carving-in these benefits, MCOs have the opportunity to serve beneficiaries with behavioral health needs across a range of settings. Additionally, the state has conducted trainings with MCOs to incorporate best practices learned from its MFP behavioral health pilot – a program that integrates mental health and substance abuse services with HCBS. Other states reported expanding Medicaid provider networks (in both fee-for-service and managed care environments) so that individuals with mental illness have more choices in behavioral health providers.
States also reported leveraging financial incentives to help foster transitions for people with mental illness. Washington has had “some success” in helping move children and young adults out of state hospital settings by providing financial incentives through a combination of MFP enhanced match and MFP rebalancing funds. Illinois used funding from the Balancing Incentive Program (BIP) to expand mental health services to MFP participants in under-served communities. Assertive Community Treatment and Community Support Team services are available to some participants in Illinois; these include counseling services with an emphasis on community living skills, assistance with medication management, identification of risks, and connection to resources. These services may include visits from mental health agency staff, sometimes daily in the initial weeks after transition.
Outreach, Referrals, and Transition Support
By 2015, most MFP states had several years of experience transitioning participants back to the community and have learned which outreach and enrollment strategies are most successful in identifying potential MFP participants. These initiatives are paving the way for more individuals to live in their choice of setting. We asked states to describe these strategies and the most frequent responses included:
“The most successful outreach is based on partnerships and a promotion of a philosophical framework which supports the person in choosing where they receive their LTSS, rather than the system deciding for them.” – MFP Project Director
Statewide communication and outreach to nursing facilities, institutions for mental diseases, and intermediate care facilities for individuals with intellectual disability (ICF/DDs) (14 states);
Presence of transition teams in nursing facilities to help with outreach and education to potential participants and their families (including peer outreach and options counseling) (12 states);
Partnerships with local Aging and Disability Resource Centers (ADRCs), Centers for Independent Living (CILs), and long-term care (LTC) ombudsman programs (11 states);
Including MFP with Minimum Data Set Section Q requirements (regarding residents’ interest in learning more about a return to community living) (10 states);
Advertising and recruitment materials, including brochures, websites, and television ads that promote the demonstration (9 states); and
Working with MCOs to prioritize transitions (5 states).
Nevada’s most successful outreach strategy is the use of a weekly level of care report. This report provides state staff with information about the most recent Medicaid beneficiaries who have been screened for nursing facility placement.
Tennessee requires staff responsible for coordinating care in its MLTSS program to assess individuals for their desire and ability to transition at least annually. In addition, to further incentivize MCOs, contracts with the state offer incentive payments upon (1) successful transition of each demonstration participant, and (2) community living for the entire 365-day demonstration period, without re-admission to a nursing facility.
Benefits
Using MFP enhanced funds, all MFP states (43 reporting) offer HCBS waiver services to MFP participants, and 36 states offer HCBS to MFP participants under their state plan benefit package to successfully transition individuals home and keep them living in the community. Services that qualify for the MFP enhanced federal matching rate during a beneficiary’s MFP participation year are those waiver and state plan services that will continue once the individual’s MFP transition period has ended. Common Medicaid HCBS are personal care, adult day health care, case management, homemaker services, home health aide services, habilitation, and respite.
Thirty-nine states offered MFP demonstration services in 2015, which are additional Medicaid HCBS reimbursed at the enhanced MFP federal matching rate during a beneficiary’s 12-month MFP participation period. MFP demonstration services are provided in a manner or amount beyond what a typical Medicaid HCBS beneficiary receives and are not otherwise available to a Medicaid beneficiary. For example, transition coordination services help MFP participants secure housing, pay for moving expenses, and secure assistive technology. After the beneficiary’s transition year ends, states are not obligated to continue MFP demonstration services but may choose to fund them through Medicaid at the state’s regular federal matching rate.
Nineteen states offered MFP supplemental services or services which are not necessarily long-term care in nature. MFP supplemental services are only offered during the beneficiary’s demonstration transition year and are reimbursed at the state’s regular federal matching rate. Eighteen states reported offering both demonstration and supplemental services. These services include benefits such as coverage of one-time housing expenses (such as security deposits, utility deposits, and furniture and household set up costs), assistive technology, employment skills training, 24-hour back-up nursing, home-delivered meals, peer-to-peer community support, and LTC ombudsman services.
Just over half (23 of 43) of the states reported making changes to MFP benefits over the past year, up from 14 states making benefit changes in 2013. Of the states making benefit alterations, 16 states reported expanding services and seven states reported eliminating services or a neutral change. Examples of restructuring of services included adding first month’s rent to transition assistance, informal caregiver’s support, peer support, and adaptive technology as demonstration services and increasing pre- and post-transition funding for environmental accessibility adaptions, pre-transition staff training, and supports coordination fees. One state reduced some of the services funded through MFP, such as physician consultation, healthcare communication, and legal consultation, due to their non-usage. The state attributed the non-usage to decreased need as a result of transition coordinators’ growing knowledge of community-based resources and relationship building with service providers over the course of the demonstration.
“Staff retention of the transition coordinators has proven invaluable to community networking and referral/resources building which has lessened the need for MFP to pay for some of the categories that were originally funded.” – MFP Project Director
States identified service coordination/case management as the most critical service for MFP beneficiaries both pre- and post-transition. The 2015 survey asked states to describe the most critical strategies or innovative services that help MFP beneficiaries successfully transition to the community. Services were grouped into pre-transition services and post-transition services. Pre-transition services are offered to MFP participants to help position them for the greatest opportunity for success. Post-transition services include all Medicaid HCBS waiver services as well as MFP demonstration and supplemental services that support individuals living in the community.
The most frequently cited essential pre-transition services were support from transition specialists (also known as transition coordinators or navigators); transition coordination services that may include a transition budget for household items, set-up fees, or deposits for utility access; and housing assistance. Access to a transition coordinator before discharge is critical so that MFP participants can have paid and non-paid supports set up in the community before they are discharged home. Other critical pre-transition supports identified by states include: options counseling (provided by locals Area Agencies on Aging (AAAs) and CILs), intensive case management (that may include a readiness assessment to develop a plan for successful transition), peer mentorship, independent living skills training, assistive technology, and access to non-medical transportation to obtain documentation for housing and/or locate housing.
“Extensive needs assessments while in the facility help to develop a plan for successful transition.” – MFP Project Director
Colorado uses multi-disciplinary transition teams made up of the beneficiary, providers, family, friends, or anyone else the beneficiary would like to have on their team. The team provides support to the MFP participant, addresses questions/concerns, and helps identify risks/mitigation plans to ensure a successful transition and high quality of life upon transition.
In Illinois, transition engagement specialists provide outreach and education about MFP to work with nursing facility residents. In completing their assessments, the specialists “improve the quality of the referrals received,” while also promoting collaboration across state programs in order to address the complex health conditions and physical limitations of the MFP participants.
“Early in the demonstration it became clear that for many participants, this on-going intensive case management, including 24/7 care coordination, would be instrumental to the success of participants in the community.” – MFP Project Director
The most commonly reported strategy, with regard to post-transition services, was the use of “more intensive” transition coordination/case management services. The role of the transition coordinators post-transition is to monitor the MFP participant with follow-up visits and ensure services are received in a timely manner, as scheduled, and with trained caregivers. A more intensive follow along is designed to ensure that the MFP participant has the appropriate level of monitoring and that changes to their service and risk mitigation plans can be made as needed. Several states extend transition coordination for the full 365 days after transition. In New York, transition coordinators communicate with MFP participants for a two-year period post-transition. Other notable post-transition strategies/supports include access to crisis response services (including a 24-hour back-up system to provide support and assistance for services that were not delivered), the provision of basic furnishings, groceries, and housewares to the new home, increased capacity or “slots” for HCBS waiver programs, and a focus on community engagement through social and vocational opportunities. Twenty-six states offer employment supports and services to MFP participants who are interested in returning to work or who want to pursue volunteer opportunities, although a 2012 study found a small share of MFP participants ever accessed employment services.1
In Missouri, all information about MFP participants from the initial referral, options counseling, all the way through the transition, and post-transition is entered into a web-based system. MFP staff, regional staff, and transition coordinators all have access to the system. This system allows the state to see why individuals who are interested in returning to the community cannot, and, the underlying reason if a transition was not successful. The system also captures such things as, what type of housing the participant is using, if they are living alone, if they are self-directing their HCBS, any hospitalizations, date and cause of death, age, etc. There are also note areas for transition coordinators to leave anything that might have an important bearing on the case.
Forty states are offering self-directed services, but only an estimated 16 percent of MFP participants chose this option in 2015, down from an estimated 19 percent in 2013 and 22 percent in 2012. Only three states responded that self-direction was not an option in their MFP demonstration. Self-direction is an alternative to the provider management service delivery model which offers Medicaid beneficiaries the authority to make decisions about some or all of their services, including who provides services and how they are delivered. For example, an MFP participant may be given the opportunity to recruit, select, and supervise direct service workers. Participants may also have decision-making authority over how the Medicaid funds in a budget are spent.
Self-direction participation rates varied widely across the states. Three states (DE, MA, and OH) reported 100 percent participation in self-direction due to the fact that one-time home set-up funding was categorized as a self-directed service. Seventeen states reported the percentage of MFP participants who self-direct services to be 5 percent or less. Thirteen states reported an increase in the percentage of participants who utilized self-directed options over the past year, up from nine states in 2013 and eight states in 2012. Twenty-two states reported no change in the percentage of MFP participants who self-direct and four states reported a decrease.
Financing
The average monthly per capita cost of serving an MFP participant in the community was $3,609 in 2015 (Figure 5), down from an average of $3,934 in 2013 and $4,432 in 2012. Average monthly per capita costs varied across states from a low of $1,260 to a high of $8,737 per person per month, based on responses from 25 states. Differences in per capita costs may be attributable to differences in covered services and/or a reflection of the diverse needs of the target populations. In comparison, the national average per user spending on Medicaid HCBS only, including Section 1915(c) waivers and the home health and the personal care services state plan benefits and excluding other Medicaid-covered services, was $17,174 in 2011.2 Average MFP monthly costs were highest for people with I/DD ($7,899) followed by individuals with mental illness ($3,476), individuals with physical disabilities ($3,221), and seniors ($2,660).
Figure 5: Money Follows the Person Demonstration Monthly Per Capita Costs, by Target Population, 2015
When asked to compare per capita costs for MFP participants with per capita costs for other Medicaid beneficiaries receiving HCBS, 18 states said costs were comparable, eight states reported that per capita costs were higher for MFP participants, and six states reported per capita costs were lower for MFP participants. The remaining states did not answer the survey question. When asked to compare the per capita costs for Medicaid beneficiaries who reside in institutions to per capita costs for MFP participants, thirty states reported that per capita costs were lower for MFP participants. Two states reported that the two costs were comparable (due to equal capitation rates for beneficiaries enrolled in managed care living in the community or in an institution), and no state reported that institutional care was lower. Responses to this survey question have remained consistent over time, with the majority of MFP states reporting MFP per capita costs for beneficiaries receiving HCBS to be lower than those residing in institutions.
MFP Staffing and Key Partnerships
“The expertise of the contracted staff and their knowledge of community resources is key to making the transition a success.” – MFP Project Director
MFP has enabled states to add program staff to help grow their transition programs and more effectively respond to transition challenges. States rely on numerous MFP staff and key partnerships to conduct outreach, coordinate efforts across state agencies, monitor quality, and assist in LTSS rebalancing efforts. Each state tailors their MFP program to meet specific needs, however, all MFP states employ a project director, and sometimes an associate/assistant project director, with MFP administrative funds. The Project Director’s role is to oversee all aspects of the demonstration including financial management, outreach/training, staffing, evaluation, project planning, and submission of required federal reporting. Other frequently reported MFP staff positions hired with 100 percent administrative funds included transition coordinators, outreach and education coordinators, housing specialists, data/fiscal analysts, quality specialists, and administrative support staff. Eight states employ an MFP quality assurance specialist. Maryland hired two quality and compliance specialists whose duties are to ensure new applicants are moving through the eligibility process in a timely manner, which includes monitoring time frames for medical assessments by the local health departments, plan of service review, provider and participant enrollment, and the eligibility determination process.
“Including a housing coordinator as part of the transition team has been found to be a critical strategy in successfully transitioning individuals to the community.” – MFP Project Director
Thirty-one states employ a housing coordinator to help with transitions, and some states employ multiple housing coordinators. These individuals function as a critical link between MFP participants and local housing resources. They can help individuals locate housing in preferred areas, negotiate lease terms with landlords, and assist with completing and acquiring needed documents for housing applications. Hawaii’s MFP housing coordinator developed a “housing stabilization tool” to assure quality transition planning and follow-up stabilization progress in the community by assessing issues such as finances (bills and rent paid on time) and safety (keeps house clean, knows how to use equipment). MFP staff are beginning to train health plan service coordinators and community case managers to use this tool.
Aside from MFP-funded positions, states rely on a number of partnerships to further their efforts to transitions individuals out of institutions and back to the community. These partnerships include working closely with local AAAs, CILs, other state agencies (such as public housing and behavioral health), LTC ombudsman programs, community stakeholders/advocacy groups, and family members.
Quality
States identified the CMS Quality of Life (QoL) survey as their main tool to measure quality and satisfaction among MFP participants, although only a handful of states (8) reported using the results from the QoL survey to make changes to their MFP demonstrations. This survey is administered within 30 days of transition and at 11 and 24 months post-discharge. The data from the QoL survey informs states about MFP participants’ health challenges, satisfaction with certain aspects of their lives in the community, their extent of independence and control over their circumstances, and the service and support gaps that result in their needs and wants not being met. Examples of changes that states made based on QoL survey findings include adding new demonstration services such as peer supports services to help with community integration and informal caregiver supports and training to address the needs of family and friends providing services. Hawaii added supportive employment services, based on the QoL question concerning the desire to work or volunteer. In doing so, the state has “developed a better relationship” with the Division of Vocational Rehabilitation and the state First-to-Work Program that provides employment preparation and support services to TANF households. New Jersey developed a Risk Review Form, based upon the responses received from the MFP QoL surveys, that was designed to indicate if an individual’s health and safety might be in jeopardy. The Risk Review Form is given to the MFP quality assurance specialist who is responsible for the follow-up with the appropriate staff and for documenting all responses and resolutions. In addition, if a Risk Review Form is generated from a first or second year follow up QoL survey administered to an individual who has been re-institutionalized, then the MFP quality assurance specialist arranges a face-to-face visit with the individual to further assess their quality of life in the institution and ascertain if the individual has any interest in returning to the community.
States also reported embedding MFP participants into the traditional quality standards – Medicaid quality improvement and quality assurance processes – that are in place through Section 1915(c) waivers and state plan assurances. Other examples of quality activities include monitoring the rate of reinstitutionalizations and the use of intensive case management for each participant during the demonstration year to monitor the delivery and quality of services. Additionally, some states conduct their own evaluations separate from CMS requirements. For example, Missouri gathers information on MFP participants that leave the program to gain insight into the reasons for their leaving. This information is used to identify trends and aids in the development of supports and services to help maintain support for individuals living in community settings. The state also noted that this insight will be important as individuals with more complicated needs return to the community. In New Jersey, MFP participants with intellectual disabilities transitioning from a Developmental Center to a community setting have the added benefit of an enhanced monitoring process – the Olmstead Review Process – that follows an individual’s transition to the community with a face-to-face follow-up review after 30, 60, and 90 days. Data collected at each review helps guide decisions about needed modifications to plans of service to mitigate issues, and to inform infrastructure decisions.
Issues Facing MFP in 2015 and Beyond: Housing, HCBS Providers, and Managed LTSS
Twenty-five states reported finding affordable, accessible housing to be the number one barrier to transitions. Housing has remained a consistent challenge since the inception of MFP. This is because MFP participants often have ongoing and persistent cognitive and physical impairments and chronic conditions that result in the need for assistance with activities of daily living and also lack adequate income and resources to afford fair market rent on their own (since Medicaid does not pay for housing in the community). Each year more MFP states have hired housing coordinators (or housing specialists) to assist individuals interested in transitioning with locating and securing housing. Other strategies to address housing shortages include partnering with state housing authorities and the federal Department of Housing and Urban Development (HUD) to help secure Housing Choice vouchers for MFP participants, provide training on housing issues, assistance in finding housing, and assistance with the development of new housing resources. States reported securing HUD Section 811 grant funding to provide interest-free capital advance and operating subsidies to nonprofit developers of affordable housing for people with disabilities and project-based rental assistance.
Illinois has been awarded Section 811 Project-Based Rental Assistance Demonstration funding and is in the process now of awarding Section 811 rental assistance contracts in areas needed and preferred by the participants. In addition, the state is collaborating with several local Public Housing Authorities to implement projects combining project-based and tenant-based vouchers dedicated to MFP participants. A web-based housing search system exists, and a new wait list system to prioritize and filter participants for matches with available Section 811 units came online June 1, 2015.
Maryland is working to implement the MFP Bridge Subsidy Program that will provide a total of $2 million in rental subsidies for MFP-eligible individuals transitioning from nursing facilities and state residential centers back to the community through the use of HCBS waivers. The MFP Bridge Subsidy will offer rental subsidy for three years. After the three years, the Public Housing Authority will offer the individual a Housing Choice Voucher. Maryland also developed the Partnership for Affordable Housing to coordinate efforts for the MFP population and engage in training and outreach at the case manager level as well as systems level advocacy with developers, public housing authorities, and other housing financers.
Other housing supports include access to rental assistance programs, security deposit guarantee programs, housing counseling services, accessibility modifications, and assistive technology. A number of states also reported using MFP funds to enhance housing resource websites.
Ohio’s Temporary Ramp Project provides modular aluminum ramps for MFP participants with an immediate need for this assistance. Depending on the participant’s specific situation, different types of vouchers, short-term rental subsidies, monetary support, and Emergency Rental/Utility Assistance are available. Also, Ohio was recently awarded HUD Section 811 funding and will be partnering with the Ohio Housing Finance Agency to develop over 500 units targeting individuals with low incomes who are transitioning through MFP.
About half (22) of MFP states reported an adequate supply of direct care workers in the community in 2015, down from tw0-thirds of states in 2013. States recognize that workforce initiatives are a critical component of successful community-based transition programs and are actively addressing challenges such as high turnover rates, shortages of direct service workers in rural areas, and language barriers between workers and MFP participants whose primary language is something other than English. One state noted a shortage of workers who have the skills set and experience to work with persons with behavioral health needs. Current efforts to address direct services worker shortages focused on Medicaid provider recruitment from existing HCBS organizations and continued education/training/certification at the local level. Ohio established a Direct Service Workforce initiative in 2012 using MFP funding and in collaboration with several state departments (Medicaid, Aging, Developmental Disabilities, Health, Mental Health & Addiction Services, Education, and Board of Regents) as well as non-governmental organizations. The initiative involves identifying core competencies for all direct service workers in the health care arena, including those in institutional settings, with the goal of increasing interest in direct service careers by building a career lattice to increase options for upward and lateral career mobility. Other state examples included developing “realistic job preview videos” for use by HCBS providers (West Virginia) and creating supply and demand projections for institutional and community workforce by town (Connecticut). In states that have implemented MLTSS, such as New Jersey, the MCOs are contractually required to establish and maintain an adequate network of providers, including HCBS providers. MCO care managers are responsible for identifying any service gaps and ensuring MCOs have adequate provider networks in place to address beneficiaries’ needs.
Twenty-three MFP states reported operating or plans to implement an MLTSS program that will include MFP participants. These initiatives include enrollment of new populations into Medicaid managed care and new or expanded use of MLTSS. While some states said it was too soon to determine the impact of managed care on MFP participants, one state noted, “making MFP part of managed care has increased our transitions…the MCO’s are better able to identify potential participants than we were able to do prior to managed care.” Still, expansion of managed care has not been seamless for individuals with complex health and LTSS needs. These systems changes require continued close coordination and introduction of new partners and new roles for coordinating and promoting community options. Five states reported challenges coordinating an MLTSS program with MFP, up from two states in 2013. Lack of access to encounter data and challenges with distribution of transition funds were examples of the challenges reported. One state acknowledged initial difficulty coordinating transition services that needed to be in place for the MFP participant on the day of discharge from the nursing facility. With the implementation of MLTSS, these services were scheduled to begin after enrollment into MLTSS and not before the transition. To address this issue, MFP participants were enrolled into MLTSS while still residing in the nursing facility and then allowed to transition any time after that. Another challenge mentioned was a result of MFP participants’ ability to change their MCO providers, which can create challenges for consistent service provision. One state with a relatively high percentage of potential MFP participants with mental illness noted the potential challenges of consistent service provision under managed care, given their ongoing challenges with mental health services capacity in the community.
MFP and Progress in LTSS Rebalancing
“We totally reorganized the transition system after looking at data reported under the MFP demonstration.” – MFP Project Director
As a result of MFP, 16 states have added transition programs to their LTSS rebalancing activities, and 27 states have used MFP to strengthen and expand existing nursing facility diversion and/or other transition programs. States with existing transition programs reported that MFP has increased the visibility of and need for such programs through improved communication, training, and marketing efforts. Federal financial support under the MFP demonstration has broadened the scale of existing transition programs, increased state staffing, and expanded HCBS availability. With the addition of MFP, states also expanded the populations of institutional beneficiaries who may be able to relocate to the community beyond those with physical disabilities to include seniors,individuals with mental illness, and individuals with I/DD. States reported learning lessons from earlier transition initiatives and have built stronger transition mechanisms that better support specific populations. For example, North Carolina reported stronger, more consistent training in transition practices, clearer expectations related to pre- and post-transition case management activities, stronger interdisciplinary collaboration, and refined service definitions that better support the needs of individuals transitioning to the community.
“MFP created a platform for discussion, ideas, collaboration, improved data integrity, and other funding options to assist in improving LTSS rebalancing.” – MFP Project Director
States reported leveraging MFP dollars and transition experience to strengthen ongoing rebalancing efforts, including other Medicaid HCBS options. Several years after MFP was established, the ACA included a number of new and expanded LTSS options that offer states the ability to take advantage of federal funding to rebalance their delivery of LTSS toward HCBS and away from institutional care. Some of these options include the Community First Choice state plan option (CFC), BIP, the health home state plan option, and the Section 1915(i) HCBS state plan option.3 This year’s survey asked states to report on how MFP helped create new or built on existing LTSS rebalancing efforts. Most often, states reported leveraging MFP rebalancing funds and building upon infrastructure changes made with MFP to apply for and implement BIP. Similar to MFP, BIP provides a mechanism for states to earn enhanced FMAP payments (2% or 5%) through the provision of HCBS. All of the eighteen states participating in BIP are also participating in MFP. This resulted in additional staff and funding to implement a No Wrong Door/Single Entry point system, a core standardized assessment tool, and a conflict free case management system (all of which are structural requirements of BIP) as well as created inter- division/agency collaboration to improve LTSS.4 States also reported relying upon lessons learned from the implementation of MFP demonstration and supplemental services when determining which services would be covered under the CFC option, in order to continue MFP-like transition efforts when the MFP demonstration expires in 2016. In the District of Columbia, MFP has collaborated with Medicaid health home efforts on housing and mental health data, in particular relative to nursing facility residents, and, in the implementation of the Section 1915(i) HCBS state plan option for adult day health program services.
Sustainability Post-2016
While MFP has helped states make progress in LTSS rebalancing, the impending expiration of the program creates some questions about the sustainability of transition activities going forward. This year’s survey asked states what impact the expiration of MFP will have on state rebalancing efforts and the beneficiary transition experience. The MFP demonstration is set to expire at the end of FY 2016, although states have the option to request to transition MFP participants through December 2018 and to spend unused funds until 2020. Loss of enhanced federal funds for pre- and post-transition services and the loss of administrative funding for staffing were the most frequently cited concerns about MFP’s expiration. One state said its housing coordinator position would not be extended after MFP funds run out and noted that “the housing challenge will continue and [the expiration of MFP] will be a loss to the state without finding some sustainability. Housing and HCBS go absolutely hand and hand. No home to go to, no transition.” Another state feared losing the expertise of outreach specialists unless it can find another source of funding for those positions. States operating MLTSS programs were hopeful the expiration of MFP would have little impact on transition efforts since most of the MFP transition services are available through managed care. Going forward, these states are looking for transitions to continue with the assistance of the MCOs. States also noted that other Medicaid and/or state-funded transition initiatives that operate concurrently with MFP would continue after MFP expires.
“MFP has been an active catalyst for pushing culture change for the nursing home population – pushing for and allowing more consumer autonomy and choice.” – MFP Project Director
At the time of this survey, all states were in the sustainability planning process to determine existing authorities through which transition services or activities could be continued post-MFP. To minimize the impact of the expiration of the demonstration on rebalancing efforts and beneficiary transition experience, CMS required states to submit an MFP sustainability plan by April 30, 2015. The sustainability plans were developed to maintain transition efforts from CY 2016 through CY 2020 and beyond. Approval of such plans was expected in August 2015. A number of states reported plans to add key demonstration services to their Section 1915(c) waivers, as well as to the CFC option, in order to continue transitions when MFP expires (although states also noted that some demonstration services would be terminated when MFP expires). Specifically, states mentioned ensuring the continuity of transition coordination services or transition management services. Additionally, states were hopeful that they could sustain MFP staff positions through their legislative process; however, all future funding commitments are subject to administration and budgetary priorities once MFP funding ends.
Conclusion
Conclusion
MFP states have collectively transitioned over 52,000 individuals back to a community home over the course of the last eight years with the help of enhanced federal funding under MFP. MFP has given states a foundation upon which to improve existing transition programs, launch new strategies, and continue to rebalance LTSS in favor of community-based services. This year’s survey found: an increasing number of transitions among individuals with mental illness; reliance on case management services to ensure successful transition back to the community; an increasing number of states adding MFP participants to managed care (with a few states reporting coordination problems to date); and the leveraging of MFP dollars and transition experience to strengthen ongoing rebalancing efforts, including BIP, CFC, and other Medicaid HCBS options.
Despite steady growth in the number of transitions, states also face transition challenges related to lack of safe, affordable, and accessible housing, absence of mental health services/providers in some areas, low participation rates in self-directed service options, and sustainability of the demonstration as federal funding expires. MFP funding runs through September 2016, and although states can continue to transition individuals through 2018 (with CMS approval) and have through 2020 to use their remaining funding, states may be pressed to continue funding at current service levels and with existing staffing once MFP expires. MFP Project Directors reported working to sustain successful elements of the demonstration – strong transition coordination and continued inter-agency coordination – in order to continue to support transitions beyond MFP and to strengthen ongoing LTSS rebalancing efforts.
Methodology
Methodology
During the spring and summer of 2015, the Kaiser Family Foundation’s Commission on Medicaid and the Uninsured surveyed MFP states about basic program information, including MFP services, transitions, and costs, as well as evaluation activities, post-2016 sustainability plans, and the lessons learned from MFP in support of other Medicaid LTSS rebalancing/delivery system reform efforts. Each MFP state received the written survey instrument, and 43 (of 45) states submitted a complete questionnaire. Two states (AR and CA) opted not to participate in the survey. Oregon completed the survey, and its responses are included in this report, but the state has since terminated its program, effective June 30, 2015, bringing the total number of states participating in MFP to 44. The data summarized here were provided directly from MFP Project Directors and other state staff. The full survey instrument can be found in Appendix A of this report. This report was supplemented with data provided by state officials in previous Kaiser MFP surveys conducted between 2008 and 2013.
The Affordable Care Act Drove Record Annual Increases in Enrollment and Total Medicaid Spending Nationally in FY 2015, As Newly Eligible Adults gained Coverage in Expansion States
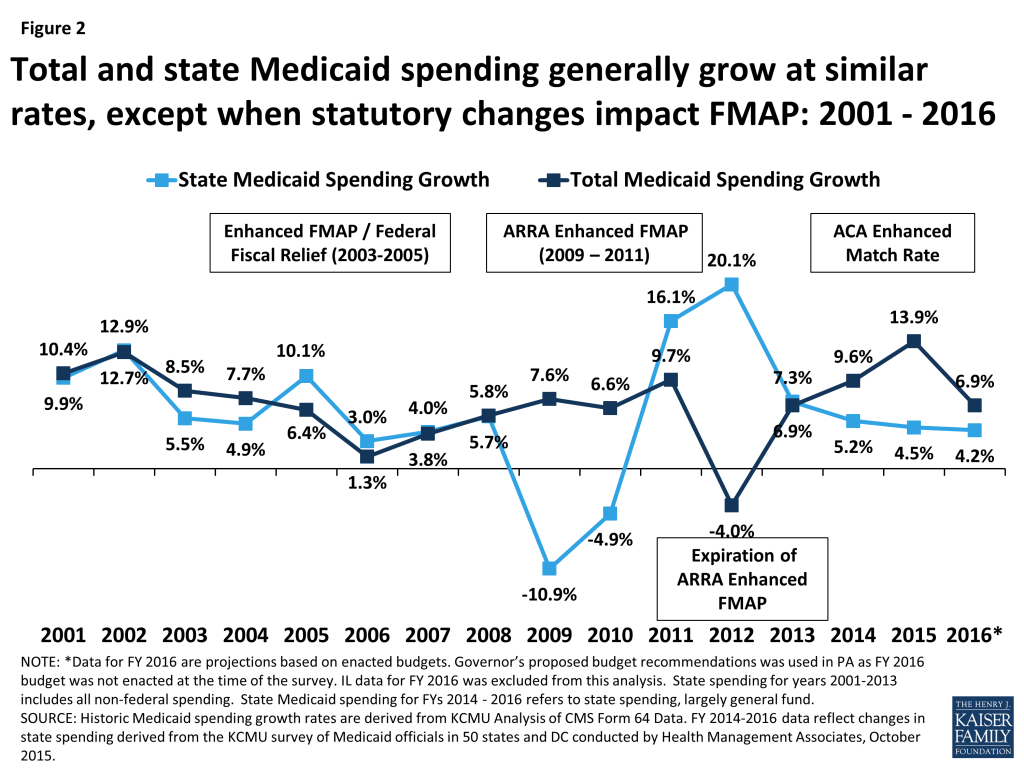
High Federal Match for Adult Expansion Group Contributed to Substantially Slower State Medicaid Spending Growth in Expansion States Compared to Non-Expansion States
Survey Also Finds States Relying More on Managed Care, Undertaking Delivery System Reforms
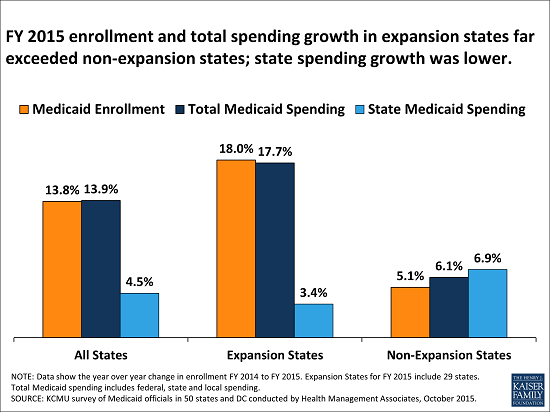
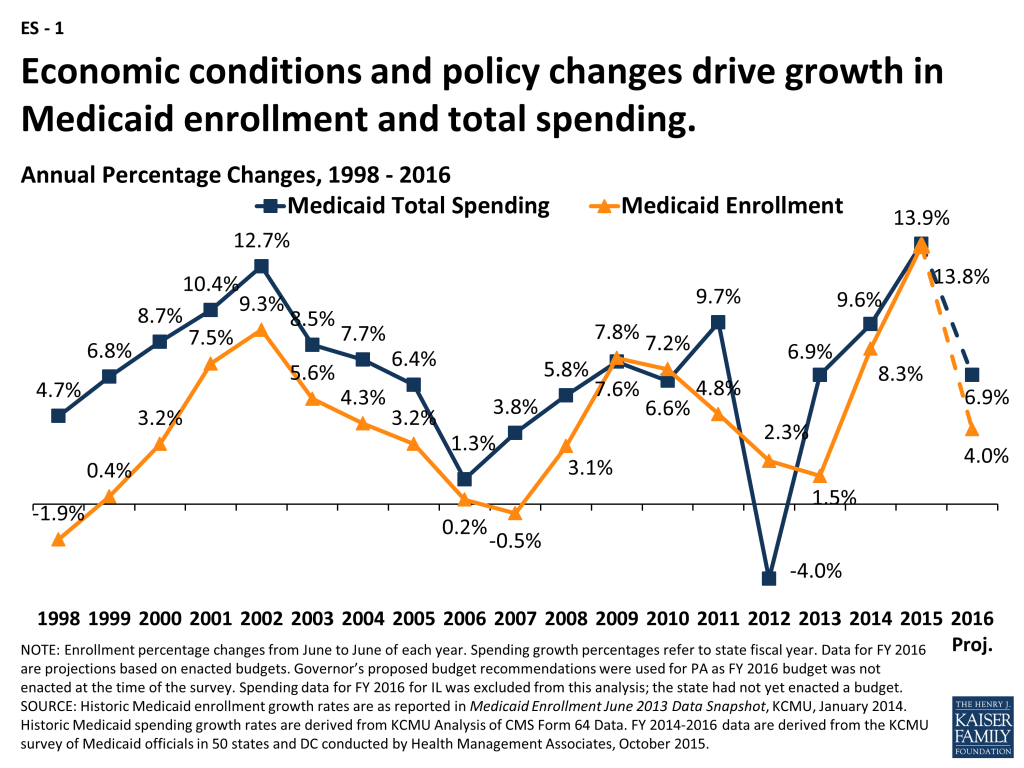
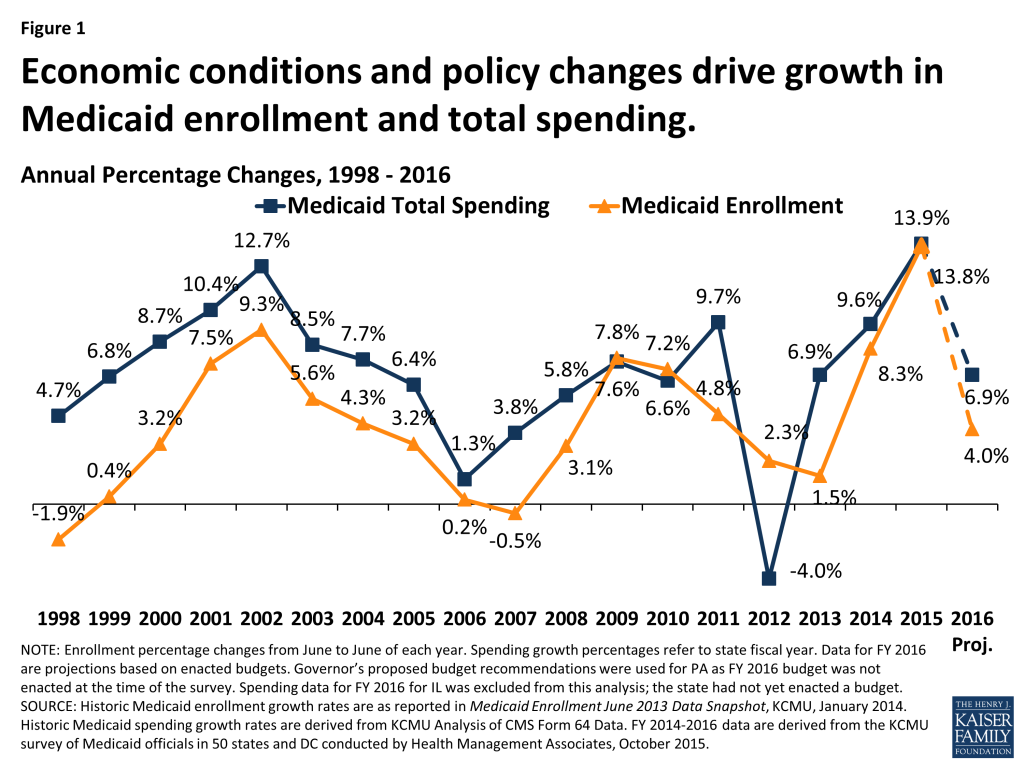
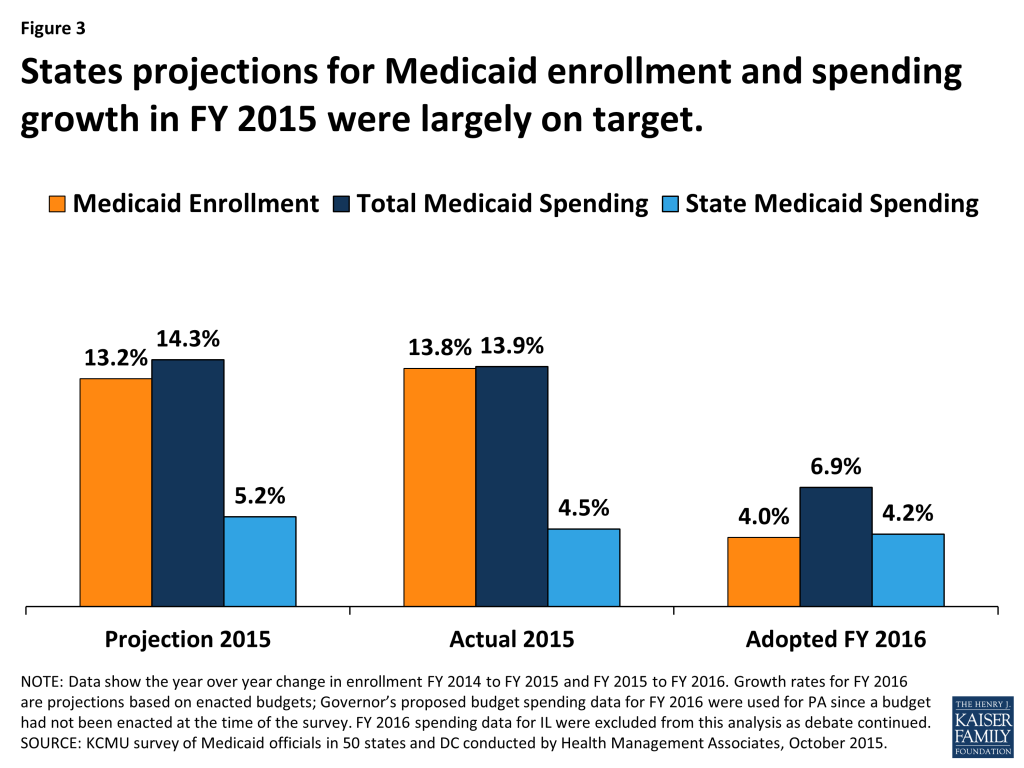
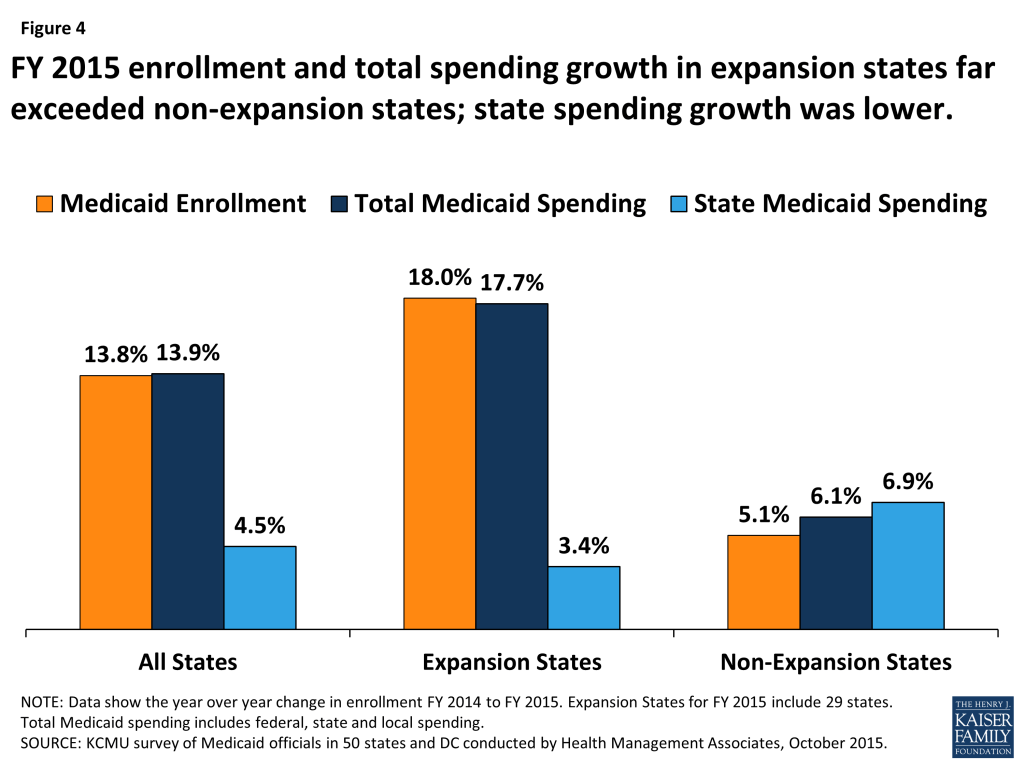
The Affordable Care Act’s Medicaid expansion resulted in record increases in Medicaid enrollment and spending nationally in fiscal year 2015, with both rising an average of nearly 14 percent, according to the 15th annual 50-state Medicaid budget survey by the Kaiser Family Foundation’s Commission on Medicaid and the Uninsured.
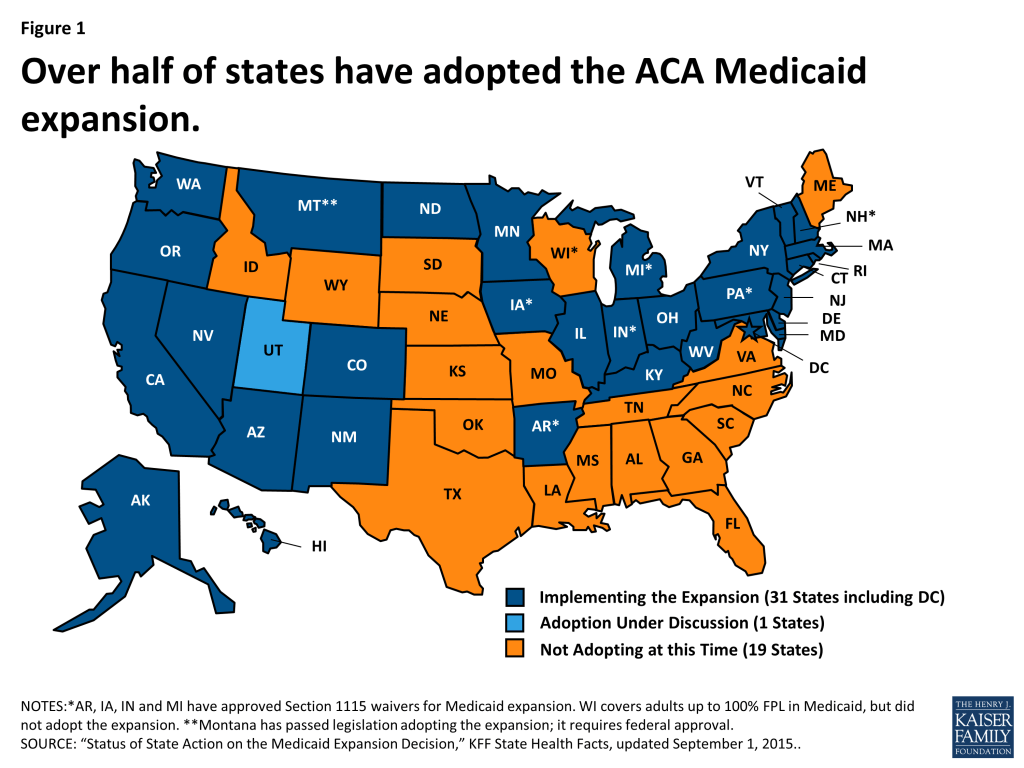
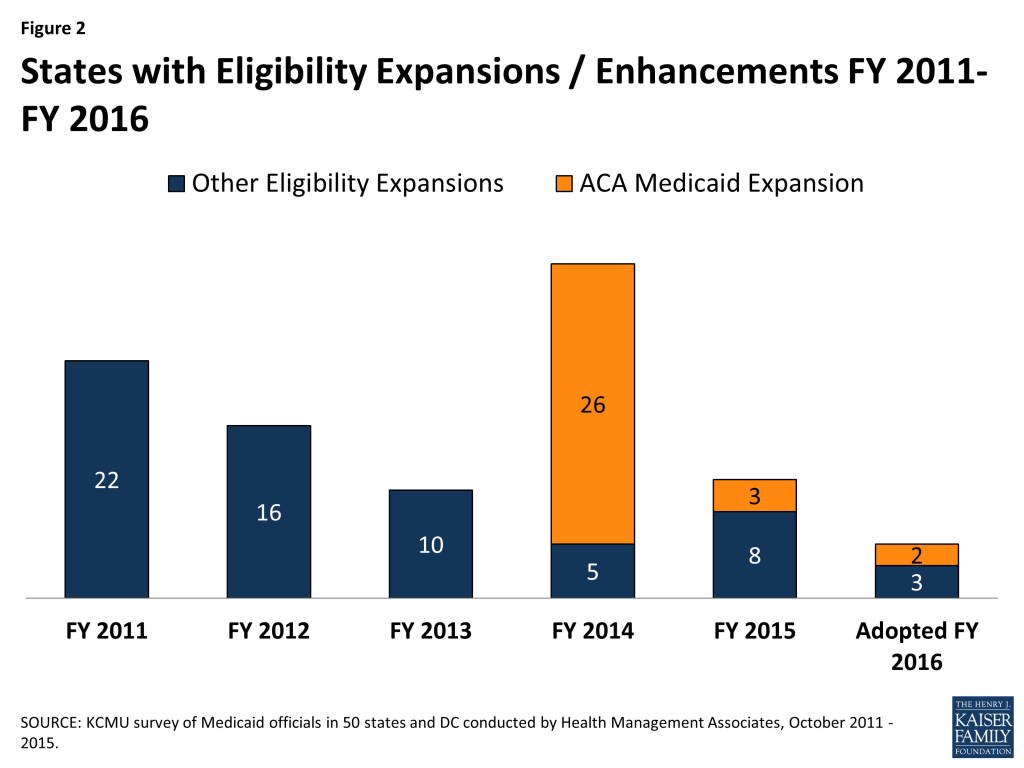
The survey of Medicaid directors across the country, conducted with Health Management Associates, shows big differences across states driven largely by the states’ decisions on the Medicaid expansion. The 29 states expanding Medicaid in FY 2015 reported enrollment and total Medicaid spending growth nearly three times the rate seen in non-expansion states. Adults newly eligible for Medicaid under the ACA with 100 percent federal financing were the primary driver, with enrollment climbing an average of 18 percent and total spending up an average of 17.7 percent in expansion states. By contrast, enrollment and total Medicaid spending grew an average of 5.1 percent and 6.1 percent, respectively, in non-expansion states, with the increase in enrollment largely due to increased participation of previously eligible parents and children.
The survey also finds that state Medicaid spending growth in expansion states (3.4%) was more modest than in non-expansion states (6.9%). Formula-driven changes to traditional federal match rates, particularly in large non-expansion states like Texas, had a disproportionate effect on boosting the average growth in state Medicaid spending across non-expansion states. State Medicaid spending growth in expansion states was much lower than total spending growth because the federal government picked up 100 percent of the costs of covering enrollees who were newly eligible under the ACA. Non-expansion states, in contrast, did not receive this enhanced match rate, and the Medicaid costs in these states are financed jointly by the states and the federal government through the traditional FMAP rates. The 100 percent match rate for Medicaid expansion adults drops to 95 percent in January 2017.
“States that opted to expand Medicaid saw significant gains in coverage, reductions in the uninsured, and access to additional federal funds,” said Diane Rowland, Executive Vice president of the Foundation and Executive Director of the KCMU. “But many other changes are underway in Medicaid programs across the country as states engage in an array of delivery system reforms to help coordinate care and control costs.”
The survey also provides an examination of state Medicaid policy and program changes across the country. It finds that 48 states are using some form of Medicaid managed care, with 39 states contracting with risk-based managed care organizations (MCOs). In other findings, 37 states in either FY 2015 or FY 2016 adopted or expanded payment and delivery system initiatives such as patient-centered medical homes, accountable care organizations and health homes in an attempt to control costs, reward quality or coordinate care. And more than two dozen states have either already taken advantage of at least one of the policy options available in the ACA to promote the use of more home and community-based long-term services and supports, or plan to do so in FY 2016. Over two-thirds of states in FY 2015 and half in FY 2016 say they’ve refined their pharmacy programs to try to rein-in rising expenditures for high-cost and specialty drugs such as hepatitis C antiviral medicines.
These and other findings from the 50-state survey were discussed today at a public briefing held jointly by Kaiser and the National Association of Medicaid Directors (NAMD). The following new reports are available:
Medicaid has long-played an important role in the U.S. healthcare system, accounting for one in every six dollars of all U.S. health care spending while providing health and long-term services and supports coverage to millions of low-income Americans. Medicaid also plays an important role in states budgets as both an expenditure item and the largest source of federal revenue for states.
The years 2015 and 2016 continue a period of significant change and transformation for Medicaid programs. With slow but steady improvements in the economy following the Great Recession, Medicaid programs across the country were focused on implementing a myriad of changes included in the Affordable Care Act (ACA), pursuing innovative delivery and payment system reforms with the goals of assuring access, improving quality and achieving budget certainty, and continuing to administer this increasingly complex program.
However, these changes to Medicaid policy take place in the larger context of states budgets. Unlike the Federal government, states generally have balanced budget requirements, taking into account the amount of revenue coming in from a state’s own resources as well as federal revenues. State lawmakers must balance competing priorities across budget expenditure categories. Even in years of economic growth, state lawmakers face this pressure of balancing priorities.
This report provides an in-depth examination of Medicaid program changes in the larger context of state budgets in three states:
These case studies build on findings from the 15th annual budget survey of Medicaid officials in all 50 states and the District of Columbia conducted by the Kaiser Commission on Medicaid and the Uninsured (KCMU) and Health Management Associates (HMA). Additional research on budget activity, economic conditions, and other relevant health policy activity was conducted by KCMU and HMA staff members; each case study was submitted to its respective state for review and comment.
Issue Brief: Alaska
Economic and Budget Outlook
Economy
In many ways, Alaska is a unique state, with its vast size, sparse population density and richness in natural beauty and natural resources, on which its economy relies heavily, specifically oil. In 2014, the oil industry was responsible for one-third of all employment and 38 percent of all wages.1 The federal government also plays a significant role in the state’s economy, with an active military presence, a substantial portion of land in the state owned by the federal government, and high per capita federal employment in the state.2 Due to these influences, Alaska’s economy has taken a trajectory different from the one seen at the national level. Going back almost a decade, Alaska’s economy was negatively affected by the economic downturn – the unemployment rate increased to 8.0 percent for several months in 2009 and 2010 and the state’s GDP declined during this same period – but the impact was comparatively less and shorter in duration, as the economy was bolstered by increased oil production, higher oil prices and increased revenues to support the state budget.
However, the recent decline in oil prices and federal deficit reduction actions have had a negative effect on the state’s economy. Oil production in the state fell from 729,000 barrels per day in 2008 to 544,000 per day in 2013,3 depressing the state GDP.4 Additionally, job growth slowed, driven in part by declines in federal employment in the state; 2015 was forecast to be the 5th consecutive year of decline in federal employment.5 These economic forces have presented major challenges to state lawmakers in enacting state budgets.
State Budget
Alaska funds its budget unlike any other state in the nation. It is one of seven states without a personal income tax, one of five states without sales tax, and the only state that has neither. Alaska relies almost entirely on revenues from oil taxes and royalties to fund the state portion of its expenditures – about 88 percent of 2014 general fund revenues were derived from oil revenue.6 Recent reductions in oil production and prices have negatively affected the state’s economy and in turn state revenues; according to a Pew Charitable Trust analysis, 2014 4th quarter revenue in Alaska was over 80 percent lower than the 2008 peak.7 This has resulted in a state budget crisis.
Alaska has experienced general fund budget deficits since 2013 that have grown each year.8 In FY 2015, the state ended the year with a deficit of $2.7 billion, which was covered by drawing down funds from the state’s Statutory Budget Reserves Fund. The Statutory Budget Reserves Fund was created to build a “rainy day fund,” setting aside surplus revenues during earlier periods of economic growth and investing for periods of economic downturn.9
When the FY 2016 budget was being developed, the state again faced a multi-billion dollar general fund deficit. The Statutory Budget Reserves Fund had been largely depleted. The Governor’s proposal included a series of spending cuts as well as exploring new sources of revenue and tapping into the Constitutional Budget Reserve Fund (a second rainy day fund which requires three-fourths majority approval to use). The Governor, fulfilling a campaign promise, also proposed adopting the ACA Medicaid expansion, highlighting new federal revenue and potential savings within the state budget. (More detail on this is provided in the next section.)
After two special sessions and much debate, the legislature passed a budget that was signed into law by the Governor. For FY 2016, Governor Walker used his line item veto authority to reduce operating appropriations by $200 million for a total annual budget of $4.95 billion. This represents a 19 percent reduction ($1.1 billion) from FY 2015 budget levels. In spite of the reduction, the state expects a spending deficit of $3.7 billion, partially offset by a $1 billion transfer from the Public Education Fund, reserves used for advance funding of school districts. The remaining $2.7 billion will be covered from the Constitutional Budget Reserve Fund.10
While the state’s reserves can sustain the current expenditure trends until sometime in FY 2018,11 the state recognizes the need to make fundamental shifts for long-term viability. The spending imbalance has prompted the administration to engage state policymakers in a discussion about strategies to return the state to long-term fiscal stability.
Alaska’s Medicaid Expansion
Governor Bill Walker, in keeping with a central campaign promise he made while running for governor as an independent, proposed adopting the Medicaid expansion. In his state of the budget speech, the Governor noted that by expanding Medicaid, the state would be investing in the health of Alaskans and that the expansion would have positive effects on the economy as well as provide additional federal funds and direct general fund savings for budget.12 The Governor’s proposal received support from a number of stakeholders, including the Alaska Chamber of Commerce.13 However, there was much debate between the Governor and legislature over the Medicaid expansion. The Governor put forward the proposal as part of his budget amendments14 and as separate legislation.15 Legislative leaders expressed concerns with expansion related to systems issues as well as a desire to implement additional Medicaid reforms ahead of implementing the expansion.16 After the two special sessions, the legislature reached a budget compromise in June that funded the budget deficit but did not include the Medicaid expansion. The Governor signed the budget into law in June, avoiding a government shutdown.17
In July 2015, Governor Walker moved to expand Medicaid by executive action since Alaska’s legislature had not done so. In an attempt to block the Governor’s actions, the Alaska Legislative Council comprised of House and Senate legislators, voted to sue the governor for exceeding his executive authority and asked the judge to temporarily halt the expansion pending the outcome of the litigation.18 On August 28, the Superior Court judge rejected the Council’s request, and the Alaska Supreme Court concurred on August 31.19 The court rulings cleared the path for the “Healthy Alaska Plan” and for enrollment to begin as planned on September 1, 2015.20
The Healthy Alaska Plan expands coverage to approximately 42,000 uninsured adults, aged 19 to 64, in families earning up to 138 percent of the federal poverty level.21 The Healthy Alaska Plan originally put forward by the Governor and the Alaska Department of Health and Social Services in February 2015 estimated that over half (55 percent) of eligible individuals have incomes below 100 percent of the federal poverty level, and thus would not qualify for premium subsidies to purchase health insurance through the ACA Marketplace. It projected that approximately 21,100 would enroll in FY 2016 with enrollment climbing to 26,500 by 2021.22 In addition, the expansion was expected to provide economic benefit to the state by adding $1.1 billion in new federal revenue, creating 4,000 new jobs; adding $1.2 billion in wages and salaries; and stimulating $2.49 billion in economic activity throughout the state. The Healthy Alaska Plan also noted that the Medicaid expansion was expected to exert downward pressure on the cost of health care and health insurance by reducing the amount of uncompensated care provided by hospitals.23 Additionally, the Healthy Alaska Plan noted that the Medicaid expansion would provide additional federal funds that would facilitate reform efforts to increase cost-effectiveness bend the cost-curve and improve value.24
Delivery System Reforms
Growth in the state’s Medicaid expenditures is reflective of factors affecting the cost of healthcare in general within the state. With 16 percent of the United States’ land mass but only 0.2 percent of its population, Alaska’s vast size, rural/frontier nature and arctic climate add a unique level of complexity in providing health care services to its state residents. In its 2011 “Findings on Health Care Cost, Pricing and Reimbursement in Alaska,” the Alaska Health Care Commission found that physician reimbursement was 60 percent higher than in other highly rural/frontier Western states, commercial reimbursement for private sector hospital services was 37 percent higher, and commercial insurance premiums were roughly 30 percent higher.25 Higher prices are driven in part by the state’s higher cost of living (20-30 percent higher than in the comparison states), higher salaries for health care workers, and by the limited number of providers, particularly in some specialties, resulting in a lack of competition.26 These structural challenges make it difficult to implement cost-effective ways to deliver coordinated care. In fact, Alaska is one of only three states (along with Wyoming and Connecticut) that does not use a comprehensive managed care delivery system for any of its Medicaid enrollees. However, Alaska has embarked on a number of Medicaid reform initiatives to enhance access to care, improve population health and moderate cost growth.
Alaska Medicaid Coordinated Care Initiative
The state has initiated the Alaska Medicaid Coordinated Care Initiative (AMCCI), a voluntary program providing one-on-one case management services including care coordination, scheduling appointments, addressing barriers, and referrals to specialists and social service supports.27 The initial focus of the program will be on decreasing the inappropriate use of emergency rooms. “Super utilizers” account for about three percent of Alaska’s Medicaid population, but about 22 percent of all Medicaid hospital emergency room expenditures. Around 6,000 enrollees had five or more emergency room visits within a one year period.28 The state contracted with MedExpert International, Inc. in December 2014 to provide case management services for participants.
Medicaid Redesign Initiative
In July 2015, Alaska’s Department of Health and Social Services launched the “Medicaid Redesign” initiative with the goals of developing recommendations for reform, by January 2016, that will optimize enrollee health outcomes, drive increased value in the delivery of services and contain costs in the Alaska Medicaid program.29 During the recommendation development process, the state is exploring a variety of delivery system and payment reform options (e.g., managed care models, patient centered medical homes, accountable care organizations and other shared savings models).
Tribal Health System Partnership
Work is currently underway with the Tribal Health System on the development of two Section 1115 waiver initiatives. Initially, the Alaska Department of Health and Social Services intended to develop two Section 1115 waiver initiatives. The first, with a target implementation date of July 2016, would develop medically necessary transportation case management services to facilitate timely and efficient delivery of health care services to Alaska Natives and American Indians (AI/AN) with a 100 percent federal match if the services are coordinated by a Tribal provider. The second waiver, with a target implementation date of July 2018, would expand the scope of Medicaid-reimbursable services available to AI/ANs, and enhance referral coordination.30 Alaska is seeking approval for 100 percent federal match when a Medicaid beneficiary, who is also an IHS beneficiary, is referred by a Tribal Health Provider to a non-tribal health provider. However, U.S. Secretary of Health and Human Services Burwell recently indicated in a letter to Governor Walker that DHHS is pursuing a policy change and 1115 waivers would not be necessary.31 Currently, the State is awaiting further policy clarification before implementing these initiatives.
Other Medicaid Initiatives
DHSS, in collaboration with multiple state agencies, released a request for proposals in July 2015 for assistance with developing a 1915(i) HCBS benefit and 1915(k) Community First Choice Medicaid State Plan option. The initiatives would serve eligible individuals with physical, cognitive, intellectual and behavioral health needs whose income qualifies them for Medicaid and who have functional needs, but who may or may not meet institutional level of care requirements. The state expects the design phase to be completed by July 2016 for implementation in July 2017.32
The state is also engaged in a feasibility study to examine various health care provider tax methodologies, and the fiscal and economic impact of such taxes in Alaska. The study is expected to result in recommendations for a specific health care provider tax for implementation, which will be the basis for health care provider tax legislation in the 2016 legislative session.33
Alaska Medicaid Policy Changes FY 2015 and FY 2016
Eligibility Changes
Implemented the ACA Medicaid expansion on September 1, 2015.
Provider Rates and Provider Taxes/Assessments
Increased rates for inpatient and outpatient hospitals, specialists and nursing facilities in FY 2015.
Froze rates for all providers except specialists in FY 2016.
Continued primary care physician payment levels at or above Medicare rates (state is one of a handful that did so prior to the ACA required primary care increase).
Pharmacy
Transitioned from using a state Maximum Allowable Cost to using the NADAC as the basis for maximum allowable cost for both brand name and generic drugs in FY 2015.
Reduced the pharmacy ingredient cost reimbursement in FY 2015, with a corresponding increase in dispensing fees.
Delivery System and Payment Reforms
Implemented Medicaid Coordinated Care Initiative (AMCCI) in FY 2015 with an initial focus on decreasing the inappropriate use of emergency rooms.
Issue Brief: California
Economic and Budget Outlook
Economy
California, like many other states, has seen continually improving economic conditions since the Great Recession, during which California experienced record unemployment (peaking at 12.2 percent), major budget shortfalls, and declines across all major industries. California’s economy began its recovery from the last recession in June 2009, paralleling the economic recovery for the U.S. After six years of slow growth, the state’s economy is now on more solid ground.34 The state has recovered all of the jobs lost during the recession,35 and in recent months, job growth in California has outpaced the national average, with notable growth in professional and business services and construction sectors.36 The state’s annual GDP has been growing faster than the national rate for the last few years. As of August 2015, California’s unemployment rate had fallen to 6.1 percent, remaining above the national average (5.1 percent) as nearly 1.2 million California residents remain unemployed.37
State Budget
California’s budget situation has improved in recent years. The state had faced several years of challenging budget conditions that were made more difficult by the Great Recession. At the height of the downturn, the state faced several years of multi-billion dollar budget shortfalls38 that required a number of policy actions to curb spending and increase revenue, including a temporary increase in personal income tax rates for higher income earners (over $250,000) along with other tax increases approved by California voters through Proposition 30 in November 2012. In 2014, for the first time since 2007, California ended its fiscal year with a positive General Fund balance totaling $1.9 billion, due to much larger than anticipated growth in revenues from personal income taxes and corporate taxes.39 In 2014 the state also implemented the Medicaid expansion, opened its state-based health insurance Marketplace, and invested in outreach and enrollment efforts.40
California’s budget processes for FY 2015 and FY 2016 started off with budget surpluses, allowing the state to continue to pay down debt, restore some previous cuts, and make additional investments. The FY 2016 budget, signed by Governor Brown on June 25, 2015, totaled $168 billion. It holds total general fund spending relatively flat (increasing just 0.8 percent over last year) while increasing spending on education, health care, in-home supportive services (IHSS), workforce development, drought assistance, and the judiciary.41 In addition, the state is expanding full-scope coverage through existing Medi-Cal managed care for undocumented children; this coverage is financed with state-only dollars. The state is also focused on building reserves; the state estimates there will be $4.6 billion in state reserve accounts at fiscal year-end.42
Affordable Care Act Coverage Expansion
The 2010 Affordable Care Act (ACA) was designed to expand coverage to a majority of the non-elderly uninsured across the country through the Medicaid expansion and the creation of health insurance Marketplaces in states. These ACA coverage provisions took effect on January 1, 2014. California was one of a several states that opted to expand coverage to low-income adults before 2014.
Early Implementation Efforts: Low-Income Health Program (LIHP)
Since 2010, the state uninsured rate has dropped dramatically. In 2010, out of a total population of 37 million, there were 6.8 million nonelderly uninsured in California.43 In 2010, well before the major gains in coverage under the ACA, California expanded coverage to uninsured, low-income adults through the creation of the Low-Income Health Program (LIHP) under their “Bridge to Reform” Section 1115 Medicaid Demonstration Waiver.
California has a history of county-delivered health care services, as counties have traditionally had broad authority over the provision of health-related services. Building on an existing coverage initiative, LIHP was county-based coverage that was financed with county funds and federal funds at the state’s regular matching rate (no dollars from the state General Fund were used).44 County participation was voluntary. LIHP benefits were more limited than those available to state Medicaid beneficiaries. Counties could use an open fee-for-service (FFS) system or a closed managed care system, or a combination of the two systems. Between July 2011 and December 2013, LIHP coverage was provided through 19 LIHP programs across 53 of the state’s 58 counties.45 By the end of 2013, over 650,000 people were enrolled in the program.46
Medicaid Expansion and Marketplace Coverage
In January 2014, California expanded its Medicaid program, known as Medi-Cal, statewide to cover low-income adults at or below 138 percent FPL. Individuals at or below 138 percent FPL who gained coverage under the early LIHP expansion were automatically enrolled in Medi-Cal coverage. As a result, approximately 630,000 LIHP beneficiaries were auto-enrolled in Medi-Cal.47 Subsidized private coverage became available to adults with moderate incomes (between 139 – 400 percent FPL) through California’s state-based health insurance Marketplace, known as “Covered California.” An estimated 25,000 LIHP beneficiaries transitioned to Covered California.48
In addition to automatically transitioning LIHP beneficiaries to ACA coverage options in 2014, California took several other steps to simplify and streamline enrollment under the ACA including creating a single online portal for Covered California and Medi-Cal applications and adopting the Express Lane Enrollment Project to target and enroll state Supplemental Nutrition Assistance Program (SNAP) beneficiaries in Medi-Cal coverage. The state also invested heavily in outreach and enrollment efforts for both Medi-Cal and Covered California. Covered California established an Assisters Program and worked with community organizations to provide direct assistance to consumers to help them enroll in coverage.
Medi-Cal coverage grew by 30 percent (or 2.8 million people) between the fall of 2013 and the end of 2014.49 Approximately 1.7 million people applied for and were determined eligible for Covered California health plans between October 2013 and October 2014.50 From 2013 to 2014, California’s uninsured rate declined from 19.1 percent to 13.4 percent.51
Despite much success in enrollment, California—like most other states—experienced enrollment and outreach challenges in 2014 including a shortage of in-person assisters, problems with cultural and linguistic resources, and technology/systems issues with the Covered California website. These system issues led to a significant Medi-Cal application backlog. In late 2014 and 2015, the state successfully addressed many of these challenges, largely resolving the backlog issue.52
Delivery System And Payment Reform
In addition to coverage expansions, DHCS has increasingly focused on delivery system and payment reform – to expand access for Medi-Cal beneficiaries, to improve care quality and health outcomes, and to reduce costs to create a more sustainable program.
Delivery System Reform Incentive Payment (DSRIP) Initiative
In 2010, California was the first state to secure a DSRIP waiver, effectively establishing the basic framework for future DSRIP waivers – the distribution of funds to safety net providers that agree to meet defined metrics and goals. California pursued a DSRIP initiative to provide financial support and stability to its 21 public hospital systems (referred to as “designated public hospitals”) and to “jump start” public hospital system preparation for broader health reform implementation. California’s $6.67 billion dollar DSRIP initiative was financed entirely by the state’s 21 public hospital systems and the federal government.53
Participating public hospitals were required to implement projects in the following areas: infrastructure development (e.g., disease management registries, enhancing performance improvement and reporting capacity); innovation and redesign (e.g., medical homes); population-focused improvement (e.g., diabetes care management and outcomes); and urgent improvement in care (e.g., central line-associated infection prevention). In 2012, the state added the HIV Transition Incentive Program to DSRIP, a new optional project, to strengthen public hospital capacity to serve individuals diagnosed with HIV, particularly LIHP enrollees previously served under programs funded by the Ryan White HIV/AIDS Treatment Extension Act of 2009.54 The state’s waiver gave individual hospital systems broad flexibility to determine the specific projects they would pursue and the benchmarks they would attempt to meet – acknowledging hospital systems were at different starting points along the spectrum of delivery system reform. To receive DSRIP funds, participating public hospitals were required to achieve project-specific milestones.
Since each public hospital system developed an individualized implementation plan, it is hard to tell a statewide story involving how much DSRIP has accomplished to date. It is also challenging for the state to assess the impact of DSRIP projects in advancing the state’s broader vision for delivery system reform.55 To address these issues, California proposed a more standardized DSRIP approach in its waiver renewal application (described in more detail below) that includes the use of required core project components and standardized outcome and quality metrics.
In March 2015, California submitted a renewal application for its Bridge to Reform waiver, which was renamed “Medi-Cal 2020.” The renewal requests authority for a series of delivery system transformation and alignment programs, including the continuation of DSRIP funding for public hospital systems. The proposed waiver expands the scope of DSRIP-eligible institutions to 42 safety net institutions run by health care districts (referred to as “non-designated public hospitals”). These institutions are predominantly located in rural areas and are often the only hospitals serving their communities. The application requests a funded planning period of up to one year for these safety-net hospitals to build the infrastructure necessary to participate in the program. Proposed DSRIP project domains noted in the Medi-Cal 2020 renewal include:
system redesign (e.g., improving care transitions, physical and behavioral health integration);
care coordination for high-risk, high-utilization populations (e.g., health homes, complex care management);
resource utilization efficiency (e.g., appropriate use of antibiotics, high cost imaging and pharmaceuticals);
prevention (e.g., obesity, cancer); and
patient safety in ambulatory care (e.g., medication reconciliation).
Managed Care
California’s Department of Health Care Services (DHCS) has a long history with managed care plans.56 Over time, DHCS has expanded Medicaid managed care to all 58 counties, with each county choosing its own managed care model. As a result, several different managed care models operate across the state. All models include commercial plans and/or county-run plans. In most counties Medi-Cal beneficiaries choose between at least two managed care plans. However, in some less-populated counties beneficiaries have access to only one county-run plan.57
At the start of the 2010 Bridge to Reform waiver, 55 percent of Medi-Cal beneficiaries were enrolled in managed care. Today, nearly 80 percent of Medi-Cal beneficiaries, or more than 9 million beneficiaries, are enrolled in managed care.58
In addition to the expansion of managed care statewide, in recent years the state has expanded managed care to new Medi-Cal populations, including seniors and persons with disabilities (SPDs). Managed care expansions involving SPDs are described in the next two sections followed by a discussion of managed care systems transformation and improvement strategies outlined in the Medi-Cal 2020 proposal.
Mandatory Managed Care for Seniors and Persons with Disabilities (SPDs)
The Bridge to Reform waiver authorized the expansion of mandatory Medicaid managed care for seniors and persons with disabilities (SPDs) enrolled in fee-for-service (FFS) Medi-Cal.59 By enrolling SPDs in managed care the state aimed to increase access, improve care coordination, and achieve cost efficiencies.60 Because of the complex care needs of SPDs, managed care plans had to meet extensive readiness requirements. The state was required to conduct outreach and engagement activities to encourage active plan selection among beneficiaries and to educate beneficiaries about the new delivery system.61 The state took a phased approach to enrolling Medi-Cal SPDs into managed care over a 12 month period beginning June 2011. During this period, nearly 240,000 FFS SPDs were transitioned to Medicaid managed care plans across 16 counties.62 Although the state engaged in significant planning efforts to try to ensure the smooth transition of SPDs to managed care, a multitude of challenges arose. Some challenges included beneficiary data sharing delays that hindered health plan and provider readiness; plan difficulty recruiting providers with expertise in complex care; lack of provider training in care coordination; and inadequate/confusing beneficiary outreach materials.63,64 The state is using experience gained from this SPD transition to inform similar transitions in an additional 19 (rural) counties65 and the transition of dually eligible beneficiaries into managed care; both of these latter transitions began in 2014.
Coordinated Care Initiative
California’s 2012-2013 state budget established the Coordinated Care Initiative. This initiative was authorized by CMS through an amendment to the Bridge to Reform waiver. Through this initiative, the state aims to transform the Medi-Cal delivery system to better serve seniors and persons with disabilities. The initiative involves two major components: Cal MediConnect and Managed Medi-Cal Long-Term Services and Supports (MLTSS).
Cal MediConnect is a three year demonstration program for Medicare and Medi-Cal dual eligible beneficiaries. Typically, across states, very little coordination has occurred between Medicare and Medicaid programs. Cal MediConnect seeks to integrate care and improve health outcomes for dual eligible beneficiaries through the alignment of Medicare and Medicaid financing. Under Cal MediConnect, a single health plan is responsible for coordinating medical, behavioral health, long-term institutional, and home- and community-based services for beneficiaries. Enrollment in Cal MediConnect began in April 2014. The demonstration is operating in 7 counties. The state is using a passive enrollment system, where eligible beneficiaries are enrolled into a MediConnect health plan unless they actively “opt-out.” Beneficiaries may opt-out or change plans at any time. As of June 2015, enrollment in the demonstration had reached nearly 130,000 beneficiaries.66 As of July 2015, the opt-out rate, excluding Los Angeles County, was 33 percent. Los Angeles County experienced a higher opt-out rate of 51 percent.67
Under the Managed Medi-Cal MLTSS initiative, all Medi-Cal beneficiaries (in demonstration counties), including dual eligible beneficiaries, are required to join a Medi-Cal managed care plan to receive LTSS and other Medicaid-covered benefits. Most people with Medi-Cal only are already enrolled in a Medi-Cal managed care plan, however, now they will also obtain LTSS through their health plan.68
Managed Care Systems Transformation & Improvement Programs
The Medi-Cal 2020 proposal outlines payment reform strategies the state believes will promote collaboration and shared accountability across managed care plans and providers. The state believes these strategies will lead to improved care quality and beneficiary health outcomes and reduced costs. Core strategies described in the Medi-Cal 2020 proposal include:
Shared Savings Incentives with Managed Care Plans – A shared savings incentive for managed care plans based on total cost of care and performance on quality metrics. Managed care plans would be required to form partnerships with providers and behavioral health systems, what the state is referring to as “accountable care groups.”
Standardization of Pay-for-Performance programs – The standardization of core elements of managed care plan pay-for-performance (P4P) programs to ease administrative burden on providers and drive quality improvement.
Physical and Behavioral Health Integration – Incentives to improve coordination between managed care plans and county mental health plans and provider incentives to promote the integration of mental and physical health care services, through coordination or co-location approaches.
Fee-for-Service Transformation
Most services are provided under Medi-Cal managed care plans, although some services are still provided through Medi-Cal’s fee-for-service program, namely dental services and maternity care. The state has proposed, in the Medi-Cal 2020 renewal application, to introduce provider incentives to expand access to oral health services and to increase preventive service utilization. The state also proposed a Hospital Incentive Program to promote evidence-based obstetrical care to improve quality and reduce costs.
Increased Access to Housing and Supportive Services Programs
As part of the Medi-Cal 2020 renewal proposal, the state aims to improve care coordination for vulnerable populations including those experiencing homelessness. The state is proposing to include enhanced tenancy support and intensive medical case management services for individuals who are homeless and meet other high-risk criteria. The state also envisions the formation of regional housing partnerships that would be eligible to receive incentive funding to establish and support integrated care partnerships focused on housing. The state would require partnerships to include managed care plans, county health agencies, cities, hospitals, and housing and social service providers.
Additional Areas of Policy Change in FY 2016
Significant adjustments made to the 2015-2016 DHCS budget include: increased Medi-Cal spending due to expected caseload growth (including the expansion of state-funded coverage for children regardless of immigration status); restoration of the 10 percent dental provider rate reduction; increased managed care rates; funding for behavioral health treatment services for individuals with Autism; funding for ACA Section 2703 Health Homes; and funding to restore in-home supportive services (IHSS) hour cuts.
While signing the Budget Act, Governor Brown called for a special legislative session to address Medi-Cal financing issues related to the state’s managed care organization (MCO) tax and continued funding for the IHSS restoration. The special session, which began June 19, 2015, is considering the Governor’s proposal to restructure the managed care organization tax which is set to expire at the end of this fiscal year. A letter from CMS raised concerns about the current tax structure – noting the tax does not meet the federal requirement to be broad-based.69 The current tax is estimated to generate $1.1 billion in FY 2016 that can then be used finance care and to draw down federal matching dollars. This special session will also consider how to fund the IHSS restoration in future years.
California Medicaid Policy Changes in FY 2015 and 2016
Eligibility, Application and Renewal Policies
Expansion to full-scope Medi-Cal coverage for pregnant women between 60-133% FPL in FY 2015.
MAGI based income standards for family planning (Family PACT) eligibility in FY 2015.
Provider Rates and Provider Fees/Taxes
Increased MCO and Nursing Facility rates in FY 2015. All other rates were held flat.
Plan to increase MCO, Nursing Facility, and Dentists’ rates in FY 2016. Plan to hold all other rates flat.
Medicaid MCO tax expires in FY 2016. Legislative plan to make this tax broad-based will be discussed in a special legislative session.
Benefits and Pharmacy
New behavioral health treatment benefit for children with Autism in FY 2015.
Restoration of previous cuts in In-Home Support Services (IHSS) in FY 2016.
New clinical guidelines for treatment of Hepatitis C will be released in FY 2016.
Managed Care
HCBS and institutional LTSS added to managed care under the Coordinated Care Initiative in FY 2015.
Substance abuse services moving to an Organized Delivery System operated by counties in FY 2016.70
Health plans participating in the Medicare-Medicaid Financial Alignment Demonstration have a quality withhold of 1% in FY 2015 and 2% in FY 2016.
In FY 2016, DHCS will introduce an updated health plan Quality Award.
Delivery System and Payment Reform
Plan to submit 2703 Health Homes SPA in FY 2016. Health Homes will focus on high utilizers including individuals experiencing homelessness.
Plan to introduce “ACO-like” initiatives (as part of 1115 waiver renewal) in FY 2016.
Plan to continue DSRIP initiative (part of 1115 waiver renewal) in FY 2016.
All-payer claims database initiative led by HHS (not DHCS) in FY 2016.
Long-term Services and Supports Rebalancing
Plan to expand the number of persons served in HCBS waivers in FY 2016.
Plan to expand the number of persons served under the HCBS State Plan Option 1915(i) in FY 2016.
Plan to build rebalancing incentives into managed care contracts covering LTSS in FY 2016.
Plan to add a new PACE site or increase the number of persons served at PACE sites in FY 2016.
Plan to close/down-size a state institution and transition residents into community settings in FY 2016.
Issue Brief: Tennessee
Economic and Budget Outlook
Economy
Tennessee’s economy has seen continual improvements in economic conditions since the Great Recession, during which Tennessee experienced record unemployment (peaking at 11.1 percent) as well as steep declines in state revenues. The state has recovered all of the jobs lost during the recession.71 Nonfarm and manufacturing sectors in the state have outgained national growth.72 The unemployment rate has steadily declined to 5.7 percent in August 2015, though the state’s unemployment rate continues to be slightly above the national average (5.1 percent).73 State tax revenue collections have also continued to improve since the recession. State revenue collections were up 4.6 percent in the third quarter of 2014, exceeding growth of 3.2 percent in the Southeast Region and 4.4 percent nationally.74 By the end of FY 2015, the state had collected $605.7 million75 more than the original budgeted estimate of $12.1 billion (which had assumed 3.17 percent growth76 ).
State Budget
Governor Bill Haslam’s budget proposal for FY 2016, presented to the Tennessee General Assembly in February 2015, was based on a conservative revenue estimate of 2.53 percent and continued slow growth in the economy. The Governor proposed strategic investments in higher education and in primary and secondary education, including teacher pay, but also proposed cuts in other program areas to stay within projected revenue growth for the year.77 Health care cuts included downsizing of a state-run facility for individuals with Intellectual and Developmental Disabilities and limiting new eligibility for certain in-home long-term services and supports78 under the state’s Section 1115 Medicaid waiver to only individuals who meet the income and disability standards for SSI.79 He also proposed and received an increase from 5.5 percent to 6 percent for 2016 in the state’s assessment on health maintenance organizations including those that manage benefits for Medicaid beneficiaries through its TennCare program. In addition, the General Assembly passed a bill to increase nursing home assessments FY 2016. The Tennessee General Assembly approved the FY 2016 budget on April 16, 2015 after rejecting attempts to add a provision to authorize an expansion of Medicaid (described further below).80
Affordable Care Act Update
Governor Haslam, who was reelected by a wide margin in 2014, proposed an alternative to Medicaid expansion in early 2015 that enjoyed strong support from both business and health care organizations.81 “Insure Tennessee” would have relied on Section 1115 waiver authority. The plan offered uninsured Tennesseans, ages 19-64, earning less than 138 percent FPL a choice between a defined contribution which could be used to purchase employer-sponsored insurance in the private market or enrollment in a managed care plan with a benefit package identical to Medicaid. The managed care option provided Health Savings Accounts, with incentives for healthy behaviors, and included premiums and copayments for individuals above 100 percent of the federal poverty level. The state’s share of expansion costs would have been covered by an increase to an existing hospital assessment on net patient revenue.82
The Governor convened a special session of the legislature in February to seek legislative approval to move forward with Insure Tennessee but the proposal was voted down in a Senate committee formed to hear the bill, bringing the special session to a close. Subsequently, the bill was reintroduced by members of the legislature in the regular session and passed out of the Senate General Welfare Committee only later to be voted down in the Senate Commerce Committee. It was not taken up in the House during regular session. Conservative lawmakers who opposed Insure Tennessee expressed concerns over the potential long-term costs to the state and the difficulty the state would face if it were to try to repeal Medicaid expansion in future years.83
The state already covers parents to 101 percent of the FPL and pregnant women to 200 percent FPL under the existing TennCare program84 , and reported significant increases in Medicaid enrollment in 2015 for non-elderly, non-disabled adults, pregnant women and children. These increases are thought to reflect more parents seeking required insurance coverage under the Affordable Care Act, including through applications made to the Federally-Facilitated Marketplace (FFM). The state is projecting enrollment growth to slow in 2016.
In 2012, Tennessee contracted with a vendor to redesign the program’s eligibility system to enable online applications for eligibility and to reflect other new requirements under the Affordable Care Act, expecting the new system to begin accepting applications by October 2013.85 However, contractors were unable to meet this and subsequent deadlines. Due to the challenges and delays, individuals were unable to apply for Medicaid through an online portal at the state level. The state instead encouraged TennCare applicants to apply through the federally facilitated marketplace at www.healthcare.gov,86 and makes computer kiosks available in all county Department of Human Services offices to support this process. Some Tennesseans experienced difficulties in 2014 obtaining timely eligibility decisions through the federally facilitated marketplace. A class action lawsuit was filed against the state in July 2014 on behalf of individuals who claim to have been harmed by delays in enrollment into TennCare.87 TennCare now offers a “delay hearing” process to individuals who have not received their eligibility determination within 45 days or 90 days, depending on application type.88 After an independent review of the work completed on the Tennessee Eligibility Determination System (TEDS), the state announced in early 2015 it was bringing in a new vendor to complete the system redesign,89 and the state now expects to have its new system fully operational in 2018.
Managed Care and Health System Reform in Tennessee
Tennessee initiated the use of capitated managed care arrangements in 1994 with the creation of TennCare under its Section 1115 demonstration waiver. The state has enrolled all Medicaid populations in managed care arrangements since 1994, though the state has continued to innovate in its delivery and financing arrangements to address specific state program goals. Today, most services are provided as part of a comprehensive contract with three statewide managed care organizations (MCOs).90 In 2010, Tennessee incorporated TennCare CHOICES91 into the TennCare MCO contracts, thereby including long-term services and supports for older adults and people with physical disabilities in comprehensive managed care. Most outpatient pharmacy services, however, are “carved-out” and paid on a fee for service basis (managed by a pharmacy benefits manager).
The Health Care Finance Administration, within the Tennessee Department of Finance and Administration, administers the TennCare program, working with and through contracted private health plans to achieve Medicaid program improvement goals. For example, the state’s commitment to improving the quality of care for beneficiaries is pursued through a variety of initiatives. TennCare requires MCOs to be NCQA accredited, and plans are required to report a full set of HEDIS and CAHPS measures to the state. The state will pay a performance incentive for high performance in selected HEDIS measures and year-over-year improvement against standards established in annual contracts with the state. Current performance targets include timeliness of prenatal and post-partum care; measures of asthma and diabetes care; follow-up care for children prescribed with ADHD medication; adolescent well-care visits and immunizations; and antidepressant medication management, among others. The 2016 contract year will begin a new three-year cycle for quality improvement. There is also a monthly withhold that must be earned back by plans through meeting state performance expectations. TennCare officials point to achieving improvement in quality scores in the program, even while maintaining low PMPM cost trends.
In recent years, the state has required its health plans to undertake initiatives to reduce the rate of early elective deliveries; for example, since 2011, plans can pay no more for C-sections than for vaginal deliveries.92 TennCare has also implemented Patient-Centered Medical Homes (PCMHs) through its MCOs and is working now to align these programs across plans. Further, under its State Innovations Models (SIM) grant from the Center for Medicare & Medicaid Innovation (CMMI), Tennessee is pursuing a multi-payer approach to PCMHs, beginning with 12 sites in 2016. The goal is to improve prevention and management of chronic disease, increased coordination and integration across multidisciplinary provider teams, and improved wellness and preventive care within the state. As part of this broader initiative, Tennessee plans to create a statewide TennCare Health Homes initiative in 2016 for individuals with Severe and Persistent Mental Illness, to further promote effective integration of physical health care, behavioral health care, and long-term services and supports within the state.
The state’s SIM grant is supporting a wide array of reform initiatives that the state anticipates will help providers build capacity in their practices to transition to value-based payment and delivery models. The state established a goal to introduce 75 Episodes of Care (EOC) payments over five years; the first three EOCs for acute asthma exacerbation, perinatal and total joint replacement (hip and knee) are fully implemented, design has been completed for another five episodes and design is underway for 12 additional episodes.93 The SIM grant will also be used to develop quality and acuity-based payments for long-term services and supports.
In addition, the state’s SIM grant is supporting the Department of Health in development of a statewide stakeholder process to develop a plan for improved population health. This will include the use of economic analysis and forecasting during the development of the State Health Plan to identify health disparities and “hot spot” populations accounting for a disproportionate share of health care costs. The Department of Health will also use grant awards to Tennessee academic public health programs to address five population health priority topics: obesity, diabetes, tobacco use, child health, and perinatal health.
Pharmacy
TennCare officials report that pharmacy costs are a significant upward pressure on expenditures in the program, fueled by the cost of new Hepatitis C treatments, generic drug price increases, and especially the cost of biosimilars and certain specialty agents (e.g., for cystic fibrosis and cholesterol lowering treatments). The state, which has managed the pharmacy benefit closely through its single statewide pharmacy benefits manager (PBM) for many years, implemented policy changes in 2015 and plans additional changes in 2016 to counter this pressure.
After reporting growth in pharmacy expenditures of 23 percent in FY 2014 over FY 2013, TennCare implemented pharmacy ingredient cost reductions as it moved to AWP-15% for brand name drugs in 2015, and also implemented tighter management of specialty agents. For example, oncology agents are limited to a 14 day supply on initial fill, the state has introduced edits to identify late refills for Hepatitis C treatment to better ensure medication compliance, and select specialty agents have been designated as “MCO-reimbursed only” when administration should only be performed in a healthcare facility. The state also introduced new prior authorization requirements for ADHD stimulant agents prescribed for adults and on the use of compounded prescription medications to ensure that all compounded prescriptions are medically necessary and FDA-approved or otherwise supported by CMS-recognized compendia.94
Additional planned reductions for 2016 include a 2 year lifetime limit for individuals being treated for opioid addiction with Buprenorphine-containing medications.95 TennCare implemented a “New Drug” Review Policy that will implement clinically relevant prior authorization criteria and point-of-sale rejections until new agents are appropriately review by the state’s Pharmacy and Technology committee. The state also plans to transition to Guaranteed Net Unit Price (GNUP) contracting with pharmaceutical manufacturers.
Limiting new LTSS enrollment into a 1915(i)-like group (CHOICES III, offered under 1115 authority) to SSI eligibles only in FY 2016. People already enrolled in the group under institutional income standards will be grandfathered.
Implemented new policy to suspend Medicaid eligibility upon incarceration (rather than terminate96 ).
Delivery System and Payment Reforms
Continuing to expand the use of Episodes of Care. (FYs 2015 and2016)
Expanding the use of PCMHs. (FYs 2015 and 2016)
Planning to implement of health homes for those with severe and persistent mental illness. (FY 2016)
Implemented individual cost cap in one 1915(c) waiver for individuals with intellectual disabilities in FY 2015. (People whose services exceeded the cap were transitioned to another waiver with an aggregate cost cap, such that their services were not reduced.)
Provider Rates and Provider Fees/Taxes
Across the board 1% rate cuts for MCOs and many ancillary providers in FY 2015 which were continued in FY 2016.
Increase nursing facility assessment in 2015 and 2016 and TennCare MCO tax in 2016 (from 5.5% to 6%)
Benefits and Pharmacy
Reducing pharmacy ingredient cost reimbursement (no change in the dispensing fee).
Adjusting the state’s PDL to add new prior authorization for ADHD stimulant agents for adults. (2015)
Planning to transition supplemental rebates to Guaranteed Net Unit Price (GNUP) contracting with pharmaceutical manufacturers. (October 2015)
Implementing new pharmacy cost-containment measures targeted to specialty drugs, such as new prior authorization requirements and edits on specialty agents. (FYs 2015 and 2016)
Implementing additional pharmacy cost-containment measures such as management of compound drugs (2015) and instituting a 2-year life-time limit on use of Buprenorphine-containing medications for opioid addiction treatment (2016).
Another unusual aspect of Alaska’s budget is revenue generated from investment activity, representing over 46 percent of total revenue in 2014. Alaska’s total reserves, approximately $64 billion, are comprised of three funds: Permanent Fund, Statutory Budget Reserve Fund ($1.65 billion), and the Constitutional Budget Reserve Fund ($10.13 billion). The Permanent Fund, which accounts for 90 percent of investment earnings, provides direct payouts in the form of dividends to Alaskan residents. In June 2015, Alaska’s Permanent Fund reserves totaled $52.8 billion after accounting for the dividend transfer. Only about 2.4 percent of investment income from the funds accrued to unrestricted General Fund in 2014 for state funded services.
Alaska Permanent Fund Corporation, Fund News – Permanent Fund up 4.9 percent (Alaska: Alaska Permanent Fund Corporation, August 20, 2015), http://www.apfc.org/home/Content/pressroom/pressStory2009.cfm?story=Permanent%20Fund%20up%204%2E9%20percent&s=1&i=606. ↩︎
This assumes the state does not utilize reserves from the Permanent Fund. The state’s constitution, which established the fund, prohibits utilizing the principal, but does not prohibit use of earnings for funding state operations. ↩︎
It is one of two states (Hawaii is the other) for which the federal government adjusts its calculation of the federal poverty level to account for an elevated cost of living. In 2015, the federal poverty level for a family of three is $20,090 for 48 states and D.C. For Alaska that level is set at $25,120, about 25 percent higher.
Office of the Assistant Secretary for Planning and Evaluation, 2015 Poverty Guidelines (Washington, DC: U.S. Department of Health and Human Services, September 2015), http://aspe.hhs.gov/2015-poverty-guidelines. ↩︎
“Alaska Medicaid Coordinated Care Initiative (AMCCI),” Alaska Department of Health and Social Services Division of Health Care Services, accessed October 6, 2015, http://dhss.alaska.gov/dhcs/Pages/amcci/default.aspx. ↩︎
Bureau of Labor Statistics, State and Area Employment, Hours, and Earnings from the Current Employment Statistics Survey, “Total Nonfarm Employment (Series ID: SMS06000000000000001) December 2007 through August 2015”accessed October 6, 2015, http://data.bls.gov/cgi-bin/dsrv. ↩︎
“Economy at a Glance,” Bureau of Labor Statistics, accessed October 6, 2015, http://www.bls.gov/eag/eag.ca.htm.
Bureau of Labor Statistics, Employment, Hours, and Earnings from the Current Employment Statistics Survey, accessed October 6, 2015, http://data.bls.gov/cgi-bin/dsrv. ↩︎
For LIHP beneficiaries with incomes at or below 133% FPL, federal funds were available to match county expenditures at the state’s regular federal medical assistance percentage (FMAP) rate. Matching funds were not capped for these beneficiaries because the state could have covered this optional group without a waiver. However, counties had the option to expand coverage up to 200% FPL; counties had the option to cap enrollment for these beneficiaries since federal funds were only available to match county expenditures up to a maximum $630 million for those over 133% FPL. ↩︎
The expansion excluded dual eligible beneficiaries (i.e., those enrolled in Medi-Cal and Medicare) as well as beneficiaries receiving long-term care services. ↩︎
Carrie Graham, Diana McDonnel, Kira Foster and Susan Ivey, The Transition of Senior and People with Disabilities to Medi-Cal Managed Care: The beneficiary perspective – Prepared for the California HealthCare Foundation and the California Department of Health Care Services (California: Health Research for Action at the University of California – Berkley, March 2014), http://www.healthresearchforaction.org/sites/default/files/SPDTransitions_FNL_Rpt_Web%20Mar%2014.pdf. ↩︎
One of the federal requirements related to the use of provider taxes in Medicaid requires that the tax be broad-based. Currently the state taxes MCOs on the revenue received from their Medi-Cal managed care plans only.
For more information on the tax, see the following LAO brief:
California Legislative Analyst’s Office, Overview of MCO Tax, Selected Other Tax Increase Options, and IHSS Issues (California: California Legislative Analyst’s Office, July 2015), http://www.lao.ca.gov/handouts/health/2015/Overview-of-MCO-Tax-070215.pdf.
For further information on the requirements see the following brief:
Kaiser Commission on Medicaid and the Uninsured, Medicaid Financing Issues: Provider Taxes (Washington, DC: Kaiser Commission on Medicaid and the Uninsured, May 2011), https://modern.kff.org/medicaid/fact-sheet/medicaid-financing-issues-provider-taxes/. ↩︎
This change, Substance Abuse Services moving to an Organized Delivery System operated by counties, is described in the main Budget Survey Report as movement to a PHP arrangement in FY 2016, because in federal terms the program falls under a PIHP. However, the state notes this arrangement isn’t a PIHP in a traditional sense. ↩︎
Bureau of Labor Statistics, State and Area Employment, Hours, and Earnings from the Current Employment Statistics Survey, “Total Nonfarm Employment (Series ID: SMS47000000000000001) December 2007 through August 2015”accessed October 6, 2015, http://data.bls.gov/cgi-bin/dsrv. ↩︎
Tennessee Department of Labor & Workforce Development, Tennessee’s Unemployment Rate for July 5.7% (Tennessee: Tennessee Department of Labor & Workforce Development, August 20, 2015), https://www.tn.gov/workforce/news/17178. ↩︎
Center for Business and Economic Research, Tennessee Business and Economic Outlook: Spring 2015 (Knoxville, Tennessee: Center for Business and Economic Research, 2015), http://cber.bus.utk.edu/tefs/spr15.pdf. ↩︎
Tennessee Department of Finance and Administration, July Revenues (Tennessee: Tennessee State Government, August 13, 2014), https://www.tn.gov/news/16951. ↩︎
The new eligibility limits apply to CHOICES Group 3, which covers adults who don’t qualify for a nursing facility level of care, but need in home supports to delay or prevent the need for nursing facility care; individuals determined eligible using institutional eligibility standards are to be grandfathered.
“To Qualify for CHOICES,” TennCare Division of Health Care Finance & Administration, accessed October 6, 2015, https://www.tn.gov/tenncare/article/to-qualify-for-choices. ↩︎
Tennessee State Government, Tennessee to Go in New Direction for Medicaid Eligibility Determination System (Tennessee: Tennessee State Government, January 12, 2015), https://news.tn.gov/node/13420. ↩︎
In 2015, TennCare MCOs include BlueCare Tennessee, UnitedHealthcare and Wellpoint; BlueCare also operates TennCare Select. ↩︎
CMS approved an amendment to Tennessee’s Section 1115 waiver July 23, 2009, to incorporate long term services and supports into comprehensive managed care, implementing Tennessee’s Long Term Care Community Choices Act of 2008.
Tennessee State Government, TennCare Receives Federal Approval for Long-Term Care Community Choices Act (Tennessee: Tennessee State Government, July 23, 2009), https://news.tn.gov/node/2273. ↩︎
Incarcerated individuals in a suspended status are eligible for inpatient hospitalizations to be reimbursed by TennCare and not billed to the correctional facility. ↩︎
Beginning in FY 2014, policy changes introduced by the Affordable Care Act (ACA) have been driving Medicaid enrollment and spending growth. This report provides an overview of Medicaid enrollment and spending growth with a focus on state Fiscal Year (FY) 2015 and state Fiscal Year 2016. Findings are based on interviews and data provided by state Medicaid directors as part of the 15th annual survey of Medicaid directors in all 50 states and the District of Columbia conducted by the Kaiser Commission on Medicaid and the Uninsured (KCMU) and Health Management Associates (HMA). Information collected in the survey on policy actions taken during FY 2015 and FY 2016 can be found in the companion report. Key findings related to Medicaid enrollment and spending growth are described below.
Medicaid enrollment and spending increased substantially in FY 2015, the first full year of implementation of the major ACA coverage expansions. Across all 50 states and DC, Medicaid enrollment increased on average by 13.8 percent in FY 2015, largely due to the ACA coverage expansions. Driven by growth in enrollment, total Medicaid spending increased by 13.9 percent on average in FY 2015. (ES – 1) Beyond enrollment, states reported that the other drivers of increases in spending were provider rate increases and the higher cost of health care, including prescription drugs. Improvements in the economy were a downward pressure on enrollment which affected spending, but downward pressure in enrollment and spending as a result of the improving economy were outweighed by the ACA coverage policy changes.
ES-1: Economic conditions and policy changes drive growth in Medicaid enrollment and total spending.
In FY 2015, Medicaid enrollment and total Medicaid spending growth in expansion states far exceeded growth in non-expansion states. Expansion states reported Medicaid enrollment and total spending growth nearly three times the rate of non-expansion states. (Figure 2) A total of 29 states were implementing the ACA Medicaid expansion in FY 2015, up from 26 states in the previous year (FY 2015 additions include: New Hampshire, Pennsylvania and Indiana).
Across the 29 expansion states in FY 2015, enrollment increased on average by 18.0 percent and total spending increased by 17.7 percent; both enrollment and spending growth were driven by increases in enrollment among adults qualifying under the new expansion group. Of the 29 states expanding Medicaid in FY 2015, more than half (17 states) noted that enrollment initially increased faster than expected. Over two-thirds of expansion states reported that per member per month costs for the expansion population were at or below projections.1 Across the 22 states not implementing the Medicaid expansion in FY 2015,2 enrollment and total spending growth was 5.1 percent and 6.1 percent (respectively), much slower growth compared to the expansion states. Increased enrollment among previously eligible parents and children was the primary reason cited for enrollment growth in non-expansion states. (ES – 2)
ES-2: FY 2015 enrollment and total spending growth in expansion states far exceeded non-expansion states; state spending growth was lower.
State general fund Medicaid spending3 across all states grew at more modest levels in FY 2015 than total Medicaid spending and Medicaid enrollment growth but there was variation across expansion and non-expansion states. Across expansion states, state general fund Medicaid spending grew at more modest levels compared to total Medicaid spending – primarily due to the enhanced federal match rate for those newly eligible for coverage. For non-expansion states, state Medicaid spending growth in FY 2015 slightly outpaced total Medicaid spending growth. Some non-expansion states attributed growth in state Medicaid spending to annual changes in the formula-driven federal Medicaid match rate that resulted in reductions in the federal Medicaid share for some large non-expansion states, including Texas. Across all states, state general fund Medicaid spending for FY 2015 grew at a similar rate as overall general fund growth (4.5 percent for Medicaid compared to 4.6 percent for state general fund growth).4
Total Medicaid enrollment and spending growth is projected to slow in FY 2016; looking ahead, states will monitor the effects of the ACA and other payment and delivery system reforms on spending. The major effects of the ACA were experienced by states in FY 2015; FY 2016 projections for Medicaid enrollment (4.0 percent) and total spending (6.9 percent) across all states indicate much slower growth on average than in FY 2015. Subsequently, the difference in enrollment and total spending growth rates across expansion and non-expansion states are projected to narrow in FY 2016. Expansion states are continuing to monitor and assess the effects of the Medicaid expansion on the state budget (within and beyond Medicaid). For FY 2015 and FY 2016, a number of Medicaid directors reported savings in areas including behavioral health, uncompensated care and criminal justice as well as increased revenue as a result of implementing the Medicaid expansion. Understanding these effects is important as states look ahead to 2017 when the enhanced match rate for newly eligible Medicaid expansion adults begins to decline; starting January 1, 2017 (halfway through FY 2017 for most states) the match rate will drop from 100 percent to 95 percent, resulting in a state fund share of 5 percent. Many states are also engaged in major payment and delivery system reforms that have implications for care delivery as well as program spending going forward.
Issue Brief
Introduction
Medicaid enrollment and spending are primarily affected by economic conditions and policy changes. Over the past 15 years, Medicaid enrollment increased substantially during two major recessions, reflecting the countercyclical nature of the program. During economic downturns, when individuals lose their jobs and incomes decline, more people qualify and enroll in Medicaid, which in turn drives increases in total Medicaid spending. During the most recent economic downturns, Medicaid enrollment peaked in 2002, leveled in 2006 and 2007, and then peaked again in 2009. Following economic downturns, Medicaid enrollment and spending growth may slow in the absence of other policy changes. (For additional information about Medicaid financing, the role of Medicaid in state budgets and Medicaid and the economy, see Appendix).
In each of the past five years, the economy has gradually improved and policy changes at the state and federal levels, including those in the Affordable Care Act (ACA), have been driving enrollment and spending growth. The enactment of the ACA had major implications for Medicaid eligibility, enrollment and spending across states. As enacted, all states were to expand coverage to nearly all adults with incomes up to 138 percent of the poverty level (FPL) ($16,242 per year for an individual in 2015). However, the 2012 Supreme Court ruling on the ACA effectively made the decision to implement the Medicaid coverage expansion an option for states. The ACA also required all states to implement new streamlined and coordinated application, enrollment, and renewal processes, including transitioning to a new income standard (Modified Adjusted Gross Income or MAGI) to determine Medicaid financial eligibility for non-elderly, non-disabled populations.
This report provides an overview of Medicaid enrollment and spending growth with a focus on state Fiscal Year (FY) 2015 and state Fiscal Year (FY) 2016. Findings are based on interviews and data provided by state Medicaid directors as part of the 15th annual survey of Medicaid directors in all 50 states and the District of Columbia conducted by the Kaiser Commission on Medicaid and the Uninsured (KCMU) and Health Management Associates (HMA). For a more detailed description of the Methodology used to calculate enrollment and spending growth, please see the “Methods Box” at the end of this brief.
Medicaid Enrollment and Spending FY 2015 and FY 2016
Medicaid enrollment and spending increased substantially in FY 2015, the first full year of implementation of the major ACA coverage expansions. Across all 50 states and DC, Medicaid enrollment increased on average by 13.8 percent in FY 2015, following growth of 8.3 percent the previous year. The sharp increases in these two years were driven by enrollment growth in states implementing the Medicaid expansion. Driven by growth in enrollment, total Medicaid spending increased by 13.9 percent in FY 2015. Growth in total Medicaid spending is expected to drop to 6.9 percent in FY 2016, as the initial effects of the major ACA coverage expansions are largely completed. (Figure 1) Beyond enrollment, states reported that other drivers of increases in spending are provider rate increases and the higher cost of health care, including prescription drugs. Improvements in the economy were a downward pressure on enrollment which affected spending, but downward pressure in enrollment and spending as a result of the improving economy were outweighed by the ACA coverage policy changes.
Figure 1: Economic conditions and policy changes drive growth in Medicaid enrollment and total spending.
Compared to enrollment and total spending growth, state general fund spending for Medicaid across all states grew at more modest levels in FY 2015.5 Historically, state Medicaid spending and total Medicaid spending have increased at similar rates except when there have been statutory changes in the federal Medicaid match rate (officially known as the FMAP, or Federal Medical Assistance Percentage). For example, Congress enacted temporary increases in the federal share of Medicaid during the last two economic downturns that resulted in lower growth in state Medicaid spending compared to total Medicaid spending growth. The magnitude of the federal fiscal relief included in the American Recovery and Reinvestment Act (ARRA) – over $100 billion in additional federal funds over 11 quarters through June 2011 – resulted in declines in state spending for Medicaid in 2009 and 2010. However, the expiration of this relief resulted in higher state Medicaid spending growth in FY 2012 compared to growth in federal Medicaid spending.
More recently, the change in the Medicaid match rate tied to the ACA Medicaid expansion has resulted in a divergence in growth rates for total and state Medicaid spending. For states that expand Medicaid, the federal government pays 100 percent of Medicaid costs of those newly eligible under the Medicaid expansion for calendar years 2014-2016. The federal share phases down to 95 percent in 2017, 94 percent in 2018, 93 percent in 2019 and 90 percent in 2020 and thereafter, well above traditional FMAP rates in every state.
Figure 2: Total and state Medicaid spending generally grow at similar rates, except when statutory changes impact FMAP: 2001 – 2016
As a result of the 100 percent FMAP for newly eligible enrollees in expansion states, state spending for Medicaid across all states increased on average by 4.5 percent in FY 2015, compared to total Medicaid spending growth across all states of 13.9 percent. (Figure 2) State general fund Medicaid spending for FY 2015 grew at a similar rate as overall general fund growth (4.5 percent for Medicaid compared to 4.6 percent for all state general fund growth).6
State Medicaid directors were remarkably accurate in projecting enrollment and spending for FY 2015. Compared to projections included in this report last year, actual enrollment, total spending and state spending averages were on target with state projections. In each of these areas, states expect to see sharp declines in growth for FY 2016 as the full effects of the implementation of the ACA were experienced primarily in FY 2015. (Figure 3)
Figure 3: States projections for Medicaid enrollment and spending growth in FY 2015 were largely on target.
Looking ahead to FY 2016, total enrollment and spending growth are projected to slow. Enrollment growth is projected to average just 4.0 percent across all 50 states and DC. This would be a substantial decline from the previous two years. Some uncertainty remains for FY 2016 since, at the time of the survey, legislatures had not yet enacted a final state budget for FY 2016 in Illinois and Pennsylvania.
FY 2015: Expansion and Non-Expansion States
In FY 2015, Medicaid enrollment and total spending growth in expansion states far exceeded growth in non-expansion states. Expansion states reported enrollment and spending growth nearly three times the rate of non-expansion states. (Figure 4) A total of 29 states were implementing the ACA Medicaid expansion in FY 2015, up from the 26 states in the previous year. The three additional states that implemented the Medicaid expansion in FY 2015 were New Hampshire in August 2014, Pennsylvania in January 2015 and Indiana in February 2015.
Across the 29 states expanding Medicaid in FY 2015, enrollment increased on average by 18.0 percent and total spending by 17.7 percent. Enrollment in expansion states was driven by growth among adults qualifying under the new expansion group, although nearly all expansion states also saw increased enrollment among the elderly and two-thirds saw increased enrollment among children. Some expansion states reported declines in enrollment in the eligibility categories for pregnant women, individuals with disabilities and other non-elderly adults as individuals gained coverage under the Medicaid expansion group instead of qualifying based on categorical requirements or through more limited pathways.
Of the 29 states expanding Medicaid in FY 2015, slightly more than half (17 states) noted that enrollment initially increased faster than expected. For most states, the cost of the new enrollees was less than expected; nearly two-thirds of expansion states reported that per member per month costs for the expansion population were at or below projections.7 Across the 29 states that had implemented the ACA Medicaid expansion as of FY 2015, the rate of growth in total Medicaid spending averaged 17.7 percent, very similar to the 18.0 percent enrollment growth rate. (Figure 4)
Figure 4: FY 2015 enrollment and total spending growth in expansion states far exceeded non-expansion states; state spending growth was lower.
Across the 22 non-expansion states in FY 2015, enrollment and total Medicaid spending grew 5.1 percent and 6.1 percent (respectively), much slower growth than experienced by expansion states. Increased Medicaid enrollment among “previously eligible but not enrolled” parents and children was the primary reason cited for Medicaid enrollment growth in non-expansion states in FY 2015. Additionally, total Medicaid spending increased on average by 6.1 percent across non-expansion states in FY 2015, also primarily due to growth in Medicaid enrollment. (Figure 4)
Growth in state general fund spending for Medicaid in expansion states was much slower than total Medicaid spending in FY 2015, due to the ACA enhanced FMAP. In the 29 states that had implemented the Medicaid expansion in FY 2015, state general fund spending on Medicaid increased on average by 3.4 percent (compared to total Medicaid spending growth of 17.7 percent). States that implement the Medicaid expansion receive 100 percent federal match for those made eligible by the expansion; therefore, the increase in total Medicaid spending in these states was supported primarily by the increase in federal matching funds to these states.
In FY 2015, across the 22 non-expansion states, state general fund spending on Medicaid increased by 6.9 percent on average, slightly higher than total Medicaid spending growth of 6.1 percent. (Figure 4) Differences between total and state Medicaid spending growth in non-expansion states were driven by annual formula-driven changes in the FMAP, particularly for some large non-expansion states. For example, in Texas the FMAP dropped from 58.69 percent to 58.05 percent, necessitating additional state Medicaid spending to maintain current programs.
Enacted Budgets for FY 2016: Expansion and Non-Expansion States
In FY 2016, the Medicaid enrollment growth rate is expected to slow across all states, and the variation in enrollment growth between expansion and non-expansion states is expected to narrow. (Figure 5) Slower overall growth in Medicaid enrollment in FY 2016 is anticipated because of three main factors. First, enrollment growth among those newly eligible under the ACA Medicaid expansion is moderating, after the initial surge in growth in 2014 or 2015. Second, an improving economy has contributed to less demand for Medicaid. Third, in some states, slowing enrollment is tied to the timing of annual renewals. In response to challenges states faced implementing new eligibility and enrollment systems in 2014, CMS granted waivers to a number of states (expansion and non-expansion alike) to postpone eligibility redeterminations and renewals for several months. Many states that postponed redeterminations reported that enrollment growth moderated or declined when renewal backlogs were addressed and regular renewal procedures were resumed.
Figure 5: For FY 2016, Medicaid enrollment and total Medicaid spending growth are projected to slow.
In FY 2016, most expansion states expect Medicaid enrollment and Medicaid spending growth to slow, compared to FY 2015. In FY 2016, two additional states plan to implement the Medicaid expansion. Alaska began implementation in September 2015 and Montana plans to implement in January 2016.8 Across the 31 Medicaid expansion states, enrollment is expected to increase on average by 4.5 percent in FY 2016. New enrollment among expansion adults is projected to drive enrollment growth across all expansion states, but particularly in Alaska and Montana (newly adopting states in FY 2016) and in Indiana and Pennsylvania (states that adopted in late FY 2015). Although the other expansion states expect overall enrollment growth driven by the expansion group to continue in FY 2016, these states expect growth rates to moderate substantially compared to FY 2015.
Three states (Minnesota, Massachusetts and Oregon) project that FY 2016 enrollment will be less than FY 2015 enrollment. Minnesota reported that enrollment in Medicaid is expected to decline primarily because of the implementation of the Basic Health Plan (BHP). Under the state’s Basic Health Plan, individuals with incomes between 138% and 200% FPL previously covered under Medicaid were shifted to BHP coverage. Massachusetts projects enrollment to decline among non-elderly, non-disabled adults. Non-elderly, non-disabled adults were temporarily enrolled in Medicaid while the state resolved issues with its eligibility and enrollment system that prevented the completion of Medicaid and Marketplace eligibility determinations. Oregon also projects enrollment to decline across MAGI adults, due in part to the resumption of redeterminations. As enrollment growth is projected to slow in FY 2016, so is total Medicaid spending growth. Across the 31 expansion states, growth in total Medicaid spending in FY 2016 is projected to be 8.6 percent on average. State Medicaid spending growth in expansion states is projected to increase by less than half that rate, on average by 3.7 percent, due to the enhanced ACA match rate for newly eligible adults. (Figure 5)
Across the 20 non-expansion states in FY 2016, Medicaid enrollment is projected to increase on average by 2.8 percent and total Medicaid spending is expected to increase on average by 3.6 percent. Non-expansion states reported that they expect to continue to see some increased participation among those previously eligible but not enrolled, but the resumption of regular renewals and the improving economy are factors working to slow enrollment growth. Slowing enrollment growth is expected to result in slower total Medicaid spending growth.
Formula-driven changes to the traditional federal Medicaid match rate as well as specific issues in some large states are driving changes in state Medicaid spending projections in non-expansion states in FY 2016. Enacted budgets across the 20 non-expansion states authorized state general fund Medicaid spending increases of 5.2 percent on average, compared to average growth in total Medicaid spending of 3.6 percent. This higher growth for state spending is largely attributed to continued declines in the formula driven FMAP for Texas (a significant drop from 58.05 percent to 57.13 percent) and in other states, as well as other state-specific changes in sources of funding. For example, in Florida, another state where changes have a large effect on the weighted average, state general fund spending for Medicaid is expected to increase at a higher rate than for total spending for Medicaid due to changes in funding for its Low-Income Pool (LIP) program. Under the renewal of the Florida LIP waiver, the federal contribution declined substantially resulting in a need for a larger increase state Medicaid spending.
The Effect of the Medicaid Expansion on State Budgets
In addition to increases in health coverage and reductions in the number of uninsured, state decisions about whether to expand Medicaid have broader economic and fiscal implications.9 This year, Medicaid directors in states that implemented the expansion were asked to report if state budget savings were occurring in specific areas outside of the Medicaid program. Early evidence from some expansion states shows that additional federal Medicaid dollars can result in savings in state general fund spending both within the Medicaid budget as well as for other state programs or agencies. Although states reported that isolating the fiscal impact of expanded Medicaid eligibility from other ACA effects and/or other factors affecting health care costs can be a challenge.10 Some Medicaid directors noted that state “savings” were realized by other programs and were reinvested in those programs. Other states noted that savings were generated but did not accrue at the state-level, but did accrue at the county-level.Other Medicaid directors were not able to report whether savings accrued or not, since they were not familiar with other program budgets. However, a number of Medicaid directors did report seeing savings, suggesting these are areas to continue to watch going forward.
Behavioral Health: Thirteen (13) states reported savings in either FY 2015 or FY 2016 as individuals who previously received state-funded behavioral health services were now receiving those services under Medicaid.
Uncompensated Care: Six states reported savings for the state budget related to state funding for uncompensated care costs in either FY 2015 or FY 2016.
Criminal Justice / Corrections: Fifteen (15) states reported savings related to state funding for criminal justice due to the expansion in either FY 2015 of FY 2016. Under federal law, Medicaid reimbursement is available for care provided to eligible individuals who are admitted to an inpatient facility (not on jail or prison grounds), such as a hospital, for at least 24 hours. Prior to the ACA, few states had pursued Medicaid reimbursement for these services given the limited share of the incarcerated population that could qualify for Medicaid.11 With the expansion, a larger share of the incarcerated population may qualify for Medicaid.12
Revenue: Twelve (12) states reported either provider tax revenues or general revenues had increased in either FY 2015 or FY 2016 due to the expansion.
Conclusion and Looking Ahead
Historically, Medicaid enrollment and spending have been driven largely by economic conditions as well as state and federal policy decisions. Over the past two decades, two major recessions resulted in periods of significant growth in Medicaid program enrollment and spending, with the rate of growth slowing as the economy improved. Since 2014, the implementation of the ACA has been the primary driver of Medicaid enrollment and spending growth, particularly in states implementing the Medicaid expansion. Looking ahead to FY 2016 and beyond, enrollment and spending growth are expected to slow as the effects of the ACA eligibility changes play out both in states implementing and not implementing the ACA Medicaid expansion. Expansion states are also looking ahead to FY 2017 when new state fund dollars will be needed when the enhanced match rate for newly eligible enrollees starts to decline, dropping from 100 percent to 95 percent starting January 1, 2017 (halfway through FY 2017 for most states.) States will also continue to monitor how the ACA provisions are affecting Medicaid enrollment and spending, other areas of the state budget, overall health insurance coverage, and the health care systems in their state. Many states are also engaged in major payment and delivery system reform efforts that have implications for program performance and spending as well as the health and health care for the millions of beneficiaries served by Medicaid.
The authors express their appreciation to Dennis Roberts, who managed the database. We also thank the Medicaid directors and staff in all 50 states and the District of Columbia who completed the survey on which this brief is based.
Methodology
Methodology
Definition of Medicaid Spending. Total Medicaid spending includes all payments to Medicaid providers for Medicaid covered services provided to enrolled Medicaid beneficiaries. In addition, total Medicaid spending includes special payments to “disproportionate share hospitals” (“DSH payments”) that subsidize uncompensated care for persons who are uninsured and unreimbursed costs related to care for persons on Medicaid. Not included in total Medicaid spending are Medicaid administrative costs and federally mandated state “Clawback” payments to Medicare (to help finance the Medicare Part D prescription drug benefit for beneficiaries who are dually enrolled in both Medicare and Medicaid.) States are also asked to exclude costs for the Children’s Health Insurance Program (CHIP) though a few states provided percentage changes for spending that reflected Medicaid and CHIP combined. Total Medicaid spending includes payments financed from all sources, including state funds, local contributions and federal matching funds. Historical state Medicaid spending refers to all non-federal spending, which may include local funds and provider taxes and fees as well as state general fund dollars. State spending for FYs 2014-2016 collected as part of this survey reflect state spending, largely state general fund dollars.
Methodology. The Kaiser Commission on Medicaid and the Uninsured (KCMU) commissioned Health Management Associates (HMA) to survey Medicaid directors in all 50 states and the District of Columbia to identify and track trends in Medicaid spending, enrollment and policy making. This was the fifteenth annual survey, conducted at the beginning of each state fiscal year from FY 2002 through FY 2016.
The KCMU/HMA Medicaid survey on which this report is based was conducted from June through August 2015. Medicaid directors and staff provided data for this report in response to a written survey and a follow-up telephone interview. The survey was sent to each Medicaid director in June 2015. All 50 states and DC completed surveys and participated in telephone interview discussions in June, July and August 2015. The telephone discussions are an integral part of the survey to ensure complete and accurate responses and to record the complexities of state actions.
At the time of the survey, two states (Illinois and Pennsylvania) had not enacted budgets for FY 2016. For Pennsylvania, the projections for FY 2016 reflect the governor’s estimates provided to NASBO.13 For Illinois, the Governor’s budget anticipated large cuts in Medicaid that may be unachievable given that the timing in the fiscal year so spending data for Illinois is not included in weighted averages for FY 2016.
Annual rates of growth for Medicaid enrollment and spending were calculated as weighted averages across all states, and for states based on state decisions to implement the ACA Medicaid expansion in 2015 or 2016. For FYs 2014, 2015 and 2016, average annual Medicaid spending growth was calculated using weights derived from the most recent state Medicaid expenditure data for fiscal year 2014, based on estimates prepared for KCMU by the Urban Institute using CMS Form 64 reports, adjusted for state fiscal years. These data were also used for historic Medicaid spending. Medicaid enrollment average annual growth rates were calculated using weights based on Medicaid and CHIP monthly enrollment data for June 2014 published by CMS.14 Historical enrollment trend data reflects the annual change from June to June of monthly enrollment data for Medicaid beneficiaries collected from states.15
Because the data reported here for FYs 2015 and 2016 are weighted averages derived from Medicaid enrollment and spending, data reported for states with larger enrollment and spending have a larger effect on the national average. These effects are further amplified when looking at smaller groups of states, such as states implementing the Medicaid expansion and those that have not. Additional information collected in the survey on policy actions taken during FY 2015 and FY 2016 can be found in the companion report at: www.kff.org
Appendix
Appendix: Background on Medicaid Financing
Medicaid Financing Structure
The Medicaid program is jointly funded by states and the federal government. The federal government guarantees match funds to states for qualifying Medicaid expenditures (payments states make for covered Medicaid services provided by qualified providers to eligible Medicaid enrollees.) The federal match rate (Federal Medical Assistance Percentage or FMAP) is calculated annually for each state using a formula set in the Social Security Act which is based on a state’s average personal income relative to the national average; poorer states have higher FMAPs. Personal income data are lagged, so data used for FFY 2016 FMAPs are from the three years of 2011 to 2013. According to the formula, the FMAP in FFY 2015 varies across states from a floor of 50 percent to a high of 74.2 percent. (Figure 6) This means every $1 of state spending on Medicaid is matched with at least $1 of federal funds.16
Figure 6: Medicaid costs are shared by the states and the federal government based on each state’s federal matching rate.
Medicaid’s Role in State Budgets
Medicaid has a unique role in state budgets because it is both an expenditure item and a source of federal revenue for states. In FY 2013, Medicaid accounted for 24.5 percent of total spending, but only 17.8 percent of all state general fund spending, a far second to spending on K-12 education (35.4 percent of state general fund spending.)17 Due to the federal match structure for Medicaid, the program is the largest source of federal funds for states, accounting 47.6 percent of all federal funds for states in FY 2013. Over the last decade, shares of general fund spending for Medicaid and K-12 education have remained fairly constant with an uptick in the share of general fund spending on Medicaid since 2010 in part due to the June 2011 expiration of the enhanced FMAP provided by under the American Recovery and Reinvestment Act (ARRA). (Figures 7 and 8)
Figure 7: Medicaid is both a budget item and a revenue item in state budgets.Figure 8: Shares of state general funds spent for Medicaid and K-12 Education have remained fairly stable over time.
Medicaid and the Economy
Medicaid is a countercyclical program. During economic downturns individuals lose jobs, incomes decline and more people qualify and enroll in Medicaid which increases program spending. At the same time, economic downturns negatively affect state tax revenues. This places additional pressure on state budgets as demand for other forms of assistance (i.e. food stamps and unemployment benefits) also increases. During economic downturns, states face difficulty balancing these pressures. In response, Congress has twice passed temporary increases to the FMAP rates to help support states during economic downturns, most recently in 2009 as part of the American Recovery and Reinvestment Act (ARRA.) The ARRA-enhanced match rates provided states with the largest source of federal fiscal relief, over $100 billion in additional federal funds over 11 quarters, ending in June 2011.18
As economic conditions improve, demand for Medicaid coverage moderates. State economies have seen sustained improvement following the worst recession since the Great Depression. The national unemployment rate has continued to decline, falling to 5.1 percent in September 2015, the lowest rate since April 2008.19 Over two-thirds of states had unemployment rates at or below six percent in July 2015. (Figure 9) After 67 months of private-sector job growth, there were over 4.3 million more private sector jobs in September 2015 than before the recession.20 However, an estimated 7.9 million people remain unemployed, nearly 27 percent of whom are long-term unemployed (those actively looking for work for 27+ weeks.21 )
Figure 9: Unemployment rates have fallen since the recession; over two-thirds of states have unemployment rates below 6%.
Real gross state product (GSP), a measure of state economic activity, grew by 2.2 percent from 2013 to 2014 at the national level, the fifth year of consecutive growth at the national level. All but two states (Alaska and Mississippi) experienced positive GSP growth from 2013 to 2014, ranging up to 6.3 percent.22 State revenue collections have also improved. After experiencing the sharpest decline in state tax revenues on record during the Great Recession, states had seen tax revenue growth 21 of the last 22 quarters.23 (Figure 10) The improving economic conditions have acted as a downward pressure on Medicaid enrollment growth in recent years. However, the moderating effect of the improving economic conditions has been outweighed by policy changes to expand coverage under the ACA.
Figure 10: State tax revenues have grown for 21 of the last 22 quarters since the declines during the Great Recession.
Endnotes
Two expansion states (Arkansas and Pennsylvania) did not respond to this question. Of the remaining 27 states that had implemented the Medicaid expansion at the time of the survey, 20 reported the average per-member per-month costs had come in either below or on target with initial projections. ↩︎
Alaska and Montana plan to implement the Medicaid expansion in FY 2016; they are therefore counted as not implementing the Medicaid expansion in FY 2015. ↩︎
Historical state Medicaid spending refers to all non-federal spending, which may include local funds and provider taxes and fees as well as state general fund dollars. State spending for FYs 2014-2016 collected as part of this survey reflect state spending, largely state general fund dollars. ↩︎
Historical state Medicaid spending refers to all non-federal spending, which may include local funds and provider taxes and fees as well as state general fund dollars. State spending for FYs 2014-2016 collected as part of this survey reflect state spending, largely state general fund dollars. ↩︎
Two expansion states (Arkansas and Pennsylvania) did not respond to this question. Of the remaining expansion states, responses were less clear. Some noted higher than expected costs in reference to an earlier period not covered in this survey. Others indicated that they could not disaggregate expansion increases from other MCO increases. Only a few indicated that costs on a pmpm basis were higher than they had originally projected. ↩︎
The state adopted the Medicaid expansion through legislation that requires federal waiver approval. ↩︎
To be eligible for ARRA funds, states could not restrict eligibility or tighten enrollment procedures in Medicaid or CHIP.
Vic Miller, Impact of the Medicaid Fiscal Relief Provisions in the American Recovery and Reinvestment Act (ARRA) (Washington, DC: Kaiser Commission on Medicaid and the Uninsured, October 2011), https://modern.kff.org/medicaid/issue-brief/impact-of-the-medicaid-fiscal-relief-provisions/. ↩︎
Bureau of Labor Statistics, Labor Force Statistics from the Current Population Survey, “(Seas) Unemployment Rate (Series ID: LNS14000000)” accessed October 2, 2015, http://data.bls.gov/timeseries/LNS14000000. ↩︎
Bureau of Labor Statistics, Employment, Hours, and Earnings from the Current Employment Statistics Survey, “Total Private Employment (Series ID: CES0500000001) December 2007 through September 2015”accessed October 2, 2015, http://data.bls.gov/cgi-bin/dsrv. ↩︎
Bureau of Labor Statistics, Labor Force Statistics from the Current Population Survey, “A-12. Unemployed persons by duration of unemployment, seasonally adjusted” accessed October 2, 2015, http://www.bls.gov/web/empsit/cpseea12.htm. ↩︎
US Census Bureau, Quarterly Summary of State & Local Tax Revenue, “Table 3: Latest State Tax Collections by State” accessed September 29, 2015, http://www.census.gov/govs/qtax/. ↩︎
Medicaid Reforms to Expand Coverage, Control Costs and Improve Care: Results from a 50-State Medicaid Budget Survey for State Fiscal Years 2015 and 2016
Authors:
Vernon K. Smith, Kathleen Gifford and Eileen Ellis, Health Management Associates, Robin Rudowitz, Laura Snyder, and Elizabeth Hinton
Medicaid plays a significant role in the U.S. health care system, now providing health insurance coverage to more than one in five Americans. The Medicaid program continues to evolve, responding to changes in the economy, the broader health system, state budgets and policy priorities, and in recent years, to requirements and opportunities in the Affordable Care Act (ACA).
This report provides an in-depth examination of the changes taking place in Medicaid programs across the country. The findings in this report are drawn from the 15th annual budget survey of Medicaid officials in all 50 states and the District of Columbia conducted by the Kaiser Commission on Medicaid and the Uninsured and Health Management Associates (HMA), in collaboration with the National Association of Medicaid Directors. This report highlights policy changes implemented in state Medicaid programs in FY 2015 and those planned for implementation in FY 2016 based on information provided by the nation’s state Medicaid directors.
Policy changes and initiatives described in this report include those in eligibility and enrollment, managed care, delivery and payment system reforms, provider payment rates, and covered benefits (including prescription drug policies). The report also looks at the key issues and challenges now facing Medicaid programs.
Eligibility and enrollment changes in the ACA are continuing to have major policy implications for states in FY 2015 and FY 2016. As of October 2015, 31 states (including DC) had adopted the ACA Medicaid expansion. This includes 26 states that implemented the expansion in FY 2014, three additional states in FY 2015 (New Hampshire, Pennsylvania and Indiana) and two additional states in FY 2016 (Alaska and Montana). Other eligibility changes adopted or planned for states in FY 2015 and FY 2016 were small and targeted to a limited number of beneficiaries. As a result of new coverage pathways, a number of states are eliminating coverage for beneficiaries with incomes above 138 percent of poverty, many of whom qualify for Marketplace subsidies, as well as eligibility pathways to more limited Medicaid coverage. A few states had received or were seeking waivers to implement changes to premiums that were primarily related to the ACA coverage expansions (Arkansas, Indiana, Iowa, Michigan and Montana).
Under the ACA, all states were required to implement enrollment changes including new streamlined application, enrollment, and renewal processes for individuals. Many states adopted new eligibility and enrollment systems. A number of states were still working through challenges in processing renewals at the start of FY 2016.
States remain focused on strategies and initiatives to improve the effectiveness and outcomes of care, and to slow the growth in the cost of care. As of July 2015, a total of 48 states used some form of managed care to serve the Medicaid population, including 39 states (including DC) that contracted with risk-based managed care organizations (MCOs) to serve their Medicaid enrollees. In 21 of these states, at least 75 percent of all Medicaid beneficiaries were enrolled in MCOs. In FYs 2015 and 2016, the trend toward increased use of MCOs continues, as five states (Florida, Indiana, Iowa, Louisiana and Rhode Island) end their primary care case management (PCCM) programs and transition populations to MCOs. Other states are moving more eligibility groups, geographic areas and benefits into MCOs. As more states rely on MCOs for acute physical health care, a growing number of states are focusing on integration of physical health, behavioral health and long-term services and supports (LTSS) under the umbrella of managed care as a priority policy direction.
With greater utilization of MCOs has come greater focus on quality performance. For FY 2015, a total of 21 states implemented new or expanded quality initiatives and 19 states planned to do so in FY 2016. (ES 1) These include MCO report cards and greater reporting of quality metrics, pay for performance, capitation withholds, performance bonuses or penalties, and special quality initiatives and performance improvement projects.
States are implementing and expanding alternative delivery system and payment models. Thirty-seven (37) states in either FY 2015 or FY 2016, including 27 states in FY 2015 and 28 states in FY 2016, reported adopting or expanding one or more initiatives that seek to control costs, reward quality and encourage integrated care. (ES 1) Initiatives include patient-centered medical homes (PCMHs), Health Homes, Accountable Care Organizations (ACOs) as well as other initiatives to coordinate physical and behavioral health care and better manage the care of persons with multiple chronic conditions. Nearly a quarter of states are implementing initiatives in FY 2015 or FY 2016 to coordinate care and financing for dually-eligible Medicare-Medicaid beneficiaries. A limited number of states are implementing episode of care and DSRIP initiatives.
States are implementing policies designed to “re-balance” care to allow more individuals to live in their homes and in the community. Nearly every state (46 states in both FY 2015 and FY 2016) took steps to expand care in the home and community. The ACA included some LTSS-related options intended to promote LTSS rebalancing including the Community First Choice Option and the 1915(i) HCBS State Plan Option. Thirteen (13) states reported having one or both of these options in place in FY 2014; an additional six states implemented at least one of these options in FY 2015 and eight states planned to do so in FY 2016.
Figure ES-1: Medicaid programs continue to add and expand payment and delivery system reforms in FYs 2015 and 2016.
Given the size of Medicaid in state budgets, there is always pressure to control costs; however, improvements in the economy have allowed states to adopt more increases in reimbursement rates and benefits compared to restrictions. Medicaid provider payment rates and benefits are often adjusted in response to changes in the economy, with restrictions in times of economic downturns and state budget shortfalls, and restorations or enhancements when the economy and state revenues improve. In FY 2015 and FY 2016, more states implemented or planned for rate increases compared to restrictions (47 and 45 states increasing compared to 35 and 38 states restricting rates in those years). In this survey, a number of states reported that they have or are adopting reimbursement policies to reduce potentially preventable hospital readmissions and early elective deliveries.
All states (except Alaska) use at least one provider tax or fee to help finance Medicaid. Eighteen (18) states increased or planned to increase one or more provider taxes or fees in FYs 2015 and 2016. Seven (7) of the Medicaid expansion states (Arizona, California, Colorado, Indiana, Kentucky, Nevada and Ohio) reported plans to use increased provider taxes or fees to fund all or part of the costs of the ACA Medicaid expansion beginning in January 2017, when states must pay a small share of the costs of the expansion.
A total of 24 states expanded or enhanced covered benefits in FY 2015, and 18 states planned expansions in FY 2016. The most common benefit enhancements reported were for behavioral health and substance abuse services, HCBS and dental services for adults. Far fewer states reported benefit restrictions.
States have a renewed focus on controlling rising prescription drug costs. Since 2014, rising drug prices and increasing program costs have refocused state attention on pharmacy reimbursement and coverage policies. The majority of states identified high-cost and specialty drugs (e.g., hepatitis C antivirals among others) as a significant cost driver for state Medicaid programs as well as increased costs for generics among other factors. Over two-thirds of the states in FY 2015 and half in FY 2016 reported actions to refine and enhance their pharmacy programs in response to new and emerging specialty and high-cost drug therapies.
Medicaid directors reported a number of key priorities in FY 2016 and beyond. Medicaid is a large and complex program that provides health coverage for an increasing share of the population in each state. As the program continues to evolve, the key priorities for most directors are around implementing the ACA coverage provisions, controlling costs, implementing an array of complex delivery system reforms, and standing up new systems to support program operations related to enrollment, claims processing and delivery system reforms. Tackling this magnitude of change is a significant challenge, particularly given that most state Medicaid programs are operating within constrained resources, both in terms of staff and funding. Emerging priorities mentioned by Medicaid directors include population health and social determinants of health. (ES 2) State Medicaid programs are looking for opportunities to leverage other resources and stakeholders (such as state public health agencies and other payers) to improve the quality of care provided and ultimately affect health outcomes for the populations they serve. Pursuing these significant goals has caused Medicaid to evolve into a major player in transforming the overall health care system.
Figure ES-2: Medicaid directors reported many key priorities for FY 2016 and beyond.
Report: Introduction
This report provides an in-depth examination of the reforms, policy changes and initiatives taking place in state Medicaid programs across the country. The findings in this report are drawn from the 15th annual budget survey of Medicaid officials in all 50 states and the District of Columbia conducted by the Kaiser Commission on Medicaid and the Uninsured (KCMU) and Health Management Associates (HMA), in collaboration with the National Association of Medicaid Directors. This was the fifteenth annual survey, which has been conducted at the beginning of each state fiscal year from FY 2002 through FY 2016.1 (Copies of previous reports are archived here.)
The KCMU/HMA Medicaid survey on which this report is based was conducted from June through August 2015. Medicaid directors and staff provided data for this report in response to a written survey and a follow-up telephone interview. All 50 states and DC completed surveys and participated in telephone interview discussions between June and August 2015. The survey asked state officials to describe policy initiatives and changes that occurred in FY 2015 and those adopted for implementation for FY 2016 (which began for most states on July 1, 20152 ). The survey does not attempt to catalog all Medicaid policies. Experience has shown that adopted policies are sometimes delayed or not implemented for reasons related to legal, fiscal, administrative, systems or political considerations, or due to delays in approval from CMS. Not included in the survey are policy changes under consideration where a definite decision on implementation has not yet been made. A copy of the survey instrument is located in the appendix of this report.
Key findings of this survey, along with 50-state tables providing more detailed information, are described in the following sections of this report:
Report: Eligibility, Enrollment, Premiums And Cost-sharing
Key Section Findings
As of October 2015, 31 states (including DC) had adopted the ACA Medicaid expansion. This includes 26 states that implemented the expansion in FY 2014, three additional states in FY 2015 (Indiana, New Hampshire and Pennsylvania) and two additional states in FY 2016 (Alaska and Montana). Other eligibility changes adopted or planned for states in FY 2015 and FY 2016 were small and targeted to a limited number of beneficiaries.
As a result of new coverage pathways, some states are eliminating Medicaid coverage for beneficiaries with incomes above 138 percent FPL, many of whom qualify for Marketplace subsidies, as well as eligibility pathways to more limited Medicaid coverage.
Given new requirements and systems for enrollment and renewal, a number of states reported challenges processing MAGI-based renewals. The majority of states reported that they have implemented Hospital Presumptive Eligibility (HPE).
Few states identified changes to premium and cost-sharing policies. Among states making premium changes, the majority related to ACA coverage expansions (Arkansas, Indiana, Iowa, Michigan and Montana). Six states reported new copayment requirements in either FY 2015 or FY 2016 for ACA Medicaid expansion populations. Indiana also reported new copayments for some existing Medicaid groups.
Tables 2, 3 and 4 at the end of this section include additional details on eligibility, premiums and cost-sharing policy changes in FYs 2015 and 2016. These tables are also available in a downloadable PDF.
Changes to Eligibility Standards
The ACA included a number of significant changes to Medicaid eligibility and enrollment policies. One of the most significant changes was to extend Medicaid coverage to nearly all non-elderly adults with incomes up to 138 percent of the federal poverty level (FPL) ($16,242 per year for an individual in 2015), ending the historic exclusion of adults without dependent children, or childless adults, from the program. However, the June 2012 Supreme Court ruling on the constitutionality of the ACA effectively made the Medicaid expansion optional for states. Regardless of whether states implement the Medicaid expansion, all states were required to implement a range of other changes to eligibility and enrollment under the ACA. These changes included transitioning to use of Modified Adjusted Gross Income (MAGI) to determine financial eligibility for children, pregnant women, parents and low-income adults; eliminating asset limits for these same groups; establishing a new minimum eligibility limit of 138 percent FPL for children in Medicaid, which resulted in the transition of older children from the Children’s Health Insurance Program (CHIP) to Medicaid in some states; and providing new streamlined application, enrollment, and renewal processes for individuals. In addition, Medicaid agencies must coordinate eligibility determination and enrollment processes with the new Marketplaces. Altogether, the eligibility changes in 2014 represent historic program changes. Most of these changes occurred in FY 2014. As a result, very few changes in eligibility standards occurred for FY 2015 and FY 2016.
As of October 2015, 31 states (including DC) had adopted the Medicaid expansion. (Figure 1) In Utah, discussions continue about implementing the Medicaid expansion, and other states may re-visit the decision in the next legislative session. Most states that have adopted the ACA Medicaid expansion did so in FY 2014 (26 states). In FY 2015, three additional states adopted the ACA Medicaid expansion (Indiana, New Hampshire and Pennsylvania.) In FY 2016, two states to date have adopted the ACA Medicaid expansion; Alaska implemented in September 2015, and Montana plans to implement in January 2016 pending federal waiver approval.
Other eligibility changes in FY 2015 and FY 2016 were limited and targeted to small numbers of beneficiaries. For FY 2015, a total of eleven states made changes that expanded Medicaid eligibility and for FY 2016, five states plan to implement Medicaid eligibility expansions. (Figure 2) Only one state in FY 2015 and three states in FY 2016 made or are planning eligibility restrictions that were likely to leave individuals without other coverage options. A number of states are making changes to existing Medicaid eligibility pathways due to the availability of new coverage options; these changes are not counted as restrictions or expansions in this report.
Figure 1: Over half of states have adopted the ACA Medicaid expansion.Figure 2: States with Eligibility Expansions / Enhancements FY 2011-FY 2016
Coverage Transitions
As reported last year, with more coverage options available across the income spectrum, some states made changes to existing Medicaid pathways. These changes are discussed below and are noted in Tables 2 and 3 as “(#)” meaning they are not counted as a positive or negative eligibility change.
Medicaid expansion states reducing eligibility for adults over 138 percent FPL. Both Minnesota and New York previously covered adults with incomes above traditional Medicaid eligibility levels through Medicaid waiver programs but have transferred those groups to their Basic Health Plans, discussed below. In addition, Connecticut reported plans to reduce Medicaid parent eligibility levels to 150 percent FPL in FY 2016; many parents previously eligible at the higher levels should be eligible for Marketplace subsidies.
Basic Health Plan
New York and Minnesota both implemented a Basic Health Plan (BHP) in FY 2015. Under the BHP provisions of the ACA, a state receives 95 percent of what the federal government would have spent on premium and cost-sharing subsidies in the Marketplace for the eligible population. The state then provides coverage through a state-managed BHP. While the BHP is not part of Medicaid, it affected Medicaid in these states.
Minnesota previously provided Medicaid to adults with income up to 200 percent FPL under its MinnesotaCare waiver, many of whom were likely to be eligible for Marketplace subsidies. Minnesota moved non-elderly non-pregnant adults with income between 138 percent FPL and 200 percent FPL from MinnesotaCare to its BHP on January 1, 2015.
In FY 2015, New York implemented the “Essential Plan,” which is a BHP. The option transitions a Medicaid waiver population3 and certain immigrants (funded with state-only dollars) with income at or below 138 percent FPL to BHP. The program will also cover adults ineligible for Medicaid with income below 200 percent of FPL in January 2016.
States reducing or eliminating optional and limited Medicaid eligibility pathways. With new coverage options available either through the Medicaid expansion or the Marketplace, states have new options about how they treat some existing eligibility pathways for more limited Medicaid coverage, such as pregnancy related coverage, family planning-only programs, some spend-down programs, and the Breast and Cervical Cancer Treatment (BCCT) program.4 Prior to the implementation of the major ACA coverage changes, it was not clear if states would eliminate or scale back some of these programs in response to the new coverage options. While most states reported no current plans to change such pathways, many states indicated that enrollment in these groups has declined as more individuals are eligible under the adult Medicaid expansion group. However, a few states did note eligibility changes. (Table 1) In these cases, states generally plan to not allow new enrollment through these pathways but will continue coverage for those already enrolled.
Table 1: States Eliminating Coverage for Optional and Limited Medicaid Eligibility Pathways
Program
In Place in 2013 (Prior to the ACA)
Eliminated or Plans to Eliminate
Breast and Cervical Cancer Treatment
51
Arkansas and Maryland (FY 2014), Illinois (FY 2016)
Medically Needy / Spend Down Adults
36
Hawaii and Illinois (FY 2014); Pennsylvania1 (FY 2015)
Pregnant Women Coverage > 138% FPL
43
Louisiana2 (FY 2014)
Family Planning Waivers or State Plan
33
Arizona, Arkansas, Delaware, Louisiana3 and Michigan4 (FY 2014); Illinois (FY 2015); Ohio and Pennsylvania5 (FY 2016)
NOTES:1 Pennsylvania eliminated spend-down for the disabled only; it is reinstating this coverage in FY 2016.2 Louisiana reported that pregnant women with income above 133% FPL were eligible for coverage under CHIP.3 Louisiana converted its family planning waiver to a SPA, but eligibility declined to 133% FPL.4 Michigan closed its family planning waiver to new enrollment in April 2014.5 Pennsylvania is converting its family planning wavier to a SPA but is no longer accepting new enrollment.
Other Eligibility Changes
Other eligibility changes were more targeted or limited. These changes are noted in Table 2, but a few include:
In FY 2016, Colorado is implementing the option to eliminate the five-year bar on Medicaid eligibility for lawfully-residing immigrant children.
In FY 2015, Montana increased the cap on enrollment in its Mental Health Services Plan (MHSP) waiver from 2,000 to 6,000 adults with serious mental illness (before the state adopted the Medicaid expansion).
Virginia implemented a Section 1115 waiver to provide limited benefits to some uninsured adults with serious mental illness as part of the Governor’s Action Plan in FY 2015. (State legislation later reduced eligibility for this waiver from 100 percent FPL to 60 percent FPL, effective July 1, 2015.)
A number of states made changes to increase eligibility for the aged, blind and individuals with disabilities including eliminating the asset test (Vermont in FY 2015)and increasing income and asset limits for working individuals with disabilities (Virginia, New Jersey, Florida and Michigan).
Only one state in FY 2015 (Wisconsin) and three states in FY 2016 (Ohio, Tennessee and Virginia) made or plan to make eligibility restrictions that are likely to leave individuals without other coverage options. These are targeted restrictions that would affect small groups of beneficiaries.
In addition, California mentioned plans in FY 2016 to extend coverage to all undocumented children. This is a state-funded initiative and not funded through Medicaid; therefore, it is not counted as a Medicaid policy change in this report.
Enrollment Policies and Changes
Renewals
As of January 1, 2014, new streamlined renewal policies for Medicaid also went into effect under the ACA. However, many states were delayed in implementing new renewal procedures. Recognizing this delay, during 2014, CMS allowed states to suspend renewals for existing enrollees for specified periods of time in order to free up staff resources to process new applicants and continue to update eligibility systems to implement new streamlined renewal procedures based on MAGI rules. States were asked if, at the time of the survey, they were experiencing challenges processing MAGI-based renewals and to describe those challenges.
A number of states reported that they were experiencing challenges processing MAGI-based renewals at the time of the survey. Most of the issues reported were related to new eligibility systems, high volume of renewals, challenges matching data, and issues with pre-populated renewal forms. Most of these challenges were seen as temporary issues, but were not yet fully resolved in some states at the start of FY 2016.
Hospital Presumptive Eligibility (HPE)
Starting in January 2014, the ACA allowed qualified hospitals to make Medicaid presumptive eligibility determinations. States were asked to describe the level of participation among hospitals in their states. Thirty-three (33) states reported that they have implemented HPE and have at least one hospital participating in the initiative; the remaining states noted that either they were still working to implement HPE or that no hospitals had signed up to participate at the time of the survey.
Premiums and Cost-Sharing
In July 2013, CMS released final rules designed to streamline and simplify regulations around Medicaid premiums and cost-sharing, consolidate existing law and provide for individual market premium assistance. Under the new rules, CMS clarified that total Medicaid premiums and cost-sharing incurred by all individuals in a Medicaid household may not exceed an aggregate limit of five percent of the family’s income, applied on either a quarterly or monthly basis. To enforce this, the new rules also extended the requirement that states track aggregate premiums and cost-sharing and suspend such payments if the household reached the five percent cap.5 In this year’s survey, several states commented on the difficulty of implementing a process to track these limits. In some cases, this has resulted in delays or reversals of plans to increase beneficiary cost-sharing.
Premiums
With certain exceptions, Medicaid generally is not allowed to charge premiums to Medicaid beneficiaries with incomes at or below 150 percent FPL, although in limited cases certain populations may be charged premiums (sometimes referred to as “buy-in” programs) including: working individuals with disabilities eligible under the Ticket to Work and Work Incentives Improvement Act (TWWIIA) and children with disabilities in families with incomes that otherwise exceed Medicaid limits eligible under the Family Opportunity Act (FOA). States are also permitted under certain circumstances to impose premiums on parents receiving Transitional Medical Assistance (TMA) coverage. Prior to the ACA Medicaid expansion, a number of states also received Section 1115 waiver authority to expand coverage to higher income groups who were not otherwise eligible for Medicaid and to subject them to a premium requirement. Under the ACA, a few states have received federal waivers to impose premiums on their Medicaid expansion populations.
In this year’s survey, states identified very few changes to premiums. Six states reported premium changes, including some with multiple changes. Five states made or proposed changes related to ACA coverage expansions (Arkansas, Indiana, Iowa, Michigan and Montana) and are described following the next section. Two states (Michigan and Minnesota) increased premiums for working individuals with disabilities.6
Copayment Requirements
Most state Medicaid programs require beneficiary copayments, but to varying degrees. Six states reported new copayment requirements in either FY 2015 or FY 2016; each of these states reported new copayment requirements for their Medicaid expansion populations. Indiana reported new copayments in FY 2015 and FY 2016 aside from the new Medicaid expansion group. Only three states reported any other actual or planned copayment increases for either FY 2015 (one state) or FY 2016 (two states). Two states reported elimination of copayments in FY 2015 and three states reported reductions in copayments in either FY 2015 (two states) or FY 2016 (one state).
Increases for the ACA Expansion Population. Two states in FY 2015 (Indiana and Iowa) and four states in FY 2016 (Arizona, Montana, New Hampshire and New Mexico) adopted new copayments for their expansion populations. Four of these states (Arizona, Indiana, Iowa and New Mexico) noted changes in copayments related to non-emergent use of the Emergency Department (ED) for the expansion group; all but one (Indiana) planned to increase such copayments under existing state plan authority (up to $8). Indiana received a waiver under Section 1916(f) to test the effects of higher copayments ($8 for the first use of the ED and then $25 for subsequent use) than otherwise allowed under federal law (Section 1115 waiver authority does not extend to Medicaid cost-sharing requirements).7 Additionally, two states (New Hampshire and Michigan) reported plans to increase copayments for some expansion adults in FY 2016.
Pharmacy. A few states reported changes to pharmacy copayments in either FY 2015 or FY 2016. The nature and direction of these changes varied based on policy goals. New Mexico added pharmacy copayments for its expansion population. New Hampshire increased pharmacy copayments for its Medicaid expansion population, but eliminated pharmacy copayments for adults with incomes below 100 percent FPL. Two states reported decreased pharmacy copayments – an across the board reduction for working individuals with disabilities in New Mexico and a reduction in copayments for high value drugs (such as those for diabetes or mental illness) in South Carolina.
ACA Medicaid Expansion Premium Waivers
Five states (Arkansas, Indiana, Iowa, Michigan and Montana) used or plan to use Section 1115 demonstration waiver authority to implement premium requirements for their expansion populations. (Pennsylvania also received waiver authority to implement premiums for this population beginning January 1, 2016, but Governor Wolf chose to transition its Medicaid expansion from a waiver to a state plan amendment by September 2015, without premiums.) Arkansas, Indiana, Iowa, Michigan and Montana all implemented or plan to implement changes to premiums for their expansion populations in FY 2015 or FY 2016.
Arkansas, in February 2015, added monthly contributions of $10 to $15 depending on income as part of Health Care Independence Accounts (HIA) available to newly eligible adults with incomes between 100 and 138 percent FPL in lieu of paying cost-sharing obligations. If individuals do not pay the HIA amounts, they would be assessed copayments at the point of service.
Indiana’s Medicaid expansion waiver, Healthy Indiana Plan 2.0, requires most newly eligible adults with incomes from 0 to 138 percent FPL to contribute to a Personal Wellness and Responsibility (POWER) Account. Contributions range from $1 per month for individuals with incomes from zero to five percent FPL to $27 per month for individuals with incomes between 100 and 138 percent FPL. Payment is required before Medicaid enrollment is effective. Individuals have 90 days from the date of their invoice to make the required contributions without penalty. Failure to make contributions to the POWER accounts would result in a more limited benefits package and point of service copayments for those with incomes below 100 percent FPL and would result in a six month “lockout” from Medicaid eligibility for those with incomes above 100 percent FPL.
Under Iowa’s Medicaid expansion waiver, enrollees with incomes over 50 percent FPL are required to make a monthly premium contribution, beginning in the second year of coverage (January 2015 at the earliest), which could be waived if the beneficiary completes specified wellness activities. Beneficiaries can also receive a hardship exemption if they cannot pay the premiums. In Iowa, there are no copayment requirements except for non-emergency use of the emergency department, which were waived during the first year of enrollment. This copayment was adopted under a SPA, not a waiver.
The Healthy Michigan Plan requires contributions equal to two percent of annual income for persons between 100 and 138 percent FPL after they have been in the health plan for six months. (This is equivalent to the premiums that this population would face if they were enrolled in the Marketplace if the state had not expanded Medicaid). Total cost-sharing, including copayments (determined based on the past six months of services use) cannot exceed five percent of annual household income and is paid through the use of a dedicated health account called the “MI Health Account.” Enrollees can reduce their annual cost-sharing by participating in healthy behavior activities which include completing an annual health risk assessment. The imposition of these contributions began in FY 2015.8 Failure to pay premiums would not result in a loss of eligibility.
Montana’s Medicaid expansion waiver request would impose a premium of two percent of income for the entire ACA expansion group (from 0 to 138 percent FPL) as of January 1, 2016. Montana proposes dis-enrolling beneficiaries from 100-138 percent FPL for failing to pay premiums and seeks waiver authority to lock-out these individuals until overdue premiums are paid, or there is an assessment from the Department of Revenue against income taxes. Additionally, the waiver mentions that participation in a wellness program could exempt a beneficiary from disenrollment, but details were not provided. While the state is not requesting waiver authority, the proposal would require copayments according to maximum state plan amounts and consistent with federal law for all newly eligible beneficiaries.9
Table 2: Changes to Eligibility Standards in all 50 States and DC, FY 2015 and 2016
Eligibility Standard Changes
STATES
FY 2015
FY 2016
(+)
(-)
(#)
(+)
(-)
(#)
Alabama
Alaska
X – Medicaid Expansion
Arizona
Arkansas
California
Colorado
X
Connecticut
X
Delaware
DC
Florida
X
Georgia
Hawaii
Idaho
Illinois
X
X
Indiana
X – Medicaid Expansion
Iowa
Kansas
X
Kentucky
Louisiana
X
X
Maine
Maryland
Massachusetts
Michigan
X
Minnesota
X
Mississippi
Missouri
Montana
X
X – Medicaid Expansion
Nebraska
X
Nevada
New Hampshire
X – Medicaid Expansion
New Jersey
X
New Mexico
New York
X
North Carolina
X
North Dakota
Ohio
X
X
Oklahoma
Oregon
Pennsylvania
X – Medicaid Expansion
X
X
Rhode Island
South Carolina
South Dakota
Tennessee
X
Texas
Utah
Vermont
X
Virginia
X
X
X
Washington
West Virginia
Wisconsin
X
Wyoming
Totals
11
1
6
5
3
4
NOTES: Positive changes from the beneficiary’s perspective that were counted in this report are denoted with (+). Negative changes from the beneficiary’s perspective that were counted in this report are denoted with (-). Several states made reductions to Medicaid eligibility pathways in response to either the availability of coverage through the Marketplaces and/or through the Medicaid expansion; these changes were denoted as (#) since most affected beneficiaries will have access to coverage through an alternative pathway.
SOURCE: Kaiser Commission on Medicaid and the Uninsured Survey of Medicaid Officials in 50 states and DC conducted by Health Management Associates, October 2015.
Table 3: Eligibility Changes in all 50 States and DC, FY 2015 and FY 2016*
State
Fiscal Year
Eligibility Changes
Alabama
2015
2016
Alaska
2015
2016
Adults (+): Medicaid expansion on September 1, 2015. (Estimated first year enrollment of 20,000)
Arizona
2015
2016
Arkansas
2015
2016
California
2015
2016
Colorado
2015
2016
Other (+): Implement the option to eliminate the 5-year bar on eligibility for lawfully residing immigrant children. (Estimated to affect 1,699 individuals)
Connecticut
2015
2016
Adults (#): Reduction in income limits for parent/caretakers to 150% of FPL (with disregard, effectively 155%) (Estimated to affect 23,700 individuals, of whom 1,350 are not eligible for Transitional Medical Assistance and will lose Medicaid eligibility effective 9/1/2015)
Delaware
2015
2016
District of Columbia
2015
2016
Adults (nc): Section 1115 waiver expires 12/31/2015. Plan to transition adults with incomes above 138% FPL from a Medicaid waiver to Medicaid state plan. (Estimated to affect 7,000 or more individuals)
Florida
2015
Elderly and Disabled (+): Increased the minimum monthly maintenance income allowance and excess standard for community spouses of institutionalized people. (The number of nursing home residents eligible for Medicaid is also affected by 2015 cost of living adjustments and increases in the average private pay nursing home used to set LTSS policy.)
2016
Georgia
2015
2016
Hawaii
2015
2016
Idaho
2015
2016
Illinois
2015
Adults (#): Family planning waiver expired December 31, 2014.
Adults (nc): The state’s previous 1115 waiver (Cook County Care) ended June 30, 2014; adults transitioned to the new Medicaid expansion adult group July 2014.
2016
Adults (#): Plan to eliminate Breast and Cervical Cancer Treatment Program, with the expectation that these individuals qualify under the ACA expansion. (current enrollment is about 1,200)
Indiana
2015
Adults (+): Adult expansion under HIP 2.0. (Affects an estimated 357,000 individuals)
2016
Iowa
2015
2016
Kansas
2015
Adults (+): Presumptive Eligibility for Pregnant Women. (Estimated fewer than 500)
2016
Kentucky
2015
2016
Louisiana
2015
Adults (#): Eliminated Family Planning waiver for those over 138% FPL. Those with income below 133% FPL will move from waiver to state plan. (8,700 individuals)
Adults (+): Family Planning SPA includes more services and adds coverage for men.
2016
Maine
2015
2016
Maryland
2015
2016
Massachusetts
2015
2016
Michigan
2015
2016
Adults (+): Income and asset expansion for working disabled adults.
Minnesota
2015
Adults (#): Eliminated MinnesotaCare coverage for those with incomes between 133% and 200% FPL. Change is neutral for enrollees because Minnesota implemented a Basic Health Plan for those with incomes between 133% and 200% FPL.
2016
Mississippi
2015
2016
Missouri
2015
2016
Montana
2015
Adults (+): Raised cap on 1115 Mental Health Services Plan (MHSP) waiver from 2,000 to 6,000 adults with SMI.
2016
Adults (+): Waiver request in process to implement ACA expansion, including request for 12 month continuous coverage.
Nebraska
2015
2016
Other (+): Individuals age 19-21 who entered into a subsidized guardianship or adoption at age 16 or older. (13 individuals)
Nevada
2015
2016
New Hampshire
2015
Adults (+): Implemented the Medicaid expansion as of July 1, 2014. Coverage became effective August 15, 2014. The expansion was originally implemented through existing managed care programs and transitioned to a waiver January 2016. (estimated 50,000 individuals)
2016
New Jersey
2015
Elderly and Disabled (+): New Jersey implemented the “Miller Trust” option. New applicants formerly eligible for the Medically Needy program will establish qualified income trust, resulting in an expanded benefit package (beyond just long-term care services). Individuals in the “Medically Needy Spend-Down Adults” group on November 30, 2014, were grandfathered into this program.10 (209 additional enrollees)
2016
New Mexico
2015
2016
New York
2015
Adults (#): Transfer some Medicaid waiver coverage (parents with incomes from 138% FPL to 150% FPL that receive an additional premium wrap to purchase coverage in the Marketplace) to Essential Plan (New York’s BHP).
2016
North Carolina
2015
Adults (+): Income and resource disregard of payments from the Eugenics Compensation Program.
2016
North Dakota
2015
2016
Ohio
2015
2016
Adults (#): Ending Family Planning coverage group as of 1/1/16.
Other (-): Change in transitional Medicaid for families from 12 months of eligibility to six months of eligibility with possible coverage for two consecutive six-month reporting periods. (Affects estimated 50,000 individuals)
Oklahoma
2015
2016
Oregon
2015
2016
Pennsylvania
2015
Adults (+): Implemented the Healthy PA Section 1115 waiver January 1, 2015, which increased Medicaid eligibility for adults up to 138% FPL. (605,180 individuals) State converted this to a SPA starting in FY 2015 with completion in FY 2016.
Adults (#); Medically-Needy Spend-down disabled adult coverage was discontinued with the implementation of Healthy PA; however, it is scheduled for reinstatement in FY 2016. (Affects 3,346 individuals)
2016
Adults (nc): Family Planning waiver converted to a SPA. Review of family planning enrollees for possible eligibility for full health care. (90,000 individuals)
Adults (#): Reinstatement of medically needy spend-down for disabled adults. (3,346 individuals)
Adults (nc): Converted all individuals enrolled in Medicaid expansion under the Healthy PA 1115 waiver to the Health Choices Medicaid expansion state plan as of September 1st.
Rhode Island
2015
2016
South Carolina
2015
2016
South Dakota
2015
2016
Tennessee
2015
2016
Elderly and Disabled (-): In FY 2016 (7/1/2015), will begin limiting new LTSS enrollment into a 1915(i)-like group (offered under 1115 authority) to those eligible for SSI only. People already enrolled in the group under institutional income standards will be grandfathered. (Affects estimated 915 individuals)
Texas
2015
2016
Utah
2015
2016
Vermont
2015
Other (+): Submitted SPA to disregard asset tests for non-ABD medically needy.
2016
Virginia
2015
Adults (#): Restored income eligibility for Family Planning coverage to 200% FPL. (Limit had been cut to 100% FPL on 1/1/2014.)
Elderly and Disabled (+): For Ticket to Work disabled population, three changes:1. Increased allowable earnings to $75,000 per year; any increase in a participants SSDI payments, or as a result of a COLA increase not counted as income as long as deposited in WIN account.2. Unemployment benefits received due to loss of employment through no fault of the individual’s own disregarded as income during a six-month grace period as long as deposited in the WIN account.3. Income from a spouse not deemed to an applicant or enrollee in the program.(Estimate of 50 individuals.)
Adults (+): Implemented a Section 1115 waiver program to expand limited benefit coverage to uninsured adults with incomes up to 100% FPL with serious mental illness.
2016
Adults (-): Per state legislation, income eligibility for the Section 1115 waiver program that expanded limited benefit coverage to uninsured adults with serious mental illness was reduced from 100% FPL to 60% FPL.
Washington
2015
2016
West Virginia
2015
2016
Wisconsin
2015
Elderly and Disabled (-): Treating promissory notes as an asset. (Estimate of 40 individuals)
2016
Wyoming
2015
2016
* Positive changes from the beneficiary’s perspective that were counted in this report are denoted with (+). Negative changes from the beneficiary’s perspective that were counted in this report are denoted with (-). Several states made reductions to Medicaid eligibility pathways in response to either the availability of coverage through the Marketplaces and/or through the Medicaid expansion; these changes were denoted as (#) since most affected beneficiaries will have access to coverage through an alternative pathway. Other changes to Medicaid eligibility that are not likely to affect beneficiaries but were reported by states are denoted with (nc).
Table 4: Premium and Copayment Actions Taken in all 50 States and DC, FY 2015 and 2016*
State
Fiscal Year
Premium and Copayment Changes
Alabama
2015
2016
Alaska
2015
2016
Arizona
2015
2016
Copays (New only for expansion group): Impose mandatory copays to federal statutory limits and an $8 copay for non-emergent use of the ER on expansion adults. (Upon CMS approval)
Arkansas
2015
Premiums (New only for expansion group): Added monthly contributions as part of Health Independence Accounts available to newly eligible adults with incomes between 100-138% FPL. Contributions to the HIAs are in lieu of point of service copayments. (February 2015)
2016
California
2015
2016
Colorado
2015
2016
Connecticut
2015
2016
Delaware
2015
2016
District of Columbia
2015
2016
Florida
2015
2016
Georgia
2015
2016
Hawaii
2015
2016
Idaho
2015
2016
Illinois
2015
2016
Indiana
2015
Premiums (New only for expansion group): POWER Account Contributions under HIP 2.0 for all low-income parents/caretakers and the new adult group (0-138% FPL) on a sliding scale. Those that fail to pay premiums within a 60-day grace period with income at or below 100% FPL are moved to a more limited benefit package and those with income over 100% FPL will be dis-enrolled from coverage and barred from re-enrolling for 6 months. (Feb 2015)
Premiums (New): Non-expansion parent/caretaker relatives and those receiving TMA have the option of paying premiums to get additional benefits and in lieu of copays for services.
Copays (New): Testing graduated copays ($8 then $25) for non-emergency use of the ER for non-expansion parent/caretakers and newly eligible adults under § 1916(f) authority.
Copays (New for expansion group): Beneficiaries with income at or below 100% FPL who fail to pay premiums will be required to make copays in state plan amounts.
Copays (Elimination): Remove copays for ABD enrollees in managed care. (April 2015)
2016
Copays (New): Restore copays for ABD enrollees in managed care (Jan 2016)
Iowa
2015
Premiums (New only for expansion group): Under the Iowa Health and Wellness Plan (IHWP), enrollees with incomes over 50 percent FPL are required to make a monthly premium contribution, beginning in the second year of coverage, which could be waived if they complete specified wellness activities. Premium amounts are $5 per month for those with incomes between 50% to 100% FPL and $10 per month for those with incomes over 100% FPL. Individuals can file a hardship exemption if they are not able to pay. (Jan 2015)
Copays (New only for expansion group): All enrollees in the expansion group are be subject to $8 copay for non-emergent use of the ED. (Jan 2015)
2016
Kansas
2015
2016
Kentucky
2015
2016
Louisiana
2015
2016
Maine
2015
2016
Maryland
2015
2016
Massachusetts
2015
2016
Michigan
2015
Premiums (New only for expansion group): Healthy Michigan Plan requires MI Health Account contributions equal to 2% of annual income for persons between 100% and 133% FPL after they have been in the health plan for 6 months. (Oct 2014)
2016
Premiums (Increase): Legislation expanding the income and asset levels for Freedom to Work Medicaid (TWIIAA) included a revised premium schedule. (Oct 2015)
Copays (Increase): Increase in prescription, hospital, and office visit copays for Healthy Michigan Plan enrollees with incomes above 100% FPL. (Unknown date due to systems issues and CMS approval requirements.)
Minnesota
2015
Cost-Sharing (Neutral Effect): The family deductible for adults in Medicaid was decreased to $2.75 per month, retroactive to 1/1/2014. (MCOs can waive the deductible.)
2016
Premiums (Decreased): Minimum premium for Medical Assistance for Employed Persons with Disabilities (MA-EPD) reduced. (Sep 2015)
Copays (Decreased): Decreased copayment amounts for MA-EPD group. (Sep 2015)
Mississippi
2015
2016
Missouri
2015
2016
Montana
2015
2016
Premiums (New only for expansion group): Waiver request to impose premiums (2% of income) for the entire ACA expansion group.
Copays (New only for expansion group): Individuals with incomes up to 138% FPL will be required to pay copayments up to the maximum allowable amount under federal law.
Nebraska
2015
2016
Nevada
2015
2016
New Hampshire
2015
Copays (Eliminated): Eliminating pharmacy copays for adults under 100% FPL. (July 2014)
2016
Copays (Increased): Pharmacy copays for the expansion group (those above 100% FPL) are being increased from $1/$4 (generic/brand) to $2/$8. (Jan 2016)
Copays (New only for expansion group): Expansion group will be subject to copays on some medical services. (Jan 2016)
New Jersey
2015
2016
New Mexico
2015
Copays (Decreased): Pharmacy copayment decreased from $5.00 to $4.00 for working disabled Individuals. (FY 2015)
2016
Copays (New only for expansion group): Copays for non-emergency use of the emergency department and for brand-name prescriptions when there is a less expensive generic equivalent medicine available. (FY 2016)
New York
2015
2016
North Carolina
2015
2016
North Dakota
2015
2016
Ohio
2015
2016
Oklahoma
2015
Copays (Increased): Most SoonerCare copays increased. (July 2014)
2016
Oregon
2015
2016
Pennsylvania
2015
2016
Rhode Island
2015
2016
South Carolina
2015
2016
Copays (Decrease): Exempting certain high value drugs (including maintenance and certain psychiatric drugs) from copay requirements for all full benefit Medicaid beneficiaries. (July 2015)
South Dakota
2015
2016
Tennessee
2015
2016
Texas
2015
2016
Utah
2015
2016
Vermont
2015
2016
Virginia
2015
2016
Washington
2015
2016
West Virginia
2015
2016
Wisconsin
2015
2016
Wyoming
2015
2016
* New premiums or copays as well as new requirements (i.e. making copays enforceable) are noted as (NEW). Increases in existing premiums or copays are noted as (Increased), while decreases are noted as (Decreased) and eliminations are noted as (Eliminated).
Report: Managed Care Reforms
Key Section Findings
As of July 2015, a total of 39 states (including DC) had contracts with comprehensive risk-based managed care organizations (MCOs).
Among the 39 states with MCOs, 21 states reported that 75 percent or more of their beneficiaries were enrolled in MCOs as of July 1, 2015, including four of the five states with the largest total Medicaid enrollment across the country.
In both FY 2015 and in FY 2016, states continued to take actions to increase enrollment in managed care. The most common strategy was to expand voluntary or mandatory enrollment to additional eligibility groups, particularly those eligible for long-term services and supports (LTSS). In addition, five states (Florida, Indiana, Iowa, Louisiana and Rhode Island) are terminating PCCM programs in either FY 2015 or FY 2016 and shifting those populations into risk-based managed care.
Nearly all states elect to exclude or “carve-out” certain services from MCO contracts. These services may be delivered and financed through another contractual arrangement (e.g., through a limited benefit risk-based prepaid health plan or “PHP”) or in the FFS delivery system. Most MCO states carve-in prescription drugs while LTSS are more likely to be carved-out. More than half of MCO states carve-in dental services for children. Behavioral health services arrangements are more varied, with more states opting to carve-out all or some of these services. However, more states are moving to carve-in behavioral health as well as LTSS in FY 2015 and FY 2016.
In FY 2015, a total of 21 states implemented new or expanded quality initiatives, and 19 states planned to do so in FY 2016. The most common new or expanded initiatives in FY 2015 and 2016 were the adoption or increase of managed care payment withholds.
As of July 1, 2015, 19 of the 39 states that contracted with comprehensive risk-based MCOs specified a minimum MLR for all or some plans. State Medicaid minimum MLRs vary, but most are set at 85 percent. A few states noted that their minimum MLRs varied by type of plan or population.
States’ auto-enrollment algorithms also vary, but usually take into consideration previous plan or provider relationships, geographic location of the beneficiary, and/or plan enrollments of other family members. In addition, states reported that algorithms were designed to balance enrollment among plans, take into account plan capacity, and reward higher-quality MCOs.
Tables 5 through 10 include more detail on the populations covered under managed care (Table 5), expansions to new groups (Table 6), selected benefits included in managed care contracts (Table 7), managed care quality initiatives (Table 8), and MLR (Table 9) and auto-enrollment policies (Table 10). These tables are also available in a downloadable PDF.
Managed care is now the predominant delivery system for Medicaid in most states, as Medicaid programs increasingly have turned to managed care as a means to help ensure access, improve quality and achieve budget certainty. As of July 2015, all states (including DC) except three – Alaska, Connecticut and Wyoming– had in place some form of managed care. Across the 48 states with some form of managed care, a total of 39 states (including DC) had contracts with comprehensive risk-based managed care organizations (MCOs); 19 states administered a Primary Care Case Management (PCCM) program, a managed fee-for-service based system in which beneficiaries are enrolled with a primary care provider who are paid a small fee to provide case management services in addition to primary care. Of the 48 states that operate some form of managed care, a total of 10 states operate both MCOs and a PCCM program while 29 states (including DC) operate MCOs only and nine states operate PCCM programs only.11 (Figure 3) Wyoming, one of the three states without managed care (i.e., without an MCO or PCCM model), does operate a limited-benefit risk-based prepaid health plan (PHP). In total, 18 states (including Wyoming) contracted with one or more PHPs to provide behavioral health, dental care, maternity care, non-emergency medical transportation, or other benefits.
Figure 3: Comprehensive Medicaid Managed Care Models in the States, 2015
Populations Covered by Managed Care
The share of Medicaid beneficiaries enrolled in MCOs, PCCM programs or remaining in fee-for-service varies widely by state. However, the share of Medicaid beneficiaries enrolled in MCOs has steadily increased as states have expanded their managed care programs to new regions and new populations and made MCO enrollment mandatory for additional eligibility groups. In this year’s survey, states were asked to indicate the approximate share of specific Medicaid populations that were served by MCOs, PCCM programs and fee-for-service (FFS) for their acute care services. As shown in Table 5, among the 39 states (including DC) with MCOs, 21 states reported that 75 percent or more of their Medicaid beneficiaries were enrolled in MCOs as of July 1, 2015, including four of the five states with the largest total Medicaid enrollment, accounting for 4 out of every 10 Medicaid beneficiaries across the country (California, New York, Texas and Florida). (Figure 4 and Table 5)
Figure 4: MCO Managed Care Penetration Rates for Select Groups of Medicaid Beneficiaries as of July 1, 2015
Children and adults (particularly those enrolled through the ACA Medicaid expansion) are much more likely to be enrolled in an MCO than elderly Medicaid beneficiaries or those with disabilities. Thirty-two (32) of the 39 MCO states covered 75 percent or more of children through MCOs. Twenty-one (21) of the 39 MCO states covered 75 percent or more of low-income adults (e.g., parents, pregnant women) through MCOs. The elderly and people with disabilities were the group least likely to be covered through managed care contracts, with only 15 of the 39 MCO states covering 75 percent or more such enrollees through MCOs. (Figure 4) With the exception of some states participating in the CMS Financial Alignment Demonstrations, most states were even less likely to include those dually eligible for Medicare and Medicaid through managed care contracts.
Of the 29 states that were implementing the ACA Medicaid expansion on July 1, 2015, 26 were using MCOs to cover newly eligible adults. (The three expansion states without risk-based managed care were Arkansas, Connecticut and Vermont.) The large majority (23) of these 26 states covered more the 75 percent of beneficiaries in this group through managed care. The three states with less than 75 percent MCO penetration for this group were Colorado, Illinois and Iowa (which each operate PCCM programs as well as MCOs.)
Ten (10) of the 19 states with PCCM programs also contract with MCOs. In most of these states, MCOs cover a larger share of beneficiaries than PCCM programs. However, Colorado, Iowa and North Dakota are exceptions: a majority of Colorado’s enrollees were in the PCCM program, which is the foundation of the state’s Accountable Care Collaboratives, and approximately four in ten enrollees in both Iowa and North Dakota were enrolled in those states’ PCCM programs as of July 1, 2015.
Managed Care Population Changes
In both FY 2015 and in FY 2016, states continued to take actions to increase enrollment in managed care, although fewer states reported doing so than in last year’s survey – likely reflecting full or nearly full MCO saturation in a growing number of states. Of the 39 states (including DC) with MCOs, a total of 20 states indicated that they made specific policy changes in either FY 2015 (13 states) or FY 2016 (13 states) to increase the number of enrollees in MCOs, compared to 34 in last year’s survey; no states with MCOs took any action to restrict MCO enrollment.
Figure 5: Medicaid Managed Care Population Expansions, FYs 2015 and 2016
The most common strategy was to expand voluntary or mandatory enrollment to additional eligibility groups (9 states in FY 2015 and 8 states in FY 2016). The eligibility group most commonly added to MCOs was persons eligible for LTSS (New Jersey, New Mexico, New York, Texas, Virginia and Washington), followed by the newly eligible adult group in states adopting the ACA Medicaid expansion (Illinois, Indiana, Pennsylvania and West Virginia). In addition, five states (Florida, Indiana, Iowa, Louisiana and Rhode Island) are terminating their PCCM programs in either FY 2015 or FY 2016 and shifting those populations into risk-based managed care (discussed below). Four states (Florida, Illinois, Louisiana and New York) made enrollment mandatory for specific eligibility groups in FY 2015, and nine states (Illinois, Iowa, Louisiana, New Hampshire, New York, Rhode Island, Utah, Virginia and Washington) are doing so in FY 2016. Expansions of MCO geographic service areas were reported in five states in FY 2015, and in four states for FY 2016. (Figure 5) In addition, California reported plans to enroll undocumented children into MCOs in FY 2015. This is predominantly a state-funded program and is therefore not counted as a Medicaid policy change in this report.
Notable MCO Expansions Implemented or Planned
Florida transitioned nearly all Medicaid enrollees into MCOs on a phased-in schedule that was completed in August 2014. At that time, Florida’s PCCM, dental PHP and behavioral health PHP programs ended.
Indiana began enrolling aged, blind and disabled enrollees into the Hoosier Care Connect MCO program in April 2015 and ended the Care Select PCCM program on June 30, 2015.
Iowa plans to implement statewide MCO coverage for almost all Medicaid enrollees on January 1, 2016 (pending federal waiver approval) and end its PCCM and behavioral health PHP programs.
Louisiana discontinued its Bayou Health Shared Savings (enhanced PCCM) model on January 31, 2015 and transitioned enrollees to MCOs.
Rhode Island reported plans to eliminate its PCCM program for adults with disabilities (Connect Care Choice) in FY 2016 and transition enrollees to MCOs.
Primary Care Case Management (PCCM) Programs Changes
Of the 19 states with PCCM programs, six indicated they enacted policies to increase PCCM enrollment in FY 2015 or FY 2016. Four (Iowa, Massachusetts, Montana and Nevada) indicated that they would enroll new Medicaid expansion adults in their PCCM programs; Alabama expanded its Health Home program statewide in FY 2015; and Colorado reported increased PCCM enrollment of persons dually eligible for Medicare and Medicaid as part of its Financial Alignment Demonstration.
In contrast, seven states (Florida, Illinois, Indiana, Iowa, Louisiana, Oklahoma, and Rhode Island) have taken actions to decrease enrollment in their PCCM programs. Five of these states (Florida, Indiana, Iowa, Louisiana and Rhode Island) have ended or plan to end their PCCM programs and will transition PCCM enrollees to risk-based managed care. In June 2014, Illinois began transitioning 1.5 million PCCM enrollees to new care coordination models (including both risk-based managed care and PCCM models) in five mandatory enrollment regions. In Oklahoma, effective July 2014, individuals with creditable primary coverage are no longer eligible for the SoonerCare Choice PCCM program.
Limited-Benefit Prepaid Health Plans (PHP) Changes
Of the 18 states with one or more limited-benefit prepaid health plans (PHPs), six indicated they enacted policies to increase PHP enrollment in FY 2015 or FY 2016. California is planning to move coverage of substance abuse services from FFS to a PHP arrangement in FY 2016.12 Iowa reported that the benefit for its Medicaid expansion population includes a dental PHP program, and Pennsylvania reported that the Medicaid expansion would increase enrollment in its behavioral health PHP program. Michigan indicated that its dental PHP program was expanding to additional counties; Wisconsin noted that its LTSS PHP was expanding to additional counties; and Wyoming expanded a behavioral health PHP program for children statewide.
Four states reported actions that decreased enrollment in their PHP programs. Iowa and Florida folded, or will fold, PHP arrangements into their MCO programs (dental and behavioral health PHPs in Florida and a behavioral health PHP program in Iowa). Colorado ended a physical health PHP and replaced it with an MCO arrangement, and Washington is allowing “Early Adopter” counties to convert behavioral health PHPs to fully integrated MCO contracts.
Benefits Covered Under Managed Care Contracts
Although MCOs are at-risk financially for providing a comprehensive set of acute-care services, nearly all states elect to exclude or “carve-out” certain services from MCO contracts. These services may be delivered and financed through another contractual arrangement (e.g., through a limited benefit risk-based PHP) or in the FFS delivery system. In this year’s survey, states were asked to indicate the delivery system(s) used to provide the following benefits: prescription drugs, children’s dental services, adult dental services, outpatient and inpatient mental health services and substance abuse services.
The data presented shows this information only for populations enrolled under an MCO contract. Nearly all states exclude some populations from MCOs. For example, North Dakota does not cover children through its managed care contracts so North Dakota is not included in the “Dental (Children)” data. Ten states that operate MCOs do not cover dental services for adults (or only cover emergency dental), so these states are excluded from the “Dental (Adults)” counts.
“Carved-in” refers to the inclusion in MCO contracts of virtually all services in a given category (exceptions may exist, such as limited carve-outs for selected drugs). “Varies” refers to cases where the inclusion of benefits in MCO contracts may vary by population or region or the contract may cover some but not all services (e.g., states that carve-in some behavioral health services but carve-out specialized services for persons with serious mental illness). “Carved-out” means that the services are largely excluded from MCO contracts and are instead covered under either a FFS or PHP model. (Figure 6) States were also asked to describe any carve-in or carve-out changes for specific benefits in FY 2015 or planned for FY 2016. The most commonly reported benefit change was to carve-in behavioral health services and LTSS.
Figure 6: There is significant variation in the services states cover through Medicaid managed care contracts.
Pharmacy
Most MCO states (33 of 39 states) carve-in their pharmacy services for the populations covered by their MCO contracts. Some of these states have small carve-outs for certain drugs or drug classes (e.g., HIV/AIDS drugs, medications for hepatitis C, mental health drugs, etc.). Three states (Iowa, Missouri and Nebraska) carve-out pharmacy benefits entirely, delivering these benefits on a FFS basis. Additionally, Tennessee reported that all drugs – except for certain physician-administered drugs – are carved-out and delivered FFS through a contracted pharmacy benefit manager. Two states (Indiana and Wisconsin) reported that pharmacy benefits are carved-in under certain MCO programs but carved-out of others.
A number of states have carved pharmacy benefits into their managed care contracts in recent years. In this year’s survey, four states added or reported plans to add pharmacy benefits to their managed care contracts (Delaware, Iowa, Indiana and New York). Delaware reported carving pharmacy benefits into their MCO contracts in FY 2015. Iowa plans to carve the pharmacy benefit into its MCO contracts as it terminates its PCCM program and shifts this population to MCOs in FY 2016. Indiana implemented a new MCO program for the aged, blind and disabled population in FY 2015 that included pharmacy benefits; it also carved-in pharmacy benefits for the Healthy Indiana Plan (the state’s expansion group). New York, which had already carved most pharmacy benefits into managed care contracts, plans to carve-in hemophilia factor products and injectable antipsychotic drugs in FY 2016. In contrast, only one state (Maryland) reported carving some pharmacy benefits out of managed care contracts in FY 2016 (substance use disorder drugs).
Dental
Children’s Dental. More than half of MCO states that cover children under their managed care contracts13 generally carve-in children’s dental services (21 of 38 states). Fifteen (15) MCO states carve-out children’s dental services. The majority of these states cover children’s dental on a FFS basis, but two states (Louisiana and Rhode Island) carve-out these services to a PHP and two states (Michigan and Utah) use both PHP and FFS models, depending on geographic area. Two states (Indiana and Wisconsin) reported that children’s dental services are sometimes carved-in: Indiana’s coverage varies by MCO program and Wisconsin’s coverage varies by geographic region.
Adult Dental. Twenty-nine (29) of the 39 MCO states reported that they cover adult dental benefits; the other ten do not cover adult dental or only provide coverage for emergency dental services.14 Just over half of the MCO states that cover adult dental generally carve-in this benefit (15 of 29 states). Another four (Indiana, Massachusetts, Michigan and Wisconsin) sometimes carve-in adult dental services; in Indiana, Massachusetts and Michigan, the dental carve-in varies by MCO program while the dental carve-in in Wisconsin varies by geographic region. Eight of the remaining ten MCO states with adult dental benefits carve these services out15 to FFS, while two states (Iowa for expansion adults and Louisiana) carve-out adult dental services to PHPs.
Indiana reported carving dental services into managed care contracts for selected populations (children and adults) in FY 2015.
Behavioral Health
States cover behavioral health services (mental health and substance abuse services) through a wide array of delivery arrangements. Sixteen (16) MCO states generally cover outpatient mental health services through their MCO contracts; a similar number cover inpatient mental health services (15 states) and substance abuse services (16 states) through their MCO contracts. Of the remaining states, a number contract with PHPs to provide carved-out specialty behavioral health services.
Eight states reported planned changes for FY 2016: six states (Arizona, Iowa, Louisiana, New York, Washington and West Virginia) plan to carve inpatient and outpatient mental health services as well as substance abuse services into at least some of their MCO contracts. Arizona plans to carve-in these services for their dual-eligible beneficiaries under their acute care contracts; New York continues to phase in coverage of these services under managed care plans. Iowa and Louisiana plan to transition coverage from PHPs to their managed care contracts. Washington also reported plans to carve these services into managed care contracts in regions that elect to be “Early Adopters” as part of their effort to establish common purchasing regions for managed behavioral health and physical health. (Those that do not will contract separately for physical and behavioral health.) In addition, Mississippi plans to carve inpatient mental health services into its managed care contracts as part of its larger effort to carve-in inpatient services generally. Maryland reported carving substance abuse services out of managed care contracts in FY 2015.
Long-Term Care Services and Supports (LTSS)
In this survey, about half of the MCO states reported that institutional LTSS (17 states) and home and community-based services (HCBS) (18 states) were provided only under the FFS delivery system. However, the survey did not capture whether LTSS was carved out of the states’ MCO arrangements or whether, instead, persons receiving LTSS were entirely excluded from MCO arrangements for all of their care (primary, acute, and behavioral health services). Only a small number of states reported that most LTSS is provided by MCOs – five states for institutional LTSS (Arizona, Hawaii, Kansas, New Mexico and Tennessee) and four states for HCBS (Arizona, Kansas, New Jersey and Tennessee). In some of these states, however, persons with intellectual and developmental disabilities (IDD) are excluded from enrollment or IDD waiver services are carved-out. In addition, 17 other MCO states reported providing some HCBS and institutional LTSS through MCOs, often based on specific population characteristics and/or geographic region (for example, under a Financial Alignment Demonstration for dual eligible beneficiaries). A number of states also mentioned PACE programs,16 but this site-based form of managed care was not counted for purposes of this analysis.
Ten states reported changes for FY 2015 or planned for FY 2016. In FY 2015, six states (California, Michigan, New Jersey, New York, South Carolina and Texas) implemented MCO arrangements for institutional LTSS and HCBS for at least some populations; many of these states noted this change was in reference to the launch of dual eligible demonstrations (Michigan, New York, South Carolina and Texas). California implemented MCO contracts including both HCBS and institutional care services in some counties in FY 2015. New Jersey carved HCBS (services and beneficiaries) into managed care contracts as well as institutional services for new nursing facility entrants (those already in nursing facilities will remain in FFS). Texas also carved institutional LTSS into its non-dual managed LTSS program. Additionally, Idaho added institutional as well as HCBS to its Medicare-Medicaid Coordinated Plan (MMCP) in FY 2015.17
In FY 2016, five states will implement new LTSS MCO arrangements. Rhode Island will implement its dual eligible demonstration; Iowa will include both HCBS and institutional LTSS into new MCO contracts (pending federal waiver approval), and New Hampshire will add HCBS to its MCO contracts. New York and New Mexico will add additional LTSS (services and beneficiaries) to their MCO contracts (assisted living services in New York, waiver services for the medically frail in New Mexico).
Managed Care Quality Initiatives
All states with MCO programs track one or more quality measures and require other health plan quality activities to improve health care outcomes and plan performance. In this year’s survey, states were asked whether certain quality strategies were in place in FY 2014, or newly added or expanded in FY 2015 or FY 2016. Thirty-three (33) of the 39 MCO states (including DC) had one or more of these quality strategies in place in FY 2014. A majority (23 states) publicly reported or required MCOs to publicly report quality metrics (e.g., a “report card”), and over one-third had pay-for-performance provisions, capitation withholds, and performance bonuses or penalties in place in FY 2014 as well. (Figure 7) Four states mentioned other types of quality initiatives in place in 2014 including a requirement for some or all plans to be NCQA-accredited (Massachusetts and Tennessee), a requirement for MCOs to implement provider and member incentive plans (Missouri) and other reviews of performance, quality and network adequacy (Nevada).
In FY 2015, a total of 21 states implemented new or expanded quality initiatives and 19 states planned to do so in FY 2016. The most common initiative that was new or expanded in FY 2015 and 2016 was managed care payment withholds tied to quality performance. (Figure 7) Three of these states in FY 2015 (California, Texas and West Virginia) and two of these states in FY 2016 (DC and Iowa) added new withhold requirements. Withhold amounts ranged from 0.15 percent (Virginia) to five percent (West Virginia and Minnesota). Several states also reported expanding or adding new pay-for- performance requirements as well as performance bonus or penalties and initiatives to publicly report quality metrics.
A few states mentioned additional types of quality initiatives. Minnesota will require MCOs to participate in its ACO and value-based contracting initiatives in FY 2016, and Pennsylvania will require MCOs to participate in community-based care management programs in FY 2015 and plans to require MCOs to participate in physical health/behavioral health integration efforts in FY 2016.
Medicaid Managed Care Administrative Policies
Minimum Medical Loss Ratios
For an MCO, the proportion of total per member per month capitation payments that is spent on clinical services and for quality improvement is known as the Medical Loss Ratio (MLR). Thus, the MLR represents the share of dollars that MCOs spend on providing and improving patient care, rather than on administrative costs, which include executive salaries, overhead, and marketing and profits. State insurance regulators commonly set a minimum MLR for commercial health plans, and the ACA mandates a minimum MLR for Medicare Advantage plans and for qualified health plans (QHPs) participating in the health insurance Marketplaces. There is currently no federal minimum MLR for Medicaid MCOs, nor are state Medicaid programs currently required to set minimum MLRs, but states are allowed to establish minimum MLR requirements for Medicaid health plans.
As of July 1, 2015, 19 of the 39 states that contracted with comprehensive risk-based MCOs specified a minimum MLR for all or some plans, and 20 states did not have an MLR requirement. Seventeen (17) of the 19 states with a MLR requirement always applied it and two states applied it on a limited basis (e.g., for the new ACA Medicaid expansion population). State Medicaid MLRs vary, but are most commonly set at 85 percent. A few states noted that their minimum MLRs varied by type of plan or population.
Other states that do not require a minimum MLR did note other mechanisms to monitor administrative costs and profits among Medicaid MCOs. Four states without minimum MLRs (Massachusetts, New York, Pennsylvania and Virginia) reported having a cap on profits and/or administrative costs. Two states (California and Utah) reported using a target MLR in their rate-setting process. One state (Texas) reported requiring “experience rebates” from plans with profits above a specified level, and one state (Kansas) reported not requiring a minimum MLR but does track MLRs of its plans.
Auto-enrollment
Beneficiaries who are required to enroll in MCOs must be offered a choice of at least two plans. Those who do not select a plan are auto-enrolled in a plan by the state. Of the 39 states with comprehensive risk-based MCOs, all except one required some or all beneficiaries to enroll in an MCO. (The exception is North Dakota, which has only one health plan.) The proportion of beneficiaries who are auto-enrolled varies widely across states. Two states had auto-enrollment rates of 10 percent or less, while six states auto-enrolled over 75 percent of new MCO enrollees.18 States’ auto-enrollment algorithms also vary, but are usually designed to take into consideration previous plan or provider relationships, geographic location of the beneficiary, and/or plan enrollments of other family members. In addition, over half (23) of MCO states reported that their auto-enrollment algorithms were designed to balance enrollments among plans; 15 states considered plan capacity, and eight states took plan quality rankings into consideration. Other states noted plans to move toward including quality rankings in their auto-assignment algorithms in the future.
Selected State Auto-Enrollment Quality Criteria
Minnesota: Enrollees who do not select a plan are defaulted (i.e., auto-enrolled) into plans in their area with the highest overall quality score.
Missouri: Auto-enrollment algorithm includes various factors including plan capacity, balancing enrollment among plans, certain performance criteria and consideration of the number of FQHCs, RHCs, CMHCs, and safety net hospitals in the plan.
Washington: The auto-enrollment algorithm is based on an average of plan performance on two HEDIS measures as well as initial health screening rates. In May 2015, Washington’s Health Benefit Exchange implemented health plan selection online, enabling Medicaid beneficiaries to select a health plan online at the time of eligibility and recertification or at any time (as state does not currently have a “lock-in” policy). The state anticipates this change will reduce the number of auto-enrolled individuals.
Using HEDIS measures for Plan Selection. In this year’s survey, states were asked if they used, or planned to use, HEDIS scores as criteria for selecting MCOs to contract with. Of the 39 states with MCOs, 14 answered “yes,” 22 answered “no,” and three states did not respond.
Proposed Managed Care Rule
On May 26, 2015, CMS released a long-awaited proposal to revise and modernize the Medicaid managed care regulations.19 The proposed rule addresses changes that have occurred in state Medicaid managed care and other programs since the regulations were last revised in 2002, including the emergence of managed long-term services and supports (MLTSS) and other innovative payment and delivery system models. Among other things, the sweeping changes proposed are intended to strengthen the quality of care provided to Medicaid beneficiaries, promote more effective use of data in overseeing managed care, strengthen actuarial soundness and other payment requirements, ensure beneficiary protections, promote beneficiary access to care and strengthen program integrity safeguards. The proposed rule is also intended to promote better alignment with other coverage including Marketplace Qualified Health Plans and Medicare Advantage plans.20 A variety of other stakeholders, including state Medicaid agencies, health plans, providers and beneficiary advocates, commented on the proposed rule, expressing support for select provisions and raising concerns over others.21
In its lengthy and detailed comment letter to CMS submitted on July 27, 2015, the National Association of Medicaid Directors (NAMD) identified both the specific concerns of its members as well as those provisions of the proposed rule viewed as positive policy approaches.22 Three overarching concerns were identified: the new administrative costs that states would incur to implement the new requirements; the ability of CMS to carry out the new proposed oversight activities without resulting in problematic delays for states (e.g., approvals of capitation rates and contracts); and the apparent shift in the balance of regulatory authority for Medicaid managed care from the states to the federal government. Of particular concern is a requirement for states to provide a minimum 14-day period of FFS coverage before enrolling beneficiaries into managed care arrangements and the proposed capitation rate review process. In this survey, states were asked to identify the key issues, concerns or opportunities related to the proposed rule. A number of states indicated that the proposed rule was still under review and other states touched on many of the issues raised in the NAMD comment letter. The most frequently cited concerns related to the capitation rate review process and the 14 day FFS enrollment requirement.
Table 5: Share of the Medicaid Population Covered Under Different Delivery Systems, as of July 2015
States
Type(s) of Managed Care In Place
Share of Medicaid Population in Different Managed Care Systems
MCO
PCCM
Other / FFS
Alabama
PCCM
—
64.3%
35.7%
Alaska
FFS
—
—
100.0%
Arizona
MCO
87.3%
—
12.7%
Arkansas
PCCM*
—
57.6%
42.4%*
California
MCO and PCCM*
77.0%
<1%
23.0%
Colorado
MCO and PCCM*
8.5%
64.9%
26.6%
Connecticut
FFS*
—
—
100.0%
DC
MCO
72.0%
—
28.0%
Delaware
MCO
90.0%
—
10.0%
Florida
MCO
79.0%
—
21.0%
Georgia
MCO
66.4%
—
33.6%
Hawaii
MCO
99.9%
—
0.1%
Idaho
PCCM*
—
NR
NR
Illinois
MCO and PCCM
52.7%
26.6%
20.7%
Indiana
MCO*
77.9%
0.6%*
21.5%
Iowa
MCO and PCCM
12.0%
37.0%
51.0%
Kansas
MCO
95.0%
—
5.0%
Kentucky
MCO
91.0%
—
9.0%
Louisiana
MCO
71.0%
—
29.0%
Maine
PCCM
—
NR
NR
Maryland
MCO
82.0%
—
18.0%
Massachusetts
MCO and PCCM
51.5%
20.6%
27.9%
Michigan
MCO
77.0%
—
23.0%
Minnesota
MCO
73.0%
—
27.0%
Mississippi
MCO*
67.0%
—
33.0%
Missouri
MCO
50.5%
—
49.5%
Montana
PCCM
—
73.7%
26.3%
Nebraska
MCO
74.0%
—
26.0%
Nevada
MCO and PCCM
68.0%
6.0%
26.0%
New Hampshire
MCO
89.8%
—
10.2%
New Jersey
MCO
93.0%
—
7.0%
New Mexico
MCO
87.5%
—
12.5%
New York
MCO
77.8%
—
22.2%
North Carolina
PCCM
—
NR
NR
North Dakota
MCO and PCCM
21.0%
41.0%
37.0%
Ohio
MCO
78.3%
—
21.7%
Oklahoma
PCCM
—
69.9%
30.1%
Oregon
MCO*
93.0%
—
7.0%
Pennsylvania
MCO
70.0%
—
30.0%
Rhode Island
MCO and PCCM
87.7%
1.6%
10.7%
South Carolina
MCO
75.0%
—
25.0%
South Dakota
PCCM
—
86.0%
14.0%
Tennessee
MCO
100.0%
—
—
Texas
MCO
88.0%
—
12.0%
Utah
MCO*
62.8%
—
37.2%
Vermont
PCCM
—
NR
NR
Virginia
MCO
66.0%
—
34.0%
Washington
MCO and PCCM
79.0%
1.0%
20.0%
West Virginia
MCO and PCCM
65.0%
2.0%
33.0%
Wisconsin
MCO
67.0%
—
33.0%
Wyoming
FFS*
—
—
100.0%
NOTES: Share of Medicaid Population that is covered by different managed care systems. MCO refers to risk-based managed care; PCCM refers to Primary Care Case Management. Other/FFS refers to Medicaid beneficiaries that are not in MCOs or PCCM programs. *AR – included in “Other/FFS” include those receiving premium assistance through the Private Option (Medicaid Expansion). *CA – PCCM program operates in LA county for those with HIV. *CO – PCCM enrollees are part of the state’s Accountable Care Collaboratives (ACO). *CT – terminated its MCO contracts in 2012 and now operates its program on a fee-for-service basis using four administrative services only entities. *ID – The Medicaid-Medicare Coordinated Plan (MMCP) has been recategorized by CMS as an MCO but is not counted here as such since it is secondary to Medicare. *IN – state ended its PCCM program as of July 1, 2015. *MS – risk-based managed care program does not cover inpatient hospital services. *OR – MCO enrollees include those enrolled in the state’s Coordinated Care Organizations. *UT – MCO enrollees include those enrolled in the state’s Accountable Care Organizations. *WY – the state does not operate a traditional PCCM or MCO program, but does use PCCM authority to make PCMH payments.
SOURCE: Kaiser Commission on Medicaid and the Uninsured Survey of Medicaid Officials in 50 states and DC conducted by Health Management Associates, October 2015.
Table 6: Medicaid Managed Care Expansions to New Groups in all 50 States and DC, FY 2015 and 2016
States
Geographic Expansions
Add New Groups
New Mandatory Enrollment
Any Managed Care Expansions
2015
2016
2015
2016
2015
2016
2015
2016
Either Year
Alabama
Alaska
Arizona
Arkansas
California
Colorado
X
X
X
Connecticut
Delaware
DC
Florida
X
X
X
Georgia
Hawaii
Idaho
Illinois
X
X
X
X
X
X
X
X
X
Indiana
X
X
X
Iowa
X
X
X
X
X
Kansas
Kentucky
Louisiana
X
X
X
X
X
Maine
Maryland
Massachusetts
Michigan
Minnesota
Mississippi
X
X
X
X
X
Missouri
Montana
Nebraska
X
X
X
Nevada
New Hampshire
X
X
X
New Jersey
X
X
X
New Mexico
X
X
X
New York
X
X
X
X
X
X
X
X
North Carolina
North Dakota
Ohio
Oklahoma
Oregon
Pennsylvania
X
X
X
Rhode Island
X
X
X
X
South Carolina
South Dakota
Tennessee
Texas
X
X
X
X
Utah
X
X
X
X
Vermont
Virginia
X
X
X
X
X
Washington
X
X
X
X
West Virginia
X
X
X
Wisconsin
X
X
X
X
X
Wyoming
Totals
5
4
9
8
4
9
13
13
20
NOTES: States were asked if they expanded managed care (comprehensive risk-based managed care) to new regions, new populations, or increased the use of mandatory enrollment.
SOURCE: Kaiser Commission on Medicaid and the Uninsured Survey of Medicaid Officials in 50 states and DC conducted by Health Management Associates, October 2015.
Table 7: Coverage of Select Benefits Under Medicaid Managed Care Contracts, as of July 2015
State
Coverage of Select Benefits under MCO contracts
Pharmacy
Dental
Behavioral Health
Children
Adults
Outpatient Mental Health
Inpatient Mental Health
Substance Abuse
Alabama
—
—
—
—
—
—
Alaska
—
—
—
—
—
—
Arizona
carved-in
carved-in
carved-in
varies (region)
varies (region)
varies (region)
Arkansas
—
—
—
—
—
—
California
carved-in
carved-out
carved-out
varies (services)
carved-out
carved-out
Colorado
carved-in
carved-in
carved-in
carved-out
carved-out
carved-out
Connecticut
—
—
—
—
—
—
DC
carved-in
carved-in
carved-in
varies (services)
varies (services)
varies (services)
Delaware
carved-in
carved-out
not covered
varies (services)
varies (services)
varies (services)
Florida
carved-in
carved-in
carved-in
carved-in
carved-in
carved-in
Georgia
carved-in
carved-in
not covered
carved-in
carved-in
carved-in
Hawaii
carved-in
carved-out
not covered
varies (services)
varies (services)
varies (services)
Idaho
—
—
—
—
—
—
Illinois
carved-in
carved-in
carved-in
carved-in
carved-in
carved-in
Indiana
varies
varies
varies
carved-out
varies (services)
varies (services)
Iowa
carved-out
carved-out
carved-out
carved-out
carved-out
carved-out
Kansas
carved-in
carved-in
carved-out
carved-in
carved-in
carved-in
Kentucky
carved-in
carved-in
carved-in
carved-in
carved-in
carved-in
Louisiana
carved-in
carved-out
carved-out
carved-out
carved-out
carved-out
Maine
—
—
—
—
—
—
Maryland
carved-in
carved-out
carved-out
carved-out
carved-out
carved-out
Massachusetts
carved-in
carved-out
varies
carved-in
carved-in
carved-in
Michigan
carved-in
carved-out
varies
varies (services)
varies (services)
carved-out
Minnesota
carved-in
carved-in
carved-in
carved-in
carved-in
carved-in
Mississippi
carved-in
carved-in
carved-in
carved-in
carved-out
carved-in
Missouri
carved-out
carved-in
carved-in
varies (services)
carved-out
varies (services)
Montana
—
—
—
—
—
—
Nebraska
carved-out
carved-out
carved-out
carved-out
carved-out
carved-out
Nevada
carved-in
carved-in
not covered
carved-in
carved-in
carved-in
New Hampshire
carved-in
carved-out
not covered
carved-in
carved-in
carved-in
New Jersey
carved-in
carved-in
carved-in
varies (program, population)
varies (program, population)
varies (program, population)
New Mexico
carved-in
carved-in
carved-in
carved-in
carved-in
carved-in
New York
carved-in
carved-in
carved-in
varies (population, services)
varies (population, services)
varies (services)
North Carolina
—
—
—
—
—
—
North Dakota
carved-in
excluded
not covered
carved-in
carved-in
carved-in
Ohio
carved-in
carved-in
carved-in
varies (population)
carved-in
varies (population)
Oklahoma
—
—
—
—
—
—
Oregon
carved-in
carved-in
carved-in
carved-in
carved-out
carved-in
Pennsylvania
carved-in
carved-in
carved-in
carved-out
carved-out
carved-out
Rhode Island
carved-in
carved-out
carved-out
varies (services)
varies (services)
varies (services)
South Carolina
carved-in
carved-out
carved-out
varies (services)
varies (services)
varies (services)
South Dakota
—
—
—
—
—
—
Tennessee
carved-out
carved-in
not covered
carved-in
carved-in
carved-in
Texas
carved-in
carved-in
not covered
carved-in
carved-in
carved-in
Utah
carved-in
carved-out
carved-out
varies (services)
varies (services)
varies (services)
Vermont
—
—
—
—
—
—
Virginia
carved-in
carved-out
not covered
varies (services)
varies (services)
varies (services)
Washington
carved-in
carved-out
carved-out
carved-out
carved-out
carved-out
West Virginia
carved-in
carved-in
not covered
carved-in
carved-in
carved-in
Wisconsin
varies
varies
varies
varies (services)
varies (services)
varies (services)
Wyoming
—
—
—
—
—
—
Carved-in
33
21
15
16
15
16
Varies
2
2
4
15
13
14
Carved-out
4
15
10
8
11
9
NOTES: *– indicates there were no MCOs operating in that state’s Medicaid program in July 2015. Data limited to populations included in MCO contracts (e.g., ND does not cover children in their managed care contracts, so they were excluded from the dental (children) category and 10 states that operate MCOs do not cover dental services for adults, these states were excluded from dental (adults)). Carved-in refers to states that carve-in virtually all services (exceptions might relate to small carve-outs for select drugs for example). Varies refers to instances where services are carved in for some populations covered under MCOs but not for other MCO populations or some services are carved-in while others are not (e.g. more intensive mental health or behavioral health services are carved-out.) Carved-out means that the service is largely carved out of managed care and covered by either FFS or PHPs.
SOURCE: Kaiser Commission on Medicaid and the Uninsured Survey of Medicaid Officials in 50 states and DC conducted by Health Management Associates, October 2015.
TABLE 8: MEDICAID MANAGED CARE QUALITY INITIATIES IN ALL 50 STATES AND DC, FY 2014 – 2016
States
Pay for Performance
Managed Care Payment Withhold
Public Reporting of Quality Metrics
Performance Bonus or Penalties
Other Quality Initiatives
Any Quality Initiatives
In Place
New/ Expanded
In Place
New/ Expanded
In Place
New/ Expanded
In Place
New/ Expanded
In Place
New/ Expanded
In Place
New/ Expanded
2014
2015
2016
2014
2015
2016
2014
2015
2016
2014
2015
2016
2014
2015
2016
2014
2015
2016
Alabama
Alaska
Arizona
X
X
X
X
X
X
X
X
X
X
Arkansas
California
X
X
X
X
X
X
X
X
X
Colorado
X
X
X
X
Connecticut
DC
X
X
X
X
X
X
Delaware
X
X
X
Florida
X
X
X
X
X
X
X
X
X
Georgia
X
X
X
X
X
X
Hawaii
X
X
X
X
Idaho
Illinois
X
X
X
X
X
X
X
X
X
X
Indiana
X
X
X
X
Iowa
X
X
X
Kansas
X
X
X
X
Kentucky
X
X
X
X
Louisiana
X
X
X
X
X
X
X
X
Maine
Maryland
X
X
X
Massachusetts
X
X
X
X
X
X
X
X
Michigan
X
X
X
X
X
X
X
X
Minnesota
X
X
X
X
X
X
Mississippi
X
X
X
X
Missouri
X
X
X
X
X
X
X
X
X
X
X
X
Montana
Nebraska
Nevada
X
X
X
X
X
X
New Hampshire
X
X
X
X
New Jersey
X
X
X
X
X
X
X
X
X
New Mexico
X
X
X
X
X
New York
X
X
X
X
North Carolina
North Dakota
Ohio
X
X
X
X
X
X
X
X
X
X
X
Oklahoma
Oregon
X
X
X
X
X
Pennsylvania
X
X
X
X
X
X
X
X
X
X
X
X
Rhode Island
X
X
X
South Carolina
X
X
X
X
X
South Dakota
Tennessee
X
X
X
Texas
X
X
X
X
X
X
X
Utah
X
X
Vermont
Virginia
X
X
X
X
X
X
X
X
X
X
X
X
Washington
X
X
X
West Virginia
X
X
X
X
X
X
X
Wisconsin
X
X
X
X
X
X
X
X
X
Wyoming
Totals
19
8
6
18
11
10
23
10
5
19
9
9
4
4
4
33
21
19
NOTES: States with MCO contracts were asked to report if select quality initiatives were included in contracts in FY 2014, new or expanded in FY 2015 or in FY 2016. The table above does not reflect all quality initiatives states have included as part of MCO contracts.
SOURCE: Kaiser Commission on Medicaid and the Uninsured Survey of Medicaid Officials in 50 states and DC conducted by Health Management Associates, October 2015.
Table 9: Minimum Medical Loss Ratio Policies for Medicaid MCOs in all 50 States and DC, as of July 2015
Minimum Medical Loss Ratio (MLR)
States
Require minimum MLR
% if required
Alabama
—
Alaska
—
Arizona
Yes — always
85%
Arkansas
—
California
Yes — sometimes*
85%* (Expansion)
Colorado
Yes — always
85%
Connecticut
—
Delaware
No
DC
Yes — always
85%
Florida
Yes — always
85%
Georgia
No
Hawaii
Yes — always
~90%
Idaho
—
Illinois
Yes — always
85% (aged, blind and disabled)88% (MAGI-related populations)
Indiana
Yes — always
85% (Hoosier Healthwise program)87% (HIP 2.0 and Hoosier Care Connect)
Iowa
Yes — always
85%
Kansas
No
Kentucky
Yes — always
85%
Louisiana
Yes — always
85%
Maine
—
Maryland
Yes — always
NR
Massachusetts
No*
Michigan
No
Minnesota
No
Mississippi
Yes — always
85%
Missouri
No
Montana
—
Nebraska
No
Nevada
No
New Hampshire
No
New Jersey
Yes — always
80%
New Mexico
Yes — always
85%
New York
No*
North Carolina
—
North Dakota
No
Ohio
Yes — always
85%
Oklahoma
—
Oregon
Yes — sometimes
80% (Expansion)
Pennsylvania
No*
Rhode Island
No
South Carolina
No
South Dakota
—
Tennessee
No
Texas
No*
Utah
No*
Vermont
—
Virginia
No*
Washington
Yes — always
85-87%*
West Virginia
Yes — always
85%
Wisconsin
No
Wyoming
—
Yes — always
17
Yes — sometimes
2
No
20
N/A – No MCOs
12
NOTES: MLR refers to the proportion of total per member per month capitation payments that is spent on clinical services and for quality improvement. “–” indicates states that do not have Medicaid MCOs. NR – not reported. CA (outside of their expansion population) and UT reported not requiring a minimum MLR but using a target MLR as part of their rate setting process. MA, NY, PA, VA reported no minimum MLR but do have administrative and/or profit caps. TX has experience rebates on plans above a certain profit level. VA – FY16 contract also requires MCOs to report MLRs to the state, but there is no minimum MLR. WA indicated that the minimum MLR varied by population.
SOURCE: Kaiser Commission on Medicaid and the Uninsured Survey of Medicaid Officials in 50 states and DC conducted by Health Management Associates, October 2015.
Table 10: Auto-Enrollment Policies for Medicaid MCOs in all 50 States and DC, as of July 2015
Auto-Enrollment Practices
Select Factors Used in State Auto-Enrollment Algorithms
States
Auto-Enrollment Process
Share of Beneficiaries Auto-Enrolled
Plan Capacity
Plan Cost
Balancing Enrollment
Encouraging New Plan Entrants
Plan Quality Rating
Alabama
Alaska
Arizona
Yes
17% (Acute Care)*
X
Arkansas
California
Yes
35-40%
X
X
X
X
Colorado
Yes
94%*
Connecticut
Delaware
Yes
45%
X
DC
Yes
20%
X
X
Florida
Yes
52% – Acute Care (MMA)55% – Long-term Care
Georgia
Yes
NR
X
X
Hawaii
Yes
100%*
X
X
X
Idaho
Illinois
Yes
53%
X
X
Indiana
Yes
68%
X
Iowa
Yes
80%
Kansas
Yes
65%
X
Kentucky
Yes
54%
X
X
Louisiana
Yes
50%
X
X
Maine
Maryland
Yes
32%
X
X
Massachusetts
Yes
30%
X
X
Michigan
Yes
24%
X
X
X
Minnesota
Yes
25%
X
Mississippi
Yes
80%
Missouri
Yes
13%
X
X
Montana
Nebraska
Yes
52%
X
Nevada
Yes
30%
X
New Hampshire
Yes
30%
New Jersey
Yes
15%
New Mexico
Yes
22%
X
New York
Yes
4% (statewide)4% (NYC)
X
X
X
North Carolina
North Dakota
No
Ohio
Yes
39% (CFC & ABD)56% (MyCare Ohio)
Oklahoma
Oregon
Yes
5%
X
X
Pennsylvania
Yes
40%
X
Rhode Island
Yes
20%
South Carolina
Yes
60%
X
X
South Dakota
Tennessee
Yes
100%*
X
Texas
Yes
30%
X
X
Utah
Yes
20%
X
Vermont
Virginia
Yes
80%
X
Washington
Yes
50%
X
West Virginia
Yes
50%
X
Wisconsin
Yes
60%*
X
X
Wyoming
Total
38
15
2
23
3
8
NOTES: States with Medicaid MCOs were asked if they have an auto-enrollment process and to estimate the share of their population that is typically auto-enrolled (average monthly basis for FY 2015). NR – not reported. AZ – rate reported refers to acute care only. CO – the state only has one MCO plan; it uses a passive enrollment process since there isn’t a choice of plans. HI and TN both auto-enroll beneficiaries and then offer beneficiaries a period to change plans. WI – Long-term care does not have an auto-enrollment process; auto enrollment used only for HMOs.
SOURCE: Kaiser Commission on Medicaid and the Uninsured Survey of Medicaid Officials in 50 states and DC conducted by Health Management Associates, October 2015.
Report: Emerging Delivery System And Payment Reforms
Key Section Findings
Thirty-seven (37) states in either FY 2015 or FY 2016, including 27 states in FY 2015 and 28 states in FY 2016, reported adopting or expanding one or more initiatives that seek to reward quality and encourage integrated care. Initiatives include patient-centered medical homes (PCMHs), Health Homes, Accountable Care Organizations (ACOs) as well as other initiatives to coordinate physical and behavioral health care and better manage the care of persons with multiple chronic conditions.
Nearly a quarter of states are implementing initiatives in FY 2015 or FY 2016 to coordinate care and financing for dually-eligible Medicare-Medicaid beneficiaries.
A more limited number of states are implementing episode of care and DSRIP initiatives.
Tables 11 and 12 contain more detailed information on emerging delivery system and payment reform initiatives in place in FY 2014, implemented in FY 2015 or planned for FY 2016. These tables are also available in a downloadable PDF.
Interest in delivery system and payment reforms that hold the promise of improving health outcomes and constraining costs remains high among state Medicaid programs across the country. Twenty-seven (27) states in FY 2015 and 28 states in FY 2016 reported adopting or expanding one or more initiatives that seek to reward quality and encourage integrated care. Key initiatives include patient-centered medical homes (PCMHs), Health Homes, and Accountable Care Organizations (ACOs). States are also implementing initiatives to coordinate care and financing for dual eligible beneficiaries. Episode of care and DSRIP initiatives are emerging delivery system reforms. This year’s survey asked states to identify which delivery system and payment reform models were in place in FY 2014, and whether they had adopted or were enhancing such models in FY 2015 or FY 2016. (Figure 8)
Figure 8: States Delivery System Reform Activity, FYs 2014-2016
Patient-Centered Medicaid Homes (PCMHs)
Patient-centered medical home initiatives operated in half (26) of Medicaid programs in FY 2014. Under a PCMH model, a physician-led, multi-disciplinary care team holistically manages the patient’s ongoing care, including recommended preventive services, care for chronic conditions and access to social services and supports. Generally, providers or provider organizations that operate as a PCMH seek recognition from organizations like the National Committee for Quality Assurance (NCQA).23 PCMHs are often paid (by state Medicaid agencies directly or through MCO contracts) a PMPM fee in addition to regular FFS payments for their Medicaid patients.24
In this year’s survey, nine states reported having adopted or expanded PCMHs in FY 2015 and six states indicated plans to do so in FY 2016. Several of these states reported significant expansions. For example, Connecticut has made significant investments in recent years to help primary care practices obtain NCQA PCMH recognition. Over one-third of Connecticut’s Medicaid beneficiaries are served by PCMHs and the state is considering expanding the model beyond primary care. Wyoming, a state without MCO or PCCM programs, implemented PCMHs in FY 2015; the state is expanding the number of large practices participating. Idaho also reported expanding the number of practices participating in the state’s PCMH program, with the goal of covering 80 percent of the state’s population over the next four years. Other states with well-established managed care programs reported harmonizing PCMH requirements across their MCOs (Tennessee) and requiring MCOs to establish pilot medical homes for behavioral health, targeting adults with serious mental illness (Virginia).
In contrast, Massachusetts reported that its PCMH demonstration ended in March 2014, but was followed by the launch of the state’s three-year Primary Care Payment Reform Demonstration covering nearly 90,000 lives. Also, Pennsylvania reported that one of its MCOs participated in the CMMI Multi-Payer Advanced Primary Care Practice demonstration (that included Medicaid) that ended in 2014, but is considering expanding PCMH payments under future managed care contracts.
ACA Health Homes
Nearly one-third of states (16) had at least one Health Home initiative in place in FY 2014. This option, created under Section 2703 of the ACA, builds on the PCMH concept. It requires states to target beneficiaries who have at least two chronic conditions (or one and risk of a second, or a serious and persistent mental health condition), and provide a person-centered system of care that facilitates access to and coordination of the full array of primary and acute physical health services, behavioral health care, and long-term services and supports. This includes services such as comprehensive care management, referrals to community and social support services and the use of Health Information Technology (HIT) to link services, among others. States receive a 90 percent federal match rate for qualified Health Home service expenditures for eight quarters under each Health Home state plan amendment; states can (and have) created more than one Health Home program to target different populations.
In this survey, eight states reported having adopted or expanded Health Homes in FY 2015 and 13 states reported plans to do so in FY 2016. Nearly all states noted that they were focusing their Health Home programs on populations with behavioral health conditions. States are also incorporating Health Homes into larger reform efforts related to integrating physical and behavioral health. For example, Tennessee is planning to implement Health Homes statewide for individuals with severe and persistent mental illness in 2016; this is part of a larger effort to develop a multi-payer PCMH program that the state plans to expand statewide by 2018.
Two states reported that they ended their Health Homes during this period. Oregon ended its Health Home initiative on September 30, 2013, when the enhanced federal payments ended, but the state continues to expand the use of PCMHs. Washington’s Health Home program, which provided additional coordination and other Health Home services for those dually-eligible for Medicare and Medicaid as well as other Medicaid beneficiaries with at least one chronic condition and at risk of developing another, is ending December 31, 2015. The state is working with beneficiaries to transition them to other care management services.
Accountable Care Organizations (ACOs)
States continue to experiment with accountable care organizations as the concept evolves. Six states reported having ACO models in place for at least some of their Medicaid beneficiaries in FY 2014. While there is currently no uniform, commonly accepted federal definition of an ACO, an ACO generally refers to a group of health care providers or, in some cases, a regional entity that contracts with providers and/or health plans, that agrees to share responsibility for the health care delivery and outcomes for a defined population.25 An ACO that meets quality performance standards that have been set by the payer and achieves savings relative to a benchmark can share in the savings. The organizational structure of ACOs varies, but ACOs generally include primary and specialty care physicians and at least one hospital. Virtually all states with ACO initiatives built on existing care delivery programs (e.g., PCCM, medical homes, MCOs) that already involved some degree of coordination among providers and likely had key infrastructure to facilitate coordination among ACO providers (e.g., electronic medical records). States use different terminology in referring to their Medicaid ACO initiatives, such as Coordinated Care Organizations (CCOs) in Oregon and Regional Care Collaborative Organizations (RCCOs) in Colorado.26
In this survey, three states reported adopting or expanding ACOs in FY 2015 and six states reported such activity in FY 2016. This includes states like Maine, Massachusetts, and New Jersey that have implemented or are planning to implement new ACO models. Utah reported plans to expand their ACO model to new counties. Other states reported ACO activity spurred by MCO contract requirements (Iowa, New Mexico and Minnesota) or as part of larger Section 1115 waiver proposals (California).
New Jersey ACO Demonstration
In July 2015, New Jersey kicked off the Medicaid ACO Demonstration Project, which focuses on improving health outcomes, quality and access to care through regional collaboration, and shared accountability while reducing costs. The Medicaid ACO Demonstration Project provides the New Jersey Medicaid program an opportunity to explore innovative system re-design including: testing the ACO as an alternative to managed care; evaluating how care management and care coordination could be delivered to high-risk, high-cost utilizers; stretching the role of Medicaid beyond medical services to integrate social services; and testing payment reform models including pay for performance metrics and incentives.
Care Coordination and Integration of Care for Dual Eligible Beneficiaries
Coordinating care for those dually eligible for Medicare and Medicaid (dual eligible beneficiaries) is a significant issue for Medicaid programs. These individuals tend to have significant health needs, a high prevalence of chronic conditions and substantial need for long-term services and supports. Prior to the ACA, coordination of care for individuals with dual enrollment in Medicaid and Medicare had been difficult to pursue for states in part because of misalignment between Medicare and Medicaid laws. In addition, when states did develop approaches to better coordinate care, any resulting savings from improvements in acute care (such as reduced inpatient admissions, readmissions and emergency room visits) accrued to Medicare and were not shared with state Medicaid programs. Under Section 2602 of the ACA, CMS established the Medicare-Medicaid Coordination Office (MMCO) and initiated Financial Alignment Demonstrations (FADs) with interested states seeking to coordinate and improve care and control costs for those dually eligible for Medicare and Medicaid.
In this survey, 13 states indicated that initiatives to coordinate care for dual eligible beneficiaries were in place in FY 2014, including seven with CMS FADs and seven with initiatives outside the CMS FAD that centered on enrolling this population in comprehensive MCOs or managed long-term care plans (one state had both a FAD and a non-FAD initiative). Ten states reported implementing or expanding an initiative to coordinate care for dual eligible beneficiaries in FY 2015, including six states with FADs, two of which (California and Texas) implemented or expanded other initiatives such as MLTSS outside of the FAD initiative. For FY 2016, five states are planning to implement or expand an initiative including one state planning a FAD. Initiatives outside of the FADs included alignment of Medicare Advantage Special Needs Plans for dual eligible beneficiaries (D-SNPs) with Medicaid MCOs and enrollment of dual eligible beneficiaries in comprehensive Medicaid MCOs (for acute care services) or managed long-term care.
Selected Dual Eligible Care Coordination Initiatives (Outside of Financial Alignment Demonstrations)
Arizona is working to increase alignment and improve service delivery for dual eligible beneficiaries by contractually requiring its health plans to also serve as Medicare Dual Special Needs Plans (D-SNPs) and promoting enrollment of dual eligible beneficiaries into the same health plan for both Medicaid and Medicare to the greatest extent possible. Enrolling in specialized duals-only Medicare plans allows individuals to receive all of their health care, including the payment for prescriptions and benefits, from a single, integrated source.
Florida reported contracting with a specialty Medicaid managed care plan beginning in FY 2015 that caters to dual eligible beneficiaries with chronic conditions.
Episode-of-Care Initiatives
Unlike fee-for-service (FFS) reimbursement where providers are paid separately for each service, or capitation where a health plan receives a per member per month (PMPM) payment intended to cover the costs for all covered services, an episode-of-care payment is linked to the care that a patient receives for a defined condition or health event (e.g., pregnancy and delivery, heart attack, or knee replacement). Episode-based payments usually involve payment for multiple services and providers and therefore create a financial incentive for physicians, hospitals and other providers to work together to improve patient care and manage costs. In this survey, two states (Arkansas and Tennessee) noted that an episode-of-care initiative was in place in FY 2014. Both states indicated that they continued to expand these initiatives in FY 2015 and FY 2016. New Mexico reported that a small pilot is being operated by some of the state’s MCOs in FY 2015 and Louisiana reported that one MCO planned a demonstration in partnership with a birthing hospital in FY 2016. Additionally, Ohio is currently in an episode-of-care reporting year; gain-sharing payments will begin in calendar year 2017.
Hospital Delivery System Reform Incentive Payment (DSRIP) Program
Delivery System Reform Incentive Payment (DSRIP) programs are another piece of the dynamic and evolving Medicaid delivery system reform landscape. DSRIP initiatives, which are part of broader Section 1115 demonstration waiver programs, provide states with significant funding to support hospitals and other providers in changing how they provide care to Medicaid beneficiaries. DSRIP waivers are not grant programs – they are performance-based incentive programs. Originally, DSRIP initiatives were more narrowly focused on funding for safety-net hospitals and often grew out of negotiations between states and HHS over the appropriate way to finance hospital care. Now, however, they are used to promote far more sweeping payment and delivery system reforms.
The first DSRIP initiatives were approved and implemented in California and Texas in 2010 and 2011, followed by New Jersey, Kansas and Massachusetts in 2012 and 2013. In this year’s survey, Massachusetts reported expanding its DSRIP program and New Mexico and New York reported implementing DSRIP programs in FY 2015. For FY 2016, California and New Mexico reported DSRIP enhancements while New Hampshire and Washington reported plans to seek approval for new DSRIP initiatives.
Other Initiatives
In addition to the initiatives discussed already, states reported other delivery system and payment reform initiatives. For example, some states reported including value-based purchasing requirements in their managed care contracts (Arizona, Iowa, Michigan, and Texas). Pennsylvania reported plans to include a “health-home like” program in its 2016 MCO contracts. Other states reported expanding telehealth services and use of community health workers (New Mexico), creating a coordinated point of entry for substance abuse disorder treatment services (New Jersey) and offering subsidies to enable ambulatory practices to access health information exchange services and achieve Meaningful Use (North Carolina).
All-Payer Claims Database
All-payer claims database (APCD) systems are large-scale databases that systematically collect medical claims, pharmacy claims, dental claims (typically, but not always), and eligibility and provider files from both private and public payers. They can be a valuable tool for identifying areas to focus reform efforts and for other purposes. Ten states (Colorado, Massachusetts, Maine, Minnesota, Montana, New Hampshire, Oregon, Rhode Island, Tennessee and Virginia) reported having APCDs in place while two states (California and Washington) planned to implement APCDs in FY 2016.
Table 11: Delivery System and Payment Reform Initiatives in Place in all 50 States and DC in FY 2014
States
Patient-Centered Medical Homes(PCMH)
ACA Health Homes
Accountable Care Organizations (ACO)
Dual Eligible Initiatives
Episode of Care Payments
Delivery System Reform Incentive Payment Program (DSRIP)
Other Initiatives
Any of these Initiatives in Place in FY 2014
Alabama
X
X
X
Alaska
Arizona
X
X
X
Arkansas
X
X
X
California
X*
X
X
Colorado
X
X
X*
X
Connecticut
X
X
Delaware
DC
Florida
Georgia
Hawaii
X
X
Idaho
X
X
X
X
Illinois
X*
X
Indiana
Iowa
X
X
X
Kansas
X
X
X
Kentucky
Louisiana
Maine
X
X
X
Maryland
X
X
X
Massachusetts
X
X*
X
X
Michigan
X
X
X
Minnesota
X
X
X
X
Mississippi
Missouri
X
X
Montana
Nebraska
X
X
Nevada
New Hampshire
New Jersey
X
X
X
X
New Mexico
X
X
X
X
New York
X
X
X
North Carolina
X
X
North Dakota
Ohio
X
X*
X
Oklahoma
X
X
Oregon
X
X
X
X
X
Pennsylvania
X
X
Rhode Island
X
X
X
X
South Carolina
X
X
South Dakota
X
X
Tennessee
X
X
X
Texas
X
X
X
X
Utah
X
X
Vermont
X
X
X
X
Virginia
X
X*
X
Washington
X
X*
X
West Virginia
Wisconsin
X
X
X
Wyoming
Totals
26
16
6
13
2
6
3
36
NOTES: Dually Eligible Initiatives: X* = State is pursuing a Financial Alignment Demonstration. CA reported another dual initiative in place outside of the demonstration.
SOURCE: Kaiser Commission on Medicaid and the Uninsured Survey of Medicaid Officials in 50 states and DC conducted by Health Management Associates, October 2015.
Table 12: Delivery System and Payment Reform Actions Taken in all 50 States and DC, FY 2015 and 2016
States
Patient-Centered Medical Homes(PCMH)
ACA Health Homes
Accountable Care Organizations (ACO)
Dual Eligible Initiatives
Episode of Care Payments
Delivery System Reform Incentive Payment Program(DSRIP)
Other Initiatives
Any New or Expanded Initiative
2015
2016
2015
2016
2015
2016
2015
2016
2015
2016
2015
2016
2015
2016
2015
2016
Alabama
X
X
Alaska
Arizona
X
X
X
X
X
X
Arkansas
X
X
X
X
California
X
X
X*
X
X
X
Colorado
Connecticut
X
X
X
X
Delaware
X
X
X
X
DC
X
X
Florida
X
X
Georgia
Hawaii
Idaho
X
X
Illinois
X
X
Indiana
Iowa
X
X
X
X
X
X
Kansas
Kentucky
X
X
Louisiana
X
X
X
Maine
X
X
X
Maryland
Massachusetts
X
X
X
X
X
Michigan
X
X
X*
X
X
X
Minnesota
X
X
Mississippi
Missouri
X
X
X
X
Montana
X
X
X
X
Nebraska
Nevada
New Hampshire
X
X
New Jersey
X
X
X
X
X
X
X
X
New Mexico
X
X
X
X
X
X
X
X
X
X
New York
X
X
X*
X
X
X
North Carolina
X
X
North Dakota
Ohio
X*
X
Oklahoma
X
X
X
Oregon
X
X
X
X
Pennsylvania
X
X
Rhode Island
X*
X
South Carolina
X*
X
South Dakota
Tennessee
X
X
X
X
X
X
X
Texas
X*
X
Utah
X
X
Vermont
Virginia
X
X
X
X
Washington
X
X
West Virginia
X
X
X
X
Wisconsin
Wyoming
X
X
X
X
Totals
9
6
8
13
3
6
10
5
3
3
3
4
3
6
27
28
NOTES: Expansions of existing initiatives include rollouts of existing initiatives to new areas or groups and significant increases in enrollment or providers. Dually Eligible Intiatives: X* = State is pursuing a Financial Alignment Demonstration. CA and TX reported other FY 2015 initiatives outside of the demonstration.
SOURCE: Kaiser Commission on Medicaid and the Uninsured Survey of Medicaid Officials in 50 states and DC conducted by Health Management Associates, October 2015.
Report: Long-term Services And Supports Reforms
Key Section Findings
Nearly every state reported actions to expand the number of persons served in community settings in both years (46 states in both FY 2015 and in FY 2016), primarily through increases in HCBS waivers and SPAs.
Eighteen (18) states in FY 2015 and 23 states in FY 2016 reported implementing or expanding PACE programs.
The ACA created and expanded several LTSS-related options intended to promote LTSS rebalancing including the Community First Choice Option and the Section 1915(i) HCBS State Plan Option. Thirteen (13) states reported having at least one of these options in place in FY 2014; an additional six states reported implementing at least one of these options in FY 2015 and eight states reported plans to do so in FY 2016.
Additional information on LTSS expansions implemented in FY 2015 or planned for FY 2016 can be found in Tables 13 and 14. These tables are also available in a downloadable PDF.
Medicaid is the nation’s primary payer for long-term services and supports (LTSS) covering a continuum of services ranging from home and community-based services (HCBS) that allow persons to live independently in their own homes or in the community, to institutional care provided in nursing facilities and intermediate care facilities for individuals with intellectual disabilities (ICF-ID). Long-term services and supports represent at least one-third of Medicaid spending and are an important focus for state policymakers.27 This year’s survey shows that almost all states are employing a variety of tools and strategies to expand HCBS options including traditional Section 1915(c) HCBS waivers, PACE programs,28 and managed LTSS.
Figure 9: State Long-Term Care Actions to Serve More Individuals in Community Settings, FY 2015-2016
Nearly every state reported actions to expand the number of persons served in community settings in both years (46 states in FY 2015 and in FY 2016). The number of states taking such actions has increased since FY 2012 (26 states) and FY 2013 (22 states). While virtually every state reported using Section 1915(c) waivers or Section 1915(i) state plan authority to expand HCBS, a significant number of states (17 in FY 2015 and 19 in FY 2016) also reported that the incentives built into their managed care programs were expected to increase the availability of HCBS. Also, 18 states in FY 2015 and 23 states in FY 2016 reported implementing or expanding PACE programs. (Figure 9) A number of states (15 states in FY 2015 and 15 in FY 2016) reported closing or downsizing institutions that led to more community placements and several states (four states in FY 2015 and three states in FY 2016) reported implementing or tightening a Certificate of Need program or imposing a moratorium on construction of new institutional beds. States also reported increased take up of ACA options to expand community-based LTSS (discussed below).
Several states reported on a number of other rebalancing initiatives. California reported that its Department of Health Care Services will collaborate with its Department of Housing and Community Development to award rental subsidies to developers and Medi-Cal community-based organizations (CBOs) using grant awards received from the U.S. Department of Housing and Urban Development. The CBOs will use the subsidies to transition institutionalized or homeless Medi-Cal beneficiaries into private independent living settings partnered with home and community-based services.29 Connecticut reported that it was continuing to implement its Strategic Plan to Rebalance Long-Term Services and Supports including a second round of rebalancing grant awards, announced by Governor Malloy in May 2015, to help the state’s nursing home industry diversify services to meet the changing needs of older adults and other people with disabilities. Several states also noted the implementation of conflict-free case management and single points of entry30 and one state commented that it was in the process of developing and testing a uniform assessment tool that, in the future, should have a positive impact on rebalancing the LTSS system.
Three states (Iowa, Illinois and Tennessee) reported new HCBS restrictions or limitations in FY 2015 or FY 2016: Iowa reported that its HCBS waiver for persons with intellectual and developmental disabilities (IDD) had reached its federally approved enrollment cap causing the state to implement a waiting list in FY 2015; Illinois reported that it is planning to change its Level of Care criteria for nursing homes as part of a legislative mandate which will also reduce the number of persons eligible for Section 1915(c) waiver services; and in FY 2016, Tennessee will also begin limiting new enrollment into a Section 1915(i)-like group (offered under Section 1115 authority) to SSI eligible beneficiaries only. People already enrolled in the group under institutional income standards will be grandfathered.31
Long-Term Services and Supports Options in the ACA
The ACA created and expanded several LTSS-related options intended to promote LTSS rebalancing. This year’s survey asked about two LTSS-related options intended to promote LTSS rebalancing that were created or expanded by the ACA: the Community First Choice Option and the Section 1915(i) HCBS State Plan Option. Thirteen (13) states reported having at least one of these options in place in FY 2014; six states reported implementing at least one of these options in FY 2015 and eight reported plans to do so in FY 2016. (Figure 10) State utilization of each of these options is discussed below.
Figure 10: State Participation in ACA LTSS Options, FY 2015-2016
An additional program, the Balancing Incentive Program (BIP) was created under the ACA to provide enhanced Medicaid matching funds to certain states that meet requirements for expanding the share of LTSS spending for HCBS (and reducing the share of LTSS spending for institutional services). The enhanced funding ended in September 2015. For more information on the impact of this program, please see the following brief.32
Section 1915(i) HCBS State Plan Option
This option allows states to offer HCBS through a Medicaid state plan amendment (SPA) rather than through a Section 1915(c) waiver. As a result of changes made in the ACA, income eligibility for this option was extended up to 300 percent of the maximum SSI federal benefit rate and states were permitted to target benefits to specific populations and offer the same range of HCBS under Section 1915(i) as are available under Section 1915(c) waivers. Unlike Section 1915(c) waivers, however, states are not permitted to cap enrollment or maintain a waiting list and, if offered, the benefit must be available statewide. If enrollment exceeds the state’s projections, the state may tighten their Section 1915(i) needs-based eligibility criteria, subject to advance notice and grandfathering of existing beneficiaries. Twelve states reported having an HCBS state plan option in place in FY 2014. Four states (Connecticut, Delaware, DC and Indiana) reported implementing in FY 2015; Connecticut and Indiana already had 1915(i) SPAs in place but implemented additional ones in FY 2015. Five states (Maryland, Minnesota, Mississippi, New York and Texas) reported plans to implement in FY 2016.
States were also asked to describe the target populations for their Section 1915(i) SPAs. Adults with significant mental health needs were identified by the largest number of states (7) followed by persons with intellectual and developmental disabilities (5), children with significant mental health needs (4), the elderly (3) and persons with vision impairments or physical disabilities (1). For some states, the target population included more than one of these categories. Also, two states (Connecticut and Idaho) have two Section 1915(i) SPAs in place, while Indiana implemented a third Section 1915(i) SPA in FY 2015 for adults diagnosed with mental health conditions and have incomes below 300 percent of the supplemental security income benefit rate (SSI), including persons who lost Medicaid coverage when the state’s spend-down program was eliminated.33
Community First Choice (CFC) State Plan Option
States electing this State Plan option to provide Medicaid-funded home and community-based attendant services and supports receive an FMAP increase of six percentage points for CFC services. In this year’s survey, four states (California, Maryland, Montana and Oregon) reported having CFC in place in FY 2014. Two states reported implementing this option in FY 2015 (New York34 and Texas), and four states reported plans to implement in FY 2016 (Connecticut, Delaware, Minnesota and Washington).
Texas LTSS Transformation Initiatives
In the last two years, Texas has implemented a number of initiatives to transform delivery of long-term care services and supports. Through managed care, the state has expanded its managed LTSS program statewide, carved nursing facility services into its managed care contracts and shifted acute care health services for individuals in its Section 1915(c) ICF/IDD waivers into managed care. Texas has also nearly completed implementation of the structural changes required under the Balancing Incentive Program (e.g., statewide expansion of the Aging and Disability Resource Centers and the automated LTSS Screening and Referral System) and implemented the Community First Choice Option. These initiatives combined with implementation of the Department of Labor rule on minimum wage and overtime for direct care workers and the HCBS settings final rule amount to the state undergoing an unprecedented transformation in a short timeframe.
Texas is planning additional initiatives to further transform its delivery of long-term care services and supports. For example, the state is planning to implement the STAR Kids managed care program for children with disabilities, to do a pilot program for serving individuals with IDD in managed care, and eventually to carve into managed care long-term care services for those in the state’s IDD waiver. As part of the nursing facility carve-in initiative, Texas is also developing performance measures to monitor admissions and readmissions to nursing facilities with the goal of ensuring appropriate utilization of nursing facility services and reducing unnecessary institutionalizations.
HCBS Settings Rule
In January 2014, CMS issued a new HCBS regulation (the “HCBS Rule”) making a number of significant program changes including the addition of new requirements that define the qualities of settings that are eligible for Medicaid reimbursement under Section 1915(c) waivers, the Section 1915(i) HCBS State Plan Option and the Community First Choice Option.35 The HCBS Rule includes a transitional process for states to ensure that their waivers and state plans meet the HCBS settings requirements including a requirement for each state to submit a Statewide Transition Plan. In this year’s survey, states were asked to comment on significant issues, concerns or opportunities that have emerged to date related to the implementation of their HCBS Statewide Transition Plans.
States expressed concerns around the administrative cost and staffing challenges associated with implementation of the Statewide Transition Plan as well as evaluating and completing on-site provider assessments and validating provider self-assessments. States also highlighted challenges in terms of provider compliance and consumer impact concerns including loss of providers and services valued by consumers and the potential for service disruptions when consumers are transitioned to compliant settings. A few states commented on delays in CMS feedback on submitted plans while three states indicated that more CMS guidance would be helpful. A few states also expressed concerns about the challenges faced in rural areas and those associated with specific sub-populations (e.g. beneficiaries with behavioral issues that pose a risk to the public).
On the other hand, some states cited opportunities presented by the HCBS Rule for increasing consumer choice and autonomy, increasing HCBS quality, ensuring more person-centered and person-directed service planning and provision, and providing new opportunities to work across state agencies and divisions.
Table 13: Long-Term Care Expansions in all 50 States and DC, FY 2015 and 2016
HCBS Waiver or SPA Expansions
Building Balancing Incentives in MLTSS
PACE Expansions
Total States with HCBS Expansions
2015
2016
2015
2016
2015
2016
2015
2016
Alabama
X
X
X
X
Alaska
Arizona
Arkansas
X
X
California
X
X
X
X
X
X
X
X
Colorado
X
X
X
X
X
Connecticut
X
X
X
X
Delaware
X
X
X
X
X
X
X
DC
X
X
X
X
X
Florida
X
X
X
X
X
X
X
X
Georgia
X
X
Hawaii
X
X
X
X
Idaho
X
X
X
X
Illinois
X
X
X
X
X
X
Indiana
X
X
X
X
X
X
Iowa
X
X
X
X
X
Kansas
X
X
X
X
Kentucky
X
X
X
X
Louisiana
X
X
X
X
X
X
Maine
X
X
X
X
Maryland
X
X
Massachusetts
X
X
X
X
X
X
X
X
Michigan
X
X
X
X
X
X
X
X
Minnesota
X
X
X
X
X
X
Mississippi
X
X
X
X
Missouri
X
X
X
X
Montana
X
X
X
X
Nebraska
X
X
X
X
X
Nevada
X
X
X
X
New Hampshire
X
X
X
X
New Jersey
X
X
X
X
X
X
X
X
New Mexico
X
X
X
X
X
X
New York
X
X
X
X
X
X
X
X
North Carolina
X
X
North Dakota
X
X
X
Ohio
X
X
X
X
X
X
Oklahoma
X
X
X
X
X
X
Oregon
X
X
X
X
X
X
Pennsylvania
X
X
X
X
X
X
Rhode Island
X
X
X
X
X
X
X
X
South Carolina
X
X
X
X
X
X
X
South Dakota
X
X
X
X
Tennessee
X
X
X
X
X
X
Texas
X
X
X
X
X
X
X
X
Utah
X
X
X
X
Vermont
X
X
X
X
Virginia
X
X
X
X
X
X
X
X
Washington
X
X
X
X
X
X
West Virginia
X
X
Wisconsin
X
X
X
X
X
X
Wyoming
X
X
X
X
X
X
Totals
45
43
17
19
18
23
46
46
NOTES: “HCBS Expansion” includes both expansions of 1915(c) waivers as well as 1915(i) State Plan Options SPAs. In addition to the actions reported here, states also reported expanding the number served in the community through the ACA Community First Choice Option as well as closing/downsizing state institutions and implementing/tightening certificate of need programs.
SOURCE: Kaiser Commission on Medicaid and the Uninsured Survey of Medicaid Officials in 50 states and DC conducted by Health Management Associates, October 2015.
Table 14: State Adoption of ACA LTSS Options in all 50 States and DC, FY 2014 – 2016
1915(i) State Plan Option
Community First Choice
Any ACA LTC Option
In Place
New in:
In Place
New in:
In Place
New in:
2014
2015
2016
2014
2015
2016
2014
2015
2016
Alabama
Alaska
Arizona
Arkansas
California
X
X
X
Colorado
X
X
Connecticut
X
X
X
X
X
X
Delaware
X
X
X
X
DC
X
X
Florida
X
X
Georgia
Hawaii
Idaho
X
X
Illinois
Indiana
X
X
X
X
Iowa
X
X
Kansas
Kentucky
Louisiana
X
X
Maine
Maryland
X
X
X
X
Massachusetts
Michigan
Minnesota
X
X
X
Mississippi
X
X
Missouri
Montana
X
X
X
Nebraska
Nevada
X
X
New Hampshire
New Jersey
New Mexico
New York
X
X
X
X
North Carolina
North Dakota
Ohio
Oklahoma
Oregon
X
X
X
Pennsylvania
Rhode Island
South Carolina
South Dakota
Tennessee
Texas
X
X
X
X
Utah
Vermont
Virginia
Washington
X
X
West Virginia
Wisconsin
X
X
Wyoming
Totals
12
4
5
4
2
4
13
6
8
NOTES: States were asked if each of these options were in place in FY 2014, implemented in FY 2015, or state planned to implement in FY 2016. States can implement multiple HCBS State Plan options focusing different populations. New York reported implementing the Community First Choice option in FY 2015, but was awaiting final SPA approval at the time of the survey.
SOURCE: Kaiser Commission on Medicaid and the Uninsured Survey of Medicaid Officials in 50 states and DC conducted by Health Management Associates, October 2015.
Report: Provider Rates, Taxes And Benefits
Key Section Findings
State fiscal conditions directly affect Medicaid provider rates. During economic downturns and resulting state revenue shortfalls, states often turn to Medicaid provider rate cuts to control costs. Improving state finances in recent years allowed more states to restore or enhance rates. In both FY 2015 and FY 2016, more states implemented or planned rate increases (47 and 45 states) compared to rate restrictions (35 states and 38 states) in those years. States were also more likely to implement increases in rates for outpatient hospital, specialists and dentists, compared to restrictions.
A number of states are adopting reimbursement policies to reduce potentially preventable readmissions and early elective deliveries.
All states except Alaska rely on provider taxes and fees to provide a portion of the non-federal share of the costs of Medicaid. The most common provider taxes in place in FY 2015 were taxes on nursing facilities (44 states), followed by taxes on hospitals (39 states) and intermediate care facilities (37 states). In recent years, states made very few changes in the number of provider taxes. Several states increased provider tax rates in FY 2015 and FY 2016.
Seven of the expansion states (Arizona, California, Colorado, Indiana, Kentucky, Nevada and Ohio) reported plans to use increased provider taxes or fees to fund all or part of the costs of the ACA Medicaid expansion that will occur in calendar year 2017 and beyond when the federal funding percentage for expansion costs is reduced.
A majority of states reported enhancing or adding benefits in FY 2015 and FY 2016. The most common benefit enhancements or additions were for behavioral health and substance abuse services as well as home and community-based services. Other common benefit enhancements included dental services and telemedicine and tele-monitoring.
Since 2014, rising drug prices and increasing program costs have refocused state attention on pharmacy reimbursement and coverage policies. The majority of states identified high-cost and specialty drugs (e.g. hepatitis C antivirals among others) as a significant cost driver for state Medicaid programs as well as increased costs for generics among other factors. Over two-thirds of the states in FY 2015 and half in FY 2016 reported actions to refine and enhance their pharmacy programs in response to new and emerging specialty and high-cost drug therapies.
Tables 15 through 17 provide a complete listing of Medicaid provider rate changes and provider taxes and fees in place in FY 2015 and FY 2016; Tables 19 through 21 provide a complete listing of Medicaid benefit and pharmacy changes for FY 2015 and FY 2016. These tables are also available in a downloadable PDF.
Provider Rates
State fiscal conditions have a direct impact on Medicaid provider rates. During economic downturns, states often turn to provider rate cuts to control costs. Improving state finances in recent years have resulted in more states restoring or enhancing rates than restricting rates overall. In both FY 2015 and FY 2016, more states implemented or planned rate increases (47 and 45 states) compared to rate restrictions (35 states and 38 states) in those years. (Figure 11) Data for FY 2016 was not available for Illinois as budget deliberations were in process in September 2015.36 The number of states with rate increases exceeded the number of states with restrictions in FY 2015 and FY 2016 across all major categories of providers (physicians, MCOs and nursing homes) except for inpatient rates for hospitals.37
Figure 11: Provider Rate Changes Implemented in FY 2013 – FY 2015 and Adopted for FY 2016
For the purposes of this report, provider rate restrictions include cuts to fee-for-service rates for physicians, dentists, outpatient hospitals, and to capitation rates for managed care organizations, as well as cuts or freezes in rates for inpatient hospitals and nursing homes. States were asked to report aggregate changes for each major provider category. The ultimate impact of some rate changes may differ across states depending on the delivery system. For example, the effect of fee-for-service rate restrictions for hospitals, physicians, and nursing facilities rates may have less impact on providers in states that rely heavily on managed care than in states that have little or no managed care presence.
Only three states in FY 2015 and five states in FY 2016 had implemented or planned inpatient hospital rate reductions; the vast majority of hospital rate restrictions were freezes in rates. A few states noted that restrictions to inpatient hospital rates were a reflection of shifting some funding from inpatient to outpatient hospital rates. The number of states increasing nursing home rates dropped sharply in FY 2016. One state (Illinois38 ) cut nursing home rates in FY 2015 and four states indicated plans to cut nursing home rates in FY 2016. The other nursing home rate restrictions are rate freezes. (Figure 11)
Capitation payments for Medicaid Managed Care Organizations (MCOs) are generally bolstered by the federal requirement that states pay actuarially sound rates. In FY 2015 and FY 2016, the majority of the 39 states with Medicaid MCOs implemented or planned increases in MCO rates. Only five states reported MCO rate cuts in 2015, and only one state plans to cut MCO rates in FY 2016. To meet the federally required test of actuarial soundness, reductions to MCO rates may occur as a correction to previous rates that were set too high or to reflect reductions in fee-for-service rates or competitive price bids.
Primary Care Payments
The ACA included a provision to increase Medicaid payment rates for primary care services to Medicare rates from January 1, 2013 through December 31, 2014. The federal government funded 100 percent of the difference between Medicaid rates that were in effect as of July 1, 2009 and the full Medicare rates for these two years. States were asked about their plans to extend this provision for FY 2016 (at regular FMAP rates). The significance of this rate differential varies greatly across states; a 2012 survey of Medicaid physician fees showed that in a small number of states, Medicaid rates for physician services were already at or close to 100 percent of Medicare rates while other states paid sixty percent or less of Medicare rates.39
Ten states (Alabama, Colorado, DC, Hawaii, Iowa, Maine, Mississippi, Nebraska, Nevada and New Mexico) indicated that they continued the higher rates at the full level in FY 2015. Nine of these states have continued the full level of the ACA primary care rate enhancement for FY 2016.
In addition, three states (Alaska, Montana and North Dakota) reported already reimbursing providers at or above Medicare rates prior to the ACA increase; all three states reported plans for primary care rates to increase in FY 2016.
Six states (Connecticut, Delaware, Kentucky, Maryland, Michigan and South Carolina) indicated that they partially continued the rate increase in FY 2015. For example, one state provided a proportionate increase for all primary care physicians (half of the ACA rate increase), another provided a temporary continuation, and another state continued using a targeted approach limited to certain types of primary care providers.
Nine states are partially continuing the primary care rate enhancement for FY 2016, including the six that partially continued the rate increase in FY 2015. In addition, two states (Georgia and Utah) that did not continue the rate increase in FY 2015 later partially restored the increase for FY 2016; one state (Nevada) that had continued the increase in full in FY 2015 reported partially continuing the increase in FY 2016 (rates for primary care physicians still increased but not to the full Medicare level).
Among the states that did not continue the ACA primary care rate increase in FY 2015, seven states (Indiana, Missouri, New Jersey, New York, Ohio, South Dakota and Vermont) reported plans to increase primary care physician rates in FY 2016 from FY 2015 levels.
In addition to primary care providers, the survey also asked about rates for specialist physicians, dentists and for outpatient services. For each of these categories, states reported more rate increases than rate cuts, particularly in FY 2015 and FY 2016. (Figure 12)
Figure 12: Ambulatory Provider Rate Changes Implemented in FY 2013 – FY 2015 and Adopted for FY 2016
Potentially Preventable Readmissions
States were asked if they had or planned to implement an inpatient hospital reimbursement incentive/policy for potentially preventable readmissions. Fifteen (15) states indicated that they had such policies in place in FY 2014 and two more states implemented such policies in FY 2015. Six states indicated that they have plans to implement in FY 2016 and an additional four states plan to implement after FY 2016.
Early Elective Deliveries
States were asked about reimbursement policies designed to reduce the number of early elective deliveries. Twenty (20) states had a policy in place in FY 2015 and six additional states plan to adopt such a policy in FY 2016. Some of the states that do not have such a policy indicated that their managed care organizations can elect to have such a policy. The most common policy was reduced payment (paying for a Cesarean-Section at the rate of a vaginal delivery) for any Cesarean-Section before 39 weeks gestational age unless there was documentation of medical necessity. States are also implementing incentive programs that reward providers for reducing the rate of early elective deliveries.
Provider Taxes and Fees
States continue to rely on provider taxes and fees to provide a portion of the non-federal share of the costs of Medicaid. At the beginning of FY 2003, a total of 21 states had at least one provider tax in place. Over the next decade, a majority of states imposed new taxes or fees and increased existing tax rates and fees to raise revenue to support Medicaid. By FY 2013, all but one state (Alaska) had at least one provider tax or fee in place.40 In FY 2015, 32 states had three or more provider taxes in place. (Figure 13)
Figure 13: States with Provider Taxes or Fees in Place in FY 2015
The most common provider taxes in place in FY 2015 were taxes on nursing facilities (44 states), followed by taxes on hospitals (39 states) and intermediate care facilities (37 states). In recent years, states have made very few changes to the number of provider taxes. Minor changes for FY 2015 and FY 2016 include the following:
In FY 2015, two states eliminated provider taxes (a hospital tax in DC and a cosmetic surgery tax in New Jersey).
For FY 2016, three states and DC reported plans to add provider taxes. DC has a new hospital tax. Connecticut is adding a tax on ambulatory surgery centers. Michigan and Utah are adding taxes on ambulance providers.
Several states reported changes to tax rates in FY 2015 and FY 2016. Most notable were increases to rates for hospital taxes and fees (ten states in FY 2015 and six states in FY 2016) as well as increases to rates for nursing home taxes and fees (six states in FY 2015 and eight states in FY 2016). Some states also reported reducing tax rates, again mostly for hospitals (one state in FY 2015 and four states in FY 2016) and nursing home taxes and fees (two states in FY 2015 and one state in FY 2016).
States were asked whether in the future they planned to use increased provider taxes or fees to fund all or part of the costs of the ACA Medicaid expansion that will occur in calendar year 2017 and beyond when the 100 percent federal match rate for expansion costs starts to decline. Seven of the expansion states (Arizona, California, Colorado, Indiana, Kentucky, Nevada and Ohio) responded that they had such plans. Other expansion states are studying provider taxes and fees.
Table 15: Provider Rate Changes in all 50 States and DC, FY 2015
States
Inpatient Hospital
Outpatient Hospital
Specialists
Dentists
Managed Care Organizations
Nursing Facilities
Total
Rate Change
Increase
Restrict
Increase
Restrict
Increase
Restrict
Increase
Restrict
Increase
Restrict
Increase
Restrict
Increase
Restrict
Alabama
X
—
—
X
X
X
Alaska
X
X
X
—
—
X
X
Arizona
X
X
X
X
X
Arkansas
X
—
—
X
X
X
California
X
X
X
X
X
Colorado
X
X
X
X
X
X
Connecticut
X
X
—
—
X
X
DC
X
X
X
X
X
X
Delaware
X
X
X
X
X
X
X
X
Florida
X
X
X
X
X
X
Georgia
X
X
X
X
X
Hawaii
X
X
X
X
X
Idaho
X
X
X
—
—
X
X
X
Illinois
X
X
X
X
X
X
X
X
Indiana
X
X
X
X
X
Iowa
X
X
X
X
X
Kansas
X
X
X
X
X
Kentucky
X
X
X
Louisiana
X
X
X
X
X
X
Maine
X
—
—
X
X
X
Maryland
X
X
X
X
X
X
X
Massachusetts
X
X
X
X
X
Michigan
X
X
X
X
X
X
Minnesota
X
X
X
X
Mississippi
X
X
X
X
X
X
Missouri
X
X
X
X
X
Montana
X
X
X
X
—
—
X
X
X
Nebraska
X
X
X
X
X
X
Nevada
X
X
X
X
X
NewHampshire
X
X
X
X
X
New Jersey
X
X
X
X
X
New Mexico
X
X
X
X
X
New York
X
X
X
X
X
North Carolina
X
X
X
—
—
X
X
X
North Dakota
X
X
X
X
X
X
X
Ohio
X
X
X
X
X
Oklahoma
X
X
X
X
—
—
X
X
Oregon
X
X
X
X
Pennsylvania
X
X
X
X
X
Rhode Island
X
X
X
X
X
South Carolina
X
X
X
X
X
South Dakota
X
X
X
X
—
—
X
X
Tennessee
X
X
X
X
X
Texas
X
X
X
X
X
Utah
X
X
X
X
X
X
X
Vermont
X
X
X
X
—
—
X
X
Virginia
X
X
X
X
X
X
Washington
X
X
X
X
X
West Virginia
X
X
X
X
Wisconsin
X
X
X
X
X
Wyoming
X
—
—
X
X
Totals
19
32
20
2
15
5
9
4
27
5
37
14
47
35
NOTES: For the purposes of this report, provider rate restrictions include cuts to rates for physicians, dentists, outpatient hospitals, and managed..care organizations as well as both cuts or freezes in rates for inpatient hospitals and nursing facilities. Changes to primary care rates were asked..about separately for FY 2015 and are not included in this table. There are 12 states that did not have Medicaid MCOs in operation in FY 2015;..they are denoted as ‘–‘ in the MCO column.
SOURCE: Kaiser Commission on Medicaid and the Uninsured Survey of Medicaid Officials in 50 states and DC conducted by Health Management..Associates, October 2015.
Table 16: Provider Rate Changes in all 50 States and DC, FY 2016
States
Inpatient Hospital
Outpatient Hospital
Specialists
Dentists
Managed Care Organizations
Nursing Facilities
Total
Rate Change
Increase
Restrict
Increase
Restrict
Increase
Restrict
Increase
Restrict
Increase
Restrict
Increase
Restrict
Increase
Restrict
Alabama
X
—
—
X
X
X
Alaska
X
X
—
—
X
X
X
Arizona
X
X
X
X
X
Arkansas
X
—
—
X
X
X
California
X
X
X
X
X
X
Colorado
X
X
X
X
X
X
Connecticut
X
—
—
X
X
X
DC
X
X
X
X
X
X
Delaware
X
X
X
X
X
X
X
X
Florida
X
X
TBD
X
X
X
Georgia
X
X
X
X
X
Hawaii
X
X
X
X
X
Idaho
X
X
—
—
X
X
X
Illinois
TBD
TBD
TBD
TBD
TBD
TBD
TBD
Indiana
X
X
X
X
X
Iowa
X
X
X
X
X
Kansas
X
X
X
X
X
Kentucky
X
X
X
Louisiana
X
X
X
X
X
Maine
X
—
—
X
X
X
Maryland
X
X
X
X
X
X
X
X
Massachusetts
X
X
X
X
X
Michigan
X
X
X
X
X
Minnesota
X
X
X
X
X
X
X
Mississippi
X
X
X
X
X
X
Missouri
X
X
X
X
X
X
X
X
Montana
X
X
X
X
—
—
X
X
Nebraska
X
X
X
X
X
X
X
Nevada
X
X
X
X
X
New Hampshire
X
X
X
New Jersey
X
X
X
X
X
X
New Mexico
X
X
X
X
X
New York
X
X
X
X
X
X
X
North Carolina
X
—
—
X
X
North Dakota
X
X
X
X
X
X
X
Ohio
X
X
X
X
X
X
X
X
Oklahoma
X
—
—
X
X
Oregon
X
X
X
X
Pennsylvania
X
X
X
X
X
Rhode Island
X
X
X
X
X
X
South Carolina
X
X
X
X
X
South Dakota
X
X
X
X
—
—
X
X
Tennessee
X
X
X
Texas
X
X
X
X
X
X
Utah
X
X
X
X
X
X
X
Vermont
X
—
—
X
X
X
Virginia
X
X
X
X
X
X
Washington
X
X
X
X
X
West Virginia
X
X
X
X
Wisconsin
X
X
X
X
X
X
Wyoming
X
—
—
X
X
X
Totals
20
30
18
5
14
1
14
0
29
1
29
21
45
38
NOTES: For the purposes of this report, provider rate restrictions include cuts to rates for physicians, dentists, outpatient hospitals, and managed care organizations as well as both cuts or freezes in rates for inpatient hospitals and nursing facilities. Changes to primary care rates were asked about separately for FY 2016 and are not included in this table. There are 12 states that did not have Medicaid MCOs in operation in FY 2015; they are denoted as ‘–‘ in the MCO column.
TBD – At the time of the survey, some rates for a few states were still being determined; these are denoted as TBD.
SOURCE: Kaiser Commission on Medicaid and the Uninsured Survey of Medicaid Officials in 50 states and DC conducted by Health Management Associates, October 2015.
Table 17: Provider Taxes in Place in the 50 States and DC, FY 2015 and 2016
States
Hospitals
Intermediate Care Facilities
Nursing Facilities
Other
Any Provider Tax
2015
2016
2015
2016
2015
2016
2015
2016
2015
2016
Alabama
X
X
X
X
X
X
X
X
Alaska
Arizona
X
X
X
X
X
X
Arkansas
X
X
X
X
X
X
X
X
California
X
X
X
X
X
X
X
X
X
X
Colorado
X
X
X
X
X
X
X
X
Connecticut
X
X
X
X
X
X
X
X
X
Delaware
X
X
X
X
DC
X
X
X
X
X
X
X
X
X
Florida
X
X
X
X
X
X
X
X
Georgia
X
X
X
X
X
X
X
X
Hawaii
X
X
X
X
X
X
Idaho
X
X
X
X
X
X
X
X
Illinois
X
X
X
X
X
X
X
X
Indiana
X
X
X
X
X
X
X
X
Iowa
X
X
X
X
X
X
X
X
Kansas
X
X
X
X
X
X
Kentucky
X
X
X
X
X
X
X*
X*
X
X
Louisiana
X
X
X
X
X
X
X
X
Maine
X
X
X
X
X
X
X
X
X
X
Maryland
X
X
X
X
X
X
X
X
X
X
Massachusetts
X
X
X
X
X
X
Michigan
X
X
X
X
X
X
X
Minnesota
X
X
X
X
X
X
X
X
X
X
Mississippi
X
X
X
X
X
X
X
X
X
X
Missouri
X
X
X
X
X
X
X*
X*
X
X
Montana
X
X
X
X
X
X
X
X
Nebraska
X
X
X
X
X
X
Nevada
X
X
X
X
New Hampshire
X
X
X
X
X
X
New Jersey
X
X
X
X
X
X
X*
X*
X
X
New Mexico
X*
X*
X
X
New York
X
X
X
X
X
X
X*
X*
X
X
North Carolina
X
X
X
X
X
X
X
X
North Dakota
X
X
X
X
Ohio
X
X
X
X
X
X
X
X
Oklahoma
X
X
X
X
X
X
X
X
Oregon
X
X
X
X
X
X
Pennsylvania
X
X
X
X
X
X
X*
X*
X
X
Rhode Island
X
X
X
X
X
X
South Carolina
X
X
X
X
X
X
South Dakota
X
X
X
X
Tennessee
X
X
X
X
X
X
X
X
X
X
Texas
X
X
X
X
X
X
Utah
X
X
X
X
X
X
X
X
X
Vermont
X
X
X
X
X
X
X*
X*
X
X
Virginia
X
X
X
X
Washington
X
X
X
X
X
X
X
X
West Virginia
X
X
X
X
X
X
X*
X*
X
X
Wisconsin
X
X
X
X
X
X
X
X
X
X
Wyoming
X
X
X
X
Totals
39
40
37
37
44
44
19
22
50
50
NOTES: This table includes Medicaid provider taxes as reported by states. Some states also have premium or claims taxes that apply to managed care organizations and other insurers. Since this type of tax is not considered a provider tax by CMS, these taxes are not counted as provider taxes in this report. (*) has been used to denote states with multiple “other” provider taxes.
SOURCE: Kaiser Commission on Medicaid and the Uninsured Survey of Medicaid Officials in 50 states and DC conducted by Health Management Associates, October 2015.
Benefits Changes
In this year’s survey, the number of states reporting benefit cuts or restrictions – one in FY 2015 and five in FY 2016 – remains far below the number seen during the economic downturn. (Figure 14) A far larger number of states, 24 states in FY 2015 and 18 in FY 2016, reported enhancing or adding new benefits.
One of the most common benefit enhancements or additions reported was for behavioral health and substance abuse services. For example, Ohio is redesigning its behavioral health benefits to include coverage of additional services such as Assertive Community Treatment and Intensive Home Based Treatment. Other common benefit enhancements reported include home and community-based services including changes to 1915(c) waivers, new 1915(i) HCBS State Plan Option implementations and implementation of the Community First Choice State Plan Option. Also common were enhancements to dental services and telemedicine and tele-monitoring. (Table 18)
Table 18: Benefit Enhancements or Additions
Benefit
FY 2015
FY 2016
Behavioral Health
CT, DE, IN, MD, MO, NH, SC, VA, WY
DC, MD, NY, OH, SC, TX, VT, WY
HCBS
CA, CT, DC, DE, MA, ND, NJ, NY, TX, WI
CA, CT, DC, DE, GA, MS, WA
Dental Services
CO, IL, MA, SC, VA
MO, OR
Telemedicine / Tele-monitoring
MD, VT
NE, VT
For its Medicaid expansion population, Pennsylvania reported replacing its Healthy PA waiver benefits plan (that included a number of physical and behavioral health service limits) with its traditional Medicaid benefit plan resulting in the elimination of those limits in FY 2015. Also, California is planning a notable benefit expansion for pregnant women in FY 2016; the state is planning to provide the full Medicaid benefit package to pregnant women up to 138 percent FPL in place of the current, more limited pregnancy-related benefit package.
Benefit restrictions reflect the elimination of a covered benefit or the application of utilization controls for existing benefits. In FY 2015, Arkansas imposed limits to non-emergency transportation for non-medically frail adults. For FY 2016, four states reported narrowly targeted benefit eliminations (Connecticut, New York, Oklahoma and Vermont) and one state (West Virginia) reported plans to apply a number of service limitations in its home and community-based services waiver serving persons with Intellectual and Developmental Disabilities to enable the waiver to operate within its budget while also serving more people on the waiting list.
Autism Services
On July 7, 2014, CMS issued an Informational Bulletin41 describing approaches and Medicaid authorities available to cover Autism Spectrum Disorder (ASD) services. The bulletin also clarified state obligations under the Early and Periodic Screening, Diagnostic and Treatment (EPSDT) benefit to cover all medically necessary services for children, including ASD services. In this year’s survey, two states in FY 2015 and eight states in FY 2016 reported adding coverage for ASD services. These policy changes have not been counted as positive or negative as they were required changes.
Table 19: Benefit Changes in the 50 States and DC, FY 2015 and 2016
Benefit Changes
STATES
FY 2015
FY 2016
Enhancements/ Additions
Restrictions/ Eliminations
Enhancements/ Additions
Restrictions/ Eliminations
Alabama
Alaska
Arizona
X
X
Arkansas
X
California
X
X
Colorado
X
Connecticut
X
X
X
Delaware
X
X
DC
X
X
Florida
Georgia
X
Hawaii
Idaho
Illinois
X
Indiana
X
Iowa
Kansas
Kentucky
Louisiana
Maine
Maryland
X
X
Massachusetts
X
Michigan
Minnesota
X
Mississippi
X
X
Missouri
X
X
Montana
Nebraska
X
Nevada
New Hampshire
X
New Jersey
X
New Mexico
New York
X
X
X
North Carolina
North Dakota
X
Ohio
X
Oklahoma
X
Oregon
X
Pennsylvania
X
Rhode Island
South Carolina
X
X
South Dakota
Tennessee
Texas
X
X
Utah
Vermont
X
X
X
Virginia
X
Washington
X
West Virginia
X
Wisconsin
X
Wyoming
X
X
Totals
24
1
18
5
NOTES: States were asked to report benefit restrictions, eliminations, enhancements, and additions in FY 2015 and FY 2016. Excluded from these changes are the implementation of alternative benefit plans for the Medicaid expansion group.
SOURCE: Kaiser Commission on Medicaid and the Uninsured Survey of Medicaid Officials in 50 states and DC conducted by Health Management Associates, October 2015.
Table 20: Benefit Actions Taken in all 50 States and DC, FY 2015 and 2016*
Adults (+): Restoring coverage for orthotics. (August 1, 2015)
Arkansas
2015
Expansion Adults (-): Applied limits to non-emergency medical transportation benefits for non-medically frail expansion adults. (February 1, 2015)
2016
Aged & Disabled (nc): Combining the ElderChoices 1915(c) and the Adults with Physical Disabilities 1915(c) waivers into a new 1915(c) waiver which ensures all benefits of both waivers to both groups. (January 1, 2016)
California
2015
Children (nc): Added coverage for Behavioral Health Treatment for children with autism spectrum disorder to meet federal requirements. (September 2014)
Children (nc): Increased expenditure cap as part of Autism Waiver expansion. (July 1, 2015)
Connecticut
2015
Adults (+): Expanded coverage for licensed behavioral health clinician services provided by independent practitioners (licensed psychologists, licensed clinical social workers, licensed marital and family therapists, licensed alcohol and drug counselors, and licensed professional counselors). (July 1, 2014)
Aged & Disabled (+): Implemented new HCBS services under 1915(i) authority for Medicaid eligible elders who do not meet nursing home level of care.
2016
Adults (+): Added coverage of select over the counter drugs. (July 1, 2015)
Aged & Disabled (+): Implemented the Community First Choice Option. (July 2015)
Pregnant Women (+): Added coverage of low dose aspirin. (July 1, 2015)
Adults (-): Eliminated coverage of Part D copays for non-institutionalized dual eligible beneficiaries. (July 1, 2015)
Delaware
2015
Aged & Disabled (+): Added 1915(i) supported employment services for individuals with disabilities (Pathways Program). (January 1, 2015)
Aged & Disabled (+): Enhancing behavioral health and substance use disorder services through the PROMISE Program. (January 1, 2015)
2016
Aged & Disabled (+): Planning to implement the Community First Choice Option.
District of Columbia
2015
Children (+):Added coverage for school based health services when delivered in nonpublic school settings. (October 1, 2014)
Children (nc): Personal care aide removed from coverage as school-based service. (Oct 2014)
All (+): Expanding transplant services. (October 1, 2014)
Aged & Disabled (+): Added adult day health services under 1915(i) authority for persons aged 55+ with a chronic medical condition.
2016
Children (+): Adding reimbursement for adolescent substance abuse treatment. (Jan. 1, 2016)
LTSS Adults (+): Amending the IDD and Elderly and Physically Disabled 1915(c) waivers to increase person-centered thinking, planning, and service coordination. Examples are the addition of Individualized Day Programs and Supported Living with Transportation to community activities for people with IDD. Key EPD Waiver amendments include the addition of a new provider type suitable to the delivery of Homemaker and Chore Services and revisions to the Environmental Accessibility Adaptation service that will make services more accessible.
Florida
2015
2016
Georgia
2015
2016
Adults (+): Added coverage for medically necessary emergency transportation by rotary wing air ambulance. (July 1, 2015)
LTSS Adults (+): Added hourly skilled nursing to Independent Care Waiver Program. (July 1, 2015)
Aged & Disabled (+): Added habilitation services for adults with serious mental illness under 1915(i) authority.
2016
Children (nc): Adding coverage for Applied Behavioral Analysis services for children with autism spectrum disorder to meet federal requirements. (October 1, 2015)
Iowa
2015
2016
Kansas
2015
2016
Kentucky
2015
2016
Aged & Disabled (nc): Modifying and adding new HCBS waiver services to better align beneficiary needs with services available and to comply with new HCBS federal requirements.
Louisiana
2015
2016
Maine
2015
2016
Maryland
2015
All (+): Expanded telemedicine services from rural to urban areas. (October 1, 2014)
All (+): Added coverage for certain Substance Use Disorder services. (January 1, 2015)
2016
All (+): Added Physician Assistants as a new provider type. (July 1, 2015)
Children (+): Plan to implement services under 1915(i) authority for children and youth with serious emotional disturbances and serious and persistent mental illness.
Massachusetts
2015
Adults (+): Added coverage for treatment of gender dysphoria.
Adults (+): Restored coverage for dentures. (May 15, 2015)
Aged & Disabled (+): Added a shared living benefit to the TBI 1915(c) waiver.
2016
Michigan
2015
2016
Minnesota
2015
Pregnant Women (+): Adding coverage for services provided by certified doulas. (July 1, 2014)
2016
Children (nc): Added coverage for treatment of autism spectrum disorder to meet federal requirements. (July 1, 2015)
Aged & Disabled (nc): Plan to convert the personal care assistance benefit to the Community First Choice Option under 1915(i) and Section 1115 waiver authority. (Upon CMS approval)
Mississippi
2015
Aged & Disabled Children (+): Added coverage for Prescribed Pediatric Extended Care Centers (a new provider type). (July 1, 2014)
2016
Aged & Disabled (+): Plan to implement HCBS services under 1915(i) authority for persons with intellectual and developmental disabilities.
Missouri
2015
All (+): Added coverage for SBIRT (Screening, Brief Intervention, Referral and Treatment) and HBAI (Health Behavior Assessment and Intervention services). (January 2015)
2016
Children (+): Adding coverage for asthma education and environmental assessment services. (Upon CMS approval)
Adults (+): Restoring coverage for preventive dental services and fillings. (January 2016)
Montana
2015
2016
Nebraska
2015
2016
All (+): Adding coverage for telehealth and tele-monitoring services. (January 2016).
Children (nc): Adding coverage for intensive behavioral intervention services for treatment of autism spectrum disorder to meet federal requirements.
Nevada
2015
2016
New Hampshire
2015
All (+): Removed service limits on psychotherapy, X-ray and outpatient hospital (to harmonize with Alternative Benefit Plan for the expansion population).
Expansion Adults (+): Added coverage for chiropractic and Substance Use Disorder services. (August 15, 2014)
2016
New Jersey
2015
Aged & Disabled (+): Implemented managed long-term services and supports and consolidating 1915(c) waivers into state’s Section 1115 which provides LTSS beneficiaries with a greater array of LTSS services. (July 1, 2014)
2016
New Mexico
2015
Pregnant Women (nc): Added coverage for birthing centers to meet federal requirements. (December 1, 2014)
Children (nc): Added coverage for treatment of autism spectrum disorder to meet federal requirements. (July 1, 2015)
2016
New York
2015
Aged & Disabled (+): Implemented the Community First Choice Option. (SPA still pending; plan to implement retroactively.42 )
2016
All (-): Discontinued coverage for viscosupplementation of the knee for an enrollee with a diagnosis of osteoarthritis of the knee. (April 1, 2015 for FFS and July 1, 2015 for managed care)
All (+): Expanded smoking cessation counseling providers to include dental practitioners. (April 1, 2015 for FFS and July 1, 2015 for managed care)
All (-): Limited coverage of DEXA Scans for Screening to one time every 2 years for Women Over Age 65 and Men Over Age 70. (April 1, 2015 for FFS and July 1, 2015 for managed care)
Aged & Disabled (+):Plan to add services for adults with serious mental illness services under 1915(i) authority as part of the state’s Health and Recovery Plans (HARP) managed care program.
North Carolina
2015
2016
North Dakota
2015
Aged & Disabled (+): Added personal care with supervision to the Home and Community Based waiver to allow individuals with a primary diagnosis of dementia or traumatic brain injury to receive 24 hour supervision with a daily rate. (January 2015)
2016
Ohio
2015
2016
Aged & Disabled (+): Planning to implement a redesign of behavioral health benefits to include coverage of additional services for persons with high intensity service and support needs (e.g., Assertive Community Treatment for SPMI adults, Intensive Home Based Treatment for SED children and residential treatment for substance use disorders). (January 1, 2016)
Oklahoma
2015
2016
Adults (-): Eliminated coverage for sleep studies. (July 1, 2015)
Oregon
2015
2016
Adults (+): Restoring previously cut adult restorative dental benefits (relaxed limitation criteria for dentures; coverage for crowns; scaling and planning). (January 1, 2016)
Pennsylvania
2015
Expansion Adults (+): Conformed Alternative Benefit Package (originally implemented on January 1, 2015) to the traditional Medicaid benefit package which resulted in an elimination of service limits on physical and behavioral health services. (April 27, 2015)
Family Planning Adults (+): Added additional preventive services including diabetes screening, health and behavioral assessments, cholesterol abnormalities and HIV screening. (Aug 2014)
Children (nc): Added autism spectrum disorder treatment to meet federal requirement. (Oct 2015)
Children (+): Expanded coverage for treatment of eating disorders ages 0-21. (October 2015)
South Dakota
2015
2016
Tennessee
2015
2016
Texas
2015
LTSS Adults (+): Implemented Community First Choice Option (CFCO) services for eligible individuals meeting institutional level of care and delivered through both the FFS and managed care delivery systems. (September 1, 2014)
MLTSS Adults (+): Added supported employment and employment assistance to the HCBS waiver service array in the STAR+PLUS program. (September 1, 2014)
Aged & Disabled (nc): Allowed providers other than Local Mental Health Authorities (LMHAs) to provide Mental Health Targeted Case Management and Mental Health Rehabilitative services already available through STAR Health. (September 1, 2014)
2016
Aged & Disabled (+): Implementing an array of HCBS designed to support long-term recovery from mental illness for SMI adults who are former long-term residents of inpatient facilities under a 1915(i) SPA. (Upon CMS approval)
Utah
2015
2016
Children (nc): Added autism spectrum disorder treatment to meet federal requirement. (July 2015)
Vermont
2015
All (+): Added a tele-monitoring benefit. (August 1, 2014)
2016
Aged & Disabled (-): Eliminating Enhanced Residential Care and Adult Family Care Case Management.
All (+): Adding coverage for Licensed Alcohol and Drug Counselors. (October 2015)
All (+): Adding coverage for primary care telemedicine outside of a facility. (October 1, 2015)
Children (nc): Added coverage for Applied Behavior Analysis for treatment of autism spectrum disorder to meet federal requirements. (July 1, 2015)
Virginia
2015
Aged & Disabled (+): Added nutrition counseling and inpatient substance abuse services for Medicaid Works (working disabled eligibility group). (July 1, 2014)
Pregnant Women (+): Expanded comprehensive dental benefits to pregnant women. (March 2015)
2016
Washington
2015
2016
LTSS Adults (+): Adding skills acquisition training and assistive technology under Community First Choice (CFC) for persons meeting nursing facility level of care. (Upon CMS approval)
All (+): Added coverage for gender reassignment surgery. (August 6, 2015)
West Virginia
2015
2016
Aged & Disabled (-): Amending IDD HCBS waiver (as part of five year renewal) to impose service limitations that will allow waiver to operate within its budget and serve more persons on the waiting list. Service limitations include reductions in respite hours, person centered support services, non-emergency transportation, and other reductions. (Upon CMS approval)
Wisconsin
2015
Aged & Disabled (+):Added the following HCBS waiver services for persons meeting nursing facility level of care: Consultative Clinical and Therapeutic Services for Caregivers and Training Services for Unpaid Caregivers. (January 1, 2015)
2016
Children (nc): Added State Plan coverage (to replace HCBS waiver coverage) for behavioral health services for treatment of autism spectrum disorder to meet federal requirements. (January 1, 2016)
Aged & Disabled (nc):A psychosocial rehabilitation program under 1915(i) along with two other such programs under other Medicaid authorities are being replaced with a single comprehensive psychosocial rehabilitation program under 1905 authority that will cover all the services provided by the prior programs.
Wyoming
2015
All (+): Added coverage for additional licensed MH provider types. (July2014)
2016
All (+):Added chiropractic benefit. (July 1, 2015)
All (+):Adding coverage for additional provisionally licensed MH provider types. (July 1, 2015)
* Benefit enhancements counted in this report are denoted with (+). Benefit restrictions or eliminations counted in this report are denoted with (-). Changes that were not counted as positive or negative in this report, but were mentioned by states in their responses, are denoted with (nc).
Prescription Drug Utilization and Cost Control Initiatives
Just over a decade ago, between 2001 and 2005, the vast majority of states aggressively implemented policies designed to slow the growth in Medicaid spending for prescription drugs. In January 2006, the implementation of the Medicare prescription drug benefit reduced total state Medicaid drug expenditures by almost half, the rate of growth in the cost of prescription drugs abated, and the intense Medicaid focus on pharmacy cost containment began to diminish. Since 2014, however, a combination of rising drug prices and increasing enrollments (as a result of ACA coverage expansions) have refocused state attention on pharmacy reimbursement and coverage policies. In this year’s survey, over two-thirds of the states in FY 2015 and half in FY 2016 reported actions to refine and enhance their pharmacy programs and to react to new and emerging specialty and high-cost drug therapies.
This year’s survey asked states to comment on the most significant factors affecting the trend in total Medicaid pharmacy expenditures (federal and state) between FY 2014 and projected for FY 2016. Responding to this open-ended question, the vast majority of states identified specialty and other high-cost drugs as a significant cost driver including a number of states identifying specific drug classes: hepatitis C antivirals, oncology drugs, cystic fibrosis agents and hemophilia factor. A few states also identified recently approved cholesterol drugs called “PCSK9 inhibitors” as likely cost drivers for FY 2016. In addition to specialty and other high-cost drugs, a number of states identified generic drugs as a significant cost driver, referencing large price increases for existing generics and higher than expected prices for new generics entering the market in addition to inflation and general drug price increases. Increased enrollment was also identified as a factor (including both ACA Medicaid expansion states and non-expansion states). A few states also identified factors that helped to moderate or reduce expenditure growth trends including higher rebates, drugs coming off patent and increased prior authorization and step therapy requirements. A number of states also commented that because pharmacy benefits for many enrollees were delivered under a capitated MCO arrangement, the growth in pharmacy expenditures could not be isolated.
Pharmacy Management Policies in Place and New in FY 2015 and FY 2016
At the start of FY 2015, a total of 45 states indicated that they had already in place a Preferred Drug List (PDL) and were already obtaining supplemental rebates.43 Two states (Arizona and Massachusetts) reported collecting supplemental rebates for the first time during FY 2015; one state (North Dakota) reported plans to adopt a PDL and collect supplemental rebates in FY 2016. The number of states with limits on the number of prescriptions that Medicaid will pay for each month decreased to 14 states in FY 2015, down from 16 states in FY 2014 and 18 states in FY 2013. One state (Pennsylvania) reported eliminating their prescription cap for adults in FY 2015. (Kentucky reported eliminating their monthly prescription limit in January 2014.)
Summary of FY 2015 and FY 2016 Pharmacy Policy Changes and Cost Containment Efforts
Thirty-five states (35) in FY 2015 and 25 states in FY 2016 implemented cost-containment initiatives in the area of prescription drugs, comparable to the number of states taking such actions in FY 2014 (28), FY 2013 (24), and FY 2012 (33). As PDL and related supplemental rebate programs have matured in most states and as more states have carved the pharmacy benefit into capitated managed care arrangements, the number of states reporting PDL or supplemental rebate changes (e.g., adding new PDL drug classes or joining a multi-state rebate pool) has dropped significantly (three states planning changes to PDL and five states planning changes to supplemental rebates in FY 2016) compared to 24 and 28 states in FY 2009. A small number of states reported reductions in ingredient cost reimbursement (5 states in FY 2015 and 6 states in FY 2016) often associated with adopting an actual acquisition cost methodology (discussed below), and a small number reported dispensing fee reductions (4 states in FY 2015 and 1 state in FY 2016). No state reported imposing new limits on the number of monthly prescriptions in either FY 2015 or FY 2016. The most significant restriction reported related to applying clinical management protocols for specialty/high-cost drugs.
Medicaid Covered Outpatient Drug Rule
State Medicaid programs reimburse pharmacies for the “ingredient cost” of each prescription using an Estimated Acquisition Cost (EAC), plus a dispensing fee.44 A proposed rule released in February 2012,45 replaces the term EAC with the term “Actual Acquisition Cost” (AAC) and also requires states to align their dispensing fees to be consistent with their ingredient cost reimbursement. States can define their own AAC prices or use the pricing files published and updated weekly by CMS – the “National Average Drug Acquisition Costs” (NADACs) – which are derived from outpatient drug acquisition cost surveys of retail community pharmacies.46 Some states have already transitioned to an AAC methodology. In this year’s survey, one state in FY 2015 (Alaska) and five states in FY 2016 (Maryland, Nevada, North Carolina, Texas and Virginia) reported adopting, or plans to adopt, an AAC (e.g., NADAC) ingredient cost methodology. A number of other states reported that they were holding off making any changes to their pharmacy reimbursement methodologies until the proposed rule is finalized which is expected to occur in late CY 2015.47
High-Cost Specialty Drugs
While there is no universally accepted definition of specialty drugs and Medicaid programs use varying definitions, products designated as specialty drugs tend to require either difficult or unusual medication delivery, or complex treatment maintenance. Price is also frequently considered an indicator of specialty drugs.48 According to pharmacy benefit manager, Express Scripts, overall U.S. drug spending increased by 13.1 percent in 2014 driven by a 30.9 percent increase in spending on specialty drugs, the highest specialty drug trend ever reported.49 Specialty drugs also grew as a share of total drug spending from 27.7 percent in 2013 to 31.8 percent in 2014 and are expected to reach 44 percent in the next three years with annual increases of 21 – 22 percent.50 Much of the 2014 growth was driven by the launch of three new hepatitis C treatments – Sovaldi, Olysio and Harvoni. As noted above, however, other new and emerging specialty drugs for cancer, cystic fibrosis, cholesterol management and other conditions are, or are expected to become, significant cost drivers.
In this year’s survey, states were asked to comment on whether their state had adopted or planned to adopt coverage, reimbursement or managed care policies targeting specialty or high-cost drugs in FYs 2015 or 2016.
Nineteen (19) states reported implementing new clinical prior authorization requirements and 11 states indicated that they were standardizing clinical criteria across both fee-for-service and managed care;
Four states (Connecticut, DC, Idaho and South Carolina) reported negotiating lower prices for certain drugs or more aggressive supplemental rebates;
Two states (Tennessee, Texas) reported reimbursement changes that effectively lower specialty drug prices;
One state (New York) reported plans to implement a specialty pharmacy program, and
One state (Wyoming) reported adding case managements with high drug costs and plans to implement a medication therapy program.
In contrast, in FY 2016, two states (California and Connecticut) reported plans to liberalize their previously more restrictive prior authorization polices for hepatitis C drugs, making them more widely available.
Several states also reported other managed care policies specifically related to reimbursement of hepatitis C drugs in FY 2015: California and Florida pay “kick” payments to MCOs, Kansas pays a “case rate,” and Maryland makes supplemental payments to MCOs that follow the state’s hepatitis C clinical guidelines. New Mexico reported using risk corridors and Rhode Island reported stop-loss payments, and five states (DC, New Hampshire, South Carolina, Texas and Washington) reported carving these drugs out of the capitation payment. In some cases, these policies were reported as “temporary” to allow the state time to collect enough utilization data so that the cost of these drugs could be included in future capitation rates. Oregon also expressed the concern that the coverage of specialty and high-cost drugs could put its Section 1115 Demonstration Waiver budget neutrality ceiling at risk.
Other Pharmacy Policy Changes
Other pharmacy actions counted as cost containment measures for FY 2015 and FY 2016 included: Medication Therapy Management programs including efforts to better manage opiates and behavioral health drugs (Indiana, Massachusetts, North Carolina, North Dakota, Washington and Wyoming), new or expanded 340B programs (Arizona and Oklahoma), a common formulary across FFS and MCOs (Michigan and Mississippi), hemophilia management program (Arkansas), restructured physician administered drug program (Kentucky), expanded step therapy or prior authorization programs (Louisiana), new enrollee lock-in program (North Carolina), reductions in over-the-counter (OTC) coverage for cough and cold medications for children (New Mexico), management of compound prescriptions and limits on Buprenorphine – a medication used to treat opioid addiction (Tennessee).
In addition, several states reported other pharmacy-related actions that were not included in the count of cost containment actions. Connecticut is allowing non-controlled prescriptions to remain valid for a full year (rather than six months) and is also implementing select OTC coverage for adults. DC, New York, Ohio and Vermont are awarding new administrative contracts for pharmacy benefit management and related services. Delaware, Indiana and Iowa are transitioning the pharmacy benefit to MCOs and Kansas is moving select vaccines to the pharmacy benefit under managed care. New York plans to carve in hemophilia factor products and injectable antipsychotic drugs into managed care contracts in FY 2016. Maryland carved-out substance use disorder drugs from managed care. Michigan is allowing behavioral health and other select physician injectables to be billed under the pharmacy benefit. Nebraska implemented Indian Health Service pharmacy reimbursement at an encounter rate. Texas is requiring MCO prior authorization policies to be reviewed and approved by its Drug Utilization Review Board.
Finally, a few states reported pharmacy-related expansions or reversals of previous pharmacy cost containment actions. Three states increased dispensing fees in FY 2015 (Alaska, Iowa and Montana) and six states planned to increase dispensing fees in FY 2016 (Maryland, Montana, Nevada, North Carolina, Texas and Virginia). In six of these states (Alaska, Maryland, Nevada, North Carolina, Texas and Virginia), dispensing fee increases were expected to partially offset reimbursement decreases resulting from the adoption of the AAC/NADAC ingredient cost reimbursement methodology. In addition to expansions or reversals of cost containment noted previously (Pennsylvania eliminated its monthly prescription cap for adults; California and Connecticut reported plans to liberalize their prior authorization policies for hepatitis C drugs) Illinois reported exempting antipsychotic medications from its monthly prescription cap, as well as exempting children with complex medical needs enrolled in a care coordination entity from its monthly prescription cap requirements.
Table 21: Pharmacy Cost Containment Actions Taken in all 50 States and DC, FY 2015 and 2016
States
Reduce Dispensing Fee
Reduce Ingredient Costs
Preferred Drug List Changes
Supplemental Rebate Changes
Specialty Rx Actions
Other Pharmacy Actions
Total Pharmacy Actions Taken
2015
2016
2015
2016
2015
2016
2015
2016
2015
2016
2015
2016
2015
2016
Alabama
Alaska
X
X
Arizona
X
X
X
X
X
Arkansas
X
X
X
X
X
X
X
California
X
X
Colorado
Connecticut
X
X
X
X
X
X
X
X
X
Delaware
DC
X
X
X
X
Florida
X
X
Georgia
Hawaii
X
X
Idaho
X
X
X
Illinois
X
X
X
X
X
Indiana
X
X
X
X
X
X
Iowa
Kansas
Kentucky
X
X
Louisiana
X
X
X
X
X
X
Maine
X
X
Maryland
X
X
X
X
Massachusetts
X
X
X
X
X
Michigan
X
X
Minnesota
Mississippi
X
X
X
X
X
Missouri
Montana
X
X
X
Nebraska
X
X
X
X
Nevada
X
X
X
X
X
New Hampshire
X
X
New Jersey
New Mexico
X
X
X
X
New York
X
X
X
X
X
North Carolina
X
X
X
X
X
X
X
North Dakota
X
X
X
X
X
Ohio
Oklahoma
X
X
X
Oregon
X
X
X
X
X
Pennsylvania
X
X
Rhode Island
X
X
X
X
South Carolina
X
X
South Dakota
Tennessee
X
X
X
X
X
X
X
Texas
X
X
X
X
X
X
X
Utah
Vermont
Virginia
X
X
X
X
Washington
X
X
X
X
West Virginia
Wisconsin
X
X
Wyoming
X
X
X
X
Totals
4
1
5
6
6
3
6
5
26
13
6
11
35
25
SOURCE: Kaiser Commission on Medicaid and the Uninsured Survey of Medicaid Officials in 50 states and DC conducted by Health Management Associates, October 2015.
Report: Priorities For Fy 2016 And Beyond Reported By Medicaid Directors
Medicaid is a large and complex program that provides health coverage for an increasing share of the population in each state. As the program continues to evolve, key priorities for most directors center around implementing the Medicaid expansion, controlling costs, implementing an array of complex delivery system reforms, and standing up new information technology systems related to eligibility, enrollment, claims processing and delivery system reform. Emerging priorities are focused on population health and social determinants of health. Tackling these major issues is a significant challenge for Medicaid directors, especially since administrative resources (both in terms of staff and funding) are often constrained. Key priorities for Medicaid directors identified in this year’s survey are described below.
Implementing the myriad provisions of the ACA. All states continue to focus on eligibility and enrollment changes, and 31 states (including DC) have adopted the ACA Medicaid expansion. Many directors reported that implementing the Medicaid expansion and expanding access to care for residents who have not had insurance continues to be a key priority.
Controlling costs. While not as acute as during the recession, states still report that controlling costs and spending is a top priority. Given the size of the Medicaid program as a share of state budgets, ensuring high quality and cost effective care is a perennial issue. Several expansion states indicated that as the overall program grows, maintaining or reducing state Medicaid spending or achieving other state budget savings (such as those related to behavioral health or corrections) has been key. More broadly, many states mentioned the growing costs of specialty drugs and improving program integrity as areas of focus. In addition, a number of states noted that while the economy has been improving, state revenues may not have kept pace, which has implications for all state programs including Medicaid. Looking ahead to FY 2017, a few states implementing the Medicaid expansion reported that finding general funds for the state share of Medicaid spending beginning in January 2017 is an upcoming challenge.
Implementing a wide range of payment and delivery system reform initiatives. Medicaid programs have embarked on a range of initiatives designed to better coordinate and integrate care. These initiatives often utilize reimbursement approaches that incentivize high quality care and reward optimal outcomes. These are complex initiatives to design, adopt and implement. States also continue to prioritize efforts to “rebalance” the delivery of LTSS toward greater use of home and community-based services. Some of these Medicaid reforms may have effects that ripple throughout the entire health system.
A number of Medicaid payment and delivery system reforms rely on managed care. With the increasing reliance on MCOs to manage physical health care, a growing number of states are focusing on the integration of physical health, behavioral health and long-term services and supports under the umbrella of managed care. States mentioned that expanding the scope of managed care involves a number of specific challenges, including the procurement and contracting for Medicaid health plans, the need for effective oversight of MCO contracts and performance and the new potential challenges from the recently proposed CMS rules for Medicaid managed care.
Ensuring that informationtechnology systems are in place to support program operations with constrained administrative resources. In almost half of states, systems and administrative initiatives were listed as a top priority for FY 2016. These priorities include procurement or implementation of new Medicaid Management Information Systems (MMIS), ongoing work on upgrades or replacement of eligibility systems, and other information technology or system projects designed to improve administrative efficiency and to achieve program goals. Development data analytics capability for is one example of using systems technology to develop information that can help a program run more effectively. Technology systems initiatives take several years to procure and often present major administrative challenges, especially since workload and demands on staff continue to increase while resources remain constrained in most states. Medicaid directors noted continued strain on administrative resources, in particular staff, as Medicaid programs are working to implement a number of major initiatives across multiple arenas (delivery system and payment reform, coverage expansions and information technology.)
Improving population health and addressing the social determinants of health. Expanding access to coverage and needed care was highlighted as a key element in addressing population health, especially among states implementing the ACA Medicaid expansion. However, broader efforts to improve population health are emerging priorities for Medicaid directors. State Medicaid programs are looking for opportunities to leverage other resources and stakeholders (such as state public health agencies and other payers) to improve the quality of care provided and ultimately affect health outcomes for the populations they serve. Pursuing these significant goals, however, has caused Medicaid to evolve into a major player in transforming the overall health care system.
Methods
The Kaiser Commission on Medicaid and the Uninsured (KCMU) commissioned Health Management Associates (HMA) to survey Medicaid directors in all 50 states and the District of Columbia to identify and track trends in Medicaid spending, enrollment and policy making. This is the 15th annual survey, each conducted at the beginning of the state fiscal year from FY 2002 through FY 2016. Additionally, eight mid-fiscal year surveys were conducted during state fiscal years 2002-2004 and 2009-2013, when a large share of states were considering mid-year Medicaid policy changes due to state budget and revenue shortfalls. Findings from previous surveys are referenced in this report when they help to highlight current trends. Archived copies of past reports are available on the following page.
The KCMU/HMA Medicaid survey on which this report is based was conducted from June through August 2015. The survey instrument (in the Appendix) was designed to document policy actions states implemented in FY 2015 and adopted for FY 2016 (which began for most states on July 1, 2015.51 ) Each survey is designed to capture information consistent with previous surveys, particularly for eligibility, provider payment rates, benefits, long-term care and managed care. Each year, questions are added to address current issues, such as state actions to address rising costs for specialty prescription drugs.
Medicaid directors and staff provided data for this report in response to a written survey and a follow-up telephone interview. The survey was sent to each Medicaid director in June 2015. All 50 states and DC completed surveys and participated in telephone interview discussions in July and August 2015. The telephone discussions are an integral part of the survey to ensure complete and accurate responses and to record the complexities of state actions. At the time the survey and telephone discussion was completed, the Medicaid budget for FY 2016 had not been adopted in Illinois and Pennsylvania. For Pennsylvania, FY 2016 responses were generally based on the Executive Recommended Budget. FY 2016 information was incomplete for Illinois.
The survey does not attempt to catalog all Medicaid policies in place for each state. The focus is on changes in Medicaid policy and new initiatives that are implemented in FY 2015 and those adopted and planned for implementation in FY 2016. Experience has shown that adopted policies are sometimes delayed or not implemented, for reasons related to legal, fiscal, administrative, systems or political considerations, or due to delays in approval from CMS. Policy changes under consideration without a definite decision to implement are not included in the survey.
State fiscal years begin on July 1 except for these states: NY on April 1; TX on September 1; AL, MI and DC on October 1. ↩︎
New York transitioned parents with incomes between 138 percent FPL to 150 percent FPL who received an additional Medicaid-funded premium wrap to purchase coverage in the Marketplace to the BHP. ↩︎
Family planning waivers and SPAs offer limited benefits while the breast and cervical cancer treatment program and the medically needy spend-down programs offer full Medicaid benefits but are limited to those with either a specific condition or after meeting spend-down requirements. Medicaid for Pregnant Women varies in scope of services. Some states only cover services very directly related to the pregnancy while other states deem that any health care issue could possibly affect a pregnancy. ↩︎
Since the survey was fielded, two states (AZ and MI) have submitted waiver requests that include premium and cost-sharing proposals. Each of these waiver proposals must be approved by CMS before the states could implement such changes. Additionally, state legislation in Ohio requires the state to seek a waiver to implement Health Savings Accounts (HSAs) for non-disabled adults in Ohio Medicaid. The state is still developing such a proposal; at the time of this report, no proposal had been publicly released.
– Arizona released a waiver proposal in August 2015 based on state legislation calling for the establishment of HSAs with contributions of up to 2 percent of income for new adults and copayments of up to $25 for non-emergent use of the emergency room.
Arizona Health Care Cost Containment System, Arizona’s Application for a New Section 1115 Demonstration (Arizona: Arizona Health Care Cost Containment System, September 2015), http://www.azahcccs.gov/shared/Downloads/AZWaiverPackage9-30-15RealFinal.pdf.
Nick Lyon, Amendment to Michigan’s Section 1115 Demonstration Known as the “Healthy Michigan Plan” Submitted Under Authority of Section 1115 of the Social Security Act (Michigan: Michigan Department of Health and Human Services, September 1, 2015), http://www.michigan.gov/documents/mdch/CMS_HMP_1115_Waiver_Amendment_Submission_498740_7.pdf.
“FY 2016- 2017 State Budget – Health Savings Accounts,” Ohio Department of Medicaid, accessed October 1, 2015, http://medicaid.ohio.gov/INITIATIVES/StateBudget.aspx. ↩︎
In order to impose higher cost sharing than otherwise allowed under federal law, a state needs to meet separate cost sharing waiver requirements under Section 1916(f) of the Social Security Act. Section 1916(f) permits a state to seek a demonstration waiver to charge cost sharing above otherwise allowable amounts if the state meets specific requirements and criteria, including testing a unique and previously untested use of copayments and limiting the demonstration to no longer than two years.
Robin Rudowitz, Samantha Artiga and MaryBeth Musumeci, The ACA and Medicaid Expansion Waivers (Washington, DC: Kaiser Commission on Medicaid and the Uninsured, February 2015), https://modern.kff.org/report-section/the-aca-and-medicaid-expansion-waivers-issue-brief/. ↩︎
Michigan released a waiver proposal in September 2015 based on state legislation calling for those with incomes between 100 and 138% FPL who have had coverage through the Healthy Michigan Plan for 48 cumulative months to be given the choice of either purchasing private insurance through the Marketplace with eligibility for advanced premium tax credits and cost-sharing reductions or remain in Healthy Michigan Plan but with increased cost-sharing and premiums capped at 7% of income (instead of federal maximum of 5%.) Such beneficiaries would also have increased monthly contributions (up to 3.5%) that could be reduced if they complete healthy behavior activities. If approved, this change would not go into effect until April 1, 2018. If this waiver is not approved, state law requires that the Healthy Michigan Plan ends as of April 30, 2016.
Nick Lyon, Amendment to Michigan’s Section 1115 Demonstration Known as the “Healthy Michigan Plan” Submitted Under Authority of Section 1115 of the Social Security Act (Michigan: Michigan Department of Health and Human Services, September 1, 2015), http://www.michigan.gov/documents/mdch/CMS_HMP_1115_Waiver_Amendment_Submission_498740_7.pdf. ↩︎
This is in lieu of the “217-like option” which had been approved by CMS as part of the state’s comprehensive waiver, but proved challenging to implement. ↩︎
Mississippi is included in the counts for states operating MCOs; however, its risk-based managed care program as of July 1, 2015 did not cover inpatient hospital services. Idaho’s MMCP program, which is secondary to Medicare, has been re-categorized by CMS from a PAHP to an MCO by CMS but is not counted here as such. California has a small PCCM program operating in LA County for those with HIV. Wyoming’s Patient Centered Medical Home program uses PCCM authority to make PMPM payments but is not counted here as such. ↩︎
California notes that the delivery of substance abuse services is moving to an “Organized Delivery System operated by counties” in FY 2016. For purposes of this report, this new arrangement is treated as a PHP as it is recognized at the federal level. ↩︎
One MCO state (North Dakota) had no children enrolled in its MCO which is limited to Medicaid expansion adults; they are therefore excluded from this count. ↩︎
There are 10 MCO states (DE, GA, HI, ND, NH, NV, TN, TX, VA and WV) that either do not cover adult dental services or only cover emergency dental services for adults. Georgia and Tennessee indicated that MCOs could offer adult dental services as a value-added benefit or cost effective alternative. ↩︎
Maryland indicated that MCOs could offer add-on adult dental plans for non-covered populations. ↩︎
The “Program of all All-Inclusive Care for the Elderly” (PACE) is a capitated managed care benefit for the frail elderly provided by a not-for-profit or public entity that features a comprehensive medical and social service delivery system. It uses a multidisciplinary team approach in an adult day health center supplemented by in-home and referral services in accordance with participants’ needs. ↩︎
For purposes of this survey, Idaho Medicare Medicaid Coordinated Plan is considered a PHP rather than an MCO as Medicare provides primary coverage for primary and acute care including inpatient hospital services. ↩︎
Hawaii and Tennessee auto assign all new members to a health plan and then offer them a choice. ↩︎
National Association of Medicaid Directors, Comments on Medicaid and Children’s Health Insurance Programs; Medicaid Managed Care, CHIP Delivered in Managed Care, Medicaid and CHIP Comprehensive Quality Strategies and Revisions Related to Third Party Liability (CMS-2390-P) (Washington, DC: National Association of Medicaid Directors, July 27, 2015), http://medicaiddirectors.org/node/1241. ↩︎
The “Program of all All-Inclusive Care for the Elderly” (PACE) is a capitated managed care benefit for the frail elderly provided by a not-for-profit or public entity that features a comprehensive medical and social service delivery system. It uses a multidisciplinary team approach in an adult day health center supplemented by in-home and referral services in accordance with participants’ needs. ↩︎
California Department of Health Care Services, DHCS Issues Statement Regarding the Section 811 Project Rental Assistance Demonstration Program (California: Department of Health Care Services, February 2013), http://www.dhcs.ca.gov/Documents/13-1%20Section%20811%20Demo.pdf. ↩︎
“Conflict-free case management” assures, in part, that the person or entity that conducts the functional assessment and/or case management services for a member does not also provide services to that individual.
Single points of entry (SPOE) systems offer consumers one-stop access to information, support, and linkages to local care services thereby reducing service fragmentation and simplifying access to long-term supports and services. ↩︎
Tennessee also reported implementing an individual cost cap in one of its IDD HCBS waivers in FY 2015, but noted that persons whose services exceeded the cap were transitioned to another waiver with an aggregate cost cap so that their services would not be reduced. Also South Carolina) reported temporarily suspending its Certificate of Need program during parts of FY 2014 and FY 2015, but noted that the state did not experience any increases in institutional capacity during that period. ↩︎
Until June 2014, Indiana operated as a Section 209(b) state; under Section 209(b) of the Social Security Act, states may develop their own disability determination methods for determining eligibility for aged, blind, and disabled groups. As part of this option, states must operate a spend-down program. In June 2014, Indiana switched to operate as a Section 1634 state, which relies on disability determinations by the Social Security Administration. As a Section 1634 state, Indiana no longer had to operate a spend-down program. ↩︎
New York reported implementing this option in FY 2015, but was awaiting final SPA approval at the time of the survey. The SPA calls for retroactive implementation. New York State Department of Health, State Plan Amendment #13-35 Community First Choice Option (New York: New York State Department of Health, December 30, 2013), https://www.health.ny.gov/regulations/state_plans/status/non-inst/original/docs/os_2013-12-30_spa_13-35.pdf. ↩︎
An additional state (Pennsylvania) had also not enacted a budget at the time of the survey. The state reported current plans but indicated that final actions depended on the final budget approved by state lawmakers. ↩︎
Rates for FY 2016 not yet determined at the time of the survey included MCO rates for Florida and all rates for Illinois. ↩︎
Illinois indicated that the rate restriction reported for nursing facilities in FY 2015 reflects a composite of a 10 month increase in rates and a two month decrease in rates. ↩︎
Some states also have premium or claims taxes that apply to managed care organizations and other insurers. Since this type of tax is not considered a provider tax by CMS, these taxes are not counted as provider taxes in this report. ↩︎
In years past, New Mexico was reported as having a PDL. In this year’s survey, the state clarified that while the Medicaid MCOs have their own PDLs, the state does not have its own PDL. ↩︎
In accordance with federal and state law, states pay the lower of (a) the ingredient cost rate plus a dispensing fee; (b) the Federal Upper Limit (FUL) or State Maximum Allowable Cost rate, if applicable, plus a dispensing fee; or (c) the pharmacy’s Usual and Customary Charge. ↩︎
“Medicaid Covered Outpatient Drug Rule Currently under OMB Review,” National Association of Medicaid Directors Newsletter, accessed August 18, 2015, http://medicaiddirectors.org/node/1249. ↩︎
Ibid. According to Express Scripts, roughly half of specialty drug expenditures are billed through the medical benefit (rather than the pharmacy benefit) and are not included in its trend calculations. ↩︎
State fiscal years begin July 1 except for these states: NY on April 1; TX on September 1; AL, MI and DC on October 1. ↩︎
Larry Levitt’s October 2015 post explains the terms of the much-debated Cadillac plan tax, how it is designed to reduce health costs, and how it could end up shifting more costs to workers. The tax on higher-cost health plans is scheduled to go into effect in 2018 and is the last remaining piece of the Affordable Care Act to be implemented. The post is now available at The JAMA Forum.
Other contributions to The JAMA Forum are also available.
In his latest column for The Wall Street Journal’s Think Tank, Drew Altman explains why covering the nation’s remaining uninsured population is more than just a red state issue.
All previous columns by Drew Altman are available online.
Second Analysis Finds Modest Shifts in Medicare Advantage Plan Options
When Medicare’s 2016 open enrollment begins Oct. 15, current enrollees in stand-alone Medicare Part D plans are projected to face an average 13 percent increase in premiums if they remain in their current plan for 2016, a new analysis finds.
Medicare Part D: A First Look at Plan Offerings in 2016 finds that for the coming year, the average beneficiary will have a choice of 26 stand-alone Part D drug plans, down from 30 last year. If currently enrolled beneficiaries stay in the same plan next year, average premiums are projected to rise to $41.46 per month, up from $36.68 this year. Many enrollees have access to plans that could lower their premiums or reduce their total drug costs. But, in a typical year, about 9 in ten Part D enrollees stick with the same plan rather than make a switch.
The analysis also identifies other changes for 2016 that could result in enrollees paying more out of pocket to fill their prescriptions. For instance, more than half (53%) of stand-alone Part D plans will require enrollees to meet the standard Part D deductible, the largest share to impose the maximum allowable deductible since the start of the program. (The standard deductible will be $360 in 2016, up from $320 this year).
As in 2015, most stand-alone plans will charge coinsurance rather than copayments for non-preferred brand name and specialty drugs in 2016, which can result in higher out-of-pocket costs for people who use these drugs, finds the analysis, co-authored by researchers at Georgetown University and the Kaiser Family Foundation.
A second analysis, What’s In and What’s Out? Medicare Advantage Market Entries and Exits for 2016, finds the Medicare Advantage market will change relatively little between 2015 and 2016 in terms of plan offerings. Beneficiaries will have 19 Medicare Advantage plans to choose from in 2016, on average, up slightly from 18 this year.
Nationally, there are a total of 2,001 plans, a slight net increase as 259 new plans enter the market and 203 existing plans exit. These plan departures will affect 3 percent of the nearly 17 million current Medicare Advantage enrollees, a smaller share than were affected last year.
Medicare’s annual enrollment period runs from Oct. 15 through Dec. 7. During this time, the program’s 55 million beneficiaries are able to choose or change Part D drug plans and Medicare Advantage plans, as well as move between traditional Medicare and a Medicare Advantage plan. Fact sheets explaining the Part D drug benefit and Medicare Advantage are available.