Contraceptive Coverage at the Supreme Court Zubik v. Burwell: Does the Law Accommodate or Burden Nonprofits’ Religious Beliefs?

Published: Mar 21, 2016

Issue Brief

Among the most contentious and litigated elements of the Affordable Care Act (ACA) is the requirement that most private health insurance plans provide coverage for a broad range of preventive services, including Food and Drug Administration (FDA) approved prescription contraceptives and services for women.  Since the implementation of the ACA contraceptive coverage requirement in 2012, over 200 corporations have filed lawsuits claiming that their religious beliefs are violated by the inclusion of that coverage or the “accommodation” offered by the federal government. The legal challenges have fallen into two groups: those filed by for-profit corporations and those filed by nonprofit organizations and both have reached the Supreme Court.

In the Burwell v. Hobby Lobby decision, the Supreme Court ruled that “closely held” for-profit corporations may be exempted from the requirement. This ruling, however, only settled part of the legal questions raised by the contraceptive coverage requirement, as other legal challenges have been brought by nonprofit corporations. The nonprofits are seeking an “exemption” from the rule, meaning their workers would not have coverage for some or all contraceptives, rather than an “accommodation,” which entitles their workers to full contraceptive coverage but releases the employer from paying for it.

The lawsuits brought by nonprofits have worked their way through the federal courts. On March 23, 2016, the Supreme Court will hear oral argument for Zubik v. Burwell, a consolidated case for seven legal challenges that involve nonprofit corporations. After the death of Justice Antonin Scalia, this already complicated case has taken on yet an additional question.  Given that the Court will be operating with only 8 Justices, what would be the impact of a tie (4-4) decision?   This brief explains the legal issues raised by the nonprofit litigation, discusses the influence of the Hobby Lobby decision on the current case before the Supreme Court, and the potential impact of a tie decision.

Who are the Petitioners in the Case Before the Supreme Court?

Since the contraceptive coverage regulations have been implemented, over 100 nonprofit corporations have challenged the contraceptive coverage requirement claiming that the accommodation for religiously affiliated nonprofits is insufficient and still burdens their religious rights. Multiple federal courts of appeals denied stays to all of the nonprofits involved in the litigation, finding that the accommodation is not a substantial burden.  Only one federal Court of Appeals, the 8th Circuit, has ruled in favor of nonprofits, striking down the accommodation, but these nonprofits are not part of the case before the Supreme Court. Following these rulings, a number of the litigants petitioned the Supreme Court to review their cases, which the Court agreed to do on November 6, 2015.  The named petitioners in the cases  to be reviewed by the Court are: Zubik (the Bishop of the Roman Catholic Diocese of Pittsburgh), Priests for Life, Roman Catholic Archbishop, East Texas Baptist University, Little Sisters of the Poor, Southern Nazarene University, and Geneva College.1   All of the petitioners contend that complying with the accommodation triggers the contraceptive coverage, but the petitioners outline different burdens for fully insured plans, self-insured plans, and church plans (Appendix 1).

What is the Basis for the Challenges Brought by the Religious Nonprofits?

As the contraceptive coverage rules have evolved through litigation and new regulations, there are three categories of employers with differing requirements.  Most employers are required to include the coverage in their plans.   Houses of worship can choose to be exempt from the requirement if they have religious objections (Figure 1). Workers and dependents of exempt employers do not have coverage for either some or all FDA approved contraceptive methods. Religiously-affiliated nonprofits and closely held for-profit corporations are not eligible for an exemption.  They can opt out of providing contraceptive coverage by notifying their insurer, third party administrator or the federal government of their objection and receive an accommodation which assures that their workers and dependents have contraceptive coverage, and relieves the employers of the requirement to pay for it.
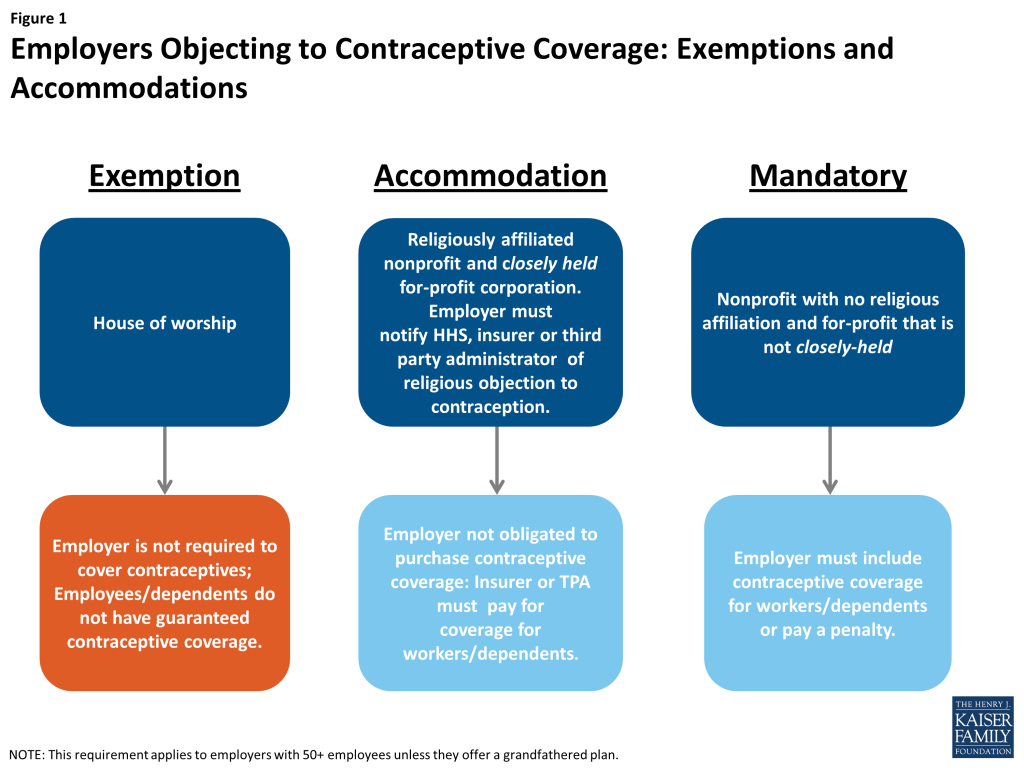
Figure 1: Employers Objecting to Contraceptive Coverage: Exemptions and Accommodations

The nonprofit corporations continuing to pursue legal challenges are seeking an “exemption” from the contraceptive coverage rule, not an “accommodation.”   They contend that they are unjustly burdened under the Religious Freedom Restoration Act (RFRA). RFRA was enacted in 1993 to protect “persons” from generally applicable laws that burden their free exercise of religion. The Government contends that it is federal law that requires the insurance issuer or the third party administrator to provide this coverage.  In resolving these cases, the Court must consider a series of threshold questions in deciding whether the contraceptive coverage requirement is in violation of the RFRA (Figure 2). While RFRA was the basis for both the for-profit and nonprofit challenges, the questions raised by the Zubik consolidated cases differ somewhat. The nonprofit legal challenges involve a different question than the one raised by the for-profit challenges: Does the requirement to notify the employer’s insurer/TPA/government of their religious objection to contraceptive that results in an “accommodation” to the contraceptive coverage rule “substantially burden” the nonprofits’ religious exercise?
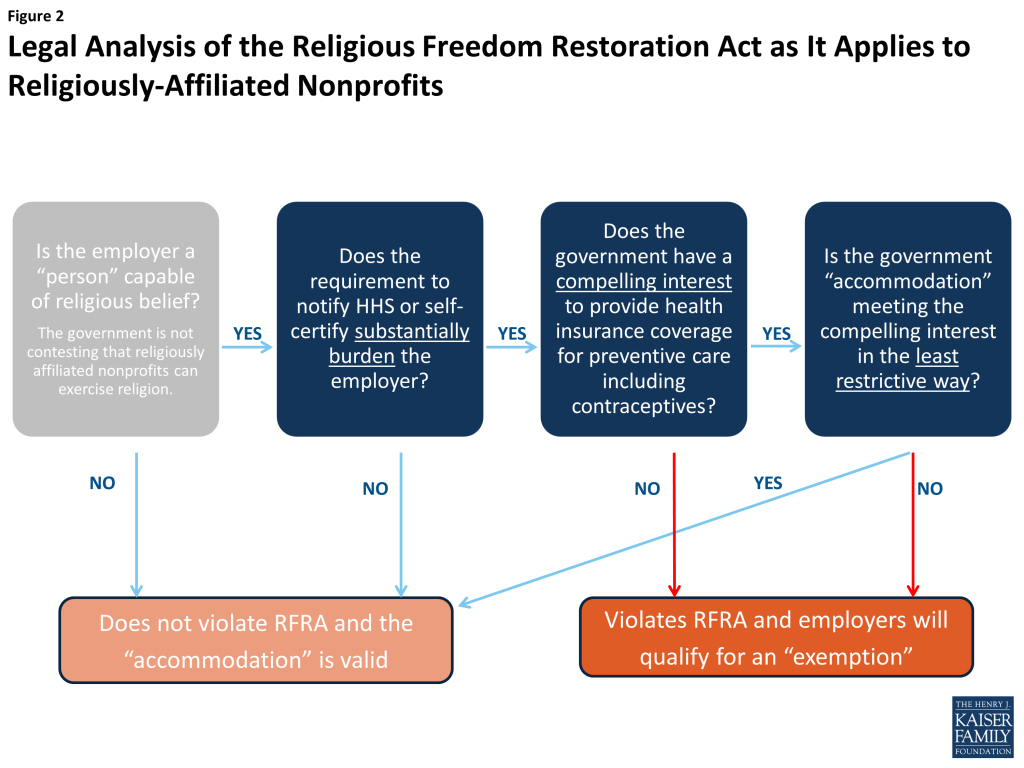
Figure 2: Legal Analysis of the Religious Freedom Restoration Act as it Applies to Religiously-Affliated Nonprofits

Do the Nonprofits Have a Sincerely Held Religious Belief?

The government is not contesting that the religiously affiliated nonprofits are considered “persons” under RFRA and hold sincerely held religious beliefs opposed to contraceptives.

Is the Accommodation a “Substantial Burden”?

The nonprofits must demonstrate the accommodation is a “substantial burden.” In other words, does the notice requirement that results in an “accommodation” to the contraceptive coverage requirement “substantially burden” the nonprofits’ religious exercise?   Federal regulations require that religiously affiliated nonprofits with an objection to contraception either notify their insurer, third party administrator or Health and Human Services of their objection to including some or all contraceptives in their health insurance plan.  This notice then qualifies them for an “accommodation” relieving them of the requirement to pay for the benefit, yet assuring that women workers and women dependents get the contraceptive coverage to which they are entitled under the ACA. The religiously-affiliated nonprofit organizations contend that when the insurer separately contracts with an employer’s workers to cover contraception at no cost, it remains part of the employer’s plan and is financed by the employer.  By providing notice they contend they will “facilitate” or “trigger” the provision of insurance coverage for contraceptive services, enabling their insurance company or their third party administrator “to provide the morally objectionable coverage and allow their health plans to be used as a vehicle to bring about a morally objectionable wrong.”2  The Government contends that it is federal law that requires the insurance issuer or the third party administrator to provide this coverage, not the actual act of notification.

Religiously affiliated nonprofit employers offering a health insurance plan to their workers may choose whether to offer a fully insured plan, self-insured plan, or a church plan. The nonprofit employers challenging the accommodation have selected different types of health insurance plans that address the accommodation in different ways (Table 1).

Table 1: Typology of Insurance Arrangements used by Litigants in the Zubik v. Burwell Consolidated Cases
Type of plan How is the Accommodation is HandledPayment for CoverageOversight
Fully-Insured Plan

Insurer collects premiums and assumes the risk of providing covered services

The insurer must exclude contraceptive coverage from the employer’s plan3  and not apply any of the employer’s premium contributions to pay for the coverage.4 No payment – federal government determined this coverage is cost neutral.State insurance regulators
Self-Insured ERISA plan

Employer assumes the risk of providing covered services and usually contracts with a third party administrator (TPA) to manage the claims payment process.

The TPA must provide contraceptive coverage to employees and dependents. The employer does not pay for or control this benefit but it is considered part of the employer’s plan.The costs of the benefit are offset by reductions in the fees the TPA paid to participate in the federal exchange.  The value is equal to the amount the TPA spent on contraceptive coverage plus a minimum 10% administrative fee.5 Department of Labor under the Employer Retirement Income Security Act (ERISA).
Self-Insured Church Plan

“A plan established and maintained for its employees (or their beneficiaries) by a church or by a convention or association of churches” and may also include entities controlled by or associated with a religious denomination.6  

A TPA for a church plan is not required to provide the coverage.  It can voluntarily choose to provide contraceptive coverage for the workers and dependents of an employer that has filed notice for an accommodation.The costs of the benefit are offset by reductions in the fees the TPA paid to participate in the federal exchange.  The value is equal to the amount the TPA spent on contraceptive coverage plus a minimum 10% administrative fee.7 Unlike other fully-insured or self-insured plans, Church plans are not regulated by ERISA or state insurance agencies.  There is effectively no enforcement authority for self-insured church plan TPAs to provide contraceptive coverage.

One of the more complicated aspects of the cases relates to self-insured church plans because there are regulatory gaps in oversight of these particular entities when it comes to contraceptive coverage.  Eighteen petitioners, including Little Sisters of the Poor, have a self-insured church plan,8  which is different than other types of employer self-insured plans in that it is explicitly not regulated by ERISA as are other self-insured plans.  A church plan is a plan “established and maintained for its employees (or their beneficiaries) by a church or by a convention or association of churches.” Church plans are not limited to traditional church entities, but may include entities controlled by or associated with a religious denomination. For example, church-related hospitals, educational institutions and nonprofits that provide services to the aging, children, youth and family, may sponsor church plans.  Because church plans are not governed under ERISA, they are not required to follow the ACA-related health reform mandates incorporated only into the ERISA law.9  However, church plans are required to follow all the ACA provisions included in the Internal Revenue Code (IRC).10   The IRS may impose penalty taxes on group health plans, including church plans for noncompliance with the contraceptive coverage provision.11 

Employers with self-insured plans must designate entities to take on two different roles: plan administrator (who operates the plan) and third party administrator (who processes the claims). 12   These are typically two separate entities.  However, when a religiously affiliated nonprofit employer with a self-insured plan provides notice of its objection to contraception, the contraceptive coverage regulations designate the plan TPA to function as the plan administrator, as defined in ERISA, but only for the contraceptive coverage benefit which effectively becomes a contraceptive plan.

Because the government’s authority to require a TPA to provide contraceptive coverage derives from ERISA, the government cannot actually enforce these regulations for self-funded church plans.13  While employers with self-funded church plans are required to provide notice of their objection, the TPAs for these plans have no enforceable obligation to provide the employees with contraceptive coverage.  The litigants, however, contend that if a TPA voluntarily decides to offer the contraceptive services to the employees, the employer believes that they would be substantially burdened by the notice requirement (Figure 3).
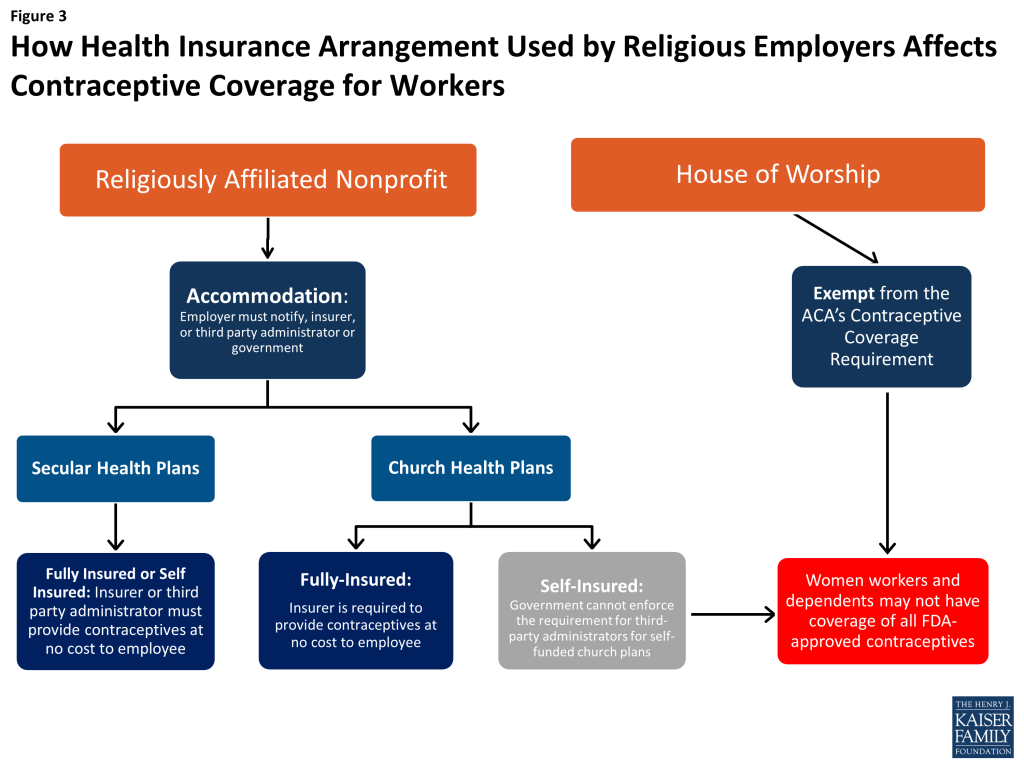
Figure 3: How Health Insurance Arrangement Used by Religious Employers Affects Contraceptive Coverage for Workers

The parties’ arguments on this point are a bit circular. The Little Sisters of the Poor and others contend the Government cannot have a “compelling” reason to require them to complete the notice when their TPA is not required to provide the contraceptive coverage. In response, the Government asserts that because the employees will only receive contraceptive coverage if the TPAs for self-insured church plans voluntarily choose to provide the coverage, these nonprofits have an even more attenuated burden than other nonprofits and cannot claim that the notification “triggers” the coverage.14 

Does the Contraceptive Coverage Requirement Further a Compelling Interest?

If the nonprofit corporations can show that they are substantially burdened, then the government will then need to prove that the contraceptive coverage requirement is a “compelling interest” that is met in the “least restrictive means.”  The Government has articulated the same compelling reasons for the contraceptive coverage requirement in these cases as it did in Hobby Lobby. These reasons include: 1) safeguarding the public health, 2) promoting a woman’s compelling interest in autonomy and 3) promoting gender equality.15 

In the Hobby Lobby decision, the Supreme Court did not adjudicate this issue; for the purpose of the ruling, they assumed that the Government had a compelling interest, and skipped to their analysis on whether the contraceptive mandate is the least restrictive means of furthering that compelling governmental interest.”16   The Court may have skipped this question because there was no clear agreement among the five Justices signing onto the Court’s majority opinion on whether the Government had a compelling interest.  In the decision, Justice Alito articulated that in order to demonstrate a compelling interest, the Government not only needs to show a compelling reason for the contraceptive coverage requirement generally, but the Government needs to specifically demonstrate “the marginal interest in enforcing the contraceptive mandate in these cases.”17   However, Justice Kennedy (who sided with the majority), and the four Justices that signed onto the dissent endorsed the position that providing contraceptive coverage to employees “serves the Government’s compelling interest in providing insurance coverage that is necessary to protect the health of female employees, coverage that is significantly more costly than for a male employee.”18 

In these cases, the Government is also asserting a compelling interest in its ability to fill the gaps created by accommodations for religious objectors.19  The contraceptive coverage regulations, including the religious accommodations, also advance the government’s related compelling interest in assuring that women have equal access to recommended health care services.

In their briefs, the nonprofits contend that the government cannot have a compelling interest when it does not apply this requirement equally to all employers, effectively exempting those with less than fifty employees that do not provide health insurance, grandfathered plans, and houses of worship. Furthermore, grandfathered plans are required “to comply with a subset of the Affordable Care Act’s health reform provisions” that provide what HHS has described as “particularly significant protections.”20  But the contraceptive mandate is expressly excluded from this subset.  “Here, granting a religious exemption for Petitioners would not undercut any “compelling” interest because the mandate is already riddled with exemptions.”21  Citing examples of other  laws including the Civil Rights Act which allow exceptions, the Government counters that the exceptions to the contraceptive coverage requirement do not negate the Government’s compelling interest.22 

IF the Government Demonstrates it Has a Compelling Interest, is it Meeting it in the “Least Restrictive Means”?

Lastly, the government must show it is meeting the compelling interest in the least restrictive means. The nonprofits argue there are less restrictive ways to accomplish the same goals, including allowing employees to qualify for subsidies on the exchange so they can enroll in an entirely new plan or a contraceptive only plan, or using Title X, the federal family planning program, to provide contraceptives to employees and dependents who lack coverage.  The Government contends that none of these alternatives would be as effective in achieving its compelling interest because they would place “financial, logistical, informational, and administrative burdens” on women seeking contraceptive services.23 

In the Court’s Hobby Lobby ruling, Justice Alito, wrote about the accommodation as a “less restrictive means,” to provide contraceptive coverage. The Court, however, did not decide whether the accommodation is lawful: “We do not decide today whether an approach of this type complies with RFRA for purposes of all religious claims. At a minimum, however, it does not impinge on the plaintiffs’ religious belief that providing insurance coverage for the contraceptives at issue here violates their religion, and it serves HHS’s stated interests equally well.”24 

The majority opinion hints that the accommodation may not be least restrictive means: “The most straightforward way of doing this would be for the Government to assume the cost of providing the four contraceptives at issue to any women who are unable to obtain them under their health-insurance policies due to their employers’ religious objections. This would certainly be less restrictive of the plaintiffs’ religious liberty, and HHS has not shown … that this is not a viable alternative.”25  Justice Ginsburg disagrees with this position in her dissent citing evidence that Title X cannot absorb more people, and it would be burdensome for women to find out about and sign up for another health insurance plan for contraceptives.

Why Are Houses of Worship Suing if They Are “Exempt”?

Three houses of worship that are exempt from the contraceptive coverage rule are also petitioners in the cases before the Supreme Court. The Archdiocese of Washington, the Diocese of Pittsburg, and the Diocese of Erie, each sponsor a self-insured church plan administered by a TPA, and have invited nonexempt nonprofit religiously affiliated organizations to participate in their plan. The Dioceses which sponsor these plans can choose to either drop coverage for their affiliates or complete the accommodation form for the other employers participating in the church plan. The Diocese objects to “facilitating” contraceptive coverage for the workers and dependents, employed by the other participating nonprofits.

What Are Potential Ramifications of the Decision?

There is much at stake in the Court’s ruling on these cases. If the Court decides that the accommodation violates RFRA, then many workers and dependents may not receive contraceptive coverage because their employers will be exempt.  Overall 3% of nonprofits offering health benefits (with 10 or more workers) have given notice for an accommodation, and a much larger share, 10% of nonprofits with 1,000 or more workers, have given notice for accommodation (Figure 4).26   It is not known if the nonprofits that have already filed notice of their objection and have obtained an accommodation would continue or would seek an exemption if that became an option.
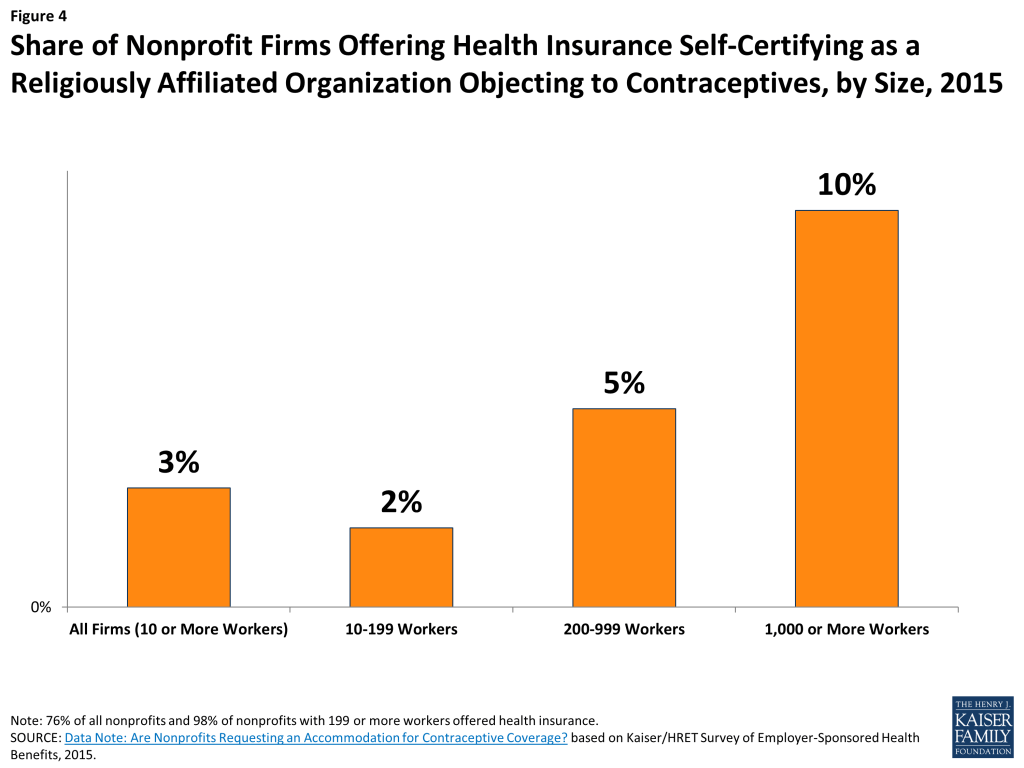
Figure 4: Share of Nonprofit Firms Offering Health Insurance Self-Certifying as a Religiously Affiliated Organization Objecting to Contraceptives, by Size, 2015

If the Supreme Court rules in favor of the religiously affiliated nonprofits, religious objectors in other contexts may be allowed to block the conduct of the government or third parties to fill in the gap left by the objector. The 10th Circuit court found that “Many religious objection schemes require an affirmative opt out before another person is required to step in and assume responsibility, and may require the objector to identify a replacement in the process.” 27   Lower courts have noted that if providing notice of an objection is a “substantial burden” then many other notifications resulting in opt outs could be affected including conscientious objector.  “A religious conscientious objector to a military draft” could claim that being required to claim conscientious-objector status constitutes a substantial burden on his exercise of religion because it would “trigger the draft of a fellow selective service registrant in his place and thereby implicate the objector in facilitating war.”28 

In his decision for the 10th Circuit Court of Appeals for Little Sisters v. Burwell,29  Judge Matheson notes other examples of when a religious objector is required to identify another person to step in: requiring a county clerk with objections to same sex marriage to designate someone else to solemnize a legal marriage;30  requiring pharmacists who object to providing contraception to refer patients to another pharmacist that will dispense the contraception;31  requiring health care providers who object to implementing a do-not-resuscitate order to “turn over care of the patient without delay to another provider who will implement the DNR order;”32   and requiring a church that opts out of paying Social Security and Medicare taxes for religious reasons to deduct those taxes from its employees’ paychecks as though the employees were self-employed.33 

What Happens if There is a Split Decision?

In reviewing the seven nonprofit cases, the Supreme Court will have to decide whether the notice and the resulting accommodation from the contraceptive coverage requirement substantially burdens the religious exercise of nonprofits, whether the government has a compelling interest, and whether there is a less restrictive way of achieving the same of goal of allowing women coverage for all FDA-approved contraceptive methods without cost-sharing.

If the Court decision is a tie, 4-4, the rulings for each case heard by the lower courts of the U.S. District Courts of Appeals will stand. All of the Circuits that have heard the cases of the petitioners in the consolidated case have ruled in favor of the Government, finding that the accommodation is not a substantial burden. However, unlike the other Federal Courts of Appeals, the 8th Circuit ruled in two separate cases (Sharpe Holdings Inc. et al. v. Burwell, and Dordt College et al. v. Burwell) that the religiously affiliated nonprofits are substantially burdened by the accommodation to the contraceptive coverage requirement, and the accommodation is not the least restrictive means of furthering the government’s interests (Figure 5).  These two cases, however, are not among the nonprofit employers petitioning the Supreme Court.  So while a 4-4 decision by the Supreme Court would mean that all of the nonprofits before the court would need to abide by the accommodation, it would not be upheld and enforceable in the 8th Circuit (ND, SD, NE, MN, IA, MO, AR), meaning that the religiously affiliated nonprofits that object to contraception in those states would effectively become exempt from the requirement and their employees and dependents would not get contraceptive coverage.  Alternatively, if the Court determines that that the Justices are split evenly, the Court might defer a decision and order a re-argument in the next term when there are nine Justices.  The possibility also exists, if the Court issues a 4-4 decision, that it may revisit this issue in a future term when there are nine Justices to review the case.
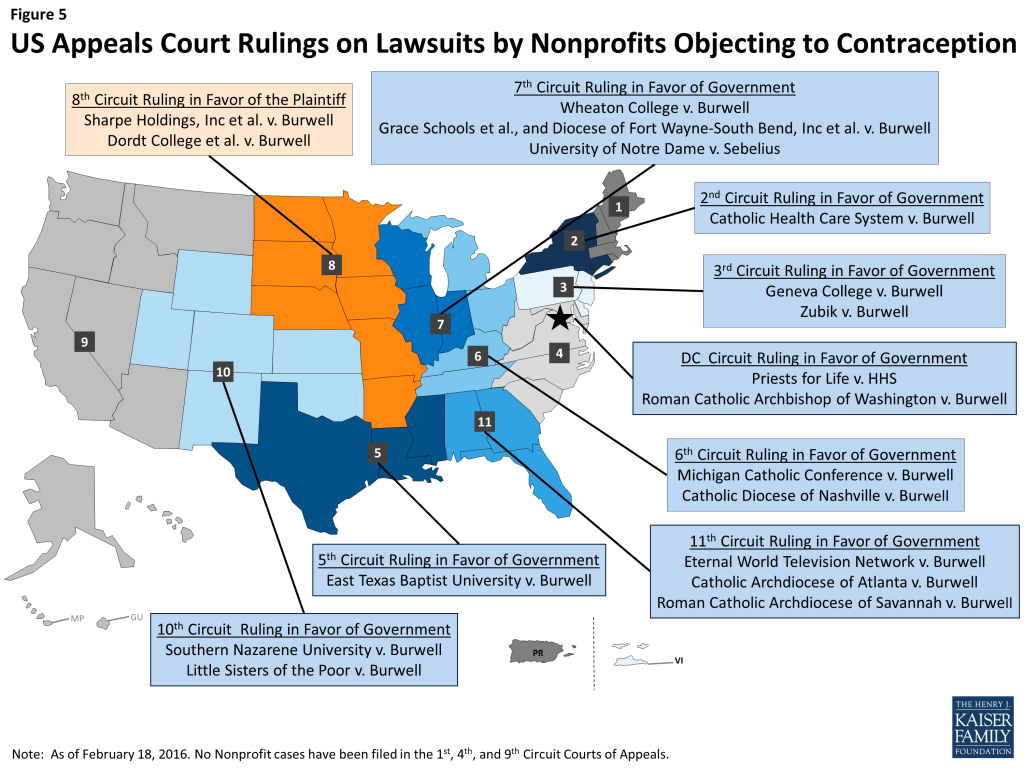
Figure 5: US Appeals Court Rulings on Lawsuits by Nonprofits Objecting to Contraception

Are These Supreme Court Cases The Final Word?

In addition to the current nonprofit cases that are being considered by the Court, there is other litigation by both employers and employees of organizations that are challenging the contraception coverage provisions.  On August 31, 2015, the DC District Court issued a decision in a case brought by March for Life, and two of its employees. March for Life was formed after the Roe v. Wade decision in 1973, and claims moral objections to many forms of contraceptives. As a secular nonprofit, however, it is not eligible for the exemption or accommodation available to religious organizations. This case represents a new legal approach and, for the first time, includes employees. The employer’s claim is that that the government has violated equal protection under the 5th Amendment by treating secular organizations with moral objections differently from religious organizations with religious objections. In addition, two employees of March for Life are also challenging the contraceptive coverage requirement under RFRA claiming they personally have religious objections to contraceptives, and do not want contraceptive coverage included in their plan. U.S. District Court for the District of Columbia issued a decision favorable to both March for Life and the two employees. The Administration has appealed this decision to the DC Court of Appeals; the court is holding the case until the Supreme Court issues a decision in Zubik v. Burwell.

More litigation may also emerge from for-profit employers like Hobby Lobby who also receive an accommodation from the requirements.  Beginning in their new plan year,34  Hobby Lobby and other similar corporations will be required to notify their insurer or HHS of their objection to contraceptive coverage so that the insurer can still provide the contraceptive coverage directly to the employees and their dependents. Depending on the outcome of the nonprofit cases before the Supreme Court, some closely held corporations may challenge the accommodation as applied to them, contending that the accommodation still substantially burdens the corporation, in much the same way that the religiously-affiliated nonprofits have done.

The outcome of all of these cases will determine if the employees and dependents of these corporations, and potentially other firms that are eligible for the accommodation, will have access to no cost contraceptive coverage as intended under the ACA.  As with most cases before the Supreme Court, the ruling will also likely have implications that go far beyond the issue of contraceptive coverage.

Appendix

 Appendix 1: Cases to be reviewed by Supreme Court in Zubik v Burwell
LawsuitCase HistoryStatus
Zubik et al. v. Burwell


On February 11, 2015, a unanimous 3rd Circuit panel issued a decision that the accommodation does not impose a substantial burden on plaintiffs’ religious exercise. The 3rd Circuit denied plaintiffs’ petition for a rehearing en banc and request for a stay. Zubik et al. filed an emergency petition with the Supreme Court asking for a stay.On April 15, 2015, Justice Alito issued a temporary stay allowing the plaintiffs to not comply with the accommodation while the Government submitted a response to the Court (submitted April 20, 2015). In May 2015, the plaintiffs filed a brief requesting that the Supreme Court review the case. On June 29, 2015, the Supreme Court denied the request for a stay, but allowed the plaintiffs to inform the government of their objection, and the government to facilitate contraceptive coverage for the workers and dependents, while the Court decided whether to take the case in the next term.  On November 6, 2015 the Supreme Court granted review on the RFRA challenges but not the First Amendment challenge.
Geneva College v. BurwellOn February 11, 2015, a unanimous 3rd Circuit panel issued a decision that the accommodation does not impose a substantial burden on plaintiffs’ religious exercise. The 3rd Circuit denied plaintiffs’ petition for a rehearing en banc and request for a stay.On May 18, 2015 the 3rd Circuit granted Geneva College (which did not join the emergency petition to the Supreme Court) a temporary stay pending a response and further orders by the Supreme Court in Persico and Zubik. In August 2015, Geneva College filed a brief requesting the Supreme Court to review the case. On November 6, 2015, the Supreme Court granted review.
Priests for Life v. HHS; Roman Catholic Archbishop of Washington  v. BurwellThe DC Circuit Court of Appeals panel ruled that the accommodation does not impose a substantial burden on plaintiffs’ religious exercise, the regulations advance compelling government interests, and the regulations are the least restrictive means. Plaintiffs petitioned for a re-hearing en banc asking the full D.C. Circuit to rehear the case.On May 20, 2015 DC Circuit Court of Appeals denied the request for an en banc hearing. In June 2015, the Priests for Life and Roman Catholic Archbishop of Washington filed briefs asking the Supreme Court to review the case. The DC Circuit Court has stayed enforcement pending the Supreme Court’s decision on whether to take the case. On November 6, 2015 the Supreme Court granted review for both cases.
East Texas Baptist University v. BurwellThe 5th Circuit Court of Appeals ruled that accommodation does not impose a substantial burden on plaintiff’s religious exercise. RFRA does confer the right to challenge independent conduct of third parties.The 5th Circuit Court of Appeals issued a decision on June 22, 2015. In July 2015, the plaintiffs appealed to the Supreme Court.  On November 6, 2015 the Supreme Court granted review.
Southern Nazarene University et al. v. BurwellU.S. District Court for the Western District of Oklahoma, granted plaintiffs’ motion for a preliminary injunction and then stayed proceedings until March 1, 2014. The government appealed to the 10th Circuit.The 10th Circuit issued a decision on July 14, 2015, denying Southern Nazarene University a stay. On July 24, 2015 the plaintiffs submitted a brief requesting the Supreme Court to review the case. On November 6, 2015 the Supreme Court granted review.
Little Sisters of the Poor v. Burwell 


The Supreme Court granted plaintiffs’ emergency application for an injunction pending appeal on the condition that they file notice with HHS that they are organizations that hold themselves out as religious and have religious objection to contraceptive coverage. Following the government’s issuance of interim final rules amending the accommodation for nonprofit, the parties filed supplemental briefs addressing the impact of those rules on the caseThe 10th Circuit issued a decision on July 14, 2015, denying Little Sister of the Poor a stay. On July 28, 2015, the plaintiffs submitted a brief requesting the Supreme Court to review the case. On November 6, 2015 the Supreme Court granted review, but will not consider the question about whether RFRA is violated by treated houses of worship differently than religiously affiliated nonprofits.

Endnotes

  1. The briefing order consolidates three cases for one brief:  Zubik v. BurwellPriests for Life v. Department of Health & Human Services, and Roman Catholic Archbishop of D.C. v. Burwell.  It consolidates the other four cases for the second brief: the Little Sisters, East Texas Baptist University v. BurwellSouthern Nazarene University v. Burwell, and Geneva College v. Burwell. ↩︎
  2. Zubik et al. v. Burwell et al.,  Emergency Application to Recall and Stay Mandate or Issue Injunction Pending Resolution of Certiorari Petition. April 15, 2015,  at page 17. ↩︎
  3. 45 C.F.R. 147.131(c)(2)(ii). ↩︎
  4. Ibid. ↩︎
  5. A participating issuer offering a plan through a Federally-facilitated Exchange may qualify for an adjustment in the Federally-facilitated Exchange user fee for payments made for contraceptive services for employers that self-certified for the accommodation. Adjustments of Federally-Facilitated Exchange User Fees:45 CFR § 156.50(d) and 156.80(d). ↩︎
  6. 26 C.F.R. § 1.414(e)-1. ↩︎
  7. A participating issuer offering a plan through a Federally-facilitated Exchange may qualify for an adjustment in the Federally-facilitated Exchange user fee for payments made for contraceptive services for employers that self-certified for the accommodation. Adjustments of Federally-Facilitated Exchange User Fees:45 CFR § 156.50(d) and 156.80(d). ↩︎
  8. Lederman, M. Who is “Zubik” in Zubik v. Burwell . . . and why is he allegedly complicit in the use of contraception? [Updated with list and categorization of al 37 petitioners]. November 8, 2015. ↩︎
  9. Church plans are exempt from regulation under the Employee Retirement Income Security Act of 1974 (ERISA)  unless they affirmatively opt in.  29 U.S.C. 1003 (b)(2); 26 U.S.C. §410(d). ↩︎
  10.   26 U.S.C. §500026 U.S.C. §9832. ↩︎
  11.   26 U.S.C. § 4980 (D). ↩︎
  12. ERISA Glossary, Health Plan Law. ↩︎
  13. Coverage of Recommended Preventive Services Under 26 CFR 54.9815-2713, 29 CFR 2590.715-2713, and 45 CFR 147.130 , July 14, 2015,  footnote 22 ↩︎
  14. Little Sisters of the Poor et al. v. Burwell et al., Supplemental Brief for Government filed in 10th Circuit, July 22, 2014, at page 7. ↩︎
  15. Brief of Respondents, Burwell, et al. v. Zubik, Supreme Court of the United States February 10, 2016, at pages 54-61. ↩︎
  16. Burwell v. Hobby Lobby, Supreme Court opinion, June 30 2014 at page 28. ↩︎
  17. Burwell v. Hobby Lobby, Supreme Court opinion, June 30, 2014 at page 39. ↩︎
  18. Burwell v, Hobby Lobby, Supreme Court opinion, June 30, 2014, at page 28 (Kennedy, J., concurring); accord id. at pages 40-41 & footnote 23 (Ginsburg, J., dissenting). ↩︎
  19.   Little Sisters of the Poor et al. v. Burwell et al., Supplemental Brief for Government filed in 10th Circuit, July 22, 2014, at page 17. ↩︎
  20. 75 Fed. Reg. 34540 (2010). ↩︎
  21. Brief for Petitioners, Zubik, et al, v. Burwell et al.,  Supreme Court of United States, January 4, 2016, at page 55. ↩︎
  22. Brief of Respondents, Zubik et al. v. Burwell et al., Supreme Court of United States, February 10, 2016, at page 62. ↩︎
  23. Brief of Respondents in Opposition to Petition for Writ of Certiorari, Priests  for Life et al., v, Department of Health and Human Services, at page 12 citing United State Court of Appeals for the DC Circuit, Priests for Life et al. v. HHS et al decision issued November 14, 2014. ↩︎
  24. Burwell v. Hobby Lobby, Supreme Court opinion, June 30 2014 at page 44. ↩︎
  25. Burwell v. Hobby Lobby, Supreme Court opinion, June 30 2014 at page 41. ↩︎
  26. Sobel, L., Rae, M., & Salganicoff, A. Data Note: Are Nonprofits Requesting an Accommodation for Contraceptive Coverage?, Kaiser Family Foundation (Dec. 2015). ↩︎
  27. Tenth Circuit Decision, Little Sisters of the Poor et al. v. Burwell et al. Published July 14, 2015, at page 51 footnote 31. ↩︎
  28. United State Court of Appeals for the DC Circuit, Priests for Life et al. v. HHS et al decision issued November 14, 2014, at page  24 quoting in part United States Court of Appeals for the 7th Circuit,  Univ. of Notre Dame v. Sebelius, decision issued  February 21, 2014. ↩︎
  29. Tenth Circuit Decision, Little Sisters of the Poor et al. v. Burwell et al. Published July 14, 2015, at page 51, footnote 31. ↩︎
  30. 2015 Utah Laws Ch. 46. ↩︎
  31. Stormans Inc. v. Selecky, 844 F. Supp. 2d 1172 (W.D. Wash. Feb. 22, 2012). ↩︎
  32. Conn. Agencies Regs. § 19a-580d-9. ↩︎
  33. Internal Revenue Service, Tax Guide for Churches & Religious Organizations 18 (2013), page 21. ↩︎
  34. Hobby Lobby’s plan year begins on July 1. In the midst of its lawsuit, Hobby Lobby changed the start of its plan year.   “According to the plaintiffs, the corporations’ deadline to comply with the contraceptive-coverage requirement is July 1, 2013” Hobby Lobby Stores, Inc. v. Sebelius, 723 F.3d 1114, 1125 (10th Cir. 2013). ↩︎
Access to Dental Care in Medicaid: Spotlight on Nonelderly Adults

Authors: Elizabeth Hinton and Julia Paradise
Published: Mar 17, 2016

Issue Brief

Introduction

Oral health is a critical but often overlooked component of overall health and well-being.1  Although good oral health can be achieved through preventive care, regular self-care, and the early detection, treatment, and management of problems, many people suffer from poor oral health, which often has additional adverse effects on their general health and quality of life.2  The prevalence of dental disease and tooth loss is disproportionately high among people with low income, reflecting lack of access to dental coverage and care. Racial and ethnic disparities in these measures are also pronounced.

Medicaid, the major health coverage program for low-income Americans, provides a uniquely comprehensive mandatory benefit package for children that includes oral health screening, diagnosis, and treatment services. In the last decade, with federal and state leadership, Medicaid and the Children’s Health Insurance Program (CHIP) have made important progress in addressing gaps in low-income children’s access to dental care, boosting children’s use of preventive and primary dental services. However, even with a robust benefit package, securing access to dental providers and services has remained a key challenge. The situation for low-income adults in Medicaid is more complex than that for children. Dental benefits for Medicaid adults are not required by federal law, but are offered at state option, and most states provide only limited coverage – in many cases, restricted to extractions or emergency services. Further, when states have faced budget pressures, adult dental services in Medicaid have typically been among their first cutbacks.3  It is noteworthy, too, that the Medicare program, which covers elderly adults and nonelderly adults with disabilities, provides no dental benefits.

Comprehensive coverage of dental care for children in Medicaid and CHIP, as well as the designation of pediatric dental care as one of the ten essential health benefits (EHB) under the Affordable Care Act (ACA), indicate recognition among policymakers of the importance of oral health. New opportunities now exist to establish similarly robust oral health benefits for low-income adults. Broad state flexibility to define Medicaid benefits for adults, the ACA expansion of Medicaid to nonelderly adults up to 138% of the federal poverty level (FPL), and Medicaid payment and delivery system reform are key policy levers. To help inform federal and state action concerning adult access to oral health care, this brief examines the oral health status of low-income adults, the dental benefits covered by state Medicaid programs, and low-income adults’ access to dental care today.

Why adult oral health is important

Untreated oral disease can have serious adverse impacts. Untreated oral health problems can affect appetite and the ability to eat, or lead to tooth loss, all of which can lead, in turn, to nutrition problems.4  Untreated problems can also cause chronic pain that can affect daily activities such as speech or sleep.5  Research has also identified associations between chronic oral infections and diabetes, heart and lung disease, stroke, and poor birth outcomes.6  Oral health problems can also interfere with work; employed adults are estimated to lose more than 164 million hours of work each year due to oral health problems or dental visits.7  Adults who work in lower-paying industries, such as customer service, lose two to four times more work hours due to oral health-related issues than adults who have professional positions.8  Visibly damaged teeth or tooth loss can also harm job prospects for adults seeking work.

Dental disease prevalence in nonelderly adults

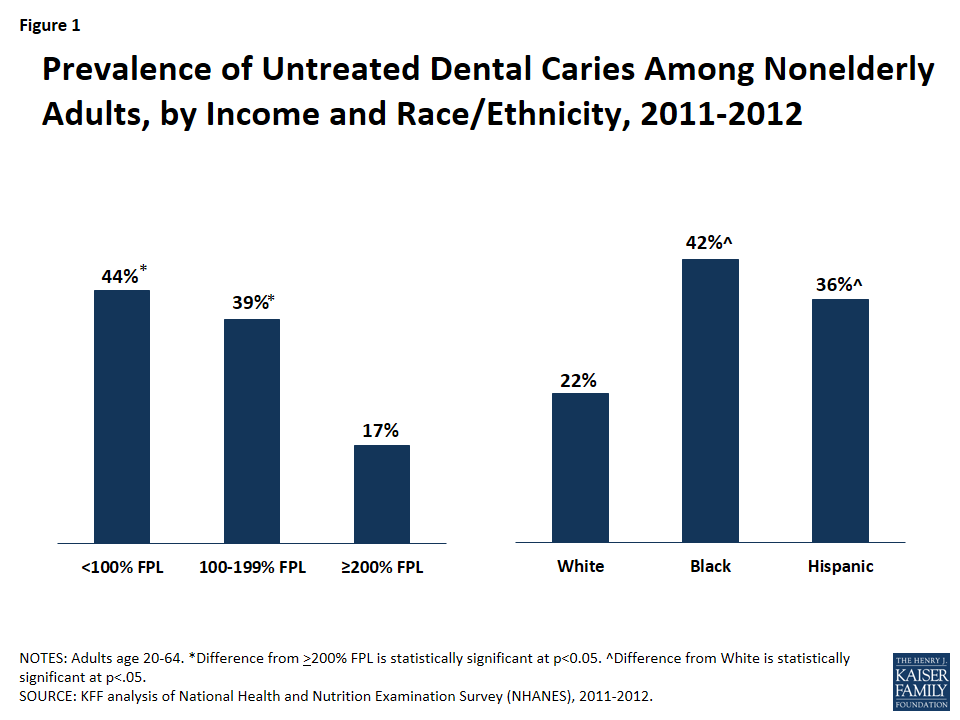
Nationally, 27% of all adults age 20-64 have untreated dental caries, but the burden of disease is not distributed evenly in the population.9  The rate of untreated dental caries is highest (44%) among adults with income below 100% FPL ($11,880 per year for an individual in 2016) –more than twice the rate (17%) among adults with income at or above 200% FPL (Figure 1). Racial and ethnic minorities were also disproportionately affected by oral health problems. Both Black and Hispanic adults had significantly higher rates of untreated caries than Whites, largely a reflection of their higher rates of poverty.

Figure 1: Prevalence of Untreated Dental Caries Among Nonelderly Adults, by Income and Race/Ethnicity, 2011-2012

Medicaid’s role in covering low-income adults

In 2014, Medicaid covered nearly 28 million low-income nonelderly adults. The program covers 4 in every 10 nonelderly adults under the poverty level.10  As of February 2016, 31 states and DC had adopted the Affordable Care Act’s (ACA) Medicaid expansion, which provides Medicaid eligibility to nearly all adults with income at or below 138% FPL ($16,394 per year for an individual in 2016); 19 states have not adopted the Medicaid expansion. The uninsured rate among low-income adults remains high, especially in non-expansion states.11  Across non-expansion states, the median Medicaid income eligibility for parents is 44% FPL, and adults without dependent children, except pregnant women and people with disabilities, are excluded from Medicaid no matter how poor they are. An estimated 2.9 million adults with income below 100% FPL fall into the “coverage gap” across non-expansion states – without access to Medicaid coverage and unable to qualify for subsidies in the Marketplace.12 

Medicaid dental benefits for adults

States have considerable discretion in defining Medicaid adult dental benefits because these services are optional, not mandatory, under federal Medicaid law. Adult dental benefits are a state option across the board – for adults who qualify for Medicaid under pre-ACA law and also for adults newly eligible for Medicaid under the ACA expansion. States must provide Alternative Benefit Plans (ABPs) for Medicaid expansion adults, modeled on one of four “benchmark” options specified in the law, including an option for coverage approved by the HHS Secretary. All ABPs must include the ten essential health benefits (EHBs) established by the ACA.13  Notably, the EHBs include pediatric dental benefits, but not adult dental benefits.14  Many states have used the Secretary-approved coverage option to conform the benefits they provide for expansion adults with their benefits for adults in traditional Medicaid, modifying them as necessary to comply with the EHB requirements. Of the 31 states and DC that have adopted the Medicaid expansion, all but two states provide the same dental benefits for expansion adults that they do for the traditional adult Medicaid population. The two exceptions are Montana and North Dakota. Montana provides limited dental benefits for its traditional Medicaid adult population, but none for Medicaid expansion adults; North Dakota provides extensive dental benefits for traditional Medicaid adults, but none for expansion adults.

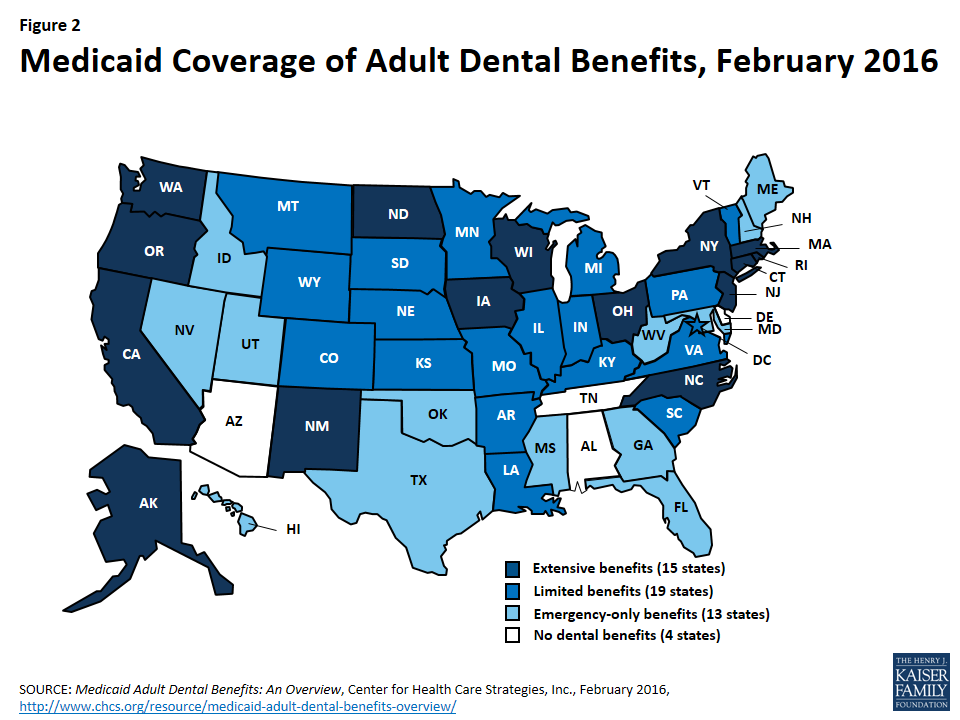
Almost all states (46) and DC currently provide some dental benefits for adults in Medicaid (Figure 2 and Appendix). However, just as commercial dental plans typically do, many state Medicaid programs set a maximum on their per-person spending for adult dental benefits or impose caps on the number of certain services they will cover. The scope of Medicaid adult dental benefits varies widely by state. As of February 2016, 15 states provided extensive adult dental benefits, defined as a comprehensive mix of services including more than 100 diagnostic, preventive, and minor and major restorative procedures, with a per-person annual expenditure cap of at least $1,000. Nineteen states provided limited dental benefits, defined as fewer than 100 such procedures, with a per-person annual expenditure cap of $1,000 or less. The remaining 13 states with any adult dental benefits covered only dental care for pain relief or emergency care for injuries, trauma, or extractions. Four states provided no dental benefits at all.15  Even in states that provide some dental benefits, adult Medicaid beneficiaries may face high out-of-pocket costs for dental care, making it difficult or impossible to afford.

Figure 2: Medicaid Coverage of Adult Dental Benefits, February 2016

As optional Medicaid services, adult dental benefits are also subject to being cut. Many states change their benefits from one year to the next. In particular, when states are under budget pressures, adult dental benefits in Medicaid have been cut back and, when their economies improve, states often move to restore them. For example, in 2009, California eliminated coverage of non-emergency dental services for adults. In 2014, the state restored many of the benefits, including preventive and restorative care, periodontal services, and dentures. Similarly, Illinois eliminated coverage of non-emergency dental services for adults in 2012, but expanded services again in 2014 to include limited fillings, root canals, dentures, and oral surgery services.16  Research has shown that when states reduce or eliminate adult dental benefits, unmet dental care needs increase, preventive dental service use decreases, and emergency department use for dental problems increases.17  18  19 

Adult access to dental care

Access to and use of dental care among low-income adults depends on a number of variables. Medicaid eligibility for low-income adults, Medicaid coverage of dental benefits,  the availability of dental providers, and beneficiary and provider awareness of the importance of preventive dental care all bear on whether low-income adults obtain dental services. Particularly in the absence of dental benefits, cost is the main barrier to access to dental care for low-income adults.20  Paying for services out-of-pocket is difficult, if not impossible, on their strained budgets. Over time, persistent lack of access to dental care or connection with dental providers may result in low expectations for oral health among low-income adults, reinforcing existing disparities. And if consumers are unaware of the need for regular checkups or cannot afford them, they may wait until they experience oral pain to seek care.

Dental Care Utilization and Unmet Need

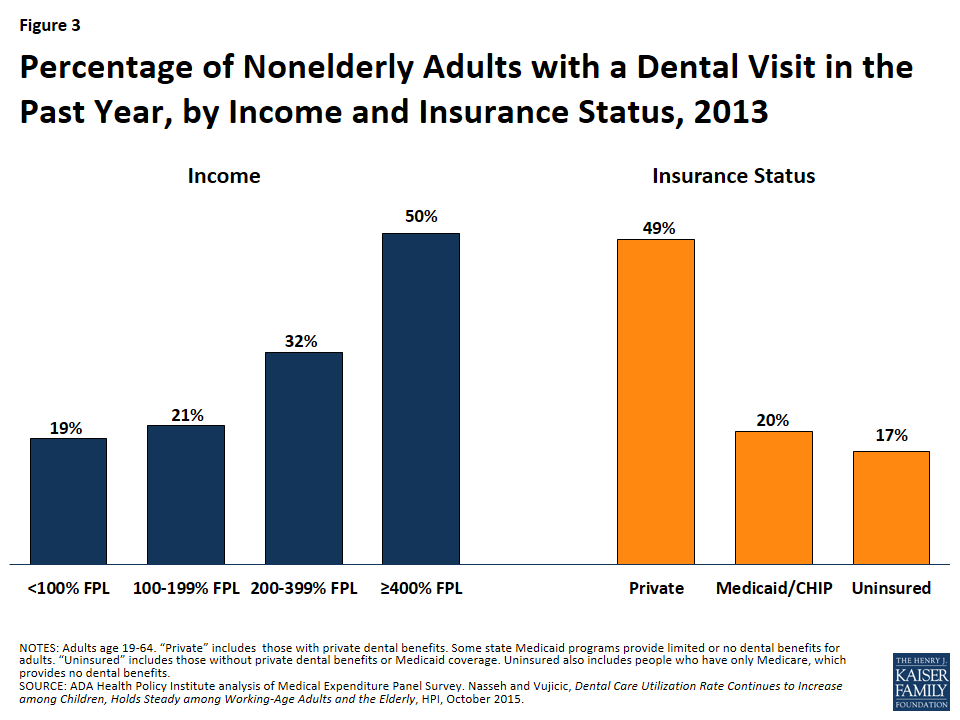
Regular dental care is important to maintaining good oral health. Low-income adults are less likely to have seen a dental provider within the last year than higher-income adults. In 2013, only about 1 in 5 adults with income below 200% FPL had a dental visit in the past year, compared to 1 in 3 of those with income of 200-399% FPL, and 1 in 2 adults with income above 400% FPL (Figure 3). Similarly, adults with private dental coverage were more than twice as likely as adults with Medicaid/CHIP or uninsured adults to have seen a dental provider within the last year. (Note: “Uninsured” includes adults without private dental benefits or Medicaid and nonelderly Medicare-only adults who do not have private supplemental dental benefits.) In 2013, 49% of adults with private coverage had a dental visit in the last year, compared to 20% of adults with Medicaid/CHIP and 17% of uninsured adults. Children in Medicaid/CHIP, for whom dental benefits are mandatory, were much more likely than adults in Medicaid to have had a dental visit (42%).21  The low visit rate for adults with Medicaid/CHIP coverage, compared to both children with Medicaid/CHIP and adults with private insurance, reflects, in part, the limited adult dental benefits covered in many state Medicaid programs.

Figure 3: Percentage of Nonelderly Adults with a Dental Visit in the Past Year, by Income and Insurance Status, 2013

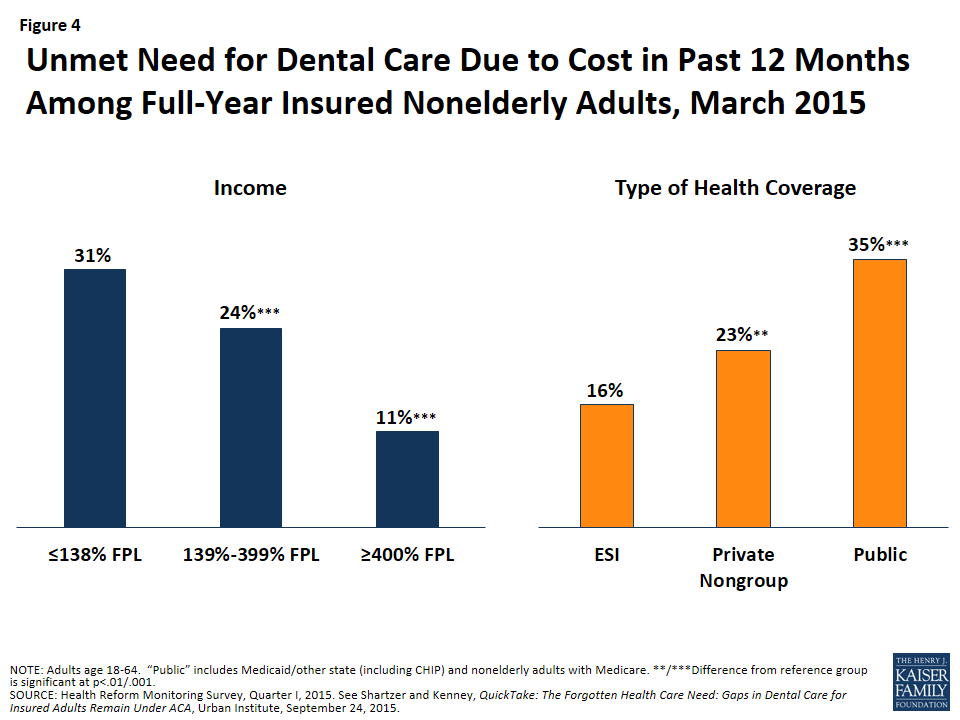
In recent research, dental care emerged as the service for which insured adults were most likely to report unmet need due to cost. This was especially true for low-income insured adults22  (Figure 4). Nearly one-third (31%) of full-year-insured nonelderly adults with income at or below 138% FPL and one-quarter (24%) of those between 139% and 399% FPL reported an unmet need for dental care due to cost, compared to 11% of full-year-insured adults with income at or above 400% FPL. Also, nonelderly adults with public insurance, including those with Medicaid/other state coverage and those with Medicare, were more than twice as likely to report an unmet need for dental care due to cost as adults with employer-sponsored insurance (35% vs. 16%) – again, likely reflecting limited Medicaid adult dental benefits in many states.

Figure 4: Unmet Need for Dental Care Due to Cost in Past 12 Months Among Full-Year Insured Nonelderly Adults, March 2015

Provider Availability and the Role of Health Centers

As of January 1, 2016, there were nearly 49 million people living in over 5,000 dental health professional shortage areas (HPSAs) across the country. HPSAs are defined primarily in terms of the number of dental health professionals relative to the population.23  Although there is some debate about whether a national shortage of dentists exists, most experts agree that there is a geographic maldistribution of dentists and a shortage of office-based dentists available to treat low-income and special needs populations, including people in nursing homes and other residential institutions. In addition, dentist participation in Medicaid is limited, as a large percentage of dentists accept no insurance and many dentists who do accept private insurance do not accept Medicaid.24  Medicaid beneficiaries often have difficulty finding a dental provider. The reasons dentists generally cite for not participating in Medicaid are low reimbursement rates, administrative burden, and high no-show rates among Medicaid patients.

Medicaid dental services may be delivered and paid for on a fee-for-service basis or by comprehensive or dental-only managed care plans that contract with the state. Of the 39 states with comprehensive Medicaid managed care in 2015, 29 states reported that they cover adult dental benefits. Of these states, 10 states reported carving-out adult dental benefits to Medicaid fee-for-service or prepaid health plans.25 

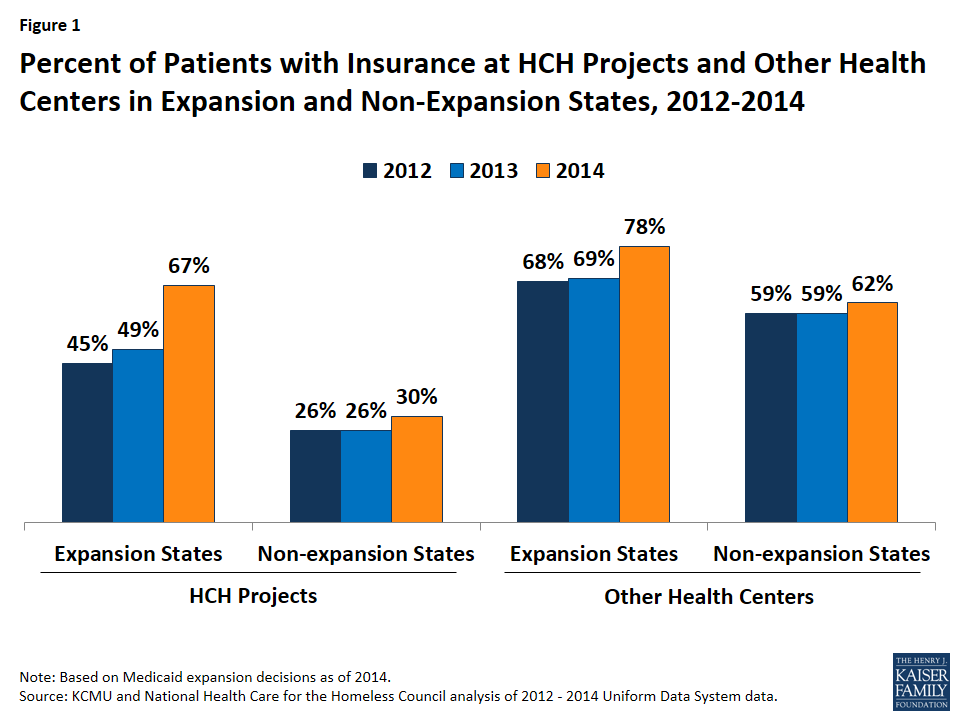
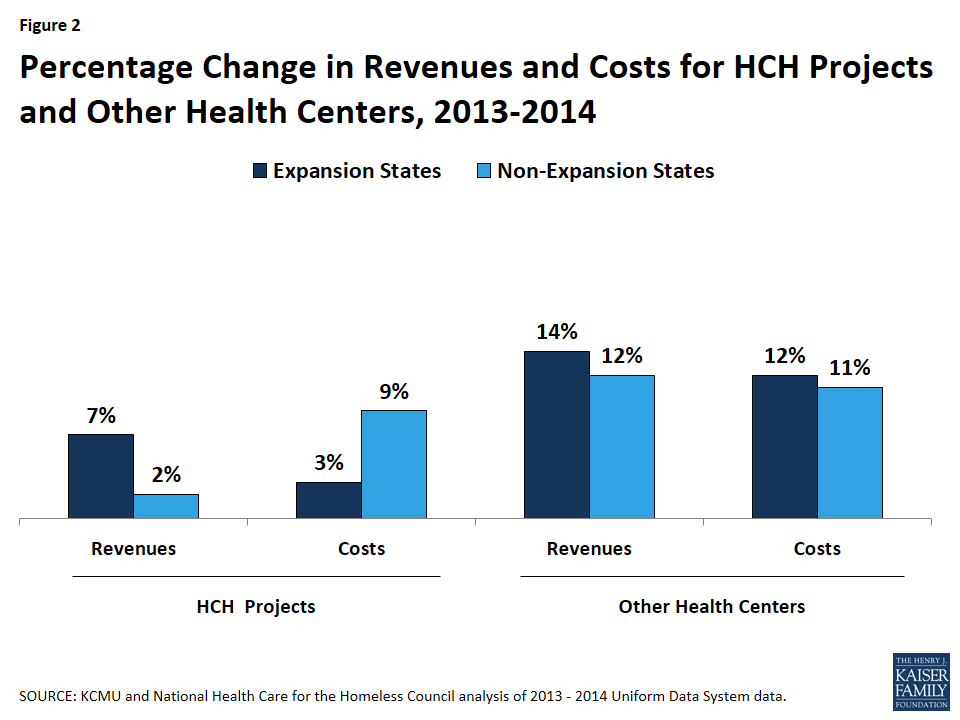
Although most dental care is provided in solo or small office-based dental practices, community health centers are an important source of dental care for Medicaid beneficiaries and others in low-income, medically underserved communities. In 2014, health centers across the country served 22.5 million patients, a large majority of them Medicaid beneficiaries (46%) and uninsured patients (28%).26  The ACA made a major investment in health center growth, establishing  a five-year $11 billion Health Center Trust Fund (which has since been extended through 2017), and providing $1.5 billion in new funding for the National Health Service Corps, which supplies many of the medical and dental providers who staff health centers. Health centers can also contract with private dental practices to provide oral health services to health center patients. Between the ACA trust fund dollars and increased patient revenues generated by expanded coverage for low-income people under the ACA, health centers in all states have been able to expand their service capacity; a recent survey of health centers found that those in Medicaid expansion states were significantly more likely than those in non-expansion states to have expanded their dental and mental services capacity since the start of 2014.27  In 2014, over three-quarters of health centers provided dental care, and about 15% of all health center patient visits were for dental services.28 

One strategy with potential to increase access to dental care in low-income communities is to develop a more diverse oral health workforce, because minority providers are more likely to work in minority communities and to provide care to the underserved.29  Programs like the National Dental Pipeline Program have increased enrollment of under-represented minority students at participating dental schools. In addition, dental school accreditation standards have been revised to improve diversity among dental school faculty and students.30 

Expanding the Supply of Dental Care: Scope-of-Practice & New Provider Types

In addition to dentists, dental hygienists, who specialize in preventive care and oral hygiene, are an integral part of the dental workforce. Dental hygienists work in a variety of settings (e.g., private offices, schools, nursing homes) in accordance with varying state requirements for dentist supervision, based on each state’s practice acts or regulations. To expand access to dental care, some states have amended their scope-of-practice rules to allow dental hygienists to furnish services without the presence or direct supervision of a dentist. Accompanying changes may be needed in some states’ Medicaid reimbursement policies and systems to permit dental hygienists to bill the program directly for services provided to Medicaid beneficiaries.

Some states have broadened the dental workforce further by introducing new midlevel dental provider types. Conceptually, midlevel dental providers play a role similar to that of nurse practitioners and physician assistants in the medical care context.31  They are part of the dental professional team and perform routine preventive and restorative services in a variety of settings.32  Three states – Alaska, Minnesota, and Maine – have recognized and licensed a new type of midlevel provider known as a dental therapist, to help improve access to care, especially for underserved populations. Education requirements, roles, and supervision requirements for midlevel dental providers vary across states. For example, Minnesota requires that at least 50% of the caseload of dental therapists and advanced dental therapists be Medicaid beneficiaries or underserved populations.33  Emerging research on midlevel dental providers indicates that they provide high-quality, cost-effective care.34 

Other strategies for optimizing current dental care capacity are also developing. Effective January 1, 2015, California began requiring the Medicaid program to reimburse for services delivered by dental hygienists in consultation with remote dentists, a practice known as “teledentistry.”35  This law was passed years after the state began the Virtual Dental Home Demonstration Project, a pilot program designed to test the “virtual dental home” model to expand access to care in dental shortage areas. In this model, telehealth technology is used to link allied dental professionals working in the community – registered dental hygienists in alternative practice, registered dental hygienists, and registered dental assistants – with dentists located in dental offices or clinics. The community-based providers collect patient information, including medical histories and x-ray images, and this information is then sent to the collaborating dentist. A treatment plan is developed, and the community-based provider furnishes the services they are authorized to provide in the community, and patients requiring more complex services are referred to a local dentist.36 

Dental Delivery System

Important changes in two key realms are poised to affect the delivery of dental care in the coming years. The first relates to the organization of service delivery. Movement toward more integrated, “whole-person” care and more accountable systems of care (e.g., Accountable Care Organizations) is leading to arrangements in which providers who have not traditionally done so are now sharing patient information and collaborating in care planning. Currently, states and delivery systems (e.g., managed care plans) are focused primarily on integrating behavioral health care with general medical care, but some systems are taking steps to integrate dental care as well.37  Interestingly, early research indicates that ACOs that provide dental services are more likely to include a health center and are much more likely to have contracts with Medicaid.38 

The second realm of change is clinical care itself. A different paradigm for oral health care is emerging that departs from the traditional fee-for-service, procedure-driven model that prevails today, and instead involves care planning based on individual patient characteristics and risk factors, and payment tied to quality and outcomes, not volume.39  This approach is essentially a model of prevention and chronic care management, in which patient risk is assessed, and preventive care, early intervention, close monitoring, and care management are targeted to individuals with or at high risk for disease. The aim is to improve oral health outcomes by providing services based on individual patient risk and need. Rethinking systems of care and broad health system accountability may improve access to and utilization of dental care as well as the impact of Medicaid spending for dental services.

Looking ahead

Improving the oral health of low-income adults involves efforts to expand coverage, strengthen benefits, promote oral health, and improve access and care delivery. State Medicaid programs can play a major role in this area and have important levers for making advances. States that have not yet expanded Medicaid under the ACA have an opportunity to cover millions of poor adults who lack other affordable health coverage options. Independent of the Medicaid expansion, improving state economies may enhance the prospects for expansion of adult dental benefits in Medicaid programs. The progress that states have made in increasing children’s access to and use of dental care, by building stronger provider networks, leveraging accountability through contracts, and investing in care coordination efforts, provides a foundation for similar action for adults in Medicaid.40  States are also expanding the dental workforce by removing scope-of-practice barriers and through targeted efforts among dental schools to increase diversity among dental students, as under-represented minority students are more likely to provide care to the underserved. Finally, state Medicaid programs are implementing a host of payment and delivery reforms in pursuit of higher-quality care, better patient outcomes, and reduced costs. A central emphasis of these new approaches is more integrated care, sometimes encompassing an expanded range of health and social services and supports, as well as innovative workforce and other strategies for expanding access. With growing recognition that oral health is essential to overall health and well-being, these new models of care present potential for increasing access to dental care and improving dental care and outcomes for both children and adults in Medicaid.

Appendix

Table 1: Oral Health Access in the States – Selected Measures
Medicaid Income Eligibility Limits for Adults (as % of FPL): 1   
StateParents (in a family of three)Childless AdultsPercent of Adults**≤138% FPL Reporting“Poor” Condition of Mouth/Teeth, 20152Scope of Medicaid Adult Dental Benefits3Percent of Medicaid Childrenwho received preventive dental visit in 20134
 
Medicaid Expansion States:
Alaska143%138%14%Extensive42%
Arizona138%138%25%None46%
Arkansas138%138%32%Limited50%
California138%138%20%Extensive37%
Colorado138%138%10%Limited51%
Connecticut155%138%14%Extensive60%
Delaware138%138%19%None46%
DC221%215%6%Limited50%
Hawaii138%138%12%Emergency-Only44%
Illinois138%138%20%Limited52%
Indiana139%139%20%Limited38%
Iowa138%138%9%Extensive50%
Kentucky138%138%21%Limited43%
Louisiana*138%138%27%Limited48%
Maryland138%138%18%Emergency-Only53%
Massachusetts138%138%15%Extensive54%
Michigan138%138%20%Limited40%
Minnesota138%138%17%Limited38%
Montana138%138%21%Limited48%
Nevada138%138%13%Emergency-Only45%
New Hampshire138%138%17%Emergency-Only56%
New Jersey138%138%15%Extensive47%
New Mexico138%138%17%Extensive51%
New York138%138%12%Extensive41%
North Dakota138%138%14%Extensive29%
Ohio138%138%9%Extensive21%
Oregon138%138%20%Extensive40%
Pennsylvania138%138%20%Limited40%
Rhode Island138%138%15%Extensive41%
Vermont138%138%19%Limited59%
Washington138%138%18%Extensive55%
West Virginia138%138%27%Emergency-Only46%
Non-Expansion States
Alabama18%0%19%None52%
Florida34%0%26%Emergency-OnlyNR
Georgia37%0%24%Emergency-Only50%
Idaho26%0%14%Emergency-Only56%
Kansas38%0%21%Limited46%
Maine105%0%21%Emergency-Only40%
Mississippi27%0%20%Emergency-Only48%
Missouri22%0%25%LimitedNR
Nebraska63%0%13%Limited52%
North Carolina44%0%15%Extensive49%
Oklahoma44%0%18%Emergency-Only47%
South Carolina67%0%21%Limited51%
South Dakota52%0%18%Limited41%
Tennessee101%0%16%None49%
Texas18%0%24%Emergency-Only53%
Utah45%0%13%Emergency-Only52%
Virginia39%0%28%Limited48%
Wisconsin100%100%21%Extensive25%
Wyoming57%0%20%Limited41%
US138% (median)138% (median)19%NA48% (median)
NOTES:NR- Not Reported* LA’s Governor signed an Executive Order to adopt the Medicaid expansion on 1/12/16, but coverage under the expansion is not yet in effect. For purposes of this analysis, LA is considered an expansion state.**Adults age 18 and older1: Based on state-reported eligibility levels as of January 1, 2015, collected through a national survey conducted by the Kaiser Commission on Medicaid and the Uninsured with the Georgetown University Center for Children and Families: Modern Era Medicaid: Findings from a 50-State Survey of Eligibility, Enrollment, Renewal, and Cost-Sharing Policies in Medicaid and CHIP as of January 2015, Kaiser Family Foundation, January 20, 2015, https://www.kff.org/medicaid/report/medicaid-and-chip-eligibility-enrollment-renewal-and-cost-sharing-policies-as-of-january-2016-findings-from-a-50-state-survey/.2: The Oral Health Care System: A State-by-State Analysis, by the ADA Health Policy Institute. http://www.ada.org/en/science-research/health-policy-institute/oral-health-care-system. Fifty-state data provided directly to KCMU by the ADA Health Policy Institute.3: Medicaid Adult Dental Benefits: An Overview, Feb. 2016, Center for Health Care Strategies, http://www.chcs.org/resource/medicaid-adult-dental-benefits-overview/.4: Use of Dental Services in Medicaid and CHIP, Jan. 2015, Mathematica analysis of FFY 2013 CMS-416 Reports (annual EPSDT report), https://www.medicaid.gov/medicaid-chip-program-information/by-topics/benefits/downloads/secretarys-report-dental-excerpt.pdf

Endnotes

  1. U.S. Department of Health and Human Services, Oral Health in America: A Report of the Surgeon General (Rockville, MD: U.S. Department of Health and Human Services, National Institute of Dental and Craniofacial Research, National Institutes of Health, 2000), http://www.nidcr.nih.gov/DataStatistics/SurgeonGeneral/Documents/hck1ocv.@www.surgeon.fullrpt.pdf. ↩︎
  2. Ibid. ↩︎
  3. Kaiser Commission on Medicaid and the Uninsured, Medicaid Benefits Database, 2010 Smith V., Gifford, K, and Ellis, E, et al, Moving Ahead Amid Fiscal Challenges: A Look at Medicaid Spending, Coverage and Policy Trends. Kaiser Commission on Medicaid and the Uninsured, October 2011. ↩︎
  4. US Department of Health and Human Services, Oral Health in America: A Report of the Surgeon General (Rockville, MD: U.S. Department of Health and Human Services, National Institute of Dental and Craniofacial Research, National Institutes of Health, 2000), http://www.nidcr.nih.gov/DataStatistics/SurgeonGeneral/Documents/hck1ocv.@www.surgeon.fullrpt.pdf. ↩︎
  5. Ibid. ↩︎
  6. Ibid. ↩︎
  7. Centers for Disease Control and Prevention, Oral Health for Adults (Atlanta, GA: U.S. Department of Health and Human Services, Centers for Disease Control and Prevention, July 2013), http://www.cdc.gov/oralhealth/publications/factsheets/adult_oral_health/adults.htm. ↩︎
  8. Ibid. ↩︎
  9. Bruce A. Dye et al., Dental caries and tooth loss in adults in the United States, 2011–2012. NCHS data brief, no 197 (Hyattsville, MD: National Center for Health Statistics, 2015, NHANES), http://www.cdc.gov/nchs/data/databriefs/db197.htm. ↩︎
  10. Melissa Majerol, Vann Newkirk, and Rachel Garfield, The Uninsured: A Primer, Key Facts about Health Insurance and the Uninsured in the Era of Health Reform: Supplemental Tables, (Washington, DC: Kaiser Commission on Medicaid and the Uninsured, Nov. 2015), https://modern.kff.org/uninsured/report/the-uninsured-a-primer-key-facts-about-health-insurance-and-the-uninsured-in-the-era-of-health-reform/. ↩︎
  11. The Kaiser Family Foundation State Health Facts. Data Source: Kaiser Family Foundation estimates based on the Census Bureau’s March 2014 and March 2015 Current Population Surveys (CPS: Annual Social and Economic Supplements), “Uninsured Rates for the Nonelderly by Federal Poverty Level (FPL)” accessed Feb. 26, 2016, https://modern.kff.org/uninsured/state-indicator/rate-by-fpl/. ↩︎
  12. Rachel Garfield and Anthony Damico, The Coverage Gap: Uninsured Poor Adults in States that Do Not Expand Medicaid – An Update, (Washington, DC: Kaiser Commission on Medicaid and the Uninsured, Jan. 2016), https://modern.kff.org/health-reform/issue-brief/the-coverage-gap-uninsured-poor-adults-in-states-that-do-not-expand-medicaid-an-update/. ↩︎
  13. Pub. L. 111-148, 124 Stat. 782 (2010) § 1302(b)(1) (codified at 42 U.S.C. § 18022(b)(1)) – Essential health benefits requirements ↩︎
  14. Centers for Medicare and Medicaid Services, “Alternative Benefit Plan Coverage” accessed Feb. 25, 2016, https://www.medicaid.gov/medicaid-chip-program-information/by-topics/benefits/alternative-benefit-plans.html. ↩︎
  15. Center for Health Care Strategies, Medicaid Adult Dental Benefits: An Overview (Hamilton, NJ: Center for Health Care Strategies, Oct. 2015), http://www.chcs.org/media/Adult-Oral-Health-Fact-Sheet_101915.pdf. ↩︎
  16. Medicaid and CHIP Payment and Access Commission, June 2015 Report to Congress on Medicaid and CHIP, Chapter 2: Medicaid Coverage of Dental Benefits for Adults, (Washington, DC: Medicaid and CHIP Payment and Access Commission, June 2015), https://www.macpac.gov/publication/coverage-of-medicaid-dental-benefits-for-adults-3/. ↩︎
  17. Carol Pryor and Michael Monopoli, Eliminating Adult Dental Coverage in Medicaid: An Analysis of the Massachusetts Experience, (Washington, DC: Kaiser Commission on Medicaid and the Uninsured, Aug. 2005), https://modern.kff.org/medicaid/report/eliminating-adult-dental-coverage-in-medicaid-an/. ↩︎
  18. Neal T. Wallace et al., “The Individual and Program Impacts of Eliminating Medicaid Dental Benefits in the Oregon Health Plan,” American Journal of Public Health 101, no.11 (Nov. 2011): 2144-2150, http://www.ncbi.nlm.nih.gov/pmc/articles/PMC3222412/. ↩︎
  19. Medicaid and CHIP Payment and Access Commission, June 2015 Report to Congress on Medicaid and CHIP, Chapter 2: Medicaid Coverage of Dental Benefits for Adults, (Washington, DC: Medicaid and CHIP Payment and Access Commission, June 2015), https://www.macpac.gov/publication/coverage-of-medicaid-dental-benefits-for-adults-3/. ↩︎
  20. Cassandra Yarbrough, Kamyar Nasseh, and Marko Vujicic, Why Adults Forgo Dental Care: Evidence from a National Survey, (Chicago, IL: American Dental Association, Health Policy Institute, Nov. 2014), http://www.ada.org/~/media/ADA/Science%20and%20Research/HPI/Files/HPIBrief_1114_1.ashx ↩︎
  21. Kamyar Nasseh and Marko Vujicic, Dental Care Utilization Rate Continues to Increase among Children, Holds Steady among Working-Age Adults and the Elderly, (Chicago, IL: American Dental Association, Health Policy Institute, Oct. 2015), http://www.ada.org/~/media/ADA/Science%20and%20Research/HPI/Files/HPIBrief_1015_1.ashx. ↩︎
  22. Adele Sharter and Genevieve M. Kenney, QuickTake: The Forgotten Health Care Need: Gaps in Dental Care for Insured Adults Remain under ACA, (Washington, DC: Urban Institute, Sept. 2015), http://hrms.urban.org/quicktakes/Gaps-in-Dental-Care-for-Insured-Adults-Remain-under-ACA.html. ↩︎
  23. Bureau of Health Workforce, Health Resources and Services Administration (HRSA), Designated Health Professional Shortage Areas Statistics, as of January 1, 2016, (Washington, DC: U.S. Department of Health and Human Services, Health Resources and Services Administration, Feb. 2016), http://datawarehouse.hrsa.gov/tools/hdwreports/reports.aspx. ↩︎
  24. The National Conference of State Legislatures, Access to Oral Health Services for Low-Income People: Policy Barriers and Opportunities for Intervention for the Robert Wood Johnson Foundation, (Washington, DC: The National Conference of State Legislatures, Oct. 2002), http://www.ncsl.org/Portals/1/documents/health/forum/rwjoral.pdf. ↩︎
  25. Vernon K. Smith et al., Medicaid Reforms to October 2015 Expand Coverage, Control Costs and Improve Care: Results from a 50-State Medicaid Budget Survey for State Fiscal Years 2015 and 2016, (Washington, DC: Kaiser Commission on Medicaid and the Uninsured, Oct. 2015),  https://modern.kff.org/medicaid/report/medicaid-reforms-to-expand-coverage-control-costs-and-improve-care-results-from-a-50-state-medicaid-budget-survey-for-state-fiscal-years-2015-and-2016/. ↩︎
  26. Peter Shin et al., Health Center Patient Trends, Enrollment Activities, and Service Capacity: Recent Experience in Medicaid Expansion and Non-Expansion States, (Washington, DC: Kaiser Commission on Medicaid and the Uninsured, Dec. 2015), https://modern.kff.org/report-section/health-center-patient-trends-enrollment-activities-and-service-capacity-issue-brief/. ↩︎
  27. Ibid. ↩︎
  28. Health Resources and Services Administration (HRSA), 2014 Health Center Profile: Uniform Data System, (Washington, DC: U.S. Department of Health and Human Services, Health Resources and Services Administration), http://www.bphc.hrsa.gov/datareporting/index.html. ↩︎
  29. Ryan K. Edmunds, “Increasing Access to Care with Diversity,” Journal of Dental Education 70, no. 9 (Sept. 2006): 918-920, http://www.ncbi.nlm.nih.gov/pubmed/16954412. ↩︎
  30. Allan J. Formicola et al., “Underrepresented Minority Dental Student Recruitment and Enrollment Programs: An Overview from the Dental Pipeline Program,” Journal of Dental Education 74, no. 10, 10 suppl. (Oct. 2010): S67-S73, http://www.jdentaled.org/content/74/10_suppl/S67.full. ↩︎
  31. Bryan Kelley, NCSL Blog: Maine Introduces Mid-Level Dental Providers to Increase Access to Care (Washington, DC: National Conference of State Legislatures, May 2014), http://www.ncsl.org/blog/2014/05/06/maine-introduces-mid-level-dental-providers-to-increase-access-to-care.aspx. ↩︎
  32.   The Pew Charitable Trusts, Working with Midlevel Providers: Dentists’ Perspectives, (Washington, DC:  The Pew Charitable Trusts, Oct. 2014), http://www.pewtrusts.org/en/research-and-analysis/analysis/2014/10/02/working-with-midlevel-providers-dentists-perspectives. ↩︎
  33. Rachel Yalowich and Chiara Corso, Enhancing Oral Health Access through Safety Net Partnerships: A Primer and Resource Guide for Medicaid Agencies, (Washington, DC: National Academy for State Health Policy, Aug. 2015), http://www.nashp.org/wp-content/uploads/2015/08/Enhancing-Oral-Health-Primer-for-Medicaid-Agencies.pdf. ↩︎
  34. Jane Koppelman, Opinion: Expanding Access through Midlevel Dental Providers, (Washington, DC: The Pew Charitable Trusts, Nov. 2015), http://www.pewtrusts.org/en/about/news-room/opinion/2015/11/17/expanding-access-through-midlevel-dental-providers. ↩︎
  35. Daniela Hernandez, California To Launch Medicaid-Funded Teledentistry, (Washington, DC: Kaiser Health News, Sept. 2014), http://kffhealthnews.org/news/california-to-launch-medicaid-funded-teledentistry/. ↩︎
  36. Pacific Center for Special Care, Policy Brief: The Virtual Dental Home: Improving the Oral Health of Vulnerable and Underserved Populations Using Geographically Distributed Telehealth-enabled Teams (San Francisco, CA: University of the Pacific, Arthur A. Dugoni School of Dentistry, Pacific Center for Special Care, May 2013), http://dental.pacific.edu/Documents/community/special_care/acrobat/VirtualDentalHome_OvierviewResults_PolicyBrief_May_2013.pdf. ↩︎
  37. Taressa Fraze et al., Research Brief: Early Insights on Dental Care Services in Accountable Care Organizations, (Chicago, IL: American Dental Association, Health Policy Institute, April 2015), http://www.ada.org/~/media/ADA/Science%20and%20Research/HPI/Files/HPIBrief_0415_1.ashx. ↩︎
  38. Ibid. ↩︎
  39. Michelle Hurlbutt, CAMBRA: Best Practices in Dental Caries Management, (Chesterland, OH: Academy of Dental Therapeutics and Stomatology, Aug. 2011), http://www.rdhmag.com/etc/medialib/new-lib/rdh/site-images/volume-31/issue-10/1110RDH095-109.pdf. ↩︎
  40. Andrew Snyder and Keerti Kanchinadam, Adult Dental Benefits in Medicaid: Recent Experiences from Seven States (Washington, DC: National Academy for State Health Policy, July 2015), http://www.nashp.org/wp-content/uploads/2015/07/Adult-Dental-Benefits-in-Medicaid-Recent-Experiences-from-Seven-States.pdf. ↩︎

Surprise Medical Bills

Author: Karen Pollitz
Published: Mar 17, 2016

A Kaiser Family Foundation survey finds that among insured, non-elderly adults struggling with medical bill problems, charges from out-of-network providers were a contributing factor about one-third of the time.  Further, nearly 7 in 10 of individuals with unaffordable out-of-network medical bills did not know the health care provider was not in their plan’s network at the time they received care.

“Surprise medical bill” is a term commonly used to describe charges arising when an insured individual inadvertently receives care from an out-of-network provider. This situation could arise in an emergency when the patient has no ability to select the emergency room, treating physicians, or ambulance providers. Surprise medical bills might also arise when a patient receives planned care from an in-network provider (often, a hospital or ambulatory care facility), but other treating providers brought in to participate in the patient’s care are not in the same network.  These can include anesthesiologists, radiologists, pathologists, surgical assistants, and others.  In some cases, entire departments within an in-network facility may be operated by subcontractors who don’t participate in the same network.1     In these non-emergency situations, too, the in-network provider or facility generally arranges for the other treating providers, not the patient.

For insured patients, the surprise medical bill can involve two components.  The first component reflects the difference in patient cost-sharing between in-network and out-of-network providers.  For example, in a managed care plan that provides coverage in- and out-of-network (sometimes called a PPO plan), a patient might owe 20% of allowed charges for in-network services and 40% of allowed charges for out-of-network services.  A second component of surprise medical bills is due to “balance billing.”  Typically health plans negotiate fee schedules, or allowed charges, with network providers that reflect a discount from providers’ full charges. Network contracts also typically prohibit providers from billing patients the difference between the allowed charge and the full charge.  Because out-of-network providers have no such contractual obligation, however, patients can be liable for the balance bill in addition to any cost-sharing that might otherwise apply.

Data on the prevalence of surprise medical bills and costs to consumers are limited.  The Affordable Care Act (ACA) requires health plans in and out of the Marketplace to report data on out-of-network costs to enrollees, though this provision has not yet been implemented.2   Research studies offer some clues as to the prevalence and cost to patients due to surprise medical bills:

  • One national survey found that 8% of privately insured individuals used out-of-network care in 2011; 40% of those claims involved surprise (involuntary) out-of-network claims. This survey found that most surprise medical bills were related to emergency care.
  • In 2011, the New York Department of Financial Services studied more than 2,000 complaints involving surprise medical bills, and found the average out-of-network emergency bill was $7,006. Insurers paid an average of $3,228 leaving consumers, on average, “to pay $3,778 for an emergency in which they had no choice.”
  • The same New York study found that 90% of surprise medical bills were not for emergency services, but for other in-hospital care. The specialty areas of physicians most often submitting such bills were anesthesiology, lab services, surgery, and radiology.  Out-of-network assistant surgeons, who often were called in without the patient’s knowledge, on average billed $13,914, while insurers paid $1,794 on average.  Surprise bills by out-of-network radiologists averaged $5,406, of which insurers paid $2,497 on average.
  • A private study of data reported by health insurers in 2013 to the Texas Department of Insurance suggest that emergency room physicians often do not participate in the same health plan networks as the hospitals in which they work. Three Texas insurers with the largest market share reported that between 41% and 68% of dollars billed by for emergency physician care at in-network hospitals were submitted by out-of-network emergency physicians.  Analysis of provider directories of these three insurers found that between 21% and 45% of in-network hospitals had no in-network emergency room physicians.

Federal and State protections against surprise medical bills

Policymakers at the federal and state level have expressed concern that surprise medical bills can pose significant financial burdens and are beyond the control of patients to prevent since, by definition, they cannot choose the treating provider.  Various policy proposals have been advanced, and some implemented, to address the problem.  These include hold harmless provisions that protect consumers from the added cost of surprise medical bills, including limits or prohibitions on balance billing.  Others include disclosure requirements that require health plans and/or providers to notify patients in advance that surprise balance billing may occur, potentially giving them an opportunity to choose other providers.

Federal policy responses

Several federal standards have been adopted or proposed to address the problem of surprise medical bills in private health plans generally, in qualified health plans offered through the Marketplace, and in Medicare.  These standards vary in scope and applicability:

  • Out-of-network emergency services (all private health plans) – The ACA requires non-grandfathered health plans, in and outside of the Marketplace, to provide coverage for out-of-network emergency care services and apply in-network levels of cost sharing for emergency services, even if the plan otherwise provides no out-of-network coverage. For example, if an HMO would normally cover 80% of allowed charges for in-network care and nothing for out-of-network care, the HMO would have to pay 80% of allowed charges for an out-of-network emergency room visit.  This provision does not, however, limit balance billing by out-of-network emergency providers.
  • Proposed changes to coverage for out-of-network non-emergency services (Marketplace plans) – Recently the Centers for Medicare and Medicaid services proposed changes to address surprise medical bills for non-emergency services for individuals covered by qualified health plans offered through the Marketplace.  Proposed standards would apply when an enrollee receives care for essential health benefits from an out-of-network provider in an otherwise in-network setting (for example, anesthesia care for surgery performed in an in-network hospital.)  Plans would be required to apply out-of-network cost sharing for such care toward the plan’s annual out-of-pocket limit for in-network cost sharing.  The proposed rule would waive this requirement whenever plans notify enrollees in writing at least 10 days in advance (for example, as part of a plan pre-authorization process) that such surprise medical bills might arise.   The proposed rule indicates that CMS may consider an alternative under which all out-of-network cost sharing for surprise medical bills would count toward the in-network OOP limit, regardless of whether the plan provides advance notification, but notes the agency is “wary of the impact of such a policy on premiums.” The proposal would not apply to balance billing charges arising from surprise medical bills.  In addition, the proposal would seem to not affect enrollees of HMO or EPO plans that do not cover non-emergency out-of-network services at all.  Such plans comprise 73% of all QHPs offered in the federal Marketplace in 2016.
  • Out-of-network services (Medicare) – Rules governing the traditional Medicare program generally limit patient exposure to balance billing, including surprise medical bills. Providers that do not participate in Medicare  are limited in the amount they can balance bill patients to no more than 15% of Medicare’s established fee schedule amount for the service.3   Since these rules were adopted in 1989, the vast majority of providers accept Medicare assignment, and beneficiary out-of-pocket liability from balance billing has declined from $2.5 billion annually in 1983 ($5.65 billion in 2011 dollars) to $40 million in 2011.  The rules are somewhat different for Medicare Advantage plans, which typically have more limited provider networks compared to traditional Medicare and which may not provide any coverage out-of-network.  For emergency services, Medicare Advantage plans must apply in-network cost sharing rates even for out-of-network providers.  Balance billing limits similar to those under traditional Medicare also apply.  For non-emergency services, enrollees in PPO plans in surprise medical bill situations would be liable for out-of-network cost sharing, but Medicare balance billing rules would still apply, while enrollees in HMO plans might not have any coverage for non-emergency out-of-network services. 

State policy responses

  • New York’s comprehensive approach to surprise medical bills – Last year a new law took effect in New York limiting surprise medical bills from out-of-network providers in emergency situations and in non-emergency situations when patients receive treatment at an in-network hospital or facility. To date, this law stands out as offering the most comprehensive state law protection against surprise medical bills.  For emergency services, patients insured by state-regulated health plans (e.g., not including self-funded employer plans) are held harmless for costs beyond the in-network cost sharing amounts that would otherwise apply.  For non-emergency care, patients who receive surprise out-of-network bills can submit a form authorizing the provider to bill the insurer directly, and then are held harmless to pay no more than the otherwise applicable in-network cost sharing.   In both situations, out-of-network providers are prohibited from balance billing the patient; although providers who dispute the reasonableness of health plan reimbursement may appeal to a state-run arbitration process to determine a binding payment amount.  The New York law applies only to state-regulated health plans.  However, patients who are uninsured or covered by self-insured group health plans may also apply to the state-run arbitration process to limit balance billing by providers under certain circumstances.
  • Limited provisions addressing surprise medical bills – A number of other states have laws limiting balance billing by out-of-network providers in certain circumstances. Some of these laws apply only to certain types of health plans (HMO vs. PPO) or only to certain types of providers or services (for example, for ambulance providers or emergency care services.)4 
  • NAIC model act – This fall, the National Association of Insurance Commissioners (NAIC) proposed changes to its health plan network adequacy model act to address surprise medical bills. NAIC model acts do not have the force of law, but often encourage state legislative action.  For example, twenty states had adopted the previous NAIC model act on network adequacy or similar laws for network-based health plans. In addition, federal health insurance laws and regulations sometimes cite NAIC model act standards.  The model act revisions would apply new standards for in-network facilities (hospitals and ambulatory care facilities) with non-participating facility based providers (such as anesthesiologists or emergency physicians).  For emergency services, state-regulated plans would be required to apply in-network cost sharing rates for surprise medical bills (extending the ACA’s requirement for non-grandfathered plans to grandfathered plans as well).  For balance billing amounts, out-of-network facility-based providers would be required to offer patients 3 choices: (1) pay the balance bill, (2) for balance bill amounts greater than $500, submit the claim to a mediation process with the provider to determine an allowed charge amount, or (3) rely on any other rights and remedies that may be available in the state.  Similar requirements would apply for non-emergency services.  In addition, health plans that require pre-authorization of facility-based care would be required to notify enrollees that surprise medical bills could arise, and plans would be required to provide enrollees with a list of facility-based providers that are participating in the plan network.  Finally, plans would be required to keep data on all requests for mediation involving surprise medical bills and, upon request, report it to the state regulator.

Discussion

Surprise medical bills can contribute significantly to financial burden and medical debt among insured individuals, though data on the incidence and impact of this problem are limited.  Federal authority to track the incidence and impact of surprise medical bills exists but has not yet been implemented.

Policy makers have considered and adopted various responses, yet tradeoffs are involved in protecting consumers from surprise bills. There is concern among some as to whether or how new consumer protections might affect insurance premiums.  Establishing requirements both on what health plans must cover and on amounts that out-of-network providers can bill can limit the impact on premiums, though providers may balk at restrictions on how much they can charge.

The problem of surprise medical bills is likely to continue, and may increase to the extent plans create narrower provider networks.  The very nature of the problem means that consumers will be hard pressed to take action to avoid surprise medical bill situations absent intervention by policy makers.

  1. Another Kaiser Family Foundation report on medical debt featured one patient who had surgery and follow-up rehab services at an in-network hospital, only to learn that the rehab floor was operated by an out-of-network subcontractor. ↩︎
  2. Transparency reporting requirements for non-Marketplace plans under Section 2715A of the ACA had an effective date of September 23, 2010.  Transparency reporting requirements for Marketplace plans under Section 1311(e) of the ACA had an effective date of January 1, 2014. ↩︎
  3. So-called non-participating Medicare providers can decide on a service-by-service basis whether to accept Medicare assignment and forego balance billing.  They are distinct from “opt-out” providers, who refuse to accept Medicare reimbursement for any patient and who are not subject to any limits on what they can charge Medicare beneficiaries. ↩︎
  4. See also Hoadley, Ahn, and Lucia, “Balance Billing: How are States Protecting Consumers from Unexpected Charges?” September 2015. ↩︎

How has the ACA Medicaid Expansion Affected Providers Serving the Homeless Population: Analysis of Coverage, Revenues, and Costs

Authors: Matt Warfield, Barbara DiPietro, and Samantha Artiga
Published: Mar 15, 2016

Executive Summary

The Affordable Care Act (ACA) Medicaid expansion to adults closed a longstanding gap in eligibility in the 32 states, including DC, that have adopted it to date, providing a new coverage option for millions of uninsured adults. In Medicaid expansion states, many people experiencing homelessness are newly eligible for coverage since this population includes many single adults who were excluded from Medicaid prior to the expansion. Coverage is particularly important for this population given that they have poor health and intensive health care and social service needs. To further understand how the first full year of Medicaid expansion has affected patients who are homeless and the providers who care for them, this analysis uses data from the Uniform Data System (UDS) for health centers1  to examine changes in insurance coverage, revenues, and costs among Health Care for the Homeless (HCH) projects serving the homeless population. Key findings include the following:

There have been significant coverage gains among patients at HCH projects since implementation of the ACA in 2014, with much larger gains among patients at HCH projects in states that expanded Medicaid compared to non-expansion states. In Medicaid expansion states, the health coverage rate for patients at HCH projects increased by 22 percentage points from 45% in 2012 to 67% during 2014, while the coverage rate increased by only 4 percentage points from 26% to 30% in non-expansion states (Figure 1). HCH projects experienced larger coverage gains among patients compared to other health centers, but their coverage rates remain lower than other health centers in 2014.

Figure 1: Percent of Patients with Insurance at HCH Projects and Other Health Centers in Expansion and Non-Expansion States, 2012-2014

HCH Projects in expansion states also had larger gains in revenue and smaller increases in costs compared to those in non-expansion states (Figure 2). In expansion states, total revenues for HCH projects in 2014 were 7% higher than total revenues in 2013. In contrast, revenues for HCH projects in non-expansion states increased marginally, rising only 2%. Conversely, total costs for HCH projects in non-expansion states were 9% higher in 2014 than 2013, compared to 3% higher for those in expansion states. HCH projects had smaller revenue and cost increases compared to other health centers in both expansion and non-expansion states.

Figure 2: Percentage Change in Revenues and Costs for HCH Projects and Other Health Centers, 2013-2014

For HCH projects in expansion states, third-party payments increased as a share of total revenue due to coverage gains among patients. With this increase, only about half (49%) of total revenue for HCH projects in expansion states came from grants in 2014. In contrast, HCH projects in non-expansion states experienced little change in third-party payments as a share of revenue and remain heavily reliant on grant funding (Figure 3).

Figure 3: Distribution of Revenues at HCH Projects by Medicaid Expansion Status, 2013-2014

The distribution of costs remained fairly stable among HCH projects in both expansion and non-expansion states. Among HCH projects in expansion and non-expansion states, medical care (medical care personnel, laboratory and x-ray, and other direct medical costs) accounted for about half of costs, clinical care (dental, mental health, substance abuse, pharmacy, vision and other services) made up about 30% of costs, and the remainder of costs were for enabling services (case management, outreach, transportation, translation and interpretation, education, eligibility assistance and other support).

In sum, HCH projects in expansion states have had larger coverage gains among patients as well as greater revenue gains and smaller increases in costs compared to those in non-expansion states, with third-party payments increasing as a share of revenue due to coverage gains among patients. Together, the coverage gains and revenue increases may facilitate broader access to services among patients and greater stability for HCH projects in expansion states. Gains in third-party revenue may also support strategic and operational improvements. Yet even with gains in third-party revenue, grant funding still remains important, particularly for services such as case management and outreach that are not reimbursed by Medicaid. HCH projects may also face new administrative challenges associated with serving an increasing share of patients with coverage. In contrast, HCH projects in non-expansion states continue to serve a largely uninsured population, experienced increased costs but little increase in revenue, and rely almost exclusively on grant funding.

Issue Brief

Introduction

The Affordable Care Act (ACA) Medicaid expansion to adults with incomes up to 138% of the Federal Poverty Level (FPL) closed a longstanding gap in eligibility for the program. As of February 2016, 32 states, including DC, have adopted the Medicaid expansion, providing a new coverage option for millions of uninsured adults. In Medicaid expansion states, many people experiencing homelessness are newly eligible for coverage, since this population includes many single adults who were excluded from Medicaid prior to the expansion. Coverage is particularly important for this population given that they have poor health and intensive health care and social service needs. 2 , 3 , 4  Gains in coverage among this population provide an opportunity to increase their access to health care services, which may contribute to improved health outcomes and increased stability in their lives. The Medicaid expansion also has implications for the health care providers who serve those experiencing homelessness. These providers include Health Care for the Homeless (HCH) projects, which are a subset of community health centers that serve this population. In addition to the services provided by other health centers, HCH projects typically offer a broader range of behavioral health care, intensive case management, and other supportive services. The Medicaid expansion offers an opportunity to increase coverage among patients served by HCH projects, which could contribute to changes in service use and costs and revenues.

To further understand how the first full year of Medicaid expansion has affected patients who are homeless and providers who care for them, this analysis uses data from the Uniform Data System (UDS) to examine differences between HCH projects in expansion and non-expansion states. The analysis examines differences in patient demographics, patient health coverage, service utilization, patient and visit volume, and costs and revenues. It also explores differences between HCH projects and other health centers serving a general, low-income population. This report builds on two previous projects that explored the early impacts of the Medicaid expansion for homeless patients and providers based on information collected through focus groups.5 ,6 

Data and Methods

This analysis was conducted by the Kaiser Family Foundation and the National Health Care for the Homeless Council based on data from the Uniform Data System (UDS) for calendar years 2013 and 2014. Analysis of health coverage of patients also includes data from calendar year 2012. All health centers report into the UDS annually. Data were separated for HCH projects and other health centers and based on the state Medicaid expansion decisions as of 2014. Data for health centers in the U.S. territories were excluded from the analysis.

Some HCH projects are stand-alone HCH projects that focus on serving only homeless patients and others are embedded within other health centers that serve the general low-income population (Table 1). For the analysis of patient demographics, service use, coverage, and patient volume, the “HCH Projects” group includes data from stand-alone HCHs and data from embedded HCH projects that are associated with serving the homeless population. Data from health centers with an embedded HCH project that is associated with serving the non-homeless population were included with data for other health centers in the “Other Health Centers” group. However, for the cost and revenue analysis, it was not possible to separate the HCH-related data from the data associated with serving the broader population for those projects embedded within other health centers. As such, for these measures, the data for “HCH Projects” only includes stand-alone HCH projects.

Table 1: Number of HCH and Other Health Centers, 2013 and 2014
Stand-alone HCHsHealth Centers with an Embedded HCH ProjectOther Health CentersTotal Health Centers
2013581889271173
2014602049851249
Source: KCMU and National Health Care for the Homeless Council analysis of 2013 and 2014 Uniform Data System data.

Findings

Patient Demographics and Service Use

There are key differences in the demographic characteristics and uninsured rate of homeless patients at HCH projects and those at other health centers. Compared to patients at other health centers, patients at HCH projects are more likely to be non-elderly adults (84% vs. 61%), Black (31% vs. 19%), male (55% vs. 42%), and to have income below poverty (89% vs. 71%). They also are more likely to be uninsured than patients at other health centers (43% vs. 27%). The difference in coverage rates reflects these other demographic differences, as women, children, and the elderly traditionally have had more expansive eligibility for Medicaid and Medicare, compared to non-elderly males.

Table 2: Demographics of Patients at HCH Projects and Other Health Centers, 2014
HCH ProjectsOther Health Centers
Age
0-1712%31%
18-6484%61%
65+4%8%
Race
White35%36%
Black31%19%
Hispanic17%25%
Other5%6%
Not Reported14%14%
Gender
Male55%42%
Female45%58%
Income
≤100% FPL89%71%
Insurance
Uninsured43%27%
Source: KCMU and National Health Care for the Homeless Council analysis of 2014 Uniform Data System data.

Mental health, substance abuse, and enabling services account for a larger share of patient visits at HCH projects compared to other health centers. Among HCH projects, mental health visits account for 15% of visits, compared to 6% in other health centers, while substance abuse services make up 7% of visits at HCH projects compared to just 1% of visits at other health centers (Figure 4).7  Similarly, enabling services, such as outreach and case management, account for a larger share of visits at HCH projects compared to other health centers (15% vs. 5%). These differences likely reflect the greater need for behavioral health treatment, outreach, and case management services for the population served by HCH projects, as well as greater availability of these services through HCH projects compared to other health centers in response to this increased patient need.

Figure 4: Distribution of Patient Visits by Service Type at HCH Projects and Other Health Centers, 2014

Health Coverage

Health coverage rates for patients at HCH projects and other health centers increased since implementation of the ACA coverage expansions in 2014, with HCH projects experiencing larger coverage gains compared to other health centers. Since 2012, the coverage rate for patients at HCH projects increased by 18 percentage points from 39% in 2012 to 57% during 2014 (Figure 5). In other health centers, the patient health coverage rate increased from 64% to 73% over the period, a 9 percentage point increase. Even with the larger increase, the health coverage rate among patients at HCH projects remains lower than that for other health centers (57% vs. 73%) in 2014.

Figure 5: Percent of Patients with Insurance at HCH Projects and Other Health Centers, 2012-2014

Increases in health coverage were larger for patients of HCH projects in Medicaid expansion states compared to those in non-expansion states. In Medicaid expansion states, the health coverage rate for patients at HCH projects increased by 22 percentage points, from 45% in 2012 to 67% during 2014, while the coverage rate increased by only 4 percentage points from 26% to 30% in non-expansion states (Figure 6). Reflecting higher initial coverage rates and this difference in coverage gains, the health coverage rate for patients at HCH projects in Medicaid expansion states was more than two times higher than the rate in non-expansion states (67% vs. 30%) in 2014. For other health centers, there were also larger gains in coverage for patients of centers in expansion states compared to non-expansion states, although the difference was not as large.

Figure 6: Percent of Patients with Insurance at HCH Projects and Other Health Centers in Expansion and Non-Expansion States, 2012-2014

Changes in coverage among HCH projects varied widely across states. Across HCH projects in expansion states, the change in the share of patients with coverage between 2013 and 2014 ranged from a 2 percentage point decrease in Minnesota and DC, which already had coverage for adults in place prior to the Medicaid expansion, to increases of at least 60 percentage points in Rhode Island and West Virginia (Figure 7 and Appendix A, Table 1). Several other states had Medicaid-funded coverage for adults prior to 2014, which may explain smaller gains in insurance, although the scope of benefits of this coverage varied.8  In non-expansion states, the change in the share of patients with coverage ranged from an 11 percentage point decrease in Alaska to a 26 percentage point increase in Kansas. This variation reflects a number of factors in addition to state Medicaid expansion decisions, including coverage in place prior to the ACA, differences in the number of HCH projects across each state, patient demographics, outreach and enrollment activities, and variation in reporting and data collection.

Figure 7: Percentage Point Change in Share of Patients With Coverage at HCH Projects Between 2013 and 2014

Medicaid comprises the majority of insurance for insured patients at HCH projects and other health centers, but plays a larger role for centers in Medicaid expansion states compared to non-expansion states. Among patients at HCH projects, over half of patients (55%) in expansion states have Medicaid coverage compared to one in five in non-expansion states (20%) (Figure 8). This disparity in Medicaid coverage rates contributes to the higher uninsured rate for patients at HCH projects in non-expansion states. A similar pattern is observed for other health centers, although the share of patients with Medicaid coverage in non-expansion states is higher in other health centers compared to HCH projects (37% vs. 20%). Other health centers also have higher rates of private and Medicare coverage compared to HCH projects, which contributes to their overall higher insurance rate.

Figure 8: Coverage Distribution of Patients at HCH Projects and Other Health Centers in Expansion and Non-Expansion States, 2014

The rate and distribution of coverage for HCH patients varies widely across states, with generally higher coverage rates among Medicaid expansion states (Figure 9 and Appendix A, Table 1). Among HCH projects in states that had not expanded Medicaid as of 2014, patient coverage rates ranged from 8% in Georgia to 58% in Pennsylvania in 2014, while patient coverage rates of HCH projects in expansion states ranged from 42% in North Dakota to 92% in Vermont. The higher patient coverage rates of HCH projects in expansion states are generally driven by larger shares of Medicaid coverage in these states.

Figure 9: Coverage Distribution of Patients at HCH Projects by State, 2014

Patient Volume

HCH projects in expansion states had a lower number of patients and patient visits in 2014 compared to 2013, while HCH projects in non-expansion states had a small increase in both patients and total patient visits (Figure 10). Other health centers had increases in patients and patient visits in both expansion and non-expansion states, with slightly larger increases in expansion states compared to non-expansion states.

Figure 10: Percentage Change in Patients and Patient Visits for HCH Projects and Other Health Centers, 2013-2014
  • HCH projects in expansion states. The number of HCH projects in expansion states increased by 6% from 156 in 2013 to 165 in 2014. However, they had a 1% decline in the number of patients, which fell from about 616,000 in 2013 to 611,000 in 2014, and a 1% decline in total patient visits, which decreased from 3.41 million to 3.36 million over the period (Appendix A, Table 2). These declines despite an increase of nine additional HCH projects may reflect some patients moving to other providers after gaining health coverage. Individuals may have sought a new provider after gaining coverage for a number of reasons, including a desire for more convenient locations and/or hours, a preference to receive care in a non-homeless-specific environment, or to seek covered services that are not offered at the HCH provider. Provider changes also may result from Medicaid auto-assigning individuals to another provider upon enrollment.
  • HCH projects in non-expansion states. The number of HCH projects in non-expansion states increased by 10% from 90 in 2013 to 99 in 2014. In contrast to HCH projects in expansion states, HCH projects in non-expansion states had a 3% increase in the number of patients, rising from about 233,000 in 2013 to nearly 240,000 in 2014. HCH projects in these states also had a slight increase in total patient visits (1%), which increased from 1.11 million to 1.12 million visits. The addition of nine new HCH projects may have contributed to these increases, but it is not possible to draw firm conclusions from these data.
  • Other health centers. The total number of patients at other health centers increased by 4% and 3% in expansion and non-expansion states, respectively. Patient visits increased by 7% in expansion states and 4% in non-expansion states. These changes, in part, reflect increases in the number of health centers in both expansion and non-expansion states. However, they may also stem from enhanced outreach and patient engagement, which was supported by increased outreach and enrollment funding provided to health centers. They also suggest that fewer patients may have left other health centers after gaining coverage compared to HCH projects, although additional research is needed to understand this finding.

Revenues and Costs

 There were larger gains in total revenue for HCH Projects in expansion states and smaller increases in costs compared to those in non-expansion states (Figure 11 and Appendix A, Table 3). Aggregate revenues for HCH projects in expansion states increased by 7%, rising from $328.9 million in 2013 to $352.4 million in 2014. In contrast, aggregate revenues for HCH projects in non-expansion states increased marginally, rising only 2% from $47.7 to $48.5 million. Conversely, costs for HCH projects in non-expansion states rose by 9%, compared to 3% for those in expansion states. Compared to other health centers, HCH projects had smaller increases in revenues and costs in both expansion and non-expansion states.

Figure 11: Percentage Change in Revenues and Costs for HCH Projects and Other Health Centers, 2013-2014

Third-party payments accounted for a larger share of revenue among HCH projects in 2014 than in 2013, but grant funding continues to play a large role for these health centers. Among HCH projects, the share of revenue coming from grants declined from 60% in 2013 to 49% in 2014, while the share of revenue from grants at other health centers remained constant at 33% (Figure 12).9  Reflecting the gains in coverage among patients at HCH projects, their share of revenue coming from third-party payments increased from 32% to 38%. However, third-party payments still account for a much smaller share of revenue among HCH projects compared to other health centers (38% vs. 59% in 2014). Even with the gains in coverage and increases in third-party payments among HCH projects, other grant funding remains important, particularly for services that are not reimbursed by Medicaid. For example, enabling services (such as case management and outreach) are vital for a patient population that is homeless, but the vast majority of states do not reimburse for these services directly.

Figure 12: Distribution of Revenues at HCH Projects and Other Health Centers, 2013-2014

Distribution of revenue by source varies widely between HCHs in expansion states and those in non-expansion states. The vast majority of revenue at HCH projects in non-expansion states comes from grants (86%), with the Bureau for Primary Health Care (BPHC) grant representing over half the budget in 2014 and third-party payments only 3% (Figure 13 and Appendix A, Table 3). In contrast, HCH projects in expansion states have more diverse funding, with grants representing about half the revenue (49%), and the BPHC grant making up 21% of the operating budget. In these states, the share of revenue coming from third-party payments from insurers rose from 36% in 2013 to 43% in 2014 as a result of coverage gains among patients. The differences in revenue distribution between HCH projects in expansion and non-expansion states reflect a myriad of state decisions regarding Medicaid and non-federal grant distribution both before and after the 2014 Medicaid expansion. Despite these differences, grant funding remains an important revenue source for all HCH projects. However, given the major role grant funding plays for HCH projects in non-expansion states, they would be the most significantly affected by any reductions in grants at the federal or state level.

Figure 13: Distribution of Revenues at HCH Projects by Medicaid Expansion Status, 2013-2014

Distribution of costs remained fairly stable among both HCH projects and other health centers. When comparing the distribution of costs by service type in 2013 to the distribution in 2014, there were only slight changes (Appendix A, Table 3). Among HCH projects, medical care (medical care personnel, laboratory and x-ray, and other direct medical costs) accounts for about half of costs, clinical care (dental, mental health, substance abuse, pharmacy, vision and other services) makes up about 30% of costs, and enabling services (case management, outreach, transportation, translation and interpretation, education, eligibility assistance and other support services) account for the remainder of costs.10  Consistent with the data showing greater use of enabling services in HCH projects, enabling services account for nearly twice the share of costs in HCH projects compared to other health centers (20% vs. 12% for expansion states and 19% vs. 9% in non-expansion states in 2014).

Conclusion

In sum, the data show that there have been significant coverage gains among patients at HCH projects since implementation of the ACA in 2014, with the largest gains among patients at HCH projects in states that have adopted the Medicaid expansion. In contrast, coverage remains very low among patients at HCH projects in non-expansion states. HCH projects in expansion states experienced small declines in their number of patients and patient visits in 2014 compared to 2013, which could reflect individuals moving to other providers after gaining coverage. HCH projects in non-expansion states saw a slight increase in total patients and patient visits.

HCH projects in expansion states also had larger revenue gains and smaller increases in costs compared to those in non-expansion states, with third-party payments increasing as a share of revenue due to coverage gains among patients. In contrast, grants remain the primary source of funding for HCH projects in non-expansion states, making them more sensitive to any reductions in federal or state grants. Across all HCH projects, however, grant funding remains important, particularly since many enabling and supportive services that are important for serving the population experiencing homelessness generally are not reimbursable through Medicaid. The distribution of costs by service type at HCH projects remained fairly stable between 2013 and 2014 in both expansion and non-expansion states. Consistent with the data showing greater use of enabling services in HCH projects compared to other health centers, these services account for nearly twice the share of total costs in HCH centers compared to other health centers.

Together, the changes among HCH projects in Medicaid expansion states may facilitate broader access to services among patients and greater financial stability for homeless providers. Gains in third-party revenue may also support strategic and operational improvements. However, HCH projects face new challenges associated with serving an increasing share of patients with coverage, including negotiating payments; credentialing providers; improving coding, billing, and quality outcome practices; increasing referrals for specialty care; and tracking client Medicaid enrollment status. Increased coverage among HCH patients may also contribute to new connections between homeless providers, hospital systems, and insurance plans, which may lead to an increased focus on the role that housing and housing-related support services play with regard to health outcomes, service utilization, and system costs.

In contrast, there has been little change for HCH projects in non-expansion states. While much of the health care system focuses on the opportunities for those newly insured, HCH projects in these states continue to serve a largely uninsured population and rely heavily on federal and non-federal grants to provide services. While HCHs and other health centers in these states provide services to individuals regardless of ability to pay or insurance status (as required by federal law), this patient population does not benefit from the broader services available through Medicaid, particularly specialty care and hospitalizations. Over time, there may be increasing disparities in health outcomes, overall system costs, and service utilization for people who are homeless in states that have expanded Medicaid compared to those in states that have not.

This brief was prepared by Matt Warfield and Barbara DiPietro of the National Health Care for the Homeless (HCH) Council and Samantha Artiga with the Kaiser Family Foundation. National HCH Council staff time for their work with the Council is supported by the Health Resources and Services Administration (HRSA) of the U.S. Department of Health and Human Services (HHS) under grant number U30CS09746, a National Training and Technical Assistance Cooperative Agreement for $1,625,741, with 0% match from nongovernmental sources. This information or content and conclusions are those of the authors and should not be construed as the official position or policy of, nor should any endorsements be inferred by HRSA, HHS or the U.S. Government.

Appendices

Appendix A, Table 1: Health Coverage Distribution of Patients at HCH Projects, 2013-2014
 MedicaidOther PublicPrivateUninsured
 2013 2014 Percentage Point Change2013 2014 Percentage Point Change2013 2014 Percentage Point Change2013 2014 Percentage Point Change
States that Had Expanded as of 2014
Arkansas3%29%26%4%3%-1%1%15%14%91%53%-38%
Arizona28%55%27%8%7%-1%6%7%1%59%31%-27%
California34%53%18%12%9%-3%2%3%1%51%35%-16%
Colorado25%58%33%5%8%2%1%1%0%69%34%-35%
Connecticut56%63%8%8%9%1%5%6%1%31%22%-10%
District of Columbia64%59%-5%12%14%2%1%3%2%23%25%2%
Delaware38%54%16%6%6%1%5%5%-1%52%35%-16%
Hawaii62%64%2%8%9%1%4%4%0%26%23%-3%
Iowa32%50%18%6%6%0%8%12%4%55%32%-22%
Illinois32%51%19%5%6%0%4%5%1%59%38%-21%
Kentucky12%43%31%6%6%1%2%4%2%81%46%-35%
Massachusetts57%63%7%19%18%0%3%4%1%22%15%-7%
Maryland22%74%52%7%8%1%0%0%0%71%18%-54%
Michigan41%51%10%6%7%1%6%7%1%47%35%-12%
Minnesota67%65%-2%7%6%-1%1%2%1%25%27%2%
North Dakota17%15%-2%5%5%-1%6%23%17%73%58%-15%
New Hampshire15%32%17%9%12%3%2%8%7%75%47%-27%
New Jersey28%51%22%4%5%1%5%6%1%62%37%-25%
New Mexico12%39%27%2%6%3%6%6%-1%80%50%-30%
Nevada12%33%21%3%6%2%10%6%-4%74%55%-19%
New York57%61%4%6%6%1%4%4%0%33%29%-4%
Ohio18%45%26%5%6%1%1%2%0%75%48%-27%
Oregon28%53%25%10%8%-2%3%3%0%59%36%-23%
Rhode Island16%71%55%4%7%2%3%6%3%77%17%-60%
Vermont70%74%4%12%13%1%6%5%-1%13%8%-4%
Washington45%65%20%8%8%0%3%6%3%45%21%-24%
West Virginia1%62%60%0%1%1%0%0%0%98%37%-61%
States that Had Not Expanded as of 2014
Alaska20%18%-3%21%13%-8%7%7%0%51%62%11%
Alabama14%16%2%4%4%0%2%2%0%80%78%-2%
Florida19%18%-1%5%7%2%2%3%1%74%72%-2%
Georgia2%5%3%2%2%1%0%1%1%96%92%-4%
Idaho7%8%1%6%4%-2%1%2%1%86%86%0%
Indiana20%30%10%3%4%1%1%3%2%76%62%-13%
Kansas14%40%25%1%2%1%2%3%0%82%56%-26%
Louisiana52%44%-8%3%4%1%5%6%1%40%46%6%
Maine28%28%0%8%7%-1%2%3%0%62%62%1%
Missouri19%21%2%4%6%2%4%7%3%73%66%-7%
Mississippi29%22%-7%6%5%-1%8%17%9%57%56%-1%
Montana12%14%2%6%9%3%17%4%-13%65%73%8%
North Carolina16%20%4%9%8%-1%7%9%2%68%62%-5%
Nebraska6%7%1%3%3%0%1%2%1%90%88%-2%
Oklahoma7%14%6%3%4%1%0%2%2%90%81%-9%
Pennsylvania44%46%2%8%8%0%3%4%0%45%42%-2%
South Carolina18%20%2%9%10%1%9%10%1%65%60%-4%
South Dakota15%12%-3%3%4%1%4%5%1%78%79%2%
Tennessee10%15%4%5%6%1%2%3%1%83%76%-7%
Texas10%13%3%3%4%1%1%2%1%86%82%-4%
Utah22%29%7%4%5%0%0%0%0%74%67%-7%
Virginia6%7%1%6%6%1%6%10%4%82%77%-5%
Wisconsin26%32%6%1%5%5%0%3%2%73%59%-13%
Wyoming4%3%-1%7%6%-1%0%2%2%89%89%0%
SOURCE: KCMU and National Health Care for the Homeless Council analysis of 2013-2014 Uniform Data System data.


Appendix A, Table 2: Patient Volume at HCH Projects and Other Health Centers by State Medicaid Expansion Status, 2013-2014
HCH ProjectsOther Health Centers
 Expansion StatesNon-Expansion StatesExpansion StatesNon-Expansion States
 20132014% Change20132014% Change20132014% Change20132014% Change
Number of Centers1561656%909910%5886327%5275576%
Patients (millions)0.620.61-1%0.230.243%13.213.74%7.77.93%
Patient Visits (millions)3.413.36-1%1.111.121%52.556.37%26.727.84%
NOTE: For embedded HCH Projects, data associated with the HCH project was included in the HCH Projects group and data associated with serving the broader population was included in the Other Health Centers group. Because they have data included in both categories, embedded HCH projects are included in the count of the number of centers for both the HCH Projects and Other Health Centers. As a result, the sum of the number of centers in this table is greater than the total number of centers for each year. In 2013, there were a total of 1,173 health centers, including 188 embedded HCH projects; in 2014, there were a total of 1,249 health centers, including 204 embedded HCH projects.

SOURCE: KCMU and National Health Care for the Homeless Council analysis of 2013 – 2014 Uniform Data System data.


Appendix A, Table 3:Costs and Revenues at Health Care for HCH Projects and Other Health Centers by State Medicaid Expansion Status, 2013-2014
HCH ProjectsOther Health Centers
 Expansion StatesNon-Expansion StatesExpansion StatesNon-Expansion States
 20132014% Change20132014% Change20132014% Change20132014% Change
Number of Centers43442%15167%5886327%5275576%
Costs (millions)$328.4$339.23%$42.3$469%$10,234.4$11,477.512%$4,821.7$5,346.211%
Medical Care53%50%52%52%62%61%63%61%
Clinical27%30%31%29%27%28%29%30%
Enabling Services19%20%17%19%12%12%8%9%
Revenues (millions)$328.9$352.47%$47.7$48.52%$10,453.4$11,871.114%$4,844.5$5,444.512%
BPHC Grant19%21%60%54%14%14%24%25%
Other Federal Grants5%4%4%5%3%2%3%3%
Non-Federal Grants31%24%20%27%14%12%12%12%
Third Party Payments36%43%5%3%59%63%49%49%
Self-Pay2%1%2%1%5%4%8%8%
Other8%8%9%10%4%4%3%3%
NOTES: Data for HCH Projects only includes stand-alone HCH projects. All data for embedded HCHs is included with the Other Health Centers group because data for the HCH Project could not be separated from other health center data. Medical care includes costs for medical care personnel; laboratory and X-ray; and other direct medical care costs (e.g., staff recruitment, equipment depreciation, medical supplies, professional dues and subscriptions, continuing medical education and travel associated with CME). Other clinical care includes staff and related costs for dental, mental health, substance abuse, pharmacy, vision, and services rendered by other professional personnel (e.g., chiropractors, naturopaths, occupational and physical therapists, speech and hearing therapists, and podiatrists). Enabling services includes staff and related costs for case management, outreach, transportation, translation and interpretation, education, eligibility assistance—including pharmacy assistance program eligibility, environmental risk reduction, and other services that support and assist in the delivery of primary care and facilitate patient access to care.

SOURCE: KCMU and National Health Care for the Homeless Council analysis of 2013 – 2014 Uniform Data System data.

Endnotes

  1. Health centers are funded through the Health Resources and Services Administration at the U.S. Department of Health and Human Services. HRSA-funded health centers provide preventive and primary health care to patients regardless of their ability to pay. ↩︎
  2. Fazel, S., Geddes, JR, Kushel, M. (October 2104.) “The health of homeless people in high-income countries: descriptive epidemiology, health consequences, and clinical and policy recommendations.” The Lancet 384 (9953), 1529 – 1540. Available at: http://www.thelancet.com/journals/lancet/article/PIIS0140-6736(14)61132-6/abstract ↩︎
  3. O’Connell, J.J. (Ed.) (2004.) “The health care of homeless persons: A manual of communicable diseases and common problems in shelters and on the streets.” The Boston Heath Care for the Homeless Program. Available at: http://www.bhchp.org/health-care-homeless-persons. ↩︎
  4. Morrison, D.S. (2009.) “Homelessness as an independent risk factor for mortality: Results from a retrospective cohort study.” International Journal of Epidemiology, 28(3), 877-883. ↩︎
  5. Kaiser Family Foundation (September 2012). Medicaid Coverage and Care for the Homeless Population: Key Lessons to Consider for the 2014 Medicaid Expansion. Available at: https://modern.kff.org/health-reform/report/medicaid-coverage-and-care-for-the-homeless/ ↩︎
  6. Kaiser Family Foundation (November 2014). Early Impacts of the Medicaid Expansion for Homeless Population. Available at: https://modern.kff.org/uninsured/issue-brief/early-impacts-of-the-medicaid-expansion-for-the-homeless-population/ ↩︎
  7. HCH grantees are required to offer substance abuse services, unlike other health centers. Client need together with this requirement likely explains the difference. ↩︎
  8. Kaiser Family Foundation (January 2013).  Getting into Gear for 2014: Findings from a 50-State Survey of Eligibility, Enrollment, Renewal, and Cost-Sharing Policies in Medicaid and CHIP, 2012–2013 Available at: https://modern.kff.org/wp-content/uploads/2013/05/8401.pdf. ↩︎
  9. Revenue categories include the following: BPHC grants are Public Health Service Act, Section 330 grants from the Bureau of Primary Health Care (BPHC) at the Health Resources and Services Administration (HRSA) within the U.S. Department of Health and Human Services; other federal grants include Ryan White program funds, Medicare and Medicaid electronic health record incentive grants, and other federal grants drawn from the U.S. Treasury; non-federal grants include state and local government grants and contracts, indigent care programs, and foundation or private grants and contracts; third party payments are patient-related payments that include Medicaid, Medicare, other public payments, which includes CHIP, family planning programs, and State insurance programs, and private payments, which are payments made by commercial insurers; self-pay is where the patient makes payment on their own. Other revenue includes revenue not related to charge-based services or grants, which may include fund-raising, rent from tenants, and medical record fees. ↩︎
  10. Medical care includes costs for medical care personnel; laboratory and X-ray; and other direct medical care costs (e.g., staff recruitment, equipment depreciation, medical supplies, professional dues and subscriptions, continuing medical education and travel associated with CME). Other clinical care includes staff and related costs for dental, mental health, substance abuse, pharmacy, vision, and services rendered by other professional personnel (e.g., chiropractors, naturopaths, occupational and physical therapists, speech and hearing therapists, and podiatrists). Enabling services includes staff and related costs for case management, outreach, transportation, translation and interpretation, education, eligibility assistance—including pharmacy assistance program eligibility, environmental risk reduction, and other services that support and assist in the delivery of primary care and facilitate patient access to care. ↩︎

Streamlining Medicaid Home and Community-Based Services: Key Policy Questions

Authors: Mary Sowers, Henry Claypool, and MaryBeth Musumeci
Published: Mar 11, 2016

Executive Summary

Medicaid’s current home and community-based services (HCBS) programs represent a 35 year incremental approach to system design. Since the early 1980s, Congress has amended the law numerous times, seeking to ameliorate the program’s institutional bias by creating new authorities and incentives for states to offer HCBS. While substantially increasing beneficiary access to HCBS, these initiatives also have resulted in a patchwork of options, contributing to administrative complexity for states and confusion for individuals seeking services. Recently, policymakers have begun discussing how states and beneficiaries might be helped by a streamlined Medicaid state plan authority. This issue brief draws on features of the various existing Medicaid HCBS programs to identify key policy questions raised by initiatives to streamline Medicaid HCBS. These include:

  • How would financial eligibility for HCBS be determined?
  • How would states manage program enrollment?
  • How would beneficiaries functionally qualify for services?
  • How would HCBS be incentivized?
  • How would the program be administered, monitored, and evaluated?

Streamlining Medicaid HCBS might alleviate some of the complexity and administrative costs associated with the program and support further progress in increasing beneficiary access to HCBS. The existing Section 1915(i) option for states to provide HCBS as Medicaid state plan benefits, as amended by the Affordable Care Act, has streamlined some program elements, such as the menu of available services. States’ experiences with implementing Section 1915(i), instead of offering HCBS through waivers, can inform the design of a streamlined HCBS option. Any changes to Medicaid HCBS programs will have to address how to ensure adequate financing, which is central to any streamlining effort, and how to manage program enrollment over time. Next steps in streamlining Medicaid HCBS could include engaging a variety of stakeholders; considering options to address potential concerns; and exploring financing mechanisms and the federal and state fiscal implications of a streamlined program.

Issue Brief

Introduction

In the early decades of the Medicaid program, institutional care was the dominant form of long-term services and supports (LTSS), with home and community-based services (HCBS) becoming increasingly available over time. State Medicaid programs are required to cover nursing facility services, while most HCBS are provided at state option. This effectively establishes an institutional bias within the Medicaid program, which federal and state policymakers have been working to address in recent decades. Since the early 1980s, Congress has amended federal Medicaid law numerous times, seeking to ameliorate the program’s institutional bias by creating new authorities and incentives for states to offer HCBS. These initiatives have resulted in a patchwork of options, each with its own review and approval processes, financial and functional eligibility criteria, available services, reporting requirements, quality measures, and other features.

While substantially increasing beneficiary access to HCBS over the last several decades, this piecemeal approach has contributed to administrative complexity for states. To provide services to a variety of populations, states combine multiple authorities, administer different sets of eligibility rules, and oversee distinct quality measures for each HCBS option. States also face fiscal pressures that drive a desire to control costs by limiting program enrollment and/or placing utilization controls on services.

The current Medicaid HCBS system also creates confusion for individuals in need of services. Those seeking services for the first time are typically unfamiliar with the program’s complexities and may have to navigate different sets of requirements and determine which pathway leads to the benefit package that best meets their needs. One benefit package may include supports such as personal care targeted to people with physical limitations, while specialty behavioral health services may be available through a separate benefit package. If different services are offered through distinct programs, people with multiple needs may have to choose which services to pursue and which to forgo.

Recently, policymakers have begun discussing how states and beneficiaries might be helped by a streamlined Medicaid state plan authority that consolidates features of the various existing HCBS options. The President’s FY 2016 and FY 2017 budgets both proposed an eight year pilot program for up to five states to create a comprehensive Medicaid state plan option that would provide equal access to institutional care and HCBS, seeking to end institutional bias and simplify state administration.1   In February, 2016, the Bipartisan Policy Center released initial recommendations to improve long-term care financing, which include combining the various existing Medicaid HCBS authorities into a single streamlined state plan option to incentivize states to expand HCBS.2   Also in February, 2016, the Long-Term Care Financing Collaborative issued a consensus framework for long-term care financing reform, which proposes changes related to Medicaid LTSS eligibility and financing.3   This issue brief draws on features of existing Medicaid HCBS programs from the last 35 years and identifies key policy questions raised by initiatives to streamline Medicaid HCBS, ameliorate institutional bias, and promote administrative simplification.

Background

The Need for HCBS

HCBS help people with functional limitations meet self-care and household activity needs and gain access to and engage in their communities. These services are used by people of all ages with a range of disabilities and chronic conditions.4   People who need HCBS include those with physical disabilities such as multiple sclerosis or spinal cord injuries, cognitive disabilities such as dementia, intellectual or developmental disabilities (I/DD) such as Down’s syndrome or autism, and behavioral health disabilities such as serious mental illness. HCBS include a range of services, such as habilitative services, adult day health care programs, home health aide services, personal care services, assistive technology, and case management services.5 

With impending demographic shifts in the U.S., the need for HCBS is expected to increase exponentially over the coming decades. Population estimates project that the number of people over age 65 will more than double, and the number of people over age 85 will more than triple by 2050 (Figure 1). Just under half (46%) of seniors living in the community report that they need assistance with self-care or household activities.6   This population is at risk of institutionalization if their needs are not adequately supported in the community. About one-third (32%) of this group may have dementia, adding further complexity to meeting their needs.7    In addition, one-third of seniors who have LTSS needs live alone,8  making it less likely that family caregivers are available to meet all of their needs.

Figure 1: The 65 and Over Population Will More Than Double and the 85 and Over Population Will More Than Triple by 2050

In addition to supporting seniors with functional limitations, HCBS play an important role for non-elderly people with disabilities living in the community. Advances in medical science and technology are enabling many people with disabilities to live longer and more independently than ever before. As of 2010, nearly 57 million people, or 18.7% of people living in the community, have some type of disability, such as a communication, mental, or physical limitation.9   Over 38 million people, or 12.6% of those living in the community, have a disability that is considered severe.10   Forty percent of working age adults with a disability were employed in 2010, compared to nearly 80% of working age adults without disabilities.11   HCBS are essential to helping people with disabilities move from institutions to the community. These services also can be used to prevent institutionalization by providing appropriate supports in the community that delay or avoid further declines in functioning. Additionally, HCBS help ensure that people with disabilities are fully integrated into community life by providing services like supported housing and supportive employment.12 

Medicaid’s Role in Financing HCBS

In addition to covering medical care, Medicaid has developed into the nation’s single largest payer for both institutional and community-based LTSS, funding over half of these services in 2014 (Figure 2). As federal and state policymakers continue to develop reforms to overcome the institutional bias built into the law, the share of Medicaid LTSS spending devoted to HCBS instead of institutional care has been steadily increasing in recent decades (Figure 3). This development has been spurred by beneficiary preferences for HCBS, the typically lower cost of HCBS relative to institutional care, and the Supreme Court’s 1999 Olmstead decision, which found that the unjustified institutionalization of people with disabilities is discrimination under the Americans with Disabilities Act.13 

Figure 2: Medicaid is the Primary Payer for Long-Term Services and Supports, 2014
Figure 3: Medicaid LTSS Spending is Increasingly Devoted to HCBS as Opposed to Institutional Care

While 2013 marked the first time that the share of Medicaid LTSS spending devoted to HCBS exceeded the share devoted to institutional spending, access to HCBS is inconsistent among beneficiary populations. Among Medicaid beneficiaries receiving LTSS, 80 percent of non-elderly people with disabilities lived in the community in 2011, while only half of seniors did so (Figure 4). For people with I/DD, the share of Medicaid LTSS dollars devoted to HCBS exceeded the share spent on institutional care as early as 2002,14  over a decade before the Medicaid LTSS spending balance for all populations tipped toward HCBS. With substantial shares of Medicaid beneficiaries who use LTSS remaining in institutions and variation among states and populations, the need to continue to increase access to HCBS remains.

Figure 4: Among Beneficiaries Who Use LTSS, a Larger Share of Non-Elderly People with Disabilities Live in the Community Than Seniors

Existing Medicaid HCBS Authorities

An institutional bias remains inherent in the Medicaid statute. Since the program’s inception in 1965, Medicaid has required states to cover nursing facility services to address the LTSS needs of seniors and people with disabilities. Authority to cover intermediate care facility services for people with intellectual and developmental disabilities (ICF/ID) was added in 1971; while ICF/ID services are optional, all states cover the ICF/ID benefit. By contrast, most Medicaid HCBS (with the exception of home health services) are provided at state option.

Over the last 35 years, Congress has amended federal Medicaid law numerous times, creating a patchwork of options for states to offer HCBS (Table 1).15   Some of these authorities are permanent, while others have been time-limited programs. The earliest of these efforts was the addition of authority for HCBS waivers through Section 1915(c) of the Social Security Act in 1981, and this program remains the primary vehicle through which states deliver HCBS today (Figure 5). These waivers authorize states to provide services that are non-medical in nature, such as personal care services, adult day health services, habilitation services, and respite care, to beneficiaries who would otherwise require institutional care. As of 2012, nearly 300 of these waivers in 47 states and DC served 1.5 million beneficiaries.16   Unlike services provided through Medicaid state plan authorities, waiver enrollment can be capped; as of 2014, over 580,000 people in 39 states were waiting for Medicaid home and community-based waiver services.17   States also provide HCBS through Medicaid state plan authorities:  in 2012, 764,000 beneficiaries in 50 states and DC received home health services and 945,000 beneficiaries in 32 states received personal care services through the state plan option.18 

Figure 5: Section 1915(c) Waivers Account for the Largest Share of Medicaid HCBS Enrollment and Expenditures, 2012

Most recently, the Affordable Care Act (ACA) offered states new and expanded options to provide HCBS.19   These include an amended version of the Section 1915(i) HCBS state plan option and the creation of the Community First Choice (CFC, or Section 1915(k)) state plan option. Section 1915(i) enables states to offer HCBS as part of the state plan benefit package instead of through a waiver. The service options are the same as those available under Section 1915(c) waivers but unlike waivers, can be provided to beneficiaries with functional limitations that are less stringent than what is required for an institutional level of care. This means that states can offer HCBS through Section 1915(i) as preventive services to avoid or delay the need for more intensive or costly services in the future. Many states use Section 1915(i) to target services to specific populations, such as people with significant mental health needs. Seventeen states include Section 1915(i) services in their Medicaid state plan benefit package as of October 2015,20  and five states reported plans to implement Section 1915(i) in FY 2016.21   CFC allows states to provide attendant care services and supports and receive six percent enhanced federal matching funds. Five states have adopted CFC as of December 2015,22  and four states reported plans to implement CFC in FY 2016.23 

Other HCBS authorities have fallen out of use or are not used by any states. For example, although nearly all states offer beneficiaries the ability to self-direct their services, few states presently use the Section 1915(j) option to authorize self-directed personal care services because these features are now available through other Medicaid authorities. Only one state uses Section 1929 waiver authority to offer HCBS, without full Medicaid benefits, to seniors with functional disabilities.24    No state uses Section 1915(d) waiver authority for seniors who require institutional care or Section 1915(e) waiver authority for young children with HIV or drug dependency at birth who are receiving adoption or foster care assistance.

States can choose to extend eligibility for most HCBS up to a federal maximum of 300% of the federal benefit rate for Supplemental Security Income (SSI, $26,388 per year for an individual in 2016) (Figure 6).25   This maximum applies to Section 1915(c) HCBS waivers, the Section 1915(i) HCBS state plan option, and CFC attendant care services and supports. Under the Section 1915(i) state plan option, states can choose to cover people up 150% FPL ($17,820 per year for an individual in 2016), including those who are not otherwise eligible for Medicaid, and/or people who would be eligible for Medicaid through an existing HCBS waiver with income below 300 percent of SSI. Financial eligibility for CFC goes up to 150% FPL with an additional state option to provide services to people above 150% FPL, up to the state’s income limit for nursing facility services (which could be as high as 300% of SSI).

The maximum financial eligibility limits for traditional Medicaid state plan services, which include some HCBS such as home health and personal care, are lower (Figure 6). Seniors and people with disabilities who qualify for SSI (75% FPL, or $8,796 per year in 2016) automatically receive Medicaid in most states.26   As of 2015, 21 states have opted to expand eligibility for seniors and people with disabilities beyond the SSI limit, up to a federal maximum of 100% FPL ($11,880 per year for an individual in 2016).27   In states that have adopted the ACA’s Medicaid expansion, non-elderly people with disabilities may qualify as expansion adults up to 138% FPL ($16,394 per year for an individual in 2016).28 

Figure 6: Maximum Annual Medicaid Financial Eligibility Levels, 2016

States generally retain the option to use asset limits in disability-related pathways, although the newer Section 1915(i) independent pathway to Medicaid eligibility does not include an asset test. Most states apply asset limits to eligibility pathways associated with HCBS. They generally use the SSI program limits of $2,000 for an individual and $3,000 for a couple. An exception is the Section 1915(i) authority, which as amended by the ACA, allows states to create a new coverage group with access to full Medicaid state plan benefits and state plan HCBS without an asset limit for people with incomes up to 150% FPL.29 

Table 1: Selected Social Security Act Provisions Authorizing Medicaid Home and Community-Based Services
ProvisionType of Authority:DescriptionEnrollment Cap Allowed:FinancingState Take-Up
State Plan OptionWaiverYesNo
Section 1915(c)XExpands financial eligibility using institutional rules and authorizes HCBS for people who need institutional level of careXRequires federal cost neutralityAs of 2012, nearly 300 waivers in 47 states and DC  serve 1.5 million beneficiaries
Section 1915(d)XAuthorizes HCBS for seniors who need institutional level of careXComplex cost test requiredNo state uses
Section 1915(e)XAuthorizes HCBS for children under age 5 receiving federal adoption or foster care assistance and who have AIDS or were drug-dependent at birth and likely to require institutional level of careX No state uses
Section 1915(i)XAuthorizes the same HCBS as available under Section 1915(c) waivers. Requires less than institutional level of care. Services can be targeted to populations.X* As of Oct. 2015, 17 states adopted
Section 1915(j)XAuthorizes self-directed personal care services.X As of 2014, 5 states use**
Section 1915(k)XAuthorizes attendant care services and supports for people who need institutional level of careX6% enhanced FMAPAs of Dec. 2015, 5 states adopted
Section 1929XAuthorizes HCBS (but not full Medicaid state plan benefits) for functionally disabled seniorsX Used by 1 state (TX)
Section 1930XAuthorized HCBS for people with I/DD, did not tie eligibility to institutional level of careX Provision expired, was used by 8 states for less than 5 years
Section 1115XAllows HHS Secretary to approve experimental, pilot or demonstration projects that further purposes of Medicaid program.XMust be budget neutral to federal governmentAs of 2014, 12 states use these waivers to deliver HCBS through capitated managed care
NOTES: *Under § 1915(i), states can constrict functional eligibility criteria if their projected number of individuals expected to receive services is exceeded. **Most states offer self-directed HCBS through authorities other than § 1915(j). SOURCES: Kaiser Commission on Medicaid and the Uninsured, Medicaid Home and Community-based Services Programs:  2012 Data Update (Nov. 2015); State Health Facts, Section 1915(i) Home and Community-based Services State Plan Option (Oct. 2015); State Health Facts Section 1915(k) Community First Choice State Plan Option (Dec. 2015); Kaiser Commission on Medicaid and the Uninsured, Key Themes in Capitated Managed Long-Term Services and Supports Waivers (Nov. 2014); Jane, K., Traylor, C., Ghahremani, K., Texas Medicaid and CHIP in Perspective. 10th ed. (Feb. 2015); Gettings, Robert M., Forging a Federal-State Partnership: A History of Federal Developmental Disability Policy. AAIDD, NASDDDS (2011).

Over the years, Congress also has authorized time-limited grant programs that have enabled states to increase beneficiary access to HCBS with enhanced federal matching funds and other features. These include the Real Choice Systems Change grants, the Money Follows the Person (MFP) demonstration, and the Balancing Incentive Program (BIP) (Table 2). Real Choice Systems Change grants were made available following the Olmstead decision to expand HCBS. MFP helps states transition beneficiaries from institutions to the community. From 2008 to mid-2015, over 52,000 beneficiaries nationally have moved from institutions to the community with the help of MFP enhanced federal matching funds.30   BIP has provided enhanced federal matching funds to 18 states that were spending less than half of their LTSS dollars on HCBS in 2009 to increase access to HCBS through structural reforms.31 

Table 2: Selected Grant Programs Aimed at Enhancing and Expanding Medicaid Home and Community-Based Services
Grant TitleYears AuthorizedDescriptionFunding AvailableState Participation
Real Choice Systems Change GrantsFY2001 – FY2010From 2001 through 2004, grants were intended to jump start new initiatives, supplement existing initiatives to increase their scope, and support states that had historically had less developed HCBS systems. Grants were typically directed at one or more aspects of a state’s HCBS system rather than promoting more comprehensive reform. Beginning in 2005, fewer grants were awarded, but the grant award amounts were larger, to promote more comprehensive systems change.Between FY 2001 and FY 2010, CMS awarded 352 grants in 39 categories totaling approximately $288,586,710.Grants were awarded in all 50 states and the District of Columbia.
Money Follows the Person DemonstrationFY2007 – FY2016*MFP provides states with enhanced federal Medicaid matching funds for 12 months for each beneficiary who transitions from an institution to the community, as well as administrative support and funding for services not otherwise covered.$1.75 billion was appropriated for FY 2007-2011, and an additional $2.25 billion ($450 million for each FY 2012-2016) was appropriated when the program was extended.In 2015, 43 states and the District of Columbia were participating in MFP.
Balancing Incentive ProgramFY2011 – FY2015BIP offers enhanced federal matching funds for Medicaid HCBS for states that spent less than half of their LTSS dollars on HCBS in FY2009. Participating states must implement 3 structural reforms (no wrong door/single entry point system, conflict-free case management, universal needs assessment).$3 billion in enhanced Federal matching funds appropriated.21 states approved (13 continuing beyond Sept. 2015, through extension for use of existing funds).
NOTE: *CY2016 is the last year states can request MFP funding, but states have until 2018 to use funds for institutional to community transitions and until 2020 to use funds to support participants in home and community-based settings post-transition. SOURCES:  CMS, Real Choice System Change Grant Program, available at https://www.medicaid.gov/medicaid-chip-program-information/by-topics/long-term-services-and-supports/balancing/real-choice-systems-change-grant-program-rcsc/real-choice-systems-change-grant-program-rcsc.html; Kaiser Commission on Medicaid and the Uninsured, Money Follows the Person:  A 2015 State Survey of Transitions, Services, and Costs (Oct. 2015), available at https://www.kff.org/medicaid/report/money-follows-the-person-a-2015-state-survey-of-transitions-services-and-costs/; Kaiser Commission on Medicaid and the Uninsured, Medicaid Balancing Incentive Program:  A Survey of Participating States (June 2015), available at https://www.kff.org/medicaid/report/medicaid-balancing-incentive-program-a-survey-of-participating-states/; Kaiser Family Foundation, State Health Facts, Balancing Incentive Program (Oct. 2015), available at https://www.kff.org/medicaid/state-indicator/balancing-incentive-program/.

While states have reported success with both programs, BIP funding expired in 2015, and MFP funding is set to expire in 2016. Although states can continue to transition beneficiaries under MFP through 2018, and have until 2020 to use remaining program funds, states may be unable to continue their transition programs at current service levels and with existing staffing once federal funding expires.32   For example, MFP funds pre- and post-transition services that may not otherwise be available through Medicaid (such as security and utility deposits and other household set-up costs) as well as housing and outreach staff to help facilitate institutional to community moves. While states participating in BIP report that the program is helping to achieve their goal of rebalancing LTSS in favor of HCBS, by building on existing HCBS options and standardizing the infrastructure that facilities beneficiary access to HCBS, they also cited the relatively short implementation timeframe for the program as a challenge, given the significant structural reforms (no wrong door/single entry point system, core standardized assessment, conflict-free case management) required.33 

In addition to the authorities described above, states have designed Section 11115 demonstrations that they believe may tip the balance of LTSS spending toward HCBS. For example, a sizeable number of states (17 in FY 2015, and 19 in FY 2016) report that they expect incentives built into their managed care programs to increase the availability of HCBS relative to institutional care.34   As of 2014, 12 states used Section 1115 demonstrations to provide LTSS through capitated managed care, with three states (AZ, RI, VT) now providing all home and community-based waiver services through Section 1115 instead of Section 1915(c).35   Other states are using Section 1115 authority to provide HCBS on a fee-for-service (FFS) basis. Minnesota has a Section 1115 demonstration that expands access to Section 1915(i) and CFC services as a means of preventing beneficiaries from requiring future institutional care,36  while Washington has a Section 1115 demonstration application pending with CMS that would expand HCBS while limiting access to nursing facility services.37 

Key Policy Questions in Streamlining Medicaid HCBS

Policymakers have begun discussing streamlining Medicaid HCBS as a next step in expanding beneficiary access to community-based care. Continuing to improve access to HCBS is important as the demographics shift toward an aging population and medical and technological advances enable people with disabilities to live longer and more independently than ever before. Streamlining seeks to reduce the complexity experienced by states in administering and individuals and their families in navigating the array of programs that have emerged from a 35 year incremental approach to system design. Streamlining also would build on recent policy initiatives in other parts of the Medicaid program, such as the ACA’s enrollment simplification provisions and CMS’s final rule defining home and community-based settings across authorities for Medicaid funding purposes. Potential obstacles to streamlining include how to finance community-based services for eligible beneficiaries and how to manage program enrollment given state budgetary pressures. The rest of this brief discusses key policy questions raised by streamlining Medicaid HCBS and some of the challenges facing states, beneficiaries, and other stakeholders in implementing such an approach.

How Would Financial Eligibility for HCBS Be Determined?

Financial eligibility limits vary among the existing Medicaid HCBS authorities, and in some instances, people must have less income to qualify for HCBS than for institutional care. States choose which optional coverage groups to include in their programs and determine the income and asset limits for each group. The current variation in financial eligibility rules across HCBS authorities makes these programs complex for states to administer and beneficiaries to navigate. Additionally, if financial eligibility rules for HCBS are stricter than the rules to qualify for institutional care, people who can no longer live in the community without services may need to go into a nursing facility to receive services if HCBS are not available to them, even if they prefer to remain at home given a choice of setting. Once in an institution, returning to the community becomes more difficult as time passes, community-based housing is lost, and other community connections and supports are no longer maintained. While most states presently choose to use the same financial eligibility limit for Section 1915(c) HCBS waivers as for nursing facility and other institutional services, 25% of HCBS waiver programs in 2014 used more restrictive financial eligibility limits than the limit used for nursing facility services.38   A similar disincentive for HCBS can result if states implement Section 1915(i) HCBS or CFC attendant care services up to 150% FPL, while using higher financial eligibility rules to qualify for institutional care.

Streamlining Medicaid HCBS could address these challenges by aligning financial eligibility rules among the various HCBS eligibility pathways and between HCBS and institutional long-term care. For example, streamlining could consolidate some or all of the current eligibility pathways for accessing HCBS by establishing consistent income and asset rules. Streamlining also could consider how the HCBS rules align with financial eligibility for institutional care, to provide equitable access to both institutional and HCBS and avoid incentivizing institutional care over HCBS. Reducing or eliminating some of the variation in financial eligibility thresholds for different Medicaid HCBS pathways could create administrative efficiencies for states and make the program as a whole simpler for beneficiaries to navigate. With adequate financing, which is central to any streamlining initiative, financial eligibility rules could be aligned to accommodate the highest level at which current beneficiaries qualify for services instead of restricting current standards.

How Would States Manage Program Enrollment?

Today, states often use their ability to cap HCBS enrollment to control program costs, although this strategy also can have the effect of creating a bias toward institutional care. While the existing HCBS state plan authorities do not have enrollment caps, most HCBS are provided through Section 1915(c) waivers that do allow states to cap enrollment and expand as new resources become available. At the same time, all beneficiaries who qualify for Medicaid nursing facility services are entitled to receive them because enrollment for Medicaid state plan services cannot be capped. Because enrollment in HCBS waivers can be limited, everyone who needs LTSS may not be able to choose their preferred setting. If no HCBS waiver slots are open, a person who prefers to receive services at home but who can no longer live in the community without services may have to go into a nursing facility. Although such a person could potentially move from a nursing facility back to the community, this transition becomes more difficult as time passes and community housing and other supports are lost.

The ACA replaced the enrollment cap for Section 1915(i) state plan HCBS with enrollment management strategies that may offer a model for a streamlined Medicaid HCBS state plan option. Section 1915(i) allows states to offer HCBS to people whose functional needs do not yet rise to the level of institutional care, which could delay or avoid more costly future services. Section 1915(i) also permits states to control enrollment by constricting the functional eligibility criteria if the projected number of individuals expected to receive services is exceeded. Those already receiving services are grandfathered into the program under the old criteria when changes are made so that current beneficiaries do not lose services. In transitioning to a streamlined HCBS state plan authority, states would need time to ensure that the necessary infrastructure, including provider capacity to provide a range of HCBS, is in place. Additionally, adequate financing would have to be available to serve beneficiaries who are eligible for services without waiting lists. States’ experiences with managing program enrollment under Section 1915(i), in lieu of enrollment caps and waiting lists associated with Section 1915(c) waivers, can inform the design of a streamlined HCBS option as an alternative means of ensuring effective system development for each population served, while allowing for enrollment growth as certain milestones are achieved.

How Would Beneficiaries Functionally Qualify for Services?

At present, the contents of the HCBS benefit package available to an individual may vary depending on the underlying eligibility pathway or program authority. Because Section 1915(c) waivers can be targeted to specific populations and each may have their own distinct benefit package, all services may not be available to all beneficiaries who otherwise would qualify to receive them based on their functional needs. People with needs in more than one area may have to choose which services to forgo if all of their needs cannot be met through one of the existing targeted benefit packages. In addition, some services, like security and utility deposits and other household set-up costs, which help beneficiaries move from institutions to the community only may be available to certain populations under particular programs such as MFP or CFC, depending on state program design. Providing these transition services seeks to remedy the historical bias of the program toward institutional care by supporting beneficiaries who wish to move to the community to do so, an option that may not have been available to them when they were institutionalized. The ACA already has taken steps toward streamlining in this area by fully aligning the service options available under Section 1915(i) with those available under Section 1915(c) so that there is now a single set of HCBS from which states can choose regardless of whether they are using state plan or waiver HCBS authority.

Streamlining Medicaid HCBS could further consolidate the services available under existing authorities, allowing access to services based on an individual’s functional needs instead of tying eligibility to a particular program or authority. Streamlining also could consider whether to incorporate some of the services and supports that will expire when MFP funding sunsets that may not be available through other existing authorities. Offering a single set of HCBS to all beneficiaries does not mean that everyone would receive all of the services contained in the benefit package. Instead, beneficiaries still would need to satisfy medical necessity criteria and would receive only the services that meet their individual needs. Streamlining the existing HCBS benefit packages also would not alter the Medicaid program’s entitlement to institutional care for people with needs that cannot effectively be met in the community or whose situation requires an institutional setting.

How Would HCBS Be Incentivized?

Functional Eligibility Criteria

Functional eligibility rules to qualify for HCBS today can be more restrictive than for institutional services, creating a disincentive for HCBS, although states can expand access to HCBS to people with functional needs that are below an institutional level of care. As of 2014, 10 Section 1915(c) waivers in eight states (3% of all such waivers nationally) used stricter functional eligibility criteria to gain access to HCBS than what the state required to access institutional care.39   For example, a state could require an individual to have difficulty in performing at least three activities of daily living, such as bathing, dressing, transferring, eating, or toileting, for HCBS waiver eligibility but require limitations in only two of these areas for nursing facility admission. On the other hand, as noted above, Section 1915(i) enables states to offer state plan HCBS to people who need help with self-care and/or household activities although their needs do not rise to the level of institutional care. This standard is different from Section 1915(c) waiver services and CFC attendant care services, both of which require beneficiaries to qualify for institutional care. Section 1915(i) provides an opportunity to use HCBS as preventive care in an effort to foreclose or delay the need for more intensive costly services in the future if needs worsen without services.

A streamlined authority could incentivize HCBS by establishing functional eligibility criteria for at least some HCBS that are less stringent than what is required to qualify for institutional care. The test used for Section 1915(c) waivers – whether HCBS are less costly individually or in aggregate than comparable institutional care – could be used to determine whether a person’s needs cannot be met with appropriate HCBS in the community. In such cases, safeguards would be needed to ensure that beneficiaries receive the level of HCBS commensurate with their needs, particularly for those facing institutionalization. For example, if beneficiaries disagree with the amount or type of services authorized in their care plan, they can appeal that decision on the grounds that more or different services are medically necessary for their needs. Beneficiaries who prefer institutional care also could be permitted to choose that setting. While maintaining the availability of HCBS for people who need an institutional level of care is critical, this additional flexibility could enable states to provide HCBS as preventive services so that beneficiaries who want to do so can remain in their homes and avoid further decline in functioning and potentially higher costs in the future.

Enhanced Federal Matching Funds

The Medicaid program currently offers enhanced federal matching funds to states that choose to provide certain HCBS. For example, the CFC state plan option added by the ACA offers six percent enhanced federal matching funds for states to provide attendant care services and supports, provided that states meet certain criteria such as developing the benefit with stakeholder input, establishing a comprehensive quality assurance system, reporting information for a federal evaluation, and maintaining existing Medicaid attendant care spending in the first year. These federal financial incentives serve to remedy the historic bias toward institutional services and can be a tool in maintaining momentum toward expanding HCBS and further developing and maintaining the necessary system capacity.

Streamlining Medicaid HCBS could include enhanced federal financing to incentivize certain services. Enhanced federal funding for CFC services already exists in the law. Reauthorizing time-limited programs with enhanced federal funding, such as MFP, and/or creating new programs with enhanced federal funding would require sufficient funds to be available in federal and state budgets. Because HCBS are typically less expensive than comparable institutional care and can help prevent the need for more costly services in the future, programs may realize savings over time. Savings also may arise from efficiencies resulting from administering a single streamlined program. Depending on the availability of federal funds, offering an enhanced match for other targeted services may facilitate the expansion of key areas such as supported employment, self-direction, and other services aimed at increasing independence and community integration.

How Would the Program Be Administered, Monitored, and Evaluated?

The way in which Medicaid HCBS authorities currently are structured results in states using multiple authorities, often targeted to different populations, creating administrative complexity. For example, as of 2012, there are nearly 300 individual Section 1915(c) HCBS waivers in 47 states and DC. In addition to having to administer and oversee different reporting requirements associated with individual HCBS authorities, states also combine other Medicaid authorities, which come with distinct reporting requirements, with their HCBS programs. For example, states use various managed care authorities, with separate reporting requirements, to offer capitated managed LTSS programs. States also may offer Medicaid health homes to better integrate care for people with chronic conditions, and those populations may overlap with beneficiaries who use Medicaid LTSS, leading to another area to potentially align reporting requirements.40   While population-specific expertise can help inform program design, opportunities for administrative simplification could be beneficial.

Current Medicaid authorities vary widely in the number and type of quality measures, and new LTSS quality measures currently are being developed to fill in gaps. In addition to differences in existing measures among the various HCBS authorities, there is a general consensus that further development of LTSS quality measures is needed, particularly to assess health outcomes, quality of life and community integration.41   Today, Section 1915(c) HCBS waivers largely focus on administrative process requirements, rather assessments of outcomes such as an individual’s experience of care. The National Quality Forum presently is working to identify gaps in HCBS quality measurement.42  Further developments in oversight and quality measurement may result from CMS’s proposed rules that would require state Medicaid programs to implement a comprehensive written strategy for assessing and improving the quality of care and services provided to all Medicaid beneficiaries across all delivery systems including FFS and managed care.43 

Streamlining Medicaid HCBS reporting requirements and quality measures could decrease administrative complexity for states and provide uniform information for beneficiaries and other stakeholders to compare. A streamlined HCBS authority could both align existing requirements and incorporate new measures as they are developed. Simplifying program administration for states could enable them to focus resources on providing services and improving beneficiary outcomes. A potential downside of streamlining in this area may mean that certain measures seen as important by some stakeholders are no longer tracked. On the other hand, including too many measures can prove to be unworkable, and streamlining may provide an opportunity to identify the most important and relevant measures to track and assess quality.

Looking Ahead

Medicaid HCBS play a central role for millions of people, many of whom need daily supports to meet a wide array of needs, but the current system can be complex for states to administer and confusing for individuals in need of services to navigate. Additionally, an institutional bias remains in the program structure because nursing facility services must be covered, while most HCBS are provided at state option. CMS has taken some steps toward streamlining requirements across HCBS authorities through its regulations that govern person-centered planning and define a “home and community-based setting” for Medicaid funding purposes.44   Building on these efforts by streamlining the existing Medicaid HCBS programs into a single state plan authority might alleviate some of the complexity and administrative costs associated with the program and support further progress in increasing beneficiary access to HCBS. Streamlining Medicaid HCBS also would be consistent with the ACA’s provisions that simplify and streamline Medicaid eligibility and enrollment for people who qualify in poverty-related coverage groups and seek to make these systems more accessible to consumers.45 

Streamlining calls for identifying the most useful features of the existing HCBS options, determining how to promote the use of HCBS as less costly, less intensive interventions before the use of institutional services, and considering how best to enable states to meet beneficiary needs. Any changes to Medicaid HCBS programs would have to address how to ensure adequate financing, which is central to any streamlining effort, and how to manage program enrollment over time. At the same time, streamlining HCBS might save administrative costs for both CMS and the states, and a system that incentivizes HCBS could prove cost-effective in the long-term. Additionally, a streamlined system could increase beneficiary and families’ understanding of how to access services, although streamlining would have to address the vulnerability of the population that relies on these services to ensure that a transition to a new system is smooth.

Given the fragmentation of Medicaid HCBS to date, stakeholder input from various beneficiary populations will be important so that streamlining HCBS builds on existing eligibility pathways and services so that those currently receiving services do not lose them. Next steps in streamlining Medicaid HCBS authority may include engaging a variety of stakeholders, such as beneficiaries, states, community-based organizations, providers, and others; considering options to address potential concerns; and exploring financing mechanisms and the federal and state fiscal implications of a streamlined program.

Endnotes

  1. Dep’t of Health and Human Servs., Fiscal Year 2017 Budget in Brief, Strengthening Health and Opportunity for All Americans at 95, available at http://www.hhs.gov/sites/default/files/fy2017-budget-in-brief.pdf; Dep’t of Health and Human Servs., HHS FY 2016 Budget in Brief, Serving Americans at Key Stages of Life, Advancing Comprehensive Medicaid Long-Term Care, (Feb. 4, 2015), available at http://www.hhs.gov/about/budget/budget-in-brief/index.html. ↩︎
  2. Bipartisan Policy Center, Initial Recommendations to Improve the Financing of Long-Term Care (Feb. 2016), available at http://bipartisanpolicy.org/library/americas-long-term-care-crisis/. ↩︎
  3. Long-Term Care Financing Collaborative, Convergence Center for Policy Resolution, A Consensus Framework for Long-Term Care Financing Reform (Feb. 2016), available at http://www.convergencepolicy.org/wp-content/uploads/2016/02/LTCFC-FINAL-REPORT-Feb-2016.pdf. ↩︎
  4. See, e.g., Kaiser Commission on Medicaid and the Uninsured, Medicaid Beneficiaries Who Need Home and Community-Based Services:  Supporting Independent Living and Community Integration (March 2014), available at https://modern.kff.org/medicaid/report/medicaid-beneficiaries-who-need-home-and-community-based-services-supporting-independent-living-and-community-integration/. ↩︎
  5. Victoria Peebles and Alex Bohl, CMS/Mathematica Policy Research, The HCBS Taxonomy:  A New Language for Classifying Home and Community-Based Services (Aug. 2013), available at http://www.mathematica-mpr.com/~/media/publications/PDFs/health/max_ib19.pdf. ↩︎
  6. Kaiser Commission on Medicaid and the Uninsured, Serving Low-Income Seniors Where They Live:  Medicaid’s Role in Providing Community-Based Long-Term Services and Supports (Sept. 2015), available at https://modern.kff.org/medicaid/issue-brief/serving-low-income-seniors-where-they-live-medicaids-role-in-providing-community-based-long-term-services-and-supports/. ↩︎
  7. Id. ↩︎
  8. Id. ↩︎
  9. This analysis is limited to the civilian noninstitutionalized population and includes seniors. The definition of disability used by the Census Bureau does not exactly track the criteria required to qualify for Medicaid based on a disability. U.S. Census Bureau, Americans with Disabilities:  2010 at 5 (July 2012), available at http://www.census.gov/prod/2012pubs/p70-131.pdf. ↩︎
  10. Id. ↩︎
  11. Id. (ages 21 to 64). ↩︎
  12. See generally Kaiser Commission on Medicaid and the Uninsured, Olmstead’s Role in Community Integration for People with Disabilities Under Medicaid:  15 Years After the Supreme Court’s Olmstead Decision (June 2014), available at https://modern.kff.org/medicaid/issue-brief/olmsteads-role-in-community-integration-for-people-with-disabilities-under-medicaid-15-years-after-the-supreme-courts-olmstead-decision/. ↩︎
  13. Id. ↩︎
  14. Eiken, S., Sredl, K, Burwell, B, Saucier, P. Medicaid Expenditures for Long-Term Services and Supports (LTSS) in FY 2013: Home and Community-Based Services were a Majority of LTSS Spending, Truven Health Analytics, (June 30, 2015). ↩︎
  15. See also Kaiser Commission on Medicaid and the Uninsured, Medicaid Long-Term Services and Supports:  An Overview of Funding Authorities (Sept. 2013), available at https://modern.kff.org/medicaid/fact-sheet/medicaid-long-term-services-and-supports-an-overview-of-funding-authorities/. ↩︎
  16. Kaiser Commission on Medicaid and the Uninsured, Medicaid Home and Community-Based Services Programs:  2012 Data Update (Nov. 2015), available at https://modern.kff.org/medicaid/report/medicaid-home-and-community-based-services-programs-2012-data-update/. ↩︎
  17. Id. ↩︎
  18. Id. ↩︎
  19. See generally Kaiser Commission on Medicaid and the Uninsured, How is the Affordable Care Act Leading to Changes in Medicaid Long-Term Services and Supports Today?  State Adoption of Six LTSS Options (April 2013), available at https://modern.kff.org/medicaid/issue-brief/how-is-the-affordable-care-act-leading-to-changes-in-medicaid-long-term-services-and-supports-ltss-today-state-adoption-of-six-ltss-options/. ↩︎
  20. Kaiser Family Foundation, State Health Facts, Section 1915(i) Home and Community-Based Services State Plan Option (Oct. 2015), available at https://modern.kff.org/medicaid/state-indicator/section-1915i-home-and-community-based-services-state-plan-option/. ↩︎
  21. Kaiser Commission on Medicaid and the Uninsured, Medicaid Reforms to Expand Coverage, Control Costs and Improve Care:  Results from a 50-State Medicaid Budget Survey for State Fiscal Years 2015 and 2016 (Oct. 2015), available at https://modern.kff.org/report-section/medicaid-reforms-to-expand-coverage-control-costs-and-improve-care-long-term-services-and-supports-reforms/. ↩︎
  22. Kaiser Family Foundation, State Health Facts, Section 1915(k) Community First Choice State Plan Option (Dec. 2015), available at https://modern.kff.org/medicaid/state-indicator/section-1915k-community-first-choice-state-plan-option/. ↩︎
  23. Kaiser Commission on Medicaid and the Uninsured, Medicaid Reforms to Expand Coverage, Control Costs and Improve Care:  Results from a 50-State Medicaid Budget Survey for State Fiscal Years 2015 and 2016 (Oct. 2015), available at https://modern.kff.org/report-section/medicaid-reforms-to-expand-coverage-control-costs-and-improve-care-long-term-services-and-supports-reforms/. ↩︎
  24. Jane, K., Traylor, C., Ghahremani, K., Texas Medicaid and CHIP in Perspective. 10th ed. (Feb. 2015). ↩︎
  25. See generally Kaiser Commission on Medicaid and the Uninsured, The Affordable Care Act’s Impact on Medicaid Eligibility, Enrollment, and Benefits for People with Disabilities (April 2014), available at https://modern.kff.org/health-reform/issue-brief/the-affordable-care-acts-impact-on-medicaid-eligibility-enrollment-and-benefits-for-people-with-disabilities/. ↩︎
  26. States that elect the § 209(b) option are permitted to use definitions of disability or financial eligibility standards that are more restrictive than the federal SSI rules, so long as the state’s rules are not more restrictive than those in effect in January 1972. Section 209(b) states must allow SSI beneficiaries to establish Medicaid eligibility through a spend-down by deducting unreimbursed out-of-pocket medical expenses from their countable income. Section 209(b) states also must provide Medicaid to children who receive SSI and who meet the state’s financial eligibility rules for the AFDC program as of July 16, 1996. ↩︎
  27. Kaiser Commission on Medicaid and the Uninsured, Medicaid Financial Eligibility for Seniors and People with Disabilities in 2015 (March 2016), available at https://modern.kff.org/medicaid/report/medicaid-financial-eligibility-for-seniors-and-people-with-disabilities-in-2015/. ↩︎
  28. Beneficiaries eligible in the ACA expansion group who are medically frail must have access to the traditional Medicaid state plan benefit package, to the extent that it differs from the state’s alternative benefit package for expansion adults. See generally Kaiser Commission on Medicaid and the Uninsured, Benefits and Cost-Sharing for Working People with Disabilities in Medicaid and the Marketplace (Oct. 2014), available at https://modern.kff.org/medicaid/issue-brief/benefits-and-cost-sharing-for-working-people-with-disabilities-in-medicaid-and-the-marketplace/. ↩︎
  29. The ACA eliminated asset tests for people who are eligible through the expansion group (as well as other poverty-related pathways, including pregnant women, parents, and children). States also can use Section 1915(i) to provide state plan HCBS to people who are eligible for Medicaid through another coverage group, and other coverage groups based on age or disability may at state option include an asset test. ↩︎
  30. Kaiser Commission on Medicaid and the Uninsured, Money Follows the Person:  A 2015 State Survey of Transitions, Services, and Costs (Oct. 2015), available at https://modern.kff.org/medicaid/report/money-follows-the-person-a-2015-state-survey-of-transitions-services-and-costs/. ↩︎
  31. Kaiser Commission on Medicaid and the Uninsured, Medicaid Balancing Incentive Program:  A Survey of Participating States (June 2015), available at https://modern.kff.org/medicaid/report/medicaid-balancing-incentive-program-a-survey-of-participating-states/. ↩︎
  32. Kaiser Commission on Medicaid and the Uninsured, Money Follows the Person:  A 2015 State Survey of Transitions, Services, and Costs (Oct. 2015), available at https://modern.kff.org/medicaid/report/money-follows-the-person-a-2015-state-survey-of-transitions-services-and-costs/. ↩︎
  33. Kaiser Commission on Medicaid and the Uninsured, Medicaid Balancing Incentive Program:  A Survey of Participating States (June 2015), available at https://modern.kff.org/medicaid/report/medicaid-balancing-incentive-program-a-survey-of-participating-states/. ↩︎
  34. Kaiser Commission on Medicaid and the Uninsured, Medicaid Reforms to Expand Coverage, Control Costs and Improve Care:  Results from a 50-State Medicaid Budget Survey for State Fiscal Years 2015 and 2016 (Oct. 2015), available at https://modern.kff.org/report-section/medicaid-reforms-to-expand-coverage-control-costs-and-improve-care-long-term-services-and-supports-reforms/. ↩︎
  35. In addition, Kansas uses a Section 1115 waiver to administer managed LTSS with concurrent Section 1915(c) authority for HCBS. Kaiser Commission on Medicaid and the Uninsured, Key Themes in Capitated Managed Long-Term Services and Supports Waivers (Nov. 2014), available at https://modern.kff.org/medicaid/issue-brief/key-themes-in-capitated-medicaid-managed-long-term-services-and-supports-waivers/. ↩︎
  36. CMS, Special Terms and Conditions, Minnesota Reform 2020:  Pathways to Independence (Oct. 2013-June 2018), available at https://www.medicaid.gov/Medicaid-CHIP-Program-Information/By-Topics/Waivers/1115/downloads/mn/mn-reform-2020-ca.pdf. ↩︎
  37. Washington State Health Care Authority and Dep’t of Social Servs., Washington State Medicaid Transformation Waiver Application (Aug. 2015), available at https://www.medicaid.gov/Medicaid-CHIP-Program-Information/By-Topics/Waivers/1115/downloads/wa/wa-medicaid-transformation-pa.pdf. ↩︎
  38. Kaiser Commission on Medicaid and the Uninsured, Medicaid Home and Community-Based Services Programs:  2012 Data Update (Nov. 2015), available at https://modern.kff.org/medicaid/report/medicaid-home-and-community-based-services-programs-2012-data-update/. ↩︎
  39. Kaiser Commission on Medicaid and the Uninsured, Medicaid Home and Community-Based Services Programs:  2012 Data Update (Nov. 2015), available at https://modern.kff.org/medicaid/report/medicaid-home-and-community-based-services-programs-2012-data-update/. ↩︎
  40. See, e.g., Kaiser Commission on Medicaid and the Uninsured, Medicaid Health Homes:  A Profile of Newer Programs (Aug. 2014), available at https://modern.kff.org/medicaid/issue-brief/medicaid-health-homes-a-profile-of-newer-programs/. ↩︎
  41. Kaiser Commission on Medicaid and the Uninsured, Rebalancing in Capitated Medicaid Managed Long-Term Services and Supports Programs:  Key Issues from a Roundtable Discussion on Measuring Performance (Feb. 2015), available at https://modern.kff.org/medicaid/issue-brief/rebalancing-in-capitated-medicaid-managed-long-term-services-and-supports-programs-key-issues-from-a-roundtable-discussion-on-measuring-performance/; Kaiser Commission on Medicaid and the Uninsured, Measuring Long-Term Services and Supports Rebalancing (Feb. 2015), available at https://modern.kff.org/medicaid/fact-sheet/measuring-long-term-services-and-supports-rebalancing/. ↩︎
  42. See, e.g. National Quality Forum, Addressing Performance Measure Gaps in Home and Community-Based Services to Support Community Living:  Synthesis of Evidence and Environmental Scan (Dec. 2015), available at http://www.qualityforum.org/Measuring_HCBS_Quality.aspx . ↩︎
  43. Kaiser Commission on Medicaid and the Uninsured, Proposed Rule on Medicaid Managed Care:  A Summary of Major Provisions (July 2015), available at https://modern.kff.org/report-section/proposed-rule-on-medicaid-managed-care-issue-brief/. ↩︎
  44. 79 Fed. Reg. 2948-3039 (Jan. 16, 2014), available at http://www.gpo.gov/fdsys/pkg/FR-2014-01-16/pdf/2014-00487.pdf. ↩︎
  45. See, e.g., Kaiser Commission on Medicaid and the Uninsured, Medicaid and CHIP Eligibility, Enrollment, Renewal, and Cost-Sharing Policies as of January 2016:  Findings from a 50-State Survey (Jan. 2016), available at https://modern.kff.org/medicaid/report/medicaid-and-chip-eligibility-enrollment-renewal-and-cost-sharing-policies-as-of-january-2016-findings-from-a-50-state-survey/. ↩︎

Profile of Medicare Beneficiaries by Race and Ethnicity: A Chartpack

Published: Mar 9, 2016
Section:
0 / 0

Introduction

Medicare provides health insurance coverage for 55 million people ages 65 and over and younger adults with permanent disabilities. As the number of black and Hispanic beneficiaries has grown over time, the program has played an increasingly vital role as a source of coverage for people of color. Before the enactment of Medicare in 1965, health coverage and care was not easily accessible or affordable for many seniors, and perhaps least so for black seniors, who were often unable to receive treatment in the same facilities as whites because hospitals were segregated. The establishment of Medicare, in conjunction with the Civil Rights Act of 1964, was transformative in desegregating the nation’s health care system for patients and providers and in improving access to care.1 ,2 ,3 

Medicare has helped to mitigate disparities in treatment and health outcomes across racial and ethnic groups, but gaps remain.4  For example, life expectancy at age 65 has improved over the past several decades, but nonetheless is lower for blacks than whites.5  Prior research has documented racial and ethnic disparities in the use of certain preventive services and diagnostic screenings, such as flu shots and prostate cancer screenings,6 ,7  in wait times for treatment, such as kidney transplants and cancer treatment,8 ,9  and in rates of hospital readmissions.10 ,11 

Studies have also shown that among beneficiaries in Medicare Advantage plans, black and Hispanic enrollees are less likely than white enrollees to have their blood pressure, cholesterol, and glucose levels under control, though disparities in these clinical outcomes have lessened over time.12 ,13 ,14  Health disparities among Medicare beneficiaries of different racial and ethnic groups are related to a number of factors associated with broad social determinants of health, such as housing, income, and education,15 ,16  which affect health status and health outcomes long before the Medicare eligibility age is reached. Racial and ethnic disparities in care also have been attributed to variations in clinical treatment practices,17  differences in access to potentially higher-quality providers and facilities,18 ,19 ,20  and geographic variation.21  In addition, disparities in care among Hispanic beneficiaries have been attributed to cultural and language barriers.22 ,23 ,24 

This chartpack draws on data and analysis from a variety of sources to profile the Medicare population through the lens of race and ethnicity, describing life expectancy, demographic characteristics, income and savings, health status and chronic conditions, supplemental coverage, selected measures of access to care, and service utilization (see “Data Sources” textbox below). In most cases, data are presented for the overall Medicare beneficiary population, and separately for white non-Hispanic, black non-Hispanic, and Hispanic Medicare beneficiaries. Sample size limitations generally preclude subgroup analysis of Asian, American Indian, Native Hawaiian or Pacific Islander beneficiaries.

Key Findings

  • People of color accounted for about one-fifth of adults ages 65 and over in 2012—including 9 percent black, 7 percent Hispanic, 4 percent Asian, and 1 percent other races—while non-white Hispanics were 79 percent of the 65 and over population. By 2040, people of color will comprise about one-third of the U.S. population ages 65 and over.
  • The distribution of Medicare beneficiaries by race and ethnicity varies considerably in states across the country. In 7 states (Alabama, Georgia, Louisiana, Maryland, Mississippi, North Carolina, and South Carolina), at least 20 percent of all Medicare beneficiaries are black—at least twice the national average—while in Washington, D.C., 68 percent of beneficiaries are black. The 5 states with the highest share of Hispanic beneficiaries are California, Florida, New Mexico, New York, and Texas.
  • Life expectancy at age 65 has improved over the past several decades, but continues to vary by race and ethnicity. Life expectancy at 65 is lower for blacks than whites (18 years versus 19 years), but higher for Hispanics at age 65 (21 years) than for whites and blacks.
  • Compared to white beneficiaries, black and Hispanic Medicare beneficiaries are more likely to be under the age of 65, have more limited financial resources, and report poorer health status.
    • The majority (83%) of Medicare beneficiaries are ages 65 and older, while 17 percent are under age 65 and qualify for Medicare because of a permanent disability. However, a much larger share of black (31%) and Hispanic beneficiaries (23%) than white beneficiaries (14%) are under age 65 and living with disabilities.
    • Median per person income in 2014 for black and Hispanic Medicare beneficiaries ($16,150 and $12,800, respectively) was considerably lower than for white Medicare beneficiaries ($27,450). In 2014, half of all Medicare beneficiaries had less than $63,350 in savings, but the amount of savings was seven times greater for white beneficiaries ($91,950) than black ($12,350) or Hispanic ($9,800) beneficiaries.
    • A larger share of black (37%) and Hispanic (36%) Medicare beneficiaries than white beneficiaries (24%) report fair or poor health status.
    • The prevalence of chronic conditions among Medicare beneficiaries varies widely by racial and ethnic groups. For example, a larger share of black (79%) and Hispanic (73%) beneficiaries have hypertension than white beneficiaries (66%), while heart conditions are more common among white beneficiaries.
  • Close to half (45%) of all Hispanic beneficiaries were enrolled in Medicare Advantage in 2011, a far higher share than among black (29%) or white (26%) beneficiaries.
  • Sources of supplemental insurance coverage vary by race and ethnicity, with a significantly smaller share of black (20%) and Hispanic (14%) beneficiaries having coverage from an employer-sponsored plan compared to white beneficiaries (32%) in 2011. Additionally, a larger share of black (28%) and Hispanic (22%) beneficiaries than white beneficiaries (11%) rely on Medicaid to supplement Medicare, based primarily on lower incomes among blacks and Hispanics. Nearly one in five (19%) black beneficiaries had no source of supplemental insurance in 2011, a larger share than among white beneficiaries (13%).
  • Measures of access to care and utilization of services vary by race/ethnicity:
    • Overall, Medicare beneficiaries have broad access to physicians, hospitals, and other health care providers, and only a small share overall report problems with access to care. While only a small share of beneficiaries overall report access to care problems, a slightly larger share of black and Hispanic beneficiaries report trouble getting needed care (7% and 9%, respectively) than white beneficiaries (5%).
    • A larger share of black beneficiaries than white beneficiaries had at least one emergency department visit during the year in 2011 (37% versus 28%). This variation is likely related to a larger share of black beneficiaries reporting fair or poor health status; nonetheless, even among beneficiaries self-reporting good health, a larger share of black beneficiaries than white beneficiaries had at least one visit to the emergency department during the year (30% versus 22%).
    • In terms of preventive services, the share of beneficiaries receiving an influenza vaccination in 2011 was higher among white beneficiaries (72%) than among black (55%) and Hispanic beneficiaries (59%); there were no notable differences by race and ethnicity in receipt of other preventive services, such as mammograms and prostate cancer screenings, in 2011.

Discussion

It has now been three decades since Department of Health and Human Services Secretary Margaret Heckler issued a landmark report documenting “the sad and significant fact” of ongoing disparities in the burden of illness between non-Hispanic whites and people of color.25  Since then, a number of efforts have been launched to measure and minimize these gaps.26 ,27  Most recently, the U.S. Department of Health and Human Services has proposed a set of initiatives to reduce disparities in hospital readmissions rates and improve quality of care for racially and ethnically diverse beneficiaries.28 ,29 ,30 ,31  Such efforts may help to address observed health disparities among Medicare beneficiaries of different racial and ethnic groups. Ultimately, achieving health equity for all Medicare beneficiaries will involve not only improving coverage for adults prior to age 65, but also addressing the specific cultural, linguistic, and socioeconomic needs of racially and ethnically diverse groups at all ages.

Data Sources Used in This Analysis

  • The Medicare Current Beneficiary Survey (MCBS) 2011 Cost and Use file and 2013 Access to Care file is used to describe Medicare beneficiary characteristics, supplemental coverage, access to care, and service utilization. The MCBS Cost and Use sample includes all beneficiaries, including those who are enrolled for the entire year, those who become eligible during the year, and those who die during the year; the 2011 file includes a total of 50.0 million beneficiaries, of whom 38.2 million are white, 4.7 million are black, and 4.5 million are Hispanic. The MCBS Access to Care sample includes only those beneficiaries who are enrolled for the entire year; the 2013 file includes a total of 48.9 million beneficiaries, of whom 36.6 million are white, 4.7 million are black, and 4.6 million are Hispanic.
  • The DYNASIM microsimulation model developed by researchers at The Urban Institute is used to describe Medicare beneficiaries’ incomes and assets in 2014.
  • The March 2015 Current Population Survey Annual Social and Economic Supplement is used to estimate poverty among people ages 65 and over under the official and supplemental poverty measures, and Medicare beneficiary population estimates by state (for calendar year 2014).
  •  Data from the U.S. Census Bureau report, An Aging Nation: The Older Population in the United States, is used for U.S. population estimates among people ages 65 and over.
  • Data from the Centers for Disease Control and Prevention, National Center for Health Statistics report, Health, United States, 2014, is used to describe life expectancy at age 65 by race and gender.

This chartpack was prepared by Christa Fields, Juliette Cubanski, Cristina Boccuti, and Tricia Neuman of the Kaiser Family Foundation. Data programming and statistical analysis was conducted by Anthony Damico, an independent consultant.

Chartpack

Distribution of U.S. Population Ages 65 and Over by Race/Ethnicity, 2012 and 2040

In 2012, 79.3 percent of U.S. adults ages 65 and over were white non-Hispanic, 8.8 percent were black, 7.3 percent were Hispanic, 3.8 percent were Asian, and 1.5 percent were other races (Figure 1).32  The racial and ethnic profile of people ages 65 and over is expected to shift over time. By 2040, non-Hispanic whites are projected to comprise a smaller share (66.7%) of the population ages 65 and over, while the share of Hispanics is projected to double to 14.7 percent. The share of the U.S. population ages 65 and over who are black and Asian is also projected to increase.

The distribution of all Medicare beneficiaries, including seniors and people under age 65, by race and ethnicity varies considerably across the country (Table 1). In 7 states (Alabama, Georgia, Louisiana, Maryland, Mississippi, North Carolina, and South Carolina), at least 20 percent of all Medicare beneficiaries are black—at least twice the national average—while in Washington, D.C., 68 percent of beneficiaries are black. The 5 states with the highest share of Hispanic beneficiaries are California, Florida, New Mexico, New York, and Texas.

Figure 1: Distribution of U.S. Population Ages 65 and Over, by Race/Ethnicity, 2012 and 2040

Life Expectancy at Age 65, by Race/Ethnicity and Gender, 2013

Adults in the U.S. who lived to age 65 in 2013 could expect to live another 19.3 years, on average (Figure 2). This reflects a five-year improvement in life expectancy since 1960, prior to the enactment of Medicare. Life expectancy at age 65 varies by race and ethnicity, and is lower for blacks at age 65 than for whites (18.0 years versus 19.3 years) and highest for Hispanic adults (20.9 years). This is the case despite the relatively low socioeconomic status of the Hispanic population, and has been attributed to low rates of smoking and other healthy behaviors among first-generation Hispanics.33 ,34  This life expectancy advantage among Hispanics is not expected to continue into the future, however, due to higher rates of smoking and obesity among second- and third- generation Hispanic adults.35  Among people in all three groups, life expectancy at age 65 is higher for women than men.

Figure 2: Life Expectancy at Age 65, by Race/Ethnicity and Gender, 2013

Age Distribution of Medicare Beneficiaries, by Race/Ethnicity, 2011

The majority (83%) of Medicare beneficiaries are ages 65 and older, and another 17 percent are younger than age 65 and qualify for Medicare because of a long-term disability (Figure 3, Table 2). A much larger share of black (31%) and Hispanic beneficiaries (23%) than white beneficiaries (14%) are under age 65 and living with a permanent disability. Conversely, a smaller share of black (9%) and Hispanic beneficiaries (8%) than white beneficiaries (14%) are ages 85 and over.

Figure 3: Age Distribution of Medicare Beneficiaries, by Race/Ethnicity, 2011

Distribution of Medicare Beneficiaries’ Education Level, by Race/Ethnicity, 2011

The education level of Medicare beneficiaries varies by race and ethnicity, with a significantly larger share of black and Hispanic beneficiaries than white beneficiaries having less than a high school education (38%, 46%, and 17%, respectively) (Figure 4, Table 2). Smaller shares of black and Hispanic beneficiaries than white beneficiaries have some college education (24%, 21%, and 30%, respectively) or a college degree (11%, 9%, and 23%, respectively).

Figure 4: Distribution of Medicare Beneficiaries’ Education Level, by Race/Ethnicity, 2011

Official and Supplemental Poverty Rates Among Adults Ages 65 and Over, by Race/Ethnicity, 2014

The rate of poverty is much higher among black and Hispanic adults ages 65 and over than among white older adults, whether measured by the official poverty measure or the Supplemental Poverty Measure (SPM) (Figure 5). The SPM differs from the official poverty measure in a number of ways, and takes into account available financial resources including liabilities (e.g., taxes), the value of in-kind benefits (e.g., food stamps), out-of-pocket medical spending (which is generally higher among older adults), geographic variation in housing expenses, and other factors.36  Under the official poverty measure, about one in five black (19%) and Hispanic (18%) seniors were living in poverty in 2014, compared to just 8 percent of white adults ages 65 and over. Rates of poverty for all three groups were higher under the SPM in 2014, with 28 percent of Hispanic seniors, 23 percent of black seniors, and 12 percent of white seniors living below the SPM poverty thresholds that year. A significantly larger share of Hispanic (65%) and black (60%) seniors than white seniors (38%) lived below 200 percent of poverty under the SPM.

Figure 5: Official and Supplemental Poverty Rates Among Adults Ages 65 and Over, by Race/Ethnicity, 2014

Median Per Capita Income Among Medicare Beneficiaries, by Race/Ethnicity, 2014

In 2014, half of all Medicare beneficiaries had incomes below $24,150 (Figure 6). Median per capita income was substantially lower for black and Hispanic Medicare beneficiaries ($16,150 and $12,800, respectively) than for white beneficiaries ($27,450).37 

Figure 6: Median Per Capita Income Among Medicare Beneficiaries, by Race/Ethnicity, 2014

Median Per Capita Savings Among Medicare Beneficiaries, by Race/Ethnicity, 2014

In 2014, half of all Medicare beneficiaries had less than $63,350 in savings, but the amount of median per capita savings was seven times greater for white beneficiaries ($91,950) than black or Hispanic beneficiaries ($12,350 and $9,800, respectively) (Figure 7).38  Nearly all Medicare beneficiaries had some amount of savings (92%), but savings rates were higher among white beneficiaries (95%) than among black and Hispanic beneficiaries (80% and 76%, respectively). Among those with any savings, the median savings amount was roughly five times higher for white beneficiaries ($102,500) than for black and Hispanic beneficiaries ($22,200 and $23,000, respectively).

Figure 7: Median Per Capita Savings Among Medicare Beneficiaries, by Race/Ethnicity, 2014

Selected Measures of Medicare Beneficiaries’ Health Status, by Race/Ethnicity, 2011

Measures of Medicare beneficiaries’ health status differ for beneficiaries of different racial and ethnic groups (Figure 8; Table 3). For example, more than one third of all black and Hispanic Medicare beneficiaries (37% and 36%, respectively) report being in fair or poor health, compared to roughly one fourth (24%) of white beneficiaries. About four in 10 black beneficiaries (41%) lives with a functional impairment, defined as having one or more limitations in activities of daily living (ADLs) such as eating or bathing, a larger share than Hispanic and white beneficiaries with functional impairments (36% and 34%, respectively). A larger share of Hispanic (37%) and black (34%) beneficiaries than white beneficiaries (29%) has a cognitive or mental impairment. Poorer health status among black and Hispanic beneficiaries may reflect the disproportionate share of beneficiaries under age 65 with permanent disabilities in these groups, as shown earlier (see Figure 3).

Figure 8: Selected Measures of Medicare Beneficiaries’ Health Status, by Race/Ethnicity, 2011

Prevalence of Selected Diseases/Chronic Conditions Among Medicare Beneficiaries, by Race/Ethnicity, 2011

The prevalence of chronic conditions among Medicare beneficiaries varies widely by racial and ethnic groups and by age (Figure 9; Table 3). Hypertension is common among all Medicare beneficiaries, but a larger share of black (79%) and Hispanic (73%) beneficiaries have hypertension than white beneficiaries (66%). Conversely, heart conditions, such as hardening of the arteries, angina, myocardial infarction, and congestive heart failure, are more common among white beneficiaries (41%) than among black or Hispanic beneficiaries (34% and 32%, respectively). A significantly larger share of black and Hispanic beneficiaries than white beneficiaries have diabetes (38%, 38%, and 23%, respectively), while the prevalence of depression is highest among Hispanic beneficiaries (35%) than among white or black beneficiaries. Cancer, osteoporosis, and stroke also show varying prevalence rates across different racial and ethnic groups, with rates of cancer and osteoporosis highest for white beneficiaries, and strokes affecting a larger share of black than white beneficiaries. Additionally, research has shown that the prevalence of Alzheimer’s disease increases with age, and among beneficiaries ages 85 and over, is highest among Hispanic (44%) and black (29%) beneficiaries than among white beneficiaries (22%).39 

Figure 9: Prevalence of Selected Diseases/Chronic Conditions Among Medicare Beneficiaries, by Race/Ethnicity, 2011

Medicare Advantage and Sources of Supplemental Coverage Among Medicare Beneficiaries, by Race/Ethnicity, 2011

In 2011, about three in 10 (28%) Medicare beneficiaries overall were enrolled in a Medicare Advantage plan, such as an HMO or PPO, but enrollment rates were significantly higher among Hispanic beneficiaries (45%) than among black (29%) or white (26%) beneficiaries (Figure 10).

Most Medicare beneficiaries had some form of supplemental insurance coverage to help cover Medicare’s cost-sharing requirements and fill in gaps in Medicare’s benefit package, but sources of coverage varied across racial and ethnic groups. Medicaid plays a key role in supplementing Medicare for low-income Medicare beneficiaries, covering a much larger share of black (28%) and Hispanic (22%) beneficiaries than white (11%) beneficiaries. In contrast, employer-sponsored coverage is the primary source of supplemental coverage for white beneficiaries (32%) and another 17 percent have Medigap policies; both supplemental insurance types cover smaller shares of black and Hispanic beneficiaries. While a relatively small share (14%) of beneficiaries overall lacked any source of supplemental coverage in 2011, nearly one in five (19%) black beneficiaries had no form of supplemental coverage in 2011, potentially exposing them to higher out-of-pocket costs.

Figure 10: Prevalence of Selected Diseases/Chronic Conditions Among Medicare Beneficiaries, by Race/Ethnicity, 2011

Distribution of Race/Ethnicity of Medicare Beneficiaries Enrolled in Traditional Medicare and Medicare Advantage, 2011

Hispanic beneficiaries comprised 9 percent of the total Medicare population in 2011, but a disproportionate share (15%) of enrollees in Medicare Advantage plans (Figure 11). Relatively high Medicare Advantage enrollment among Hispanic beneficiaries is in part attributable to geography, with larger shares of Hispanic beneficiaries living in states with relatively high Medicare Advantage penetration (e.g., Florida and California).40  Black beneficiaries comprise about one in 10 Medicare beneficiaries in both traditional Medicare and Medicare Advantage. A smaller share of white beneficiaries are enrolled in Medicare Advantage (71%) than in traditional Medicare (79%).

Figure 11: Distribution of Race/Ethnicity of Medicare Beneficiaries Enrolled in Traditional Medicare and Medicare Advantage, 2011

Distribution of Race/Ethnicity of Medicare Beneficiaries By Medicaid Enrollment (Dually Eligible), 2011

Nearly 10 million Medicare beneficiaries with low incomes and modest savings receive additional assistance from the Medicaid program, which includes premium assistance and may include cost-sharing assistance for Medicare-covered services along with extra benefits Medicare does not cover, such as dental and long-term services and supports (Figure 12). The dually eligible beneficiary population has a very different racial and ethnic composition than the non-dually eligible population. Black and Hispanic beneficiaries comprise 15 percent of non-dually eligible beneficiaries, but one third (33%) of beneficiaries who are dually eligible for Medicare and Medicaid, consistent with these groups having generally lower incomes and fewer resources than white beneficiaries.

Figure 12: Distribution of Race/Ethnicity of Medicare Beneficiaries By Medicaid Enrollment (Dually Eligible), 2011

Percent of Medicare Beneficiaries with Part D Prescription Drug Coverage and Low Income Subsidies (LIS), 2011

The Medicare Part D prescription drug benefit is an important source of drug coverage for Medicare beneficiaries. More than half of all Medicare beneficiaries (57%) were enrolled in a Part D drug plan in 2011, but a larger share of black (66%) and Hispanic (71%) beneficiaries than white beneficiaries (55%) had Part D drug coverage (Figure 13). A smaller share of white beneficiaries may be enrolled in Part D than other beneficiaries because they are more likely to have drug coverage through an employer-sponsored plan (see Figure 10). Medicare beneficiaries with low income and modest assets may qualify for additional financial premium and cost-sharing assistance through the Part D low-income subsidy (LIS) program. Nearly half of all black beneficiaries (46%) and more than one third of all Hispanic beneficiaries (38%) receive LIS under Part D, larger than the share of white beneficiaries with LIS (17%), due to lower levels of income and assets among black and Hispanic beneficiaries.

Figure 13: Percent of Medicare Beneficiaries with Part D Prescription Drug Coverage and Low Income Subsidies (LIS), by Race/Ethnicity, 2011

Percent of Medicare Beneficiaries Reporting Problems with Access to Care, by Race/Ethnicity, 2013

Overall, Medicare beneficiaries have broad access to physicians, hospitals, and other health care providers, and report generally low rates of problems across a number of access measures. Some variation is seen, however, by race and ethnicity (Figure 14; Table 4). A slightly larger share of Hispanic (8%) than white beneficiaries (4%) report not having a usual source of care to go to when they are sick or seeking medical advice, while a somewhat larger share of black and Hispanic beneficiaries (7% and 9%, respectively) report trouble getting needed care than whites (5%).

Figure 14: Percent of Medicare Beneficiaries Reporting Problems with Access to Care, by Race/Ethnicity, 2013

Percent of Medicare Beneficiaries with One or More Physician Office Visits and with Any Dental Events During the Year, by Race/Ethnicity, 2011

The majority of all beneficiaries in traditional Medicare saw a physician in 2011, with a somewhat larger share of white beneficiaries (80%) having a physician office visit than black or Hispanic beneficiaries (71% and 68%, respectively) (Figure 15; Table 5). In contrast, less than half of all beneficiaries in traditional Medicare had any dental events during the year, but larger differences by race and ethnicity are observed for using dental services. Nearly half of white beneficiaries (47%) had a dental event during the year, a significantly larger share than among black (27%) and Hispanic (30%) beneficiaries.41  The smaller share of beneficiaries seeing a dentist during the year than a physician is likely due to the lack of coverage under traditional Medicare for routine dental care (including checkups, fillings, dentures, and root canals) and the out-of-pocket costs associated with dental care.42 

Figure 15: Percent of Medicare Beneficiaries with One or More Physician Office Visits and with Any Dental Events During the Year, by Race/Ethnicity, 2011

Percent of Medicare Beneficiaries with an Inpatient Hospital Stay and with an Emergency Department Visit During the Year, by Race/Ethnicity and Self-reported Health Status, 2011

Among beneficiaries enrolled in traditional Medicare, some differences by race and ethnicity are observed in the share of beneficiaries with one or more inpatient hospital stays and emergency department visits in the year (Figure 16; Table 5). For instance, a smaller share of Hispanic beneficiaries had an inpatient hospital stay in 2011 than white beneficiaries (15% versus 19%), and a larger share of black beneficiaries had one or more emergency department visits in the year compared with whites (37% versus 28%). This variation is likely related to overall differences in health status by race and ethnicity, as discussed earlier. That is, as health status worsens, higher rates of hospitalizations are to be expected. In fact, no statistically significant differences between whites and people of color are seen in the share of beneficiaries reporting fair or poor health who had at least one inpatient hospitalization or emergency department visit. In contrast, among beneficiaries in relatively better health (defined as excellent, very good, or good self-reported health status), a larger share of black beneficiaries (30%) had an emergency department visit compared to white beneficiaries (22%); and a smaller share of Hispanic beneficiaries had an inpatient hospital stay (8%) than white beneficiaries (15%).

Additionally, a larger share of black beneficiaries than white beneficiaries had two or more hospital stays during the year in 2011 (10% versus 6%) (Table 5)—a difference also observed among beneficiaries in fair or poor health (18% of black beneficiaries versus 13% of white beneficiaries). Hospital readmissions, which have been found to be higher among black beneficiaries, may be a factor in these results.43 ,44 

Figure 16: Percent of Medicare Beneficiaries with an Inpatient Hospital Stay and with an Emergency Department Visit During the Year, by Race/Ethnicity and Self-reported Health Status, 2011

Percent of Medicare Beneficiaries Reporting Use of Preventive Services in the Past Year, by Race/Ethnicity, 2011

Medicare covers routine preventive services, such as annual wellness exams and immunizations. In 2011, the share of beneficiaries receiving an influenza vaccination in the past year was higher among white beneficiaries (72%) than among black (55%) and Hispanic beneficiaries (59%) (Figure 17). Overall, more than one-third (37%) of male beneficiaries ages 50 and older reported receiving a prostate cancer screening in 2011, with no statistically significant differences by race or ethnicity. And half (50%) of all female beneficiaries ages 40 and older reported receiving a mammogram in the past year, with no significant differences by race or ethnicity. Previous research has identified racial and ethnic disparities in receipt of mammograms, but more recent research suggests that this gap has narrowed, consistent with the findings presented here.45 

Figure 17: Percent of Medicare Beneficiaries Reporting Use of Preventive Services in the Past Year, by Race/Ethnicity, 2011

Tables

Table 1: Percent of State Medicare Beneficiary Populations, by Race/Ethnicity, 2014
StateNumber of BeneficiariesPercent WhitePercent BlackPercent HispanicPercent Other Race/Ethnicity
United States Total50,546,00076%10%8%5%
Alabama850,00077%21%N/AN/A
Alaska71,00071%N/AN/A24%
Arizona1,031,00071%4%N/AN/A
Arkansas560,00082%14%N/AN/A
California5,272,00057%6%20%16%
Colorado772,00085%4%8%3%
Connecticut521,00082%8%7%N/A
Delaware173,00079%16%N/AN/A
District of Columbia77,00025%68%5%N/A
Florida3,804,00071%9%17%2%
Georgia1,431,00072%24%N/A2%
Hawaii231,00025%N/A4%70%
Idaho212,00093%N/A4%N/A
Illinois1,981,00075%13%6%5%
Indiana1,135,00092%6%N/AN/A
Iowa518,00097%2%N/AN/A
Kansas444,00086%4%N/A6%
Kentucky843,00094%5%N/AN/A
Louisiana635,00068%26%N/AN/A
Maine273,00096%N/AN/AN/A
Maryland865,00064%25%N/A7%
Massachusetts1,105,00082%6%7%6%
Michigan1,743,00084%12%2%2%
Minnesota848,00092%1%N/A5%
Mississippi495,00066%31%N/AN/A
Missouri1,050,00087%8%N/A3%
Montana182,00097%N/AN/AN/A
Nebraska306,00095%N/AN/AN/A
Nevada423,00069%7%10%13%
New Hampshire226,00096%N/AN/A3%
New Jersey1,417,00073%12%9%6%
New Mexico355,00064%N/A28%N/A
New York3,148,00071%11%11%8%
North Carolina1,641,00074%20%2%N/A
North Dakota105,00095%N/AN/AN/A
Ohio2,181,00086%11%N/AN/A
Oklahoma600,00083%7%N/A8%
Oregon764,00090%N/A3%6%
Pennsylvania2,375,00085%9%3%2%
Rhode Island174,00088%3%5%N/A
South Carolina834,00076%22%N/AN/A
South Dakota143,00094%N/AN/AN/A
Tennessee1,141,00085%13%N/AN/A
Texas3,384,00063%11%22%4%
Utah337,00093%N/A4%N/A
Vermont112,00098%N/AN/AN/A
Virginia1,212,00074%17%3%5%
Washington1,112,00084%3%4%9%
West Virginia389,00095%N/AN/AN/A
Wisconsin967,00091%4%2%N/A
Wyoming76,00094%N/A4%N/A
NOTE: Persons of Hispanic origin may be of any race; all other racial/ethnic groups are non-Hispanic. “Other” category includes Asians, Native Hawaiians and Pacific Islanders, American Indians, Aleutians, Eskimos and persons identifying two or more races. These groups have been combined due to their small populations in many states which prevent meaningful statistical analyses of the groups individually. N/A: estimates with relative standard errors greater than 30% are not provided and often correspond to low sample size.

SOURCE: Kaiser Family Foundation analysis of the March 2015 Current Population Survey Annual Social and Economic Supplement.

Table 2: Characteristics of Medicare Beneficiaries, by Race/Ethnicity, 2011
MeasureTotalWhiteBlackHispanic
Number of beneficiaries150.0 million38.2 million4.7 million4.5 million
Share of beneficiaries100%76%9%9%
Sex
Male45%45%43%49%
Female55%55%57%51%
Age in years
Under 6517%14%31%*23%*
65-7444%45%39%*45%
75-8426%27%21%*23%*
85+13%14%9%*8%*
Education level
Less than high school22%17%38%*46%*
High school graduate29%30%27%25%*
Some college or 2-year degree29%30%24%*21%*
College graduate or more20%23%11%*9%*
Metropolitan status
Metro77%74%85%*92%*
Non-metro23%26%15%*8%*
Type of residence
Community95%95%96%97%*
Facility5%5%4%3%*
Poverty level (2014)2
Less than 100%10%8%19%*18%*
100-199% FPL22%21%29%*30%*
Supplemental coverage3
Medicare Advantage28%26%29%45%*
Medicaid15%11%28%*22%*
Employer-sponsored28%32%20%14%*
Medigap14%17%3%*4%*
Other1%1%1%1%
None14%13%19%*14%
Prescription drug coverage
Enrolled in Part D57%55%66%*71%*
Enrolled in Part D with Low Income Subsidy (LIS)23%17%46%*38%*
NOTE: 1Sample includes all beneficiaries, including those who are enrolled for the entire year, those who become eligible during the year, and those who die during the year. 2Poverty estimates are for adults ages 65 and over during 2014. 3Supplemental coverage was assigned in the following order: 1) Medicare Advantage, 2) Medicaid, 3) employer-sponsored, 4) Medigap, 5) other public/private coverage, 6) no supplemental coverage. FPL is federal poverty level. *denotes statistically significant differences at the 95% confidence level from whites.

SOURCE: Kaiser Family Foundation analysis of the Medicare Current Beneficiary Survey Cost and Use File, 2011; 2014 poverty rates from March 2015 Current Population Survey Annual Social and Economic Supplement.

Table 3: Selected Measures of Health Status and Prevalence of Diseases/Chronic Conditions Among Medicare Beneficiaries, By Race/Ethnicity, 2011
MeasureTotalWhiteBlackHispanic
Number of beneficiaries150 million38.2 million4.7 million4.5 million
Self-reported health status    
Excellent/very good/good73%76%63%*64%*
Fair/poor27%24%37%*36%*
Activities of daily living (ADLs)2
One or more35%34%41%*36%
Cognitive/mental impairment331%29%34%37%*
Number of chronic conditions4
Less than 334%34%37%35%
3-439%39%39%40%
5+27%27%24%*25%
Diseases/chronic conditions    
Alzheimer’s disease7%7%8%9%*
Arthritis55%55%53%54%
Cancer (non-skin)18%19%13%*16%*
Depression28%27%26%35%*
Diabetes26%23%38%*38%*
Heart condition539%41%34%*32%*
Heart disease10%11%8%*9%
Heart failure8%8%9%6%
Hypertension68%66%79%*73%*
Mental condition631%30%31%38%*
Myocardial Infarction12%13%10%*11%
Osteoporosis/broken hip22%23%13%*20%
Parkinson’s disease1%2%N/A1%
Pulmonary condition20%20%19%17%
Stroke11%10%14%*12%
NOTE: 1Sample includes all beneficiaries, including those who are enrolled for the entire year, those who become eligible during the year, and those who die during the year. 2Activities of daily living are eating, dressing, getting into and out of bed or chair, taking a bath or shower, using the toilet, and difficulty walking. 3Cognitive/mental impairment is defined as presence of memory loss that interferes with daily activity, difficulty making decisions, trouble concentrating, and loss of interest within the past year. 4The count for chronic conditions includes diagnosis with Alzheimer’s disease, arthritis, diabetes, emphysema, hypertension, osteoporosis, Parkinson’s disease, pulmonary disease, skin cancer, non-skin cancer, stroke, incontinence, broken hip, and/or angina, chronic heart disease and other mental conditions. 5Heart condition is defined as diagnosis with hardening of arteries, angina, myocardial infarction, congestive heart failure, and/or problem with heart valves or heart rhythm or other heart disease. 6Mental condition is defined as presence of a mental disorder (excluding depression), mental retardation, depression, schizophrenia, and/or manic depression. *denotes statistically significant differences at the 95% confidence level from whites. N/A: estimates with relative standard errors greater than 30% are not provided and often correspond to low sample size.

SOURCE: Kaiser Family Foundation analysis of the Medicare Current Beneficiary Survey Cost and Use File, 2011.

Table 4: Selected Measures of Access to Care Among Medicare Beneficiaries, by Race/Ethnicity, 2013
MeasureTotalWhiteBlackHispanic
Number of beneficiaries148.9 million3606 million4.7 million4.6 million
Have a usual source of care95%96%94%92%*
No usual source of care5%4%6%8%*
Had trouble getting needed care6%5%7%*9%*
Had a health problem but did not see the doctor about it11%10%12%11%
Delayed care due to cost11%10%12%13%
Average doctor wait time (days)10.210.18.311.1
Average ER wait time (mins)464067*61*
Ease of getting to doctor
Very satisfied39%42%30%*30%*
Satisfied54%52%64%*60%*
Dissatisfied4%4%4%6%*
Very dissatisfied1%1%1%2%
No experience2%2%2%2%
Satisfied with the quality of care received
Very satisfied/satisfied94%95%93%*93%*
Dissatisfied/very dissatisfied3%3%5%*5%*
No experience2%2%2%3%
Ever been a resident/patient in a nursing home7%7%8%5%*
NOTE: 1Sample includes only those beneficiaries who are enrolled for the entire year. *denotes statistically significant differences at the 95% confidence level from whites.

SOURCE: Kaiser Family Foundation analysis of the Medicare Current Beneficiary Survey Access to Care File, 2013.

Table 5: Selected Measures of Service Utilization by Traditional Medicare Beneficiaries, by Race/Ethnicity and Self-reported Health Status, 2011
MeasureTotalWhiteBlackHispanic
Number of beneficiaries136.1 million28.3 million3.3 million2.5 million
Self-reported health statusTotalExc./Very good/ goodFair/ poorTotalExc./Very good/ goodFair/ poorTotalExc./Very good/ goodFair/ poorTotalExc./Very good/ goodFair/ poor
1+ inpatient stays19%14%30%19%15%31%21%14%33%15%*8%*25%
2+ inpatient stays7%4%13%6%4%13%10%*5%18%*6%N/A13%
Physician office visit78%77%79%80%80%81%71%*66%*77%68%*65%*74%
Any hospice days2%1%5%2%1%6%2%N/AN/A2%N/AN/A
1+ SNF stays5%3%10%5%3%11%5%N/A10%2%*N/AN/A
1+ ED visits29%23%44%28%22%44%37%*30%*47%29%22%40%
2+ ED visits12%8%23%12%8%23%19%*14%*26%11%7%19%
Any Rx events90%91%87%90%91%86%89%91%86%88%86%90%
Any dental events43%49%28%47%52%31%27%*30%*22%*30%*36%*22%
NOTE: 1 Sample includes all beneficiaries, including those who are enrolled for the entire year, those who become eligible during the year, and those who die during the year. Analysis excludes beneficiaries enrolled in Medicare Advantage. *denotes statistically significant differences at the 95% confidence level from whites. Excludes beneficiaries enrolled in Medicare Advantage. Exc. is excellent. SNF is skilled nursing facility. ED is emergency department. Rx is prescription drug. N/A: estimates with relative standard errors greater than 30% are not provided and often correspond to low sample size.

SOURCE: Kaiser Family Foundation analysis of the Medicare Current Beneficiary Survey Cost and Use File, 2011.

Endnotes

  1. P. Reynolds, “The Federal Government’s Use of Title VI and Medicare to Racially Integrate Hospitals in the United States, 1963 through 1967,” American Journal of Public Health, 87(11):1850-1858, November 1997. ↩︎
  2. P. Lee, “Battling for the Right Health Policy, Then and Now,” Generations, 39(2):15-20, Summer 2015. ↩︎
  3. Kaiser Family Foundation, “The Story of Medicare: A Timeline,” May 2015, available at: https://modern.kff.org/medicare/video/the-story-of-medicare-a-timeline/. ↩︎
  4. C. James, “Medicare and Minority Communities: Reflections on 50 Years of Progress and a Vision for the Future,” Generations, 29(2): 58-66, Summer 2015. ↩︎
  5. U.S. Centers for Disease Control, National Center for Health Statistics, Health, United States, 2014, Table 16: “Life expectancy at birth, age 65, and at age 75, by sex, race, and Hispanic origin: United States, selected years 1900-2013, available at: http://www.cdc.gov/nchs/data/hus/hus14.pdf#016. ↩︎
  6. R. Williams, “Medicare and Communities of Color,” National Academy of Social Insurance, No.11: November 2004. ↩︎
  7. M. Gornick, “A Decade of Research on Disparities in Medicare Utilization: Lessons for the Health and Health Care of Vulnerable Men,” The American Journal of Public Health, 98 (Suppl 1): S162-S168, September 2008. ↩︎
  8. S. Joshi et al, “Disparities among Blacks, Hispanics, and Whites in Time from Starting Dialysis to Kidney Transplant Waitlisting,” Transplantation, 95(2):309-18, January 2013. ↩︎
  9. M. Halpern, “Disparities in Timeliness of Care for U.S. Medicare Patients Diagnosed with Cancer,” Curr Oncol, 19(6):e404-e413, December 2012. ↩︎
  10. Centers for Medicare & Medicaid Services (CMS), “Medicare Hospital Readmission Among Minority Populations: 2007-2013 Trends and Disparities,” Winter 2015, available at: https://www.cms.gov/About-CMS/Agency-Information/OMH/Downloads/OMH_Dwnld-MedicareHospitalReadmissionsAmongMinorityPopulations.pdf. ↩︎
  11. K. Joynt et al, “Thirty-day Readmission Rates for Medicare Beneficiaries by Race and Site of Care,” JAMA, 305(7): 675-681, February 2011. ↩︎
  12. J. Ayanian, B. Landon, J. Newhouse, and A. Zaslavsky, “Racial and Ethnic Disparities among Enrollees in Medicare Advantage Plans,” The New England Journal of Medicine, 371(24): 2288-2297, December 2014. ↩︎
  13. A. Trivedi, A. Zaslavsky, E. Schneider, and J. Ayanian, “Trends in Quality of Care and Racial Disparities in Medicare Managed Care,” The New England Journal of Medicine, 353(7):692-700, August 2005. ↩︎
  14. E. Schneider, A. Zaslavsky, and A. Epstein, “Racial Disparities in the Quality of Care for Enrollees in Medicare Managed Care,” JAMA, 287(10):1228-1294, March 2002. ↩︎
  15. S. Wallace, “Equity and Social Determinants of Health Among Older Adults,” Generations, 38(4): 6-11, Winter 2014-2015. ↩︎
  16. G. Jacobson, J. Huang, T. Neuman, and K. Smith, “Wide Disparities in Income and Assets of People on Medicare by Race and Ethnicity,” Kaiser Family Foundation, September 2013, available at: https://modern.kff.org/medicare/report/wide-disparities-in-the-income-and-assets-of-people-on-medicare-by-race-and-ethnicity-now-and-in-the-future/. ↩︎
  17. K. Schulman et al, “The Effect of Race and Sex on Physicians’ Recommendations for Cardiac Catheterization,” N Engl J Med, 340(8):618-626, February 1999. ↩︎
  18. P. Bach et al, “Primary Care Physicians Who Treat Blacks and Whites,” JAMA, 351(6):575-584, August 2004. ↩︎
  19. Y. Li et al, “Nursing Staffing Hours at Nursing Homes with High Concentrations of Minority Residents, 2001-2011,” Health Affairs, 34(12):2132-2134, December 2015. ↩︎
  20. A. Barnato et al, “Hospital-level Racial Disparities in Acute Myocardial Infarction Treatment and Outcomes,” Med Care: 43(4): 308–319, April 2005. ↩︎
  21. J. Skinner, “Racial, Ethnic, and Geographic Disparities in Rates of Knee Arthroplasty among Medicare Patients,” N Engl J Med, 349(14):1350-9, October 2003. ↩︎
  22. R. Weech-Maldonado et al, “Language and Regional Differences in Evaluations of Medicare Managed Care by Hispanics,” Health Services Research, 43(2):552-568, April 2008. ↩︎
  23. N. Ponce et al, “Language Barriers to Health Care Access among Medicare Beneficiaries,” Inquiry, 43(1):66-76, Spring 2006. ↩︎
  24. R. Valdez et al, A Profile of Hispanic Elders, Horizons Project: Nationwide Demographic Report, Health Care Financing Administration, May 2000, available at: http://latino.si.edu/virtualgallery/growingold/Nationwide%20Demographic.pdf. ↩︎
  25. M. Heckler, The Heckler Report: Report of the Secretary’s Task Force on Black and Minority Health, U.S. Department of Health and Human Services, Office of Minority Health, 1985, available at: https://archive.org/details/reportofsecretar00usde. ↩︎
  26. Institute of Medicine, Unequal Treatment: Confronting Racial and Ethnic Disparities in Health Care, National Academies Press, 2002. ↩︎
  27. National Academy of Social Insurance, “Strengthening Medicare’s Role in Reducing Racial and Ethnic Health Disparities,” Medicare Brief No. 16, October 2006, available at: https://www.nasi.org/usr_doc/Medicare_Brief_No_016.pdf. ↩︎
  28. CMS, The CMS Equity Plan for Improving Quality in Medicare, September 2015, available at: https://www.cms.gov/About-CMS/Agency-Information/OMH/OMH_Dwnld-CMS_EquityPlanforMedicare_090615.pdf. ↩︎
  29. CMS, Guide to Preventing Readmissions among Racially and Ethnically Diverse Medicare Beneficiaries, January 2016, available at: https://www.cms.gov/About-CMS/Agency-Information/OMH/Downloads/OMH_Readmissions_Guide.pdf. ↩︎
  30. M. Boutaugh et al, “Closing the Disparity Gap: The Work of the Administration on Aging,” Generations, 38(4):107-118, Winter 2014-2015. ↩︎
  31. C. James, “Medicare and Minority Communities: Reflections on 50 Years of Progress and a Vision for the Future.” ↩︎
  32. Categories sum to more than 100% because Hispanics may be of any race. ↩︎
  33. R. Hummer and M. Hayward, “Hispanic Older Adult Health and Longevity in the United States: Current Patterns and Concerns for the Future.” Daedalus, 144(2):20-30, Spring 2015. ↩︎
  34. J. Lariscy et al, “Hispanic Older Adult Mortality in the United States: New Estimates and an Assessment of Factors Shaping the Hispanic Paradox,” Demography, 52(1):1-14, February 2015. ↩︎
  35. M. Hayward et al, “Does the Hispanic Paradox in U.S. Adult Mortality Extend to Disability?” Population Research and Policy, 33(1):81-96, February 2014. ↩︎
  36. For additional information about the official poverty measure and the SPM, both developed by the U.S. Census Bureau, and poverty rates among seniors, see J. Cubanski, G. Casillas, and A. Damico, “Poverty Among Seniors: An Updated Analysis of National and State Level Poverty Rates Under the Official and Supplemental Poverty Measures,” Kaiser Family Foundation, June 2015, available at: https://modern.kff.org/medicare/issue-brief/poverty-among-seniors-an-updated-analysis-of-national-and-state-level-poverty-rates-under-the-official-and-supplemental-poverty-measures/. ↩︎
  37. Income takes into account Social Security, pensions, earnings, and other income sources; including income from assets, rental income, and retirement account (IRA) withdrawals. Income is presented on a per person basis; for married people income is divided equally between spouses to calculate per capita income. For additional information, see G. Jacobson, C. Swoope, T. Neuman, and K. Smith, “Income and Assets of Medicare Beneficiaries, 2014–2030,” Kaiser Family Foundation, September 2015, available at: https://modern.kff.org/medicare/issue-brief/income-and-assets-of-medicare-beneficiaries-2014-2030/. ↩︎
  38. Total savings includes retirement account holdings (such as IRAs or 401Ks) and other financial assets, including savings accounts, bonds and stocks. Savings are presented on a per person basis; for married people, savings are divided equally between spouses to calculate per capita savings. For additional information, see G. Jacobson et al, “Income and Assets of Medicare Beneficiaries, 2014–2030.” ↩︎
  39. CMS, 2011 Health and Health Care of the Medicare Population, Table 2.4: “Self-Reported Health Conditions and Risk Factors of Medicare Beneficiaries, by Race/Ethnicity and Age, 2011.” ↩︎
  40. T. Neuman, G. Casillas, and G. Jacobson, “Medicare Advantage and Traditional Medicare: Is the Balance Tipping?” Kaiser Family Foundation, October 2015, available at: https://modern.kff.org/medicare/issue-brief/medicare-advantage-and-traditional-medicare-is-the-balance-tipping/ ↩︎
  41. Similarly, the National Health Interview Survey (NHIS) also finds lower shares of black and Hispanic beneficiaries reporting that they had seen or talked to a dentist in the past year compared with whites; see Centers for Disease Control and Prevention, National Center for Health Statistics, Health, United States, 2014, Table 84: “Dental visits in the past year, by selected characteristics: United States, selected years 1997-2013,” available at: http://www.cdc.gov/nchs/data/hus/hus14.pdf. ↩︎
  42. Kaiser Family Foundation, “Oral Health and Medicare Beneficiaries: Coverage, Out-of-Pocket Spending, and Unmet Need,” June 2012, available at: https://modern.kff.org/medicare/issue-brief/oral-health-and-medicare-beneficiaries-coverage-out/. ↩︎
  43. CMS, “Medicare Hospital Readmission Among Minority Populations: 2007-2013 Trends and Disparities.” ↩︎
  44. K. Joynt et al, “Thirty-day Readmission Rates for Medicare Beneficiaries by Race and Site of Care.” ↩︎
  45. Centers for Disease Control and Prevention, National Center for Health Statistics, Health, United States, 2014, Table 76: “Use of mammography among women aged 40 and over, by selected characteristics: United States, selected years 1987–2013,” available at: http://www.cdc.gov/nchs/data/hus/hus14.pdf. ↩︎

Michigan’s Medicaid Section 1115 Waiver to Address Effects of Lead Exposure in Flint

Published: Mar 7, 2016

Beginning almost two years ago, the water supply in Flint, Michigan was switched from Lake Huron to the Flint River in an effort to save money. As a result of the switch and failure to treat the water with an anti-corrosive agent, the water became contaminated with lead. While the water supply has been reverted back to Lake Huron, the issues of contamination continue leading the President to declare a state of emergency in Flint. The Medicaid program has a history of being used in prior emergencies to provide coverage and access to needed services. Not unlike emergencies after 9/11 in New York and Hurricane Katrina, Governor Rick Snyder submitted a Medicaid Section 1115 waiver proposal to the Centers for Medicare and Medicaid Services (CMS) in February 2016 to address the long-term health impacts from potential lead exposure from the contaminated water. Section 1115 authorizes experimental, pilot or demonstration projects that, in the judgment of the Health and Human Services (HHS) Secretary, promote the objectives of the Medicaid program. Under expedited review, the Centers for Medicare and Medicaid Services (CMS) approved the waiver on March 3, 2016. [endnote 178391-10] Key elements include:

  1. an expansion of Medicaid and Children’s Health Insurance Program (CHIP)1  eligibility for children and pregnant women with incomes up to 400% of the federal poverty level (FPL, $80,640 per year for a household of three in 2016) served by the Flint water system;
  2. a waiver of cost-sharing and premiums for Flint beneficiaries, and
  3. an expansion of the Medicaid Targeted Case Management benefit to coordinate health and related community support services for all Medicaid-eligible children and pregnant women served by the Flint water system.

An estimated 15,000 people will be newly eligible for coverage under the waiver and an additional 30,000 beneficiaries in the impacted area already are enrolled in Medicaid. Separate from the waiver, Michigan will use state funds to implement a program so individuals with income above 400 percent of poverty served by the Flint water system can purchase unsubsidized coverage.  The original waiver had requested funding to expand lead abatement activities which was not granted, but CMS will continue to work with the state to design a program using CHIP funds to support certain lead abatement activities that would complement other state and local efforts to remove lead hazards from the homes of Medicaid and CHIP eligible children and pregnant women.

Context for Consideration of the Flint Section 1115 Waiver

On January 16, 2016, the President declared a state of emergency as a result of the Flint water crisis. The lead exposure crisis in Flint started about two years ago when city’s water supply was switched from Lake Huron to the Flint River. The switch, ordered by the state-appointed emergency manager in April 2014, was part of an effort to save money because drawing water from the Detroit system that came from Lake Huron was expensive. The change was supposed to be temporary while a new system that would draw on Lake Huron was developed. Following the change in water supply, residents noticed that the water was brown and had a bad smell and taste. Many state and local officials assured residents that the water was safe. It later became apparent that the water from the Flint River was not being treated with an anti-corrosive agent like the water that had previously come from Lake Huron which resulted in lead in the water stream. In October 2015, the city’s water supply was changed to draw once again from Lake Huron; however, due to damage to the pipes, researchers are still detecting elevated lead levels in the water. A recent study of blood lead levels for children younger than 5 years in 2013 and in 2015 (both before and after the water source change in Flint, Michigan) showed that the incidence of elevated blood lead levels increased from 2.4% to 4.9%. The study further shows that certain neighborhoods experienced a 6.6% increase while there was no significant change observed outside the city.2 

The consequences of lead exposure are serious and long-lasting, especially for children. The Centers for Disease Control (CDC) say there is no safe level of lead, but concerns are raised once a child reaches five micrograms of lead per tenth-of-a-liter of blood. Children under the age of 6 are most vulnerable to the effects of lead exposure. Initially, lead poisoning can be hard to detect. Signs and symptoms usually do not appear until dangerous amounts have accumulated. Typical symptoms of lead poisoning in children could include learning difficulties, irritability, loss of appetite, weight loss, sluggishness and fatigue, abdominal pain, vomiting, constipation, hearing loss and in cases of very high exposure, seizures, coma and death. Babies who are exposed to lead before birth may experience learning difficulties and slowed growth.3 

Residents in Flint, Michigan are disproportionately Black compared to the county and the state. Flint, located in the south east part of the state, has a total population of just under 100,000 and more than half of Flint residents are Black. (See Figure 1 and Table 1) Flint residents are less likely than other residents of the state to live in a family with a full-time worker. Tied to work status, residents in Flint are also more likely to be poor compared to the county and state.

Figure 1: Michigan Nonelderly Population by County, 2010-2014


Table 1: Selected Demographic Characteristics of the Flint, Michigan Population,Compared to the Genesee County, Michigan and Michigan Overall, 2014
 Flint, MIGenesee County, MIMichigan
Race/Ethnicity
White39%72%76%
Black51%20%14%
Hispanic4%3%5%
Other Race/Ethnicity6%4%6%
Poverty
<100%40%22%16%
100-200%24%19%18%
200% +36%59%65%
Age
0-2031%27%27%
21-6458%57%58%
65+12%16%15%
Citizenship Status
U.S.-Born Citizen99%97%94%
Naturalized Citizen1%2%3%
Non-Citizen0%1%3%
Educational Attainment of Nonelderly Adults (18-64)
Less than High School17%10%9%
High School Grad/Some College/Assoc. Degree73%70%65%
College Grad or Greater10%19%26%
Employment Characteristics of Nonelderly
Households with at Least 1 Full-time Worker71%76%82%
NOTE: Data may not sum to 100% due to rounding and data restrictions.SOURCE: Kaiser Family Foundation estimates based on the Census Bureau’s 2014 American Community Survey 1 year estimates.

Medicaid traditionally has covered lead testing and treatment for Medicaid-eligible children through the Early Periodic Diagnostic and Treatment (EPSDT) program. In 2012, CMS updated its policy to align with Centers for Disease Control recommendations that allow states to request targeted lead screening rather than universal screening for all Medicaid eligible children ages 1 and 2. The CMS policy encourages state Medicaid agencies to work with their state health departments and provider organizations to ensure that children are receiving necessary blood lead testing. CMS’s policy further states that “[w]hile primary prevention is the best way to avoid exposing young children to lead, lead screening is critically important for identifying children with elevated blood levels and referring them for a developmental assessment and educational services they are entitled to receive.”4  States are required to provide medically necessary diagnostic and treatment services for children identified with elevated blood lead levels, including case management services and a one-time investigation to determine the source of lead.5  Lead abatement services are typically not covered through Medicaid.

Medicaid has been used during past emergencies to provide temporary coverage and access to needed health care services to individuals not otherwise eligible. For example, approximately 350,000 New Yorkers were covered by Disaster Relief Medicaid (DRM) in a four-month time period following the September 11th attacks in 2001. DRM allowed for a simplified expedited application process, expanded income eligibility guidelines and new immigrant eligibility rules to make more New Yorkers eligible for coverage in the immediate aftermath of the disaster.6  Following Hurricane Katrina, states directly affected by the storm as well as those hosting evacuees turned to Medicaid and CHIP to help meet the physical and mental health care needs of those affected. In September 2005, the Department of Health and Human Services (HHS) released a new waiver initiative designed to assist states in providing temporary Medicaid coverage to certain groups of evacuees. Under the waivers, states could get expedited approval to provide up to five months of Medicaid or CHIP coverage to certain evacuees meeting suggested eligibility guidelines and receive authorization for an “uncompensated care pool” that could be used to reimburse providers for the costs of furnishing services to uninsured evacuees who did not qualify for Medicaid or CHIP and to pay for services not otherwise covered under Medicaid or CHIP (including mental health counseling). By December 2005, 17 of these waivers had been approved.7 

Key Components of the Waiver Request for Flint

Eligibility and Enrollment

Michigan’s waiver proposes to expand Medicaid eligibility for an estimated 15,000 children and pregnant women with incomes up to 400% FPL who are or were served by the Flint water system.  The expanded coverage groups include children up to age 21 who were served by the Flint water system between April 2014 and the date on which the Flint water system is deemed safe by the appropriate authorities (including children born to pregnant women eligible under the waiver) and pregnant women served by the Flint water system between the date of waiver approval and the date on which the Flint water system is deemed safe by the appropriate authorities. There will be 60 days advance public notice of the end date and at least a 30 day comment period.

Children would remain eligible until age 21, and pregnant women would remain eligible for the duration of their pregnancy and two months post-delivery. Consistent with other poverty-related coverage groups, income would be determined using Modified Adjusted Gross Income (MAGI) methodologies and no asset test. Under current eligibility rules in Michigan, children are eligible for CHIP in households with income up to 217% FPL ($43,747 per year for a household of 3 in 2016)8  and pregnant women are eligible for Medicaid up to 200% FPL ($40,320 per year for a household of 3 in 2016).

The state will implement a separate program, funded with state dollars for children and pregnant women with higher incomes.  Children up to age 21 and pregnant women with household incomes above 400% FPL served by the Flint water supply could buy-in to unsubsidized coverage under the separate state program.

The state plans to use a streamlined application process and electronic passive renewals to facilitate the enrollment and retention of eligible individuals in coverage under the waiver. Renewals would occur at least annually to verify income and residency. The state also plans to engage in targeted outreach efforts, such as using eligibility specialists in schools, health care facilities and other community locations to assist individuals with the application process. Current Medicaid beneficiaries who lose eligibility before the Flint water system is deemed safe may be reevaluated for eligibility under the expanded coverage provisions in the waiver.

Benefits and Cost-Sharing

Children and pregnant women newly eligible for coverage under the waiver will receive all Medicaid state plan benefits, including EPSDT up to age 21, non-emergency medical transportation, and Maternal Infant Health Program services. Benefits will be provided through the state’s existing capitated Medicaid managed care delivery system.

Michigan’s waiver approval waives CHIP premiums for all children who are or have been served by the Flint water system, including those currently eligible and those newly eligible under the waiver. Michigan’s CHIP program charges premiums for those with incomes from 160-212% FPL. Children and pregnant women newly eligible for Medicaid under the waiver will not be subject to any cost-sharing, consistent with existing state rules for those groups.

Under the waiver, Michigan offers face-to-face Targeted Care Management (TCM) services to all Medicaid-eligible children and pregnant women served by the Flint water system (including those newly eligible under the waiver and those already eligible). TCM will include services such as comprehensive assessment; development and management of individualized care plans; communication with beneficiaries’ primary care physicians and health plans; coordination of physical and behavioral health-related services, nutritional supports, and early education programs; and referrals to and assistance with obtaining additional social supports, such as financial, housing and transportation assistance and lead assessment and abatement resources. TCM services will be provided by certain organizations approved by the state in consultation with stakeholders, and TCM case managers will be licensed registered nurses or social workers.

Lead Abatement

CMS will continue to work with Michigan on a program to address lead abatement.  The original waiver had requested funding to expand lead abatement activities which was not granted, but CMS will continue to work with the state to design a program using CHIP funds to support certain lead abatement activities that would complement other state and local efforts to remove lead hazards from the homes of Medicaid and CHIP eligible children and pregnant women.

Michigan proposes to enhance and expand its current lead abatement program for homes in the impacted area. Abatement services include the permanent enclosure or encapsulation of lead based paint, replacement of surfaces or fixtures, the removal or covering of soil lead hazards, and cleanup and post-abatement clearance testing. The waiver also requests funding to train individuals in lead abatement.

Costs and Timeline

Given the emergency nature of the waiver request, there was an expedited review and approval of the waiver.  CMS waived the federal and state public notice processes to provide a timely response to the public health emergency in Flint, Michigan. The state’s proposal was posted concurrently for public comment at the state and federal levels beginning February 16, 2016.  CMS stated that public comments received were considered as they finalized the terms and conditions of the demonstration.

CMS and the state will finalize a budget neutrality agreement by March 15, 2016.

Evaluation

The state expects the Flint waiver to identify and address physical and behavioral health issues associated with actual or potential lead exposure and to reduce the number of individuals potentially exposed to lead in the affected area through expanded lead abatement activities. The waiver will test the following hypotheses:  (1) whether expanded Medicaid and CHIP eligibility will provide access to services to identify and address physical and behavioral health issues associated with lead exposure; (2) whether TCM services will assist enrollees with gaining access to needed services; (3) whether enrollees will have improved health outcomes compared to others with similar levels of lead exposure, and (4) whether the lead hazard investigation program will reduce estimated expected ongoing or re-exposure to lead hazards in the absence of this program.  The state must submit a draft evaluation design to CMS within 120 of the approval of the waiver.  The design will include the outcome measures to be used in the evaluation.

Looking Ahead

In addition to the Medicaid waiver, federal and state policy makers are working on other supports for Flint. Multiple federal agencies lead by the Department of Health and Human Services, are supporting state and city officials in responding to the crisis in Flint9  Other federal agencies involved include the Federal Emergency Management Agency, the Environmental Protection Agency, the Small Business Administration, the Department of Housing and Urban Development, the Department of Education and the Department of Agriculture. Key support include help to ensure a safe water supply and to provide immediate access to safe water; help addressing the physical and mental health needs of children and families potentially impacted by lead-contaminated water, assisting the state and city residents to understand the impacts of lead on health and support in responding and recovering from the economic impact of the crisis. Specifically, HHS awarded $500,000 to support Flint directed to two area health centers would share in the funds to improve the screening and care for patients afflicted by Flint’s toxic water crisis. Additional state efforts are also underway.

While federal and state authorities have taken other measures to address the immediate public health emergency resulting from the water contamination in Flint, the Medicaid waiver will help to address the health effects of potential lead exposure over the longer term. The waiver focuses on particularly vulnerable populations including children and pregnant women. It includes features of Medicaid, such as its EPSDT benefit for children and TCM, which provide comprehensive health care and coordination with other services to minimize and prevent long-term adverse health effects from potential lead exposure.

  1. Michigan converted its separate CHIP program to a CHIP-funded Medicaid expansion program as of January 2016. https://modern.kff.org/health-reform/state-indicator/medicaid-and-chip-income-eligibility-limits-for-children-as-a-percent-of-the-federal-poverty-level/#note-11 ↩︎
  2. Mona Hanna-Attisha, MD, MPH, Jenny LaChance, MS, Richard Casey Sadler, PhD, and Allison Champney Schnepp, MD. Elevated Blood Lead Levels in Children Associated With the Flint Drinking Water Crisis: A Spatial Analysis of Risk and Public Health Response. AJPH, Vol 106, No. 2, February 2016. http://ajph.aphapublications.org/doi/pdf/10.2105/AJPH.2015.303003 ↩︎
  3. Mayo Clinic Overview of Lead Poisoning, June 10, 2014, http://www.mayoclinic.org/diseases-conditions/lead-poisoning/basics/symptoms/con-2003548787 ↩︎
  4. CMCS Informational Bulletin, June 22,2012. https://www.medicaid.gov/federal-policy-guidance/downloads/cib-06-22-12.pdf ↩︎
  5. State Medicaid Director Letter, October 22, 1999. https://www.medicaid.gov/Federal-Policy-Guidance/DOWNLOADS/SMD102299.PDF ↩︎
  6. New York’s Disaster Relief Medicaid: Insights and Implications for Covering Low-Income People, July 20, 2002. https://modern.kff.org/medicaid/report/new-yorks-disaster-relief-medicaid-insights-and/ ↩︎
  7. A Comparison of the Seventeen Approved Katrina Waivers, January 2006. https://modern.kff.org/medicaid/fact-sheet/a-comparison-of-the-seventeen-approved-katrina/ ↩︎
  8. Michigan converted its separate CHIP program to a CHIP-funded Medicaid expansion program as of January 2016. https://modern.kff.org/health-reform/state-indicator/medicaid-and-chip-income-eligibility-limits-for-children-as-a-percent-of-the-federal-poverty-level/#note-11 ↩︎
  9. Federal Support for State and Local Response Operations, as of February 24, 2016. http://www.phe.gov/emergency/events/Flint/Pages/USGresponse-24Feb16.aspx   ↩︎

Assessing ACA Marketplace Enrollment

Authors: Larry Levitt, Gary Claxton, Anthony Damico, and Cynthia Cox
Published: Mar 4, 2016

As of the end of the third open enrollment under the Affordable Care Act (ACA), 12.7 million people had signed up for coverage in the health insurance marketplaces, up from 11.7 million last year and 8.0 million in 2014.

Actual enrollment will end up somewhat lower than this because some people will not pay their premiums or will have their coverage terminated due to inconsistencies on their applications, and there is typically additional attrition as the year progresses (e.g., as some enrollees get jobs with health benefits). For example, in 2015 paid enrollees totaled 10.2 million as of end of March and 9.3 million as of the end of September. If a similar pattern holds, actual enrollment should end 2016 over 10 million, which was the target established by the Department of Health and Human Services (HHS). (There are reasons to believe that attrition may be lower this year, including the fact that terminations occurring during open enrollment have already been subtracted from official signup figures, which was not the case previously.)

While enrollment is in line with the HHS target announced in advance of this year’s open enrollment, it is short of earlier projections by the Congressional Budget Office (CBO), which became an implicit yardstick for judging the law. In March 2015, CBO projected average monthly marketplace enrollment of 21 million in calendar year 2016, though recently lowered that forecast to 13 million.

In this analysis, we look at why enrollment may be lower than projected by CBO and discuss the potential for future enrollment growth.

Why Is Enrollment Lower Than Projected?

There are several reasons why marketplace enrollment may be lower than what CBO projected:

The availability of employer coverage has not declined. People with access to affordable employer coverage are not eligible for marketplace premium subsidies, so there was an expectation that some employers might drop coverage to allow their employees to take advantage of those subsidies.

CBO projected a decline in employer coverage relative to what would have happened in the absence of the ACA of 1 million people in 2015 and 6 million in 2016. So far, there are no signs of such a decline due to the ACA. A federal survey of employers found that fewer private sector employees were in establishments that offered health insurance coverage in 2014 as the ACA took effect, but that was consistent with a longer term trend that predated the ACA. The Kaiser-HRET Employer Health Benefits Survey showed 57% of firms offering health benefits in 2015, statistically unchanged from 55% in 2014.

It may be that the incentives for employers to maintain health benefits are more powerful than expected, at least so far. Employers with 50 or more full-time employees face penalties under the ACA if they do not offer affordable coverage to their full-time workers, and employer-based insurance benefits are provided tax-free to employees.

Many people are still buying their own insurance outside of the marketplaces. There are three types of individual coverage outside of the marketplaces:

  • ACA-compliant plans. Anyone buying individual coverage effective starting January 1, 2014 had to purchase an ACA-compliant plan, whether it was offered inside a marketplace or on the outside market. These plans must follow virtually all of the same rules as marketplace plans – including no discrimination against people with pre-existing conditions and inclusion of essential health benefits – and their premiums are set as part of one insurance risk pool. The main distinguishing feature is that premium subsidies for low and middle-income enrollees are only available inside a marketplace. For people not eligible for premium subsidies, there is little advantage to buying through the marketplace. Insurers and brokers may also prefer the application process outside of the marketplaces when enrolling people not eligible for premium subsidies.
  • “Grandfathered” plans. These are plans that were purchased prior to the enactment of the ACA in March 2010, and can exist in perpetuity largely under pre-ACA insurance rules. Given substantial turnover in the individual insurance market, the prevalence of these plans will diminish over time.
  • “Transitional” plans. These plans – also referred to as “grandmothered” coverage – include coverage that was purchased after the enactment of the ACA but before the beginning of the first open enrollment period in October 2013. Following controversy over these plans being cancelled because they did not comply with new insurance market rules taking effect in 2014 under the ACA, the Obama Administration issued guidance that permits these plans to remain in effect until December 31, 2017). The federal rules granted discretion to states and individual insurers, so transitional plans have not been allowed to continue in all cases.

Current data regarding how many people are purchasing individual coverage outside of the marketplaces is difficult to come by. As of the end of 2014, we estimated that 57% of all individual market coverage was purchased outside of the marketplaces (including ACA-compliant, grandfathered, and transitional plans). That share may have fallen since then as market churn lowers the number of grandfathered and grandmothered policies. However, it is still quite common for people not eligible for subsidies to buy in the outside market, evidenced by the fact that 82% of marketplace enrollees are receiving subsidies. There is, in some sense, an artificial distinction between ACA-compliant plans purchased on or off the marketplaces, since they offer equivalent coverage and are part of the same insurance risk pool.

Affordability remains a challenge. A recent Kaiser poll found that the overwhelming reason why people who are uninsured say they are uncovered is cost – 46% of uninsured, non-elderly adults say they tried to get coverage but found that it was too expensive. However, it is difficult to separate lack of affordability from lack of awareness of financial help that may be available, which could be addressed through more intensive outreach. For example, going into this last open enrollment period, another poll found that 82% of uninsured adults had not been contacted in the previous 6 months about the health law.

One way to gauge where affordability or outreach challenges may exists is to look at how the number of people uninsured has changed by income group. Figure 1 shows the change in the number of uninsured in the first year of the ACA among those who are potential purchasers of marketplace coverage (i.e., those who are ineligible for Medicaid or employer coverage and are not undocumented immigrants, excluding people below poverty in states that have not expanded Medicaid).

Figure 1: Reduction in the Marketplace-Eligible Uninsured by Poverty Level, 2013-2014

The two groups that saw the least gains in coverage were those who were very low income (below 150% of the poverty level) and those with incomes 300-400% of the poverty level.

The lowest income group qualifies for the biggest premium subsidies, but they still generally have to pay something towards the premium (up to about 4% of income for those at 150% of poverty to enroll in a benchmark Silver plan). And, while cost-sharing subsidies are available to enrollees with incomes up to 250% of the poverty level, the deductibles and copays may still feel high for a family struggling with a very low income. These low-income households – who would mostly qualify for Medicaid if their states chose to expand eligibility up to the ACA standard of 138% of the poverty level – may also be hard to reach given their often unstable financial and employment circumstances.

Those with incomes 300-400% of the poverty level had the smallest gains in coverage. Premium subsidies phase out quickly in that income range, and may provide insufficient incentive for them to purchase insurance.

Surprisingly, there was a 22% decline in the number of marketplace-eligible uninsured with incomes above 400% of the poverty level, given that they are not eligible for any premium subsidies. It may be that the so-called “individual mandate” had an effect on this group. Some people were also likely excluded from insurance previously because they had pre-existing health conditions.

What Is A Reasonable Expectation for Future Marketplace Enrollment Growth?

While marketplace enrollment has continued to grow in the third year of operation, that growth is slower than it was in year two – an increase of 1 million plan selections during 2016 open enrollment versus 3.7 million in 2015.

A key question for the future of the marketplace is whether enrollment will continue to grow and by how much. Enrollment growth is important for several reasons, including:

  • Higher enrollment among those who would otherwise be uninsured would increase the number of people with insurance, which is a primary aim of the ACA.
  • Since it is likely the case that many people who are sick already obtained coverage once pre-existing condition exclusions were prohibited starting in 2014, increasing enrollment would bring healthier people into the risk pool and help to stabilize premiums.
  • A growing market would be more attractive to insurers, whose participation is central to the success of the marketplaces.

Any effort to forecast marketplace enrollment is subject to substantial uncertainty, as illustrated by the wide gap between what CBO has projected and actual enrollment so far. One way to estimate potential growth is to look at the experience of the top-performing states.

We estimate that the 12.7 million signups so far represent 46% of the “potential market” for the marketplaces. The potential market includes people who are uninsured or purchasing their own coverage. It excludes those who have an employer offer of insurance, are eligible for Medicaid, are undocumented immigrants, or who have incomes below the poverty level and live in states that have not expanded Medicaid (the methodology for this calculation can be found here.)

The 10 best-performing states – which include several large states such as Florida, North Carolina, and California — have collectively signed up 59% of the potential market. While that might appear to leave room for substantial further growth, there are reasons to believe that enrollment has close to plateaued in those states. The potential market includes people who are buying their own coverage outside the marketplaces, many of whom do not qualify for subsidies. The experience so far is that the vast majority (82%) of marketplaces enrollees are receiving premium subsidies, while people who are ineligible for subsidies typically buy coverage on the outside market. In fact, we estimate that in the top-performing states the number of people who have selected a plan and qualified for a subsidy represents more than 90% of subsidy-eligible people. This is a very high take-up rate for a public program, suggesting there is very little potential for growth in these states. The only way enrollment could grow substantially is to attract people not eligible for subsidies who are already buying their own coverage directly.

However, there is still considerable room for enrollment growth among states that have enrolled a lower share of the potential market. If all states improved to at least the average of the 10 best-performing states, we estimate that total marketplace signups would reach 16.3 million. Assuming that around 10% of these people would not pay their first month’s premium, this would translate into an “effectuated” enrollment total of 14.7 million. This may provide a reasonable estimate of a ceiling on what marketplace enrollment could grow to over the next several years, assuming current levels of premium subsidies and outreach.

Figure 2: Marketplace Plan Selections (Millions)

Discussion

Marketplace enrollment under the ACA is lower than projected, though signups continue to grow and the program appears sustainable overall. It is important that enrollment continue to grow to fulfill expectations for reducing the number of people uninsured, to keep premiums stable, and to remain attractive to insurers. Since insurance risk is pooled at the state level, problems in certain states could develop if enrollment stagnates and skews towards sicker-than-average individuals.

Judging by the experience of the top performing states, there is considerable room for enrollment growth over the next several years. However, even if all states signed people up at the rate of the top 10 states, enrollment would still fall well short of projections by CBO, suggesting that those forecasts may have been unrealistic.

There are a number of areas of uncertainty that will affect marketplace enrollment. Enrollment could grow if larger numbers of employers drop health benefits for their workers, or if the buying experience in the marketplaces continues to improve and attracts people now buying their own insurance in the outside market. The pool of purchasers could also grow as transitional policies get terminated over the next year and a half. On the other hand, enrollment could shrink if more states expand Medicaid, pulling people with incomes between 100% and 138% of the poverty level out of the marketplace. There are also concerns that some existing enrollees may drop coverage if premiums become unaffordable or the cost-sharing is too high to offer sufficient value.

There are signs that marketplace coverage could continue to grow modestly in the years ahead. But, absent a substantial boost in outreach or changes to the subsidies to make insurance more affordable, substantial increases in marketplace enrollment are unlikely.

News Release

New Analysis Suggests ACA Marketplace Enrollment Could Grow Modestly Over Next Few Years, up to 16.3 Million Sign-Ups, 14.7 Million Enrollees after Attrition

Published: Mar 4, 2016

A new analysis from the Kaiser Family Foundation finds that sign-ups in Affordable Care Act marketplace plans could continue to grow modestly over the next few years to 16.3 million (up 28%), based on the experience of the top-performing states.

Assessing ACA Marketplace Enrollment examines factors that may have kept enrollment in 2016 from reaching early projections, including smaller declines than expected in employer coverage and a substantial number of people buying their own insurance outside of the marketplaces. The analysis estimates that if all states performed at least as well as the top 10 states, the number of people signing up during annual open enrollment periods could reach 16.3 million (14.7 million after attrition when some enrollees fail to pay premiums, called effectuated enrollment), up from 12.7 million this year. This would still be less than enrollment of over 20 million projected by the Congressional Budget Office.

aca-marketplace-plan-sign-ups_email.png

The analysis also charts coverage gains from 2013 to 2014 for uninsured people eligible for ACA marketplace plans. It shows that the biggest coverage gain came for people with incomes between 150 and 200 percent of the federal poverty level, who qualify for substantial premium subsidies under the health law. The number of marketplace-eligible people without insurance in that group declined by 33 percent during that period. The two groups experiencing the smallest gains in coverage were those with incomes below 150 percent of the federal poverty level (18% reduction in marketplace-eligible uninsured) and those with incomes between three and four times the poverty level (14% reduction).

Medi-Cal Managed Care: An Overview and Key Issues

Authors: Margaret Tatar, Julia Paradise, and Rachel Garfield
Published: Mar 2, 2016

Executive Summary

California’s Medicaid program, Medi-Cal, is the largest state Medicaid program in the nation, insuring almost one-third of California’s more than 38 million residents. In the early 1970s, California was the first state to enter into risk contracts with managed care plans to serve some Medicaid beneficiaries, rather than pay for services on a fee-for-service (FFS) basis. Over the decades since that time, Medi-Cal has been progressively moving more beneficiaries into managed care. More than three-quarters of all Medi-Cal beneficiaries, including low-income children, adults, seniors, and people with disabilities, are now enrolled in managed care plans. Besides being the earliest Medicaid managed care program and, by far, the largest in the nation, at nearly 10 million enrollees, the Medi-Cal managed care program has a unique structure, an outgrowth of underlying historical differences in the health care systems and traditions in different counties of the state. As other state Medicaid programs increase their use of risk-based managed care, and policymakers, plans and providers, and advocates seek to understand and learn from developments in this area to guide future change, a review of Medi-Cal’s managed care evolution is both timely and illustrative. It also serves to illuminate some potential implications of the proposed rule on Medicaid managed care issued by the federal Centers for Medicare & Medicaid Services (CMS)  and expected to be finalized in the Spring of 2016, which represents a major overhaul of current regulatory requirements and standards.

A number of observations stand out from this review:

  • County-based structure. California’s managed care program is unique, involving six different managed care models, shaped by the historical and continuing role of counties in financing and delivering primary care, public hospital services, mental health services, and certain long-term services and supports to poor and medically indigent residents. More than two-thirds of all Medi-Cal managed care enrollees are enrolled in public safety-net plans; the others are served by a mix of commercial and private non-profit health plans.
  • Phased managed care expansion. In the early days of the state’s managed care program, in a limited number of counties, managed care enrollment was mandated for nearly all Medi-Cal beneficiaries, including seniors and people with disabilities. Over time, California has expanded mandatory managed care to additional counties and to broader segments of the beneficiary population, including seniors and people with disabilities statewide, under the state’s “Bridge to Reform” section 1115 waiver (2011); children who were transitioned from CHIP to Medi-Cal (2013); low-income adults covered previously through the state Low Income Health Program and those newly eligible for Medi-Cal under the ACA (2014); and, under the state’s seven-county Financial Alignment Demonstration and on a voluntary basis, beneficiaries dually eligible for Medicare and Medicaid (2014).
  • Access to care. Problem with access to care in Medi-Cal FFS carry over into managed care, challenging Medi-Cal health plans to establish adequate provider networks and improve care. Gaps in access to certain specialists, including psychiatrists and other behavioral health providers, and long-term care services, are the most significant gaps. Providers have cited Medi-Cal’s low payment rates as a barrier to their participation in the program and sued the state on the basis that the fees violate federal Medicaid payment standards. Language and cultural gaps in access to care and gaps in rural access are additional issues.
  • Benefit carve-outs. Medi-Cal managed care plans provide for most primary and acute care services. However, certain services are “carved out” from managed care contracts. In particular, while mental health services for mild or moderate mental illness are included in plan contracts, specialty mental health services and substance use disorder treatment continue to be delivered through county mental health departments and local and county alcohol and drug programs. In most counties, nursing home care and certain home and community-based services (HCBS) are also carved out of managed care.
  • Managed long-term services and supports. In 2014, under its Coordinated Care Initiative in seven counties, California required all Medi-Cal beneficiaries, including dually eligible enrollees who were previously exempt from managed care, to enroll in a managed care plan to receive their Medi-Cal benefits, including nursing home and certain HCBS.
  • Transitions for people with complex needs. California’s experience shows that robust transition planning is necessary to minimize disruptions in care for beneficiaries with complex needs who are required to move from FFS to managed care. Beneficiary and provider engagement, timely transfers of data, continuity of care protections, beneficiary information and navigation assistance, and coordination with carve-out services emerge as essential elements of sound transitions.
  • Increasing focus on metrics, performance, and accountability. California has taken significant steps to improve the data reported by Medi-Cal managed care plans, which are needed for rate-setting, managed care monitoring, efforts to move to value-based purchasing. The state also established a managed care performance dashboard that makes plan-level quality and other data available to the public, increasing the program’s transparency and plan accountability.
  • Major current issues. Two recent developments – CMS’ proposed modernization of the Medicaid managed care regulations and the approval of “Medi-Cal 2020,” the renewal of California’s section 1115 waiver – can be expected to bear on the Medi-Cal managed care program, by increasing plan- and state-level requirements and state oversight responsibilities, and by setting the stage for potential changes in the role and operation of managed care plans in a transforming health care delivery and payment system.

Issue Brief

California’s Medicaid program, Medi-Cal, is the largest state Medicaid program in the nation. Insuring almost one-third of California’s more than 38 million residents,1  Medi-Cal is a key source of health coverage in the state and the main source of coverage for low-income children, adults, and people with disabilities. It also provides wrap-around coverage for many elderly Medicare beneficiaries in the state.

For several decades, Medi-Cal has been transitioning away from a fee-for-service (FFS) payment and delivery system to one that relies on risk-based managed care. Under the FFS system, beneficiaries could see any provider who accepted Medi-Cal, and providers were reimbursed for each individual service or visit. Under managed care, the state contracts with health plans to deliver Medi-Cal benefits to enrollees in exchange for a monthly premium, or “capitation” payment for each enrollee. The plans are accountable for and at financial risk for providing the services in the contract.

California was the first state to pilot managed care in Medicaid, beginning in the early 1970s, and the Medi-Cal managed care program has a unique structure that grew out of the different health care delivery and financing systems in different counties of the state. Over time, California has transitioned progressively more Medi-Cal beneficiaries into managed care, and its program is, by far, the largest Medicaid managed care program in the nation, with nearly 10 million children, adults, seniors, and people with disabilities – or more than three-quarters of all Medi-Cal beneficiaries – enrolled in plans.

In its early managed care pilot programs, California awarded contracts to health plans to serve Medi-Cal beneficiaries in a specified county or service area. Over time, the Department of Health Care Services (DHCS), California’s Medicaid agency, expanded the reach of its managed care program to include additional counties. Later, as part of the “California Bridge to Reform Demonstration,” a Section 1115 waiver approved by CMS in November 2010,2  the state extended mandatory managed care to seniors and people with disabilities enrolled in Medi-Cal. California opted to expand Medi-Cal eligibility under the Affordable Care Act (ACA), greatly increasing the number of Medi-Cal beneficiaries overall and in managed care plans. As of July 2015, 77% of Medi-Cal beneficiaries were enrolled in Medi-Cal managed care plans,3  and in October 2015, over 10 million beneficiaries were enrolled in Medi-Cal managed care plans.4  In addition, DHCS has collaborated with the Centers for Medicare and Medicaid Services (CMS) to launch a demonstration program in seven large counties under which beneficiaries who are dually eligible for Medicare and Medicaid may enroll in capitated managed care plans that provide the full range of services covered by both programs, including managed long-term services and supports (MLTSS).

As other states increase their reliance on risk-based managed care to serve their Medicaid beneficiaries, this review of California’s transition to a largely managed care-based Medicaid program is both timely and informative for Medicaid’s many stakeholders. It also serves to highlight some potential implications for Medi-of CMS’ proposed rule on Medicaid managed care, a major overhaul of the current regulations that is expected to be finalized in the Spring of 2016.

Structure of Medi-Cal Managed Care Program

County-Based Managed Care Models

A distinguishing feature of Medi-Cal’s managed care program is that different managed care models operate in different counties (Figure 1), shaped strongly by the historical role of the counties in the financing and delivery of primary care, public hospital services, mental health services, and certain long-term services and supports to poor and medically indigent residents. In the 1980’s, the first Medi-Cal managed care programs began as County Organized Health System (COHS) plans, including the Health Plan of San Mateo and Santa Barbara Regional Health Authority, operating under Section 1915(b) waivers. COHS plans were created by counties, with mandatory enrollment for virtually all Medi-Cal beneficiaries in the county service area (including seniors and persons with disabilities) and with almost all Medi-Cal services covered. In the early 1990’s, Medi-Cal expanded its managed care program by adding more COHS plans (e.g., Partnership Health Plan serving Solano and Napa Counties, CalOptima serving Orange County, and Central California Alliance for Health serving Santa Cruz and Monterey Counties).

 Medi-Cal Managed Care Models

County Organized Health System (COHS). A health plan created and administered by a County Board of Supervisors. Within a COHS county, all managed care enrollees are in the same plan. (22 counties)

Two-Plan Model. This model is comprised of a publicly-run entity (a “Local Initiative”) and a commercial plan. (14 counties)

Geographic Managed Care (GMC). In this model, DHCS contracts with a mix of commercial and non-profit plans that compete to serve Medi-Cal beneficiaries. (2 counties)

Regional Expansion Model. DHCS contracts with two commercial plans in each county. (18 counties)

Imperial Model. This model only operates in Imperial County where DHCS contracts with two commercial plans.

San Benito (Voluntary) Model. This model only operates in San Benito County where DHCS contracts with one commercial plan.

Figure 1: Medi-Cal Managed Care Models, by County

The state also created the Two-Plan Model, which was designed to shift large segments of the Medi-Cal population into managed care while preserving the role of traditional safety-net providers,5  and the Geographic Managed Care Model (GMC) in Sacramento and San Diego Counties. The Two-Plan Model offers enrollees a choice between one commercial plan and one “Local Initiative” public plan. Like COHS plans, Local Initiative plans are public entities and are expected to work collaboratively with county public hospitals and safety-net providers to support the safety-net delivery system. In general, Two-Plan Model counties tend to be ones with large Medi-Cal populations and public hospital systems critical to the safety-net; they include nine of California’s 12 public hospital health system counties6 .

Local Initiative plans enjoy strong local support and have generally secured a 65%-85% Medi-Cal market share, with commercial plans in their service areas playing a smaller role. Notably, although there is only one Local Initiative plan in each county, some of them subcontract with one or more commercial plans, effectively providing Medi-Cal enrollees in these counties with more than two plan options. For example, L.A. Care, the Local Initiative plan in Los Angeles County, subcontracts with Anthem Blue Cross, Care1st, and Kaiser Permanente, in addition to providing health plan services directly to enrollees.7 

The GMC Model relies on a mix of commercial and non-profit health plans but does not include Local Initiative plans. Enrollees in GMC counties have more than two plan options.8  Like in COHS, enrollment in both the Two-Plan and GMC Models is mandatory for low-income adults and children, but, unlike in COHS, enrollment in the Two-Plan and GMC Models was initially voluntary for seniors and persons with disabilities, becoming mandatory in 2012.

Finally, the Regional Expansion, Imperial, and San Benito (Voluntary) Models were created when Medi-Cal began expanding managed care to rural areas in late 2013. Both the Regional Expansion and Imperial Models involve contracts with two commercial plans. When children in the Healthy Families Program – California’s Children’s Health Insurance Program (CHIP) – who were enrolled in Kaiser Permanente’s Healthy Families plan transitioned to Medi-Cal coverage in 2013, the state contracted with Kaiser Permanente in three Regional Expansion Model counties to ensure continuity of care for these children.9  The San Benito Model allows Medi-Cal enrollees in San Benito County to choose between FFS and the one contracted commercial plan.

In all then, six different managed care models operate across California’s 58 counties today.10  Reflecting population distribution across the state, the largest share of Medi-Cal beneficiaries – nearly two-thirds as of October 2015 (64%) – were enrolled in the Two-Plan Model. Another 21% were enrolled in the COHS Model, and 11% were enrolled in the GMC Model (Figure 2). A large majority of Medi-Cal managed care enrollees (68%) were served through local public plans (COHS plans and Local Initiative plans under the Two-Plan Model), while about one-third were served through commercial plans (Figure 3).

Figure 2: Medi-Cal Managed Care Enrollment, Distribution by Model Type, November 2015
Figure 3: Medi-Cal Managed Care Enrollment, Distribution by Plan Type, November 2015

Key Programmatic Dimensions of Medi-Cal Managed Care

·      Managed Care Plan Enrollment

People can apply for Medi-Cal in several ways: by mail, in person, by phone through their County Social Services Office, or, since the launch of the ACA coverage expansions in 2014, online via the Covered California website (www.coveredca.com). Once their eligibility is determined, individuals are enrolled in Medi-Cal and issued a Benefits Identification Card. They then choose from two or more health plan options, or are auto-assigned to a plan if they do not select a plan. In COHS counties, a single plan administers Medi-Cal and all enrollees are mandatorily enrolled in that plan. In San Benito County, only one health plan is available and beneficiaries may enroll in that plan or choose to stay in Medi-Cal FFS.

·      Primary Care Provider Selection

Upon enrollment in a health plan, beneficiaries choose a primary care physician (PCP) who is in the health plan’s network or, if they do not choose a PCP, the health plan will assign them one. Notably, California established special provisions regarding PCP selection for ACA Medicaid expansion adults in the 12 counties with public hospital health systems11  that previously served these adults through Low Income Health Programs12  (discussed below) and county indigent programs. As in other counties, Medicaid expansion adults in these counties either select or are automatically assigned by their health plan to a PCP. However, to maintain support for the county public hospital health systems, for the period January 1, 2014 through December 31, 2016, plans must auto-assign at least 75% of newly eligible adults who do not select a PCP to a PCP in the county hospital health system until the system meets its enrollment target or notifies the plan that it is at capacity. The required percentage drops to 50% beginning January 1, 2017.13  14 

·      Benefits and Carve-Outs

Medi-Cal covers comprehensive primary and acute care, behavioral health care, and long-term services and supports (LTSS) for beneficiaries. While most primary and acute care benefits for managed care enrollees are provided by the managed care plans, the following services are generally “carved out” and provided on a FFS basis:

    • Dental care;
    • Specialty mental health services, such as targeted case management, partial hospitalization, and outpatient and inpatient mental health services (delivered through county mental health departments, which are responsible for intake, triage, and treatment of people who meet specific eligibility criteria for serious mental illness);
    • Substance use disorder treatment services (delivered by local and county alcohol and drug programs);
    • In-Home Supportive Services, which include personal assistance and other services that enable seniors and persons with disabilities to live safely in their homes (administered by counties, except in the seven MLTSS counties, where these services are provided by the health plan);
    • Home and community-based waiver services (HCBS), such as case management, continuing care nursing, day care, and respite services, for beneficiaries who would otherwise meet the functional eligibility criteria for institutional care (except in the seven MLTSS counties, where services authorized under the Multipurpose Senior Services HCBS waiver are covered by the health plan); and
    • Skilled nursing facility services beyond 91 days (except in COHS counties and the seven MLTSS counties, where these services are provided by the health plan).
·      Provider Network Adequacy and Other Access Standards

Except for most COHS plans, Medi-Cal managed care plans are licensed by the California Department of Managed Health Care (DMHC) and are subject to statutory and regulatory consumer protections, including network adequacy requirements.15  In addition, all DHCS contracts with health plans specify network adequacy standards. The COHS plans (except for the Health Plan of San Mateo) are exempt from statutory licensure requirements but are subject to the network adequacy requirements contained in their Medi-Cal contracts. (Appendix Table 1 describes network adequacy standards in Medi-Cal managed care. Appendix Table 2 describes standards for timely appointments in Medi-Cal managed care.)

Recent Medi-Cal Managed Care Expansions

To prepare for the implementation of the ACA coverage expansions in 2014, California applied for its “Bridge to Reform” Section 1115 demonstration waiver, which CMS approved in November 2010.16  This section 1115 demonstration waiver allowed the state to implement the Low Income Health Program, an expansion of county-based coverage programs for low-income adults, who would later become eligible for new ACA coverage options.). The waiver also allowed the state to pursue fundamental program changes intended to improve health outcomes and ensure the long-term financial sustainability of the Medi-Cal program. Mandatory enrollment of seniors and persons with disabilities (SPDs) in managed care was among these changes. Waiver amendments in subsequent years further expanded managed care to additional populations and geographic areas. Ultimately, over the period 2011-2014, California transitioned or enrolled almost 5 million Medi-Cal beneficiaries into managed care under authority provided by the Bridge to Reform waiver, including beneficiaries in rural counties; seniors and persons with disabilities; children previously covered by Healthy Families, the state’s Children’s Health Insurance Program (CHIP); individuals previously enrolled in the Low-Income Health Program; and adults newly eligible for Medi-Cal under the ACA.

·      Seniors and Persons with Disabilities (SPDs)

Prior to 2011, California mandated managed care enrollment for seniors and persons with disabilities (SPDs) only in COHS counties. In all other managed care models, enrollment of seniors and persons with disabilities was voluntary. However, in 2011, after the Bridge to Reform waiver was approved, the state began to transition these beneficiaries, excluding those dually eligible for Medicare and Medicaid, into managed care in 16 additional counties that had managed care for other Medi-Cal populations at the time, and where managed care for seniors and persons with disabilities had previously been voluntary. During the 12 months beginning June 2011, nearly 240,000 SPDs were enrolled into managed care plans in these counties, where they were offered a choice of at least two plans. As California began to expand mandatory managed care to rural counties in 2013, SPDs in these counties were also enrolled in plans.17  As of September 2014, 647,968 seniors and persons with disabilities (non-dually eligible) were enrolled in Medi-Cal managed care, making up 7.7% of all Medi-Cal managed care enrollment statewide.18 

·      Children Enrolled in the Healthy Families Program

Starting in 2013, children enrolled in the Healthy Families Program were moved into Medi-Cal. This change was intended to simplify eligibility and coverage for children and families; improve children’s coverage through retroactive eligibility, increased access to vaccines, and expanded mental health benefits; and eliminate premiums for lower-income children in the Healthy Families Program.19  The shift was also expected to produce budget savings for the state, as average rates paid to Medi-Cal plans were generally lower than those paid under the Healthy Families Program for a largely equivalent benefit package (after adjustments for carve–outs).20  DHCS identified approximately 750,000 children eligible to be transitioned to Medi-Cal; the transition was implemented in four phases to minimize service disruptions and ensure continued access to care.21 

·      Adults in Low Income Health Program and Newly Eligible Adults under the ACA

Through the Low Income Health Program (LIHP), county and local entities strengthened their primary and specialty care delivery systems, implemented primary care medical homes, and enrolled over 630,000 uninsured adults ages 19-64 with incomes up to 200% of the federal poverty level in coverage. On January 1, 2014, all but 24,000 LIHP enrollees (whose incomes qualified them instead for subsidies for Marketplace plans) became eligible for Medi-Cal under the ACA Medicaid expansion and were enrolled in managed care plans.

Recently Added Services in Managed Care

Since 2011, California has expanded the benefits covered under managed care contracts through amendments to its Bridge to Reform waiver. The services added include adult day health services, mental health services and, in seven demonstration counties, certain long-term services and supports, as further described below.

·      Community-Based Adult Services (CBAS) Benefit

Prior to 2011, Adult Day Health Care (ADHC), a community-based day care program that provided health, therapeutic, and social services for persons at risk of nursing home placement, was offered as an optional Medicaid State Plan service on a FFS basis. To achieve budget savings, Governor Brown’s January 2011 budget plan proposed to eliminate the ADHC benefit, and in March 2011, the state legislature voted to eliminate the ADHC benefit, subject to CMS approval (which was delayed until April 2012).22  In August 2011, DCHS began transitioning ADHC participants from FFS to managed care plans, which were to coordinate their medical and social support needs. Later, under a settlement with the ADHC providers, the Community-Based Adult Services (CBAS) benefit — utilizing the same ADHC providers — was created to replace ADHC as a managed care benefit only. In effect, the former ADHC benefit was carved into managed care as the new CBAS benefit. Accessible only to managed care enrollees, Community-Based Adult Services became the first community-based LTSS managed care plan benefit. Currently, CBAS providers serve 31,000 managed care enrollees statewide.

·      Managed Long-Term Services and Supports (MLTSS)

In January 2012, Governor Jerry Brown proposed his Coordinated Care Initiative (CCI), aimed at improving health outcomes and beneficiary satisfaction for low-income seniors and persons with disabilities, while achieving substantial savings from rebalancing the delivery of long-term services and supports toward home and community-based care.23  The CCI proposal was enacted by the state legislature in 2012 to be implemented in seven counties in 2014.24  One component of the CCI was a mandatory managed long-term services and supports (MLTSS) program. The second component, a demonstration program for persons dually eligible for Medicare and Medicaid, is described later.

In the seven CCI counties, Medi-Cal beneficiaries, including dually eligible enrollees who were exempt from managed care before 2014, are required to enroll in a managed care plan to receive their Medi-Cal benefits, including the following long-term services and supports: consumer-directed In-Home Supportive Services, Community-Based Adult Services, the Multipurpose Services and Supports Program (the state’s HCBS waiver services for frail elders), and long-term (over 91 days) skilled nursing facility services. Other HCBS waiver services (such as those under the state’s Assisted Living waiver and the waiver for persons with intellectual and developmental disabilities) remain carved out. MLTSS coverage began on April 1, 2014. As of October 2015, over 300,000 dually eligible beneficiaries were enrolled in the MLTSS program in the seven counties.

·      Mental Health Services and Autism Care

In 2014, mental health services for mild or moderate mental illness were added to managed care contracts (specialty mental health services continue to be carved out and provided through the counties). Also, in 2015, behavioral health therapy for beneficiaries with autism or autism spectrum disorder was added as a Medi-Cal-covered benefit and will be covered by managed care plans in 2016.

Other Managed Care Initiatives

Dual Eligible Demonstration

As mentioned earlier, the seven-county CCI also provided for a three-year Financial Alignment Demonstration (“Dual Demonstration”), as authorized by the ACA to promote coordinated health care delivery for individuals dually eligible for Medicare and Medicaid. Under the demonstration, called “Cal MediConnect,” dually eligible enrollees can elect to receive all of their Medicare and Medicaid services, including medical, behavioral health, and institutional and home and community-based long-term services and supports, through a single managed care plan. Plan participation in the Dual Demonstration is limited to Medi-Cal plans already serving the area. Participating plans contract with other entities to provide some services, such as behavioral health and In-Home Supportive Services, although the goal is that dually eligible beneficiaries receive all their care in a single, organized delivery system. A Memorandum of Understanding (MOU) between the state and CMS authorizing the Dual Demonstration outlines its principles and operational plan.25 

The Dual Demonstration puts many new demands on Medi-Cal health plans, including the requirement to cover Medicare Part A, B, and D benefits as well as Medi-Cal long-term services and supports. To accomplish this, plans must organize providers who have not previously contracted with managed care plans or who have not previously provided services to Medicare beneficiaries. Under the Dual Demonstration, plans are also subject to specific and detailed DHCS and CMS contract requirements to maintain continuity of care, perform health risk assessments, and use person-centered, interdisciplinary care management teams. Enrollment in the Dual Demonstration is voluntary; as of December 1, 2015, 115,743 dually eligible enrollees – about one-quarter of the eligible population – were enrolled in it.26 

Managed Care Data Initiatives and Dashboard

In late 2012, DHCS initiated the statewide Encounter Data Improvement Project (EDIP). The goal of the EDIP is to improve the timeliness, accuracy, and completeness of encounter data reported by managed care plans, to improve rate-setting and managed care monitoring, and to prepare for value-based purchasing. As part of the project, DHCS develops performance metrics and works with managed care plans to address their data collection and reporting deficiencies. This collaborative effort on data and metrics is critical in connection with performance reporting and will be foundational to value-based purchasing in the future.

To increase transparency regarding the quality of managed care plans, DHCS has created a Managed Care Performance Dashboard that provides plan-reported data on a variety of measures to help DHCS and other stakeholders examine and understand managed care activity and performance at the state level, by managed care model, and at the individual plan level. The dashboard contains metrics related to enrollment, enrollee health care utilization, appeals and grievances, and quality of care. The dashboard stratifies the plan-reported data by beneficiary population.27 

Key Challenges and Lessons

Access to Care

Provider payment rates and participation. Managed care plans are required to maintain adequate provider networks and capacity to ensure access to care for their members. Historically, Medi-Cal FFS payment rates have been among the lowest Medicaid fees in the nation.28  Research has shown a positive relationship between fee levels and physician participation in Medicaid.29  30  31  In managed care, although provider payment rates are a contractual matter between plans and providers, the role of persistent low rates in depressing provider participation and beneficiary access continues to be a major issue. California providers have sued the state on the basis that Medi-Cal rates violate the “equal access” provision of federal Medicaid law.32  33  This provision requires that payment rates be “consistent with economy and efficiency… and sufficient to enlist enough providers so that care and services are available under the plan at least to the extent that such care and services are available to the general population in the geographic area.”34  On November 2, 2015, CMS issued a final rule implementing the equal access provision, which requires states to conduct access reviews on a regular basis and to consider the findings from those reviews in setting provider rates. However, CMS limited application of the latter requirement to FFS rate-setting, stating that standards for capitation payment rates are set in the June 1, 2015 proposed rule on Medicaid managed care.35 

Data from a 2012 survey of Medi-Cal enrollees show that the vast majority of beneficiaries found it easy to find a provider who accepted Medi-Cal, but almost 1 in 5 enrollees had difficulty. Fewer than half of Medi-Cal enrollees said it was easy to find a specialist or mental health provider who accepted Medi-Cal; enrollees in fair or poor health were particularly likely to report difficulty finding specialists.36  A separate analysis, based on national survey data, found that Medi-Cal adults were significantly more likely than adults with Medicaid in other states not to have a doctor visit (37% vs. 30%) or a specialist visit (48% vs. 36%) and to delay care because of difficulty getting an appointment.37  Along with medical groups and other physicians, federally qualified health centers (FQHCs) and community clinics play an important role in providing primary care for Medi-Cal beneficiaries, but arranging specialist referrals for patients in these settings is an ongoing challenge.

A recent federal report shows that 54% of office-based physicians in California were accepting new Medicaid patients in 2013, compared to nearly 69% of office-based physicians nationally who were doing so.38  A 2013 California survey of physicians, including facility-based physicians, found a higher rate overall — 62% accepting new Medi-Cal patients, compared to 75% for Medicare and 79% for privately insured patients.39  The rate was 70% among pediatricians, but just over 50% among other primary physicians. Facility-based specialists were mostly likely to accept new Medi-Cal patients, and only 36% of psychiatrists did so. In June 2015, the California State Auditor issued a report identifying major gaps in state oversight of Medi-Cal plan provider networks to ensure their adequacy, a high volume of unanswered calls to the office of the Medi-Cal managed care ombudsman, and inconsistent monitoring of Medi-Cal plans to ensure they meet Medi-Cal beneficiaries’ medical needs.40 

Linguistic and cultural gaps in access. Another challenge in Medi-Cal is the lack of linguistic and cultural concordance between the current provider workforce and the low-income population in California. A 2013 analysis by the state showed that 40% of Californians eligible for Medi-Cal reported a language other than English as their primary language and that 13 languages met the state’s definition of a “Threshold Language” spoken at a high proportional rate within a geographic area.41  A separate study documented that nearly 40% of all Californians and approximately 50% of Medi-Cal beneficiaries are Latino, but that only 5% of licensed physicians in California are Latino and only 6% of California physicians speak Spanish.42 

Rural areas. While access to care is generally sufficient in most urban areas, securing access to care in rural areas is more challenging for publicly and privately insured patients alike. FQHCs, rural health centers (RHCs), and other health clinics form the backbone of the ambulatory care delivery system serving low-income populations in rural counties, and these safety net provider play an increasingly critical role in Medi-Cal managed care networks in rural as well as other areas of the state.43 

Transitions to Managed Care

California’s shift of seniors and people with disabilities from FFS to managed care yielded important lessons about the importance of appropriate planning to foster smooth transitions and avoid disruptions in care, especially for people with complex health care needs.

Stakeholder engagement. Robust stakeholder engagement is needed to support smooth managed care transitions.44  In implementing the Healthy Families and Low Income Health Program transitions and the Dual Demonstration, DHCS increased its engagement with beneficiaries, advocates, providers, and plans. For example, in the Dual Demonstration, the state held extensive webinars, workshops, and stakeholder meetings, which state officials said resulted in better and more effective outreach.45  DHCS also established a dedicated webpage to report on all meetings, updates, and notices.

Data issues. In the SPD transition, inaccurate enrollee contact information, privacy rules that prevented plans and providers from accessing beneficiary medical records, and other data problems made timely implementation of care coordination challenging for Medi-Cal plans. The state was able to improve its data-sharing processes in the Dual Demonstration to give plans more time to contact incoming enrollees and prepare for their needs. Still, contacting beneficiaries to complete health assessments to support care management remains a challenge for plans, particularly in the case of individuals newly eligible for Medi-Cal and people without stable addresses.

Continuity-of-care protections. SPDS were permitted to request continued access to an out-of-network provider for 12 months following their plan enrollment.46  However, lack of plan, provider, and beneficiary understanding of this provision led to unnecessary disruptions in established patient-provider relationships. In subsequent managed care transitions, DHCS and plans increased their engagement with enrollees and providers to improve understanding of the continuity-of-care protection. DHCS also incorporated specific continuity-of-care requirements in its managed care contracts.

Enrollment processes. In the lead-up to the Dual Demonstration, advocates and plans urged greater transparency in the enrollment process and beneficiary protections, including the right to opt out of or disenroll from the Demonstration. In response, the state published the enrollment schedule and the mailing dates for notices to beneficiaries, to help advocates and insurance assisters prepare and stage beneficiary outreach and education efforts. The state also published issues that arose in the beneficiary notice/enrollment process and the steps the state took to address them. Advocates and plans also worked with DHCS to improve the managed care enrollment process for beneficiaries with LTSS needs and dually eligible beneficiaries.

Coordination with carve-out services. Coordination between plan and carve-out services is an ongoing challenge. This came up in the SPD transition, particularly in the context of mental health care, as prescription drugs were provided by plans, while specialty mental health services were carved out and provided by county mental health departments.47  In the MLTSS transition, plan coordination with waiver services that remained carved-out was also difficult. Differences between waiver service care managers and health plans in their assessments of beneficiary needs and care goals can create access barriers for beneficiaries.

Improving Quality

Performance measurement and monitoring. Managed care contracting enables states to measure and require accountability for quality. Through its contracts, California requires Medi-Cal managed care plans to periodically submit various quality-related reports, including Consumer Assessments of Healthcare Providers and Systems (CAHPS) survey findings, Healthcare Effectiveness and Data Information Set (HEDIS) scores, reports on member complaints, grievances, and resolutions, and other statistical reports.

Transparency. DCHS collection and monitoring of quality data and the public availability of data on plan performance in the Managed Care Performance Dashboard strengthen the foundation for state oversight of managed care, transparency of plan quality, and value-based purchasing strategies. DHCS works with Medi-Cal plans to improve its quality measures and refine its enforcement mechanisms. This work includes developing corrective action plans to improve plans’ quality reporting and outcomes and reporting formats that capture data accurately and completely. DHCS also conducts an annual quality forum to publicly recognize plans for their progress and achievements in quality performance. Poor-performing plans may be subject to enforcement actions or corrective action plans, or may lose out under the state’s auto-assignment algorithm.

Special reports for Dual Demonstration plans. All plans participating in the Dual Demonstration must submit additional reports to CMS that include data on quality metrics for both Medi-Cal and Medicare services. DHCS and CMS review these reports and work with the plans to ensure that data are reported consistently to support evaluation purposes. DHCS recently published the first quarterly Health Risk Assessment Dashboard, which compares the plans’ compliance with the requirement to complete Health Risk Assessments for Dual Demonstration members.48 

Major Current Issues

Medicaid Managed Care Rule

CMS’ proposed rule on Medicaid managed care would modernize and fundamentally redraw the current regulatory framework for managed care. It would strengthen beneficiary protections and network adequacy requirements, establish requirements to increase the fiscal integrity of capitation rates, address health care delivery and payment reform in managed care, increase state and plan accountability for access and quality, and strengthen oversight of Medicaid managed care programs.49  If these provisions are preserved in the final rule, expected in the Spring of 2016, they could have significant bearing on provider networks and beneficiary access to care, provider payment, and other issues in the Medi-Cal managed care program.

In a letter to CMS submitted during the public comment period on the rule, the California Hospital Association expressed support for the overall direction of the rule and many of its specifics, but also identified some major concerns. Chief among them is the concern that the rule’s proposed limitations on states’ ability to direct plan expenditures and plan payments to specific providers would interfere with current supplemental payments targeted to certain hospitals– typically, safety-net and public hospitals that serve large numbers of Medicaid beneficiaries.50  The letter to CMS also commented on many other provisions of the proposed rule, recommending stronger standards in some areas and increased flexibility in others, and stressing the need for adequate state resources to audit and enforce the regulatory standards.

Section 1115 Waiver Renewal

California’s Bridge to Reform demonstration waiver expired on October 31, 2015. DHCS applied for a five-year extension of the waiver under the name “Medi-Cal 2020” and, on December 30, 2015, the terms of that waiver were announced. Among the key components of the waiver is the Public Hospital Redesign and Incentives in Medi-Cal (PRIME) fund, a pool of up to almost $7.5 billion in combined federal and state spending over the five-year waiver period for delivery system reform in California’s public hospital systems. The PRIME pool builds off the Delivery System Reform Incentive Program (DSRIP) included in California’s original waiver. DHCS will use it to fund public provider system projects to change care delivery and strengthen the ability of these systems to be paid under risk-based alternative payment models (APMs) that hold providers accountable for quality and the cost of care. The waiver documents state that CMS and the state will measure the success of PRIME, in part, by assessing the progress in moving to APMs for designated entities through Medi-Cal managed care.51  It remains to be seen exactly how the DSRIP and PRIME pools will interact with the Medi-Cal managed care program and what the implications will be for plans and their Medi-Cal members.

Medi-Cal 2020’s “Whole Person Care Pilots,” intended to provide more integrated care for vulnerable, high-utilizing beneficiaries, also involve Medi-Cal plans. In these county-based pilots, Medi-Cal managed care plans, safety-net providers, and other community-based service providers and affordable housing providers, are expected to develop innovative partnerships to address social determinants of health as well as integrate physical and behavioral health care and improve beneficiary health and well-being.

Looking Ahead

In the short time from 2011 to 2015, California expanded managed care to 28 rural counties, transitioned or enrolled almost 5 million beneficiaries into managed care, carved adult day health and mental health services into managed care, and, in seven counties, launched a managed long-term services and supports program and a Dual Demonstration. Currently, Medi-Cal managed care plans operate in all 58 counties in California and cover over three-quarters of all Medi-Cal enrollees. To absorb the influx of new members, including many with complex care needs, Medi-Cal plans have been challenged to expand their provider networks and reinforce their operations rapidly to handle increased demand for services, increased demand on call centers, and utilization management, care management, quality improvement, and claims processing on a larger scale. In addition, the state has been challenged to provide adequate notice and education to enrollees transitioning to managed care and to ensure that health plans receive data on a timely basis.

Other states considering managed care expansions – especially, expansions to Medicaid populations with more complex care needs – can learn from California’s experience. Managed care is unlikely to solve longstanding access problems attributable to systemic provider shortages and/or low Medicaid payment rates and limited provider participation. As states expand their managed care programs to more Medicaid beneficiaries, including those with high needs, ensuring that plan networks are adequate to serve their enrollees could be more challenging for both plans and states. Robust transition planning is essential to minimize disruptions in care when states mandate that new groups of FFS beneficiaries enroll in managed care plans. Engaging beneficiaries, providers, consumer advocates, and other stakeholders in this planning process and its implementation is necessary to ensure that beneficiaries know how to navigate their plans to obtain needed services and assistance and are fully informed about their rights and options. Data-sharing systems and procedures to support managed care transitions, and information systems and data analytics capacity to support ongoing monitoring, oversight, and performance improvement are integral to both plan and state accountability for Medicaid managed care programs.

California, like many other states, is increasingly oriented toward achieving better performance from its managed care contractors. Key areas of focus include further delivery system transformation to improve care while reducing costs; enhanced care integration; expansion of managed long-term services and supports; transparency regarding health outcomes of managed care enrollees; and improving population health. To meet these challenges, managed care plans will need to develop new ways to engage beneficiaries, partner with community-based social services and supportive housing organizations, and structure provider payment models to promote health care quality and outcomes – all in the context of limited federal and state funding. Finally, if, as managed care evolves in new ways, its potential to provide more coordinated and integrated care is to be optimized and gaps in access are to be minimized, close state monitoring of managed care plans and rigorous enforcement of federal and state managed care requirements will continue to be essential.

The authors wish to acknowledge valuable input and assistance from Michael Engelhard, Donna Laverdiere, and Lisa Shugarman, all of Health Management Associates.

Appendix

Appendix Table 1: Network Adequacy Standards in Medi-Cal Managed Care
Knox-Keene Act StandardsaMedi-Cal Two-Plan and GMC Contract StandardsbCOHS Contract Standardsb
General Requirements
Comprehensive range of primary, specialty, institutional, and ancillary services readily available at reasonable times to all enrollees.Maintain network adequate to serve 60% of all eligible beneficiaries within the service area and provide full scope benefits.

Ensure appropriate provider network, including PCPs, specialists, and other personnel and an adequate number of inpatient facilities within the service area.

Submit a complete provider network adequate to provide covered services to eligible beneficiaries within the service area.

Increase capacity of the network to accommodate growth.

Time and Distance Standards
Primary care and hospital services must be available within 30 minutes or 15 miles of enrollee’s residence or workplace.

Laboratory, pharmacy, and similar services available at locations within a reasonable distance from PCP.

Maintain a network of PCPs located within 30 minutes or 10 miles of a member’s residence unless MCO has an approved alternative standard.Maintain a network of PCPs located within 30 minutes or 10 miles of a member’s residence unless MCO has an approved alternative standard.
Provider-to-Enrollee Ratios and Other Access Standards
·  PCPs: 1: 2,000

·  Total physicians: 1: 1,200

·  Complete network of PCPs and specialists with admitting staff privileges at least one contracting hospital equipped to provide range of basic health care services

·  Emergency 24/7

·  Access to medically required specialists

·  PCPs: 1: 2,000

·  Total physicians: 1: 1,200

·  Non-physicians not to exceed provider/patient caseload of 1: 1,000

·  Emergency services 24/7

·  Adequate number and type of specialists

·  PCPs: 1: 2,000

·  Total physicians: 1: 1,200

·  Non-physicians not to exceed provider/patient caseload of 1: 1,000

·  Emergency services 24/7

·  Adequate number and type of specialists


a Title 28, California Code of Regulations, §1300.51.H and §1300.67.2.b COHS Boilerplate Contract and Two Plan Boilerplate Contract, available at http://www.dhcs.ca.gov/provgovpart/Pages/MMCDBoilerplateContracts.aspx
Appendix Table 2: Timeliness Standards for Appointments in Medi-Cal Managed Care
Type of AppointmentStandard for Timeliness
Urgent care, no prior authorization48 hours*
Urgent care, prior authorization96 hours
Non-urgent primary care10 business days of request
Specialist care15 business days of request
Non-urgent ancillary services for diagnosis or treatment of injury, illness, or other health condition15 business days of request
First prenatal visit10 business days
Urgent dental care72 hours
Non-urgent dental care36 business days
Preventive dental care40 business days
* The COHS contract has a more stringent urgent care provision that requires that a member needing urgent care be seen within 24 hours.

Endnotes

  1. Cite to new SHFO CPS data once posted. ↩︎
  2. Most of the state’s Medi-Cal managed care programs were included in the California “Bridge to Reform” Section 1115 waiver amendment effective for the 2010 – 2015 time period. The waiver amendment also expanded the managed care programs to include seniors and persons with disabilities, expanded managed care to additional counties, and added benefits. California Bridge to Reform Section 1115 Demonstration Fact Sheet, Updated August 2015. Accessed at http://www.medicaid.gov/Medicaid-CHIP-Program-Information/By-Topics/Waivers/1115/downloads/ca/ca-bridge-to-health-reform-fs.pdf ↩︎
  3. See https://modern.kff.org/medicaid/state-indicator/managed-care-penetration-rates-by-eligibility-group/ ↩︎
  4. Medi-Cal Managed Care Enrollment Report, October 2015, available at http://www.dhcs.ca.gov/dataandstats/reports/Documents/MMCD_Enrollment_Reports/MMCEnrollRptOct2015.pdf ↩︎
  5. Medi-Cal Managed Care, Medi-Cal Facts No. 8, March 2000, Medi-Cal Policy Institute, a project of the California Health Care Foundation. Accessed at http://www.chcf.org/~/media/MEDIA%20LIBRARY%20Files/PDF/PDF%20M/PDF%20mmc2.pdf ↩︎
  6. California’s 12 public hospital health system counties are: Alameda, Contra Costa, Kern, Los Angeles, Monterey, Riverside, San Bernardino, San Francisco, San Joaquin, San Mateo, Santa Clara, and Ventura. All Plan Letter 13-022, California Department of Health Care Services, July 25, 2014, available at http://www.dhcs.ca.gov/formsandpubs/Documents/MMCDAPLsandPolicyLetters/APL2013/APL13-022.pdf. These 12 counties are served under the Two Plan Model, except for Monterey, San Mateo, and Ventura counties, which are served by COHS plans. . ↩︎
  7. L.A. Care Health Plan website, Plan Partners page. Accessed at http://www.lacare.org/health-plans/medi-cal/plan-partners ↩︎
  8. As of August 2015, there are four plan choices in Sacramento County and five in San Diego County. Medi-Cal Managed Care Enrollment Report, August 2015. Accessed at http://www.dhcs.ca.gov/dataandstats/reports/Pages/MMCDMonthlyEnrollment.aspx ↩︎
  9. Medi-Cal Update, Part 1 – Program and Eligibility, October 2013. Accessed at http://files.medi-cal.ca.gov/pubsdoco/bulletins/artfull/part1201310.asp ↩︎
  10. California Department of Health Care Services, Medi-Cal Managed Care Program Fact Sheet – Managed Care Models, November 2014. Accessed at http://www.dhcs.ca.gov/provgovpart/Documents/MMCDModelFactSheet.pdf; Medi-Cal Managed Care Enrollment Report, August 2015. Accessed at http://www.dhcs.ca.gov/dataandstats/reports/Pages/MMCDMonthlyEnrollment.aspx ↩︎
  11. California’s 12 public hospital health system counties are: Alameda, Contra Costa, Kern, Los Angeles, Monterey, Riverside, San Bernardino, San Francisco, San Joaquin, San Mateo, Santa Clara, and Ventura. See All Plan Letter 13-022, op. cit. ↩︎
  12. California’s “Bridge to Reform” section 1115 waiver, approved in November 2010, created the Low Income Health Program (LIHP), which allowed counties to receive federal Medicaid reimbursement for providing health services through the LIHP to residents who would become newly eligible for coverage under the ACA Medicaid expansion in 2014. ↩︎
  13. All Plan Letter 13-022, op. cit. ↩︎
  14. MCOs can avoid oversight action associated with not meeting the 75% auto-assignment standard if they demonstrate that they have attempted to meet it but are constrained by regulatory geographic access standards. ↩︎
  15. Knox-Keene Health Care Service Plan Act of 1975, §1367.03, and Title 28, California Code of Regulations §1300.51 and §1300.67.2. ↩︎
  16. Bridge to Reform Waiver Resources, California Department of Health Care Services, available at http://www.dhcs.ca.gov/provgovpart/Pages/1115-Bridge-to-Reform.aspx ↩︎
  17. SPDs in an additional 19 rural counties (Alpine, Amador, Butte, Calaveras, Colusa, El Dorado, Glenn, Imperial, Inyo, Mariposa, Mono, Nevada, Placer, Plumas, Sierra, Sutter, Tehama, Tuolumne, and Yuba) began to transition to mandatory enrollment in Medi-Cal managed care in December 2014. ↩︎
  18. Medi-Cal Managed Care Performance Dashboard, , California Department of Health Care Services, accessed at: http://www.dhcs.ca.gov/services/Documents/MMCD/20150305MMCPDashboard.pdf ↩︎
  19. 2012-2013 Governor’s Budget Highlights Department of Health Care Services, January 6, 2012, available at http://www.dhcs.ca.gov/Documents/2012-13%20Budget%20Highlights.pdf ↩︎
  20. The 2012-13 Budget: Analysis of the Governor’s Healthy Families Program Proposal, Legislative Analyst’s Office, February 17, 2012. Accessed at http://www.lao.ca.gov/analysis/2012/health/healthy-families-021712.aspx ↩︎
  21. California Department of Health Care Services, Healthy Families Program Transition to Medi-Cal: Final Comprehensive Report, February 4, 2014. Accessed at http://www.dhcs.ca.gov/provgovpart/Documents/Waiver%20Renewal/AppendixCHFP.PDF ↩︎
  22. Legislative Analyst’s Office, Recent History of Adult Day Health Care and Transition of Seniors and Persons With Disabilities Into Managed Care, March 7, 2012. Accessed at http://www.lao.ca.gov/handouts/Health/2012/Recent_History_ADHC_3_7_12.pdf ↩︎
  23. California Demonstration to Integrate Care for Dual Eligible Beneficiaries, May 31, 2012, Proposal to CMS. Accessed at https://www.cms.gov/medicare-medicaid-coordination/medicare-and-medicaid-coordination/medicare-medicaid-coordination-office/downloads/caproposal.pdf ↩︎
  24. Senate Bill (SB) 1008 (Chapter 33, Statutes of 2012); SB 1036 (Chapter 45, Statutes of 2012); and SB 94 (Chapter 37, Statutes of 2013). ↩︎
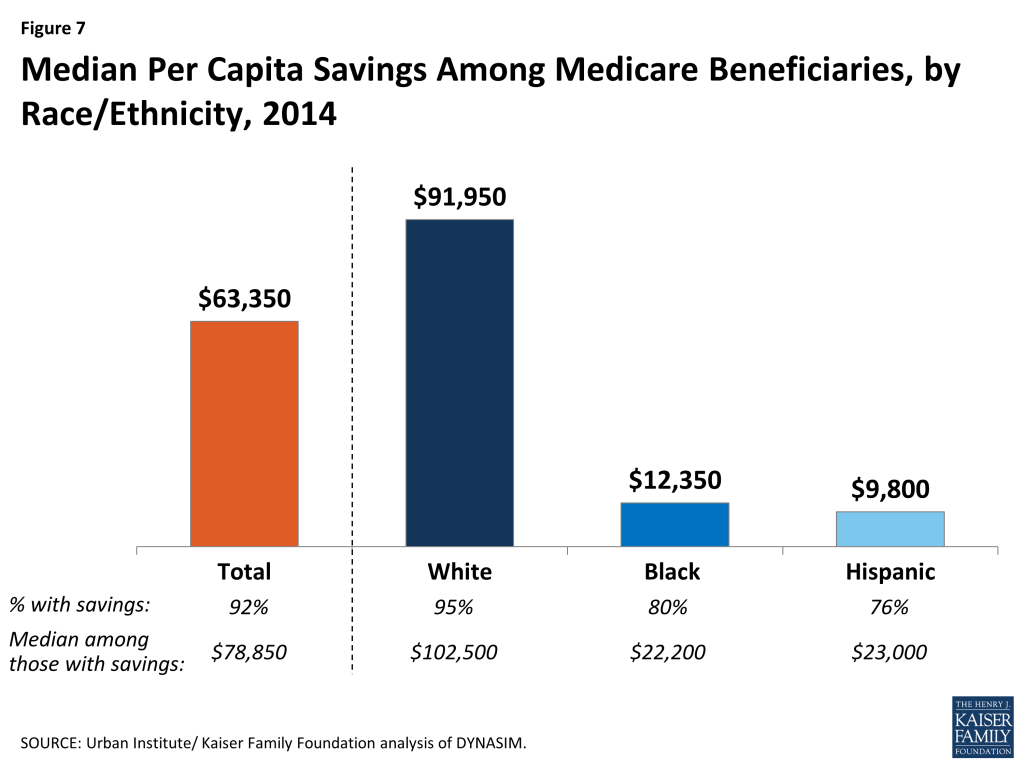
  25. Memorandum of Understanding (MOU) Between CMS and The State of California Regarding a Federal-State Partnership to Test a Capitated Financial Alignment Model for Medicare- Medicaid Enrollees, California Demonstration to Integrate Care for Dual Eligible Beneficiaries (2013). Accessed at http://www.cms.gov/Medicare-Medicaid-Coordination/Medicare-and-Medicaid-Coordination/Medicare-Medicaid-Coordination-Office/FinancialAlignmentInitiative/Downloads/CAMOU.pdf ↩︎
  26. Cal MediConnect Monthly Enrollment Dashboard as of October 1, 2015, California Department of Health Care Services. Accessed at http://www.calduals.org/wp-content/uploads/2015/10/CMC-Enrollment-Dashboard-October-Final-102015.pdf ↩︎
  27. See: http://www.dhcs.ca.gov/services/Pages/MngdCarePerformDashboard.aspx ↩︎
  28. S. Zuckerman, A. Williams, and K. Stockley (Urban Institute), Medi-Cal Physician and Dentist Fees: A Comparison to Other Medicaid Programs and Medicare , California Healthcare Foundation, April 2009; accessed at http://www.chcf.org/publications/2009/04/medical-physician-and-dentist-fees-a-comparison-to-other-medicaid-programs-and-medicare ↩︎
  29. S. Decker, “In 2011, Nearly One-Third Of Physicians Said They Would Not Accept New Medicaid Patients, But Rising Fees May Help,” Health Affairs, 31, no.8, available at http://content.healthaffairs.org/content/31/8/1673.full.pdf+html ↩︎
  30. P. Cunningham and L. Nichols, “The Effects of Medicaid Reimbursement on the Access to Care of Medicaid Enrollees: A Community Perspective,” Medical Care and Research Review 62, no. 6(2005), available at http://mcr.sagepub.com/content/62/6/676.abstract ↩︎
  31. D. Polsky, M. Richards, S. Basseyn, D.Wissoker, G. Kenney, S. Zuckerman, and K. Rhodes, “Appointment Availability after Increases in Medicaid Payments for Primary Care,” New England Journal of Medicine, February 5, 2015, accessed at: http://www.nejm.org/doi/full/10.1056/NEJMsa1413299 ↩︎
  32. Douglas, Director, California Department of Health Care Services v. Independent Living Center of Southern California, Inc., et al., available at http://www.supremecourt.gov/opinions/11pdf/09-958.pdf ↩︎
  33. S. Rosenbaum, Medicaid Payment Rate Lawsuits: Evolving Court Views Mean Uncertain Future for Medi-Cal, California Health Care Foundation, October 2009, available at http://www.chcf.org/publications/2009/10/medicaid-payment-rate-lawsuits-evolving-court-views-mean-uncertain-future-for-medical ↩︎
  34. 42 U.S.C. §1396a(a)(30)(A). ↩︎
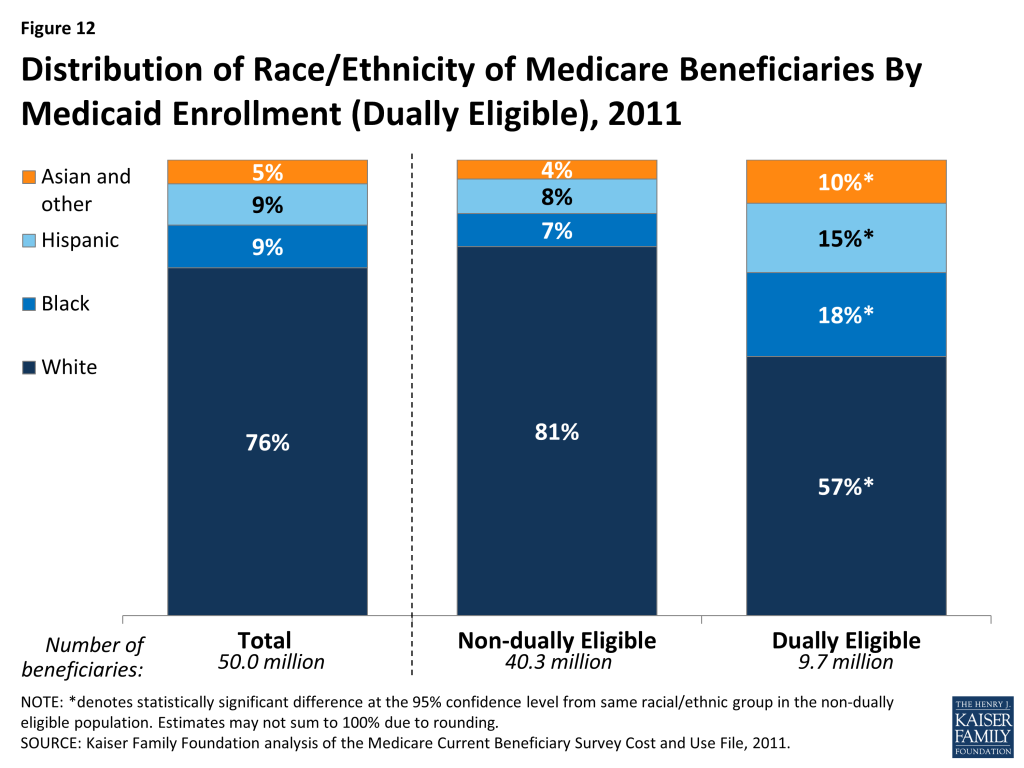
  35. Medicaid and Children’s Health Insurance Program (CHIP) Programs; Medicaid Managed Care, CHIP Delivered in Managed Care, Medicaid and CHIP Comprehensive Quality Strategies, and Revisions Related to Third Party Liability: Proposed Rules, Federal Register, Vol. 80, No. 104, June 1, 2015, https://www.federalregister.gov/articles/2015/06/01/2015-12965/medicaid-and-childrens-health-insurance-program-chip-programs-medicaid-managed-care-chip-delivered ↩︎
  36. Medi-Cal at a Crossroads: What Enrollees Say about the Program, California HealthCare Foundation, May 2012, available at http://www.chcf.org/publications/2012/05/medical-crossroads-what-enrollees-say ↩︎
  37. Monitoring Access to Care for MediCal Enrollees in a Time of Change: CHCF Sacramento Briefing, October 16, 2014, California HealthCare Foundation, accessed at: http://www.chcf.org/events/2014/briefing-medical-access ↩︎
  38. Centers for Disease Control and Prevention, National Center for Health Statistics, “Acceptance of New Patients With Public and Private Insurance by Office-based Physicians: United States, 2013,” NCHS Data Brief, No. 195, March 2015; accessed at http://www.cdc.gov/nchs/data/databriefs/db195.pdf ↩︎
  39. J. Coffman, D. Hulett, M. Fix, and A. Bindman, Physician Participation in Medi-Cal: Ready for the Enrollment Boom? California HealthCare Foundation, August 2014, available at http://www.chcf.org/publications/2014/08/physician-participation-medical ↩︎
  40. California Department of Health Care Services: Improved Monitoring of Medi-Cal Managed Care Health Plans Is Necessary to Better Ensure Access to Care, Report 2014-134, California State Auditor, June 2015, available at http://www.chcf.org/~/media/MEDIA%20LIBRARY%20Files/PDF/PDF%20P/PDF%20PhysicianParticipationMediCalEnrollmentBoom.pdf ↩︎
  41. Frequency of Threshold Language Speakers in the Medi-Cal Population by County for December 2013,” Medi-Cal Statistical Brief, California Department of Health Care Services Research and Analytic Studies Division, , “May 2014, available at http://www.dhcs.ca.gov/dataandstats/statistics/Documents/RASB_Issue_Brief_Annual_Threshold_Language_Report.pdf ↩︎
  42. G. Sánchez, T. Nevarez, W. Schink, and D. Hayes-Bautista, “Latino Physicians in the United States, 1980–2010: A Thirty-Year Overview From the Censuses,” Academic Medicine 90:7, July 2015, available at: http://journals.lww.com/academicmedicine/Citation/2015/07000/Latino_Physicians_in_the_United_States,_1980_2010_.20.aspx ↩︎
  43. On the Frontier: Medi-Cal Brings Managed Care to California’s Counties, California Healthcare Foundation, March 2015, available a http://www.chcf.org/~/media/MEDIA%20LIBRARY%20Files/PDF/PDF%20F/PDF%20FrontierMediCalMgdCareRural.pdf ↩︎
  44. C. Graham, E. Kurtovich, S. Taube, and R. Arguello, Transitioning Beneficiaries with Complex Care Needs to Medicaid Managed Care: Insights from California, Kaiser Commission on Medicaid and the Uninsured, July 2013, available at https://modern.kff.org/search/?s=Transitioning+Beneficiaries+with+Complex+Care+Needs+to+Medicaid+Managed+Care:+Insights+from+California ↩︎
  45. D. Gorn, “Medi-Cal Transition ‘Lessons Learned,’” California Healthline, October 24, 2013, available at http://www.californiahealthline.org/capitol-desk/2013/10/lessons-learned-from-medical-transitions ↩︎
  46. Extended Continuity of Care for SPDs Transitioning to Mandatory Managed Care, News Release, Department of Health Care Services, November 4, 2011, available at http://files.medi-cal.ca.gov/pubsdoco/newsroom/newsroom_20066.asp ↩︎
  47. C. Graham, E. Kurtovich, S. Taube and R. Arguello, op. cit. ↩︎
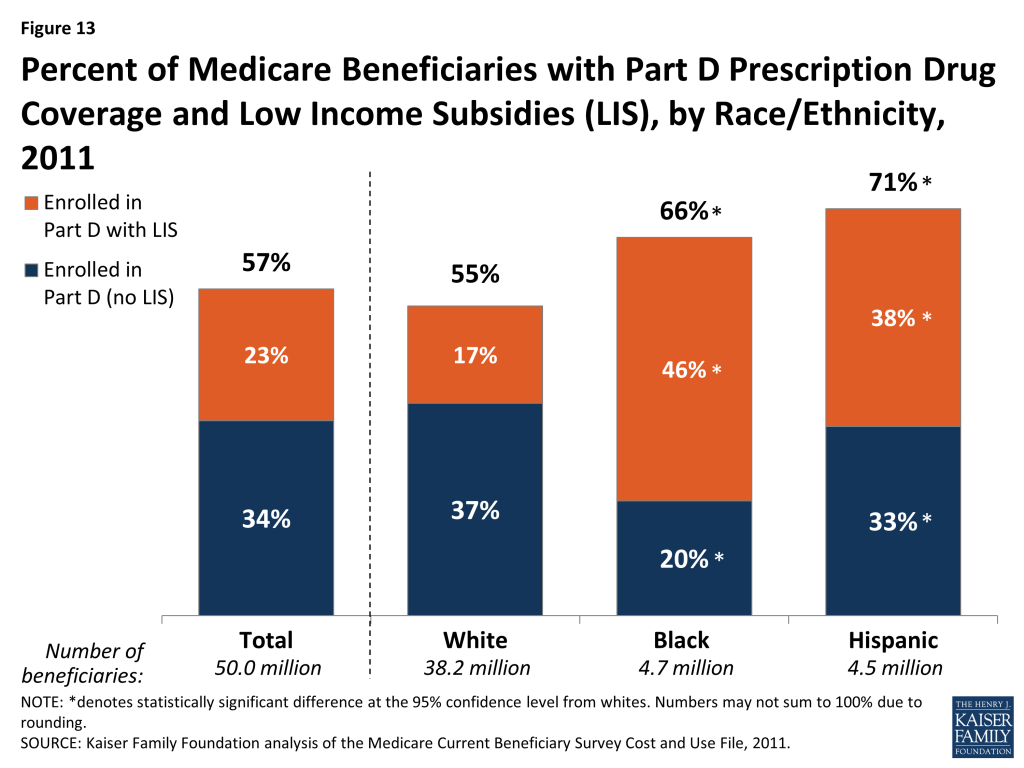
  48. Available at http://www.calduals.org/enrollment-information/hra-data ↩︎
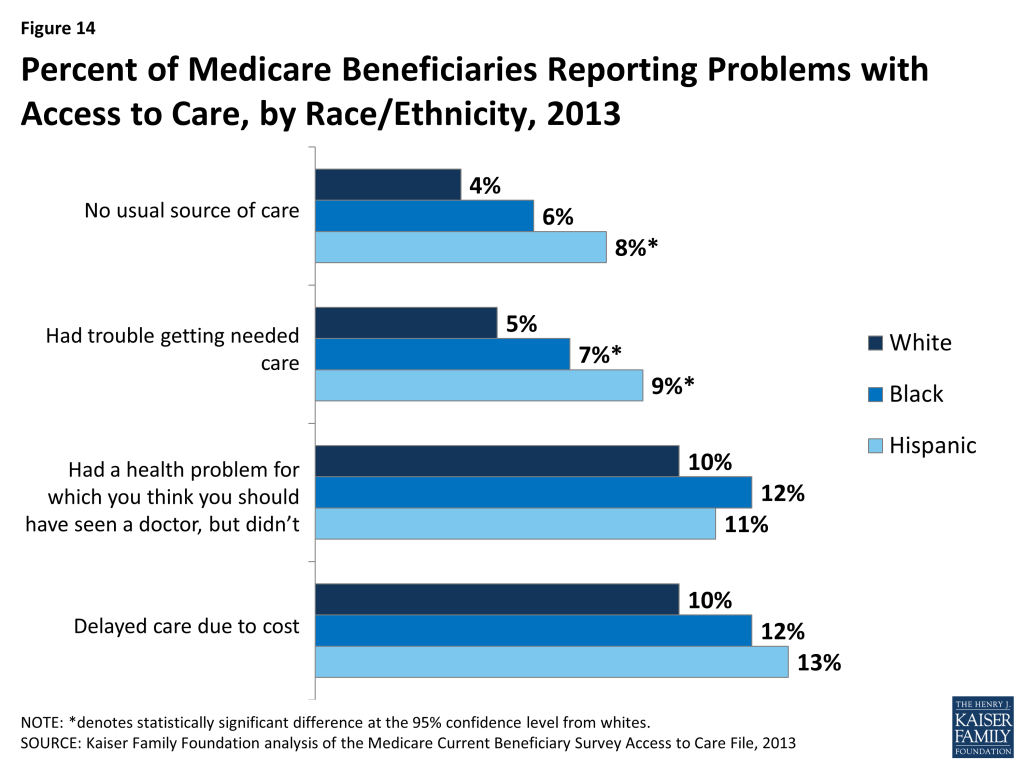
  49. J. Paradise and M. Musumeci, Proposed Rule on Medicaid Managed Care: A Summary of Major Provisions, Kaiser Commission on Medicaid and the Uninsured, July 23, 2015, available at https://modern.kff.org/medicaid/issue-brief/proposed-rule-on-medicaid-managed-care-a-summary-of-major-provisions/ ↩︎
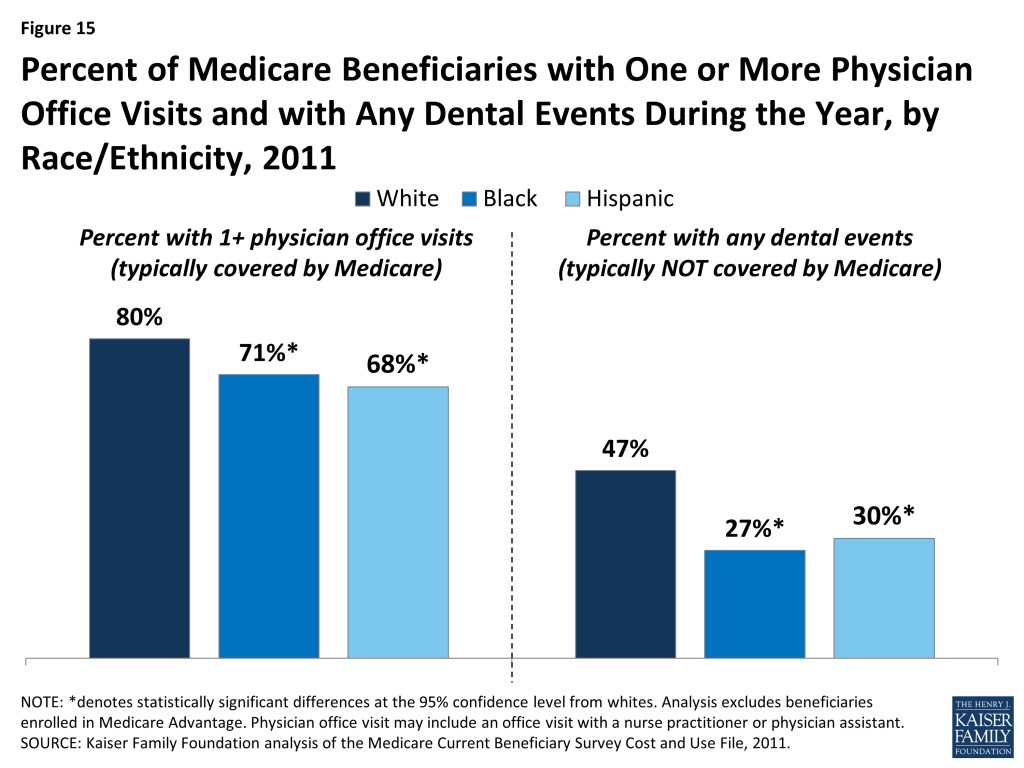
  50. California Hospital Association comment letter to the Centers for Medicare & Medicaid Services, available at http://www.regulations.gov/#!documentDetail;D=CMS-2015-0068-0570 ↩︎
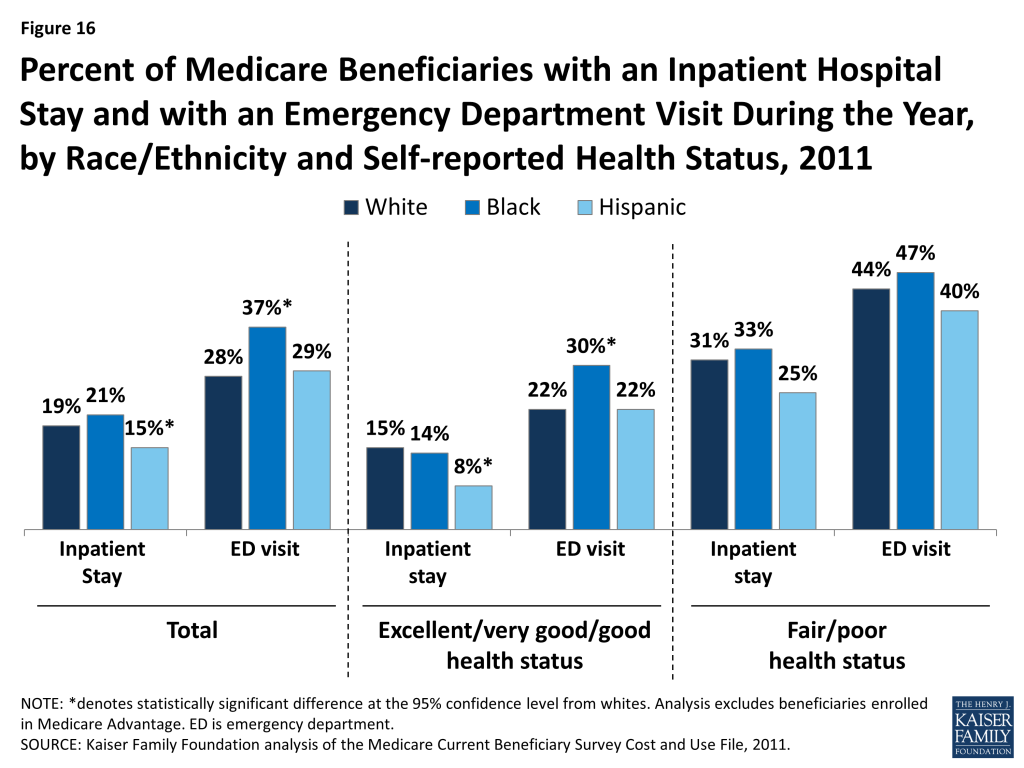
  51. Medi-Cal 2020 Waiver Resources, California Department of Health Care Services, available at http://www.dhcs.ca.gov/provgovpart/Pages/medi-cal-2020-waiver.aspx ↩︎