Data Note: Three Findings about Access to Care and Health Outcomes in Medicaid

Author: Julia Paradise
Published: Mar 23, 2017

The Medicaid program provides health coverage for 74 million low-income Americans, including many of the poorest and sickest people in our society. Among those served by Medicaid are pregnant women, infants, and children, parents and other adults, poor seniors, and people of all ages with physical, cognitive, and other disabilities. Given Medicaid’s major coverage role and the complex health care needs of the population it covers, data and evidence on access to care and health outcomes in Medicaid are of key interest. Such an assessment is also important to ensure that debate about the effectiveness of the Medicaid program is grounded in facts and analysis. This Data Note examines the research on access and health outcomes in Medicaid.

1. Most doctors accept new Medicaid patients.

About 70% of office-based physicians accept new Medicaid patients, compared to about 85% who accept new patients with private insurance or Medicare. The percentage of physicians accepting new Medicaid patients varies by state, ranging from 39% in New Jersey to 97% in Nebraska; the percentage accepting new privately insured patients ranges from 67% in the District of Columbia to 95% in Illinois. In 25 states, the percentage of physicians accepting new Medicaid patients is significantly higher than the national average, while in five states it is significantly lower (Figure 1). In 14 states, more than 85% of physicians accept new Medicaid patients, including 10 states where at least 90% do, and eight states where the percentage accepting new Medicaid patients is equal to or greater than the percentage accepting new privately insured patients.

Figure 1: Nearly 70% of physicians accept new Medicaid patients, but there is wide state variation.

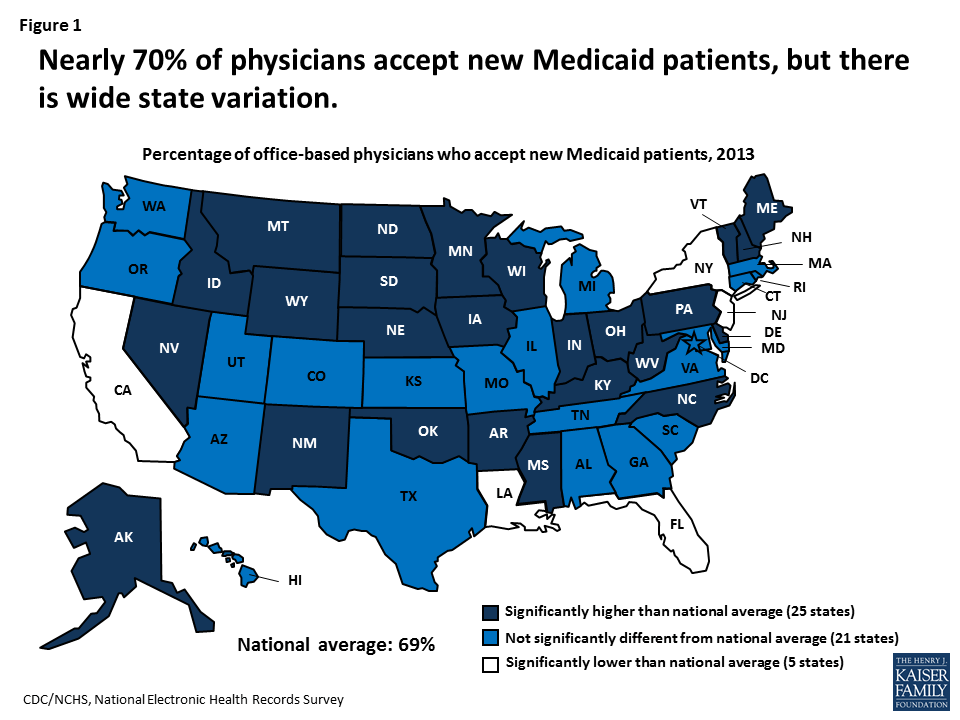
In general, specialists are more likely than primary care physicians, except for pediatricians, to accept new Medicaid patients. But psychiatrists, in particular, are less likely to participate in Medicaid (and in health insurance generally) than other physicians. Virtually all doctors who practice in community health centers, which are a key source of primary care in low-income communities, accept new Medicaid patients. Well over half of Medicaid beneficiaries are enrolled in contracted managed care plans, which are responsible for ensuring adequate provider networks and access to care for their Medicaid members.

There is no evidence that physician participation in Medicaid is declining. In a 2015 survey, 4 in 10 primary care physicians who accepted Medicaid reported seeing an increased number of Medicaid patients since January 2014, when the coverage expansions in the Affordable Care Act (ACA) took full effect. Research has shown a correlation between higher Medicaid fees and higher rates of physician participation in Medicaid. A recent 10-state “secret shopper” study found that the availability of new-patient primary care appointments for Medicaid patients increased significantly after Medicaid fees for primary care physicians were increased to Medicare levels under the ACA.

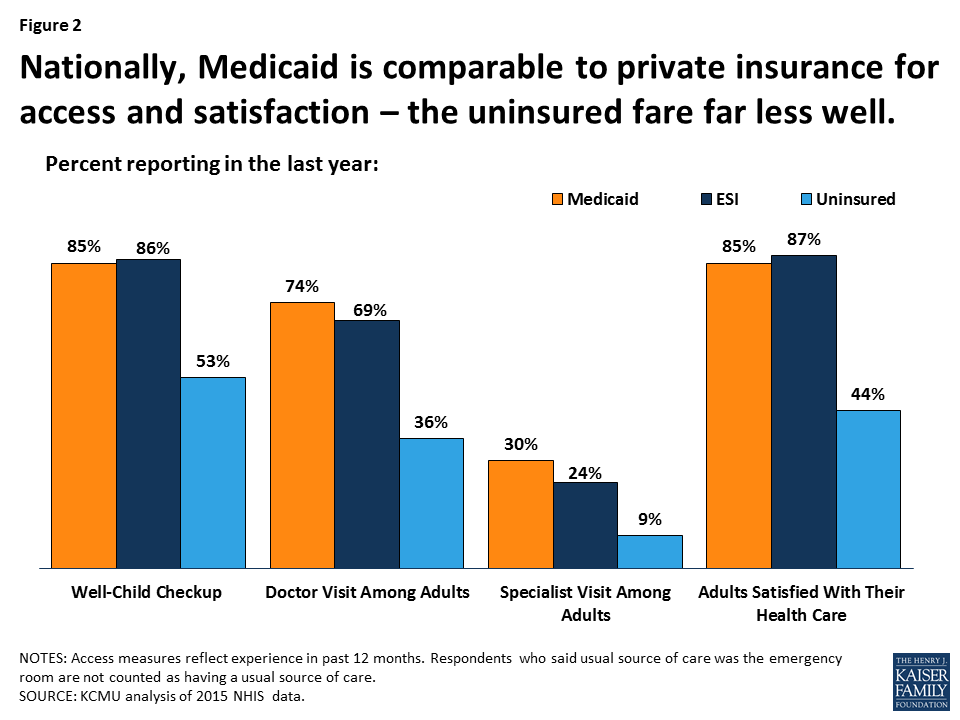
2. On key measures, access to care in Medicaid is comparable to private insurance, while the uninsured lag far behind.  

Medicaid beneficiaries access health care at rates comparable to the rates for privately insured people and at sharply higher rates than the uninsured. In addition, Medicaid increases economic security for low-income households by making health care affordable, reducing financial strain, and protecting against catastrophic medical cost burdens and medical debt.

Ninety-five percent (95%) of children covered by Medicaid or the Children’s Health Insurance Program (CHIP) have a usual source of care, compared to 97% of children with private insurance and 69% of uninsured children. Nearly 90% of non-elderly adults with Medicaid as well as adults with private insurance have a usual source of care, while less than half of uninsured adults do; among adults at or below 138% of the federal poverty level (FPL), the privately insured are twice as likely as those with Medicaid to lack a usual source of care (19% versus 10%). Uninsured people are markedly less likely than Medicaid beneficiaries to get care and significantly more likely to delay or go without needed care due to cost.

Children covered by Medicaid are as likely as children with private coverage to receive a well-child checkup. They are also similarly likely to have had a primary care visit in the past year and, when health, demographic, and socioeconomic differences between the two groups are adjusted, they are just as likely to have had a specialist visit in the past year. Medicaid covers many children with special needs and disabilities, and provides wrap-around benefits for many children with special needs who have private insurance, giving them access to long-term therapies, medical equipment and supplies, and other supports and services not typically covered by private insurance. Under 4% of children with Medicaid/CHIP have trouble finding a doctor who accepts their insurance, compared to about 2% of children with private insurance.

The data on adults tell a similar story. Adults with Medicaid are as likely as privately insured adults to have a doctor visit, receive specialist care, and report that they are satisfied with their health care (Figure 2). Among low-income adults (income at or below 250% FPL) with full-year coverage, those with Medicaid receive preventive care and cancer screening at similar rates to those with private health insurance. A large body of research shows that state Medicaid expansions to adults are associated with increased use of screening services and preventive care, diabetes medications and other prescription drugs, dental care, and other services. Medicaid adults are more likely than privately insured adults to have difficulty finding a provider with availability (11% versus 6%), but most of those who report difficulty do find a provider – under 3% of Medicaid adults (and 2% of privately insured adults) report that they were unable to find a doctor or provider with availability. Many studies show that providers have expanded their capacity and are meeting increased demand for care associated with the Medicaid expansion to adults.

Figure 2: Nationally, Medicaid is comparable to private insurance for access and satisfaction – the uninsured fare far less well.

Gaps in access to certain providers, particularly psychiatrists and dentists, are ongoing challenges in Medicaid. These and other gaps in access tend to mirror system-wide access problems that also affect Medicare and the private insurance market, but they are exacerbated in Medicaid by provider shortages in low-income communities, lower physician fees and participation in Medicaid compared to private insurance, and lack of transportation.

3. Evidence about Medicaid’s impact on health outcomes continues to emerge.

Like private health insurance and Medicare, Medicaid connects enrollees with health care providers and services. Access to screening and preventive care in Medicaid translates into well-child care and earlier detection of health and developmental problems in children, earlier diagnosis of cancer, diabetes, and other chronic conditions in adults, and earlier detection of mental illness in people of all ages. Access to physician care, prescription drugs, emergency care, and other services improves the likelihood that Medicaid enrollees will get treatment for both their acute and chronic conditions.

Multiple studies, though not all, have documented improvements in beneficiaries’ self-reported health, reduced stress and anxiety, and improved quality of life following Medicaid expansions. The Oregon Health Insurance Experiment, which used a research design that is considered the gold standard, compared the experience of adults who gained and adults who did not gain Medicaid coverage through a lottery that allocated a limited number of new Medicaid “slots” for low-income uninsured adults in the state. The study found that Medicaid improved self-reported mental health and reduced clinically observed rates of depression by 30% relative to the uninsured group. The findings related to impacts on physical health were mixed. Medicaid increased the detection of diabetes and use of diabetes medication, but did not have a statistically significant effect on control of diabetes, high blood pressure, or high cholesterol. The researchers note that the study did not have sufficient statistical power to detect changes in these measures, and also that factors including missed diagnosis and inappropriate or ineffective treatments, among others, could mitigate the impact of coverage on clinical outcomes.

Figure 3: Health insurance is one of many factors that contribute to health outcomes.

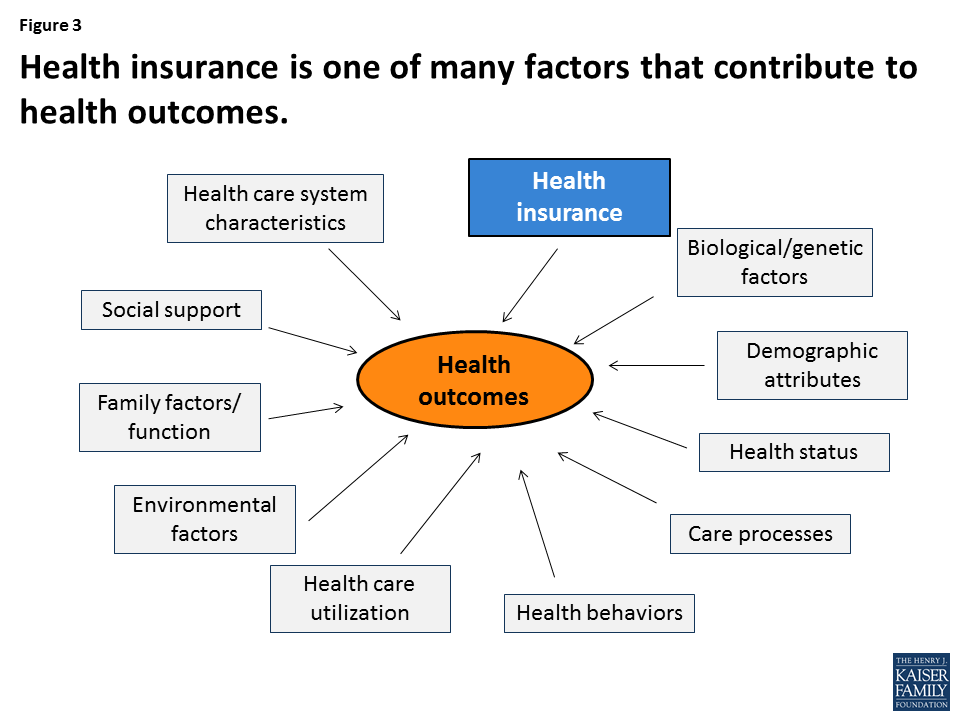
The purpose of health insurance is to increase access to care and provide protection against high out-of-pocket costs. Health outcomes are determined by a large number of variables, from genetic factors to social supports and environmental processes (Figure 3), and direct evidence that Medicaid or any other type of health coverage improves not just access to care, but also health outcomes, is limited. However, research documents that Medicaid coverage of pregnant women and children has contributed to dramatic declines in infant and child mortality in the United States. A growing number of studies show that Medicaid eligibility during childhood also has long-term positive impacts, including reduced teen mortality, reduced disability, improved long-run educational attainment, and lower rates of emergency department visits and hospitalization in later life. In addition, Medicaid eligibility during childhood appears to yield downstream benefits to the economy, in the form of reduced earned income tax credit payments and increased tax collections due to higher earnings in adulthood.

Conclusion

Medicaid covers 1 in 5 Americans today. Data and research provide evidence that Medicaid provides effective access to care for those it covers, including many of the poorest and sickest people in our nation. Because of the program, millions of otherwise uninsured low-income individuals and families – many of them with chronic conditions and disabilities – are able to see a doctor and gain entry into the health care system. The American Health Care Act, the Republican leadership’s plan to repeal and replace the Affordable Care Act, would cap federal funding for Medicaid for the first time in the program’s history, putting Medicaid coverage at risk for millions of low-income people. While the Medicaid program could be strengthened and improved, limiting the scope of Medicaid is likely to jeopardize access to care for the population most in need, with adverse consequences for their health and well-being in the near term and beyond.

Data Note: What if Per Enrollee Medicaid Spending Growth Had Been Limited to CPI-M from 2001-2011?

Authors: Rachel Garfield, Robin Rudowitz, and Katherine Young
Published: Mar 23, 2017

Data Note

Congress is currently debating the American Health Care Act (AHCA), which would repeal and replace the Affordable Care Act (ACA) and also make substantial changes to the structure and financing of Medicaid. The AHCA as released on March 6, 2017 would use a per capita cap policy to cap federal funds to states for Medicaid. Growth in per enrollee amounts would be tied to growth in the medical care component of the CPI (CPI-M).  On March 20, the AHCA added provisions to allow states to elect a block grant for certain populations and increase the per enrollee amounts for the elderly and people with disabilities to CPI-M plus one percentage point. This data note examines what the implications of tying per enrollee growth to CPI-M would have been for the 2001-2011 period for federal spending nationally and state-by-state by major enrollment group. This analysis is meant to illustrate how actual spending compares to spending limits that would have been in place if growth rates had been limited to CPI-M, similar to the limits proposed by the AHCA; however, the analysis does not examine the specific policy provisions of the AHCA, and, unlike assessments of the AHCA by the Congressional Budget Office (CBO), does not include the impact of repealing the ACA Medicaid expansion or other responses that states might adopt in response to federal funding limits. An overview of the methods underlying the analysis is provided in the “Methods” box below.  

Key Takeaways

This data note illustrates how Medicaid spending would have differed from FFY 2001-2011 if spending growth per enrollee had been limited to CPI-M for each enrollment group. It finds:

  • Total Medicaid spending would have been $195 billion lower over the period on net across all groups (about 6.5% lower), and federal spending would have been $128 billion lower (about 7.0% lower).
  • Because spending growth and enrollment growth varied by eligibility group over the period, outcomes differ by eligibility group. Of the decline in federal dollars over the 2001-2011 period, nearly three quarters would have been for spending for children and people with disabilities (each account for 37% of the change), with declines in spending for adults accounting for 22% of the change and declines for the aged accounting for 4% of the change.
  • States varied widely in their actual per enrollee growth rates and enrollment from 2000-2011, leading to state variation in changes in federal spending under the per enrollee cap that limits all states to the same growth rate. Over the 2001-2011 period, most states (38) would have experienced a reduction in federal funds in total, and more than half the states (26) would have seen a drop in federal Medicaid funds of 10% or more. About half of states (25) would have experienced at decline for each enrollee group. For children, Arizona would have faced a 38% drop in federal funds but Colorado a 24% gain; for adults, Pennsylvania would have seen a 45% loss versus a gain of 10% in Iowa; for people with disabilities, New Mexico would have lost 22% of federal funds versus +20% in Rhode Island; and among the aged, Alaska would have seen a 31% loss compared to a similar size gain in Michigan.

National Changes in Medicaid Spending

Our analysis estimates that if 2000 per enrollee spending for full-benefit beneficiaries each enrollment group were limited to growth in CPI-M for the 2001-2011 period, total Medicaid spending would have been $195 billion lower over the period on net across all groups (about 6.5% lower), and federal spending would have been $128 billion lower (about 7.0% lower) than actual total spending (Figure 1).

Figure 1: Estimated Change in Total and Federal Medicaid Spending if Per Enrollee Spending Growth by Group Was Limited to CPI-M, 2001-2011

Changes in Spending by Eligibility Group

Because spending growth varied by eligibility group over the period, outcomes differ by eligibility group. Generally, spending growth per enrollee for the aged and people with disabilities was low over this period, relative to spending growth per enrollee for adults and children. Limiting growth to CPI-M for each group would have resulted in a slight increase in per enrollee spending for the aged (2%) and a slight decline for the disabled (-6%), but much larger declines for adults (-18%) and children (-15%) in 2011 (Figure 2).

Figure 2: Actual Full-Benefit Per Enrollee Amounts Compared to Estimated if Per Enrollee Spending Growth Was Limited to CPI-M, 2011

Reflecting these differences in growth rates by eligibility group, as well as differences in enrollment across groups, the total decline in Medicaid spending over the 2001-2011 period is not evenly distributed across groups. Of the estimated $128 billion decline in federal dollars over the 2001-2011 period, nearly three quarters would have been for spending for children and people with disabilities (each account for 37% of the change), with declines in spending for adults accounting for 22% of the change and declines for the aged accounting for 4% of the change (Figure 3).

Figure 3: Distribution of Estimated Change in Federal Medicaid Spending if Per Enrollee Spending Growth by Group Was Limited to CPI-M, 2001-2011

Limiting federal Medicaid spending to a per enrollee cap set at the sum of per enrollee spending by group yields different results than setting an overall per enrollee spending cap.  Our analysis finds that, using the overall per enrollee spending cap, Medicaid spending would have increased by approximately $19 billion over the period (a 0.6% increase) and federal spending would have increased by approximately $8 billion (a 0.4% increase) (data not shown). This different outcome occurs because the overall per enrollee spending amount reflects the weighted average of spending for relatively costly groups (aged and people with disabilities) as well as relatively inexpensive groups (children and adults without disabilities). Since total Medicaid enrollment is made up mostly of the less costly groups, states overall would have fared better under a cap set at the overall per enrollee amount. However, some states (11 states) would have fared worse under an overall cap. Use of an overall cap does not adjust for changes in case mix within a state over time.

Variation by State

States varied widely in their actual per enrollee growth rates and enrollment from 2000-2011, leading to state variation in changes in federal spending under the per enrollee cap. Over the 2001-2011 period, most states (38) would have experienced a reduction in federal funds in total (Figure 4 and Table 1). Nearly all states (47) would have experienced a reduction in the adult group.

Estimated Number of States Experiencing Decline in Federal Spending if Per Enrollee Spending Growth by Group Was Limited to CPI-M, 2001-2011

Depending on the structure of a federal per capita cap, states could possibly shift funds from a group whose expenses were below the cap to one whose expenses were above it. Based on the analysis of data from 2000-2011, about half of states (25) would have experienced declines in federal Medicaid spending for all four eligibility groups, so they would not have had savings from one group to transfer to another. Further, as evidenced by the fact that most states (38) still had a net decline in federal dollars, many states that had savings for one group would not have experienced sufficient savings to offset losses.

The magnitude of the change in federal Medicaid funds varies significantly by state (Table 2 and Figure 5). More than half the states (26) would have seen an overall drop in federal Medicaid funds of more than 10%. Across all eligibility groups, New Mexico, Louisiana, and Maryland would have experienced a reduction in federal funds of 26%, 21%, and 20%, respectively, while New Hampshire, Michigan, and Illinois would have received 13%, 11%, and 11% more federal dollars, respectively.  Limiting federal Medicaid spending increases to a uniform rate across states would not account for differences in states’ cost of care for Medicaid beneficiaries.

Figure 5: Estimated Change in Federal Medicaid Spending if Per Enrollee Spending Growth by Group Was Limited to CPI-M, 2001-2011

The variation by group is even larger (Figure 6).  For the aged, Alaska would have experienced a 31% loss in federal funding compared to a 31% increase in Michigan; New Mexico would have experienced a 22% loss in federal funds for people with disabilities compared to a 20% gain in Rhode Island; Pennsylvania would have experienced a 45% reduction in federal funds for adults compared to a 10% increase in Iowa; and Arizona would have experienced a reduction of 38% for children compared to an increase of 24% in Colorado. Notably, actual per enrollee spending amounts by eligibility group vary by year for some states due to data anomalies in the administrative data. While our analysis corrected for clear errors in the data (see Methods for more details), it is not always clear whether states experiencing year-to-year shifts experienced actual changes or faced data issues. These data anomalies highlight the challenge of finding timely, accurate data to serve as the basis for per enrollee spending rules.

Figure 6: State Variation in Estimated Change in Federal Medicaid Spending if Per Enrollee Spending Growth by Group Was Limited to CPI-M, 2001-2011

Looking Ahead

Changes to Medicaid financing proposed under the AHCA would be a major restructuring of the Medicaid program. Currently, federal Medicaid matching funds are provided on an open-ended basis and grow with both enrollment increases and changes in per enrollee spending; federal Medicaid funds also account for variation in changes to the cost of care across states. This structure has allowed Medicaid spending growth per enrollee to vary over time, accounting for changes in medical technology (e.g., new prescription drug treatments), new treatment patterns (e.g., the shift to community-based long-term care), or emerging illnesses (e.g., HIV/AIDS). It also allows spending growth to vary across states, based on variation in health care markets, the needs of residents and state policy choices. A federal per enrollee cap on Medicaid spending would grow with enrollment, but it would not account for this variation in per enrollee spending growth over time and across states. As illustrated by looking at spending per enrollee from 2001 to 2011, states would face very different outcomes if federal per enrollee growth were limited to CPI-M, and most states would have experienced a net decrease in federal Medicaid funds. Policies imposed going forward (instead of looking back) could result in federal savings, but could have significantly different implications across enrollment groups and across states. In response to limited federal funding for Medicaid, states would need to either offset those federal reductions or cut back on their Medicaid programs.

Methods

This analysis is based on data prepared by the Kaiser Family Foundation and the Urban Institute from the Medicaid Statistical Information System (MSIS) for FFY 2000-2011. We calculated Medicaid enrollment, total spending, and spending per enrollee for full-benefit enrollees in each year, both by eligibility group and for all eligibility groups combined. For aged enrollees, we excluded spending for prescription drugs to account for these costs being largely shifted to the Medicare Part D program starting in 2006. To estimate federal Medicaid spending, we apply each state’s effective Federal Medical Assistance Percentage (FMAP) for that year to total spending. FMAPs include adjustments to the federal share of Medicaid costs from April 2003-June 2004 and from October 1, 2008 through June 30, 2011.

To account for data anomalies, we made some adjustments to particular state-years in the data. Specifically, New Mexico’s spending data for FFY 2009-2011 is missing data for individuals enrolled in the state’s CoLTS program. To account for this issue, we applied nationwide annual growth rates by eligibility group to New Mexico’s 2008 per enrollee spending to calculate spending levels in subsequent years. In addition, to account for anomalies in baseline (FFY 2000) data for Tennessee (for aged) and Hawaii (for disabled), we imputed per enrollee spending for FFY 2000 for these states/groups using overall FFY 2000-2001 growth rates for the state for that year. Due to additional data quality issues, we imputed spending and enrollment in Georgia and New Mexico in FFY 2002, Maryland and West Virginia in FFY 2003, Tennessee and West Virginia in FFY 2004, and Idaho in FFY 2010. We used FFY 2010 data to estimate missing data for Florida, Kansas, Maine, Maryland, Montana, New Mexico, New Jersey, Oklahoma, Texas, and Utah in 2011. While other states may have data anomalies in the MSIS data over time, we did not adjust for all potential issues, as other anomalies were on a scale that it was difficult to determine if they were data issues or reflected real annual changes in spending or enrollment.

We then estimated per enrollee spending for FFY 2001-2011 if spending growth starting in FFY 2001 had been limited to the medical care component of the CPI (CPI-M). For each year and for the entire period, we compare actual per enrollee and total spending amounts for each eligibility group and for all eligibility groups combined to what it would have been with per enrollee growth limited to CPI-M. We assume that states cut state spending to keep per enrollee costs within federal caps.

This analysis is meant to illustrate how actual spending compares to spending limits that would have been in place if growth rates had been limited to CPI-M, similar to the limits proposed by the AHCA; however, the analysis does not examine the specific policy provisions of the AHCA (i.e. adjusting for non-supplemental DSH payments). Further, unlike assessments of the AHCA by the Congressional Budget Office (CBO), this analysis does not project future changes to Medicaid spending or include the impact of repealing the ACA Medicaid expansion.

Tables

Table 1: Estimated Change in Federal Medicaid Spending under Federal Per Capita Cap, 2001-2011 ($ in millions)
StateAgedPeople with DisabilitiesAdultsChildrenTotal
US Total $(5,712) $(47,194) $(27,839) $(46,983) $(127,730)
Alabama $(466) $(514) $(134) $(1,824) $(2,939)
Alaska $(302) $(339) $(122) $(420) $(1,183)
Arizona $1,639 $(2,287) $(1,446) $(4,654) $(6,747)
Arkansas $(1,601) $(1,264) $(349) $(638) $(3,853)
California $(7,188) $(10,335) $(913) $(2,827) $(21,263)
Colorado $90 $114 $(23) $903 $1,085
Connecticut $271 $(220) $(174) $(51) $(174)
Delaware $(198) $(4) $(298) $(106) $(607)
DC $(253) $(505) $(246) $(101) $(1,105)
Florida $(3,836) $(5,386) $(1,557) $(2,504) $(13,283)
Georgia $(2,308) $(1,665) $(1,815) $(761) $(6,549)
Hawaii $(86) $(407) $(290) $344 $(439)
Idaho $93 $(140) $(109) $(367) $(523)
Illinois $4,605 $2,995 $(28) $(765) $6,807
Indiana $(427) $(899) $(473) $(642) $(2,440)
Iowa $218 $150 $158 $(51) $476
Kansas $55 $867 $(31) $(466) $425
Kentucky $(137) $(1,185) $(917) $(943) $(3,182)
Louisiana $(1,577) $(3,545) $(466) $(1,662) $(7,250)
Maine $(78) $1,214 $23 $48 $1,207
Maryland $(967) $(2,575) $(1,046) $(1,108) $(5,696)
Massachusetts $(1,120) $4,516 $(1,217) $(2,961) $(782)
Michigan $4,263 $(178) $538 $1,563 $6,185
Minnesota $411 $(1,491) $(987) $(1,370) $(3,437)
Mississippi $(1,913) $(2,178) $(83) $(484) $(4,658)
Missouri $24 $(1,186) $(1,671) $(2,958) $(5,791)
Montana $(132) $(122) $(60) $(160) $(474)
Nebraska $507 $50 $(115) $(434) $7
Nevada $(167) $(511) $(26) $(42) $(747)
New Hampshire $(5) $649 $(8) $90 $727
New Jersey $627 $(772) $(487) $(506) $(1,138)
New Mexico $(635) $(1,764) $(911) $(1,809) $(5,119)
New York $3,440 $(6,524) $1,724 $2,357 $996
North Carolina $(177) $(2,148) $(1,125) $(3,400) $(6,850)
North Dakota $(32) $218 $(2) $28 $212
Ohio $(212) $(2,635) $(2,154) $(1,429) $(6,430)
Oklahoma $(424) $(457) $(805) $(875) $(2,562)
Oregon $(313) $(615) $(539) $286 $(1,181)
Pennsylvania $4,410 $(3,952) $(3,020) $(531) $(3,092)
Rhode Island $109 $848 $(242) $(608) $107
South Carolina $(433) $(357) $(811) $(1,228) $(2,829)
South Dakota $(67) $(147) $(92) $(181) $(486)
Tennessee $(3,220) $2,109 $(2,266) $(1,179) $(4,557)
Texas $(1,670) $(1,676) $(210) $(9,914) $(13,469)
Utah $58 $208 $(21) $378 $623
Vermont $(266) $(212) $(280) $(275) $(1,032)
Virginia $38 $(1,139) $(784) $(1,876) $(3,760)
Washington $2,504 $(2,197) $(153) $(541) $(386)
West Virginia $(528) $(414) $(271) $(708) $(1,921)
Wisconsin $1,736 $998 $(1,456) $515 $1,793
Wyoming $(73) $(185) $(48) $(139) $(445)
SOURCE: Kaiser Family Foundation and Urban Institute analysis of FFY 2000-2011 MSIS data.
Table 2: Estimated Percent Change in Federal Medicaid Spending under Federal Per Capita Cap, 2001-2011
StateAgedPeople with DisabilitiesAdultsChildrenTotal
US Total-1%-6%-14%-12%-7%
Alabama-7%-5%-20%-26%-12%
Alaska-31%-15%-14%-22%-20%
Arizona30%-17%-13%-38%-16%
Arkansas-28%-13%-39%-12%-17%
California-15%-12%-6%-8%-11%
Colorado2%2%-1%24%7%
Connecticut3%-2%-7%-1%-1%
Delaware-19%0%-21%-10%-11%
DC-12%-10%-20%-6%-11%
Florida-19%-15%-23%-16%-17%
Georgia-24%-10%-28%-6%-14%
Hawaii-5%-18%-18%28%-6%
Idaho7%-3%-21%-21%-7%
Illinois42%11%0%-5%11%
Indiana-5%-6%-18%-9%-7%
Iowa5%2%10%-2%3%
Kansas2%13%-3%-17%3%
Kentucky-2%-8%-25%-12%-10%
Louisiana-25%-19%-25%-23%-21%
Maine-2%18%1%2%8%
Maryland-15%-18%-38%-19%-20%
Massachusetts-8%19%-24%-34%-1%
Michigan31%-1%8%14%11%
Minnesota5%-9%-25%-20%-10%
Mississippi-31%-19%-5%-9%-19%
Missouri0%-6%-45%-28%-14%
Montana-8%-6%-26%-13%-9%
Nebraska20%1%-14%-18%0%
Nevada-15%-18%-4%-2%-12%
New Hampshire0%28%-2%7%13%
New Jersey5%-5%-19%-8%-3%
New Mexico-21%-22%-45%-26%-26%
New York5%-6%6%9%0%
North Carolina-2%-8%-23%-26%-13%
North Dakota-2%13%0%5%5%
Ohio-1%-7%-23%-13%-8%
Oklahoma-10%-5%-37%-13%-11%
Oregon-6%-8%-21%7%-6%
Pennsylvania19%-10%-45%-4%-4%
Rhode Island7%20%-31%-36%1%
South Carolina-7%-3%-29%-18%-10%
South Dakota-7%-8%-24%-16%-11%
Tennessee-46%10%-21%-11%-9%
Texas-8%-4%-2%-24%-11%
Utah5%4%-2%13%6%
Vermont-22%-9%-34%-20%-18%
Virginia1%-10%-34%-32%-15%
Washington37%-18%-4%-8%-1%
West Virginia-15%-5%-19%-22%-12%
Wisconsin16%7%-34%13%5%
Wyoming-13%-16%-27%-23%-18%
SOURCE: Kaiser Family Foundation and Urban Institute analysis of FFY 2000-2011 MSIS data.

Impact of Cost Sharing Reductions on Deductibles and Out-Of-Pocket Limits

Published: Mar 22, 2017

Issue Brief

The American Health Care Act (AHCA) proposes several changes to the financial support available to people enrolling in nongroup coverage. In addition to modifying the premium tax credits that people would get, the AHCA would eliminate the provision that reduces the cost sharing burden for lower- and moderate income enrollees who get their coverage through the federal or a state marketplace. The cost-sharing reductions are a key part of the financial support currently provided to these enrollees; over 6.4 million people were enrolled in a plan with reduced cost-sharing in 2016 (See State Health Facts ). This note briefly describes the cost-sharing reductions in current law and illustrates their impact by looking at how these provisions affect average deductibles and out-of-pocket maximum limits in benchmark silver plans in 2017 in states using the federally facilitated marketplace.

How Cost Sharing Reductions Work

Under current law, people who are eligible for premium tax credits based on their income also may be eligible for a reduction in their cost sharing (i.e., deductibles, coinsurance, copayments, out-of-pocket limits) if they enroll in a plan in the silver tier. Insurers are required to reduce the cost sharing applicable to people with low and moderate incomes by increasing the actuarial value of the plan that people choose. A silver plan generally has an actuarial value of 70%, which means that the insurers expects to pay, on average, 70% of the covered costs of enrollees in the plan. Insurers must increase the actuarial value to 94% for enrollees with incomes below 150% of poverty, to 87% for enrollees with incomes between 150% and 200% of poverty, and to 73% for enrollees with incomes between 200% and 250% of poverty. They do this by creating variants (called cost sharing reduction, or CSR plans) of each silver plan they offer: each variant lowers the cost sharing to meet the higher actuarial value required. Insurers are periodically reimbursed for the additional claims expenses they incur from lowering the cost sharing in these plans.

The law provides insurers flexibility in determining how cost sharing is arranged in order to meet these actuarial value levels, although the out-of-pocket limits on cost sharing cannot exceed prescribed amounts. An out-of-pocket limit is the maximum an enrollee must pay toward cost sharing for services received in-network; after the limit is reached the insurer pays 100% of the cost for covered services. In 2017, the maximum out-of-pocket limit applicable for most plans is $7,150 for single coverage and twice that amount for family coverage. For CSR plans, the maximum out-of-pocket limits for single coverage are $2,350 for enrollees with incomes below 200% of poverty, and $5,700 for enrollees with incomes between 200% and 250% of poverty1  (For More on Health Insurance subsidies). The limits for family CRS plans are twice the single limits. Table 1 illustrates how the cost sharing in a standard silver plan compares to cost sharing in its CSR variants.

Table 1: Example of Cost-Sharing Reductions on Plan Cost-Sharing
 CSR – 94CSR – 87 CSR – 73Silver
Combined Medical and Drug Deductible (Individual)$0$500$2,275$2,400
Out-of-Pocket (Individual)$1,250$2,250$5,700$7,150
Primary Care Physician Visit$0$10$20$20
Specialist Physician Visit$10$30$55$55
Emergency Room Visit$150$205$400$400
Inpatient Facility10%20%30%30%
Inpatient Physician10%20%30%30%
SOURCE: Plan characteristics for “Molina Marketplace Silver Plan” the Second Lowest Cost Plan in Franklin County, Ohio

Impact of Cost Sharing Reductions

To illustrate the impact of the provisions reducing cost sharing for low and moderate income enrollees, we look at the average reductions in deductibles and out-of-pocket limits in the silver plans offered in the federally facilitated marketplace (see Methods). We focus on the deductibles and out-of-pocket maximums because these are the most visible cost-sharing elements in policies.

The cost sharing reductions significantly lower deductibles in these plans: for plans where there is a combined deductible for medical care and prescription drugs, the average deductible is reduced for those with incomes below 150% of poverty from $3,609 to $255, a savings of $3,354; for those with incomes between 150% and 200% of poverty the average deductible is reduced to $809 a savings of $2,800 and for enrollees with incomes between 200% and 250% of poverty, the average deductible is $2,904, a savings of $705 (Figure 1 and Figure 2). For plans with a separate deductible for medical care and prescription drugs, the comparable reductions in the deductible for medical care are $3,103, $2,631 and $648 (Figure 2).

Figure 1: Average Medical Deductible In Plans with Combined and Separate Medical and Prescription Drug Deductible
Figure 2: Average Savings in Plan Deductibles Between Silver Plans and Cost-Sharing Reduction Plans, 2017

The impacts of the cost sharing reductions on the out-of-pocket limits in these plans is also large. The average combined medical and prescription drug out-of-pocket limit is reduced from $6,528 to $941 for a savings of $5,587 for enrollees with incomes below 150% of poverty. Likewise, the out-of-pocket maximum is reduced to $1,875 a savings of, $4,653 for enrollees with incomes between 150% and 200% of poverty, and reduced to$5,233 for enrollees with incomes between 200% and 250% of poverty, a savings of $1,294 (Figure 3 and Figure 4).

Figure 3: Average Out-Of-Pocket Limit In Plans with Combined Limit for Medical and Prescription Drug Cost Sharing
Figure 4: Average Difference in Out-of-Pocket Maximums Between Silver Plans and Cost-Sharing Reduction Plans, 2017

Discussion

The law provides considerable financial assistance for low and moderate income people who purchase non-group coverage. Premium tax credits, which are income adjusted, help make coverage more affordable, while reduced cost sharing helps to make the out-of-pocket costs at the point of service more affordable when they need care. Insurance policies can require significant cost sharing contributions from enrollees, which can strain the budgets of many families but often are out of reach for people with lower and modest incomes: in 2013, about one-third of nonelderly households with private insurance and with incomes above poverty did not have sufficient financial assets to meet deductibles of $2,500 for single person households or $5,000 for multi-person households, and the percentages are much higher for households with incomes between 100% and 250% of poverty (See Consumer Assets and Patient Cost-Sharing). While reductions in premium tax credits under the AHCA could put insurance out of reach for many low-income people, elimination of cost-sharing subsidies would make the insurance people do buy less valuable.

Methods

Data were obtained from the Data.HealthCare.gov 2017 QHP Landscape on March 17, 2017. Plans analyzed include those offered in 2017 in the 38 states using Healthcare.gov (which includes federally facilitated, supported, and partnership Marketplaces, including Oregon, New Mexico, Nevada and Hawaii).

The analysis focuses on plans in the Silver metal tier. Child-only plans were removed, and the remaining unique records (those with identical cost-sharing structures from the same issuer) were collapsed by state, thereby removing duplications where the same plans are offered in multiple counties within the state. For each Silver plan, we compared the deductible and out-of-pocket amounts with those in 73% actuarial value, 87% actuarial value, and 94% actuarial value cost-sharing variants. Averages are simple averages and not weighted by enrollment as plan-level enrollment data are not publicly available.

News Release

10 Ways Women Could Be Affected by Repeal of the Affordable Care Act

Published: Mar 22, 2017

Repeal of the Affordable Care Act could have a profound impact on women, as the law fundamentally changed women’s health coverage, benefits, and access to care.

In a new issue brief, the Kaiser Family Foundation outlines 10 ways women could be affected if the ACA is repealed or its provisions are otherwise eliminated or modified, including through changes proposed in the House Republican replacement bill, the American Health Care Act.

The brief discusses the potential impact on women of six provisions of the AHCA:

  • Eliminating federal funds for the ACA’s Medicaid expansion.
  • Capping federal funding available to states for Medicaid.
  • Cutting off federal Medicaid payments to Planned Parenthood.
  • Changing financial assistance in the individual insurance market, including how tax credits are calculated and how much insurers can account for age when determining premiums.
  • Implementing new restrictions on coverage for abortions.
  • Rescinding the requirement to cover essential health benefits, including maternity care, preventive services, and mental health care. The AHCA removes this requirement for Medicaid expansion, but does not address it for private plans.

The brief also examines the possible effect of four possible changes that are not included in the current House Republicans’ ACA replacement plan, but could be addressed later:

  • Eliminating the requirement that public and private plans cover preventive services without cost sharing, including cancer screenings and well-woman visits.
  • Eliminating or modifying the requirement that most plans cover birth control without cost sharing.
  • Weakening protections or benefits related to care for pregnant and postpartum women.
  • Repealing ACA insurance reforms, such as prohibitions on charging women more than men for the same coverage or denying coverage due to a pre-existing condition.

This analysis, along with poll findings on women’s health coverage and federal funding for reproductive health, were discussed today at a web briefing for media hosted by the Foundation. An archived webcast of the briefing is available on kff.org.

News Release

Health Insurance Premiums Under the ACA vs. AHCA: County-Level Data

Published: Mar 22, 2017

The Kaiser Family Foundation’s interactive map now allows users to compare what consumers in each county would pay in health insurance premiums after tax credits in 2020 under the Affordable Care Act vs. the House GOP replacement plan, the American Health Care Act.

The maps include estimates by county for current ACA marketplace enrollees at age 27, 40, or 60 with an annual income of $20,000, $30,000, $40,000, $50,000, $75,000, or $100,000.

In addition to premium and tax credit estimates, the maps show the share of an individual’s income they’d pay for health insurance premiums, and the dollar and percentage difference in premiums under the ACA vs. the House GOP’s AHCA.

Generally, people who are older, lower-income, or live in high-premium areas (like Alaska and Arizona) receive less financial assistance under the AHCA. Additionally, older people would have higher starting premiums under the AHCA and would therefore pay higher premiums. Because younger people with higher-incomes and living in lower-cost areas would receive more financial assistance and would have lower starting premiums on average, they would pay less on average.

map-email-032217.jpg

Note: This analysis does not take into account changes the House made on March 20 that would potentially allow for larger tax credits under the AHCA for people over age 50; it is not yet clear whether and how those funds would be allocated to tax credits. The map also does not include cost-sharing assistance under the ACA that lowers deductibles and copayments for low-income marketplace enrollees.

Poll Finding

Data Note: 5 Misconceptions Surrounding the ACA

Published: Mar 21, 2017

On the seventh anniversary of the passing of the Affordable Care Act, we highlight five of the most common misconceptions surrounding the 2010 health care law.

#1:  Six in Ten Do Not Know the Uninsured Rate has Decreased under the ACA…

But in fact, according to the federal government’s National Health Interview Survey, the U.S. uninsured rate among people under 65 was 10.4 in the second quarter of 2016. In 2010, the year the law was enacted, the rate was 18.2. The most recent Kaiser tracking poll finds that four in ten adults in the U.S. know that the share of people without health insurance has decreased since the 2010 health care law passed, while three in ten say the share has increased and a quarter say it has stayed about the same.

Figure 1: The Uninsured Rate is At An All-Time Low, But The Public Doesn’t Know It

#2:  Half Think the ACA Provides Health Insurance to Undocumented Immigrants…

But in fact, under the health law, undocumented immigrants remained ineligible for Medicaid and are ineligible for tax credits toward premiums for ACA marketplace plans. Half of the public incorrectly thinks the law allows undocumented immigrants to receive financial help from the government to buy health insurance.

Figure 2: Half Incorrectly Say ACA Allows Undocumented Immigrants to Receive Financial Help To Buy Insurance

#3:  Half Don’t Know the ACA Eliminated Cost-Sharing for Preventive Care…

But in fact, the ACA eliminated out-of-pocket costs for a variety of preventive care services including birth control. Overall, many Americans are unaware the 2010 health care eliminated cost-sharing for birth control (53 percent) and preventive services for adults (47 percent) and children (41 percent).

Figure 3: Many Are Unaware ACA Eliminated Out-of-Pocket Costs for Birth Control and Preventive Care

#4:  Four in Ten Think the ACA Cut Medicare Benefits…

But in fact, while the ACA has reduced growth in payments to providers and to private health plans that participate in the Medicare Advantage program, it did not cut benefits for seniors enrolled in the traditional Medicare program. Four in ten Americans incorrectly think the ACA cut benefits for people who are covered by traditional Medicare.

Figure 4: Four in Ten Incorrectly Say ACA Cuts Medicare Benefits

#5:  Three in Ten Think Most Americans Get Health Coverage Through the ACA…

But in fact, most Americans are insured through an employer or through a government program, such as Medicare or Medicaid. Less than 10 percent of Americans are covered by ACA marketplace plans. Overall, 29 percent of the public incorrectly thinks that more Americans get their health coverage through the ACA’s marketplaces than through either an employer or Medicaid or Medicare.

Figure 5: Three in Ten Think Most Americans Get Health Insurance through ACA Exchanges or Marketplaces

What is at Stake for Health and Health Care Disparities under ACA Repeal?

Authors: Samantha Artiga, Petry Ubri, and Julia Foutz
Published: Mar 20, 2017

Issue Brief

Key Takeaways

Health and health care disparities, which are differences between groups in their health status and their ability to obtain care, remain a persistent issue in the United States. This brief describes health and health care disparities today, highlights recent advancements in reducing disparities under the Affordable Care Act (ACA), and discusses how the American Health Care Act (AHCA) and proposed reductions in discretionary funding may affect ongoing efforts to address disparities.

  • There have been recent advancements in reducing disparities that reflect provisions under the ACA. People of color and low-income individuals face significant disparities in access to and use of care as well as health outcomes. ACA investments through discretionary programs to strengthen public health and prevention and the health care workforce and delivery system supported reduction of disparities. In addition, the Medicaid and Marketplace coverage expansions led to large gains in health insurance for low-income individuals and people of color, narrowing longstanding disparities in coverage.
  • The proposed changes to Medicaid under AHCA would disproportionately affect low-income individuals and people of color for whom the program is a central source of coverage. Medicaid covers over half of all poor families, one in five adults of color, and over half of children of color. The changes proposed in AHCA, including the cap on federal Medicaid financing and elimination of enhanced federal funding for the Medicaid expansion, would likely lead to large coverage losses among these groups as would the proposed changes to tax credits for private coverage.
  • Other reductions in discretionary health spending may also reduce availability of services, limit progress expanding the health care workforce, and constrain continued research to understand and address disparities. Specifically, AHCA would eliminate funding for the Prevention and Public Health Fund, and the President’s 2018 budget proposes a 17.9% cut to discretionary funding for the Department of Health and Human Services (HHS).

Introduction

Many groups, including low-income individuals and people of color, face disparities in their ability to obtain needed care and in their health outcomes. There have been recent advancements in reducing disparities under the Affordable Care Act (ACA). The American Health Care Act (AHCA) proposal to repeal and replace the ACA and cuts to discretionary spending, as proposed in the President’s 2018 budget, could erode recent progress and negatively affect disparities. This brief describes health and health care disparities today, highlights recent advancements in reducing disparities under the ACA, and discusses how changes proposed in the AHCA and cuts to discretionary funding could affect ongoing efforts address disparities.

Health and Health Care Disparities Today

Health and health care disparities are differences between groups in their health status and ability obtain medical care that are rooted in historic economic, social, and racial disadvantages. Although disparities have been documented for decades and there have been overall improvements in our nation’s health, many disparities have persisted and, in some cases, widened over time.1  Addressing disparities is not only important from a social justice standpoint, but also for improving our nation’s health and reducing unnecessary costs.2  With projections estimating that people of color will make up more than half of the population by 2044, it is increasingly important to address disparities.3 

Today, many groups face significant disparities in their ability to access and use needed health care as well as in their health status and outcomes. There remain large disparities by race and ethnicity.4  For example, compared to Whites, Hispanics fare worse across measures of health access and use (Figure 1) and Blacks fare worse across a range of health measures (Figure 2).5  Disparities also exist by income, with lower income people facing greater barriers to obtaining care and reporting worse health status than those with higher incomes.6  Although disparities are often viewed through the frames of race and income, they also occur across other dimensions. For example, research shows increased barriers for LGBT individuals, people with limited English proficiency, and individuals living in rural and inner city areas.7  Moreover, these groups are not mutually exclusive and there often are disparities among subgroups of populations. 

Figure 1: Access to and Use of Care among Nonelderly Hispanic and White Adults, 2015
Figure 2: Health Status and Selected Health Conditions among Nonelderly Black and White Adults, 2015

Recent Advancements in Reducing Disparities

In recent years, there have been advancements in reducing disparities that reflect an increased federal focus on disparities and provisions to expand coverage and access under the ACA.

Health Coverage Expansions

The ACA’s broad health insurance coverage expansions through Medicaid and the Marketplaces have played a central role in reducing health care disparities. Since implementation of these expansions in 2014, there have been large gains in coverage for low-income individuals and people of color, which helped narrow disparities in coverage (Figure 3).8  The Medicaid expansion played a particularly important role in these coverage gains.

Figure 3: Uninsured Rate among Nonelderly Individuals by Race/Ethnicity, 2013-2015

Coverage gains among low-income individuals and by racial and ethnic group varied across states (Appendix Table 1). Figure 4 shows the states with the three largest percentage point reductions in their uninsured rate among the low-income population (below 200% of the federal poverty level, FPL) and among Hispanics, Blacks, and Whites. It shows that reductions in these states were often at least twice as large as the nationwide reduction for these groups. These states include a mix of those that have implemented the Medicaid expansion and those that have not as well as a mix of states led by both Republican and Democratic governors.

Figure 4: Percentage Point Reduction in Uninsured Rate among the Nonelderly Population, 2013-2015

These coverage gains are expected to reduce disparities in access to and use of health care as well as health outcomes over the long-term. Research shows that health insurance makes a key difference in whether and when people get medical care, where they get their care, and ultimately how healthy they are.9  There also has been growing recognition that, although health insurance is key to health, social and environmental factors also influence health. An increasing number of initiatives within the health care system have emerged to address broader social determinants of health.10  Further, there has been increased recognition of the need to increase diversity within the health care workforce, enhance providers’ ability to deliver culturally and linguistically appropriate care, and increase provider access in rural and underserved areas.11 

Enhanced Federal Focus and Investments in Public Health and Prevention

There has been an elevated focus on addressing health and health care disparities in recent years. In 2011, the Department of Health and Human Services (HHS) developed its first action plan to eliminate racial and ethnic disparities.12  The plan builds on organizational changes made within HHS under the ACA to prioritize and better coordinate efforts to reduce disparities. The ACA also strengthened data collection and research efforts to allow for improved measurement and monitoring of disparities and provided new protections from discrimination in health care.

The ACA included initiatives and investments through discretionary programs to strengthen public health and prevention, the health care workforce, and the delivery system that supported reduction of disparities. The ACA appropriated $11 billion over a five-year period (2011-2015) to support and enhance capacity of community health centers.13  Community health centers are a key source of care for low-income individuals and people of color.14  The ACA also contains provisions to increase the number of providers, particularly in underserved areas.15  Further, the ACA provided funding for and expanded initiatives to strengthen the public health workforce and infrastructure and prevention services, including the new Prevention and Public Health Fund.16 

Remaining Challenges

Despite nationwide gains in health insurance, differing state decisions to implement the ACA Medicaid expansion to low-income adults have widened disparities in coverage. In states that expanded, parents and childless adults with incomes up to 138% FPL, which is about $28,200 for a family of three, are eligible for Medicaid. In contrast, among the 19 states that have not expanded, 10 of which are in the South, the median Medicaid eligibility limit for parents is 44% FPL, or less than $9,000 per year for a family of three, and other adults generally are not eligible. As a result of these differences, overall, Medicaid expansion states have realized larger gains in coverage and access to care than states that have not expanded.17  In particular, there are widening gaps between the South, which is home to many people of color and has high rates of chronic disease and poor health, and the rest of the nation.18 

Further, although disparities in coverage have narrowed, low-income people and people of color still are more likely to be uninsured than those with higher incomes and Whites.19  Hispanics and American Indians and Alaska Natives (AI/ANs) have the highest uninsured rates among racial and ethnic groups, and these disparities persist among children.20  In 2015, Hispanic children were nearly twice as likely as White children to be uninsured (7% vs. 4%), and AI/AN children were nearly five times as likely as White children to be uninsured (19% vs. 4%).21 

Impact of ACA Repeal and Funding Reductions on Disparities

There is much at stake for health and health care disparities as Congress considers future funding decisions and broader health care reforms. The AHCA proposal to repeal and replace the ACA, as approved by the House Ways and Means and Energy and Commerce Committees and the House Budget Committee, would cap federal Medicaid financing, eliminate enhanced federal funding for the Medicaid expansion, make changes to premium tax credits for private health insurance, and eliminate funding for the Prevention and Public Health Fund. In addition, the President’s 2018 budget proposes a 17.9% reduction in discretionary funding for HHS.

Changes to Medicaid under AHCA would disproportionately affect low-income individuals and people of color for whom the program is a central source of coverage. Medicaid provides coverage to over half (54%) of families with income below poverty and nearly four in ten (38%) of near-poor families, with incomes between 100% and 199% FPL (Figure 5). Moreover, it covers more than one in five nonelderly Hispanic, Black, and AI/AN adults. It plays an even larger role for children of color, covering nearly six in ten Hispanic (56%) and Black (54%) children and nearly half of AI/AN children (47%).

Figure 5: Medicaid’s Role for Selected Populations

Capping federal Medicaid financing would fundamentally restructure the federal commitment to states to support care for individuals with the greatest health needs and lowest incomes. The cap would limit growth to a pre-set amount that is lower than projected growth in Medicaid spending.22  With more limited federal funds, states would need to increase spending or make program cutbacks such as reductions in eligibility, benefits, or provider payments that would lead to coverage losses and increased barriers to care for current enrollees. Capped financing also would lock in historic differences across states in benefits and spending and would not be responsive to changing health care costs, for example from new drug treatments or medical advancements, or new public health emergencies, such as the opioid epidemic.

Elimination of enhanced federal funding for the Medicaid expansion would likely result in large coverage losses among low-income people and people of color. As noted, low-income individuals and people of color experienced large coverage gains under the ACA coverage expansions, and the Medicaid expansion played a particularly large role in these gains. If the enhanced federal match rate for the expansion is eliminated, as proposed by AHCA, states would face substantial increased costs to maintain this coverage. It is projected that some of the 32 states that have already expanded their programs would eliminate this coverage and that no additional states would expand in the future.23  Eight of the expansion states (AR, AZ, IL, IN, MI, NH, NM, and WA) have legislation requiring them to eliminate the expansion if the federal match rate is reduced. As a result of these changes, many adults currently enrolled in expansion coverage would likely become uninsured, leading to growing uninsured rates among low-income individuals and people of color that would reverse the recent narrowing of coverage disparities that occurred under the ACA.

Changes in subsidies for private health coverage would also likely lead to coverage losses among low-income individuals and people of color. AHCA also would replace the ACA income-based premium tax credits for Marketplace coverage with flat premium tax credits based on age. Additionally, AHCA would eliminate the cost-sharing subsidies that lower deductibles and other out-of-pocket costs for lower-income individuals. These changes would reduce the levels of financial assistance to lower-income households, which would disproportionately affect people of color, since they are more likely to have lower family incomes compared to Whites. Without as much financial assistance, many low-income individuals and people of color will be unable to afford coverage and will become uninsured.

Elimination of funding for the Prevention and Public Health fund would reduce state capacity to provide these services at a time when there may be increased need due to coverage losses. Reductions in health insurance would increase strains on other parts of the health care system, including community health centers and public health programs. However, AHCA also would eliminate funding for the Prevention and Public Health Fund at the end of Fiscal Year 2018, and rescind any remaining unobligated funds.24  This fund supports public health and prevention services through immunization programs and grants to states to expand state and local capacity to provide prevention and public health services. It also provides targeted funding to states to strengthen their ability to respond to infectious disease and other public health threats, prevent childhood lead poisoning, and prevent healthcare-associated infections. In FY2016, over $625 million in grant funding was provided to states through the fund by the Centers for Disease Control and Prevention.25  A number of governors have pointed to the importance of this funding for supporting public health and prevention activities and cautioned against eliminating this funding under repeal.26 

Other reductions in discretionary health spending may also reduce availability of services, limit progress expanding the health care workforce, and constrain continued research efforts to understand and address disparities. The President’s 2018 budget proposes a 17.9% reduction in funding for HHS. This reduction includes a 19% cut in the budget for the National Institutes of Health, which is central to research efforts to better understand disparities and develop effective interventions to eliminate them, as well as specified reductions in nurse training programs. The budget also proposes a new block grant program to states to address public health outbreaks, without a specified amount, and increased funding to address opioid misuse, but it is unclear to what extent these programs would offset decreases in services to meet the overall 17.9% funding reduction.

Looking Ahead

Maintaining gains in health insurance and support for public health and prevention, the health care workforce, and the delivery system are key for maintaining progress achieved to date and ongoing efforts to reduce disparities.Changes being considered to health insurance through repeal of the ACA and restructuring of Medicaid, including capping federal financing and eliminating enhanced federal funding for the Medicaid expansion, could negatively affect disparities. People of color and low-income individuals would be disproportionately impacted by these changes since they had large coverage gains under the ACA and Medicaid is a central source of coverage for them. Reductions in health insurance and funding also would increase strains on other parts of the health care system, including community health centers and public health programs, which already face funding constraints and uncertainty regarding their future funding. Amid potential changes to health insurance, support for public health and prevention services and a health care workforce and delivery system that meets the needs of our increasingly diverse population is particularly important.

Appendix

Appendix Table 1: Uninsured Rates among the Nonelderly, 2013 and 2015
Below 200% FPLWhiteBlackHispanic
20132015Percentage PointDifference20132015Percentage PointDifference20132015Percentage PointDifference20132015Percentage PointDifference
United States25%17%-8%12%8%-4%17%12%-5%26%17%-9%
Implemented Medicaid Expansion-Democratic/Independent Governor
California25%14%-12%12%6%-6%12%8%-4%23%12%-11%
Colorado25%17%-7%11%8%-3%22%13%-9%21%14%-8%
Connecticut22%13%-10%9%5%-3%13%N/AN/A26%11%-15%
Delaware14%11%-3%7%6%-1%8%8%1%20%15%-5%
District of Columbia12%7%-4%6%3%-3%10%6%-5%15%8%-6%
Hawaii9%10%0%11%N/AN/AN/AN/AN/AN/AN/AN/A
Louisiana25%18%-6%13%11%-2%20%14%-7%29%18%-12%
Minnesota15%17%2%6%4%-2%15%N/AN/A19%20%1%
Montana28%18%-10%18%11%-7%N/AN/AN/AN/A19%N/A
New York16%12%-5%8%6%-2%14%9%-6%15%10%-4%
Oregon21%11%-10%13%7%-6%N/AN/AN/A27%14%-13%
Pennsylvania23%13%-9%10%6%-4%17%13%-4%17%9%-9%
Rhode Island19%8%-11%9%4%-5%19%N/AN/A17%12%-5%
Washington26%12%-15%10%7%-3%19%N/AN/A27%16%-11%
West Virginia23%11%-13%14%8%-6%16%N/AN/AN/AN/AN/A
Alaska25%27%2%13%10%-3%N/AN/AN/A15%N/AN/A
Implemented Medicaid Expansion-Republican Governor
Arizona29%22%-6%15%10%-5%16%N/AN/A30%17%-13%
Arkansas24%16%-8%16%8%-8%20%9%-11%27%31%4%
Illinois20%11%-9%9%6%-3%17%9%-8%20%11%-9%
Indiana24%19%-5%12%9%-3%20%15%-5%34%22%-13%
Iowa18%13%-5%8%6%-3%N/AN/AN/A18%13%-5%
Kentucky26%10%-17%15%7%-8%11%N/AN/A47%N/AN/A
Maryland22%13%-9%10%5%-5%12%8%-4%32%15%-17%
Massachusetts5%6%1%3%5%2%N/A6%N/A5%4%-2%
Michigan21%10%-11%11%6%-5%19%7%-12%15%16%1%
Nevada35%18%-17%16%9%-7%24%N/AN/A34%19%-15%
New Hampshire27%10%-18%13%6%-7%N/AN/AN/A28%N/AN/A
New Jersey26%17%-10%9%7%-3%16%8%-8%22%18%-3%
New Mexico29%19%-10%14%8%-5%N/AN/AN/A22%15%-7%
North Dakota25%16%-9%10%7%-3%N/AN/AN/A17%N/AN/A
Ohio24%13%-10%13%6%-6%17%8%-9%21%18%-4%
Vermont15%10%-5%9%6%-3%N/AN/AN/AN/AN/AN/A
Has Not Implemented Medicaid Expansion-Democratic Governor
North Carolina29%21%-7%14%10%-4%16%14%-2%38%30%-8%
Virginia27%22%-4%11%8%-3%14%14%1%25%21%-4%
Has Not Implemented Medicaid Expansion-Republican Governor
Alabama27%18%-9%17%11%-6%17%14%-3%29%28%-1%
Florida33%23%-10%18%13%-5%24%16%-8%29%19%-9%
Georgia31%25%-6%14%12%-2%19%16%-2%44%30%-14%
Idaho28%21%-7%15%11%-4%N/AN/AN/A23%23%0%
Kansas23%19%-4%9%9%0%11%20%10%29%21%-8%
Maine16%8%-8%11%6%-5%N/A0%N/AN/AN/AN/A
Mississippi24%21%-2%12%14%2%19%13%-6%58%30%-28%
Missouri24%21%-3%12%8%-4%14%16%2%20%28%7%
Nebraska19%19%1%8%8%-1%N/AN/AN/A18%18%0%
Oklahoma26%21%-4%15%10%-5%14%23%9%24%27%3%
South Carolina32%19%-13%15%13%-2%22%11%-12%43%24%-19%
South Dakota20%19%-1%9%8%-2%14%N/AN/A22%N/AN/A
Tennessee24%19%-5%12%11%-1%18%12%-6%41%30%-11%
Texas35%29%-6%14%12%-2%20%17%-3%32%25%-7%
Utah24%20%-4%11%9%-2%N/AN/AN/A25%21%-4%
Wisconsin17%15%-1%9%7%-2%17%N/AN/A19%16%-2%
Wyoming29%18%-11%16%10%-6%N/AN/AN/A34%13%-21%
SOURCES: Kaiser Family Foundation estimates based on the Census Bureau’s March 2014 and March 2016 Current Population Surveys (CPS: Annual Social and Economic Supplements).NOTES: Persons of Hispanic origin may be of any race; all other racial/ethnic groups are non-Hispanic. N/A: Estimates with relative standard errors greater than 30% are not provided.

Endnotes

  1. Agency for Healthcare Research and Quality, 2015 National Healthcare Quality and Disparities Report and 5th Anniversary Update on the National Quality Strategy, (Rockville, MD: Agency for Healthcare Research and Quality, May 2015), https://www.ahrq.gov/sites/default/files/wysiwyg/research/findings/nhqrdr/nhqdr15/2015nhqdr.pdf. ↩︎
  2. Thomas LaVeist, Darrell Gaskin, and Patrick Richard, The Economic Burden of Health Inequalities in the United States, (Washington, DC: Joint Center for Political and Economic Studies, September 2009), http://www.hhnmag.com/ext/resources/inc-hhn/pdfs/resources/Burden_Of_Health_FINAL_0.pdf. ↩︎
  3. Sandra L. Colby and Jennifer M. Ortman, Projections of the Size and Composition of the U.S. Population: 2014 to 2060, (Washington, D.C., U.S. Census Bureau, March 2015), https://www.census.gov/content/dam/Census/library/publications/2015/demo/p25-1143.pdf. ↩︎
  4. Agency for Healthcare Research and Quality, 2015 National Healthcare Quality and Disparities Report and 5th Anniversary Update on the National Quality Strategy, op cit. and Samantha Artiga et. al., Key Facts on Health and Health Care by Race and Ethnicity, (Washington, DC: Kaiser Family Foundation, June 2016), http://files.kff.org/attachment/Chartpack-Key-Facts-on-Health-and-Health-Care-by-Race-and-Ethnicity. ↩︎
  5. Samantha Artiga et. al., Key Facts on Health and Health Care by Race and Ethnicity, op cit. ↩︎
  6. Agency for Healthcare Research and Quality, 2015 National Healthcare Quality and Disparities Report and 5th Anniversary Update on the National Quality Strategy, op cit. ↩︎
  7. Kaiser Family Foundation, Health and Access to Care and Coverage for Lesbian, Gay, Bisexual, and Transgender Individuals in the U.S., (Washington, DC: Kaiser Family Foundation, June 2016), https://modern.kff.org/disparities-policy/issue-brief/health-and-access-to-care-and-coverage-for-lesbian-gay-bisexual-and-transgender-individuals-in-the-u-s/; Kaiser Commission on Medicaid and the Uninsured, Overview of Health Coverage for Individuals with Limited English Proficiency, (Washington, DC: Kaiser Commission on Medicaid and the Uninsured, August 2012), http://modern.kff.org/uninsured/8343.cfm; and Agency for Healthcare Research and Quality, 2013 National Healthcare Disparities Report, (Rockville, MD: Agency for Healthcare Research and Quality, May 2014), https://www.ahrq.gov/sites/default/files/publications/files/2013nhdr.pdf. ↩︎
  8. Samantha Artiga, et. al., Health Coverage by Race and Ethnicity: Examining Changes Under the ACA and the Remaining Uninsured, (Washington, DC: Kaiser Family Foundation, November 2016), https://modern.kff.org/disparities-policy/issue-brief/health-coverage-by-race-and-ethnicity-examining-changes-under-the-aca-and-the-remaining-uninsured/ and Rachel Garfield, et. al., The Uninsured: A Primer – Key Facts about Health Insurance and the Uninsured in the Wake of National Health Reform, (Washington, Kaiser Commission on Medicaid and the Uninsured, November 2016), https://modern.kff.org/uninsured/report/the-uninsured-a-primer-key-facts-about-health-insurance-and-the-uninsured-in-the-wake-of-national-health-reform/. ↩︎
  9. Kaiser Commission on Medicaid and the Uninsured, Key Facts About the Uninsured Population, (Washington, DC: Kaiser Family Foundation, September 2016), https://modern.kff.org/uninsured/fact-sheet/key-facts-about-the-uninsured-population/. ↩︎
  10. Harry J Heiman and Samantha Artiga, Beyond Health Care: The Role of Social Determinants in Promoting Health and Health Equity, op cit. ↩︎
  11. Office of Minority Health, National Standards for Culturally and Linguistically Appropriate Services in Health and Health Care: A Blueprint for Advancing and Sustaining CLAS Policy and Practice, (Washington, DC: U.S. Department of Health and Human Services, April 2013), https://www.thinkculturalhealth.hhs.gov/pdfs/EnhancedCLASStandardsBlueprint.pdf and The Commonwealth Fund, State and Federal Efforts to Enhance Access to Basic Health Care, (New York, NY: The Commonwealth Fund, March 2010), http://www.commonwealthfund.org/publications/newsletters/states-in-action/2010/mar/march-april-2010/feature/feature. ↩︎
  12. Department of Health and Human Services, HHS Action Plan to Reduce Racial and Ethnic Health Disparities, op cit. ↩︎
  13. Kaiser Family Foundation, Summary of the Affordable Care Act, (Washington, DC: Kaiser Family Foundation, April 2013), https://modern.kff.org/health-reform/fact-sheet/summary-of-the-affordable-care-act/. ↩︎
  14. Julia Paradise, et. al., Community Health Centers: Recent Growth and the Role of the ACA, (Washington, DC: Kaiser Family Foundation, January 2017), https://modern.kff.org/report-section/community-health-centers-recent-growth-and-the-role-of-the-aca-issue-brief/. ↩︎
  15. Kaiser Family Foundation, Summary of the Affordable Care Act, (Washington, DC: Kaiser Family Foundation, April 2013), https://modern.kff.org/health-reform/fact-sheet/summary-of-the-affordable-care-act/. ↩︎
  16. Ibid. ↩︎
  17. Larisa Antonisse, et. al., The Effects of Medicaid Expansion under the ACA: Updated Findings from a Literature Review, (Washington, DC: Kaiser Family Foundation, February 2017), https://modern.kff.org/medicaid/issue-brief/the-effects-of-medicaid-expansion-under-the-aca-updated-findings-from-a-literature-review/. ↩︎
  18. Samantha Artiga and Anthony Damico, Health and Health Coverage in the South: A Data Update, (Washington, DC: Kaiser Commission on Medicaid and the Uninsured, February 2016), https://modern.kff.org/disparities-policy/issue-brief/health-and-health-coverage-in-the-south-a-data-update/. ↩︎
  19. Michael E Martinez, Emily P Zammitti, and Roben A Cohen, Health Insurance Coverage: Early Release of Estimates from the National Health Interview Survey, January-September 2016, (Hyattsville, MD: National Center for Health Statistics, February 2017), https://www.cdc.gov/nchs/data/nhis/earlyrelease/insur201702.pdf. ↩︎
  20. Samantha Artiga, et. al., Health Coverage by Race and Ethnicity: Examining Changes Under the ACA and the Remaining Uninsured, op cit. ↩︎
  21. Ibid. ↩︎
  22. Congressional Budget Office (CBO), American Health Care Act: Budget Reconciliation Recommendations of the house Committees on Ways and Means and Energy and Commerce, March 9, 2017, (Washington, DC: CBO, March 2017), https://www.cbo.gov/sites/default/files/115th-congress-2017-2018/costestimate/americanhealthcareact.pdf. ↩︎
  23. Ibid. ↩︎
  24. Kaiser Family Foundation, Summary of the American Health Care Act, (Washington, DC: Kaiser Family Foundation, March 2017), http://files.kff.org/attachment/Proposals-to-Replace-the-Affordable-Care-Act-Summary-of-the-American-Health-Care-Act. ↩︎
  25. Centers for Disease Control and Prevention (CDC), Accomplishing CDC’s Mission with Investments from the Prevention & Public Health Fund, FY 2010- FY 2016, (Atlanta, GA: CDC, n.d.), https://www.cdc.gov/funding/documents/cdc-pphf-funding-impact.pdf. ↩︎
  26. Samantha Artiga, et. al., Views of Governors and Insurance Commissioners on ACA Repeal and Changes to Medicaid: Responses to a Congressional Request for State Input on Health Reform, (Washington, DC: Kaiser Family Foundation, March 2017), https://modern.kff.org/medicaid/issue-brief/views-of-governors-and-insurance-commissioners-on-aca-repeal-and-changes-to-medicaid-responses-to-a-congressional-request-for-state-input-on-health-reform/. ↩︎
News Release

11 Million People on Medicare Are Also Covered by Medicaid. What Could Switching to a Medicaid Per Capita Cap Mean for Them?

Published: Mar 20, 2017

A major structural change to Medicaid financing such as the per capita cap system called for under the American Health Care Act could have significant implications for the 11 million seniors and people with disabilities who are covered by both Medicare and Medicaid, according to a new brief by the Kaiser Family Foundation.

One in five Medicare beneficiaries relies on Medicaid for premium and cost-sharing assistance and to pay for services not covered by Medicare, such as nursing home care. Most are 65 or older, are disproportionately women and older than 85, but four in ten are under age 65 and have permanent disabilities. Medicaid also plays an important role in paying for long-term services and supports, helping to cover the costs for 2 out of 3 Medicare beneficiaries in nursing homes.

Under a Medicaid per capita cap system, the federal government would pay states a fixed amount of money per Medicaid enrollee annually, with the amount varying by category of beneficiary, including the elderly, disabled, children and adults who gained coverage under the Affordable Care Act’s Medicaid expansion, and other adults.  Payments to states would increase with medical inflation (CPI-M), rather than the current financing system, in which the federal government covers a percentage of all health care expenses incurred by enrollees.

The new brief, in FAQ format, examines the possible implications of such a system for the low-income seniors and people with disabilities on Medicare. They include the potential that states, facing fiscal pressure, could consider scaling back or eliminating optional services, such as dental care, vision care, and home and community-based services (HCBS); reduce provider payment rates; and restrict Medicaid eligibility for populations that they are not required to cover. The brief also looks at how the impact of a per capita cap or block grant could vary across states. It includes state-level data on the number of Medicare beneficiaries with Medicaid and other facts and figures.

News Release

Who Are the 7 Million Nonelderly Adults with Disabilities in Medicaid and What Would the House GOP Bill to Restructure Medicaid Financing and Repeal the Affordable Care Act Mean for Them?

Published: Mar 16, 2017

A new brief from the Kaiser Family Foundation explains the role that Medicaid plays for nearly 7 million nonelderly adults with disabilities in the U.S. and explores what the American Health Care Act could mean for their health care and coverage.

Medicaid covers more than three in 10 nonelderly adults with disabilities, including people with physical disabilities, such as cerebral palsy, multiple sclerosis, and traumatic brain or spinal cord injuries; intellectual or developmental disabilities such as Down syndrome and autism; and mental illness. Over half who are enrolled in Medicaid live below the federal poverty level. They are four times as likely to receive nursing or other health care at home, and more than 1.5 times as likely to have 10 or more health care visits in a year compared to those with private insurance.

Through Medicaid, nonelderly adults with disabilities have access to regular preventive care as well as medical care for illnesses and chronic conditions.  States must provide certain minimum services for adults, such as inpatient and outpatient hospital, physician, lab and x-ray, and nursing home services.  States also can choose to provide a broad range of optional services such as prescription drugs, physical therapy, private duty nursing, personal care, rehabilitative services, and case management.

The changes to Medicaid in the House GOP bill – notably the end of enhanced funding for the ACA Medicaid expansion and the fundamental change in program financing to a per capita cap – carry significant implications for this population. For those who have gained Medicaid eligibility through the expansion, loss of the enhanced match could curtail their prospects for keeping that coverage. And while per capita cap financing could come with increased flexibility for states in subsequent legislation, the associated federal funding reductions over time may lead states to consider cuts in Medicaid eligibility, benefits, and provider reimbursement. Nonelderly adults with disabilities could be particularly affected by such cuts, as many rely on Medicaid coverage pathways and services that are offered at state option and have higher spending, due to their greater need for acute and long-term care services.