KFF designs, conducts and analyzes original public opinion and survey research on Americans’ attitudes, knowledge, and experiences with the health care system to help amplify the public’s voice in major national debates.
Medicaid Fills Coverage Gaps in Rural Areas, Where Residents Are More Likely Than in Urban Areas to Be Low Income, Have a Disability, Be Unemployed or Lack Private Health Insurance
A new brief from the Kaiser Family Foundation examines the role of Medicaid in rural America. The 52 million children and nonelderly adults living in the most rural areas of the U.S. are more likely to be low income, more likely to have a disability and less likely to be employed or to have private insurance coverage compared to residents of urban and other areas. Individuals in rural areas also face significant barriers to accessing care, including provider shortages, recent closures of rural hospitals, and long travel distances to providers.
The brief explains that Medicaid plays a central role in helping to fill the gaps in private coverage in rural America, covering nearly one in four (24%) nonelderly individuals in rural areas. In many states, the share of the nonelderly population covered by Medicaid is higher in rural areas than in urban or other areas, and these differences are large in several states — including California, Hawaii, Kentucky, Arizona, Arkansas and Florida.
The brief also highlights the role of the Affordable Care Act’s (ACA) Medicaid expansion in driving recent coverage gains in rural areas. Between 2013 and 2015, rural areas that expanded Medicaid had larger Medicaid coverage gains (from 21% to 26% with Medicaid) compared to rural areas in non-expansion states (from 20% to 21%). Individuals in rural areas within non-expansion states were nearly twice as likely to be uninsured as those in expansion states (15% vs. 9%) in 2015. Given the large role of Medicaid in rural areas, reductions in federal Medicaid spending – either through repeal of the ACA, restructuring of Medicaid’s financing or both – could disproportionately affect people in rural communities.
The brief includes state-level data as well as a link to a county-based map highlighting rural areas of the country.
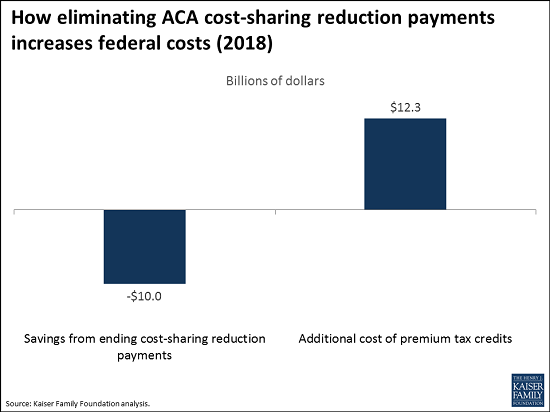
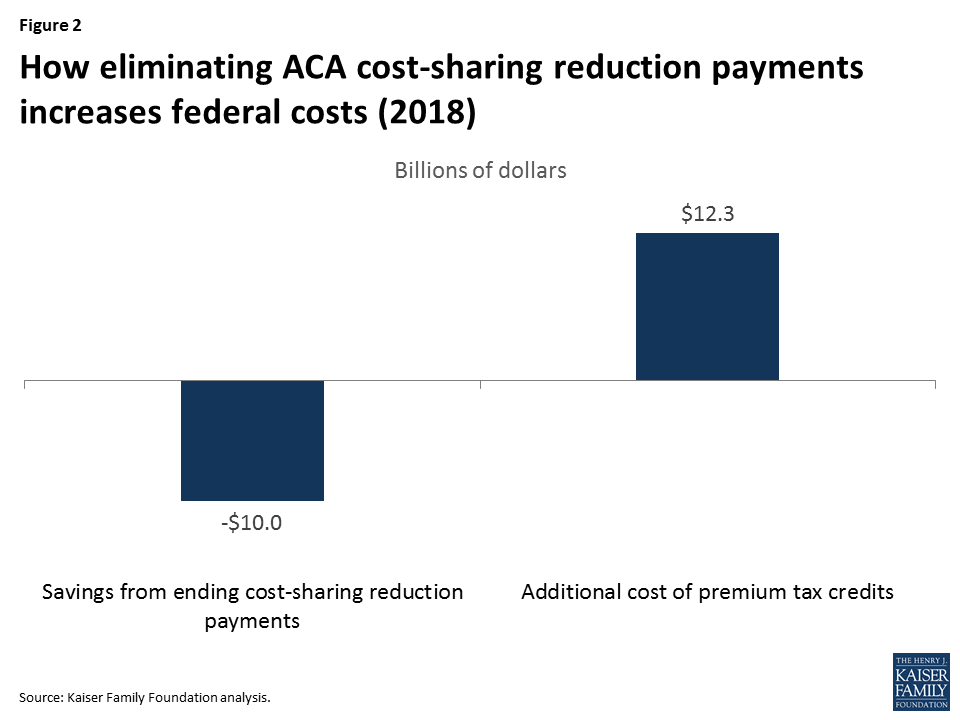
Ceasing payments for the Affordable Care Act’s (ACA) cost-sharing reduction program could save $10 billion, but cost an additional $12.3 billion in premium tax credits – an estimated net increase of $2.3 billion, or 23 percent, in federal spending on marketplace subsidies – in 2018, if insurers continue to participate in ACA marketplaces, according to a new analysis from the Kaiser Family Foundation.
The cost-sharing subsidies, established to reduce out-of-pocket costs for ACA marketplace enrollees with lower incomes, are being challenged in a lawsuit from the U.S. House. With the lawsuit temporarily suspended, the Trump Administration and Congress are in a position to determine whether to continue the payments, which go to insurers to reimburse their costs for providing the cost-sharing reductions.
The Foundation’s new analysis examines potential financial implications if the government stops cost-sharing reduction payments to insurers.
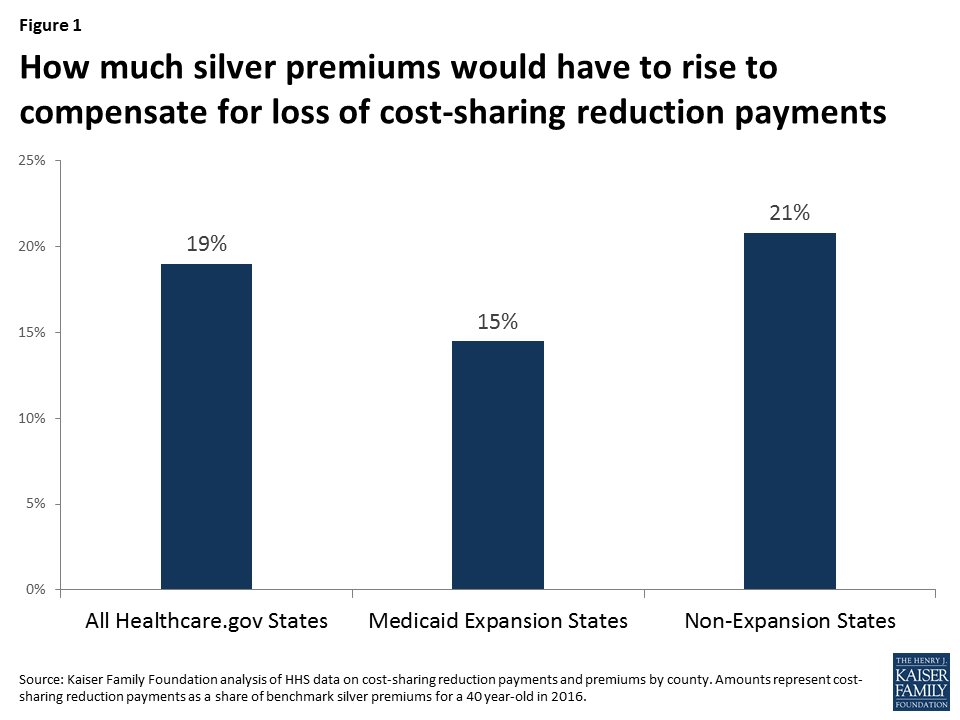
Without the payments, the analysis finds, the average ACA marketplace premium for silver plans would need to rise by 19 percent in 2018 for insurers to offset the lack of funding. Estimated premium changes vary for the 38 states that used healthcare.gov in 2016, ranging from 9 percent in North Dakota to 27 percent in Mississippi.
Changes to silver plan premiums in ACA marketplaces would affect how much the government owes to eligible enrollees in tax credits. Meant to reduce monthly insurance costs for people with lower incomes (from 100% to 400% of the poverty level), ACA premium tax credits are tied to the premium for the second-lowest cost silver plan in each geographic area.
According to the analysis, the government would owe an estimated additional $12.3 billion in tax credits in 2018, if cost-sharing reduction payments end and if insurers choose to continue offering plans in ACA marketplaces. The government would save $10 billion from stopping the payments, resulting in a net increase in federal costs of $2.3 billion. Extrapolating to the 10-year budget window (2018-2027) using the Congressional Budget Office’s projections for cost-sharing reduction payments, the net increase in federal costs would be $31 billion.
Controversy has emerged recently over federal payments to insurers under the Affordable Care Act (ACA) related to cost-sharing reductions for low-income enrollees in the ACA’s marketplaces.
The ACA requires insurers to offer plans with reduced patient cost-sharing (e.g., deductibles and copays) to marketplace enrollees with incomes 100-250% of the poverty level. The reduced cost-sharing is only available in silver-level plans, and the premiums are the same as standard silver plans.
To compensate for the added cost to insurers of the reduced cost-sharing, the federal governments makes payments directly to insurance companies. The Congressional Budget Office (CBO) estimates the cost of these payments at $7 billion in fiscal year 2017, rising to $10 billion in 2018 and $16 billion by 2027.
The U.S. House of Representatives sued the Secretary of the U.S. Department of Health and Human Services under the Obama Administration, challenging the legality of making the cost-sharing reduction (CSR) payments without an explicit appropriation. A district court judge has ruled in favor of the House, but the ruling was appealed by the Secretary and the payments were permitted to continue pending the appeal. The case is currently in abeyance, with status reports required every three months, starting May 22, 2017.
If the CSR payments end – either through a court order or through a unilateral decision by the Trump Administration, assuming the payments are not explicitly authorized in an appropriation by Congress – insurers would face significant revenue shortfalls this year and next.
Many insurers might react to the end of subsidy payments by exiting the ACA marketplaces. If insurers choose to remain in the marketplaces, they would need to raise premiums to offset the loss of the payments.
We have previously estimated that insurers would need to raise silver premiums by about 19% on average to compensate for the loss of CSR payments. Our assumption is that insurers would only increase silver premiums (if allowed to do so by regulators), since those are the only plans where cost-sharing reductions are available. The premium increases would be higher in states that have not expanded Medicaid (and lower in states that have), since there are a large number of marketplace enrollees in those states with incomes 100-138% of poverty who qualify for the largest cost-sharing reductions.
There would be a significant amount of uncertainty for insurers in setting premiums to offset the cost of cost-sharing reductions. For example, they would need to anticipate what share of enrollees in silver plans would be receiving reduced cost-sharing and at what level. Under a worst case scenario – where only people eligible for sharing reductions enrolled in silver plans – the required premium increase would be higher than 19%, and many insurers might request bigger rate hikes.
Figure 1: How much silver premiums would have to rise to compensate for loss of cost-sharing reduction payments
While the federal government would save money by not making CSR payments, it would face increased costs for tax credits that subsidize premiums for marketplace enrollees with incomes 100-400% of the poverty level.
The ACA’s premium tax credits are based on the premium for a benchmark plan in each area: the second-lowest-cost silver plan in the marketplace. The tax credit is calculated as the difference between the premium for that benchmark plan and a premium cap calculated as a percent of the enrollee’s household income (ranging from 2.04% at 100% of the poverty level to 9.69% at 400% of the poverty in 2017).
Any systematic increase in premiums for silver marketplace plans (including the benchmark plan) would increase the size of premium tax credits. The increased tax credits would completely cover the increased premium for subsidized enrollees covered through the benchmark plan and cushion the effect for enrollees signed up for more expensive silver plans. Enrollees who apply their tax credits to other tiers of plans (i.e., bronze, gold, and platinum) would also receive increased premium tax credits even though they do not qualify for reduced cost-sharing and the underlying premiums in their plans might not increase at all.
We estimate that the increased cost to the federal government of higher premium tax credits would actually be 23% more than the savings from eliminating cost-sharing reduction payments. For fiscal year 2018, that would result in a net increase in federal costs of $2.3 billion. Extrapolating to the 10-year budget window (2018-2027) using CBO’s projection of CSR payments, the federal government would end up spending $31 billion more if the payments end.
This assumes that insurers would be willing to stay in the market if CSR payments are eliminated.
Figure 2: How eliminating ACA cost-sharing reduction payments increases federal costs (2018)
Methods
We previously estimated that the increase in silver premiums necessary to offset the elimination of CSR payments would be 19%.
To estimate the average increase in premium tax credits per enrollee, we applied that premium increase to the average premium for the second-lowest-cost silver plan in 2017. The Department of Health and Human Services reports that the average monthly premium for the lowest-cost silver plan in 2017 is $433. Our analysis of premium data shows that the second-lowest-cost silver plan has a premium 4% higher than average than the lowest-cost silver plan.
We applied our estimate of the average premium tax credit increase to the estimated total number of people receiving tax credits in 2017. This is based on the 10.1 million people who selected a plan during open enrollment and qualified for a tax credit, reduced by about 17% to reflect the difference between reported plan selections in 2016 and effectuated enrollment in June of 2016.
We believe the resulting 23% increase in federal costs is an underestimate. To the extent some people not receiving cost-sharing reductions migrate out of silver plans, the required premium increase to offset the loss of CSR payments would be higher. Selective exits by insurers (e.g., among those offering lower cost plans) could also drive benchmark premiums higher. In addition, higher silver premiums would somewhat increase the number of people receiving tax credits because currently some younger/higher-income people with incomes under 400% of the poverty level receive a tax credit of zero because their premium cap is lower than the premium for the second-lowest-cost silver plan. We have not accounted for any of these factors.
Our analysis produces results similar to recent estimates for California by Covered California and a January 2016 analysis from the Urban Institute.
The Medicaid program covers more than 74 million Americans, or 1 in 5, including low-income pregnant women, children, and parents, seniors, people with disabilities, and, in Medicaid expansion states, nearly all low-income nonelderly adults. Most states today rely heavily on risk-based managed care organizations to serve Medicaid beneficiaries. This Data Note discusses the current role of managed care in Medicaid and addresses differences in managed care growth between states that expanded Medicaid to low-income adults under the Affordable Care Act (ACA) and states that did not expand Medicaid.
Risk-based managed care is the dominant delivery system in Medicaid.
Going back as far as the 1970s, some state Medicaid programs, as an alternative to paying providers on a fee-for-service basis, contracted on a risk basis with private managed care organizations (MCOs) to serve selected beneficiary populations – primarily, pregnant women, children, and families. Over time, more states have taken up MCO contracting and states have also expanded their MCO programs to include both wider geographic areas and beneficiaries with more complex needs. Today, 39 states contract with MCOs and risk-based managed care is the dominant delivery system in Medicaid. As of July 2016, in 28 states – including 8 of the 10 states with the most Medicaid beneficiaries (California, New York, Texas, Florida, Ohio, Pennsylvania, Michigan, and Washington) – at least 75% of all Medicaid beneficiaries were enrolled in MCOs. In 10 of these 28 states, more than 90% of beneficiaries were enrolled in MCOs (Figure 1). In FY 2016, 43% of Medicaid spending was attributable to payments to MCOs, up from 28% in FY 2013.1
Figure 1: A large share of all Medicaid beneficiaries are enrolled in risk-based MCOs.
In 25 Medicaid expansion states, at least 80% of all newly eligible adults are in Managed care plans.
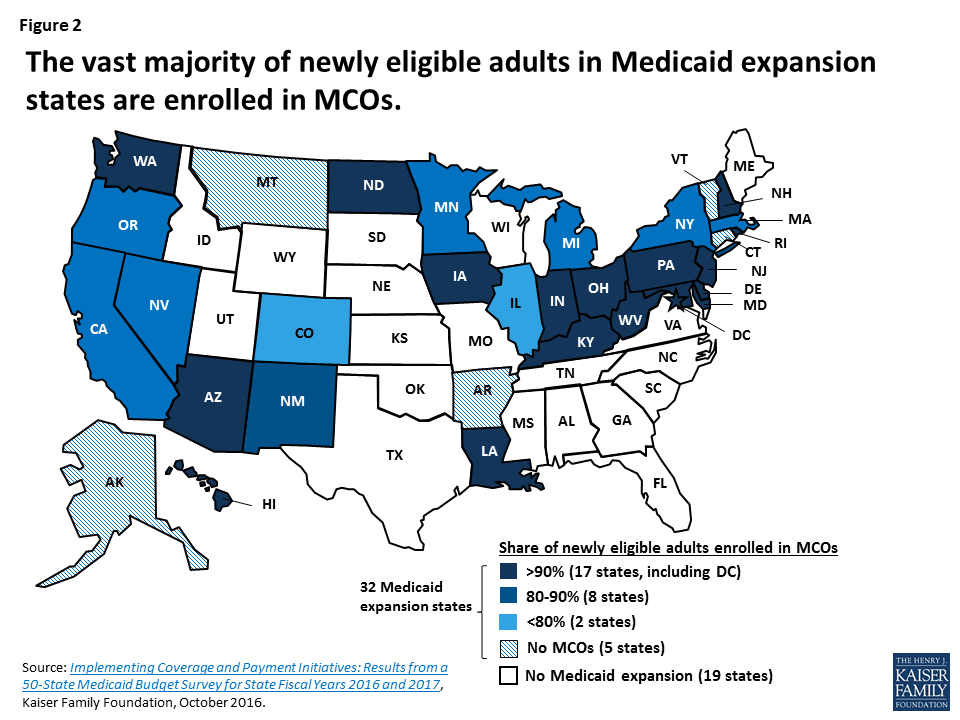
Thirty-two states (including the District of Columbia) have expanded Medicaid to low-income, nonelderly adults under the Affordable Care Act (ACA), and in these states, 11 million adults are newly eligible for Medicaid as a result. Most Medicaid expansion states (27) contract with MCOs to serve a large share of Medicaid beneficiaries. Expansion states account for 21 of the 28 states where at least 75% of beneficiaries are in MCOs, and seven of the 10 states with penetration rates above 90%. In nearly all 27 Medicaid expansion states with risk contracts, the share of newly eligible adults enrolled in MCOs is at least as high as the overall share of beneficiaries enrolled in MCOs. In 25 of these states, at least 80% of newly eligible adults are enrolled in MCOs, including 17 states where over 90% of expansion adults are enrolled in plans (Figure 2).
Figure 2: The vast majority of newly eligible adults in Medicaid expansion states are enrolled in MCOs.
Most MCO enrollment growth is occurring in Medicaid expansion states.
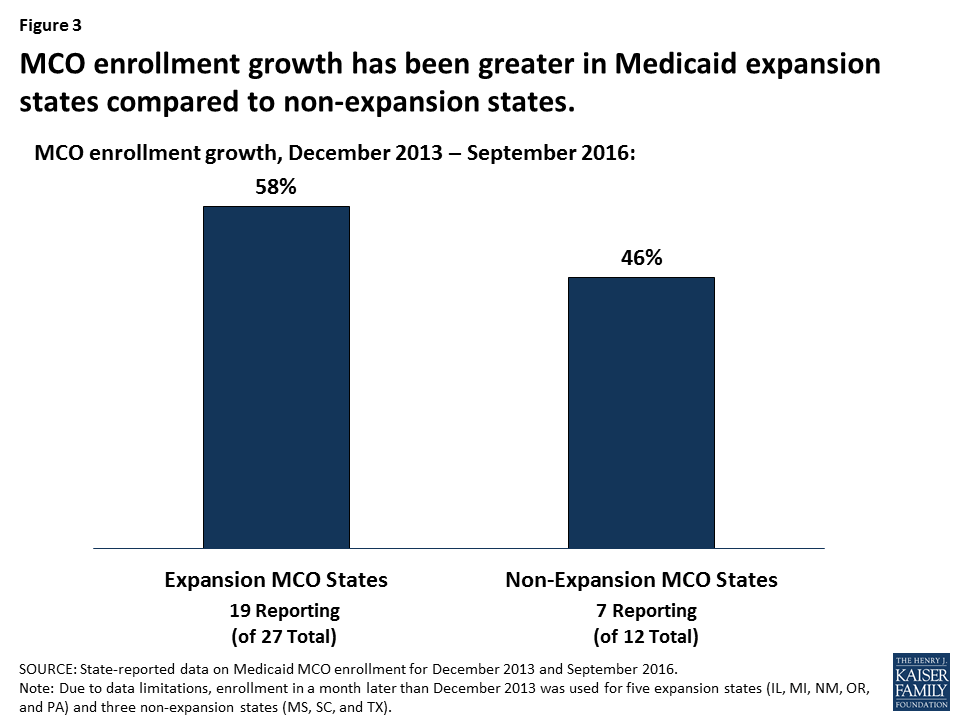
The 39 states operating Medicaid MCO programs include 27 expansion states and 12 non-expansion states. Medicaid MCO enrollment continues to grow in both groups of states. Data comparing MCO enrollment in December 2013, the month before the ACA Medicaid expansion took effect, and September 2016, show substantial managed care increases over this period, with the lion’s share of the increase in MCO enrollment occurring in expansion states.2 In the 19 expansion states with MCOs that reported both pre- and post-ACA data, MCO enrollment rose from 22.8 million to 36.1 million – an increase of 13.3 million beneficiaries, or 58% (Figure 3).3 The median increase in MCO enrollment in these states was 47%. In comparison, in the seven non-expansion states with MCOs that reported pre- and post-ACA data, MCO enrollment grew from 7.4 million to 10.8 million – an increase of 3.4 million beneficiaries, or 46%, and the median increase was 31%.4
Figure 3: MCO enrollment growth has been greater in Medicaid expansion states compared to non-expansion states.
The larger increases in MCO enrollment in the Medicaid expansion states reflect a number of factors, including: the greater number of expansion versus non-expansion states with MCOs; the much larger number of Medicaid beneficiaries residing in the expansion/MCO versus non-expansion/MCO states (43.1 million versus 18.1 million in December 2016); and the expansion states’ heavy reliance on MCOs to serve newly eligible adults as well as other Medicaid beneficiaries. Expansion states account for 15 of the 21 states where more than 80% of Medicaid beneficiaries are in MCOs.
Conclusion
States are continuing to expand their use of comprehensive risk-based managed care. In the Kaiser Family Foundation’s most recent 50-state Medicaid budget survey, 11 of the 39 states with MCOs indicated that they took specific action in FY 2017 to increase the number of Medicaid enrollees in MCOs through geographic expansions, voluntary or mandatory enrollment of new groups, or mandatory enrollment of groups formerly enrolled on a voluntary basis. As both Medicaid expansion and non-expansion states broaden the size and scope of their MCO programs, a large and growing share of beneficiaries, increasingly including people with disabilities, poor seniors, and others with complex health care needs, are receiving their care in private managed care plans. The growing role of managed care in Medicaid has important implications for beneficiary access to care, in particular, because it shifts the onus of finding providers who accept Medicaid patients from the individual to MCOs, which are contractually responsible for establishing adequate provider networks to serve Medicaid enrollees.
Urban Institute estimates based on data from CMS (Form 64), as of April 2017. ↩︎
In several states for which December 2013 data were not available, data from a later month were used to calculate MCO enrollment increases. See Endnotes 2 and 3 for detail. ↩︎
The 19 states are AZ, CA, HI, IL (August 2014), IN, KY, LA, MA, MD, MI (August 2014), MN, NV, NM (March 2015), NY, OH, OR (January 2014), PA (August 2014), WA, and WV. ↩︎
The seven states are FL, MS (January 2014), MO, SC (September 2014), TN, TX (June 2014), and WI. ↩︎
A new Kaiser Family Foundation analysis of key insurer financial indicators suggests that the individual insurance market showed signs of stabilizing in 2016, although profitability remained below the level of performance prior to the opening of the Affordable Care Act’s insurance marketplaces.
The new analysis tracks insurer financial performance in the individual market through two key indicators: average medical loss ratios (the share of health premiums paid out as claims) and average gross margins per member per month (the average amount by which premium income exceeds claims costs per enrollee in a given month).
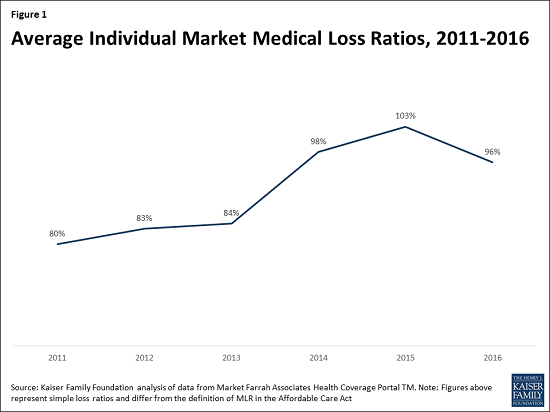
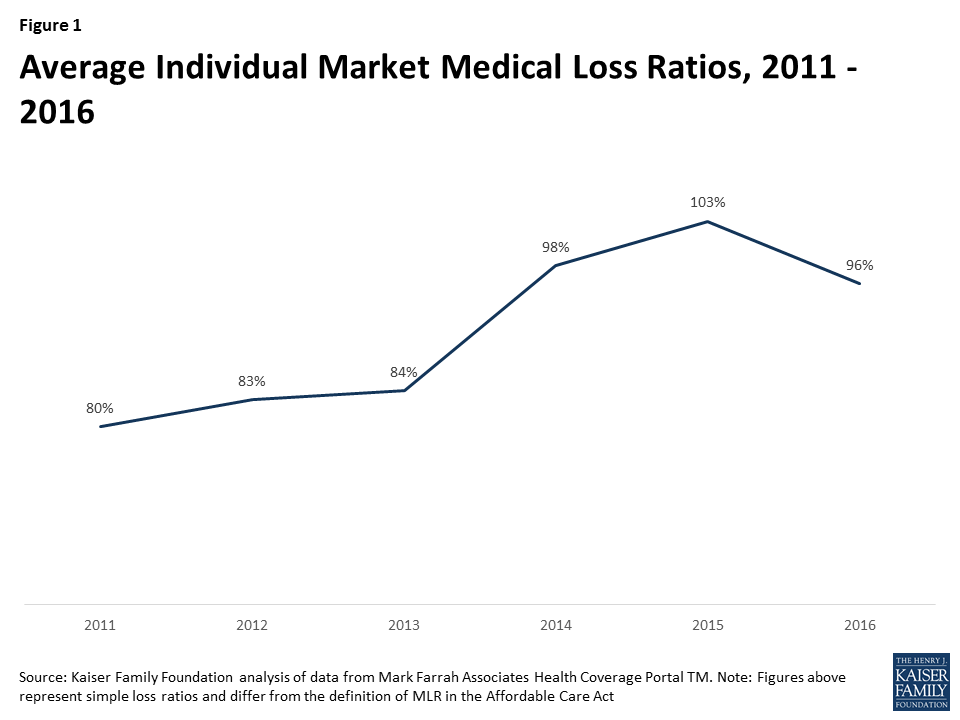
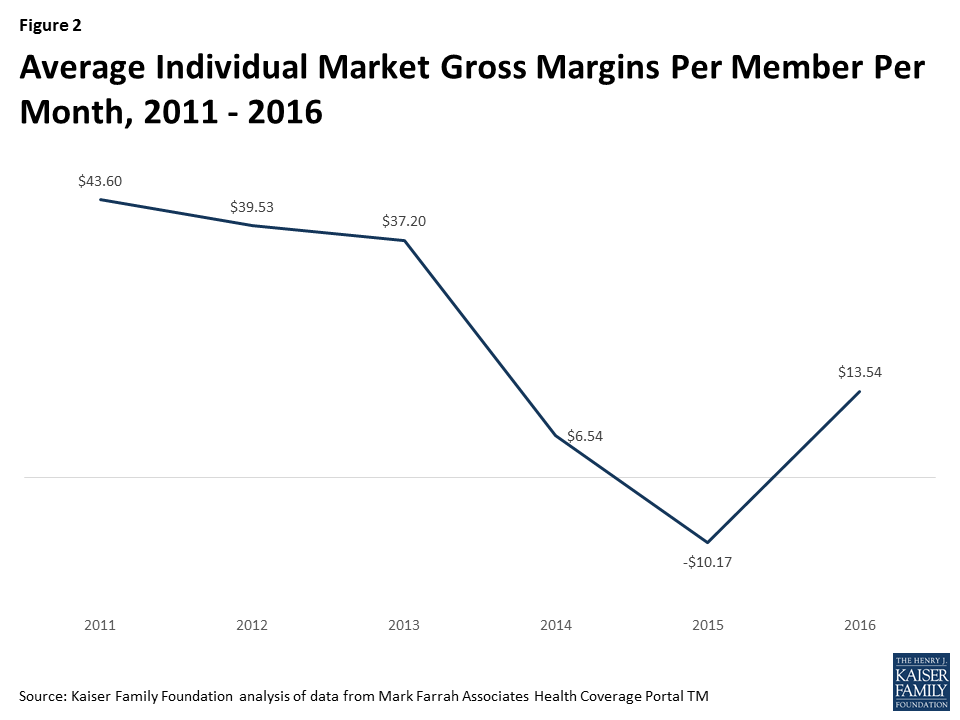
Although insurers generally have remained profitable overall since the implementation of the ACA, these measures indicate that individual market insurer financial performance worsened in 2014 and 2015, with the transition to the marketplaces and adjustment to other changes under the health law. It is unlikely insurers can be profitable when medical loss ratios exceed 85-90 percent; in 2015, the average individual market medical loss ratio grew to 103 percent. Average gross margins per member per month fell from $37.20 in 2013 to $6.54 in 2014, and dropped further to -$10.17 in 2015.
Insurers began to see improvement in 2016, the analysis finds, as they were able to access more meaningful data to set premium rates in the third year of ACA marketplaces. In the individual market that year, the average medical loss ratio was 96 percent, and the average gross margins per member per month was $13.54.
For insurers in the individual market to return to pre-ACA margins, financial performance would need to continue improving. With large premium increases and relatively steady enrollment in 2017 ACA marketplace plans, insurers may see substantial movement in that direction this year if claims costs do not rise dramatically, according to the analysis.
Insurer Financial Performance in the Early Years of the Affordable Care Act is available on kff.org.
Although insurers have generally remained profitable overall since implementation of the Affordable Care Act, many companies participating in the individual market – where most of the major market reforms took place in 2014 – experienced substantial losses in this market in the early years of reform. The individual market is where just 7% of the U.S. population gets their insurance (and thus also represents a small share of most health insurers’ business), but the stability of the market and willingness of insurers to continue to participate is essential to the ACA’s success. Going into 2017, there were a number of high-profile exits and premium increases, raising concerns over the stability of the individual market. Although some local markets are likely fragile, the Congressional Budget Office expects the ACA individual market to remain stable across most part of the country.
This data note looks at trends in insurer financial performance in the individual market over the past few years, finding that the market is showing signs of stabilizing. The success of the ACA is dependent on the participation of private insurers in the marketplaces, who will need to be profitable over the long-term to remain in the market.
We use financial data reported by insurance companies to the National Association of Insurance Commissioners and compiled by Mark Farrah Associates to look at the average medical loss ratio (the share of health premiums paid out as claims) from 2011 through 2016 in the individual insurance market. The figures include coverage purchased through the ACA’s marketplaces and ACA-compliant plans purchased directly from insurers outside the marketplaces (which are part of the same risk pool), as well as individual plans originally purchased before the ACA went into effect. When medical loss ratios (MLRs) are higher, insurers are paying out more of their premium income on claims and – considering the relatively high cost of administering individual market plans – it is unlikely insurers can be profitable when MLRs exceed 85 – 90%. The loss ratios shown in this data note differ from the definition of MLR in the ACA, which makes some adjustments for quality improvement and taxes, and also do not account for reinsurance, risk corridors, or risk adjustment payments. Reinsurance payments, in particular, helped offset some losses insurers would have otherwise experienced. However, the ACA’s reinsurance program was temporary, ending in 2016, so loss ratio calculations excluding reinsurance payments are a good indicator of financial stability going forward. We also look at average monthly margins per enrollee over the same period.
In 2014, when the exchanges opened and the bulk of the ACA’s market reforms took effect, individual market insurer financial performance worsened, with individual market MLRs averaging 98% compared to 84% a year prior. The individual market underwent a number of changes in 2014, and insurers had very little information to work with in setting their premiums. On average, insurers set premiums too low to cover their costs in the individual market. This mispricing is likely due to a combination of fewer young or healthy enrollees than initially anticipated, which was augmented by the late regulatory decision to permit some non-compliant plans to be retained, as well as some competitors apparently underpricing in an attempt to be competitive (low-cost silver premiums for 2014 came in substantially lower than CBO projections).
In 2015, as claims growth continued to outpace premiums, individual market MLRs increased again, to an average of 103%. On the exchange markets, premiums remained relatively flat from 2014 to 2015, likely because insurers had not yet gathered enough data on their enrollees’ health care utilization to be able to set premiums more appropriately, and carriers were competing to be the low-cost option. Individual market insurers submitted their 2015 premiums to state and federal regulators in spring of 2014, shortly after the first ACA exchange open enrollment had ended.
Figure 1: Average Individual Market Medical Loss Ratios, 2011 – 2016
It was not until last year that individual market loss ratios began to fall as insurers raised premiums faster than the rate of claims cost growth. 2016 was the first year that insurers had any meaningful data with which to work, though they were still setting premiums with only a partial year of experience (as 2014 open enrollment extended well into the year and insurers had to submit their 2016 premium in spring of 2015). Although insurers’ individual market performance improved on average in 2016, loss ratios remained relatively high. On average, MLRs fell by 7 percentage points from 2015 to 2016 to 96%, but remained higher than 2013 levels and would need to fall further for the industry as a whole to be profitable in this market. (A recent S&P analysis looking at a subset of Blue Cross Blue Shield plans showed a similar pattern.)
Another way to look at individual market financial performance is to examine average gross margins per member per month, or the average amount by which premium income exceeds claims costs per enrollee in a given month. Gross margins are an indicator of performance, but positive margins do not necessarily translate into profitability since they do not account for administrative expenses. Although medical loss ratios are higher now than they were pre-ACA, the total amount of premium income is also higher as many more people are enrolled in this market than before the exchanges opened. Again, we see a similar pattern, where monthly insurer margins in this market worsened in 2014 (dropping from about $37 to $7 per enrollee) and again in 2015 (to a loss of $10 per enrollee), but began to improve in 2016 (increasing by about $24 to $14 per enrollee). However, insurers would need to see a similar rate of improvement in 2017 to reach pre-exchange (2013) margins.
Figure 2: Average Individual Market Gross Margins Per Member Per Month, 2011 – 2016
What does this mean for the exchanges and broader individual market this year and next? On average, we do know that insurers participating in ACA marketplaces raised premiums substantially from 2016 to 2017, with benchmark premiums rising an average of 22%. Marketplace enrollment has held mostly steady, with open enrollment signups totaling 12.2 million for 2017, about half a million below 2016 levels. Assuming claims expenses do not rise unexpectedly, insures may significantly improve their financial performance in this market in 2017.
Though this can be taken as a sign that the market is stabilizing, health insurers still face tremendous uncertainty going forward. Mixed signals from the Administration and Congress over the direction and timing of ACA repeal efforts, and a lack of clarity on individual mandate enforcement and payments for cost-sharing subsidies, could make insurers hesitant to continue to participate, even if the market is showing signs of improving otherwise.
Methods
We analyzed insurer-reported financial data from Health Coverage Portal TM, a market database maintained by Mark Farrah Associates, which includes information from the National Association of Insurance Commissioners. All figures in this data note are for the individual health insurance market as a whole, which includes major medical insurance plans sold both on and off exchange.
To calculate the weighted average loss ratio across the individual market, we divided the market-wide sum of total incurred claims by the sum of all health premiums earned across all 50 states plus DC (the dataset analyzed in this report does not include California HMOs, which report separately to California’s Department of Managed Health Care). Medical loss ratios in this analysis are simple loss ratios and do not adjust for quality improvement expenses, taxes, or risk program payments. Gross margins were calculated by subtracting the sum of total incurred claims from the sum of health premiums earned and dividing by the total number of member months (average monthly enrollment) in the individual insurance market.
Annual Rate (per 100,000) of New Diagnosis for Individuals of All Ages(2015)
Medicaid Enrollees Living with HIV(2011)
Annual Death Rate (per 100,000)of Adults and Adolescents with Diagnosed HIV(2013)
Medicaid Coverage of HIV Treatments
HIV Drug Treatment(2017)
Lab Services(2017)
Routine HIVTesting(2013)*
Expanded Medicaid/Republican Governor
Arizona
14,726
10.5
2,600
3.9
Yes
Yes
Yes
Arkansas
5,174
8.7
900
4.4
Yes
Yes
No
Illinois
34,843
11.5
8,700
6.3
Yes
Yes
Yes
Indiana
10,279
9.6
2,300
3.4
Yes
Yes
No
Iowa
2,355
4.0
600
1.6
Yes
Yes
No
Kentucky
6,511
7.6
1,200
3.2
Yes
Yes
Yes
Maryland
32,002
22.4
8,300
6.1
Yes
Yes
No
Massachusetts
19,290
8.9
7,500
4.0
Yes
Yes
Yes
Michigan
14,944
7.3
5,500
2.6
Yes
Yes
No
Nevada
8,405
16.8
900
5.7
Yes
Yes
Yes
New Hampshire
1,240
1.7
300
1.2
Yes
Yes
Yes
New Jersey
35,682
13.3
7,800
11.1
Yes
Yes
Yes
New Mexico
3,096
6.5
500
2.0
Yes
Yes
Yes
North Dakota
306
2.9
100
0.6
Yes
Yes
Yes
Ohio
19,911
8.0
3,800
3.1
Yes
Yes
Yes
Vermont
662
1.9
300
2.1
Yes
Yes
Yes
State Average
13,089
8.9
3,206
3.8
16/16
16/16
11/16
Expanded Medicaid/Democratic or Independent Governor
Alaska
637
3.3
200
3.4
Yes
Yes
Yes
California
119,589
12.1
25,300
5.1
Yes
Yes
Yes
Colorado
11,199
6.9
800
2.4
Yes
Yes
Yes
Connecticut
10,236
7.6
4,700
6.3
Yes
Yes
Yes
Delaware
3,213
11.5
1,600
8.2
Yes
Yes
Yes
District of Columbia
15,200
57.0
5,800
39.7
Yes
Yes
Yes
Hawaii
2,741
8.0
600
0.9
Yes
Yes
Yes
Louisiana
18,950
24.2
5,300
12.4
Yes
Yes
Yes
Minnesota
7,549
5.2
2,200
1.8
Yes
Yes
Yes
Montana
548
1.8
100
1.1
Yes
Yes
Yes
New York
130,753
15.8
59,900
14.0
Yes
Yes
Yes
Oregon
6,275
5.2
1,400
3.0
Yes
Yes
Yes
Pennsylvania
33,593
9.2
3,800
6.0
Yes
Yes
Yes
Rhode Island
2,264
6.1
600
2.4
Yes
Yes
Yes
Washington
12,030
6.3
2,400
3.0
Yes
Yes
Yes
West Virginia
1,896
4.0
500
2.0
Yes
Yes
Yes
State Average
23,542
11.5
7200
7.0
16/16
16/16
16/16
Did Not Expand Medicaid/Republican Governor
Alabama
12,439
9.9
2,600
7.2
Yes
Yes
No
Florida
103,696
24.0
25,800
13.6
Yes
Yes
No
Georgia
46,870
23.4
8,200
5.6
Yes
Yes
No
Idaho
1,031
2.4
200
0.9
Yes
Yes
Yes
Kansas
2,884
5.1
600
2.6
Yes
Yes
Yes
Maine
1,454
3.5
500
1.1
Yes
Yes
No
Mississippi
8,983
17.0
2,400
8.1
Yes
Yes
No
Missouri
11,560
7.7
3,100
3.9
Yes
Yes
Yes
Nebraska
2,014
4.3
400
1.7
Yes
Yes
No
Oklahoma
5,605
8.2
1,200
3.8
Yes
Yes
Yes
South Carolina
15,942
14.2
2,800
8.1
Yes
Yes
No
South Dakota
492
2.9
100
0.5
Yes
Yes
No
Tennessee
16,163
10.9
3,700
6.8
Yes
Yes
Yes
Texas
77,896
16.3
11,100
6.2
Yes
Yes
Yes
Utah
2,618
3.9
300
0.9
Yes
Yes
No
Wisconsin
5,952
4.0
2,100
1.9
Yes
Yes
Yes
Wyoming
269
2.6
100
0.7
Yes
Yes
Yes
State Average
18,580
9.4
3,835
4.3
17/17
17/17
8/17
Did Not Expand Medicaid/Democratic Governor
North Carolina
28,897
13.4
7,300
6.7
Yes
Yes
Yes
Virginia
21,740
11.4
3,200
5.5
Yes
Yes
No
State Average
25,319
12.4
5,250
6.1
2/2
2/2
1/2
*All states are required to cover medically necessary HIV testing; some states have expanded coverage to include routine HIV testing.Data table prepared by Kaiser Family Foundation.
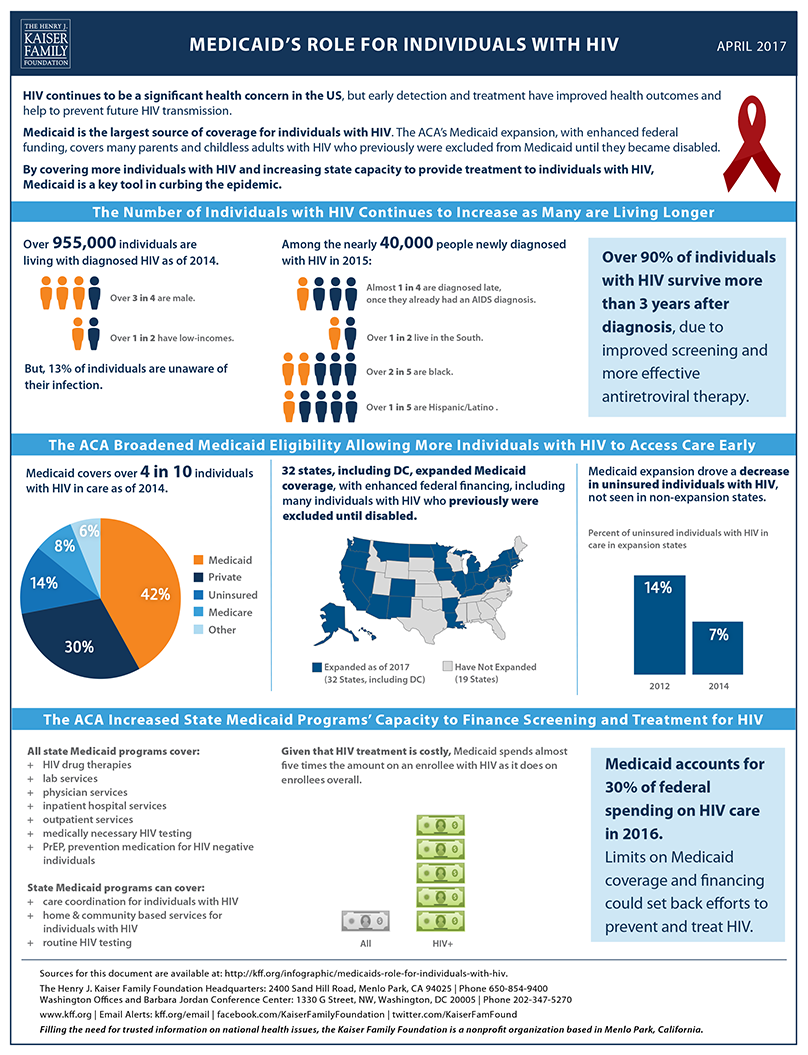
Medicaid’s Role for Individuals with HIV Source List
In this April 2017 post, Larry Levitt discusses the current status of the Affordable Care Act’s health insurance marketplaces, and explains how the Trump administration’s choices — including whether to continue cost-sharing reduction payments to insurers — could influence stability of the marketplaces going forward. The post is now available at The JAMA Forum.
Other contributions to The JAMA Forum are also available.
As Congress considers legislation that would change federal rules governing workplace wellness programs that gather information about workers’ health and risk status, a new Kaiser Family Foundation brief explains how workplace wellness programs could be affected and possible implications for workers with sensitive health conditions.
Among the findings:
Seven in 10 (71%) large employers providing health benefits collect personal health information through wellness programs, according to the annual Kaiser Family Foundation/HRET Employer Health Benefits Survey.
The pending legislation would affect nearly all workplace wellness programs that ask for personal health information. Under the bill, in these programs, there would be no limit on penalties that could be applied to workers and their dependents who decline to provide sensitive personal health and genetic information.
An estimated 38.8 million adults with employer-sponsored insurance (29.8%) have one or more of seven stigmatized health conditions that could trigger privacy concerns, according to an analysis of the 2015 National Survey on Drug Use and Health. These conditions include a sexually transmitted disease, diabetes, a mental health disorder, HIV/AIDS, Hepatitis B or C, pregnancy, or an alcohol or substance use disorder.
Legislation pending in Congress, HR 1313, would substantially change federal rules governing workplace wellness programs. Today several federal laws apply to workplace wellness programs. The Affordable Care Act (ACA) sets standards for a certain type of wellness program, called health contingent programs, used by 8% of large firms (200 or more workers) that offered health benefits in 2016. Health contingent wellness programs vary health plan premiums or cost sharing based on whether a person achieves a biometric target, such as for blood pressure. The ACA limits penalties that can be applied under such programs. However, it does not address personal health information collection practices under health contingent wellness programs. Nor does it limit incentives or set standards for any other types of workplace wellness programs, except to require that programs must be offered to all similarly situated individuals.
Two other laws – the Americans with Disabilities Act (ADA) and the Genetic Information Nondiscrimination Act (GINA) – govern all workplace wellness programs that ask workers and their family members to disclose health information, including genetic information. Today, the vast majority (71%) of large firms have wellness programs that collect personal health information. The ADA and GINA prohibit employment discrimination based on health status or genetic information. As part of that protection, ADA prohibits medical examinations and inquiries that are not job related, and GINA prohibits requests for genetic information, though both laws make exceptions for voluntary wellness programs. Rules under ADA and GINA limit financial incentives to provide personal health information and submit to medical examinations. GINA also generally prohibits penalties for refusing to disclose genetic information, or health information about children, and both laws set other standards for the collection and use of personal health and genetic information by wellness programs.
Under HR 1313, any wellness program in compliance with ACA requirements would be deemed compliant with ADA and GINA wellness program standards. As a result, for the vast majority of workplace wellness programs today, there would be no limit on inducements that could be used to encourage workers and their family members to provide personal health information, including genetic information; and other ADA and GINA wellness standards would no longer apply to any workplace wellness programs.
This brief reviews findings from the 2016 Kaiser Family Foundation/HRET Employer Health Benefits Survey related to wellness programs and financial incentives. It also reviews findings from the 2015 National Survey on Drug Use and Health (NSDUH) related to the incidence of certain sensitive or potentially stigmatized health conditions among adults covered under employer-sponsored health plans.
Collection of Personal Health Information by Workplace Wellness Programs, 2016
Nearly all large firms (90%) that offer health benefits (“offering firms”) offer some type of wellness program, though the term “wellness program” encompasses a range of measures from health screening to more targeted health interventions. About half (47%) of all offering firms and 83% of large offering firms offered classes, coaching, or other activities to help employees stop smoking, lose weight, or adopt healthier lifestyles.
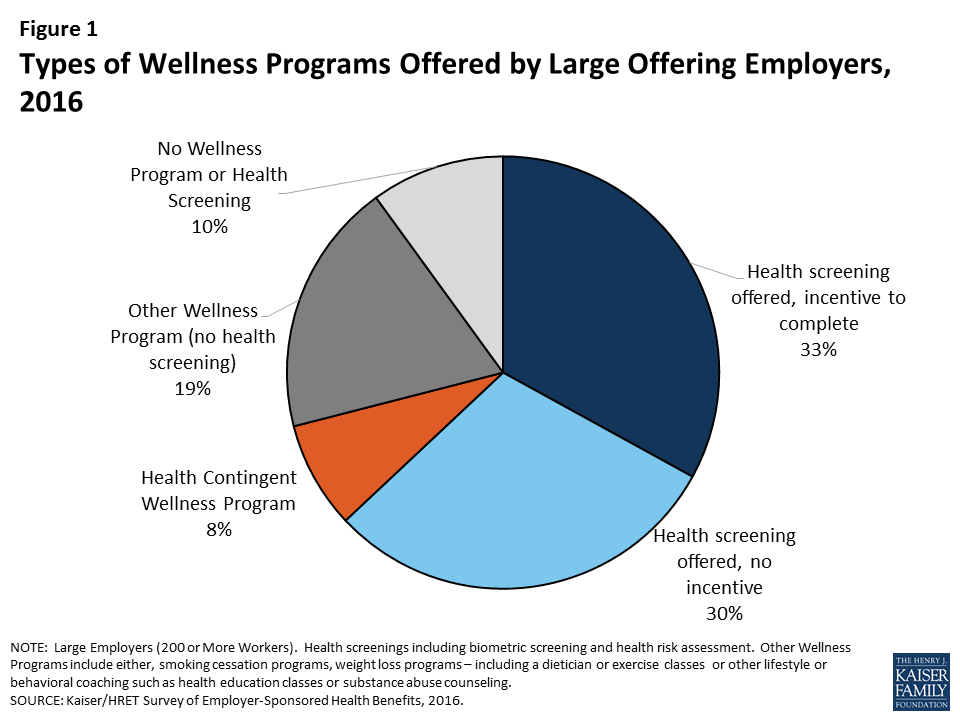
Health contingent wellness programs – Health contingent wellness programs are offered by 8% of large offering firms. (Figure 1) Such programs must meet ACA standards in order to vary participants’ health plan premiums and cost sharing based on meeting a biometric target such as for BMI or blood glucose levels.
Figure 1: Types of Wellness Programs Offered by Large Offering Employers, 2016
The ACA limits financial incentives under health contingent wellness programs to no more than 30% of the total health plan premium, though the Secretary has authority to raise this cap to 50%.1 For an average cost group health plan in 2016 ($6,435 for self only coverage, $18,142 for family coverage), the average maximum incentive would be $1,930/$5,442. Among health contingent wellness programs offered by large firms in 2016, 56% set the maximum incentive at greater than $500, 27% set the maximum incentive at greater than $1,000. Other standards also apply to health contingent programs under the ACA, including requirements to offer alternative standards or accommodations to people who do not meet biometric targets. The ACA does not address information collection practices of wellness programs. (Table 1)
For wellness programs that are not health contingent programs, the only requirement under the ACA is that programs must be offered to all similarly situated individuals, regardless of health status.2
Table 1: ACA Workplace Wellness Program Standards
Health Contingent Programs
Other Worksite Wellness Programs
Limits on Incentives
Participant premium (or cost sharing) can vary based on achievement of biometric target(s). The amount of reward or penalty cannot exceed 30% of cost of health plan (employer plus employee share).
No limits
Standards for Program Design
Must be reasonably designed, no scientific evidence of efficacy required
Must offer alternative way to earn reward/avoid penalty to participants who do not meet biometric target
Must not be overly burdensome or a subterfuge for discrimination
No standards
Eligibility
Program must be offered to all similarly situated individuals
Same
Standards for information collection
None
No standards
Confidentiality *
HIPAA privacy rules apply to programs offered through group health plans
Same
* The ACA did not address confidentiality. However, HIPAA privacy rules apply to information collected by workplace wellness programs that are offered in conjunction with group health plans. Employer-sponsored health plans are covered entities, subject to HIPAA, but not the employers that sponsor the plans.
Health screening wellness programs – Seven in ten large offering firms offer health screening tools to gather information about workers’ health and risk status (71% in 2016). Screening tools include health risk assessments (HRA) – questionnaires that ask workers to self-report on their health status, medical history, behaviors and attitudes – and biometric screenings – physical exams by a health professional to gather current health data, often including body mass index, blood pressure, blood cholesterol, and blood sugar levels. In 2016, 59% of large offering employers offered an HRA and 53% offered biometric screening. By definition, health contingent wellness programs include a health screening component, although 93% of large firm workplace wellness programs that offer health screening are not health contingent programs – that is, they do not also vary participants’ health plan premium or cost sharing based on the results of health screening. In 9% of large firm programs with screening, screening is the main component with no other offer of wellness activities included in the KFF/HRET survey.3
Incentives to complete wellness program health screening – In 2016, most (56%) large firms offering wellness screening tools offered incentives to complete them. Some incentives were nominal, such as gift cards or prizes. However, over half of firms with incentives for biometric screening (52%) and health risk assessment (51%), require employees that do not complete the screening pay higher premiums and/or cost sharing, compared to those that do.
Under the ADA and GINA, federal requirements apply to workplace wellness programs that collect workers’ health information and genetic information. Such information can only be collected through voluntary worksite wellness programs. Recent regulations issued by the Equal Employment Opportunity Commission (EEOC) re-defined “voluntary” under both laws to permit financial inducements as great as 30% of the cost of self-only health coverage – on average, $1,930 in 2016, or twice that amount if spouses can also participate. Recent GINA rules also require that individuals generally cannot be penalized for refusing to submit genetic information to a wellness program and prohibit incentives to disclose health information about employees’ children. The laws also set other standards for voluntary workplace wellness programs. (Table 2)
Table 2: ADA and GINA Standards for Workplace Wellness Programs that Request Personal Health or Genetic Information
ADA
GINA
Limits on Incentives
Only voluntary wellness programs can request a worker’s health information. Employers cannot fire or deny health benefits to workers who do not participate. Programs can offer incentives or penalties as high as 30% of the cost of self-only coverage and still be considered voluntary.
Same as ADA, except a second inducement can apply to the spouse’s medical information
In addition:
No individual can be penalized for refusing to submit genetic information4
Programs cannot penalize failure to disclose health information about employees’ children
Standards for Program Design
Wellness program must be reasonably designed, no scientific evidence of efficacy required
Program must not be overly burdensome or a subterfuge for discrimination
Program must not be designed merely to shift costs to employees, or used only to predict future health costs
Programs must provide feedback about risk factors or use aggregate information to design programs or treat conditions
Same as ADA
In addition:
Genetic information can only be requested by a wellness program that offers health or genetic services
Standards for information collection
Require advance notice specifying what information will be collected, for what purpose, the limits on disclosure and the way information will be kept confidential.
Same as ADA
Confidentiality
Information can only be disclosed to employer in aggregate form that does not disclose identity of individuals
Employers cannot require employee to agree to the sale, exchange, sharing, transfer, or other disclosure of medical information as condition of participating
Same as ADA
In addition:
Individually identifiable genetic information can only be shared with the licensed health care professional providing health or genetic services
Wellness programs and sensitive health conditions
Among large firms with an incentive for completing a health risk assessment, 50% of workers complete the assessment compared to 31% at firms with no incentive. Overall in 2016, 41% of workers at large firms that offer an HRA actually participated in the screening, in 2016. One commonly cited reason is concern for the privacy of personal health information. Wellness program HRAs typically include questions about health risks or conditions which people may consider sensitive, especially in a workplace context. For example, HRAs commonly ask whether and to what extent individuals feel stress, anxiety or depression, whether and how frequently individuals consume alcohol or use illicit drugs, information about current prescription drug use and other medical treatments, and, for women, whether they are pregnant or contemplate pregnancy in the coming year. Biometric screenings involve physical examinations, often including blood tests.
In general, many Americans are concerned for the privacy of their health information. Concern may increase when it comes to health conditions that could trigger social stigma (including perceived blame for having the condition) and discrimination. The medical literature identifies a number of stigmatized conditions, including mental health disorders, alcohol and substance use disorders, HIV and other sexually transmitted diseases, and diabetes.5 People with stigmatized conditions may sometimes take drastic measures to guard their privacy. For example, according to the US Substance Abuse and Mental Health Administration (SAMHSA), 8 percent of adults who perceived that they needed mental health treatment and did not receive treatment said they did not seek care because of concerns about confidentiality.6
The 2015 National Survey on Drug Use and Health (NSDUH) collects data on the incidence of a range of health conditions and on the health insurance status and sources of coverage of individuals. We analyzed NSDUH data on seven potentially stigmatized health conditions to learn the number of adults with job-based health coverage who were affected. Almost three in ten of such adults in 2015, or nearly 39 million, reported having one or more of these health conditions. (Table 3) It is not possible to know from NSDUH data how many of these adults were covered through employers that also offer wellness programs.
Table 3: Incidence of Stigmatized Health Conditions Among Adult with Employer-Sponsored Health Insurance (ESI), 2015
Condition
Percent Adults with ESI
Number of Adults with ESI
Sexually Transmitted Disease (past year)
1.9%
2,515,067
Diabetes
9.0%
11,671,723
Mental health disorder
15.5%
20,213,894
HIV/AIDS
0.1%
148,278
Hepatitis B or C
1.0%
1,236,408
Pregnant
0.8%
1,052,807
Alcohol or substance use disorder (past year)
7.5%
9,690,737
Any of these conditions
29.8%
38,819,350
SOURCE: KFF Analysis of 2015 NSDUH SurveyNOTE: For adults, NSDUH defines mental illness as “having any mental, behavioral, or emotional disorder in the past year that met DSM-IV criteria (excluding developmental disorders and SUDs)”
Discussion
While many individuals may have privacy and discrimination concerns about their employers collecting biometric and health information, those with a stigmatized health conditions may have even stronger concerns. Even in the face of financial penalties, including higher health insurance premiums, most people offered the opportunity to participate in workplace wellness health screening programs decline to do so. Current federal law (the ADA and GINA) limit inducements employers can use to encourage workers and their family members to disclose information to wellness programs.
Legislation pending in Congress, HR 1313, would alter the legal landscape. Under this bill, workplace wellness programs would be deemed in compliance with the ADA and GINA if they comply with the ACA – which limits incentives only for health-contingent wellness programs, and which does not address other practices governed by the ADA and GINA. Nearly 90% of workplace wellness programs that ask for personal health information are not health contingent programs. As a result, under most programs, there would be no limit on penalties that could be applied to workers, spouses, and dependent children who decline to provide sensitive personal health and genetic information, and other rules on information collection practices would no longer apply. In addition, HR 1313 specifies that the “insurance safe harbor” provision of ADA applies to workplace wellness programs, notwithstanding any other provision of law. When ADA was enacted in 1990, the safe harbor had allowed insurers and employer health plan sponsors to use information, including actuarial data, about risks posed by certain health conditions to make decisions about insurability and about the cost of insurance. This meant certain practices – such as excluding pre-existing conditions or charging people more based on health status – were not considered to violate the ADA ban on discrimination. After the Affordable Care Act prohibited such practices, EEOC rules clarified that the insurance safe harbor does not apply to workplace wellness programs, even if they are offered as part of a group health plan. HR 1313 would reverse that decision.
The potential for workplace wellness programs to improve health and save costs continues to hold great appeal for employers and policymakers, alike. The challenge is to balance this potential with protections to ensure programs do not discriminate against people with health problems or compel disclosure of health information people want to keep private. As new federal standards for wellness programs are considered, it remains to be seen how these goals will be balanced.
Endnotes
Normally under federal law, group health plans cannot vary premiums based on participants’ health status, but the Affordable Care Act (ACA) permitted such incentives within workplace wellness programs that meet other standards. ↩︎
Under this requirement, for example, it would be permissible for the health plan’s wellness program to be offered to employees but not family members, or to full-time but not part-time employees. ↩︎
This includes “programs to help employees stop smoking”, “programs to help employees lose weight”, “Other lifestyle or behavioral coaching”, such as health education classes stress management or substance abuse. See 2016 Employer Health Benefit Survey. ↩︎
However, incentives can be offered for a spouse to submit information about his/her past or current health status. Under GINA, the definition of genetic information includes information about the current and past health status of a family member, including a spouse. ↩︎
Center for Behavioral Health Statistics and Quality. (2016). 2015 National Survey on Drug Use and Health: Detailed Tables. Substance Abuse and Mental Health Services Administration, Rockville, MD. ↩︎