Views and Experiences with End-of-Life Medical Care in the U.S.

Authors: Liz Hamel, Bryan Wu, and Mollyann Brodie
Published: Apr 27, 2017

Overview

In partnership with The Economist, the Kaiser Family Foundation conducted a cross-country survey of adults in the United States, Italy, Japan, and Brazil about people’s views and experiences related to aging and end-of-life medical care. These four countries are each at different stages of population aging, and have different cultural and institutional considerations when it comes to preparing and providing care for those near the end of life.

This report gives an overview of the survey results for the U.S. A summary report comparing themes across the four countries and highlighting specific findings in Japan, Italy, and Brazil is available here.

Coverage from The Economist

What people want in their final months

Mending Mortality

What people want at the end of life

Findings

Key Findings

Views on the Aging Population

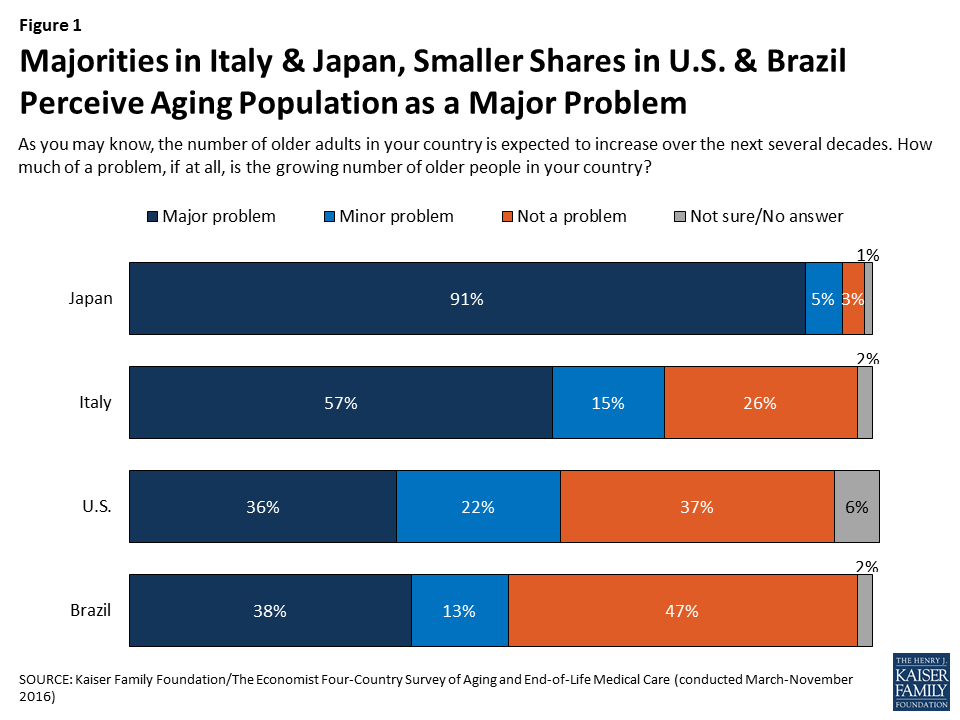
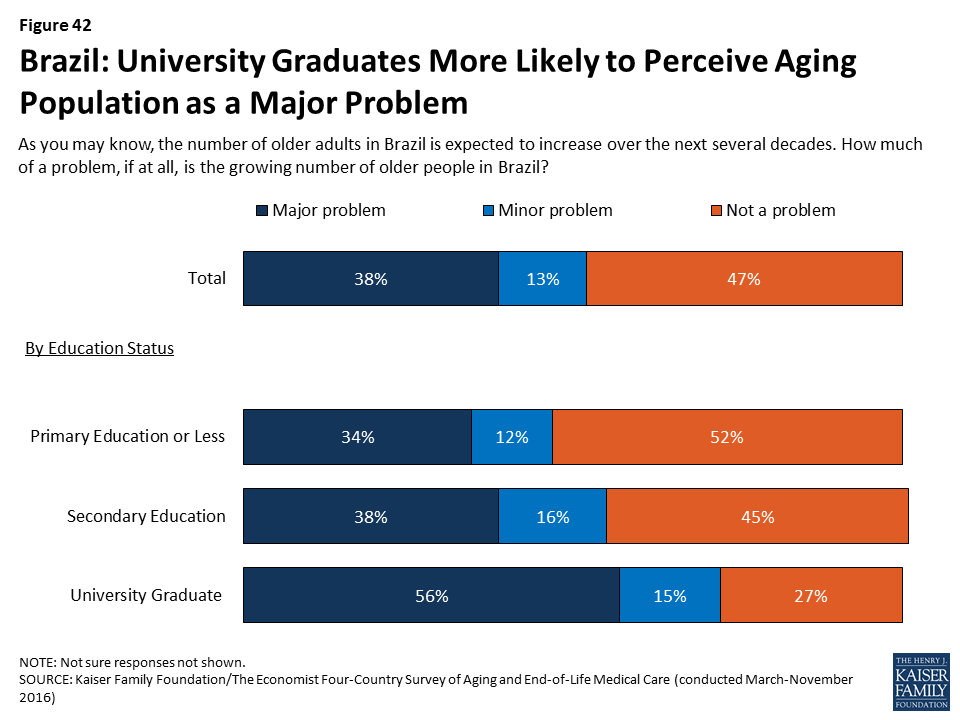
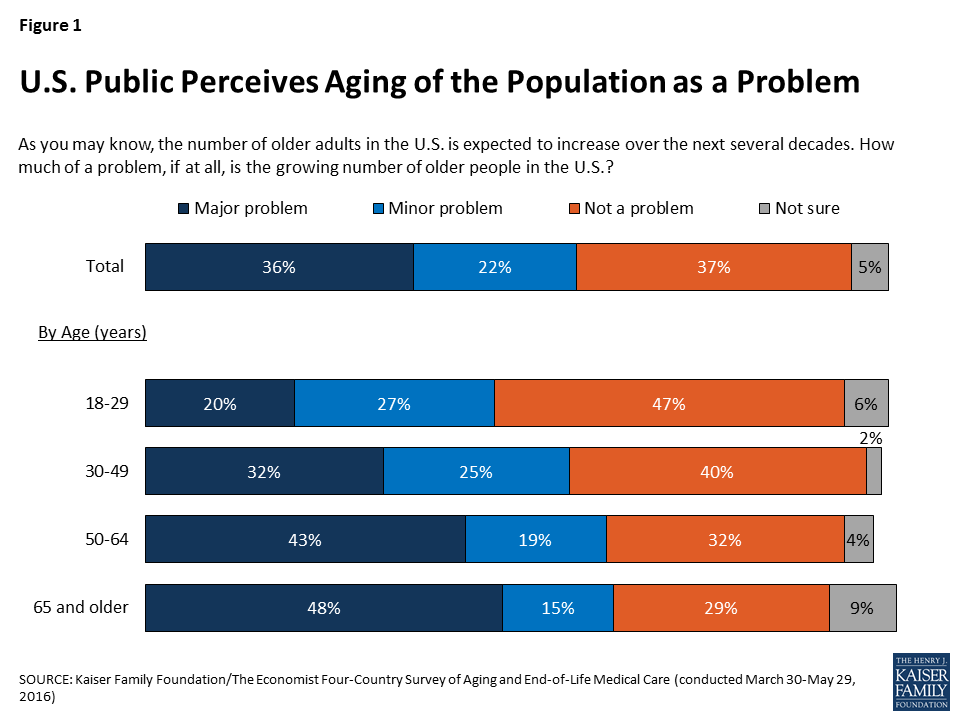
In 2014, Americans ages 65 and older made up 15 percent of the total U.S. population; by 2060, that share is projected to grow to 24 percent.1  A majority of Americans (57 percent) believe the growing number of older people in the U.S. is a problem for the country, including a third (36 percent) who see it as a major problem. Older Americans themselves are more likely to see the aging of the population as a problem; six in ten (62 percent) of those ages 65 and over see it as a problem, including half (48 percent) who believe it is a major problem.

Figure 1: U.S. Public Perceives Aging of the Population as a Problem

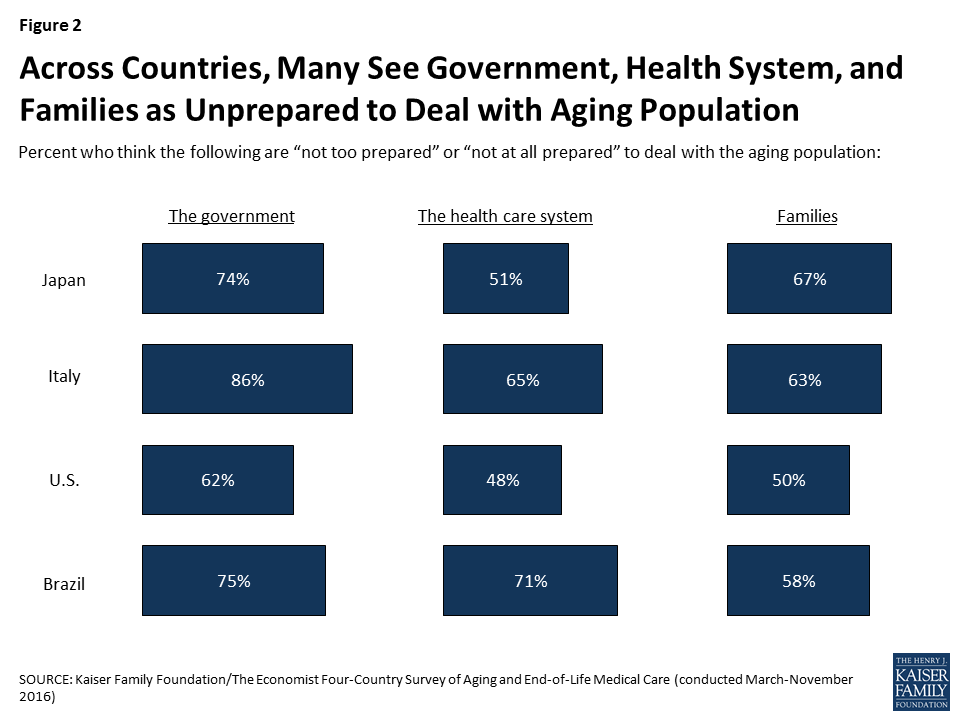
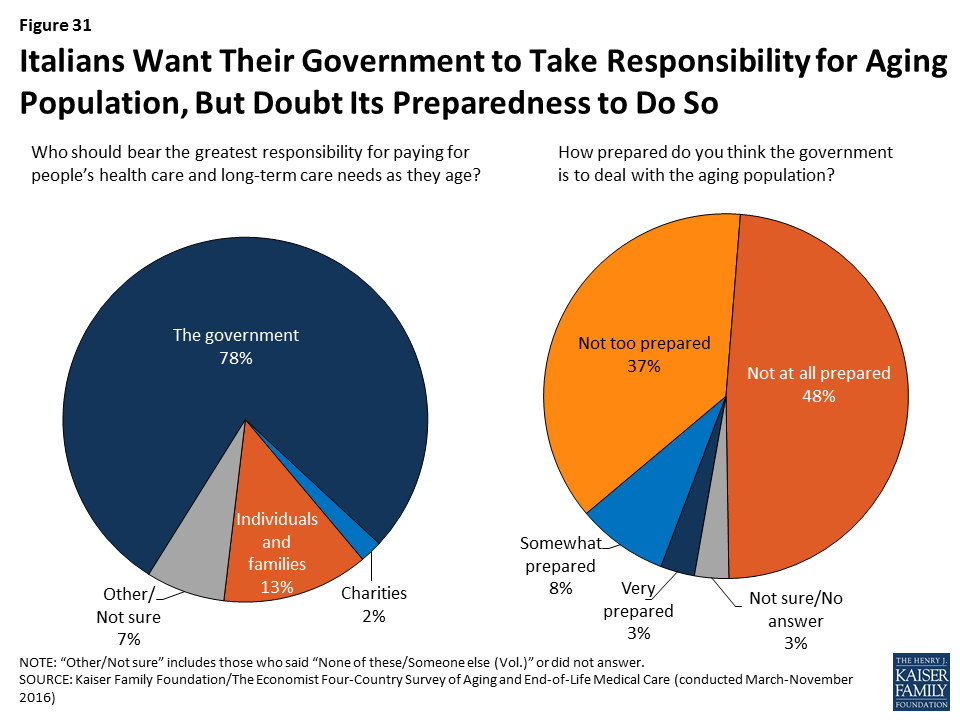
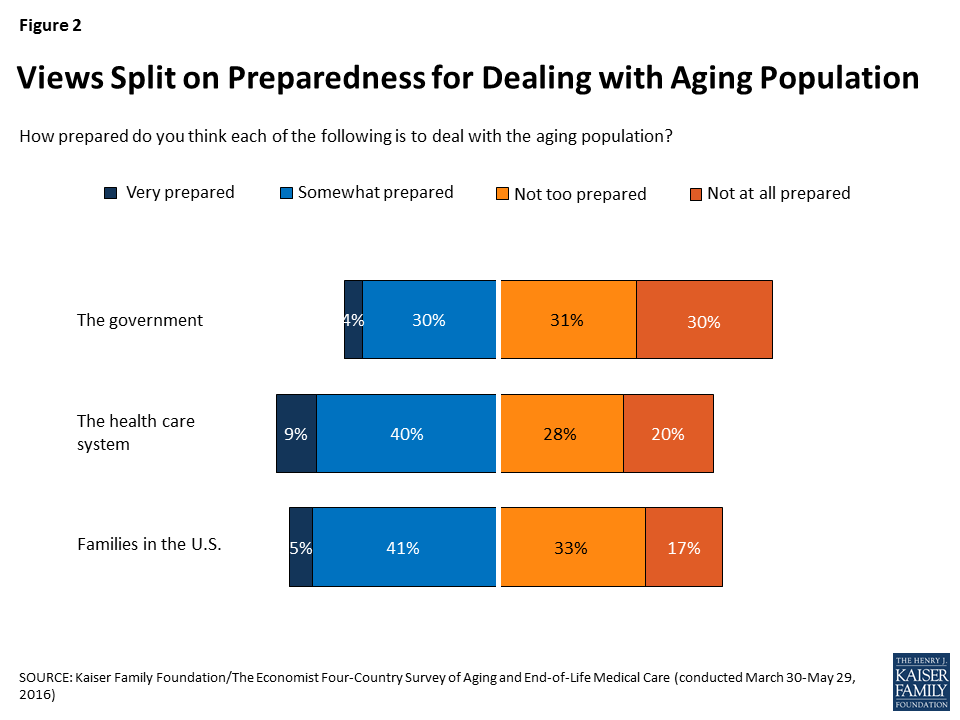
A majority (62 percent) of U.S. adults say the government is “not too prepared” or “not at all prepared” to deal with the aging population, while a third (35 percent) say it is “very” or “somewhat” prepared. Americans are more split on whether the health care system and families in the U.S. are prepared to deal with the aging population, with about half saying each is prepared and the other half saying they are not.

Figure 2: Views Split on Preparedness for Dealing with Aging Population

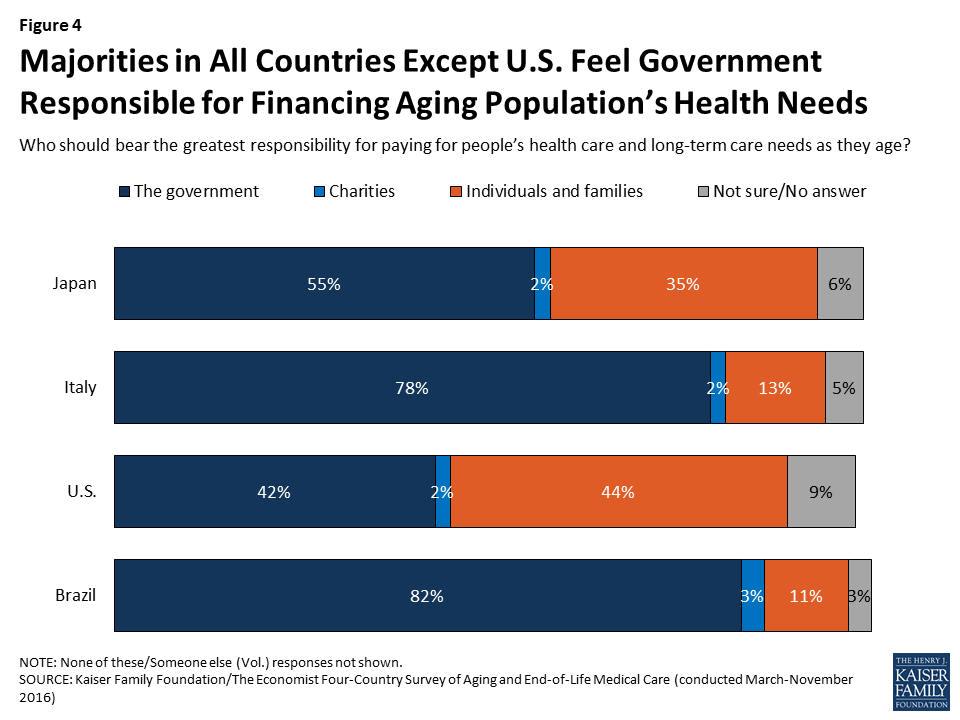
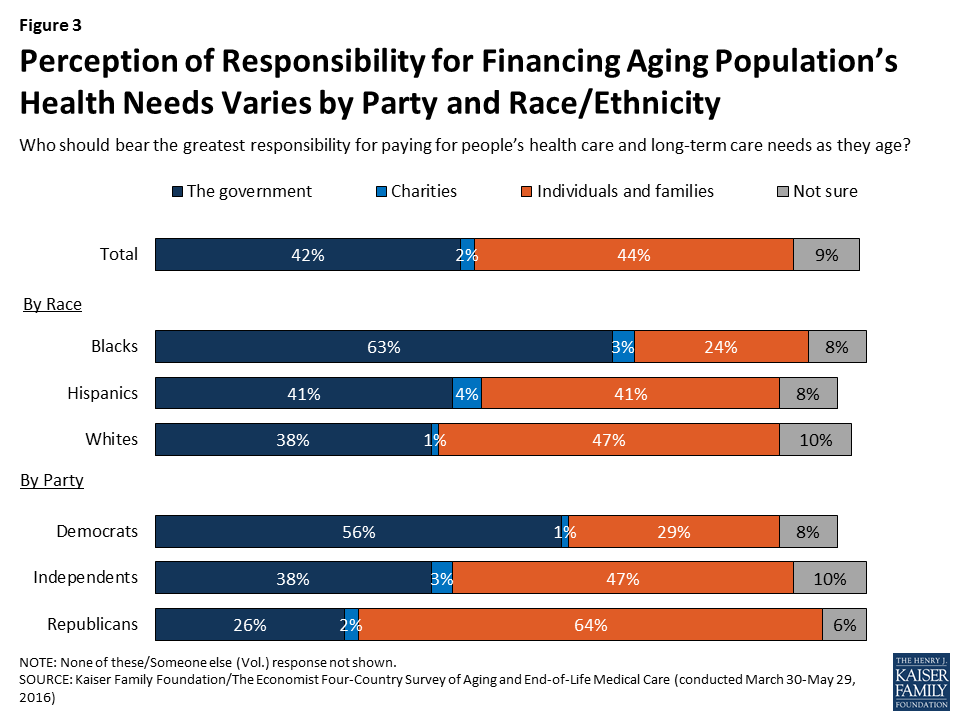
When asked who should bear the greatest responsibility for paying for people’s health care and long-term care needs as they age, Americans are fairly evenly divided between those who believe individuals and families should bear the biggest burden (44 percent) and those who place this responsibility on the government (42 percent). This stands in sharp contrast to other countries surveyed (Italy, Japan, and Brazil), where majorities place the responsibility squarely on the government. Reflecting usual partisan preferences and demographic differences within the U.S., Democrats and African Americans are more likely to believe the government should have the main responsibility to pay for care for the aging population’s health, while Republicans and whites are more likely to see it as a responsibility for individuals and families.

Figure 3: Perception of Responsibility for Financing Aging Population’s Health Needs Varies by Party and Race/Ethnicity

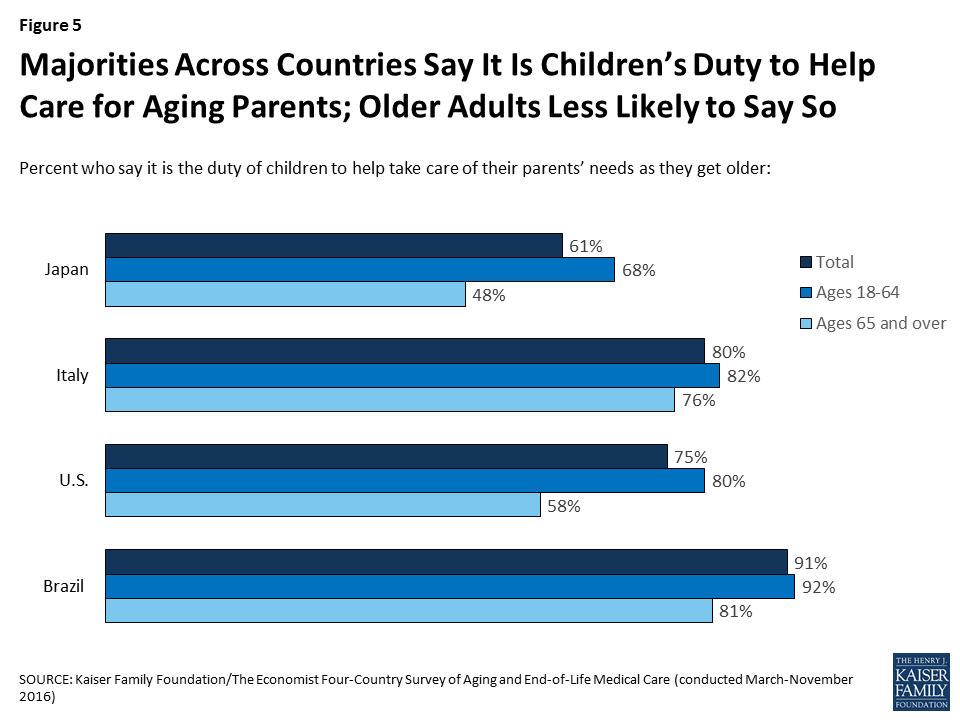
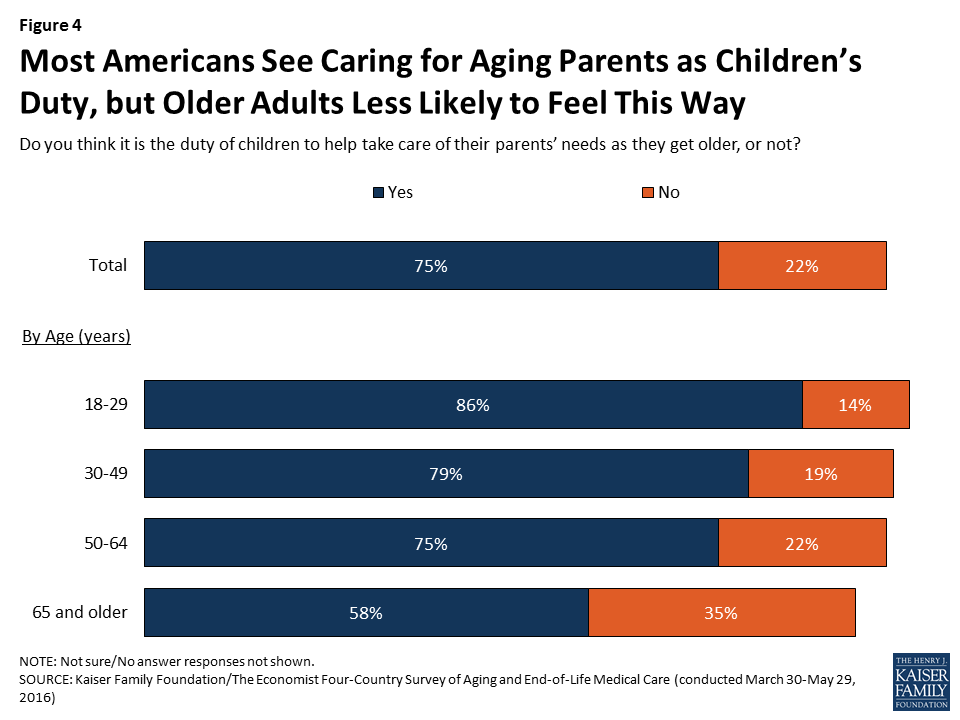
Outside of the financial responsibility, families are seen as having a major role to play in helping older adults. Three-quarters of Americans say it is the duty of children to help take care of their parents’ needs as they get older. Older adults themselves are somewhat less likely to feel this way compared with younger Americans (58 percent of those ages 65 and over, compared with at least three-quarters in younger age groups).

Figure 4: Most Americans See Caring for Aging Parents as Children’s Duty, but Older Adults Less Likely to Feel This Way

Rating the Current System for End-of-Life Care

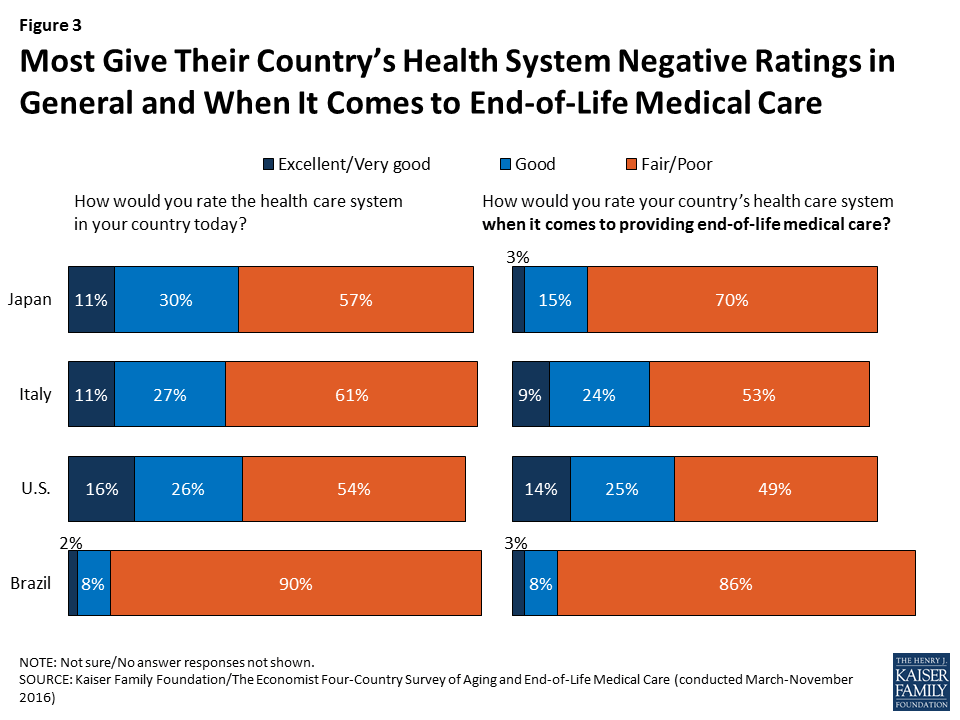
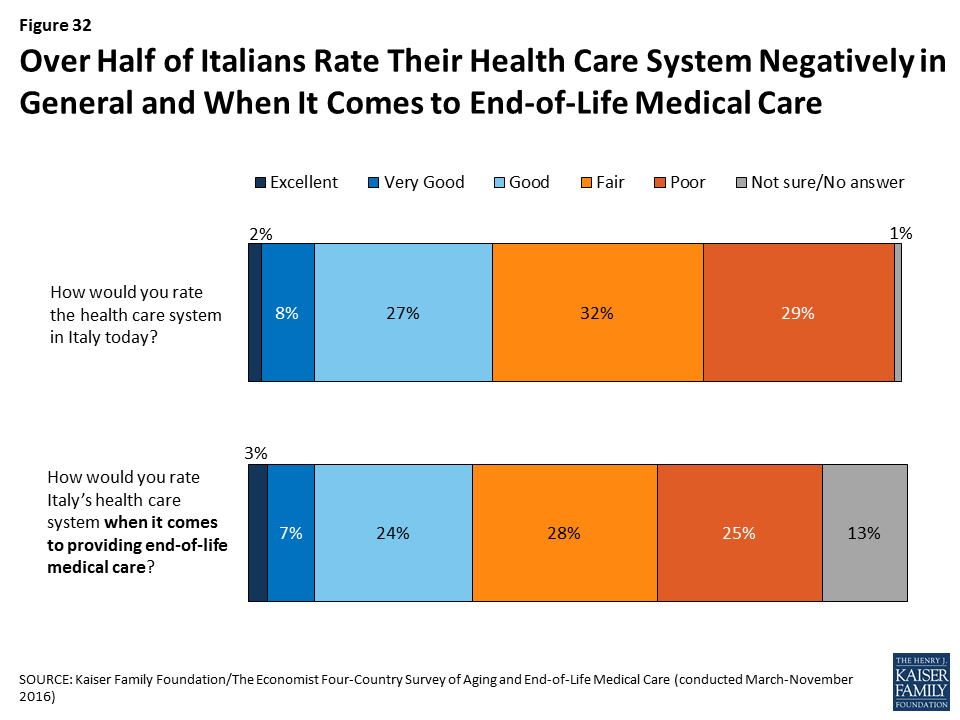
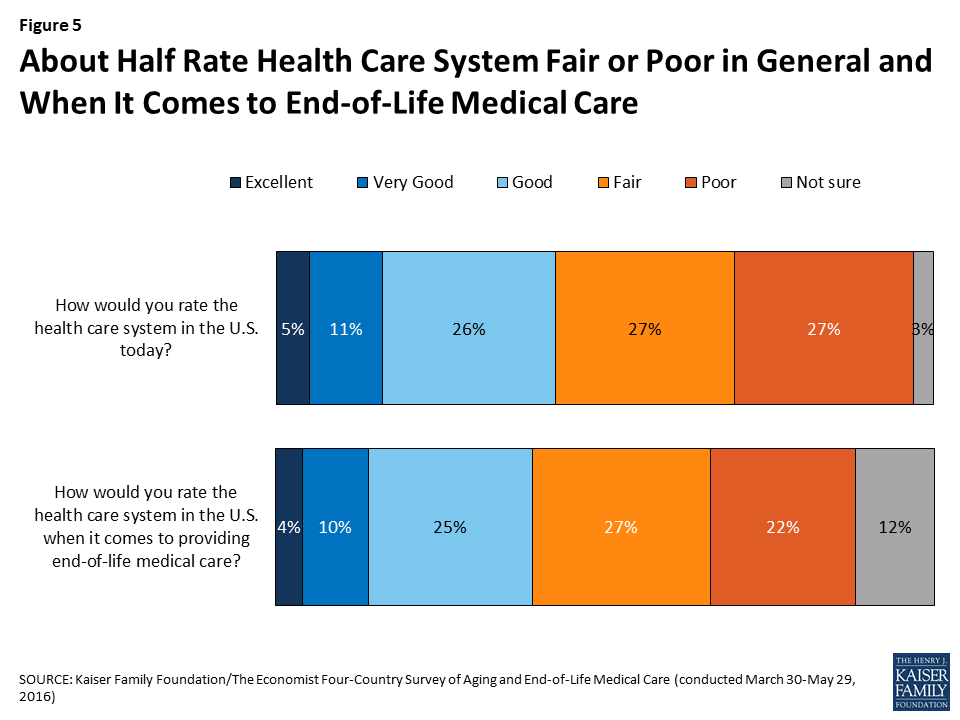
Americans do not give their health care system high marks in general, or when it comes to providing end-of-life care. About half (54 percent) give the U.S. health care system a rating of “fair” or “poor” overall, while a quarter (26 percent) rate it as “good” and 16 percent say it is “excellent” or “very good.” Responses are similar when the public is asked to rate the health care system specifically when it comes to providing end-of-life medical care (49 percent say it is fair or poor, and just 14 percent say it is excellent or very good).

Figure 5: About Half Rate Health Care System Fair or Poor in General and When It Comes to End-of-Life Medical Care

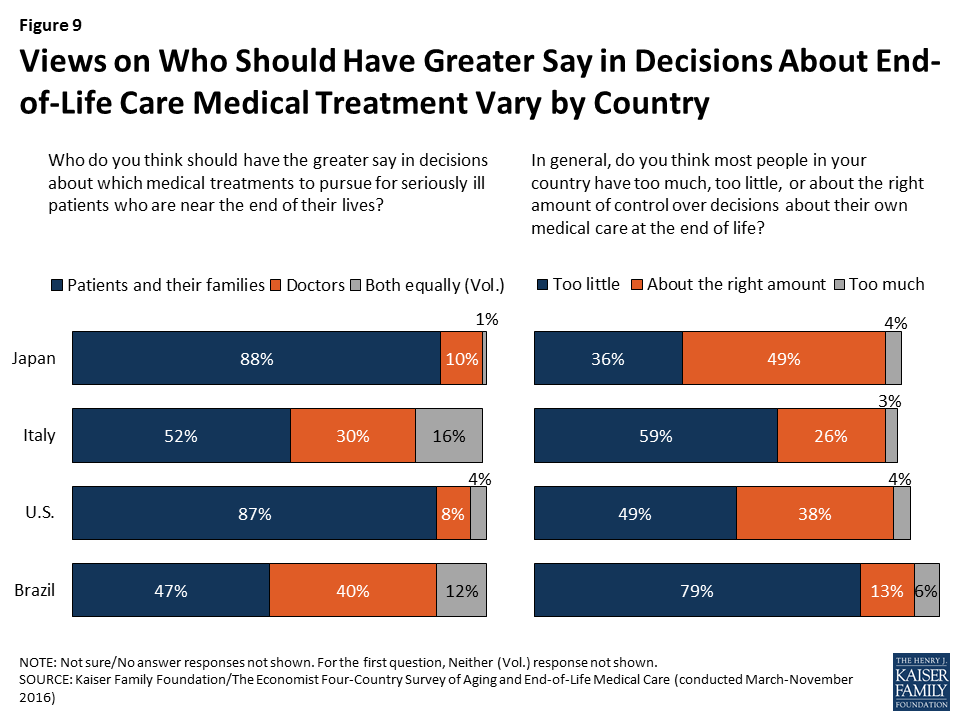
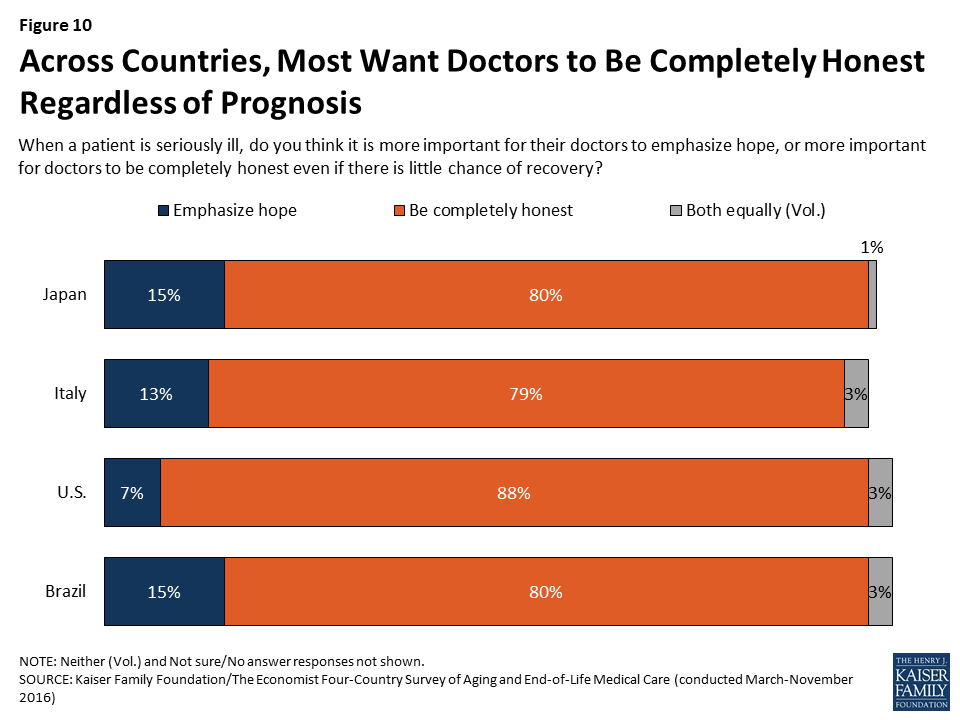
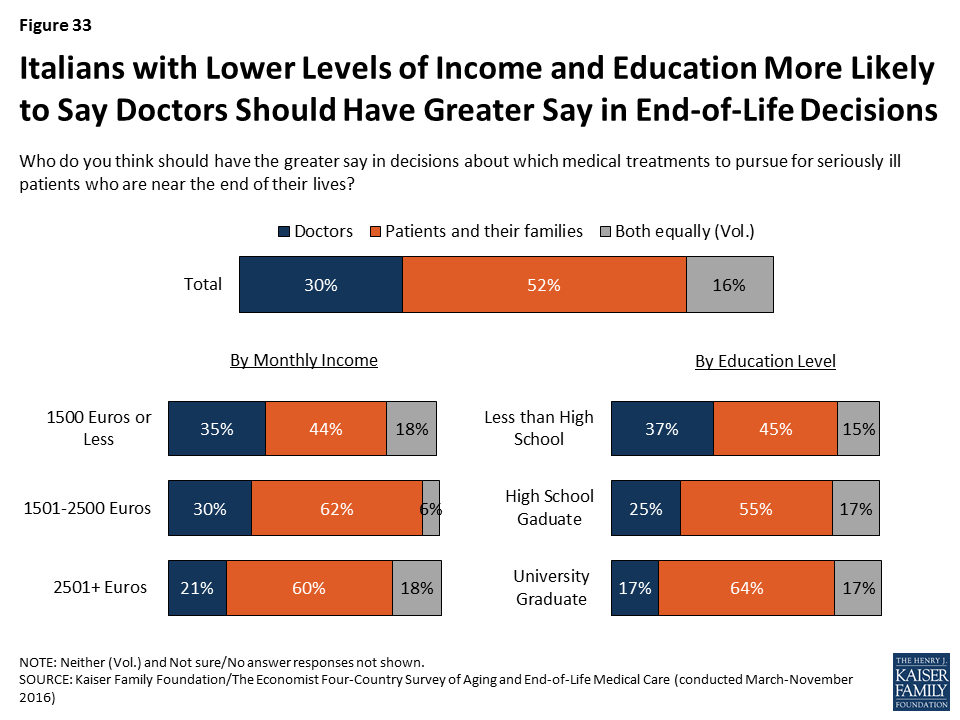
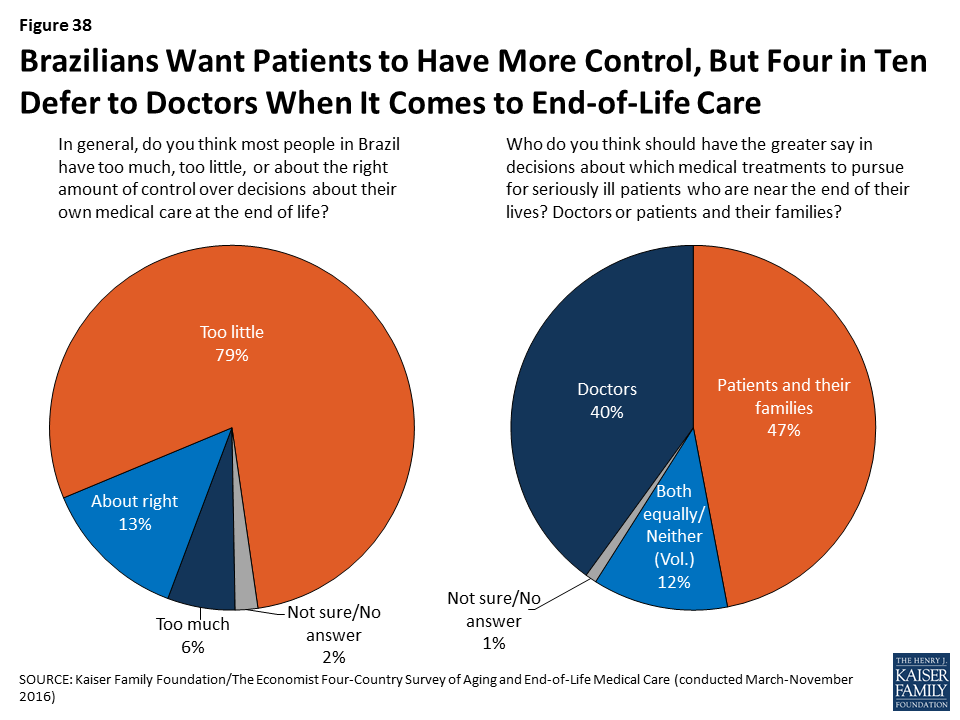
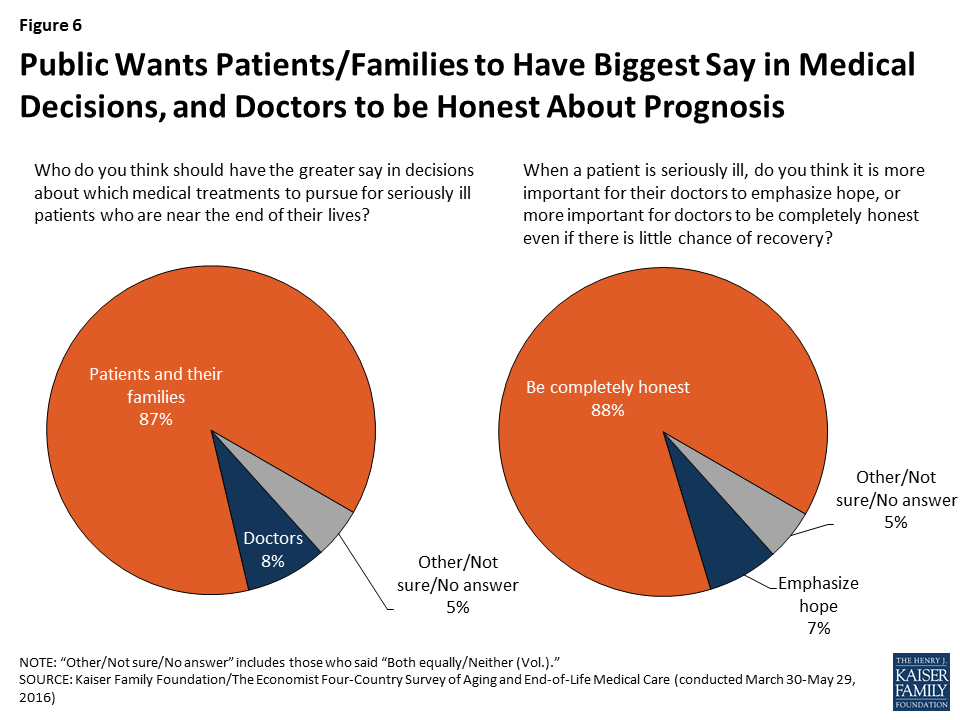
A large majority (87 percent) believe that patients and their families should have the greater say in which treatment options to pursue for patients who are seriously ill and nearing the end of life, while just 8 percent believe doctors should have the greater say. Americans also prefer honesty from their health care providers, no matter what the prognosis. Just 7 percent say that when a patient is seriously ill, it is more important for their doctors to emphasize hope, while the vast majority (88 percent) say it is more important for doctors to be completely honest even if there is little chance of recovery.

Figure 6: Public Wants Patients/Families to Have Biggest Say in Medical Decisions, and Doctors to be Honest About Prognosis

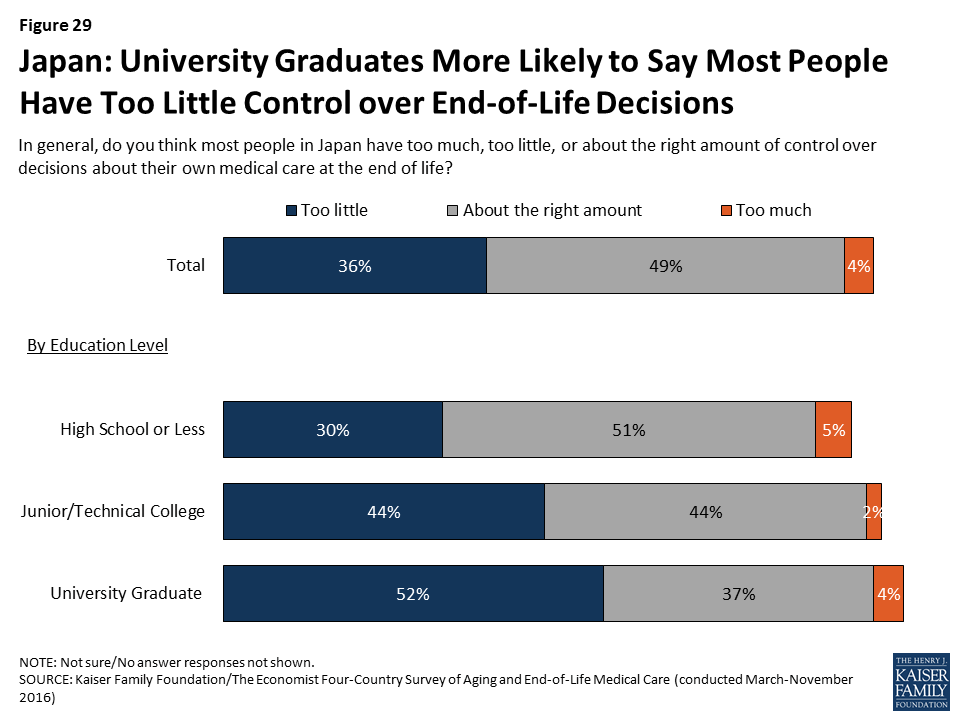
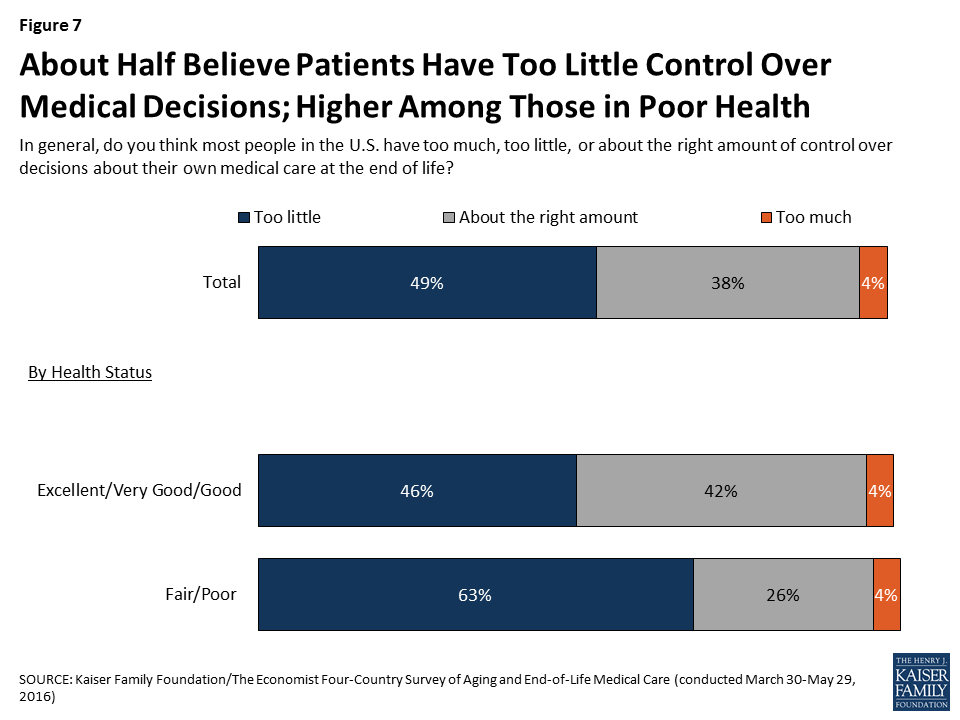
However, the public sees room for improvement when it comes to giving patients control over end-of-life medical decisions. About half (49 percent) believe most people in the U.S. have too little control over decisions about their own medical care at the end of life, while four in ten (38 percent) feel patients have about the right amount of control and just 4 percent say they have too much. Among those who say their own health is only fair or poor, an even higher share (63 percent) say most people in the U.S. have too little control.

Figure 7: About Half Believe Patients Have Too Little Control Over Medical Decisions; Higher Among Those in Poor Health

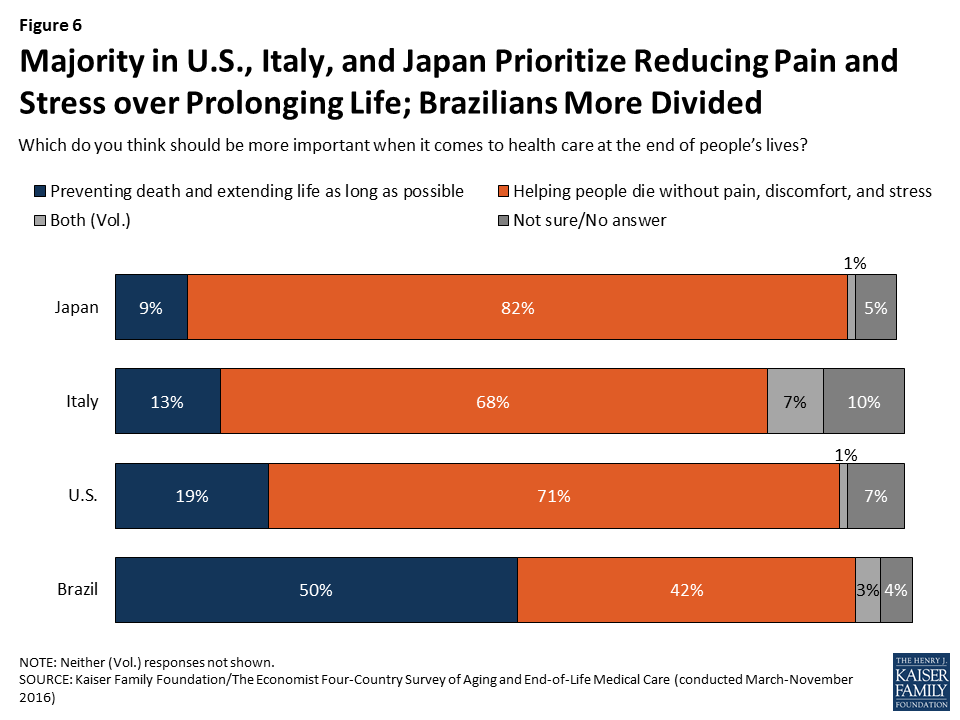
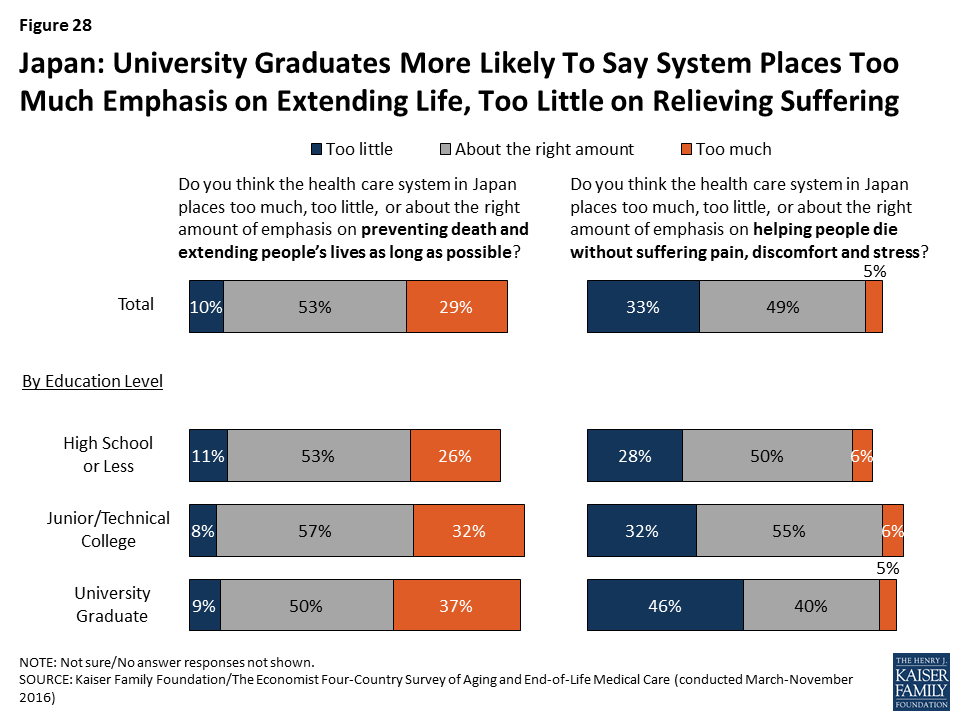
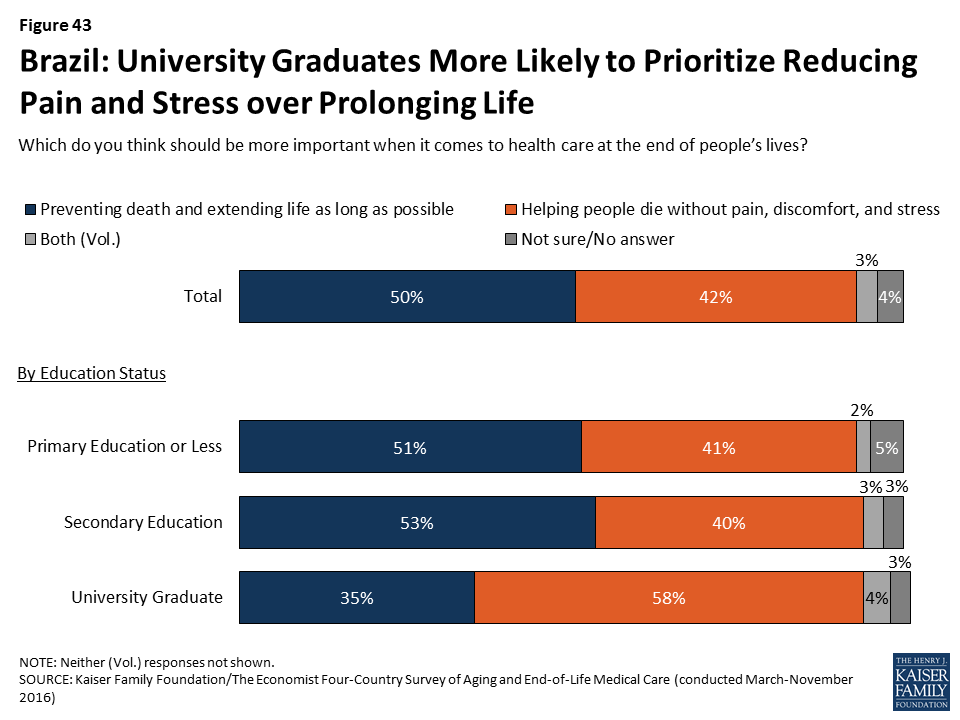
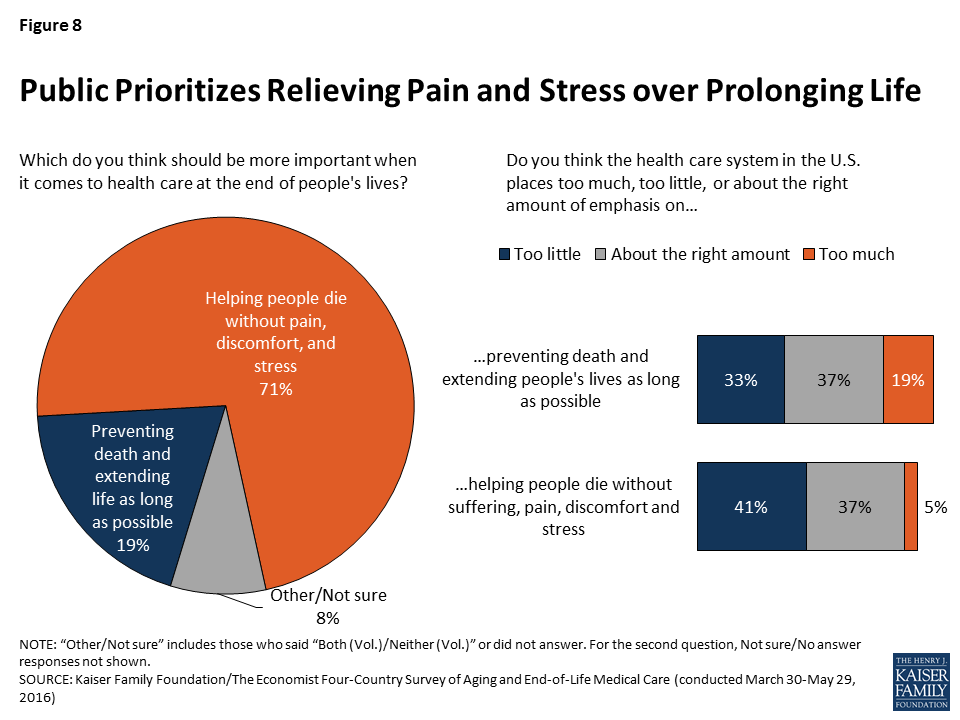
When asked which should be more important when it comes to health care at the end of people’s lives, seven in ten Americans (71 percent) choose “helping people die without pain, discomfort, and stress,” while one in five (19 percent) choose “preventing death and extending life as long as possible.” When asked to rate the U.S. health care system on each of these dimensions, about four in ten (37 percent each) say the current system places about the right amount of emphasis on each of these areas. However, four in ten (41 percent) say the system places too little emphasis on helping people die without pain, discomfort, and stress, and a third (33 percent) say it places too little emphasis on extending life. While very few (5 percent) say the system places too much emphasis on reducing pain and discomfort, roughly one in five (19 percent) say it places too much emphasis on extending life.

Figure 8: Public Prioritizes Relieving Pain and Stress over Prolonging Life

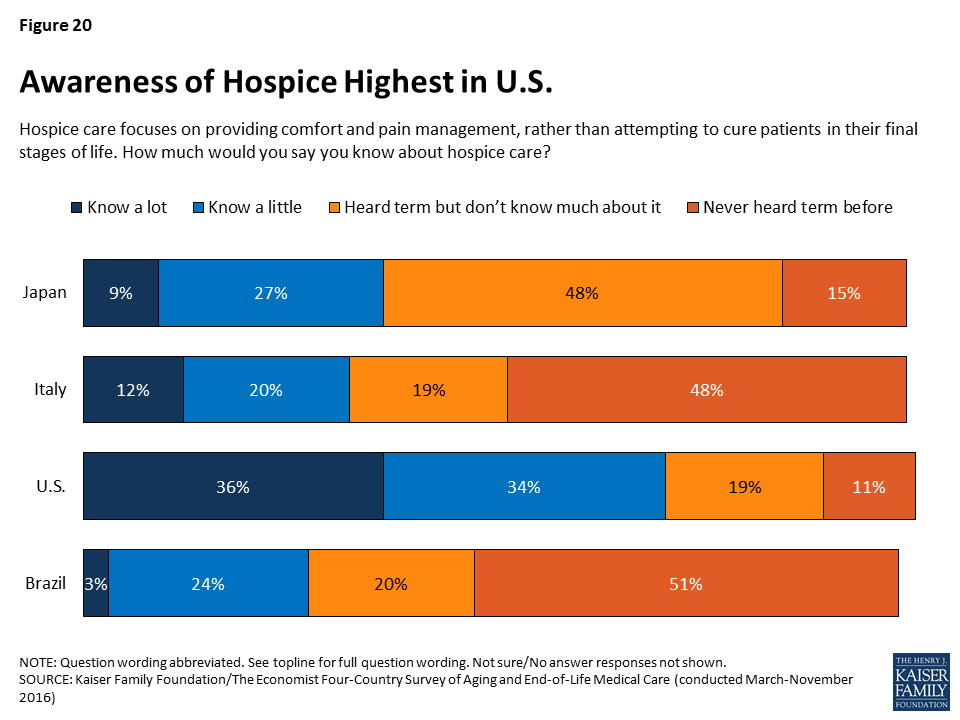
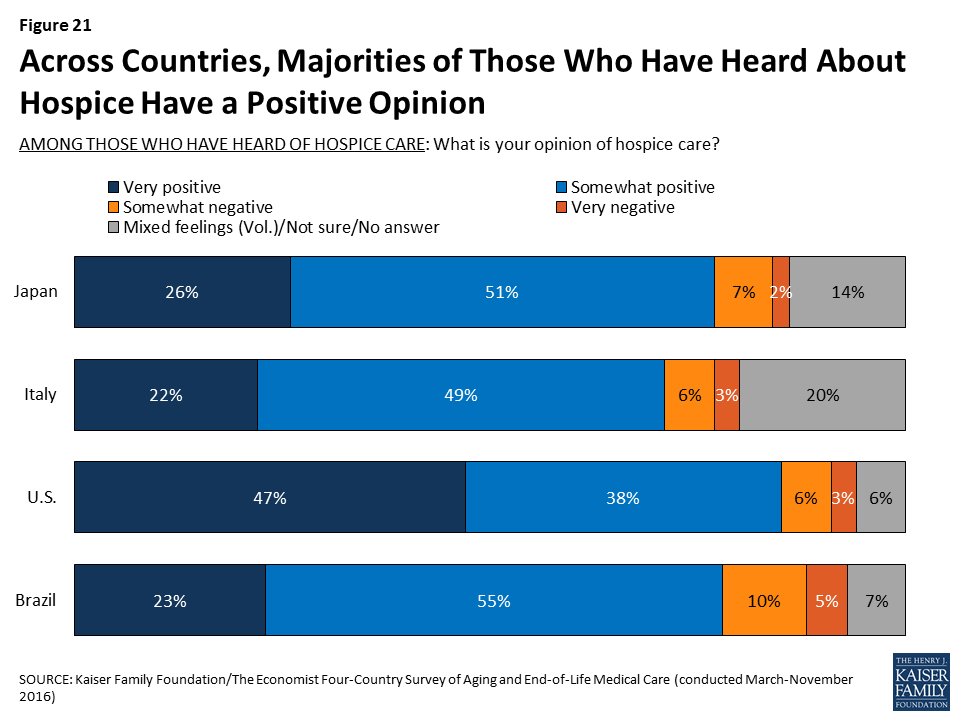
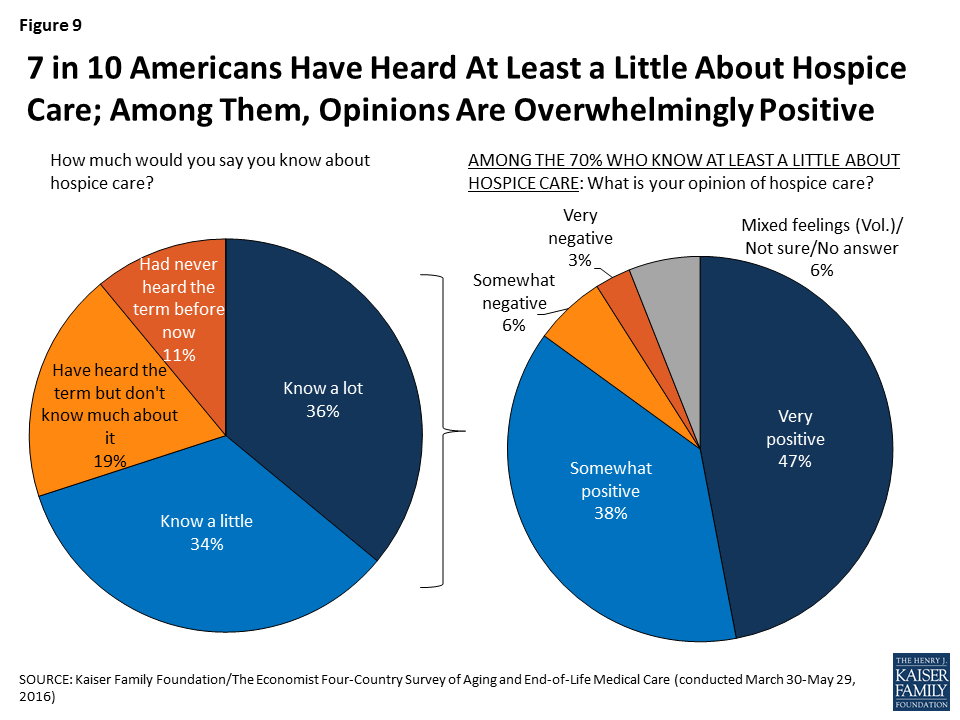
Hospice care is an option for many in the U.S. who are nearing the end of life and prefer a focus on relief of pain and suffering. Americans’ awareness of hospice care is fairly robust, and opinions of hospice care are overwhelmingly positive among those who have heard at least something about it. Seven in ten U.S. residents say they know at least a little about hospice care, including about a third (36 percent) who say they know “a lot.” About one in five (19 percent) say they’ve heard of hospice care but don’t know much about it, while one in nine say they had not heard the term before the survey. Among the 70 percent who say they know at least a little about hospice, a large majority (85 percent) say they have a positive opinion of hospice care, including almost half (47 percent) who say their opinion is very positive; just one in ten (9 percent) say they have a negative opinion of hospice care. One in five (20 percent) say that someone in their household has had an experience with hospice care in the past year, and among this group 87 percent say they have a positive opinion of hospice, including 58 percent who have a very positive opinion.

Figure 9: 7 in 10 Americans Have Heard At Least a Little About Hospice Care; Among Them, Opinions Are Overwhelmingly Positive

What People Want for Their Own Death

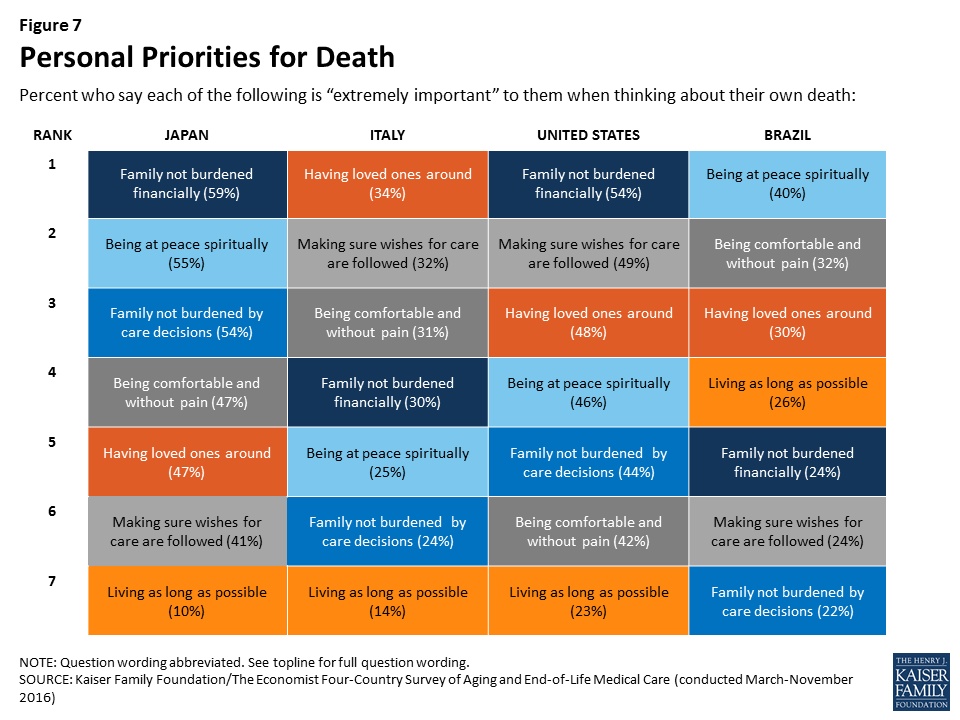
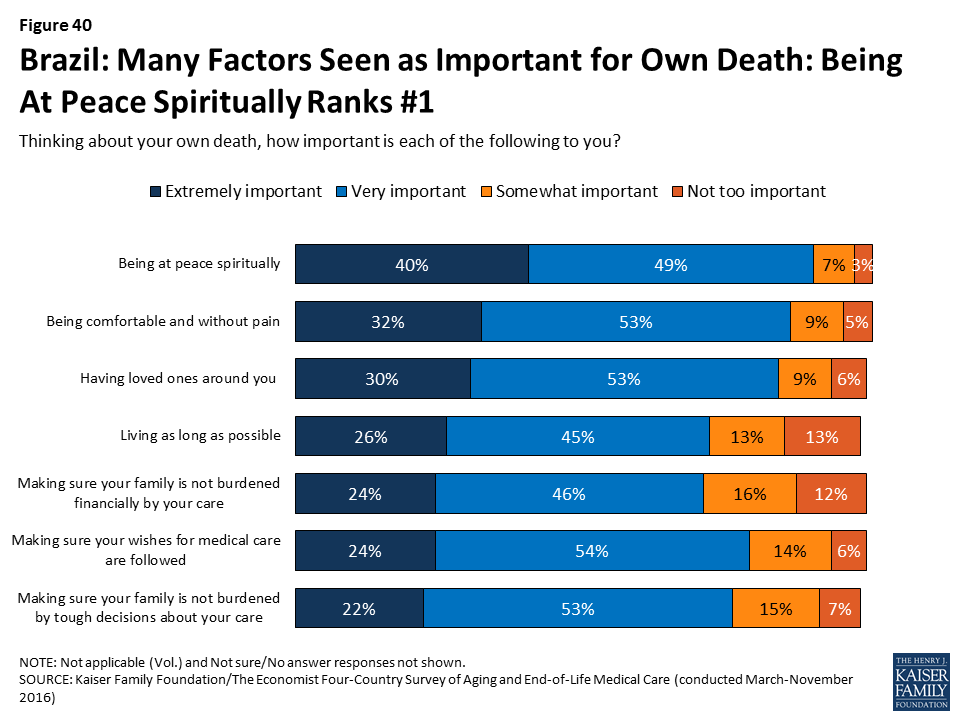
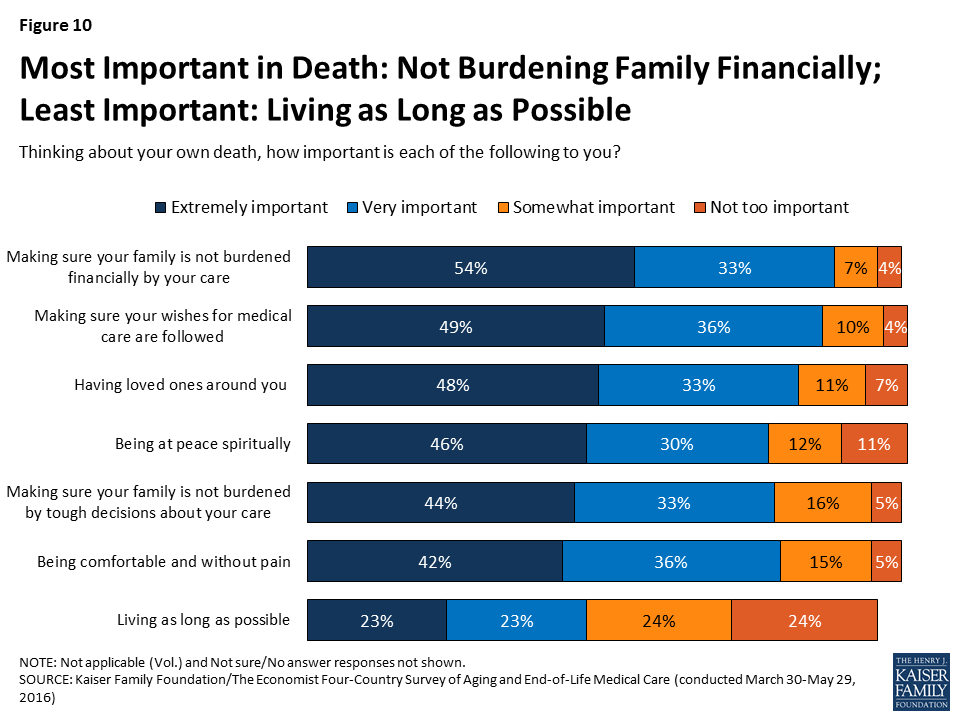
When asked what is most important in thinking about their own death, a variety of factors are rated as important by large shares of Americans. At the top of the list, just over half (54 percent) say that making sure their family is not burdened financially by their care is “extremely” important. About half also say making sure their wishes for medical care are followed (49 percent), having loved ones around them (48 percent), and being at peace spiritually (46 percent) are extremely important. Roughly four in ten say the same about making sure their family is not burdened by tough decisions about their care (44 percent) and being comfortable and without pain (42 percent). At the bottom of the list, a quarter (23 percent) say that living as long as possible is extremely important to them.

Figure 10: Most Important in Death: Not Burdening Family Financially; Least Important: Living as Long as Possible

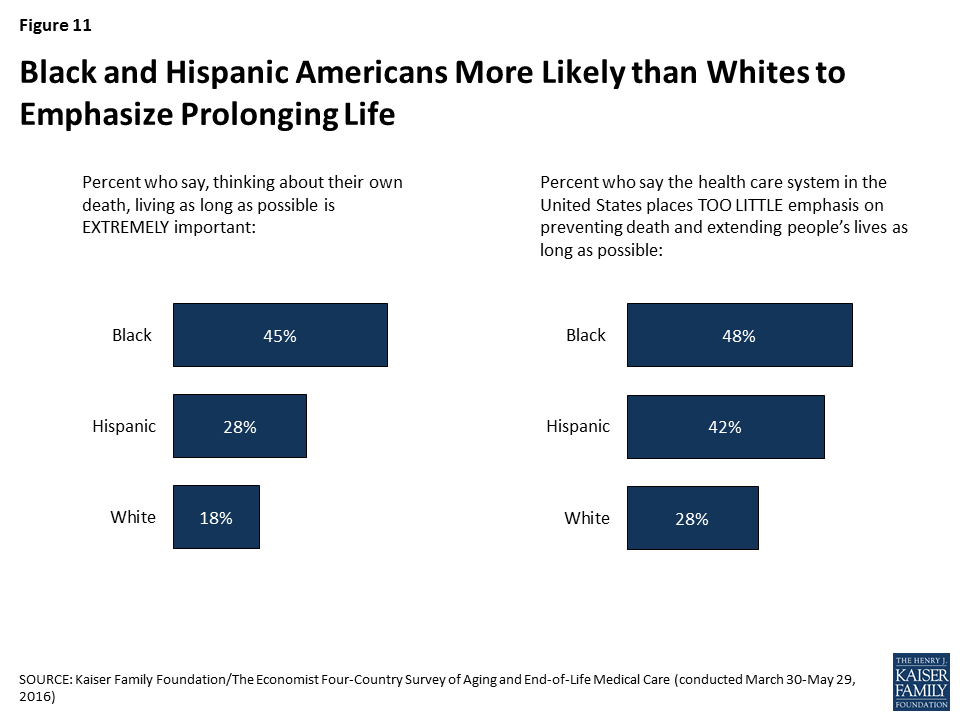
While the ranking of these factors is mostly similar across age and other demographic groups, some differences in the shares saying each factor is important emerge. For example, while living as long as possible ranks below other considerations across racial and ethnic groups, blacks and Hispanics are more likely than whites to say this is “extremely important” to them (45 percent, 28 percent, and 18 percent, respectively). Perhaps relatedly, blacks and Hispanics are also more likely than whites to say the health care system in the U.S. places too little emphasis on preventing death and extending life as long as possible.

Figure 11: Black and Hispanic Americans More Likely than Whites to Emphasize Prolonging Life

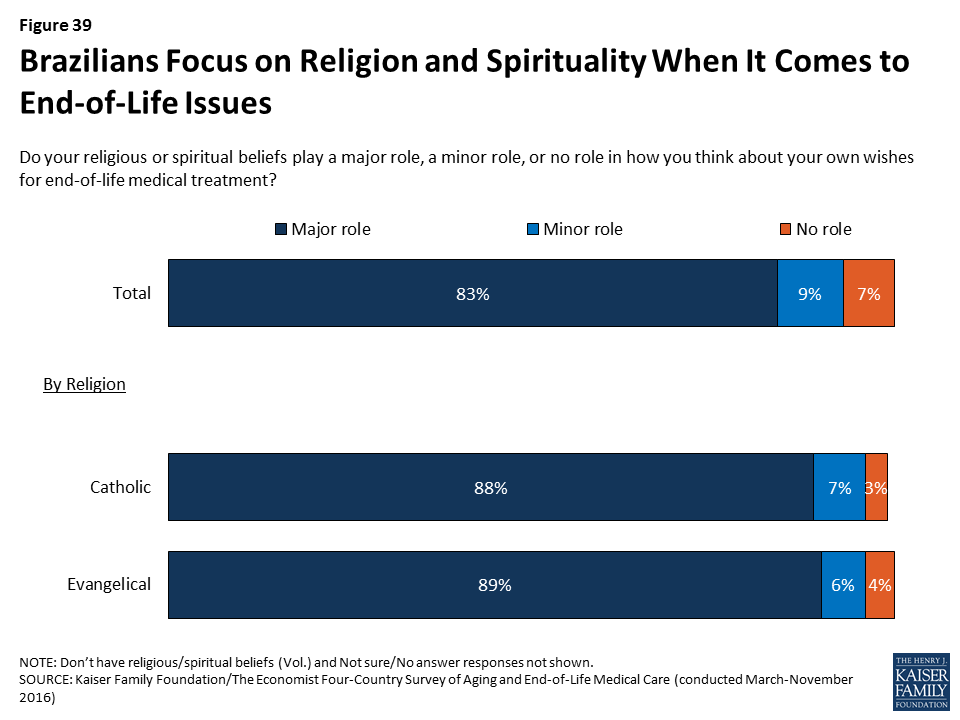
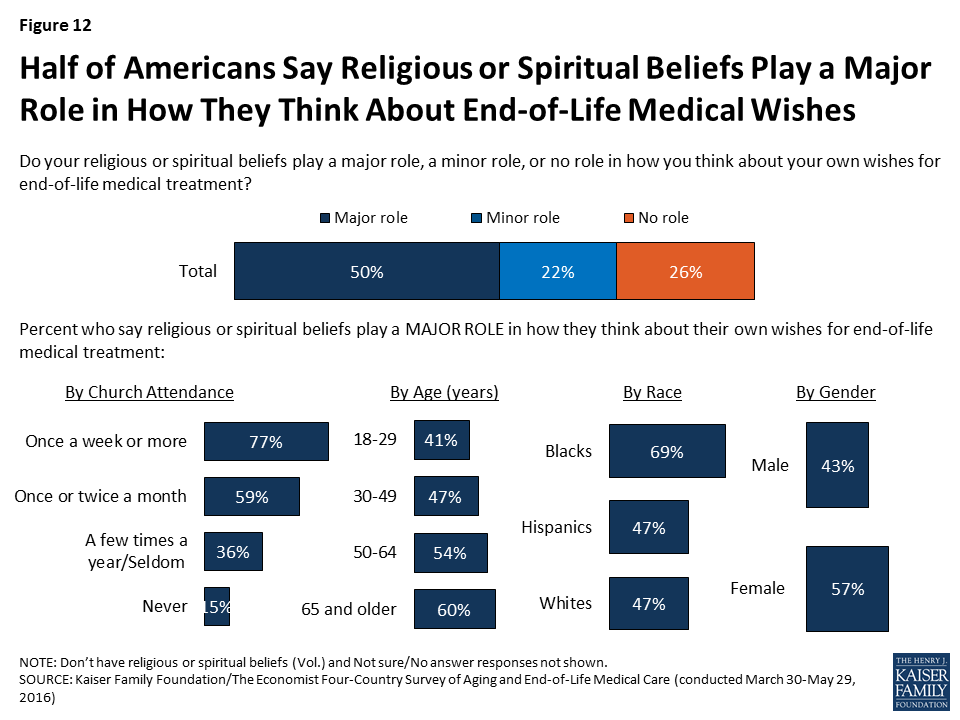
Groups of Americans also differ in the amount of influence that religion and spirituality play in their own end-of-life wishes. Overall, half of U.S. adults say that their religious and spiritual beliefs play a major role in how they think about their own wishes for end-of-life medical treatment, while 22 percent say these beliefs play a minor role and 26 percent say they play no role. Older Americans, women, Blacks, and those who attend religious services at least weekly are more likely than their counterparts to say their religious and spiritual beliefs play a major role in how they think about these matters.

Figure 12: Half of Americans Say Religious or Spiritual Beliefs Play a Major Role in How They Think About End-of-Life Medical Wishes

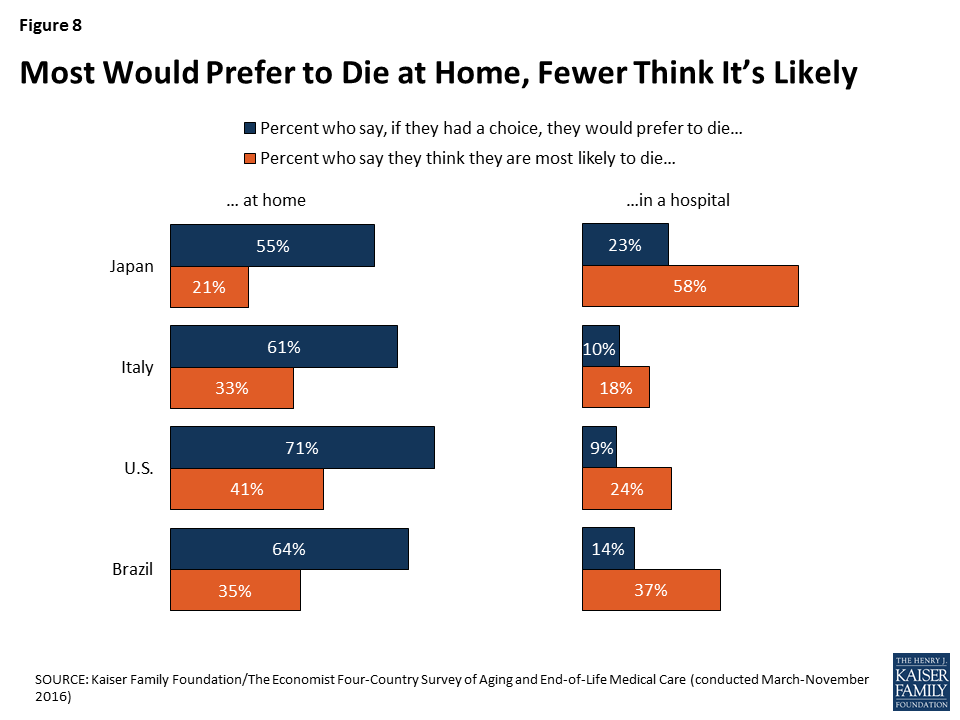
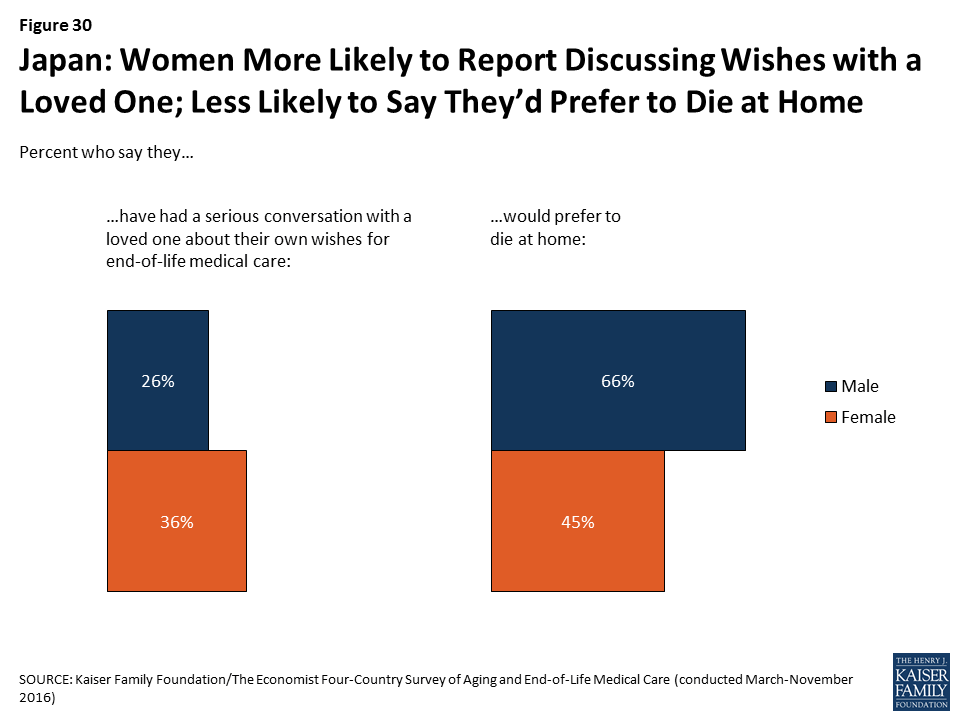
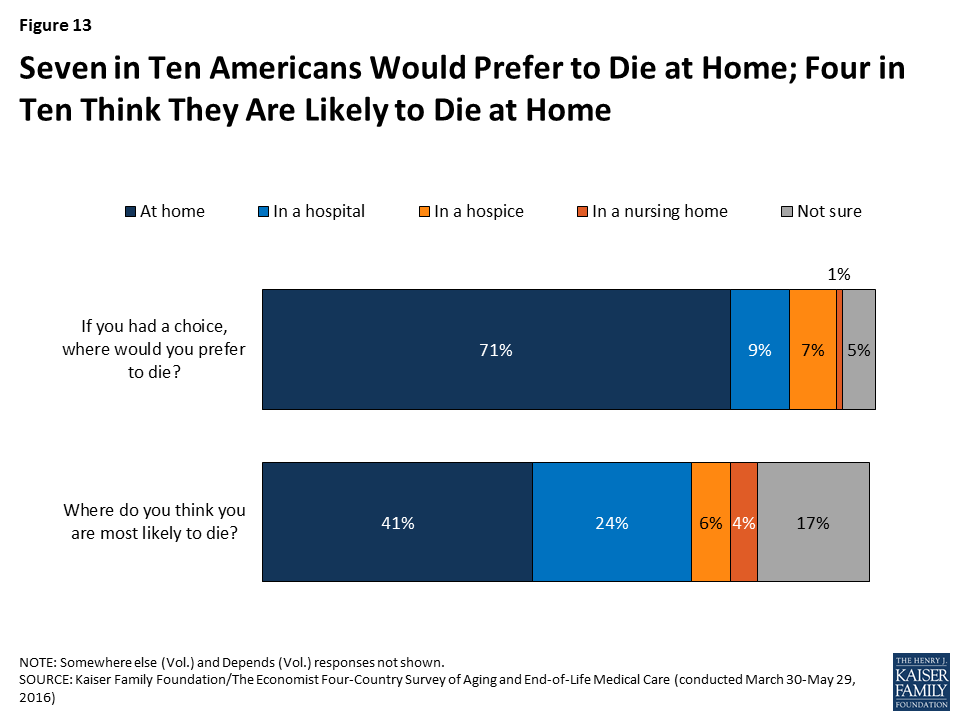
As other research has shown, most Americans (71 percent) say that given the choice, they would prefer to die at home, with few saying they would choose a hospital (9 percent), hospice (7 percent), or nursing home (1 percent). However, people’s expectations often don’t line up with their preferences. About four in ten (41 percent) think they are most likely to die at home, while about a quarter (24 percent) expect to die in a hospital, 6 percent expect to die in a hospice, 4 percent expect to die in a nursing home, and 17 percent say they aren’t sure.

Figure 13: Seven in Ten Americans Would Prefer to Die at Home; Four in Ten Think They Are Likely to Die at Home

Conversations and Preparations

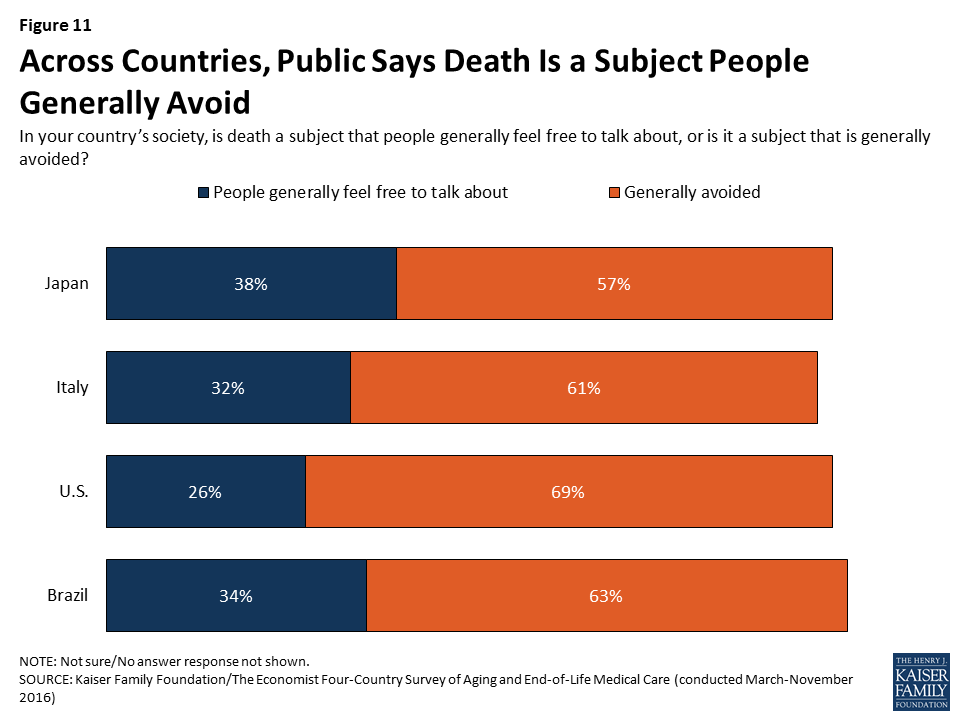
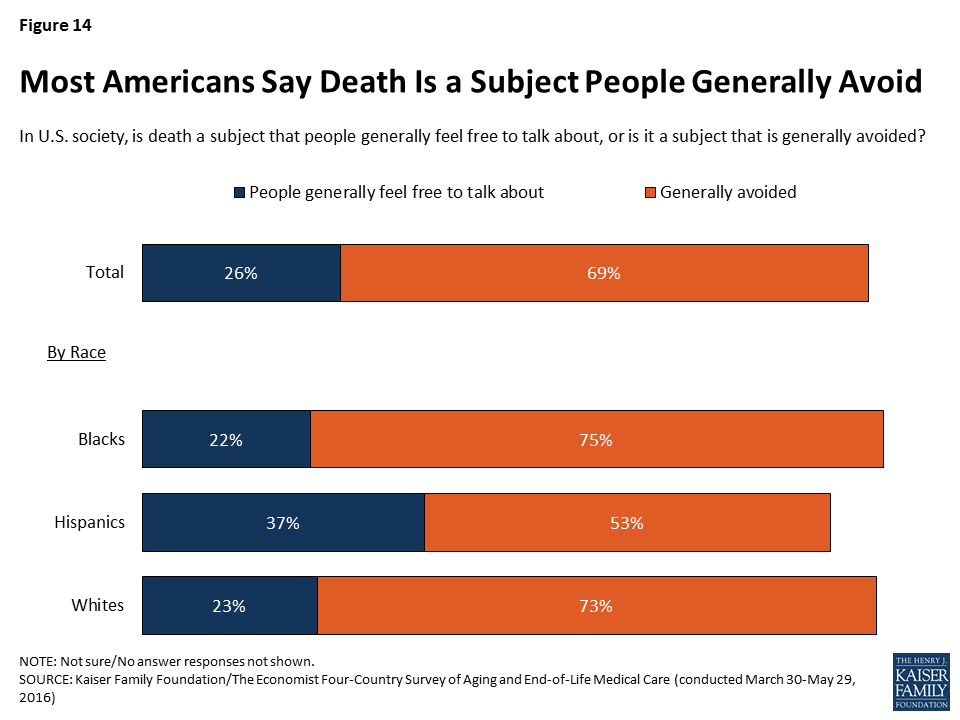
Like residents of each of the countries surveyed (Italy, Japan, and Brazil), a majority (69 percent) of Americans say that in U.S. society, death is a subject that is generally avoided. Perhaps reflecting cultural norms in different racial and ethnic communities, Hispanic Americans (37 percent) are more likely than Blacks (22 percent) or whites (23 percent) to say that death is a subject people generally feel free to talk about.

Figure 14: Most Americans Say Death Is a Subject People Generally Avoid

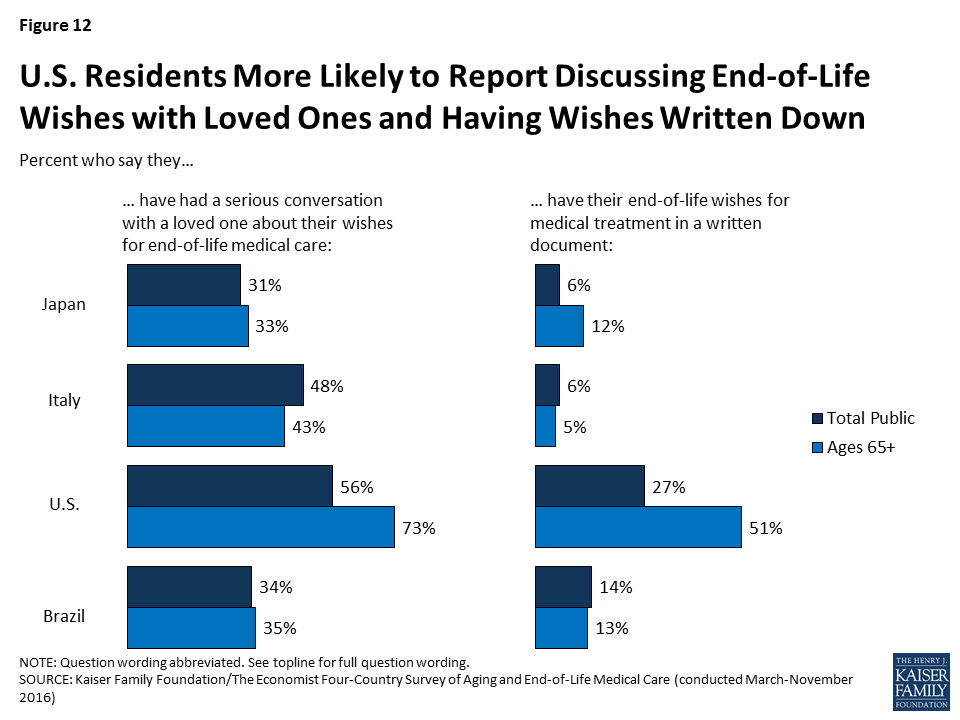
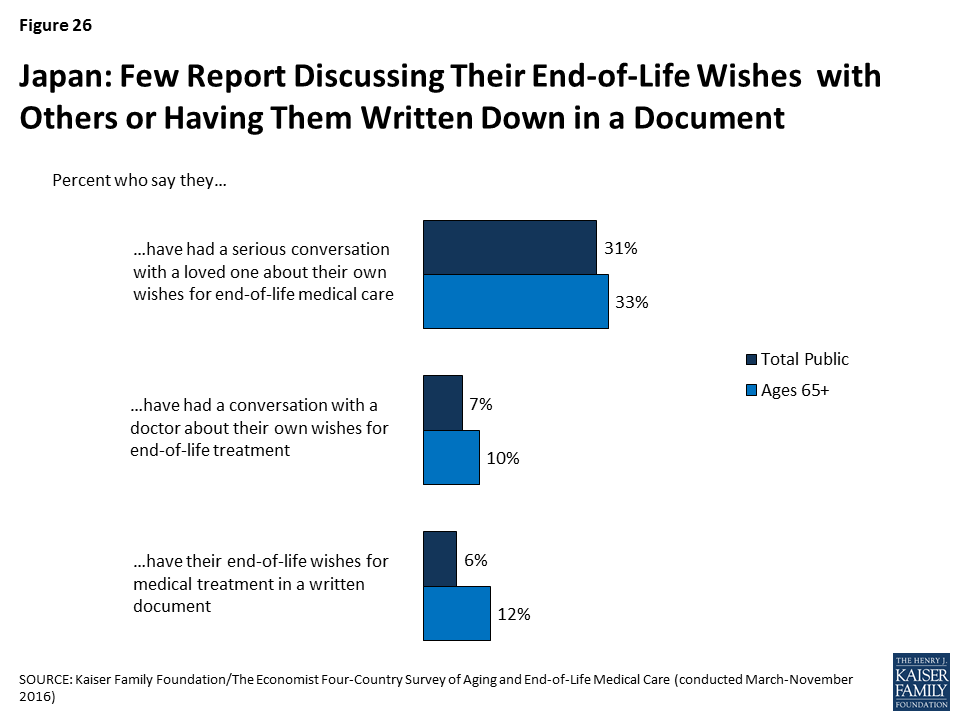
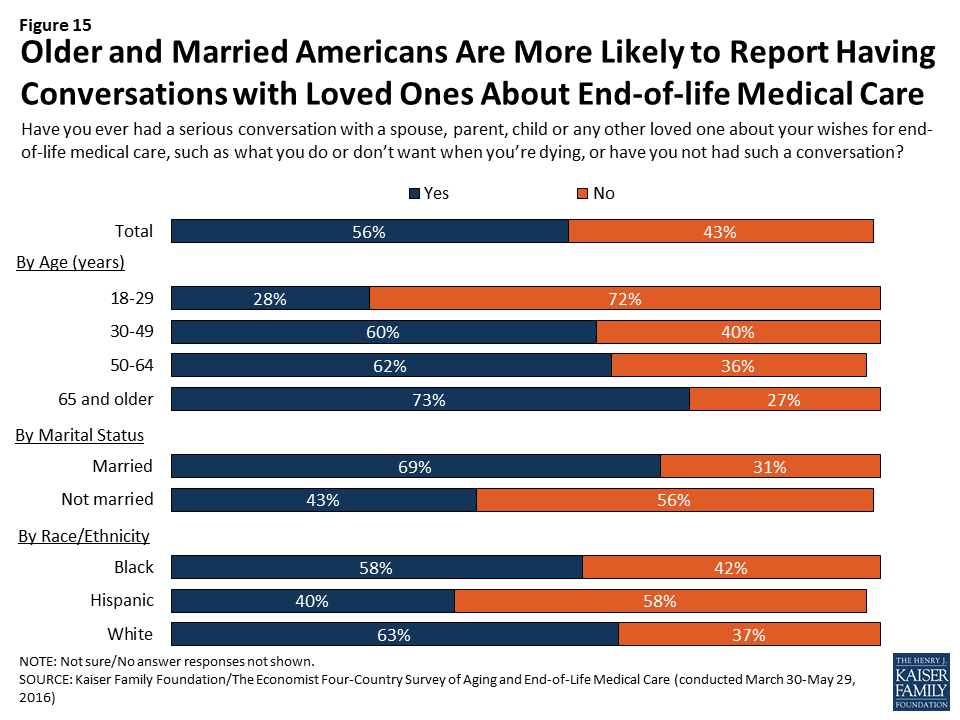
Despite this sense of cultural norms, over half (56 percent) of U.S. adults say they’ve had a serious conversation with a spouse, parent, child, or any other loved one about their own wishes for end-of-life medical care. The share who say they’ve had a serious conversation rises from 28 percent of adults under age 30 to 73 percent of those ages 65 and over. Those who are married (69 percent) are also much more likely than those who are not married (43 percent) to say they’ve had such a conversation. Interestingly, even though Hispanics are more likely than whites or Blacks to say that death is a subject that people generally feel free to talk about, Hispanics are less likely to say they’ve had a conversation with a loved one about their own wishes for end-of-life medical care. While Hispanics in the U.S. are younger on average than whites, this difference persists even after controlling for age and other demographic factors. Among people of all races/ethnicities, those who have not had this type of conversation with a loved one cite a variety of reasons, the most common being that they don’t think it’s necessary because they’re not sick yet (42 percent say this is a major reason).

Figure 15: Older and Married Americans Are More Likely to Report Having Conversations with Loved Ones About End-of-life Medical Care

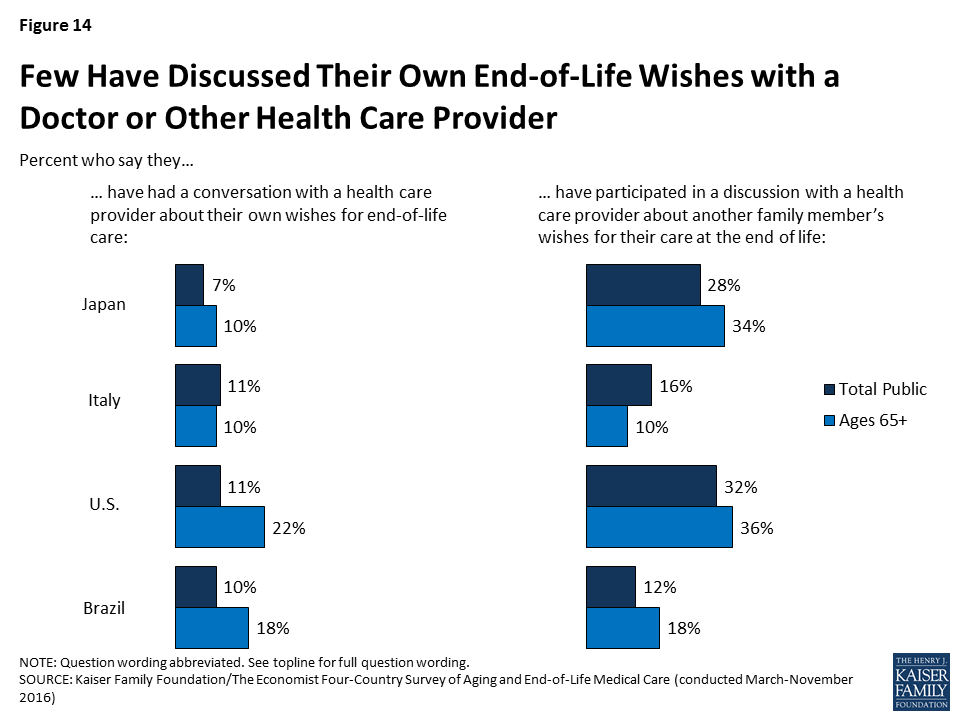
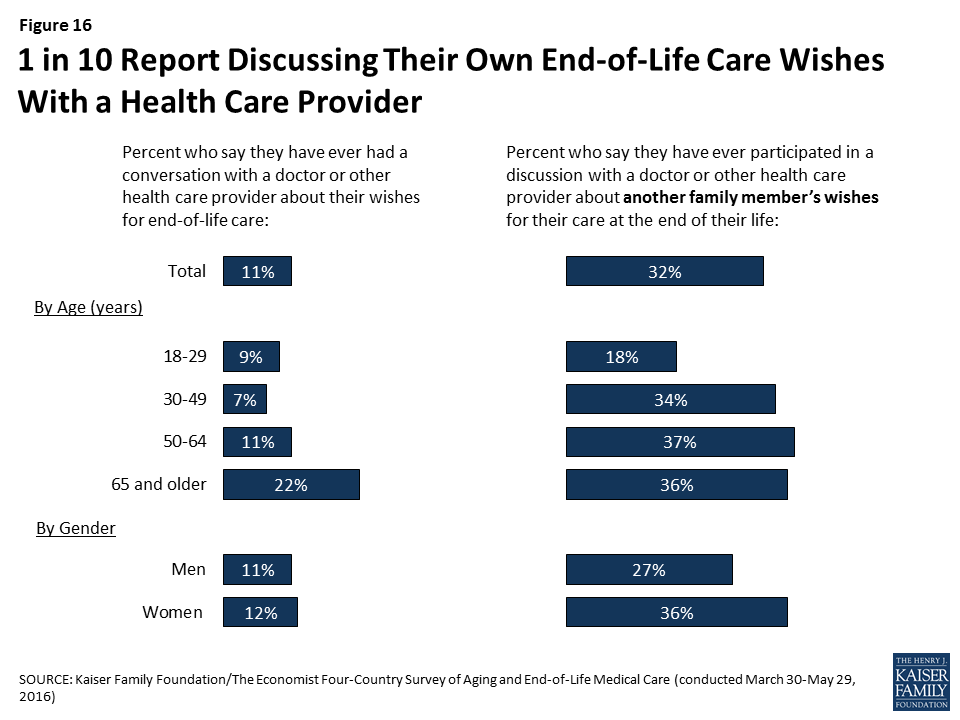
Americans are substantially less likely to say they’ve discussed their wishes for end-of-life medical care with a doctor than to say they’ve done so with a loved one. Overall, just one in nine (11 percent) say they’ve ever had such a conversation with a doctor or other health care provider, including 22 percent of those ages 65 and over. About a third (32 percent) say they’ve participated in a discussion with a doctor or other health care provider about another family member’s wishes for their care at the end of life, a share that is somewhat higher among those ages 30 and over, and also higher among women than men (36 percent versus 27 percent).

Figure 16: 1 in 10 Report Discussing Their Own End-of-Life Care Wishes With a Health Care Provider

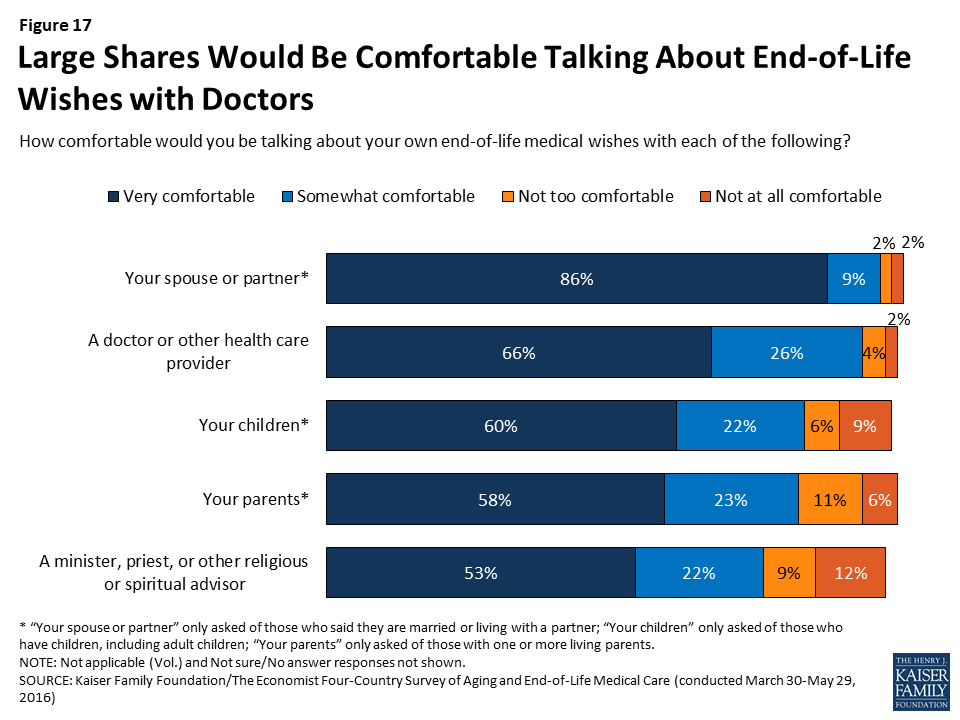
While few report having conversations with health care providers about their own wishes for end-of-life care, lack of comfort in discussing these issues with doctors does not seem to be a major barrier. The vast majority (92 percent) say they would be at least somewhat comfortable talking with a doctor or health care provider about their end-of-life medical wishes, including two-thirds (66 percent) who say they’d be very comfortable. This is similar to the share who say they’d be comfortable discussing end-of-life issues with their spouse or partner (94 percent), and higher than the share who would be comfortable having such discussions with their children (82 percent), their parents (81 percent), or a minister, priest, or other religious or spiritual advisor (75 percent). Further, there is broad support among the public for having Medicare cover discussions between doctors and patients about end-of-life treatment options (78 percent).

Figure 17: Large Shares Would Be Comfortable Talking About End-of-Life Wishes with Doctors

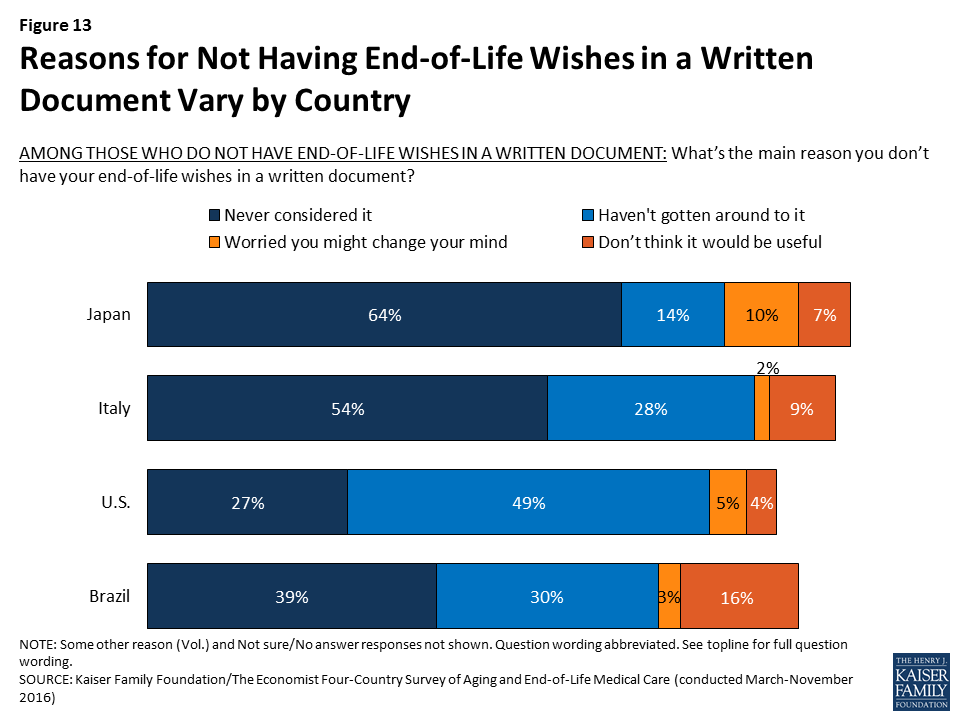
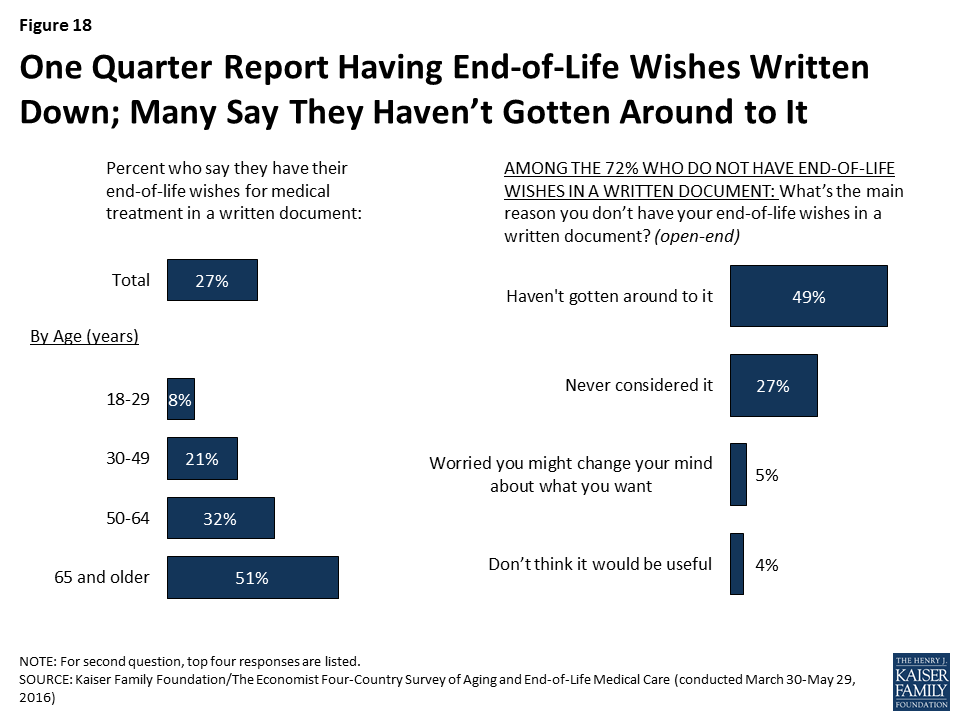
Discussions with health care providers about one’s wishes for end-of-life medical care are one part of what is often referred to as “advance care planning.”2  Another component of such planning is writing one’s wishes into a document, sometimes referred to as an “advance directive.” Overall, about a quarter (27 percent) of U.S. adults say they have their end-of-life wishes for medical treatment in a written document, ranging from just 8 percent of those under age 30 to about half (51 percent) of those ages 65 and over. Among the 72 percent who do not have their wishes written down, the most common reason is simply not having gotten around to it (49 percent), followed by never having considered it (27 percent). Few say they’re worried they might change their mind about what they want (5 percent) or that they don’t think it will be useful (4 percent).

Figure 18: One Quarter Report Having End-of-Life Wishes Written Down; Many Say They Haven’t Gotten Around to It

Besides the large difference by age, the survey also finds that members of racial and ethnic minority groups, and those with lower incomes and lower levels of education are less likely than whites and those with higher levels of income and education to say they have their wishes for end-of-life medical treatment in a written document. These differences also persist after controlling for age and other demographics.

Table 1: Wishes for End-of-Life Care in a Written Document by Race and Socioeconomic Status
Race/EthnicityEducationHousehold Income
Non-Hispanic WhitesNon-Hispanic BlacksHispanicsHigh school or lessSome collegeCollege graduateLess than $40K$40K- $89.9KOver $90K
Percent who say they have their end-of-life wishes for medical treatment in a written document35%15%11%20%33%33%20%30%33%

Experiences with the Death of a Loved One

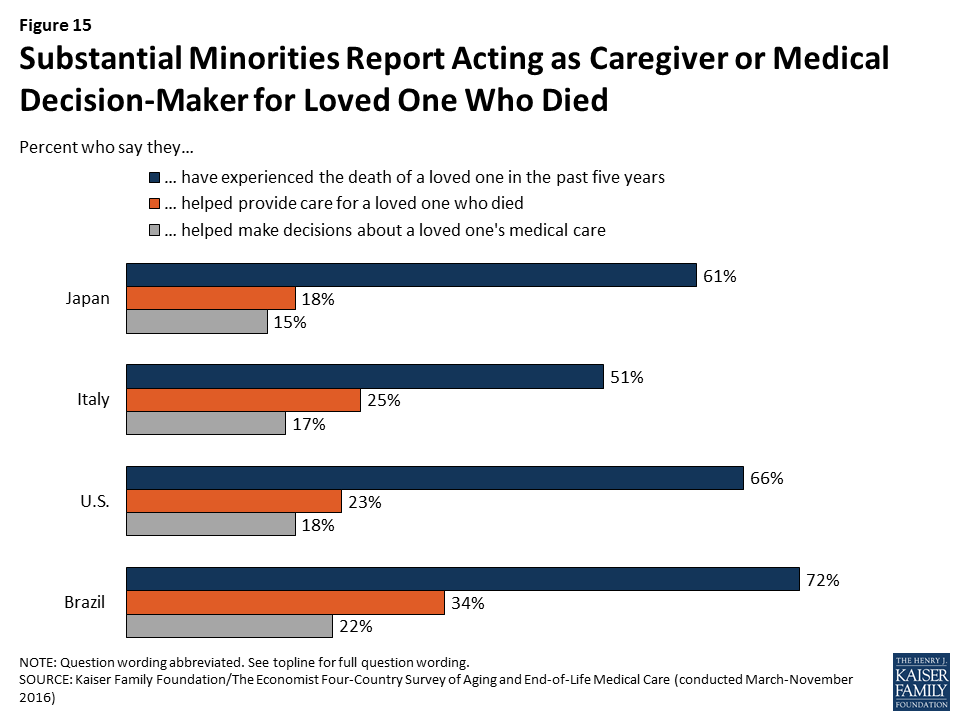
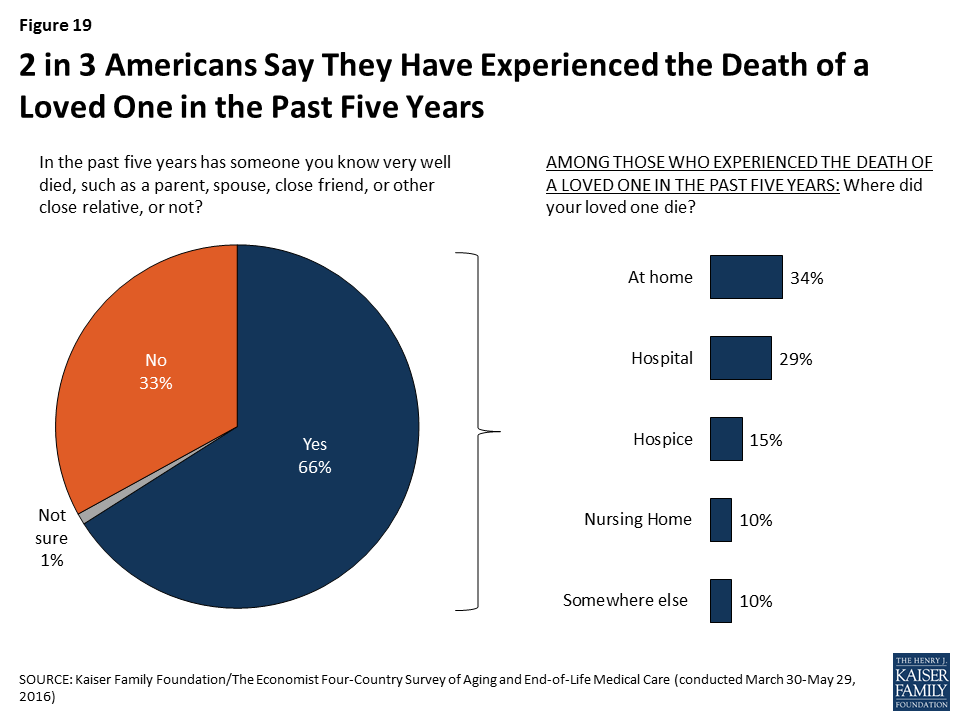
Roughly two-thirds (66 percent) of U.S. adults say they have experienced the death of someone close to them in the past five years. This includes 19 percent who experienced the death of a parent, 15 percent who experienced the death of a close friend, and 12 percent who experienced the death of a sibling. One in three (34 percent) say their loved one died at home, while a similar share (29 percent) say they died in a hospital, 15 percent say they died in a hospice, and 10 percent in a nursing home. Overall, about half (53 percent) of those who experienced the death of a loved one say that person either died in a hospice or received hospice care services before they died.

Figure 19: 2 in 3 Americans Say They Have Experienced the Death of a Loved One in the Past Five Years

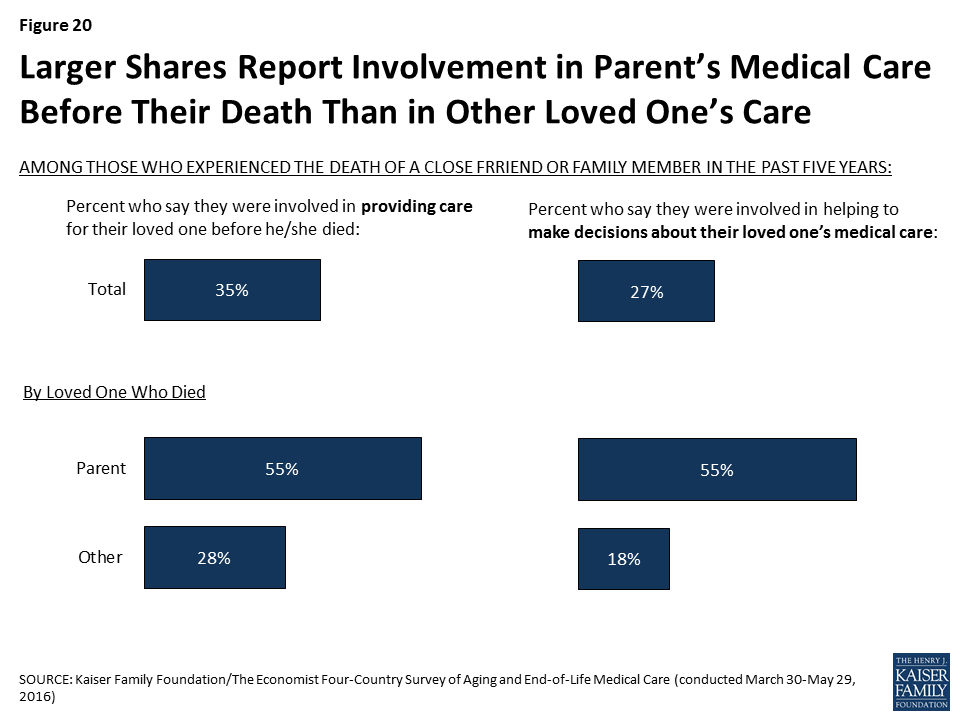
Family members often serve as caregivers or medical decision-makers when a loved one is ill and approaching the end of life. The survey finds that just over a third (35 percent) of those who experienced the death of a loved one in the past five years (accounting for 23 percent of the public overall) say that they were involved in providing care for the person before they died. Nearly as many (27 percent of those who experienced a death, or 18 percent of the public overall) report that they were involved in helping to make decisions about their loved one’s medical care. Those who experienced the death of a parent were much more likely than those who experienced the death of another type of loved one to say that they were involved in providing care (55 percent versus 28 percent) and making medical decisions (55 percent versus 18 percent).

Figure 20: Larger Shares Report Involvement in Parent’s Medical Care Before Their Death Than in Other Loved One’s Care

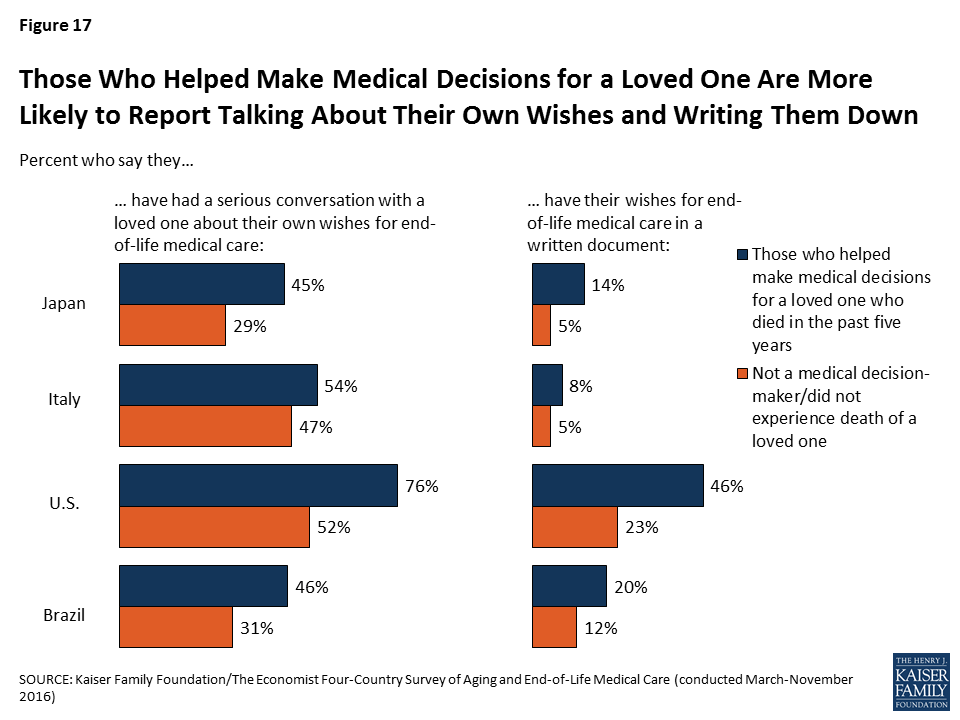
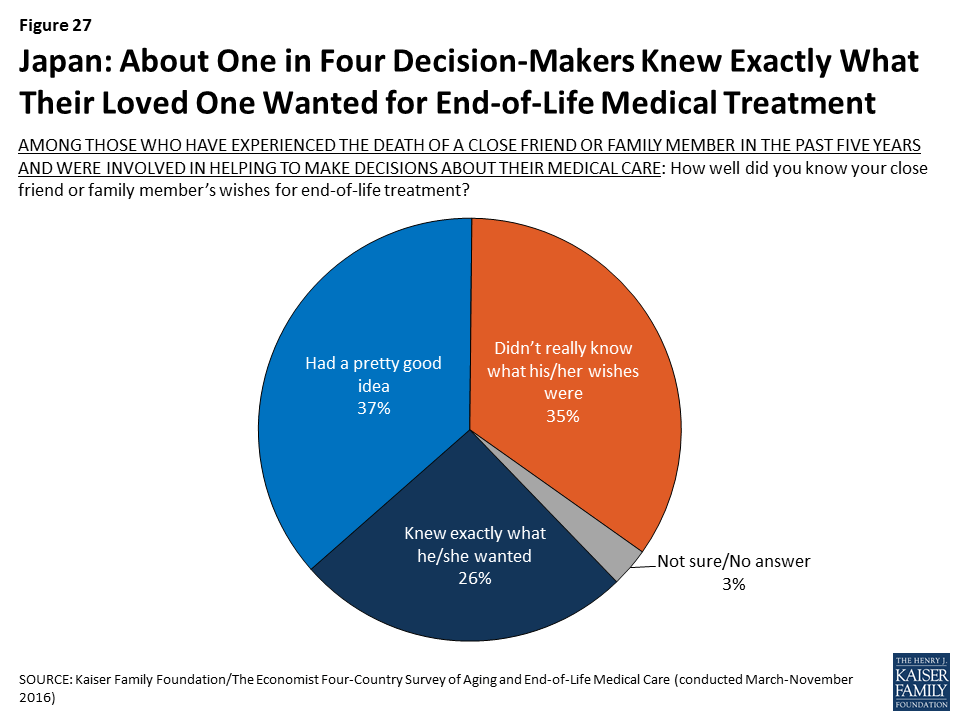
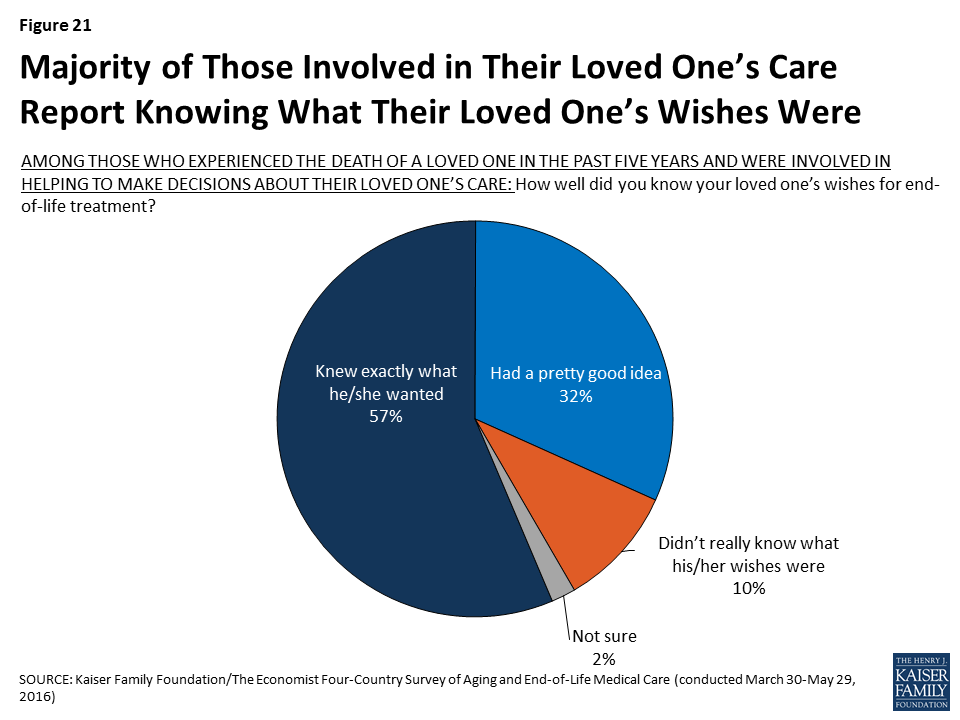
Most family members who were involved in making medical decisions for a loved one feel that they had a good understanding of their loved one’s wishes for end-of-life treatment. Among this group of decision-makers, about six in ten (57 percent) say they knew exactly what the person wanted, and about a third (32 percent) say they had a pretty good idea; one in ten (10 percent) report that they didn’t really know what the person’s wishes were. Furthermore, about three-quarters (73 percent) of this group reports that they have participated in a discussion with a doctor or other health care provider about another family member’s wishes for end-of-life medical care, a much higher share than among the public at large.

Figure 21: Majority of Those Involved in Their Loved One’s Care Report Knowing What Their Loved One’s Wishes Were

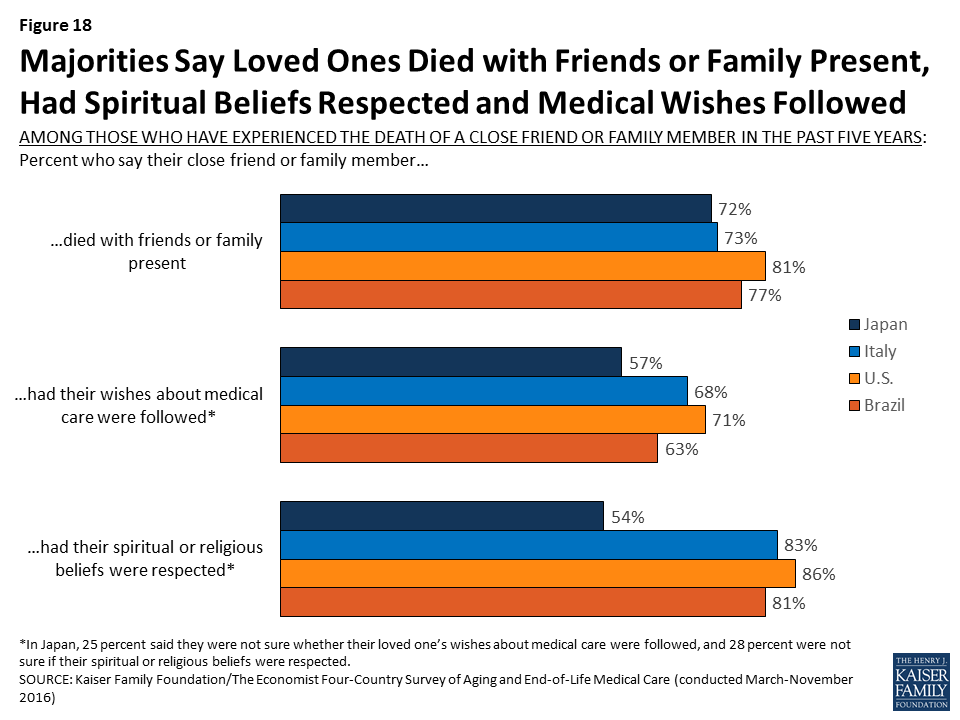
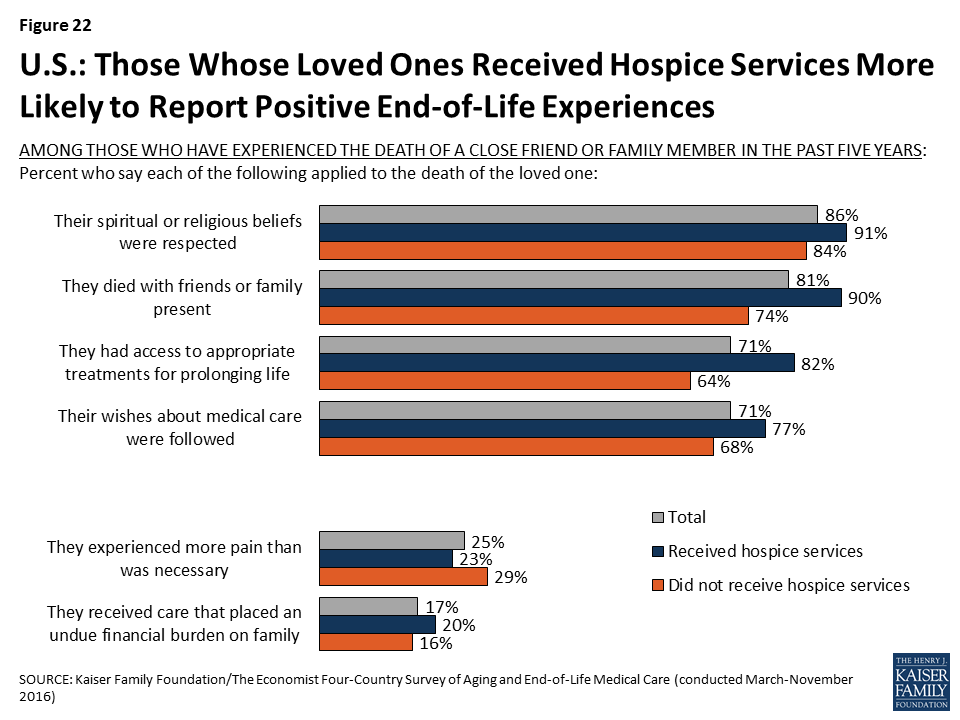
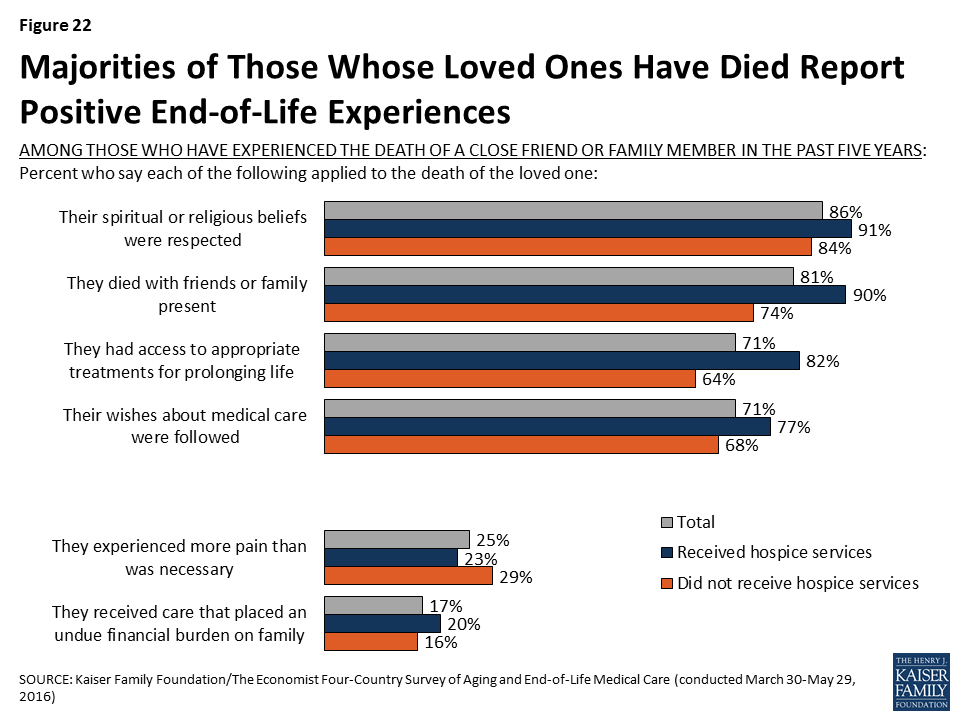
On the whole, few of those who experienced the death of a loved one describe negative experiences with end-of-life medical care. Large majorities say their loved one’s religious and spiritual beliefs were respected (86 percent), they died with friends or family present (81 percent), their wishes about medical care were followed (71 percent), and they had access to appropriate medical treatments for prolonging life (71 percent). Those who say their family member received hospice services before death are more likely than those who didn’t to say the person’s religious and spiritual beliefs were respected (91 percent versus 84 percent), they died with friends or family present (90 percent versus 74 percent), their wishes about medical care were followed (77 percent versus 68 percent), and they had access to appropriate medical treatments for prolonging life (82 percent versus 64 percent).

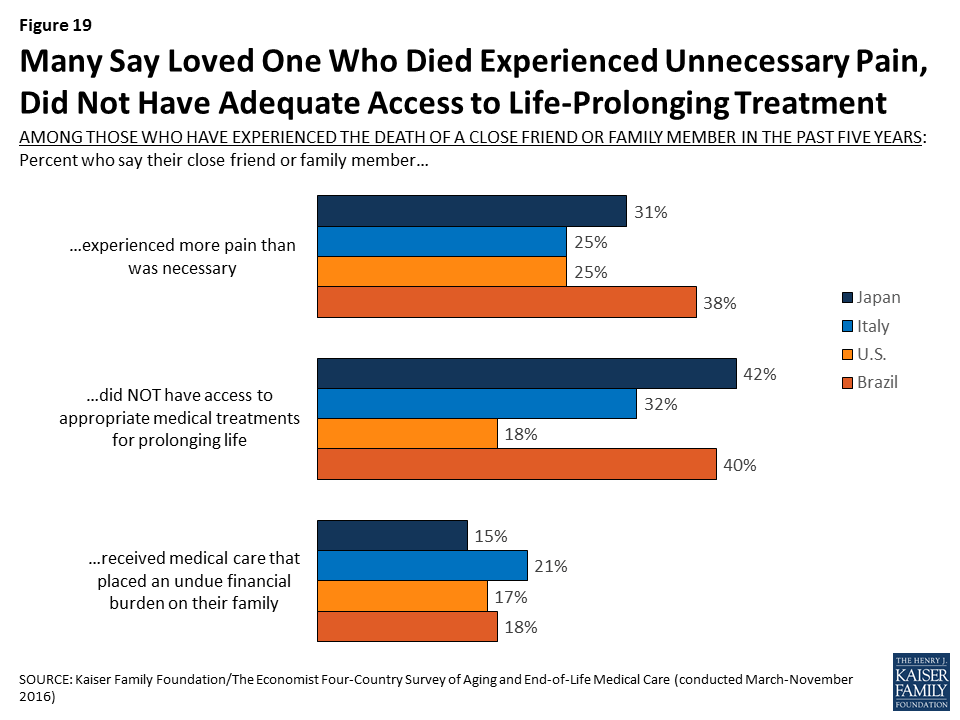
Still, small but important shares report negative experiences related to a loved one’s death. A quarter (25 percent) say their loved one experienced more pain than was necessary, and 17 percent say the person received medical care that placed an undue financial burden on the patient’s family. These shares are not statistically different between those whose family member received hospice services and those who did not.

Figure 22: Majorities of Those Whose Loved Ones Have Died Report Positive End-of-Life Experiences

Methodology

The Kaiser Family Foundation/The Economist Four-Country Survey on Aging and End-of-Life Medical Care was conducted among nationally representative random digit dial (RDD) telephone (landline and cell phone) samples of adults ages 18 and older, living in the United States (including Alaska and Hawaii), Brazil, Italy, and Japan (Note: persons without a telephone could not be included in the random selection process). SSRS carried out the sampling and weighting for all countries, and conducted computer-assisted telephone interviews for the U.S. sample. Interviews in Brazil were carried out by Cido International, and interviews in Japan and Italy were carried out by European Field Group, under the direction of SSRS. RDD landline and cell phone samples were provided by Marketing Systems Group (MSG) for the U.S., Sample Answers for Brazil, and Sample Solutions Europe (SSE) for Japan and Italy. Interview languages, field dates, and sample sizes for each country are shown in the table below. Teams from The Economist and the Kaiser Family Foundation worked together to develop the survey questionnaire and analyze the data. The Kaiser Family Foundation paid for the fieldwork costs associated with the survey. Each organization is responsible for its content.

Due to the multi-national design, the questionnaire was tested and translated in multiple stages. The first step involved a live-interview telephone pretest of the English questionnaire with U.S. respondents. Revisions to the English questionnaire were made following the pretest in order to shorten the survey instrument and improve respondent comprehension of questions. Following the English pretest, the questionnaire was translated into Spanish (for interviewing in the U.S.), Italian, Japanese, and Portuguese. Translations were reviewed by a team of professional translators and by regional experts at The Economist. A second pretest was conducted in Italy, Japan, and Brazil, after which further revisions were made to the non-English versions of the questionnaire.

In each country, to randomly select a household member for the landline samples, respondents were selected by asking for the adult male or female currently at home who had the most recent birthday based on a random rotation. If no one of that gender was available, interviewers asked to speak with the adult of the opposite gender who had the most recent birthday. For the cell phone samples, interviews were conducted with the adult who answered the phone.

Multi-stage weighting processes were applied separately for each country to ensure an accurate representation of each country’s national adult population. The first stage of weighting involved corrections to account for the fact that respondents with both a landline and cell phone have a higher probability of selection. The second weighting stage was designed to make demographic adjustments to the sample to match national population estimates. In the U.S., the sample was balanced to match known adult-population parameters using data from the Census Bureau’s 2015 March supplement of the Current Population Survey (CPS) and phone use parameters from the July-December 2015 early release estimates for the National Health Interview Survey. The weighting parameters used for the U.S. were age, gender, education, race/ethnicity, marital status, census region, and telephone use. In Italy, the sample was balanced using estimates from Instituto Nazionale di Statistica’s population projections based on 2010-2011 Census reports, with weighting parameters for age, education, region, and region by density. In Japan, the sample was balanced to match population parameters from Japan’s Statistical Yearbook 2015, based on age, education, and region by prefecture. In Brazil, the sample was balanced using the 2010 Population Census conducted by Instituto Brasileiro de Geografia de Estatística, based on age, education, region, and rural status. All statistical tests of significance account for the effect of weighting.

At the end of the field period, SSRS completed several data validation processes on the international data that included: internal validity checks, testing for straightlining, and analyzing paradata (interviewer workload, interview length, interview time, and overlap of interviews). The Kaiser Family Foundation, along with SSRS, also conducted a percent-match procedure to identify cases that share a high-percentage of identical responses to a large set of questions. This extra validation measure allows for detection of possible duplicate data, whether as a result of intentional falsification, or due to errors in data-processing.

The margin of sampling error including the design effect for each country sample is plus or minus 4 percentage points. For results based on subgroups, the margin of sampling error will be higher; sample sizes and margins of sampling error for subgroups are available by request. Note that sampling error is only one of many potential sources of error in this or any other public opinion poll. Kaiser Family Foundation public opinion and survey research is a charter member of the Transparency Initiative of the American Association for Public Opinion Research.

CountryField datesLanguage(s)Total sample size (unweighted)Cell phone sampleLandline sampleM.O.S.E
U.SMarch 30-May 29English and Spanish1,006739268±4 percentage points
ItalySeptember 15-October 3Italian1,000600400±4 percentage points
JapanSeptember 10-October 20Japanese1,000500500±4 percentage points
BrazilAugust 26-November 12Portuguese1,233714519±4 percentage points


Endnotes

  1. U.S. Census Bureau, Projections of the Size and Composition of the U.S. Population: 2014 to 2060, March 2015. http://www.census.gov/content/dam/Census/library/publications/2015/demo/p25-1143.pdf ↩︎
  2. National Institute on Aging, Advance Care Planning, February 2012. https://www.nia.nih.gov/health/publication/advance-care-planning   ↩︎

Views and Experiences with End-of-Life Medical Care in Japan, Italy, the United States, and Brazil: A Cross-Country Survey

Authors: Liz Hamel, Bryan Wu, and Mollyann Brodie
Published: Apr 27, 2017
Section:
0 / 0

Overview

In partnership with The Economist, the Kaiser Family Foundation conducted a cross-country survey of adults in Japan, Italy, the United States, and Brazil about people’s views and experiences related to aging and end-of-life medical care. These four countries are each at a different stage of population aging. On one end of the spectrum, Japan is the world’s oldest country (27 percent are ages 65 and older) and has the longest life expectancy along with a shrinking overall population . Italy is not far behind, with a population that is 21 percent elderly, the largest proportion among European nations . The United States is in the middle of the aging trajectory, with the share of the population ages 65 and older expected to grow from about 15 percent in 2015 to 24 percent by 2060 . At the other end of the spectrum, Brazil has a relatively young population today, but due to recent changes in mortality and fertility, the share of the population that is elderly is expected to double (from 7 percent to 14 percent) by 2031. These four countries also reflect different cultural and institutional considerations when it comes to preparing and providing care for those near the end of life, and both the demographic and cultural differences are reflected in the survey results reported here.

This report summarizes the overall survey results with comparisons across the four countries, and includes sections highlighting particular findings in Japan, Italy, and Brazil. A separate report with more detail on the U.S. results is available here.

Coverage from The Economist

What people want in their final months

Mending Mortality

What people want at the end of life

Summary

Four-Country Comparison: Five Key Takeaways

  1. Despite the demographic and cultural differences between these four countries, there are some common themes that emerge from the survey results. For example, in each country surveyed a majority say their government is not well-prepared to deal with the aging population, and residents are more apt to give their health care system a negative rating than a positive one when it comes to providing end-of-life care. In another area of commonality, majorities in all four countries express a preference to die at home, but fewer say they expect to die at home than say that is their wish. Large majorities across countries also feel that doctors should be completely honest with seriously ill patients, regardless of their prognosis.
  2. When asked about priorities for health care at the end of people’s lives, majorities across three of the four countries (Japan, Italy, and the U.S.) prioritize reducing pain and stress over extending life as long as possible. Similarly, when asked what is important in thinking about their own death, “living as long as possible” ranks last on a list of seven possible factors in these three countries. Brazil stands out as an exception on these measures, with a larger share placing a priority on extending life, both in general and for themselves personally.
  3. When it comes to discussing and planning for the end of life, majorities across countries say death is a subject that is generally avoided rather than something people feel free to talk about. However, the U.S. stands out from other countries, with higher shares reporting having conversations with loved ones about their end-of-life wishes and having these wishes written down.
  4. About one in five adults in each country surveyed say they were involved in helping to make medical decisions for a loved one who died in the past five years. Acting as a medical decision-maker for someone who died appears to influence people’s own personal end-of-life preparations; in Japan, the U.S., and Brazil, those who served as a medical decision-maker for someone else are more likely to say they’ve had a serious conversation with a loved one about their own end-of-life wishes, and to have those wishes in a written document.
  5. While most of those who experienced the death of a loved one report positive experiences overall, some negative reports are not uncommon. Majorities across countries say their loved one’s wishes about medical care were followed, that their spiritual and religious beliefs were respected, and that they died with friends or family present. Still, substantial shares of those who experienced the death of a loved one (particularly in Japan and Brazil) say the person experienced more pain than was necessary (about four in ten in Brazil, about three in ten in Japan, and a quarter in the U.S. and Italy) or that they did not have access to appropriate medical treatments for prolonging life (about four in ten in Japan and Brazil, one-third in Italy, and 18 percent in the U.S.). About one in five of those experiencing the death of a loved one across countries say their loved one received medical care that placed an undue burden on the patient’s family.

Key Findings Across Countries

Perceptions of the Aging Population and Preparedness of Government, Health System, and Families

Across the four countries surveyed, the share of the public perceiving population aging as a major problem corresponds roughly to each country’s place on the aging trajectory. Nine in ten adults in Japan and about six in ten in Italy (the two “older” countries in the survey) see the growing number of older people in their country as a major problem, compared with about four in ten in the “younger” countries of the U.S. and Brazil.

Figure 1: Majorities in Italy & Japan, Smaller Shares in U.S. & Brazil Perceive Aging Population as a Major Problem

Across all four countries surveyed, majorities say the government is “not too prepared” or “not at all prepared” to deal with the aging population. Preparedness ratings are somewhat more mixed when it comes to the country’s health care system and families. In Italy and Brazil, majorities see the health care system as unprepared, while residents of the U.S. and Japan are more evenly divided between thinking the health care system is prepared and not prepared. Asked how prepared families are to deal with the aging population, majorities in Italy, Japan, and Brazil say families are not prepared, while Americans are more evenly split.

Figure 2: Across Countries, Many See Government, Health System, and Families as Unprepared to Deal with Aging Population

Another similarity across countries is in residents’ relatively negative ratings of their health care systems. In each country, the public is more likely to rate their health care system as “fair” or “poor” than to say it is “excellent” or “very good.” This is true when residents are asked to rate the health care system in general and also when they are asked about end-of-life medical care specifically. Residents of Brazil – a country whose state-run health care system has been plagued by problems – are particularly negative on these measures, with about nine in ten giving a “fair” or “poor” rating.

Figure 3: Most Give Their Country’s Health System Negative Ratings in General and When It Comes to End-of-Life Medical Care

Residents of the four countries differ somewhat in their views of who should bear the greatest responsibility for financing care for an aging population. In Italy and Brazil, large majorities of around eight in ten say it’s the government’s responsibility to pay for people’s health and long-term care needs as they age, as do just over half in Japan. Views in the U.S. are more evenly split between those who say the responsibility should fall mostly on individuals and families (44 percent) and those who say it’s the responsibility of the government (42 percent). These views are largely divided by party identification, as views of government responsibility generally are in the U.S., with Democrats more likely to place the responsibility on government and Republicans more likely to place it on families.

Figure 4: Majorities in All Countries Except U.S. Feel Government Responsible for Financing Aging Population’s Health Needs

Outside of financial responsibility, most people across countries see a large role for families in helping aging family members. Solid majorities say that it is the duty of children to help take care of their parents’ needs as they get older, ranging from 61 percent in Japan to 91 percent in Brazil. With the exception of Italy, in each country older adults themselves are less likely than their younger counterparts to say it is the children’s duty.

Figure 5: Majorities Across Countries Say It Is Children’s Duty to Help Care for Aging Parents; Older Adults Less Likely to Say So

Priorities at the End of Life

The survey reveals a difference between residents of Brazil and those of the other three countries surveyed when it comes to the relative priority placed on extending life. When asked what should be more important when it comes to health care at the end of people’s lives, half of Brazilians (50 percent) choose “preventing death and extending life as long as possible” while about four in ten (42 percent) choose “helping people die without pain, discomfort, and stress.” This stands in contrast to Japan, Italy, and the U.S., where large majorities – between 68 percent and 82 percent – prioritize reducing pain and stress over extending life.

Figure 6: Majority in U.S., Italy, and Japan Prioritize Reducing Pain and Stress over Prolonging Life; Brazilians More Divided

Similarly, when asked what is important in thinking about their own death, Brazilians stand out in the relative importance placed on extending life. In Japan, Italy, and the U.S., “living as long as possible” ranks last on the list of seven possible factors, with a substantially lower share saying it is “extremely important” to them compared with any other factor. By contrast, “living as long as possible” ranks fourth in Brazil, with 26 percent saying it is “extremely important,” similar to the shares who say the same about other priorities like having loved ones around and not burdening one’s family financially. These differences between Brazil and the other countries surveyed may have something to do with Brazil’s relatively younger population; across countries, younger adults are generally more likely than older adults to place greater emphasis on extending life.

In terms of what is most important to people in thinking about their own death, in the U.S. and Japan, where medical care is generally expensive, “making sure your family is not burdened financially by your care” ranks at the top of the list.1  In Italy, the top concern is “having loved ones around you,” followed closely by “making sure your wishes about medical care are followed” and “being comfortable and without pain.” In Brazil, the top concern is “being at peace spiritually.”

Figure 7: Personal Priorities for Death

In considering their own death, individuals across countries share the desire to die at home, along with the expectation that this desire is not likely to be fulfilled. Across the four countries surveyed, majorities say if they had the choice, they would prefer to die at home. However, when asked where they think they are most likely to die, a much smaller share in each country say they expect to die at home. This pattern is starkest in Japan – a country with 13.4 hospital beds per 1,000 residents (roughly 4 times as many as any other country surveyed) – where 55 percent say they would prefer to die at home, but 58 percent think they are most likely to die in a hospital.2 

Figure 8: Most Would Prefer to Die at Home, Fewer Think It’s Likely

Who Should Have Control of Medical Decisions at the End of Life?

There is some variation across the countries surveyed in views of whether doctors or patients and their families should have the greater say in decisions about end-of-life medical treatments. The vast majority of adults in Japan (88 percent) and the U.S. (87 percent) say that patients and their families should have the greater say, while closer to half in Italy (52 percent) and Brazil (47 percent) say the same. By contrast, substantial shares of Brazilians (40 percent) and Italians (30 percent) say that doctors should have the greater say in which medical treatments to pursue for seriously ill patients who are near the end of their lives, compared with about one in ten in Japan and the U.S.

Interestingly, however, the two countries surveyed (Brazil and Italy) where residents are least likely to say patients and their families should have the greater say in end-of-life medical decisions are also the most likely to say people in their own country have too little control over decisions about their own medical care at the end of life (79 percent and 59 percent, respectively). About half (49 percent) of U.S. adults also feel that people have too little control over these decisions. In Japan, about half (49 percent) feel that people in their country have about the right amount of control, while a smaller share (36 percent) say they have too little.

Figure 9: Views on Who Should Have Greater Say in Decisions About End-of-Life Care Medical Treatment Vary by Country

Despite these differences, most people across the countries surveyed agree that doctors should be honest with patients regardless of their prognosis. Large majorities say that when a patient is seriously ill, it is more important for doctors to be completely honest even if there is little chance of recovery, while a small share across countries believe it is more important for doctors to emphasize hope for seriously ill patients.

Figure 10: Across Countries, Most Want Doctors to Be Completely Honest Regardless of Prognosis

Talking about Death and Planning Ahead

Across countries, majorities say death is a subject that is generally avoided rather than something people feel free to talk about. However, the U.S. stands out from other countries, with higher shares reporting having conversations with loved ones about end-of-life wishes and having these wishes written down.

When it comes to the subject of death, majorities ranging from 57 percent in Japan to 69 percent in the U.S. say that death is a subject that is generally avoided in their country’s society, while much smaller shares (ranging from 26 percent in the U.S. to 38 percent in Japan) say death is a subject people generally feel free to talk about.

Figure 11: Across Countries, Public Says Death Is a Subject People Generally Avoid

This reluctance to talk about death is reflected in people’s self-reported conversations. Fewer than half of adults (including those ages 65 and over) in Italy, Japan, and Brazil say they’ve had a serious conversation with a loved one about their own wishes for end-of-life medical care. These conversations are somewhat more common in the U.S., with just over half the general population and about three-quarters of Americans ages 65 and over saying they’ve had such a conversation. Having one’s end-of-life medical wishes in a written document is also more common in the U.S.; a quarter of U.S. adults (27 percent) and half of U.S. seniors (51 percent) say they do, compared with fewer than 1 in 6 in other countries.

Figure 12: U.S. Residents More Likely to Report Discussing End-of-Life Wishes with Loved Ones and Having Wishes Written Down

Among those who do not have their wishes written down, the top reason in Italy, Japan, and Brazil is “you never considered it,” suggesting that writing down one’s wishes is not a commonly discussed practice in these countries. By contrast, the top reason in the U.S. is “you just haven’t gotten around to it,” suggesting that Americans are more likely than residents of the other countries surveyed to think of writing down their medical wishes as a common practice and something they expect to do at some point in their lives.

Figure 13: Reasons for Not Having End-of-Life Wishes in a Written Document Vary by Country

If conversations with loved ones about end-of-life wishes are relatively uncommon, conversations with health care professionals about these issues are even rarer. Just about one in ten in each country say they’ve had a conversation about their wishes for end-of-life medical treatment with a doctor or other health care provider, rising to 22 percent among seniors in the United States. A somewhat larger share – roughly three in ten – in the U.S. and Japan say they’ve participated in a discussion with a health care provider about another family member’s wishes for their care at the end of life, but still the majority say they have not participated in such a conversation.

Figure 14: Few Have Discussed Their Own End-of-Life Wishes with a Doctor or Other Health Care Provider

Experiences with Death of a Loved One

At least half of people in each of the four countries surveyed report experiencing the death of someone close to them within the past five years, including substantial minorities who say they helped provide care or helped make medical decisions for the person who died. Overall, about one-fifth in Japan, one-quarter in the U.S. and Italy, and one-third in Brazil say they helped to provide care for a loved one who died in the past five years. About one in five in each country say they were involved in helping to make medical decisions for someone who died in that time frame.

Figure 15: Substantial Minorities Report Acting as Caregiver or Medical Decision-Maker for Loved One Who Died

Among those who say they acted as a medical decision-maker for a loved one who died, residents of the U.S. are more likely than residents of the other countries surveyed to say they had a good idea of their loved one’s end-of-life wishes. A majority of Americans who served as a medical decision-maker for someone who died say they knew exactly what the person wanted (57 percent) or had a pretty good idea (32 percent), while just one in ten say they didn’t really know what their loved one wanted. By contrast, between a third and four in ten in Japan, Italy, and Brazil say they didn’t really know what their loved one’s wishes were before they died. This difference may be related to the finding noted above that Americans are more likely to report having conversations with loved ones about end-of-life wishes.

Figure 16: Awareness of Loved Ones’ End-of-Life Wishes Among Medical Decision-Makers Varies by Country

Acting as a medical decision-maker for someone who died also appears to influence people’s own personal end-of-life preparations; in Japan, the U.S., and Brazil, those who served as a medical decision-maker for someone else are significantly more likely to say they’ve had a serious conversation with a loved one about their own end-of-life wishes, and to have those wishes in a written document.

Figure 17: Those Who Helped Make Medical Decisions for a Loved One Are More Likely to Report Talking About Their Own Wishes and Writing Them Down

While most of those who experienced the death of a loved one report positive experiences overall, some negative reports are not uncommon. Among those who experienced the death of someone close to them in the past five years, majorities across countries say their loved one’s wishes about medical care were followed, that their spiritual and religious beliefs were respected, and that they died with friends or family present.

Figure 18: Majorities Say Loved Ones Died with Friends or Family Present, Had Spiritual Beliefs Respected and Medical Wishes Followed

Still, substantial shares of those who experienced the death of a loved one – particularly in Japan and Brazil – say the person experienced more pain than was necessary (about four in ten in Brazil, three in ten in Japan, and a quarter in the U.S. and Italy) or that they did not have access to appropriate medical treatments for prolonging life (about four in ten in Japan and Brazil, one-third in Italy, and 18 percent in the U.S.). About one in five of those experiencing the death of a loved one across countries say their loved one received medical care that placed an undue burden on the patient’s family.

Figure 19: Many Say Loved One Who Died Experienced Unnecessary Pain, Did Not Have Adequate Access to Life-Prolonging Treatment

Awareness and Opinions of Hospice Care

Hospice care is an option for seriously ill patients near the end of life that emphasizes providing comfort and pain management rather than curative treatment. In the U.S., the use of hospice care has increased in recent years, and hospice services are provided in various settings, including hospitals, free-standing hospice centers, and often in the patient’s own home.3  In the other countries surveyed, hospice care is less common and is usually provided in a designated hospice facility. Reflecting these differences, adults in the U.S. are much more likely than those in Japan, Italy, or Brazil to say they know something about hospice. Seven in ten Americans say they know at least a little about hospice care, compared with between about a quarter and a third in the other countries surveyed.

Figure 20: Awareness of Hospice Highest in U.S.

Among those who have heard of it, feelings about hospice care across countries are overwhelmingly positive, with large majorities (between seven and eight in ten) saying they have a positive opinion of hospice.

Figure 21: Across Countries, Majorities of Those Who Have Heard About Hospice Have a Positive Opinion

While relatively few of those who experienced the death of a loved one in Japan, Italy, and Brazil say that their loved one died in a hospice facility, roughly half (53 percent) of U.S. adults who experienced a death say their loved one either died in a hospice facility or was receiving hospice services before they died. In the U.S., those whose close friend or family member received hospice services are more likely than those who didn’t receive such services to say their loved one’s spiritual or religious beliefs were respected, that they died with friends or family present, and that their wishes about medical care were followed. Although the aim of hospice is to relieve pain and suffering and not necessarily to extend life, those whose loved ones received hospice services are also more likely than those who didn’t to say the person had access to appropriate treatments for prolonging life. However, there is no significant difference based on receipt of hospice services in the share who say their loved one experienced more pain than necessary or received care that placed an undue financial burden on the family.

Figure 22: U.S.: Those Whose Loved Ones Received Hospice Services More Likely to Report Positive End-of-Life Experiences

Country Highlights: Japan

As the country in the survey with the oldest population, residents of Japan see the growing number of older adults as a major problem, and rate their health care system poorly on providing end-of-life care.

Nine in ten adults (91 percent) in Japan say the growing number of older people is a major problem for their country, far higher than any of the other countries surveyed. While just over half say it is the government’s responsibility to finance care for this aging population, one-third (35 percent) say the responsibility should fall on individuals and families. Japanese adults are also particularly sour on their health system when it comes to providing end-of-life medical care: seven in ten give it a rating of fair or poor on a 5-point scale.

Figure 23: Japan: Public Sees Aging of the Population as a Problem, Rates Health Care System Poorly When It Comes to End-of-Life Care

In Japan, a country with 13.4 hospital beds per 1,000 residents (roughly 4 times as many as any other country surveyed), residents are more likely than those in other countries surveyed to expect to die in a hospital and to say a loved one died in a hospital.

While just over half (55 percent) of Japanese adults say they would prefer to die at home, the majority (58 percent) think they are most likely to die in a hospital, higher than any of the other countries surveyed. Among residents with a loved one who died in the past five years, 69 percent in Japan say their loved one died in a hospital, while just 15 percent say they died at home.

Figure 24: Japan: Majority of Residents Expect to Die in a Hospital and About Seven in Ten Say Their Loved One Died in a Hospital

The top concern for Japanese adults in thinking about their own death is making sure their family is not financially burdened.

Six in ten (59 percent) adults in Japan say that making sure their family is not burdened financially by their care is “extremely important” in thinking about their own death. About half also place this level of importance on being at peace spiritually, not burdening their family with tough decisions about their medical care, having loved ones around, and being comfortable and without pain. By contrast, just 10 percent of Japanese adults say that living as long as possible is extremely important to them, ranking far below any other concern.

Figure 25: Japan: Most Important for Own Death: Not Burdening Family Financially; Least Important (By Far): Living as Long as Possible

Conversations about end-of-life wishes are uncommon in Japan.

Just 31 percent of Japanese adults (and 33 percent of those ages 65 and over) say they’ve had a serious conversation with a loved one about their own wishes for end-of-life care. Just 7 percent say they’ve had such a conversation with a doctor and 6 percent say they have their wishes written down. Among those who don’t have their wishes in writing, two-thirds (64 percent) say they’ve never considered it, suggesting this is something that is not discussed or done often in Japan.

Figure 26: Japan: Few Report Discussing Their End-of-Life Wishes with Others or Having Them Written Down in a Document

Perhaps reflecting this lack of conversation, just 26 percent of adults in Japan who served as a medical decision-maker for someone who died say they knew exactly what their loved one wanted in terms of medical treatment, substantially lower than among decision-makers in the other countries surveyed.

Figure 27: Japan: About One in Four Decision-Makers Knew Exactly What Their Loved One Wanted for End-of-Life Medical Treatment

Some attitudes about end-of-life medical care in Japan differ by education level and gender.

University graduates in Japan are more likely than those with lower levels of education to say the health care system places too much emphasis on extending life and too little emphasis on helping people die without pain and stress. Those with higher levels of education are also more likely to say most people have too little control over decisions about their own medical care at the end of life.

Figure 28: Japan: University Graduates More Likely To Say System Places Too Much Emphasis on Extending Life, Too Little on Relieving Suffering
Figure 29: Japan: University Graduates More Likely to Say Most People Have Too Little Control over End-of-Life Decisions

In Japan, women are more likely than men to say they’ve had a conversation with a loved one about their wishes (36 percent vs. 26 percent). By contrast, Japanese men are more likely than women to say they’d prefer to die at home (66 percent vs. 45 percent).

Figure 30: Japan: Women More Likely to Report Discussing Wishes with a Loved One; Less Likely to Say They’d Prefer to Die at Home

Country Highlights: Italy

Italians want their government to take responsibility for the aging population, but most doubt its preparedness to do so.

In Italy, the second-oldest country in our survey, 72 percent see the aging of the population as a problem – including 57 percent who say it’s a major problem – and roughly eight in ten (78 percent) say it should be the responsibility of the government to pay for people’s health and long-term care needs as they age. Yet nearly nine in ten Italians say the government is “not too prepared” (37 percent) or “not at all prepared” (48 percent) to deal with the aging population, and two-thirds (65 percent) say the same about the country’s health care system. Furthermore, six in ten (61 percent) give the country’s health care system a fair or poor rating overall, and half (53 percent) say the same when it comes to end-of-life medical care.

Figure 31: Italians Want Their Government to Take Responsibility for Aging Population, But Doubt Its Preparedness to Do So
Figure 32: Over Half of Italians Rate Their Health Care System Negatively in General and When It Comes to End-of-Life Medical Care

Italians are more likely than residents of some other countries surveyed to place decisions about end-of-life medical care in the hands of doctors. This is particularly true among Italians with lower incomes and lower levels of education.

While just 11 percent of Italians say they have had a serious conversation with a doctor about their own wishes for end-of-life medical care and just 6 percent say they have these wishes written down, Italians seem somewhat more willing than residents of the U.S. and Japan to place decision-making in the hands of doctors. Three in ten Italians (compared with about one in ten in the U.S. and Japan) say that doctors should have the greater say in which medical treatments to pursue for seriously ill patients who are near the end of their lives, while about half (compared with nearly 9 in 10 in the U.S. and Japan) say patients and their families should have the greater say.

In Italy, those with lower incomes and lower levels of education are more likely than their higher-income, more educated counterparts to say that doctors should have a greater say in these decisions. For example, 37 percent of Italians with less than a high school education say that doctors should have the greater say in medical decisions, compared with just 17 percent of university graduates.

Figure 33: Italians with Lower Levels of Income and Education More Likely to Say Doctors Should Have Greater Say in End-of-Life Decisions

When it comes to priorities for their own death, Italians value the presence of loved ones along with a variety of other factors.

Asked what is important in thinking about their own death, a third (34 percent) of Italians say that having loved ones around is “extremely important.” Similar shares say the same about making sure their wishes for medical care are followed, being comfortable and without pain, and making sure their family is not burdened financially by their care. As in Japan, living as long as possible ranks far behind other factors, with just 14 percent saying it is “extremely important” to them.

Figure 34: Italy: Most Important for Own Death: Having Loved Ones Around; Least Important: Living as Long as Possible

Some other interesting demographic differences in views of end-of-life care in Italy are worth highlighting.

As in Japan, women in Italy are somewhat more likely than men to report having had a serious conversation with a loved one about their own wishes for end-of-life medical care (53 percent vs. 42 percent).

Catholics – who make up 75 percent of adults in Italy – are more likely than those with no religious preferences to say the health care system in Italy places too little emphasis on extending life (38 percent vs. 27 percent). By contrast, those with no religious preference are more likely than Catholics to say the health care system places too much emphasis on extending life (20 percent vs. 11 percent).

Figure 35: Italians’ Views on Extending Life Differ by Religious Preference

Among Italians with a loved one who died in the past five years, those with lower incomes are more likely to say their loved one received medical care that placed an undue financial burden on the family and less likely to say they had access to appropriate life-extending treatments.

Figure 36: Italy: Lower-Income More Likely to Report Some Negative Experiences with Loved One’s Death

Country Highlights: Brazil

Among the countries surveyed, Brazilians stand out as having the most negative views of their health care system, yet they are the most likely to defer to doctors when it comes to end-of-life decision making.

In Brazil, a country whose state-sponsored health care system has been plagued by problems, nine in ten residents give the health care system a rating of “fair” or “poor” both in general (90 percent) and when it comes to providing end-of-life medical care (86 percent), by far the most negative ratings among the countries surveyed.

Figure 37: Vast Majority of Brazilians Rate Health Care System Negatively

Brazilians are also the most likely of any country surveyed to say that most people in their country have too little control over their own medical care at the end of life (79 percent). Despite this sense that people should have more control, Brazilians are more likely than residents of the other countries surveyed to say that doctors should have the greater say in which medical treatments to pursue for seriously ill patients; 4 in 10 say doctors should have the greater say, while about half say patients and their families should have the greater say. And among Brazilians who have not discussed their own end-of-life wishes with a loved one, the main reason given is that they will trust their doctor to make those decisions for them when the time comes.

Figure 38: Brazilians Want Patients to Have More Control, But Four in Ten Defer to Doctors When It Comes to End-of-Life Care

Brazilians stand out as being more likely than residents of other countries surveyed to focus on religion and spirituality when it comes to end-of-life issues.

Eight in ten Brazilians (83 percent) say their religious or spiritual beliefs play a major role in how they think about their own wishes for end-of-life medical treatment, compared to about half of residents in the U.S. and Italy and just 13 percent in Japan. Forty-four percent of adults in Brazil identify as Catholic and three in ten identify as Evangelical; these groups are about equally likely to say their beliefs play a major role in their thinking on these issues.

Figure 39: Brazilians Focus on Religion and Spirituality When It Comes to End-of-Life Issues

When asked the importance of various factors in thinking about their own death, “being at peace spiritually” ranks number one in Brazil, with 40 percent saying it is extremely important and another 49 percent saying it is very important. In contrast to the other countries surveyed, a quarter of Brazilians (26 percent) say that living as long as possible is extremely important to them, placing it on par with other concerns like having loved ones around, making sure your family is not burdened financially, and making sure your wishes about medical care are followed.

Figure 40: Brazil: Many Factors Seen as Important for Own Death: Being At Peace Spiritually Ranks #1

Some attitudes about end-of-life care in Brazil differ by gender and education level.

Among Brazilians, women are more likely than men to say they have thought a great deal about how they would pay for the costs of medical care and other services they or another family member might need in old age (50 percent vs. 36 percent) and who would provide care for them or another family member if someone became seriously ill and needed special support (51 percent vs. 40 percent). However, men are more likely than women to report discussing their own wishes for end-of-life treatment with a health care provider (14 percent versus 6 percent).

Figure 41: Brazil: Gender Differences in Preparing for Old Age/Serious Illness

While Brazil is a relatively young country, Brazilians with higher levels of education appear to be more concerned than their less-educated counterparts about the issue of population aging. Nearly six in ten university graduates (56 percent) say the growing number of older adults in Brazil is a major problem, compared with about a third (34 percent) of those with a primary education or less.

Figure 42: Brazil: University Graduates More Likely to Perceive Aging Population as a Major Problem

There is also a difference based on education level in Brazilians’ attitudes about extending life. While Brazilians overall are more likely to prioritize prolonging life over helping people die without pain, discomfort, and stress, university grads lean in the other direction (58 percent say reducing pain and stress should be more important).

Figure 43: Brazil: University Graduates More Likely to Prioritize Reducing Pain and Stress over Prolonging Life

Methodology

The Kaiser Family Foundation/The Economist Four-Country Survey on Aging and End-of-Life Medical Care was conducted among nationally representative random digit dial (RDD) telephone (landline and cell phone) samples of adults ages 18 and older, living in the United States (including Alaska and Hawaii), Brazil, Italy, and Japan (Note: persons without a telephone could not be included in the random selection process). SSRS carried out the sampling and weighting for all countries, and conducted computer-assisted telephone interviews for the U.S. sample. Interviews in Brazil were carried out by Cido International, and interviews in Japan and Italy were carried out by European Field Group, under the direction of SSRS. RDD landline and cell phone samples were provided by Marketing Systems Group (MSG) for the U.S., Sample Answers for Brazil, and Sample Solutions Europe (SSE) for Japan and Italy. Interview languages, field dates, and sample sizes for each country are shown in the table below. Teams from The Economist and the Kaiser Family Foundation worked together to develop the survey questionnaire and analyze the data. The Kaiser Family Foundation paid for the fieldwork costs associated with the survey. Each organization is responsible for its content.

Due to the multi-national design, the questionnaire was tested and translated in multiple stages. The first step involved a live-interview telephone pretest of the English questionnaire with U.S. respondents. Revisions to the English questionnaire were made following the pretest in order to shorten the survey instrument and improve respondent comprehension of questions. Following the English pretest, the questionnaire was translated into Spanish (for interviewing in the U.S.), Italian, Japanese, and Portuguese. Translations were reviewed by a team of professional translators and by regional experts at The Economist. A second pretest was conducted in Italy, Japan, and Brazil, after which further revisions were made to the non-English versions of the questionnaire.

In each country, to randomly select a household member for the landline samples, respondents were selected by asking for the adult male or female currently at home who had the most recent birthday based on a random rotation. If no one of that gender was available, interviewers asked to speak with the adult of the opposite gender who had the most recent birthday. For the cell phone samples, interviews were conducted with the adult who answered the phone.

Multi-stage weighting processes were applied separately for each country to ensure an accurate representation of each country’s national adult population. The first stage of weighting involved corrections to account for the fact that respondents with both a landline and cell phone have a higher probability of selection. The second weighting stage was designed to make demographic adjustments to the sample to match national population estimates. In the U.S., the sample was balanced to match known adult-population parameters using data from the Census Bureau’s 2015 March supplement of the Current Population Survey (CPS) and phone use parameters from the July-December 2015 early release estimates for the National Health Interview Survey. The weighting parameters used for the U.S. were age, gender, education, race/ethnicity, marital status, census region, and telephone use. In Italy, the sample was balanced using estimates from Instituto Nazionale di Statistica’s population projections based on 2010-2011 Census reports, with weighting parameters for age, education, region, and region by density. In Japan, the sample was balanced to match population parameters from Japan’s Statistical Yearbook 2015, based on age, education, and region by prefecture. In Brazil, the sample was balanced using the 2010 Population Census conducted by Instituto Brasileiro de Geografia de Estatística, based on age, education, region, and rural status. All statistical tests of significance account for the effect of weighting.

At the end of the field period, SSRS completed several data validation processes on the international data that included: internal validity checks, testing for straightlining, and analyzing paradata (interviewer workload, interview length, interview time, and overlap of interviews). The Kaiser Family Foundation, along with SSRS, also conducted a percent-match procedure to identify cases that share a high-percentage of identical responses to a large set of questions. This extra validation measure allows for detection of possible duplicate data, whether as a result of intentional falsification, or due to errors in data-processing.

The margin of sampling error including the design effect for each country sample is plus or minus 4 percentage points. For results based on subgroups, the margin of sampling error will be higher; sample sizes and margins of sampling error for subgroups are available by request. Note that sampling error is only one of many potential sources of error in this or any other public opinion poll. Kaiser Family Foundation public opinion and survey research is a charter member of the Transparency Initiative of the American Association for Public Opinion Research.

CountryField datesLanguage(s)Total sample size (unweighted)Cell phone sampleLandline sampleM.O.S.E
U.SMarch 30-May 29English and Spanish1,006739268±4 percentage points
ItalySeptember 15-October 3Italian1,000600400±4 percentage points
JapanSeptember 10-October 20Japanese1,000500500±4 percentage points
BrazilAugust 26-November 12Portuguese1,233714519±4 percentage points

Endnotes

  1. Peter G. Peterson Foundation, Per Capita Healthcare Costs – International Comparison, October 2016. http://www.pgpf.org/chart-archive/0006_health-care-oecd ↩︎
  2. OECD, Health Statistics 2014, 2014. http://www.oecd.org/els/health-systems/Briefing-Note-JAPAN-2014.pdf ↩︎
  3. National Hospice and Palliative Care Organization, Hospice Care in America, September 2015. http://www.nhpco.org/sites/default/files/public/Statistics_Research/2015_Facts_Figures.pdf     ↩︎

U.S. Global Health Funding in Draft FY18 Budget Request

Published: Apr 26, 2017

As reported in Foreign Policy, a draft of the Trump administration’s FY18 budget request for the State Department and USAID, expected to be submitted in full to Congress in May, proposes significant cuts to global health funding. According to a document obtained by Foreign Policy, funding for global health programs would total $6.8 billion, a cut of $1.7 billion (-20%) below the FY16 level ($8.5 billion).[i] While funding amounts for most program areas was not specified and total U.S. government global health funding[ii] is not yet known, some global health funding amounts are specified in the document (it is important to note that this is a draft proposal and the final request may differ):

Total global health funding: $6.8 billion provided through the Global Health Programs (GHP) account at State and USAID, which includes the majority of U.S. global health funding. This represents a decrease of $1.7 billion (-20%) below the FY16 level ($8.5 billion) and would be the lowest level of funding since FY08 ($6.5 billion). Of the 53 countries that received global health funding in FY16, twelve would increase in FY18, 40 would decrease (of which, funding in five countries would be eliminated), and one would remain flat.

State Department – bilateral HIV funding (PEPFAR) & Global Fund, UNAIDS: Of the $6.8 billion in total global health funding, $5.0 billion would be provided through the State Department, a decrease of $0.7 billion (-12%) below the FY16 level ($5.7 billion) and would be the lowest level of funding since FY08 ($4.7 billion). This includes the majority of U.S. bilateral support for HIV provided through the President’s Emergency Plan for AIDS Relief (PEPFAR) as well as contributions to the Global Fund to Fight AIDS, Tuberculosis and Malaria (Global Fund) and UNAIDS as follows:

  • Bilateral HIV (PEPFAR): Totals $3.9 billion, a decrease of more than $0.4 billion (-10%) below the FY16 level ($4.3 billion).
  • Global Fund and UNAIDS: Combined funding for these two organizations would total $1.1 billion, a decrease of $270 million (-19%) below the FY16 level ($1.4 billion); while the document does not indicate how these cuts would be distributed, in FY16, the U.S. provided $1.35 billion to the Global Fund and $45 million to UNAIDS.

USAID Global Health Programs: Of the $6.8 billion in total global health funding, $1.8 billion would be provided through USAID, a decrease of approximately $1.0 billion (-36%) below the FY16 level ($2.8 billion) and would be a return to the FY08 funding level ($1.8 billion). This funding is used to support activities addressing HIV (though most HIV funding is provided through the State Department), tuberculosis, malaria, maternal and child health (MCH), nutrition, vulnerable children, family planning and reproductive health (FP/RH), neglected tropical diseases (NTDs), and global health security. While specific amounts for all areas were not provided, the document does specify that funding for NTDs would be $75 million, a decrease of $25 million (-25%) below the FY16 level ($100 million), and funding for global health security would remain flat ($72.5 million). Funding for MDR Financing (multi-drug resistance) would decline while funding for blind children, iodine deficiency disorder, and new partners fund would be eliminated.

Other Multilateral Contributions: According to the document, the administration is proposing to increase the U.S. contribution to Gavi, the Vaccine Alliance, to $290 million, an increase of $55 million (23%) above the FY16 level ($235 million). The administration is proposing to decrease funding for the TB Drug Facility ($15 million in FY16) and eliminate funding for the Commodity Fund ($20.3 million in FY16), the International AIDS Vaccine Initiative (IAVI) ($28.7 million in FY16), and for international microbicides research ($45 million in FY16).


[i] FY17 funding is not yet finalized and is currently operating under a continuing resolution (CR) at approximately the same level as FY16.

[ii] The draft document obtained by Foreign Policy presents U.S. funding for global health provided through the U.S. Department of State and U.S. Agency for International Development (USAID). Additional global health funding is provided through the Centers for Disease Control and Prevention (CDC), National Institutes of Health (NIH), and the Department of Defense; these amounts are not yet known.

News Release

Poll: Majority Opposes Hard-Ball Negotiating Tactics to Replace the Affordable Care Act, But Republicans Support It

Three Quarters of Public, Including Half of Trump Backers, Want President and Congress to Make the Law Work

Published: Apr 26, 2017

Somewhat More Want President Trump and Republicans to Continue Working on ACA Repeal and Replace than Want Them to Move onto Other Priorities

With President Trump and Congress continuing to discuss repealing and replacing the Affordable Care Act, a majority of the public opposes using hard-ball tactics as a way to force Democrats in Congress to negotiate a replacement, the latest Kaiser Health Tracking Poll finds.

President Trump recently suggested that his administration and Congress could push Democrats to negotiate a replacement to the Affordable Care Act by stopping payments for the law’s cost-sharing reductions, which experts say would likely cause insurers to raise premiums or stop offering coverage through the ACA’s marketplaces.

The poll finds six in 10 (60%) of the public think President Trump should not try to pass an ACA replacement plan using negotiating tactics like these that could disrupt the ACA’s insurance marketplaces and cause people to lose health coverage. While majorities of Democrats (82%) and independents (66%) oppose such tactics, two thirds of Republicans (67%) instead say President Trump should use whatever negotiating tactics are necessary to win support for a replacement plan.

April Late Poll Release Chart-1.png

The poll also finds that most Americans (70%) say the uncertainty around the law’s future is hurting one of the groups most directly affected by the law – people who buy their own health insurance. A similar majority (65%) say that insurers deciding not to sell insurance plans in certain marketplaces is a “big problem” across the country, though fewer (43%) say this about insurers in their local area. These perceptions are similar across party lines.

Public Sees President Trump and Republicans in Congress as Controlling the ACA’s Future

Other findings in the poll suggest the public believes President Trump and Republicans in Congress hold the future of the ACA in their hands. For example:

  • When asked how much control, if any, various groups have over whether the current health care law works or fails, large majorities of the public say Republicans in Congress (80%) and President Trump and his administration (75%) have at least some control. Smaller shares say Democrats in Congress (56%), their own representatives in Congress (51%), or their state’s governor (48%) have at least some control.
  • Three quarters (74%) of the public say President Trump and his administration should do what they can to make the current health care law work, while one-fifth (19%) say they should do what they can to make the ACA fail so they can replace it later. Among President Trump’s supporters, half (53%) say his administration should try to make the law work.
  • A majority (64%) of the public, including most Republicans (53%), say that because President Trump and Republicans in Congress are now in control of the government, they are responsible for any problems with the ACA moving forward. That’s more than twice the share (28%) who say that President Obama and Democrats in Congress are responsible because they passed the law. The share of Republicans who say President Trump and Republicans in Congress are responsible is up significantly from 34 percent in early April.
  • This month, the public is more favorable than unfavorable in their views of the ACA overall, with 48 percent holding favorable views and 41 percent holding unfavorable ones. However, more Americans say they want President Trump and Republicans in Congress to continue working to repeal and replace it (51%) than say they want them to move on to other priorities (43%). There are big partisan divisions on both questions, with Republicans far more likely to view the ACA unfavorably (72%) and to want work to continue on repealing and replacing the law (82%).

Majorities Favor Spending Increases for Veteran’s Care, Medicare and Medical Research

With Congress facing a key budget deadline Friday, the poll finds few Americans want to see decreases in most health areas. In fact, majorities say they want the president and Congress to increase spending on veteran’s medical care (77%) and medical research to find cures for major illnesses (58%). In addition, more people say they favor increases rather than decreases in funding for many other areas, including Medicaid (40% increase, 12% decrease) and reproductive health services (36% increase, 21% decrease). The only area that more people say they want to see spending decrease than increase is for efforts to improve health for people in developing countries (33% decrease, 19% increase).

One potentially contentious issue in the budget involves efforts by some Republicans to prevent Planned Parenthood from receiving any government funding, including federal payments for non-abortion services provided to low-income women through state Medicaid programs.

The poll finds three quarters (73%) of the public favor continuing to such payments to Planned Parenthood, with a quarter (24%) saying all federal payments to the organization should stop. Few (10%, overall) say stopping these payments is important enough to shut down the federal government.

Designed and analyzed by public opinion researchers at the Kaiser Family Foundation, the poll was conducted from April 17- April 23 among a nationally representative random digit dial telephone sample of 1,171 adults. Interviews were conducted in English and Spanish by landline (421) and cell phone (750). The margin of sampling error is plus or minus 3 percentage points for the full sample. For results based on subgroups, the margin of sampling error may be higher.

Kaiser Health Tracking Poll – Late April 2017: The Future of the ACA and Health Care & the Budget

Authors: Ashley Kirzinger, Bianca DiJulio, Elise Sugarman, and Mollyann Brodie
Published: Apr 26, 2017

Aca

KEY FINDINGS:

  • President Trump recently said he may stop payments for the Affordable Care Act’s (ACA) cost-sharing reductions in order to get Democrats to start negotiating on a replacement for the 2010 health care law.1  The majority of the public (60 percent) thinks President Trump should not use negotiating tactics like these that could disrupt insurance markets and cause people to lose health coverage – including the majority of Democrats (82 percent) and independents (66 percent). On the other hand, a majority of Republicans (67 percent) say President Trump should use whatever negotiating tactics necessary to win support for a replacement plan. Most Americans (70 percent) say uncertainty around the future of the law is hurting those who purchase their own health insurance.
  • The public is more favorable (48 percent) than unfavorable (41 percent) in their views of the 2010 health care law this month. Despite this, somewhat more Americans want President Trump and Republican lawmakers to keep working on a plan to repeal and replace the ACA than want them to stop working on health care and move on to other priorities (51 percent vs. 43 percent).
  • For most, repealing the ACA falls behind other health care priorities such as lowering the amount individuals pay for health care and lowering the cost of prescription drugs – which consistently top the list of health care priorities. Among Republicans, repealing the ACA is a top health care priority, with about one-fourth saying it is the “most important priority” for President Trump and Congress when it comes to health care.
  • With the legislative path for repeal still unclear, three-fourths (74 percent) of Americans say that President Trump and his administration should do what they can to make the current health care law work. Large majorities of the public say Republicans in Congress and President Trump and his administration have at least some control over whether the current health care works or fails – including many who say they have “a lot” of control. Furthermore, a majority (64 percent) of the public – including 53 percent of Republicans – say that because President Trump and Republicans in Congress are now in control of the government, they are responsible for any problems with the ACA moving forward.
  • With lawmakers negotiating current federal budget priorities, relatively few Americans want to see the president and Congress decrease funding for a variety of different health priorities – including spending for reproductive health services for lower-income women (21 percent). Overall, one-fourth (24 percent) of the public says that federal Medicaid payments to Planned Parenthood for non-abortion services should be stopped but few (10 percent) think stopping these payments is important enough to shut down the federal government.

The Future of the ACA

With the ongoing debate about the future of the 2010 health care law, this month’s survey examines the public awareness of and attitudes about some recent developments related to the future of law, including uncertainty about cost-sharing reduction payments and insurers opting out of some health insurance marketplaces.

Cost-Sharing Reductions

Under the Affordable Care Act (ACA), financial help is available to low-income people who buy their own health insurance to lower their deductibles and co-payments, sometimes called “cost-sharing reductions” (CSRs). The federal government pays insurance companies to help cover these costs. About half of the public (49 percent) is aware that the ACA provides this type of financial help to lower-income people. Republicans are much more likely than Democrats to say the health care law does not provide this type of assistance (50 percent vs. 29 percent), suggesting that perceptions about what the law includes can be shaped by partisanship.

In addition, 44 percent of the public say they have heard at least some about President Trump saying the federal government may stop making these payments, which experts say would likely cause insurers to raise premiums or stop offering coverage.

Figure 1: Half Unaware of ACA Cost-Sharing Reductions, Two in Ten Say They’ve Heard “A Lot” About It
Majority of Republicans Approve of President Trump’s Negotiating Tactics

President Trump recently said he may stop payments for the ACA’s cost-sharing reductions in order to get Democrats to start negotiating on a replacement for the 2010 health care law. The majority of the public (60 percent) thinks President Trump should not try to pass an ACA replacement plan using negotiating tactics like these that could disrupt insurance markets and cause people to lose health coverage. The majority of Democrats (82 percent) and independents (66 percent) think President Trump should not use these tactics, while, on the other hand, two-thirds of Republicans (67 percent) say President Trump should use whatever negotiating tactics necessary to win support for a replacement plan.

Figure 2: Views on Pres. Trump’s Use of Cost-Sharing Reductions as a Negotiation Tactic Vary by Party

Health Insurance Exchanges

Recently, some major health insurers have announced they are withdrawing from some ACA exchanges — marketplaces where people who do not have employer-sponsored health insurance can buy coverage. Slightly less than half of the public say they have been closely following news about health insurance companies’ decisions on whether or not to sell plans through the marketplaces – with about one in ten saying they have been following the news “very closely.”

Overall, the majority of the public say health insurance companies choosing not to sell insurance plans in certain marketplaces is a “big problem” across the country (65 percent) with an additional 21 percent saying it is a “small problem.” When asked about their local area, 43 percent say it is a “big problem” with another third saying it is a “small problem.” These perceptions are similar across parties.

Figure 3: Most Say Insurers Pulling Out of Marketplaces Is a Problem Across the Country and in Their Local Area

Majorities Say Uncertainty over ACA’s Future is Hurting Individuals Who Buy Their Own Health Insurance

A large share (70 percent), including majorities across parties, says that uncertainty around the future of the law is hurting the group that is most directly affected by the ACA – individuals who purchase their own health insurance. The public is less likely to say that the uncertainty is hurting insurance companies or them and their families.

Figure 4: More Americans Say Uncertainty Around Future of ACA Hurting Self-Purchasers than Insurers or Them Personally

The Public Thinks President Trump and Republicans Have Control Over Making the ACA Work or Fail

When asked how much control, if any, various groups have over whether the current health care law works or fails, large majorities of the public say Republicans in Congress and President Trump and his administration have at least some control. Eight in ten say Republicans in Congress have “a lot” or “some” control over whether the current health care works or fails – including half (47 percent) who say they have “a lot” of control. This is somewhat similar to the share (75 percent) who say President Trump and his administration have at least some control, including 43 percent who say he has “a lot” of control. Smaller shares say Democrats in Congress (56 percent), their own representatives in Congress (51 percent), and their state’s governor (48 percent) have at least some control.

Figure 5: Large Majorities Think Republicans in Congress and Pres. Trump Have Control Over Whether Health Care Law Works or Fails

The vast majority of Republicans (80 percent), Democrats (86 percent), and independents (82 percent) say Republicans in Congress have at least some control while fewer – across parties – say the same about Democrats in Congress (64 percent, 51 percent, and 57 percent, respectively).

Majorities Say President Trump and Republicans Should Make the Current Health Care Law Work, Are Responsible For It Going Forward

In addition to most of the public saying President Trump and Republicans have at least some control over the future of the ACA, three-fourths (74 percent) of the public think Trump and his administration should do what they can to make the current health care law work while one-fifth (19 percent) say President Trump and his administration should do what they can to make the ACA fail so they can replace it later.

Figure 6: Three-Quarters of the Public Says Pres. Trump & Administration Should Do What They Can to Make the ACA Work

Nine in ten Democrats (91 percent) and eight in ten independents (79 percent) say Trump and his administration should do what they can to make the law work as do half of Republicans. Among Trump supporters, more say Trump and his administration should do what they can to make the law work (53 percent) than say they should do what they can to make the law fail so they can replace it later (35 percent).

Figure 7: Most Including Trump Supporters Say Pres. Trump & Administration Should Do What They Can to Make Law Work

In addition, a majority (64 percent) of the public say that because President Trump and Republicans in Congress are now in control of the government, they are responsible for any problems with the ACA moving forward. About three in ten (28 percent) say that because President Obama and Democrats in Congress passed the law, they are responsible for any problems with it moving forward.

Figure 8: Majorities Across Parties Say Pres. Trump and Republicans Are Responsible for Any ACA Problems Moving Forward

Half of Republicans (53 percent) say President Trump and Republicans in Congress are now responsible for any problems with the ACA going forward, up significantly from 34 percent earlier this month.2  Large shares of Democrats and independents still say President Trump and Republicans in Congress are responsible for any problems with the law moving forward.

Figure 9: More Republicans Now Say Pres. Trump and Republicans in Congress Responsible for Any ACA Problems Moving Forward

Plans to Repeal and Replace the ACA

Since House Republicans pulled their replacement plan from a vote last month, plans to repeal and replace the Affordable Care Act have been on-again, off-again. More Americans want President Trump and Republican lawmakers to keep working on a plan to repeal and replace the ACA than want them to stop working on health care and move on to other priorities (51 percent vs. 43 percent).

Republicans and those who say they approve of President Trump are more likely to say they want President Trump and Republicans to keep working on a replacement plan (82 percent and 78 percent, respectively). On the other hand, Democrats and those who disapprove of President Trump are more likely to say they should stop working on health care and move on to other priorities (70 percent and 65 percent, respectively). Independents are divided, with similar shares saying Trump and Republicans should keep working on health care (48 percent) as say they should move on to other priorities (45 percent).

Figure 10: Somewhat More Say Pres. Trump & Republicans Should Keep Working to Repeal and Replace ACA than Say Move On

The Public Leans Favorable in Attitudes Towards the ACA

The public is more favorable than unfavorable in their views of the 2010 health care law this month with 48 percent expressing a favorable view compared to 41 percent expressing an unfavorable view. This split is largely partisan with seven in ten Republicans (72 percent) expressing an unfavorable view and three-fourths (73 percent) of Democrats expressing a favorable opinion of the law. A larger share of independents have a favorable view (48 percent) than an unfavorable view (37 percent).

Figure 11: Public Leans Favorable in Views of the Affordable Care Act

Lowering Costs for Individuals Is Public’s Top Health Care Priority for President Trump and Congress, Repealing ACA Ranks Lower

When asked about a series of health care priorities for President Trump and Congress to act on, about six in ten of the public say lowering the amount individuals pay for health care (63 percent) and lowering the cost of prescription drugs (60 percent) should each be a “top priority” for President Trump and Congress. This is followed by half who say dealing with the prescription painkiller addiction epidemic should be a “top priority.”

Despite the ongoing discussion about repealing the ACA, this falls much lower on the list of the public’s health care priorities, with 32 percent saying it should be a “top priority” for President Trump and Congress, similar to the shares who say decreasing the role of the federal government in health care (33 percent) and decreasing how much the federal government spends on health care over time (30 percent) should be top priorities. In fact, the share who say repealing the 2010 health care law should be a “top priority” has decreased from 37 percent in December 2016.3 

Figure 12: Lowering Out-of-Pocket Costs Is Top Health Care Priority

For Republicans, Repealing the ACA is Still Most Important Priority

When asked the “most important priority” for President Trump and Congress when it comes to health care, lowering the amount individuals pay for health care and lowering the cost of prescription drugs are most prioritized by the public – and by Democrats and independents. On the other hand, one-fourth of Republicans (27 percent) say repealing the 2010 health care law is the most important health care priority.

Table 1: Views of Most Important Health Care Priority by Party Identification
Percent who say each is the most important priority:TotalParty ID
DemocratsIndependentsRepublicans
Lowering the amount individuals pay for health care33%44%33%22%
Lowering the cost of prescription drugs19232015
Repealing the 2010 health care law113827
Dealing with the prescription painkiller addiction epidemic1013107
Decreasing the role of the federal government in health care92914
Decreasing how much the federal government spends on health care4345

Federal Budget Priorities: Health Care

With lawmakers debating spending priorities in advance of a key budget deadline, few Americans want to see the president and Congress decrease funding in a variety of different health areas. In fact, a majority of Americans want to see the president and Congress increase spending on veteran’s medical care (77 percent), medical research to find cures for major illnesses (58 percent), and Medicare (57 percent). The only health area that has a larger share of the public saying they want the president and Congress to decrease spending rather than increase spending is on efforts to improve health for people in developing countries, with one-third saying they want to see spending decreased in this area.

Figure 13: Few Say They Want Decreased Spending on Most Health Priorities

The Role of Planned Parenthood in the Federal Budget

One in five Americans (21 percent) say they want the president and Congress to decrease spending on reproductive health services, such as family planning and birth control for lower-income women. Some Republicans have proposed using the budget process to stop federal Medicaid payments to Planned Parenthood for the health care services they provide to low-income women. Overall, three-fourths (73 percent) of the public thinks federal Medicaid payments to Planned Parenthood should continue while 24 percent think that these payments should stop. When asked whether stopping these payments is so important that it would be worth shutting down the federal government, one in ten of the public overall say stopping these payments is that important.

Figure 14: Most Say Federal Medicaid Payments to Planned Parenthood Should Continue, Few Say Worth Shutting Down Federal Gov’t

Rx Drugs

This month’s tracking survey examines potential policy aimed at one of the public’s top health care priorities for President Trump and Congress: lowering the cost of prescription drugs. Six in ten Americans say lowering the cost of prescription drugs is a “top priority” for President Trump and Congress – including majorities of Democrats, Republicans, and independents.

Figure 1: Lowering the Cost of Prescription Drugs Is One of the Top Health Care Priorities Across Parties

Public Favors Variety of Policy Options to Keep Prescription Drug Costs Down

When presented with a list of policy options intended to help keep the cost of prescription drugs down, the majority of the public is in favor of most of the policy actions, with the vast majority favoring allowing the federal government to negotiate with drug companies to get a lower price on medications for people on Medicare (92 percent), making it easier for generic drugs to come to market (87 percent), and requiring drug companies to release information to the public on how they set drug prices (86 percent).

Figure 2: Most of the Public Favors Actions to Keep Drug Costs Down

A majority of Republicans, Democrats, and independents favor most of these policy actions with one exception – encouraging people to buy lower-cost drugs by requiring them to pay a higher share if they choose a similar, higher-cost drug, which is favored by less than half of Democrats.

Table 1: Views of Policy Actions to Keep Drug Costs Down by Party Identification
Percent who say they favor each of the following:Party ID
DemocratsIndependentsRepublicans
Allowing the federal government to negotiate with drug companies to get a lower price on medications for people on Medicare96%92%92%
Making it easier for generic drugs to come to market in order to increase competition and reduce costs.849191
Requiring drug companies to release information to the public on how they set their drug prices.848884
Limiting the amount drug companies can charge for high-cost drugs for illnesses like hepatitis or cancer787979
Creating an independent group that oversees the pricing of prescription drugs747471
Allowing Americans to buy prescription drugs imported from Canada667775
Allowing Americans to buy prescription drugs from online pharmacies based in Canada736859
Eliminating prescription drug advertisements595953
Encouraging people to buy lower-cost drugs by requiring them to pay a higher share if they choose a similar, higher cost drug406057
NOTE: Items were asked of separate half samples.

Importing Prescription Drugs from Canada

One policy proposal that has received recent attention is allowing Americans to buy prescription drugs imported from Canada or from online pharmacies based in Canada. The majority of the public think that both of these policy changes will make medicines more affordable without sacrificing safety or quality (76 percent say this about allowing Americans to buy prescription drugs imported from Canada, 68 percent say this about allowing Americans to buy prescription drugs from online pharmacies based in Canada). Fewer say either of these policy changes will expose Americans to unsafe medicines from other countries (35 percent and 39 percent, respectively) or lead U.S. drug companies to do less research and development (29 percent and 33 percent, respectively).

Figure 3: A Large Majority Agree Importing Canadian Prescription Drugs Would Make Medicines More Affordable

Marketplaces

Recently, some major health insurers have announced they are withdrawing from the ACA exchanges — marketplaces where people who do not have employer-sponsored health insurance can buy coverage. The late-April Kaiser Health Tracking Poll gauged the public’s awareness of and attitudes about the status of the health insurance marketplaces.

Visibility of News About Insurers Withdrawing from Marketplaces

Half of the public (47 percent) say they have been closely following news about health insurance companies’ decisions on whether or not to sell plans through the marketplaces – with about one in ten saying they are following the news “very closely.”

Figure 1: Half Say They Have Been Closely Following News of Insurance Companies’ Marketplace Decisions

Most See Insurer Withdrawals as a Big Problem Across the Country

Overall, nearly seven in ten (65 percent) say health insurance companies choosing not to sell insurance plans in certain marketplaces is a “big problem” across the country with an additional 21 percent saying it is a “small problem.” When asked about their local area, 43 percent say it is a “big problem,” with another one-third saying it is a “small problem.” These perceptions are similar across parties but there are differences depending on whether individuals are closely following news about health insurance companies’ decisions. Larger shares of those who are closely following the news say it is a “big problem” both across the country (78 percent vs. 54 percent) and in their local area (54 percent vs. 33 percent).

Figure 2: Those Following the News Say Insurers Pulling Out of Exchanges Is a Problem Across the Country and in their Local Area

Views of How Marketplaces are Working

Americans are divided on how well they think the health insurance marketplaces are working in their own state and in the nation, overall. About half (53 percent) of individuals say the health insurance marketplace in their own state is working well while about four in ten say it is working either “not too well” (25 percent) or “not at all well” (14 percent). This is slightly more positive than the rating given to health insurance marketplaces in the nation, overall, with nearly half saying the marketplaces in the nation overall are not working well.

Figure 3: Half Say Marketplaces Are Working Well in Their State; Fewer Say the Same of Marketplaces in the Nation, Overall

Differences in How Public Views Marketplace Functionality

In fact, the share who say the health insurance marketplaces are working well in their own state and in the nation, overall, has actually increased slightly since September 2016.4  But, like previous surveys, party identification as well as location still drive attitudes towards the health insurance marketplaces.

Overall, Democrats are more likely to say the marketplaces in their own state (66 percent) and in the nation overall (66 percent) are working well. And while a larger share of Republicans say the marketplaces in their own state are working well than say the same about in the nation, overall (41 percent v. 26 percent, respectively), the share who say they are working well is smaller than the share of independents and Democrats who say the same.

Figure 4: Democrats are More Positive in Views of How Well Marketplaces are Working

In addition, individuals living in states that have developed their own state-based marketplace are more likely to say the health insurance marketplace in their own state is working well Individuals living in states with state-based marketplaces are more positive in their evaluations with 65 percent saying the health insurance marketplace in their state is working either “very” or “somewhat” well. This is more positive than those living in states with a state-federal partnership (52 percent) but significantly more positive than those living in states that have not developed their own state-based marketplace and are using the federal marketplace (45 percent). These differences hold even when controlling for demographic factors that tend to predict support for the ACA (age, education level, party identification, gender, and race/ethnicity).

Figure 5: Assessment of How Well State Marketplaces Are Working Varies by State Marketplace Type

Methodology

This Kaiser Health Tracking Poll was designed and analyzed by public opinion researchers at the Kaiser Family Foundation (KFF). The survey was conducted April 17-23, 2017, among a nationally representative random digit dial telephone sample of 1,171 adults ages 18 and older, living in the United States, including Alaska and Hawaii (note: persons without a telephone could not be included in the random selection process). Computer-assisted telephone interviews conducted by landline (421) and cell phone (750, including 448 who had no landline telephone) were carried out in English and Spanish by Princeton Data Source under the direction of Princeton Survey Research Associates International (PSRAI). Both the random digit dial landline and cell phone samples were provided by Survey Sampling International, LLC. For the landline sample, respondents were selected by asking for the youngest adult male or female currently at home based on a random rotation. If no one of that gender was available, interviewers asked to speak with the youngest adult of the opposite gender. For the cell phone sample, interviews were conducted with the adult who answered the phone. KFF paid for all costs associated with the survey.

The combined landline and cell phone sample was weighted to balance the sample demographics to match estimates for the national population using data from the Census Bureau’s 2015 American Community Survey (ACS) on sex, age, education, race, Hispanic origin, and region along with data from the 2010 Census on population density. The sample was also weighted to match current patterns of telephone use using data from the January-June 2016 National Health Interview Survey. The weight takes into account the fact that respondents with both a landline and cell phone have a higher probability of selection in the combined sample and also adjusts for the household size for the landline sample. All statistical tests of significance account for the effect of weighting.

The margin of sampling error including the design effect for the full sample is plus or minus 3 percentage points. Numbers of respondents and margins of sampling error for key subgroups are shown in the table below. For results based on other subgroups, the margin of sampling error may be higher. Sample sizes and margins of sampling error for other subgroups are available by request. Note that sampling error is only one of many potential sources of error in this or any other public opinion poll. Kaiser Family Foundation public opinion and survey research is a charter member of the Transparency Initiative of the American Association for Public Opinion Research.

GroupN (unweighted)M.O.S.E.
Total1171±3 percentage points
Party Identification
   Democrats360±6 percentage points
   Republicans296±7 percentage points
   Independents396±6 percentage points
Trump Approval
   Approve of President Trump526±5 percentage points
   Disapprove of President Trump595±5 percentage points


Endnotes

  1. The Wall Street Journal, Trump threatens to withhold payments to insurers to press Democrats on health bill, April 2017.  https://www.wsj.com/articles/trump-threatens-to-withhold-payments-to-insurers-to-press-democrats-on-health-bill-1492029844 ↩︎
  2. A Kirzinger, B DiJulio, B Wu, M Brodie, Kaiser Health Tracking Poll – April 2017: The Fall of the AHCA and Next Steps for the ACA,  https://modern.kff.org/health-reform/poll-finding/kaiser-health-tracking-poll-april-2017-the-fall-of-the-ahca-and-next-steps-for-the-aca/ ↩︎
  3. A Kirzinger, B Wu, M Brodie, Kaiser Health Tracking Poll: Health Care Priorities for 2017,  https://modern.kff.org/health-costs/poll-finding/kaiser-health-tracking-poll-health-care-priorities-for-2017/   ↩︎
  4. A Kirzinger, B Wu, M Brodie. Kaiser Health Tracking Poll: September 2016 https://modern.kff.org/health-costs/report/kaiser-health-tracking-poll-september-2016/ ↩︎

The Role of Medicaid in Rural America

Authors: Julia Foutz, Samantha Artiga, and Rachel Garfield
Published: Apr 25, 2017

Issue Brief

Key Takeaways

This brief describes Medicaid’s role for 52 million nonelderly children and adults living in the most rural areas in the United States and discusses how expansions or reductions in Medicaid could affect rural areas. It shows:

  • Rural populations face significant challenges to their health care coverage and access. People who live in the most rural counties of America are spread across almost 2,500 counties that are heavily concentrated in the South and Midwest. Individuals living in rural areas are less likely to be employed and more likely to be low-income than individuals living in other areas. Individuals in rural areas also face significant barriers to accessing care, including provider shortages, recent closures of rural hospitals, and long travel distances to providers.
  • Medicaid plays a central role in helping to fill gaps in private coverage in rural areas. Although private insurance accounts for the largest share of health coverage in rural areas, nonelderly individuals in rural areas are less likely to have private coverage compared to those in urban and other areas (61% vs. 64% and 66%, respectively). Medicaid helps fill this gap in private coverage, covering nearly one in four (24%) nonelderly individuals in rural areas. Further, in many states, Medicaid coverage rates are higher in rural areas than in urban or other areas of the state. In some cases, these differences are large. For example, in California, the Medicaid coverage rate in rural areas is 16 percentage points higher than in urban areas, and Hawaii has a 13 percentage point difference between Medicaid coverage rates in rural and other areas. Similarly, rural areas in Arizona, Arkansas, and Florida have a Medicaid coverage rate that is about ten percentage points higher than the rate in urban or other areas.
  • The Affordable Care Act (ACA) Medicaid expansion led to coverage gains in rural areas. Prior to the ACA Medicaid expansion to low-income adults, rural areas in Medicaid expansion and non-expansion states had similar rates of Medicaid coverage. However, in rural areas that expanded Medicaid, the Medicaid coverage rate increased from 21% to 26% between 2013 and 2015, while it increased by just one percentage point, from 20% to 21%, in rural areas of non-expansion states. As a result, as of 2015, nonelderly individuals in rural areas within non-expansion states were nearly twice as likely to be uninsured as those living in expansion states (15% vs. 9%).

Additional action to expand Medicaid within the 19 states that have not yet adopted the Medicaid expansion would likely lead to further increases in coverage among individuals living in rural areas. These non-expansion states are home to 59% of nonelderly uninsured individuals living in rural areas. Conversely, cuts to Medicaid could disproportionately affect people living in rural areas given the large role of the program in these areas.

Introduction

People in rural areas face unique challenges in health care coverage and access, including low density of providers and longer travel times to care, limited access to employer-sponsored coverage, and greater health care needs due to older age and lower income. Medicaid plays an important role in helping to address these challenges. This brief provides insight into the role of Medicaid in rural areas and discusses how expansions or reductions in Medicaid such as those currently under debate could affect rural areas. The analysis is based on data from the 2013-2015 American Community Survey and classifies counties as “rural” based on an Index of Relative Rurality (IRR). We group counties into quintiles of rurality and define those with the highest degree of rurality as “rural,” those with the lowest degree as “urban,” and those in the middle as “other.” While Medicaid provides assistance to many low-income elderly individuals, primarily as a wrap-around benefit to Medicare, this analysis focuses on its role in covering nonelderly children and adults. The analysis shows that Medicaid plays a particularly important role providing coverage in rural areas and that gains in Medicaid coverage have helped reduce the uninsured rate in rural areas. More detail on the methods underlying the analysis is available in the “methods” box at the end of the brief.

Where is Rural America and Who Lives There?

The nearly 20% of the nonelderly population, or 52 million people, who live in the most rural counties of America are spread across almost 2,500 counties that are heavily concentrated in the South and Midwest (Click here for a county level map). In contrast, the 20% of the nonelderly population (or 55 million people) who live in the most urban counties of America are spread across fewer than 70 counties that are heavily concentrated in the Northeast. Rurality varies widely by state (Figure 1 and Appendix Table 1). By the definition used in this brief, states such as Montana, North Dakota, and Wyoming are entirely rural, whereas states such as Connecticut, New York, and the District of Columbia have little to no rural area. In 11 states, more than half of the nonelderly population resides in a rural area (Montana, North Dakota, Wyoming, South Dakota, Vermont, New Mexico, Mississippi, Alaska, Iowa, Idaho, and Arkansas).

Figure 1: Share of Nonelderly Population in Rural Area by State, 2015

People living in rural areas are more likely to be older, White, and have lower levels of education compared to people living in other areas. A greater share of people living in rural areas are ages 65 and older than in urban and other areas (data not shown);1  however, there are not large differences in the age distribution of nonelderly individuals living in rural areas compared to those in urban and other areas (Appendix Table 2). Fewer than one quarter of individuals living in rural areas are people of color, compared to over half of people living in urban areas and four in ten people living in other areas (Figure 2). Similar to other areas of the US, nearly nine in ten people living in rural areas have at least a high school diploma or GED. However, fewer than two in ten people in rural areas have a Bachelor’s degree or higher, compared to nearly four in ten people in urban areas and three and ten people living in other areas of the US (Figure 3).

Figure 2: Race/Ethnicity Among the Nonelderly by Geographic Area, 2015
Figure 3: Education Among Nonelderly Adults by Geographic Area, 2015

People living in rural areas are less likely to be in the labor force, more likely to have a disability, and more likely to be low-income than people living in other areas (Figure 4). A smaller share of nonelderly adults in rural areas are working than in urban and other areas (70% vs. 74% and 73%, respectively). Further, nonelderly adults living in rural areas are significantly more likely to have a disability (14%) than those in urban and other areas (9% and 10%, respectively; Figure 4). Reflecting their lower employment rate, nonelderly individuals living in rural areas are more likely than those in other areas to be low-income (below 200% of the federal poverty level or $40,320 per year for a family of three in 2017).

Figure 4: Employment Status, Income, and Disability by Geographic Area, 2015

Rural populations face longstanding and significant disparities in their health and access to health care. Previous research has shown that rural residents are more likely to report poorer physical and mental health and have higher rates of cigarette smoking, obesity, and physical inactivity compared to their urban counterparts.2  In addition, people living in rural areas face significant barriers to accessing care, including provider shortages, recent closures of rural hospitals, and high travel distances to providers.3 

What role does Medicaid play in rural America?

Medicaid plays a central role helping to fill gaps in private coverage in rural areas. Private insurance accounts for the largest share of health coverage among individuals in rural areas. However, nonelderly individuals in rural areas have a lower rate of private coverage compared to those in urban and other areas, reflecting greater employment in jobs that do not offer employer-sponsored health insurance4  and the lower labor force participation rate in rural areas (Figure 5). Medicaid helps fill this gap in private coverage, covering nearly one in four (24%) nonelderly individuals in rural areas, compared to 22% in urban areas and 21% in other areas. However, Medicaid coverage does not fully offset the gap in private coverage. As such, rural areas have a slightly higher nonelderly uninsured rate (12%) compared to urban (11%) and other areas (10%).

Figure 5: Health Coverage Among the Nonelderly by Geographic Area, 2015

Within states, Medicaid generally plays a larger role in rural areas of the state compared to other areas. Medicaid coverage rates are higher in rural areas than in urban areas in 12 of the 19 states with both rural and urban areas (Appendix Table 3). Similarly, rural areas have a higher Medicaid coverage rate than other areas in 41 of the 43 states with both rural and other areas. In some states, the Medicaid coverage rate in rural areas is much higher than other areas. Figure 6 shows the six states with the largest differences in Medicaid coverage rates between rural and urban or other areas. For example, in California, the Medicaid coverage rate in rural areas is 16 percentage points higher compared to urban areas and in Hawaii there is a 13 percentage point difference between Medicaid coverage in rural and other areas. Similarly, in Arizona, Arkansas, and Florida, rural areas have a Medicaid coverage rate that is about ten percentage points higher than urban or other areas or the state.

Figure 6: Medicaid Coverage Rates Among the Nonelderly by Geographic Area, Selected States, 2015

How did Medicaid coverage in rural areas change under the ACA?

The share of people living in rural areas who are covered by Medicaid has grown under the ACA, corresponding with reductions in the uninsured rate. Rural areas experienced growth in Medicaid and private coverage that was similar to urban and other areas. In rural areas, the share of people with Medicaid and private coverage increased from 21% to 24% and 58% to 61% between 2013 and 2015, resulting in a decrease in the uninsured rate from 17% to 12%. Similarly, in urban and other areas, Medicaid and private coverage rates increased by 3 percentage points and uninsured rates decreased by 5 and 6 percentage points, respectively (Figure 7).

Figure 7: Health Coverage Among the Nonelderly by Geographic Area, 2013-2015

Rural areas in states that implemented the ACA Medicaid expansion to low-income adults experienced larger gains in coverage than those in non-expansion states. Prior to the ACA coverage expansion, which was implemented in 2014, rural areas in Medicaid expansion and non-expansion states had similar rates of Medicaid coverage. However, rural areas in non-expansion states had a lower rate of private coverage, which contributed to a higher uninsured rate for rural areas in non-expansion states (Figure 8). In rural areas, the Medicaid coverage rate in expansion states increased from 21% to 26% between 2013 and 2015, while it rose just one percentage point, from 20% to 21%, in non-expansion states. Reflecting the larger gains in Medicaid coverage in expansion states, the uninsured rate in rural areas within expansion states fell by nearly half from 16% to 9%. This reduction was nearly twice as large as the reduction in rural areas of non-expansion states. As a result, as of 2015, nonelderly individuals in rural areas within non-expansion states were nearly twice as likely to be uninsured as those within expansion states (15% vs. 9%).

Figure 8: Health Coverage Among the Nonelderly in Rural Areas by State Medicaid Expansion Status, 2013-2015

Looking Ahead

These data illustrate that Medicaid plays a particularly important role in the most rural communities within our nation. This analysis shows that Medicaid helps fill gaps in private coverage within rural areas, helping to reduce disparities in coverage between rural areas and the rest of the nation. Medicaid coverage has grown in rural areas under the ACA, helping to reduce uninsured rates. However, states that expanded Medicaid experienced larger coverage gains than non-expansion states, leaving individuals in rural areas in non-expansion states nearly twice as likely to be uninsured as those in expansion states.

Further action among states to implement the ACA Medicaid expansion to low-income adults could lead to additional coverage gains in rural areas. As of April 2017, 19 states have not yet adopted the Medicaid expansion to low-income adults. These non-expansion states are home to 59% of nonelderly uninsured individuals living in rural areas. Additional action to expand Medicaid within these states would likely lead to increased coverage among individuals living in rural areas. In the four states (Kansas, Maine, North Carolina, and Virginia) that have had recent legislative activity related to implementing the expansion,5  nearly a quarter or more nonelderly individuals live in rural areas.

Reductions in Medicaid could disproportionately affect individuals living in rural America. If federal funding for Medicaid is reduced through elimination of enhanced funding for the ACA Medicaid expansion or limits on funding for the broader program, states would likely need to increase state spending to maintain coverage or make program cutbacks that would reduce eligibility, benefits, or provider payments. Given the larger role Medicaid plays for individuals in rural areas compared to other areas, individuals in these areas would likely be disproportionately impacted by coverage losses as well as reduced benefits and increased premiums and cost sharing. Further, analysis shows that high poverty states and states in the South, which include many rural areas, would be disproportionately impacted by reductions in federal Medicaid funds and face the highest increases in state spending to maintain coverage amid federal reductions. Reductions in Medicaid coverage would also increase demands on safety net providers, including community health centers and public hospitals. At the same time, the loss of federal Medicaid revenues would increase fiscal strains on these providers who already face a range of challenges that have contributed to increases in closures among rural hospitals in recent years.6 

Methods

This brief is based on analysis of American Community Survey (ACS) data from 2013-2015. In this brief, rural areas are defined using the 2010 Index of Relative Rurality (IRR) measure, which is a continuous measure of a county’s degree of rurality based on population size, population density, extent of urbanized area, and distance to the nearest metro area.7  For this analysis the IRR is divided into five equally weighted population quintiles based off ACS weighted data. County level data for ACS was obtained by using a public use microdata area (PUMA) code to county crosswalk based on the 2010 Census definition.8  Although the IRR determines the degree of a county’s rurality and not if a county is rural or urban, throughout this brief, the population quintile with the highest degree of rurality is referred to as “rural,” and the population quintile with the lowest degree of rurality is referred to as “urban.” The remaining three population quintiles are referred to as “other.” While the elderly population is included in the assignment of rurality, they are excluded from the remainder of the analysis, as our focus is Medicaid’s role as a health insurer for children and non-elderly adults.

Appendix

Appendix Table 1: Nonelderly Population by Geographic Area, 2015
 % in Rural Areas% in Urban Areas% in Other Areas
United States19%20%60%
Alabama34%0%66%
Alaska59%0%41%
Arizona17%0%83%
Arkansas51%0%49%
California3%10%86%
Colorado19%13%68%
Connecticut0%51%49%
Delaware0%0%100%
DC0%100%0%
Florida5%4%91%
Georgia22%37%40%
Hawaii18%0%70%
Idaho52%0%48%
Illinois15%54%31%
Indiana30%15%56%
Iowa52%0%48%
Kansas46%0%54%
Kentucky49%17%34%
Louisiana33%0%67%
Maine45%0%55%
Maryland4%11%85%
Massachusetts1%46%53%
Michigan21%18%61%
Minnesota34%33%33%
Mississippi60%0%40%
Missouri35%22%43%
Montana100%0%0%
Nebraska44%0%56%
Nevada9%0%91%
New Hampshire25%0%75%
New Jersey0%43%57%
New Mexico67%0%33%
New York10%51%39%
North Carolina22%11%67%
North Dakota100%0%0%
Ohio20%29%51%
Oklahoma47%0%53%
Oregon32%0%68%
Pennsylvania12%33%55%
Rhode Island0%0%100%
South Carolina24%0%76%
South Dakota78%0%22%
Tennessee30%0%70%
Texas15%34%51%
Utah24%0%76%
Vermont73%0%27%
Virginia23%34%43%
Washington16%0%84%
West Virginia46%0%54%
Wisconsin33%17%49%
Wyoming100%0%0%
NOTES: Includes nonelderly individuals ages 0-64. Totals may not sum to 100% due to rounding. Totals for Hawaii do not sum to 100% because FIPS county codes 15005 and 15009 are not assigned an IRR; population in geographic area is N/A.

SOURCE: Kaiser Family Foundation analysis based on the 2015 American Community Survey 1-Year Estimates.

Appendix Figure 1: Share of Nonelderly Population in Rural Area by State, 2015
Appendix Table 2: Demographics by Geographic Area, 2015
RuralUrbanOther
Mean Index of Relative Rurality, 20100.510.130.34
Nonelderly (0-64)
Age30%28%29%
   0-18 30%28%29%
   19-3424%28%26%
   35-5430%31%31%
   55-6417%14%15%
Sex
   Male50%49%50%
   Female50%51%50%
Race/Ethnicity
   Non-Hispanic White76%45%58%
   Non-Hispanic Black8%21%11%
   Hispanic10%22%21%
   Non-Hispanic Other Race5%12%9%
Citizenship
   Citizen96%79%86%
   Naturalized Citizen1%9%6%
   Non-Citizen3%12%8%
Poverty
   <100% FPL18%16%15%
   100-199% FPL20%17%17%
   200-399% FPL32%26%29%
   400% FPL28%40%38%
Census Region
   Northeast8%35%14%
   Midwest31%26%16%
   South42%31%38%
   West19%7%31%
Nonelderly Adults (19-64)
Education
   Less than High School11%12%11%
   High School Diploma or GED34%23%25%
   Some College36%28%34%
   Bachelor’s Degree or Higher19%37%30%
Work Status
   Working70%74%73%
   Unemployed4%5%5%
   Not in Labor Force26%21%22%
Disability
   With Disability14%9%10%
   Without Disability86%91%90%
NOTES: People of Hispanic origin may be of any race but are categorized as Hispanic for this analysis; all other racial groups are non-Hispanic. Disability includes limitation in vision, hearing, mobility, cognitive functioning, self-care, and/or independent living.

SOURCE: Kaiser Family Foundation analysis of the 2015 American Community Survey 1-Year Estimates.

Appendix Table 3: Health Coverage Among the Nonelderly Population by Geographic Area, 2015
MedicaidOther PublicPrivateUninsured
Rural UrbanOtherRuralUrbanOtherRuralUrbanOtherRuralUrbanOther
United States24%22%21%4%2%3%61%64%66%12%11%10%
 Implemented Medicaid Expansion- Democratic/Independent Governor
California37%21%28%3%1%3%49%69%60%11%9%10%
Colorado26%23%18%4%2%5%57%62%70%12%13%8%
ConnecticutN/A21%20%N/A1%2%N/A69%73%N/A9%5%
DelawareN/AN/A23%N/AN/A3%N/AN/A67%N/AN/A6%
DCN/A26%N/AN/A2%N/AN/A68%N/AN/A4%N/A
Hawaii28%N/A15%3%N/A12%64%N/A69%5%N/A4%
Louisiana25%N/A23%4%N/A4%55%N/A60%16%N/A13%
Minnesota22%21%15%2%1%1%70%72%79%5%6%4%
Montana17%N/AN/A4%N/AN/A66%N/AN/A14%N/AN/A
New York26%31%21%4%1%2%63%58%71%7%10%6%
Oregon31%N/A24%3%N/A2%56%N/A66%9%N/A8%
Pennsylvania22%22%18%3%2%2%67%69%73%8%8%7%
Rhode IslandN/AN/A24%N/AN/A2%N/AN/A68%N/AN/A6%
Washington30%N/A21%4%N/A4%56%N/A68%10%N/A7%
West Virginia32%N/A28%4%N/A4%57%N/A62%7%N/A6%
Alaska19%N/A20%8%N/A9%55%N/A60%19%N/A11%
 Implemented Medicaid Expansion- Republican Governor
Arizona32%N/A22%5%N/A3%48%N/A62%15%N/A13%
Arkansas33%N/A23%4%N/A4%52%N/A62%11%N/A11%
Illinois25%22%20%2%2%2%67%67%71%6%10%6%
Indiana17%26%17%3%3%3%69%58%70%11%14%11%
Iowa20%N/A18%2%N/A2%72%N/A74%6%N/A6%
Kentucky32%24%23%6%2%4%54%67%67%8%6%7%
Maryland25%34%16%3%3%4%66%53%73%6%9%7%
Massachusetts24%21%28%1%1%2%71%75%67%4%3%3%
Michigan25%37%21%3%2%2%64%53%71%8%8%6%
Nevada21%N/A20%3%N/A4%65%N/A62%11%N/A14%
New Hampshire17%N/A12%3%N/A3%69%N/A78%11%N/A7%
New JerseyN/A19%18%N/A1%2%N/A68%72%N/A13%8%
New Mexico36%N/A32%4%N/A5%47%N/A52%13%N/A11%
North Dakota11%N/AN/A4%N/AN/A76%N/AN/A9%N/AN/A
Ohio24%24%22%3%2%3%65%66%68%8%8%7%
Vermont29%N/A21%2%N/A2%63%N/A74%6%N/A4%
 Has Not Implemented Medicaid Expansion- Democratic Governor
North Carolina24%16%19%5%2%6%56%69%63%15%13%12%
Virginia17%12%11%5%8%9%66%69%71%12%11%9%
 Has Not Implemented Medicaid Expansion- Republican Governor
Alabama24%N/A20%5%N/A4%58%N/A64%13%N/A12%
Florida27%17%20%5%4%4%50%64%60%18%14%16%
Georgia24%16%17%5%2%6%53%66%62%18%16%14%
Idaho19%N/A17%3%N/A3%64%N/A68%14%N/A12%
Kansas14%N/A14%6%N/A2%69%N/A73%10%N/A11%
Maine25%N/A16%4%N/A3%59%N/A71%12%N/A9%
Mississippi29%N/A23%4%N/A6%52%N/A57%15%N/A14%
Missouri19%15%13%7%2%3%60%74%73%14%9%10%
Nebraska13%N/A13%2%N/A4%74%N/A75%10%N/A8%
Oklahoma21%N/A17%5%N/A5%57%N/A63%17%N/A15%
South Carolina27%N/A19%5%N/A5%55%N/A64%13%N/A12%
South Dakota15%N/A12%5%N/A2%66%N/A75%14%N/A11%
Tennessee26%N/A19%5%N/A4%57%N/A64%12%N/A12%
Texas19%20%16%4%2%4%57%58%62%21%21%17%
Utah13%N/A11%2%N/A2%71%N/A76%14%N/A11%
Wisconsin18%30%14%2%2%2%73%60%78%7%9%6%
Wyoming12%N/AN/A4%N/AN/A71%N/AN/A12%N/AN/A
NOTES: Includes nonelderly individuals ages 0-64. Totals may not sum to 100% due to rounding. Other Public includes Medicare, military, and Veterans Administration coverage. MT and LA adopted Medicaid expansion in 2016. N/A indicates lack of geographic area in state.

SOURCE: Kaiser Family Foundation analysis based on the 2015 American Community Survey 1-Year Estimates.

Endnotes

  1. Kaiser Family Foundation analysis of 2015 American Community Survey 1-Year Estimates. ↩︎
  2. Michael Meit et al., The 2014 Update of the Rural-Urban Chartbook, (Bethesda, MD: The North Dakota and NORC Rural Health Reform Policy Research Center, October 2014), https://ruralhealth.und.edu/projects/health-reform-policy-research-center/pdf/2014-rural-urban-chartbook-update.pdf. ↩︎
  3. Jane Wishner et al., A look at Rural Hospital Closures and Implications for Access to Care: Three Case Studies, (Washington, DC: Kaiser Commission on Medicaid and the Uninsured, July 2016), https://modern.kff.org/medicaid/issue-brief/a-look-at-rural-hospital-closures-and-implications-for-access-to-care/. ↩︎
  4. Kaiser Family Foundation analysis of 2015 American Community Survey 1-Year Estimates. ↩︎
  5. https://modern.kff.org/medicaid/slide/state-medicaid-expansion-approaches/ ↩︎
  6. Jane Wishner et al., A look at Rural Hospital Closures and Implications for Access to Care: Three Case Studies, (Washington, DC: Kaiser Commission on Medicaid and the Uninsured, July 2016), https://modern.kff.org/medicaid/issue-brief/a-look-at-rural-hospital-closures-and-implications-for-access-to-care/. ↩︎
  7. Brigitte Waldorf and Ayoung Kim, Defining and Measuring Rurality in the US: From Typologies to Continuous Indices, (West Lafayette, IN: Purdue University, Department of Agricultural Economics, April 2015), http://sites.nationalacademies.org/cs/groups/dbassesite/documents/webpage/dbasse_168031.pdf. ↩︎
  8. Missouri Census Data Center Geographic Correspondence Engine, http://mcdc.missouri.edu/websas/geocorr12.html. ↩︎
News Release

Medicaid Fills Coverage Gaps in Rural Areas, Where Residents Are More Likely Than in Urban Areas to Be Low Income, Have a Disability, Be Unemployed or Lack Private Health Insurance

Published: Apr 25, 2017

A new brief from the Kaiser Family Foundation examines the role of Medicaid in rural America. The 52 million children and nonelderly adults living in the most rural areas of the U.S. are more likely to be low income, more likely to have a disability and less likely to be employed or to have private insurance coverage compared to residents of urban and other areas.  Individuals in rural areas also face significant barriers to accessing care, including provider shortages, recent closures of rural hospitals, and long travel distances to providers.

The brief explains that Medicaid plays a central role in helping to fill the gaps in private coverage in rural America, covering nearly one in four (24%) nonelderly individuals in rural areas.  In many states, the share of the nonelderly population covered by Medicaid is higher in rural areas than in urban or other areas, and these differences are large in several states — including California, Hawaii, Kentucky, Arizona, Arkansas and Florida.

The brief also highlights the role of the Affordable Care Act’s (ACA) Medicaid expansion in driving recent coverage gains in rural areas. Between 2013 and 2015, rural areas that expanded Medicaid had larger Medicaid coverage gains (from 21% to 26% with Medicaid) compared to rural areas in non-expansion states (from 20% to 21%). Individuals in rural areas within non-expansion states were nearly twice as likely to be uninsured as those in expansion states (15% vs. 9%) in 2015. Given the large role of Medicaid in rural areas, reductions in federal Medicaid spending – either through repeal of the ACA, restructuring of Medicaid’s financing or both – could disproportionately affect people in rural communities.

The brief includes state-level data as well as a link to a county-based map highlighting rural areas of the country.

News Release

Federal Government Could See Net Increase of $2.3 Billion in Costs in 2018 if ACA Cost-Sharing Reduction Payments Eliminated

On Average, Premiums for Silver Plans Would Need to Rise 19% to Offset Lack of Funding for Cost-Sharing Reductions, Triggering Tax Credit Increases

Published: Apr 25, 2017

Ceasing payments for the Affordable Care Act’s (ACA) cost-sharing reduction program could save $10 billion, but cost an additional $12.3 billion in premium tax credits – an estimated net increase of $2.3 billion, or 23 percent, in federal spending on marketplace subsidies – in 2018, if insurers continue to participate in ACA marketplaces, according to a new analysis from the Kaiser Family Foundation.

The cost-sharing subsidies, established to reduce out-of-pocket costs for ACA marketplace enrollees with lower incomes, are being challenged in a lawsuit from the U.S. House. With the lawsuit temporarily suspended, the Trump Administration and Congress are in a position to determine whether to continue the payments, which go to insurers to reimburse their costs for providing the cost-sharing reductions.

The Foundation’s new analysis examines potential financial implications if the government stops cost-sharing reduction payments to insurers.

Without the payments, the analysis finds, the average ACA marketplace premium for silver plans would need to rise by 19 percent in 2018 for insurers to offset the lack of funding. Estimated premium changes vary for the 38 states that used healthcare.gov in 2016, ranging from 9 percent in North Dakota to 27 percent in Mississippi.

Changes to silver plan premiums in ACA marketplaces would affect how much the government owes to eligible enrollees in tax credits. Meant to reduce monthly insurance costs for people with lower incomes (from 100% to 400% of the poverty level), ACA premium tax credits are tied to the premium for the second-lowest cost silver plan in each geographic area.

According to the analysis, the government would owe an estimated additional $12.3 billion in tax credits in 2018, if cost-sharing reduction payments end and if insurers choose to continue offering plans in ACA marketplaces. The government would save $10 billion from stopping the payments, resulting in a net increase in federal costs of $2.3 billion. Extrapolating to the 10-year budget window (2018-2027) using the Congressional Budget Office’s projections for cost-sharing reduction payments, the net increase in federal costs would be $31 billion.

The Effects of Ending the Affordable Care Act’s Cost-Sharing Reduction Payments

Published: Apr 25, 2017

Controversy has emerged recently over federal payments to insurers under the Affordable Care Act (ACA) related to cost-sharing reductions for low-income enrollees in the ACA’s marketplaces.

The ACA requires insurers to offer plans with reduced patient cost-sharing (e.g., deductibles and copays) to marketplace enrollees with incomes 100-250% of the poverty level. The reduced cost-sharing is only available in silver-level plans, and the premiums are the same as standard silver plans.

To compensate for the added cost to insurers of the reduced cost-sharing, the federal governments makes payments directly to insurance companies. The Congressional Budget Office (CBO) estimates the cost of these payments at $7 billion in fiscal year 2017, rising to $10 billion in 2018 and $16 billion by 2027.

The U.S. House of Representatives sued the Secretary of the U.S. Department of Health and Human Services under the Obama Administration, challenging the legality of making the cost-sharing reduction (CSR) payments without an explicit appropriation. A district court judge has ruled in favor of the House, but the ruling was appealed by the Secretary and the payments were permitted to continue pending the appeal. The case is currently in abeyance, with status reports required every three months, starting May 22, 2017.

If the CSR payments end – either through a court order or through a unilateral decision by the Trump Administration, assuming the payments are not explicitly authorized in an appropriation by Congress – insurers would face significant revenue shortfalls this year and next.

Many insurers might react to the end of subsidy payments by exiting the ACA marketplaces. If insurers choose to remain in the marketplaces, they would need to raise premiums to offset the loss of the payments.

We have previously estimated that insurers would need to raise silver premiums by about 19% on average to compensate for the loss of CSR payments. Our assumption is that insurers would only increase silver premiums (if allowed to do so by regulators), since those are the only plans where cost-sharing reductions are available. The premium increases would be higher in states that have not expanded Medicaid (and lower in states that have), since there are a large number of marketplace enrollees in those states with incomes 100-138% of poverty who qualify for the largest cost-sharing reductions.

There would be a significant amount of uncertainty for insurers in setting premiums to offset the cost of cost-sharing reductions. For example, they would need to anticipate what share of enrollees in silver plans would be receiving reduced cost-sharing and at what level. Under a worst case scenario – where only people eligible for sharing reductions enrolled in silver plans – the required premium increase would be higher than 19%, and many insurers might request bigger rate hikes.

Figure 1: How much silver premiums would have to rise to compensate for loss of cost-sharing reduction payments

While the federal government would save money by not making CSR payments, it would face increased costs for tax credits that subsidize premiums for marketplace enrollees with incomes 100-400% of the poverty level.

The ACA’s premium tax credits are based on the premium for a benchmark plan in each area: the second-lowest-cost silver plan in the marketplace. The tax credit is calculated as the difference between the premium for that benchmark plan and a premium cap calculated as a percent of the enrollee’s household income (ranging from 2.04% at 100% of the poverty level to 9.69% at 400% of the poverty in 2017).

Any systematic increase in premiums for silver marketplace plans (including the benchmark plan) would increase the size of premium tax credits. The increased tax credits would completely cover the increased premium for subsidized enrollees covered through the benchmark plan and cushion the effect for enrollees signed up for more expensive silver plans. Enrollees who apply their tax credits to other tiers of plans (i.e., bronze, gold, and platinum) would also receive increased premium tax credits even though they do not qualify for reduced cost-sharing and the underlying premiums in their plans might not increase at all.

We estimate that the increased cost to the federal government of higher premium tax credits would actually be 23% more than the savings from eliminating cost-sharing reduction payments. For fiscal year 2018, that would result in a net increase in federal costs of $2.3 billion. Extrapolating to the 10-year budget window (2018-2027) using CBO’s projection of CSR payments, the federal government would end up spending $31 billion more if the payments end.

This assumes that insurers would be willing to stay in the market if CSR payments are eliminated.

Figure 2: How eliminating ACA cost-sharing reduction payments increases federal costs (2018)

Methods

We previously estimated that the increase in silver premiums necessary to offset the elimination of CSR payments would be 19%.

To estimate the average increase in premium tax credits per enrollee, we applied that premium increase to the average premium for the second-lowest-cost silver plan in 2017. The Department of Health and Human Services reports that the average monthly premium for the lowest-cost silver plan in 2017 is $433. Our analysis of premium data shows that the second-lowest-cost silver plan has a premium 4% higher than average than the lowest-cost silver plan.

We applied our estimate of the average premium tax credit increase to the estimated total number of people receiving tax credits in 2017. This is based on the 10.1 million people who selected a plan during open enrollment and qualified for a tax credit, reduced by about 17% to reflect the difference between reported plan selections in 2016 and effectuated enrollment in June of 2016.

We believe the resulting 23% increase in federal costs is an underestimate. To the extent some people not receiving cost-sharing reductions migrate out of silver plans, the required premium increase to offset the loss of CSR payments would be higher. Selective exits by insurers (e.g., among those offering lower cost plans) could also drive benchmark premiums higher. In addition, higher silver premiums would somewhat increase the number of people receiving tax credits because currently some younger/higher-income people with incomes under 400% of the poverty level receive a tax credit of zero because their premium cap is lower than the premium for the second-lowest-cost silver plan. We have not accounted for any of these factors.

Our analysis produces results similar to recent estimates for California by Covered California and a January 2016 analysis from the Urban Institute.

Data Note: Medicaid Managed Care Growth and Implications of the Medicaid Expansion

Author: Julia Paradise
Published: Apr 24, 2017

Introduction

The Medicaid program covers more than 74 million Americans, or 1 in 5, including low-income pregnant women, children, and parents, seniors, people with disabilities, and, in Medicaid expansion states, nearly all low-income nonelderly adults. Most states today rely heavily on risk-based managed care organizations to serve Medicaid beneficiaries. This Data Note discusses the current role of managed care in Medicaid and addresses differences in managed care growth between states that expanded Medicaid to low-income adults under the Affordable Care Act (ACA) and states that did not expand Medicaid.

Risk-based managed care is the dominant delivery system in Medicaid.

Going back as far as the 1970s, some state Medicaid programs, as an alternative to paying providers on a fee-for-service basis, contracted on a risk basis with private managed care organizations (MCOs) to serve selected beneficiary populations – primarily, pregnant women, children, and families. Over time, more states have taken up MCO contracting and states have also expanded their MCO programs to include both wider geographic areas and beneficiaries with more complex needs. Today, 39 states contract with MCOs and risk-based managed care is the dominant delivery system in Medicaid. As of July 2016, in 28 states – including 8 of the 10 states with the most Medicaid beneficiaries (California, New York, Texas, Florida, Ohio, Pennsylvania, Michigan, and Washington) – at least 75% of all Medicaid beneficiaries were enrolled in MCOs. In 10 of these 28 states, more than 90% of beneficiaries were enrolled in MCOs (Figure 1). In FY 2016, 43% of Medicaid spending was attributable to payments to MCOs, up from 28% in FY 2013.1 

Figure 1: A large share of all Medicaid beneficiaries are enrolled in risk-based MCOs.

In 25 Medicaid expansion states, at least 80% of all newly eligible adults are in Managed care plans.

Thirty-two states (including the District of Columbia) have expanded Medicaid to low-income, nonelderly adults under the Affordable Care Act (ACA), and in these states, 11 million adults are newly eligible for Medicaid as a result. Most Medicaid expansion states (27) contract with MCOs to serve a large share of Medicaid beneficiaries. Expansion states account for 21 of the 28 states where at least 75% of beneficiaries are in MCOs, and seven of the 10 states with penetration rates above 90%. In nearly all 27 Medicaid expansion states with risk contracts, the share of newly eligible adults enrolled in MCOs is at least as high as the overall share of beneficiaries enrolled in MCOs. In 25 of these states, at least 80% of newly eligible adults are enrolled in MCOs, including 17 states where over 90% of expansion adults are enrolled in plans (Figure 2).

Figure 2: The vast majority of newly eligible adults in Medicaid expansion states are enrolled in MCOs.

Most MCO enrollment growth is occurring in Medicaid expansion states.

The 39 states operating Medicaid MCO programs include 27 expansion states and 12 non-expansion states. Medicaid MCO enrollment continues to grow in both groups of states. Data comparing MCO enrollment in December 2013, the month before the ACA Medicaid expansion took effect, and September 2016, show substantial managed care increases over this period, with the lion’s share of the increase in MCO enrollment occurring in expansion states.2  In the 19 expansion states with MCOs that reported both pre- and post-ACA data, MCO enrollment rose from 22.8 million to 36.1 million – an increase of 13.3 million beneficiaries, or 58% (Figure 3).3  The median increase in MCO enrollment in these states was 47%. In comparison, in the seven non-expansion states with MCOs that reported pre- and post-ACA data, MCO enrollment grew from 7.4 million to 10.8 million – an increase of 3.4 million beneficiaries, or 46%, and the median increase was 31%.4 

Figure 3: MCO enrollment growth has been greater in Medicaid expansion states compared to non-expansion states.

The larger increases in MCO enrollment in the Medicaid expansion states reflect a number of factors, including: the greater number of expansion versus non-expansion states with MCOs; the much larger number of Medicaid beneficiaries residing in the expansion/MCO versus non-expansion/MCO states (43.1 million versus 18.1 million in December 2016); and the expansion states’ heavy reliance on MCOs to serve newly eligible adults as well as other Medicaid beneficiaries. Expansion states account for 15 of the 21 states where more than 80% of Medicaid beneficiaries are in MCOs.

Conclusion

States are continuing to expand their use of comprehensive risk-based managed care. In the Kaiser Family Foundation’s most recent 50-state Medicaid budget survey, 11 of the 39 states with MCOs indicated that they took specific action in FY 2017 to increase the number of Medicaid enrollees in MCOs through geographic expansions, voluntary or mandatory enrollment of new groups, or mandatory enrollment of groups formerly enrolled on a voluntary basis. As both Medicaid expansion and non-expansion states broaden the size and scope of their MCO programs, a large and growing share of beneficiaries, increasingly including people with disabilities, poor seniors, and others with complex health care needs, are receiving their care in private managed care plans. The growing role of managed care in Medicaid has important implications for beneficiary access to care, in particular, because it shifts the onus of finding providers who accept Medicaid patients from the individual to MCOs, which are contractually responsible for establishing adequate provider networks to serve Medicaid enrollees.

  1. Urban Institute estimates based on data from CMS (Form 64), as of April 2017. ↩︎
  2. In several states for which December 2013 data were not available, data from a later month were used to calculate MCO enrollment increases. See Endnotes 2 and 3 for detail. ↩︎
  3. The 19 states are AZ, CA, HI, IL (August 2014), IN, KY, LA, MA, MD, MI (August 2014), MN, NV, NM (March 2015), NY, OH, OR (January 2014), PA (August 2014), WA, and WV. ↩︎
  4. The seven states are FL, MS (January 2014), MO, SC (September 2014), TN, TX (June 2014), and WI. ↩︎