News Release

Analysis: Insurer Financial Indicators Show Signs of Stabilizing After Transition to ACA Marketplaces

Published: Apr 21, 2017

A new Kaiser Family Foundation analysis of key insurer financial indicators suggests that the individual insurance market showed signs of stabilizing in 2016, although profitability remained below the level of performance prior to the opening of the Affordable Care Act’s insurance marketplaces.

The new analysis tracks insurer financial performance in the individual market through two key indicators: average medical loss ratios (the share of health premiums paid out as claims) and average gross margins per member per month (the average amount by which premium income exceeds claims costs per enrollee in a given month).

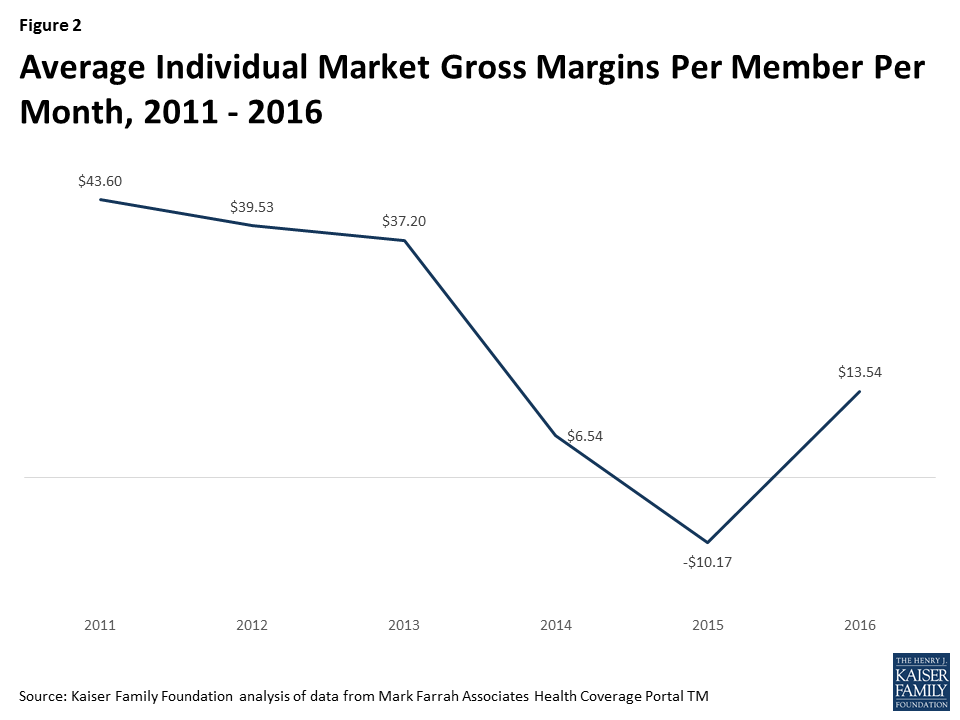
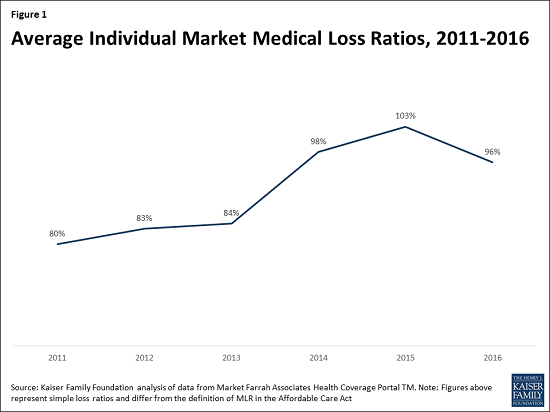
Although insurers generally have remained profitable overall since the implementation of the ACA, these measures indicate that individual market insurer financial performance worsened in 2014 and 2015, with the transition to the marketplaces and adjustment to other changes under the health law. It is unlikely insurers can be profitable when medical loss ratios exceed 85-90 percent; in 2015, the average individual market medical loss ratio grew to 103 percent. Average gross margins per member per month fell from $37.20 in 2013 to $6.54 in 2014, and dropped further to -$10.17 in 2015.

mlr slide2 email-1.png

Insurers began to see improvement in 2016, the analysis finds, as they were able to access more meaningful data to set premium rates in the third year of ACA marketplaces. In the individual market that year, the average medical loss ratio was 96 percent, and the average gross margins per member per month was $13.54.

For insurers in the individual market to return to pre-ACA margins, financial performance would need to continue improving. With large premium increases and relatively steady enrollment in 2017 ACA marketplace plans, insurers may see substantial movement in that direction this year if claims costs do not rise dramatically, according to the analysis.

Insurer Financial Performance in the Early Years of the Affordable Care Act is available on kff.org.


Insurer Financial Performance in the Early Years of the Affordable Care Act

Published: Apr 21, 2017

Although insurers have generally remained profitable overall since implementation of the Affordable Care Act, many companies participating in the individual market – where most of the major market reforms took place in 2014 – experienced substantial losses in this market in the early years of reform. The individual market is where just 7% of the U.S. population gets their insurance (and thus also represents a small share of most health insurers’ business), but the stability of the market and willingness of insurers to continue to participate is essential to the ACA’s success. Going into 2017, there were a number of high-profile exits and premium increases, raising concerns over the stability of the individual market. Although some local markets are likely fragile, the Congressional Budget Office expects the ACA individual market to remain stable across most part of the country.

This data note looks at trends in insurer financial performance in the individual market over the past few years, finding that the market is showing signs of stabilizing. The success of the ACA is dependent on the participation of private insurers in the marketplaces, who will need to be profitable over the long-term to remain in the market.

We use financial data reported by insurance companies to the National Association of Insurance Commissioners and compiled by Mark Farrah Associates to look at the average medical loss ratio (the share of health premiums paid out as claims) from 2011 through 2016 in the individual insurance market. The figures include coverage purchased through the ACA’s marketplaces and ACA-compliant plans purchased directly from insurers outside the marketplaces (which are part of the same risk pool), as well as individual plans originally purchased before the ACA went into effect. When medical loss ratios (MLRs) are higher, insurers are paying out more of their premium income on claims and – considering the relatively high cost of administering individual market plans – it is unlikely insurers can be profitable when MLRs exceed 85 – 90%. The loss ratios shown in this data note differ from the definition of MLR in the ACA, which makes some adjustments for quality improvement and taxes, and also do not account for reinsurance, risk corridors, or risk adjustment payments. Reinsurance payments, in particular, helped offset some losses insurers would have otherwise experienced. However, the ACA’s reinsurance program was temporary, ending in 2016, so loss ratio calculations excluding reinsurance payments are a good indicator of financial stability going forward. We also look at average monthly margins per enrollee over the same period.

In 2014, when the exchanges opened and the bulk of the ACA’s market reforms took effect, individual market insurer financial performance worsened, with individual market MLRs averaging 98% compared to 84% a year prior. The individual market underwent a number of changes in 2014, and insurers had very little information to work with in setting their premiums. On average, insurers set premiums too low to cover their costs in the individual market. This mispricing is likely due to a combination of fewer young or healthy enrollees than initially anticipated, which was augmented by the late regulatory decision to permit some non-compliant plans to be retained, as well as some competitors apparently underpricing in an attempt to be competitive (low-cost silver premiums for 2014 came in substantially lower than CBO projections).

In 2015, as claims growth continued to outpace premiums, individual market MLRs increased again, to an average of 103%. On the exchange markets, premiums remained relatively flat from 2014 to 2015, likely because insurers had not yet gathered enough data on their enrollees’ health care utilization to be able to set premiums more appropriately, and carriers were competing to be the low-cost option. Individual market insurers submitted their 2015 premiums to state and federal regulators in spring of 2014, shortly after the first ACA exchange open enrollment had ended.

Figure 1: Average Individual Market Medical Loss Ratios, 2011 – 2016

It was not until last year that individual market loss ratios began to fall as insurers raised premiums faster than the rate of claims cost growth. 2016 was the first year that insurers had any meaningful data with which to work, though they were still setting premiums with only a partial year of experience (as 2014 open enrollment extended well into the year and insurers had to submit their 2016 premium in spring of 2015). Although insurers’ individual market performance improved on average in 2016, loss ratios remained relatively high. On average, MLRs fell by 7 percentage points from 2015 to 2016 to 96%, but remained higher than 2013 levels and would need to fall further for the industry as a whole to be profitable in this market. (A recent S&P analysis looking at a subset of Blue Cross Blue Shield plans showed a similar pattern.)

Another way to look at individual market financial performance is to examine average gross margins per member per month, or the average amount by which premium income exceeds claims costs per enrollee in a given month. Gross margins are an indicator of performance, but positive margins do not necessarily translate into profitability since they do not account for administrative expenses. Although medical loss ratios are higher now than they were pre-ACA, the total amount of premium income is also higher as many more people are enrolled in this market than before the exchanges opened. Again, we see a similar pattern, where monthly insurer margins in this market worsened in 2014 (dropping from about $37 to $7 per enrollee) and again in 2015 (to a loss of $10 per enrollee), but began to improve in 2016 (increasing by about $24 to $14 per enrollee). However, insurers would need to see a similar rate of improvement in 2017 to reach pre-exchange (2013) margins.

Figure 2: Average Individual Market Gross Margins Per Member Per Month, 2011 – 2016

What does this mean for the exchanges and broader individual market this year and next? On average, we do know that insurers participating in ACA marketplaces raised premiums substantially from 2016 to 2017, with benchmark premiums rising an average of 22%. Marketplace enrollment has held mostly steady, with open enrollment signups totaling 12.2 million for 2017, about half a million below 2016 levels. Assuming claims expenses do not rise unexpectedly, insures may significantly improve their financial performance in this market in 2017.

Though this can be taken as a sign that the market is stabilizing, health insurers still face tremendous uncertainty going forward. Mixed signals from the Administration and Congress over the direction and timing of ACA repeal efforts, and a lack of clarity on individual mandate enforcement and payments for cost-sharing subsidies, could make insurers hesitant to continue to participate, even if the market is showing signs of improving otherwise.

Methods

We analyzed insurer-reported financial data from Health Coverage Portal TM, a market database maintained by Mark Farrah Associates, which includes information from the National Association of Insurance Commissioners. All figures in this data note are for the individual health insurance market as a whole, which includes major medical insurance plans sold both on and off exchange.

To calculate the weighted average loss ratio across the individual market, we divided the market-wide sum of total incurred claims by the sum of all health premiums earned across all 50 states plus DC (the dataset analyzed in this report does not include California HMOs, which report separately to California’s Department of Managed Health Care). Medical loss ratios in this analysis are simple loss ratios and do not adjust for quality improvement expenses, taxes, or risk program payments. Gross margins were calculated by subtracting the sum of total incurred claims from the sum of health premiums earned and dividing by the total number of member months (average monthly enrollment) in the individual insurance market.

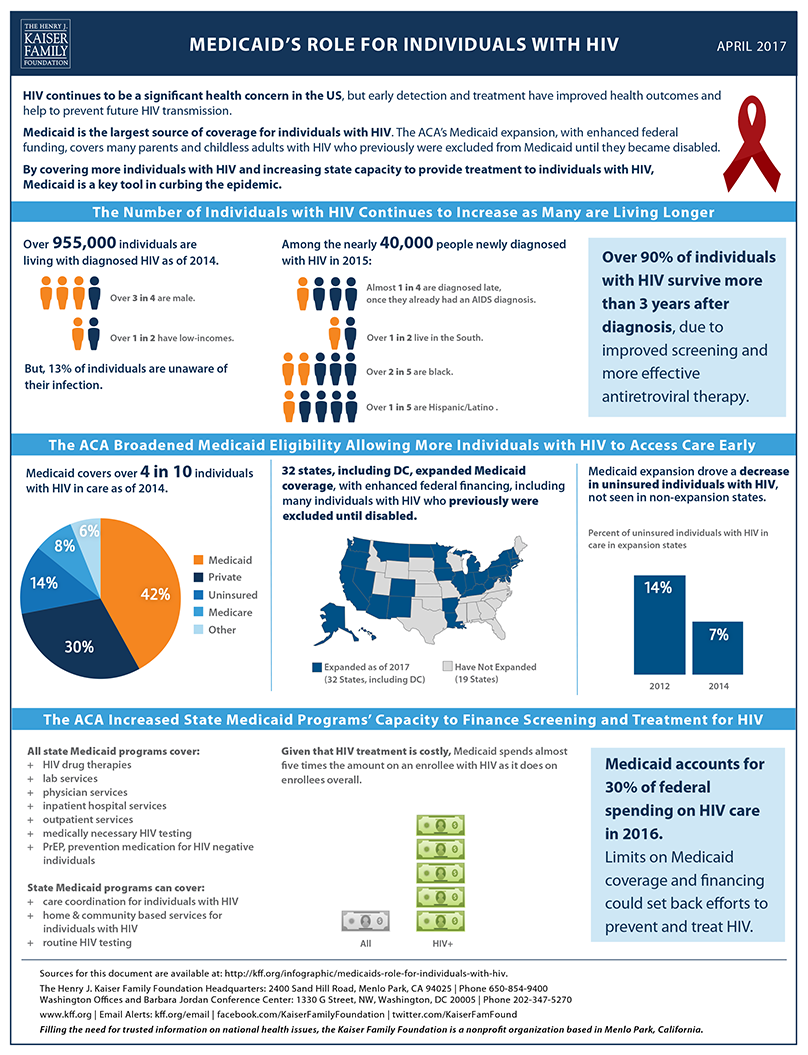
Medicaid’s Role for Individuals with HIV

Published: Apr 18, 2017
Medicaid’s Role in Care for Individuals with HIV by State
StateAdults andadolescents livingwith diagnosed HIV(2014)Annual Rate (per 100,000) of New Diagnosis for Individuals of All Ages(2015)Medicaid Enrollees Living with HIV(2011)Annual Death Rate (per 100,000)of Adults and Adolescents with Diagnosed HIV(2013)Medicaid Coverage of HIV Treatments
HIV Drug Treatment(2017)Lab Services(2017)Routine HIVTesting(2013)*
Expanded Medicaid/Republican Governor
Arizona14,72610.52,6003.9YesYesYes
Arkansas5,1748.79004.4YesYesNo
Illinois34,84311.58,7006.3YesYesYes
Indiana10,2799.62,3003.4YesYesNo
Iowa2,3554.06001.6YesYesNo
Kentucky6,5117.61,2003.2YesYesYes
Maryland32,00222.48,3006.1YesYesNo
Massachusetts19,2908.97,5004.0YesYesYes
Michigan14,9447.35,5002.6YesYesNo
Nevada8,40516.89005.7YesYesYes
New Hampshire1,2401.73001.2YesYesYes
New Jersey35,68213.37,80011.1YesYesYes
New Mexico3,0966.55002.0YesYesYes
North Dakota3062.91000.6YesYesYes
Ohio19,9118.03,8003.1YesYesYes
Vermont6621.93002.1YesYesYes
State Average13,0898.93,2063.816/1616/1611/16
Expanded Medicaid/Democratic or Independent Governor
Alaska6373.32003.4YesYesYes
California119,58912.125,3005.1YesYesYes
Colorado11,1996.98002.4YesYesYes
Connecticut10,2367.64,7006.3YesYesYes
Delaware3,21311.51,6008.2YesYesYes
District of Columbia15,20057.05,80039.7YesYesYes
Hawaii2,7418.06000.9YesYesYes
Louisiana18,95024.25,30012.4YesYesYes
Minnesota7,5495.22,2001.8YesYesYes
Montana5481.81001.1YesYesYes
New York130,75315.859,90014.0YesYesYes
Oregon6,2755.21,4003.0YesYesYes
Pennsylvania33,5939.23,8006.0YesYesYes
Rhode Island2,2646.16002.4YesYesYes
Washington12,0306.32,4003.0YesYesYes
West Virginia1,8964.05002.0YesYesYes
State Average23,54211.572007.016/1616/1616/16
Did Not Expand Medicaid/Republican Governor
Alabama12,4399.92,6007.2YesYesNo
Florida103,69624.025,80013.6YesYesNo
Georgia46,87023.48,2005.6YesYesNo
Idaho1,0312.42000.9YesYesYes
Kansas2,8845.16002.6YesYesYes
Maine1,4543.55001.1YesYesNo
Mississippi8,98317.02,4008.1YesYesNo
Missouri11,5607.73,1003.9YesYesYes
Nebraska2,0144.34001.7YesYesNo
Oklahoma5,6058.21,2003.8YesYesYes
South Carolina15,94214.22,8008.1YesYesNo
South Dakota4922.91000.5YesYesNo
Tennessee16,16310.93,7006.8YesYesYes
Texas77,89616.311,1006.2YesYesYes
Utah2,6183.93000.9YesYesNo
Wisconsin5,9524.02,1001.9YesYesYes
Wyoming2692.61000.7YesYesYes
State Average18,5809.43,8354.317/1717/178/17
Did Not Expand Medicaid/Democratic Governor
North Carolina28,89713.47,3006.7YesYesYes
Virginia21,74011.43,2005.5YesYesNo
State Average25,31912.45,2506.12/22/21/2
*All states are required to cover medically necessary HIV testing; some states have expanded coverage to include routine HIV testing.Data table prepared by Kaiser Family Foundation.

Medicaid’s Role for Individuals with HIV Source List

Center for Disease Control & Prevention. National Center for HIV/AIDS, Viral Hepatitis, STD and TB Prevention (NCHHSTP) Atlas Plus; accessed March 2017.

Center for Disease Control & Prevention. HIV Surveillance Supplemental Report, Monitoring Selected National HIV Prevention and Care Objectives by Using HIV Surveillance Data, Vol. 21, No. 4; July 2016.

Center for Disease Control & Prevention. Communities in Crisis: Is There a Generalized HIV Epidemic in Impoverished Urban Areas of the United States?; accessed March 2017.

Kaiser Family Foundation. HIV/AIDS in the United States: The Basics; February 2017.

Kaiser Family Foundation. Insurance Coverage Changes for People with HIV Under the ACA; February 2017.

Kaiser Family Foundation. Medicaid and HIV; October 2016.


JAMA Forum: Is the Affordable Care Act Imploding?

Author: Larry Levitt
Published: Apr 17, 2017

In this April 2017 post, Larry Levitt discusses the current status of the Affordable Care Act’s health insurance marketplaces, and explains how the Trump administration’s choices — including whether to continue cost-sharing reduction payments to insurers — could influence stability of the marketplaces going forward. The post is now available at The JAMA Forum.

Other contributions to The JAMA Forum are also available.

News Release

New Analysis Examines Proposed Changes to Workplace Wellness Programs

Published: Apr 7, 2017

As Congress considers legislation that would change federal rules governing workplace wellness programs that gather information about workers’ health and risk status, a new Kaiser Family Foundation brief explains how workplace wellness programs could be affected and possible implications for workers with sensitive health conditions.

Among the findings:

  • Seven in 10 (71%) large employers providing health benefits collect personal health information through wellness programs, according to the annual Kaiser Family Foundation/HRET Employer Health Benefits Survey.
  • The pending legislation would affect nearly all workplace wellness programs that ask for personal health information. Under the bill, in these programs, there would be no limit on penalties that could be applied to workers and their dependents who decline to provide sensitive personal health and genetic information.
  • An estimated 38.8 million adults with employer-sponsored insurance (29.8%) have one or more of seven stigmatized health conditions that could trigger privacy concerns, according to an analysis of the 2015 National Survey on Drug Use and Health. These conditions include a sexually transmitted disease, diabetes, a mental health disorder, HIV/AIDS, Hepatitis B or C, pregnancy, or an alcohol or substance use disorder.

Changing Rules for Workplace Wellness Programs: Implications for Sensitive Health Conditions

Authors: Karen Pollitz and Matthew Rae
Published: Apr 7, 2017

Issue Brief

Legislation pending in Congress, HR 1313, would substantially change federal rules governing workplace wellness programs.  Today several federal laws apply to workplace wellness programs.  The Affordable Care Act (ACA) sets standards for a certain type of wellness program, called health contingent programs, used by 8% of large firms (200 or more workers) that offered health benefits in 2016.  Health contingent wellness programs vary health plan premiums or cost sharing based on whether a person achieves a biometric target, such as for blood pressure. The ACA limits penalties that can be applied under such programs.  However, it does not address personal health information collection practices under health contingent wellness programs.  Nor does it limit incentives or set standards for any other types of workplace wellness programs, except to require that programs must be offered to all similarly situated individuals.

Two other laws – the Americans with Disabilities Act (ADA) and the Genetic Information Nondiscrimination Act (GINA) – govern all workplace wellness programs that ask workers and their family members to disclose health information, including genetic information.  Today, the vast majority (71%) of large firms have wellness programs that collect personal health information.  The ADA and GINA prohibit employment discrimination based on health status or genetic information.  As part of that protection, ADA prohibits medical examinations and inquiries that are not job related, and GINA prohibits requests for genetic information, though both laws make exceptions for voluntary wellness programs.  Rules under ADA and GINA limit financial incentives to provide personal health information and submit to medical examinations. GINA also generally prohibits penalties for refusing to disclose genetic information, or health information about children, and both laws set other standards for the collection and use of personal health and genetic information by wellness programs.

Under HR 1313, any wellness program in compliance with ACA requirements would be deemed compliant with ADA and GINA wellness program standards.  As a result, for the vast majority of workplace wellness programs today, there would be no limit on inducements that could be used to encourage workers and their family members to provide personal health information, including genetic information; and other ADA and GINA wellness standards would no longer apply to any workplace wellness programs.

This brief reviews findings from the 2016 Kaiser Family Foundation/HRET Employer Health Benefits Survey related to wellness programs and financial incentives.  It also reviews findings from the 2015 National Survey on Drug Use and Health (NSDUH) related to the incidence of certain sensitive or potentially stigmatized health conditions among adults covered under employer-sponsored health plans.

Collection of Personal Health Information by Workplace Wellness Programs, 2016

Nearly all large firms (90%) that offer health benefits (“offering firms”) offer some type of wellness program, though the term “wellness program” encompasses a range of measures from health screening to more targeted health interventions.  About half (47%) of all offering firms and 83% of large offering firms offered classes, coaching, or other activities to help employees stop smoking, lose weight, or adopt healthier lifestyles.

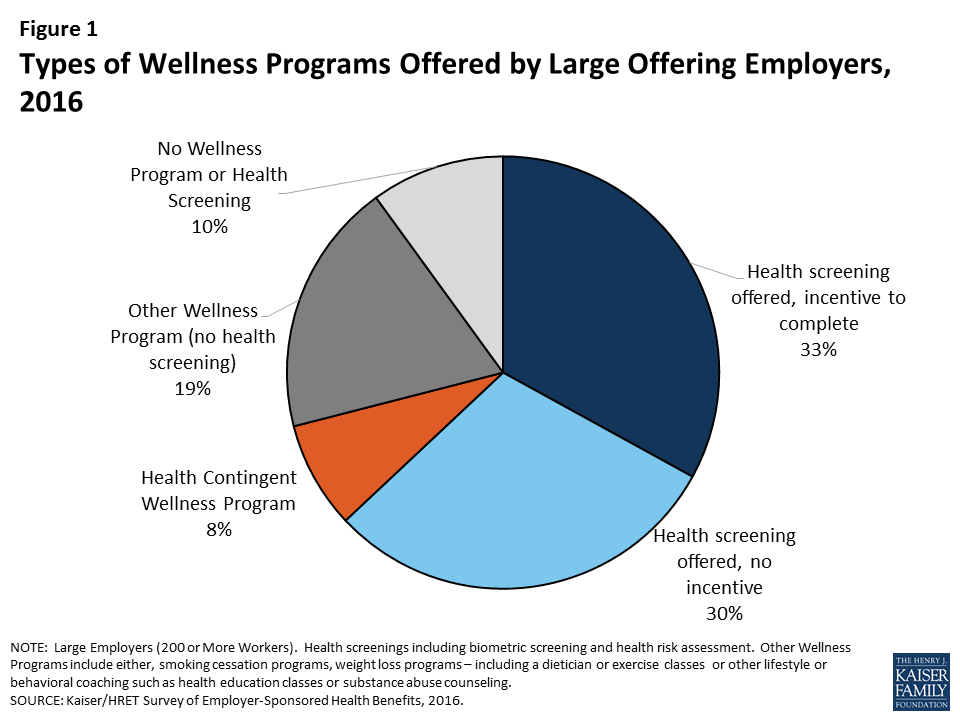
Health contingent wellness programs – Health contingent wellness programs are offered by 8% of large offering firms. (Figure 1)  Such programs must meet ACA standards in order to vary participants’ health plan premiums and cost sharing based on meeting a biometric target such as for BMI or blood glucose levels.

Figure 1: Types of Wellness Programs Offered by Large Offering Employers, 2016

The ACA limits financial incentives under health contingent wellness programs to no more than 30% of the total health plan premium, though the Secretary has authority to raise this cap to 50%.1   For an average cost group health plan in 2016 ($6,435 for self only coverage, $18,142 for family coverage), the average maximum incentive would be $1,930/$5,442.   Among health contingent wellness programs offered by large firms in 2016, 56% set the maximum incentive at greater than $500, 27% set the maximum incentive at greater than $1,000.  Other standards also apply to health contingent programs under the ACA, including requirements to offer alternative standards or accommodations to people who do not meet biometric targets.  The ACA does not address information collection practices of wellness programs.  (Table 1)

For wellness programs that are not health contingent programs, the only requirement under the ACA is that programs must be offered to all similarly situated individuals, regardless of health status.2 

Table 1:  ACA Workplace Wellness Program Standards
Health Contingent ProgramsOther Worksite Wellness Programs
Limits on Incentives
  • Participant premium (or cost sharing) can vary based on achievement of biometric target(s).    The amount of reward or penalty cannot exceed 30% of cost of health plan (employer plus employee share).
  • No limits
Standards for Program Design
  • Must be reasonably designed, no scientific evidence of efficacy required
  • Must offer alternative way to earn reward/avoid penalty to participants who do not meet biometric target
  • Must not be overly burdensome or a subterfuge for discrimination
  • No standards
Eligibility
  • Program must be offered to all similarly situated individuals
  • Same
Standards for information collection
  • None
  • No standards
Confidentiality *
  • HIPAA privacy rules apply to programs offered through group health plans
  • Same
* The ACA did not address confidentiality.  However, HIPAA privacy rules apply to information collected by workplace wellness programs that are offered in conjunction with group health plans.  Employer-sponsored health plans are covered entities, subject to HIPAA, but not the employers that sponsor the plans.

Health screening wellness programs –  Seven in ten large offering firms offer health screening tools to gather information about workers’ health and risk status (71% in 2016).   Screening tools include health risk assessments (HRA) – questionnaires that ask workers to self-report on their health status, medical history, behaviors and attitudes – and biometric screenings – physical exams by a health professional to gather current health data, often including body mass index, blood pressure, blood cholesterol, and blood sugar levels.  In 2016, 59% of large offering employers offered an HRA and 53% offered biometric screening.  By definition, health contingent wellness programs include a health screening component, although 93% of large firm workplace wellness programs that offer health screening are not health contingent programs – that is, they do not also vary participants’ health plan premium or cost sharing based on the results of health screening.  In 9% of large firm programs with screening, screening is the main component with no other offer of wellness activities included in the KFF/HRET survey.3 

Incentives to complete wellness program health screening – In 2016, most (56%) large firms offering wellness screening tools offered incentives to complete them.  Some incentives were nominal, such as gift cards or prizes.  However, over half of firms with incentives for biometric screening (52%) and health risk assessment (51%), require employees that do not complete the screening pay higher premiums and/or cost sharing, compared to those that do.

Under the ADA and GINA, federal requirements apply to workplace wellness programs that collect workers’ health information and genetic information.  Such information can only be collected through voluntary worksite wellness programs.  Recent regulations issued by the Equal Employment Opportunity Commission (EEOC) re-defined “voluntary” under both laws to permit financial inducements as great as 30% of the cost of self-only health coverage – on average, $1,930 in 2016, or twice that amount if spouses can also participate. Recent GINA rules also require that individuals generally cannot be penalized for refusing to submit genetic information to a wellness program and prohibit incentives to disclose health information about employees’ children.  The laws also set other standards for voluntary workplace wellness programs.  (Table 2)

Table 2:  ADA and GINA Standards for Workplace Wellness Programs that Request Personal Health  or Genetic Information
ADAGINA
Limits on Incentives
  • Only voluntary wellness programs can request a worker’s health information.  Employers cannot fire or deny health benefits to workers who do not participate.  Programs can offer incentives or penalties as high as 30% of the cost of self-only coverage and still be considered voluntary.
  • Same as ADA, except a second inducement can apply to the spouse’s medical information

In addition:

  • No individual can be penalized for refusing to submit genetic information4 
  • Programs cannot penalize failure to disclose health information about employees’ children
Standards for Program Design
  • Wellness program must be reasonably designed, no scientific evidence of efficacy required
  • Program must not be overly burdensome or a subterfuge for discrimination
  • Program must not be designed merely to shift costs to employees, or used only to predict future health costs
  • Programs must provide feedback about risk factors or use aggregate information to design programs or treat conditions
  • Same as ADA

In addition:

  • Genetic information can only be requested by a wellness program that offers health or genetic services
Standards for information collection
  • Require advance notice specifying what information will be collected, for what purpose, the limits on disclosure and the way information will be kept confidential.
  • Same as ADA
Confidentiality
  • Information can only be disclosed to employer in aggregate form that does not disclose identity of individuals
  • Employers cannot require employee to agree to the sale, exchange, sharing, transfer, or other disclosure of medical information as condition of participating
  • Same as ADA

In addition:

  • Individually identifiable genetic information can only be shared with the licensed health care professional providing health or genetic services

Wellness programs and sensitive health conditions

Among large firms with an incentive for completing a health risk assessment, 50% of workers complete the assessment compared to 31% at firms with no incentive.  Overall in 2016, 41% of workers at large firms that offer an HRA actually participated in the screening, in 2016.  One commonly cited reason is concern for the privacy of personal health information.  Wellness program HRAs typically include questions about health risks or conditions which people may consider sensitive, especially in a workplace context.  For example, HRAs commonly ask whether and to what extent individuals feel stress, anxiety or depression, whether and how frequently individuals consume alcohol or use illicit drugs, information about current prescription drug use and other medical treatments, and, for women, whether they are pregnant or contemplate pregnancy in the coming year.  Biometric screenings involve physical examinations, often including blood tests.

In general, many Americans are concerned for the privacy of their health information.  Concern may increase when it comes to health conditions that could trigger social stigma (including perceived blame for having the condition) and discrimination.  The medical literature identifies a number of stigmatized conditions, including mental health disorders, alcohol and substance use disorders, HIV and other sexually transmitted diseases, and diabetes.5    People with stigmatized conditions may sometimes take drastic measures to guard their privacy.  For example, according to the US Substance Abuse and Mental Health Administration (SAMHSA), 8 percent of adults who perceived that they needed mental health treatment and did not receive treatment said they did not seek care because of concerns about confidentiality.6 

The 2015 National Survey on Drug Use and Health (NSDUH) collects data on the incidence of a range of health conditions and on the health insurance status and sources of coverage of individuals.  We analyzed NSDUH data on seven potentially stigmatized health conditions to learn the number of adults with job-based health coverage who were affected.  Almost three in ten of such adults in 2015, or nearly 39 million, reported having one or more of these health conditions.  (Table 3)  It is not possible to know from NSDUH data how many of these adults were covered through employers that also offer wellness programs.

Table 3:  Incidence of Stigmatized Health Conditions Among Adult with Employer-Sponsored Health Insurance (ESI), 2015
ConditionPercent Adults with ESINumber of Adults with ESI
Sexually Transmitted Disease (past year)1.9%2,515,067
Diabetes9.0%11,671,723
Mental health disorder15.5%20,213,894
HIV/AIDS0.1%148,278
Hepatitis B or C1.0%1,236,408
Pregnant0.8%1,052,807
Alcohol or substance use disorder (past year)7.5%9,690,737
Any of these conditions29.8%38,819,350
SOURCE: KFF Analysis of 2015 NSDUH SurveyNOTE:  For adults, NSDUH defines mental illness as “having any mental, behavioral, or emotional disorder in the past year that met DSM-IV criteria (excluding developmental disorders and SUDs)”

Discussion

While many individuals may have privacy and discrimination concerns about their employers collecting biometric and health information, those with a stigmatized health conditions may have even stronger concerns.  Even in the face of financial penalties, including higher health insurance premiums, most people offered the opportunity to participate in workplace wellness health screening programs decline to do so.   Current federal law (the ADA and GINA) limit inducements employers can use to encourage workers and their family members to disclose information to wellness programs.

Legislation pending in Congress, HR 1313, would alter the legal landscape.  Under this bill, workplace wellness programs would be deemed in compliance with the ADA and GINA if they comply with the ACA – which limits incentives only for health-contingent wellness programs, and which does not address other practices governed by the ADA and GINA.  Nearly 90% of workplace wellness programs that ask for personal health information are not health contingent programs.  As a result, under most programs, there would be no limit on penalties that could be applied to workers, spouses, and dependent children who decline to provide sensitive personal health and genetic information, and other rules on information collection practices would no longer apply.  In addition, HR 1313 specifies that the “insurance safe harbor” provision of ADA applies to workplace wellness programs, notwithstanding any other provision of law. When ADA was enacted in 1990, the safe harbor had allowed insurers and employer health plan sponsors to use information, including actuarial data, about risks posed by certain health conditions to make decisions about insurability and about the cost of insurance.  This meant certain practices – such as excluding pre-existing conditions or charging people more based on health status – were not considered to violate the ADA ban on discrimination.  After the Affordable Care Act prohibited such practices, EEOC rules clarified that the insurance safe harbor does not apply to workplace wellness programs, even if they are offered as part of a group health plan.  HR 1313 would reverse that decision.

The potential for workplace wellness programs to improve health and save costs continues to hold great appeal for employers and policymakers, alike.  The challenge is to balance this potential with protections to ensure programs do not discriminate against people with health problems or compel disclosure of health information people want to keep private.  As new federal standards for wellness programs are considered, it remains to be seen how these goals will be balanced.

Endnotes

  1. Normally under federal law, group health plans cannot vary premiums based on participants’ health status, but the Affordable Care Act (ACA) permitted such incentives within workplace wellness programs that meet other standards. ↩︎
  2. Under this requirement, for example, it would be permissible for the health plan’s wellness program to be offered to employees but not family members, or to full-time but not part-time employees. ↩︎
  3. This includes “programs to help employees stop smoking”, “programs to help employees lose weight”, “Other lifestyle or behavioral coaching”, such as health education classes stress management or substance abuse.  See 2016 Employer Health Benefit Survey. ↩︎
  4. However, incentives can be offered for a spouse to submit information about his/her past or current health status.  Under GINA, the definition of genetic information includes information about the current and past health status of a family member, including a spouse. ↩︎
  5. See for example, J. Stuber et al, “Stigma, Prejudice, Discrimination, and Health,” Social Science and Medicine, August, 2008.  See also, J. Ablon, “Stigmatized Health Conditions,” Social Science and Medicine, January 1981.  D. Quinn and S. Chaudoir, “Living with a Concealable Stigmatized Identity: The Impact of Anticipated Stigma, Centrality, Salience, and Cultural Stigma on Psychological Distress and Health,” Journal of Personal Social Psychology, October 2009. ↩︎
  6. Center for Behavioral Health Statistics and Quality. (2016). 2015 National Survey on Drug Use and Health: Detailed Tables. Substance Abuse and Mental Health Services Administration, Rockville, MD. ↩︎
News Release

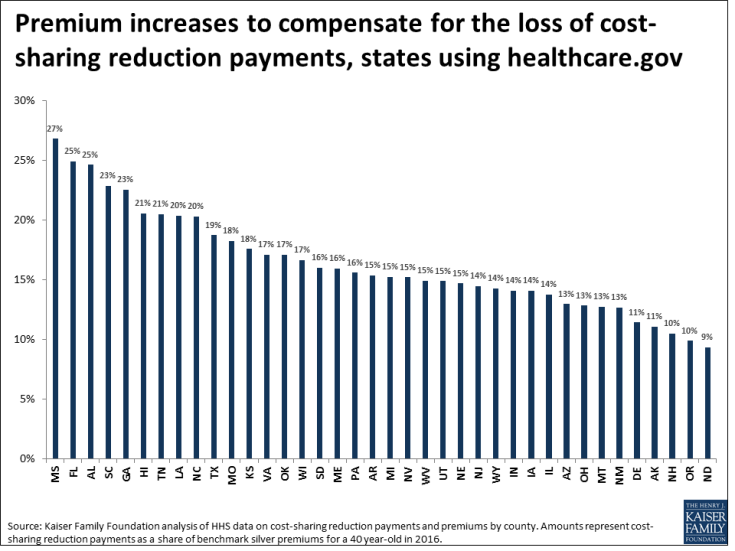
Estimates: Average ACA Marketplace Premiums for Silver Plans Would Need to Increase by 19% to Compensate for Lack of Funding for Cost-Sharing Subsidies

Estimated Increases Range from 9% in North Dakota to 27% in Mississippi

Published: Apr 6, 2017

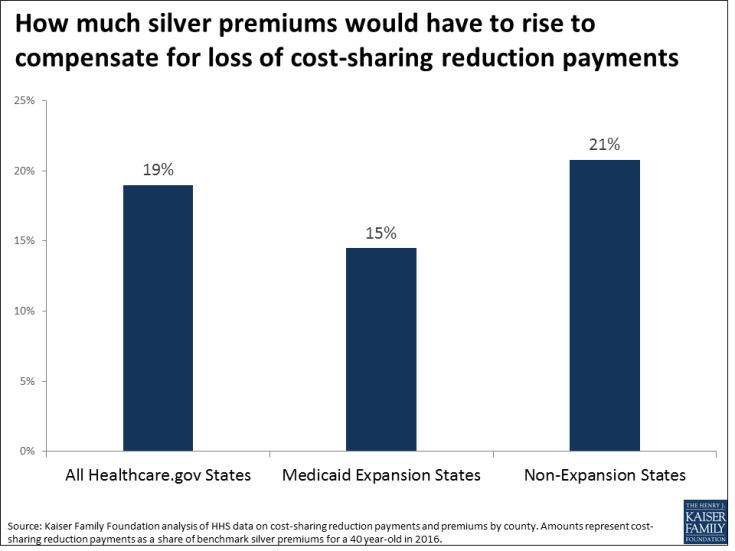
A new Kaiser Family Foundation analysis finds that the average premium for a benchmark silver plan in Affordable Care Act (ACA) marketplaces would need to increase by an estimated 19 percent for insurers to compensate for lost funding if they don’t receive federal payment for ACA cost-sharing subsidies.

Established by the health law to reimburse insurers for the cost of reducing out-of-pocket costs for lower-income people buying marketplace plans (with incomes from 100% to 250% of the poverty level), the subsidies have been challenged in a lawsuit from the U.S. House. With a legal appeal pending, the federal government and Congress are in a position to choose whether to continue reimbursing insurers for their cost.

Among 12.2 million people who selected a 2017 ACA marketplace plan, about 58 percent, or 7.1 million, are receiving cost-sharing reductions. An earlier Foundation analysis of 2017 plans found the subsidies lower combined medical and prescription drug deductibles by as much as $3,354 and reduce annual out-of-pocket maximums by up to $5,587.

The Foundation’s new analysis examines the amount insurers would need to increase premiums to make up for the lack of funding, if federal payments cease for the cost-sharing reduction program.

The analysis – based on cost-sharing subsidy payments and benchmark premiums in federal marketplace states in 2016, the most recent data available — finds that the estimated premium increase for silver plans would be higher (21%) in states that did not expand Medicaid under the ACA than in states that expanded Medicaid (15%). Cost-sharing subsidies are generally higher in states that have not expanded Medicaid because they have a larger share of enrollees with incomes from 100% to 150% of the poverty level, who get the biggest cost-sharing reductions.

Estimated premium changes vary for the 38 states that used healthcare.gov in 2016, ranging from 9 percent in North Dakota to 27 percent in Mississippi.

Foundation experts discussed the analysis today during a web briefing for journalists: ACA Cost-Sharing Subsidies: How One Decision Could Disrupt Obamacare Marketplaces. Watch the archived recording here.

Governors’ Proposed Budgets for FY 2018: Focus on Medicaid and Other Health Priorities

Authors: Larisa Antonisse, Elizabeth Hinton, Robin Rudowitz, Kathleen Gifford, and Nicole McMahon
Published: Apr 6, 2017

Executive Summary

This report provides Medicaid highlights from governors’ proposed budgets for state fiscal year (FY) 2018, which runs from July 1, 2017 through June 30, 2018 in most states.1  Proposed budgets reflect the priorities of the governor and are often blueprints for the legislature to consider. As of the 2017 legislative session, 31 governors are from the same party as their legislatures (24 Republican and 7 Democratic states) and 18 governors are from different parties than their legislatures.2 ,3  As governors were issuing proposed budgets for FY 2018, federal lawmakers were debating the American Health Care Act (AHCA) which included major changes to the ACA as well as fundamental reforms for the structure and funding of the Medicaid program. While the AHCA failed to pass in the House, discussions on Medicaid reform are likely to continue at the federal level.

The analysis is based on a review of proposed state budget documents, news reports, and other relevant documents. In total, 47 states will enact a new budget for FY 2018 while three states (Kentucky, Virginia, and Wyoming) have previously enacted budgets that cover FYs 2017 and 2018. We reviewed 48 proposed state budgets (including proposed supplemental changes to the 2017-2018 biennium budgets for Virginia and Wyoming). Key findings from the report are highlighted below.

Key Takeaways

  • While a number of states have improving economies and stable state finances, nearly half are facing budget challenges for FY 2018 and relatively weak state revenue growth. While experiences vary across states, at least 12 governors are proposing broad-based state budget cuts for FY 2018.
  • Despite some budget challenges, governors are proposing more enhancements to Medicaid compared to restrictions. For example, governors proposing provider rate increases or benefit enhancements for FY 2018 outnumber the governors proposing rate cuts or benefit restrictions. Many governors continue to propose policies to expand the use of managed care and community-based long term services and supports.
  • Despite federal debates regarding the ACA and Medicaid, proposed budgets continued to build on Medicaid as well as ACA Medicaid expansion coverage to address broader health priorities including the opioid epidemic, behavioral health issues, and treatment for persons involved with the criminal justice system.

Issue Brief

Introduction

Medicaid now provides health insurance coverage to more than one in five Americans, and accounts for nearly one-sixth of all U.S. health care expenditures.4  Medicaid is jointly financed by the states and the federal government. In FY 2015, Medicaid accounted for 28.2 percent of total state spending (including state and federal funding) for all items in the state budget, but 15.6 percent of all state spending (from general fund and other state funds), a far second to state spending on K-12 education (24.8%). Medicaid is the largest single source of federal funds for states, accounting for more than half (56.8%) of all federally supported spending by states in SFY 2015, according to data from the National Association of State Budget Officers. Increases in Medicaid as a share of overall state budgets have been driven by coverage expansions resulting from the Affordable Care Act (ACA), especially for the 32 states (including DC) that have thus far taken advantage of the ACA Medicaid expansion for adults up to 138 percent of the Federal Poverty Level (FPL). That expansion included an enhanced federal match rate (known as the federal medical assistance percentage, or “FMAP”) for expansion populations which began at 100 percent in 2014, but phases down (starting at 95 percent in January 2017) to 90 percent in 2020 and future years.

While the federal government continues to bear almost the entire cost for ACA Medicaid expansion populations, many states currently face budget challenges in an environment of relatively weak state revenue growth. After seven straight quarters of growth, total state tax revenues fell by 2.1 percent in the second quarter of 2016 (compared to the second quarter of 2015) with tax collections falling in about half the states.5  Modest growth (1.2 percent) resumed in the third quarter of 2016 with even weaker growth (0.04 percent) projected for the fourth quarter leading to a gloomy state budget outlook for the remainder of FY 2017 for some states.6  At the time that states adopted their budgets for FY 2017, the state share of Medicaid spending, on average, was budgeted to grow by 4.4 percent representing an increase over FY 2016 (2.9%) largely due to the FMAP reduction for ACA expansion enrollees that took effect in January 2017.7 

As state policymakers in most states approach the task of adopting a state budget for FY 2018, they do so against the backdrop of great uncertainty at the federal level regarding health care and federal tax policy. President Trump and other GOP leaders have called for the repeal and replacement of the ACA as well as fundamental changes regarding the structure and financing of Medicaid generally. At the same time, GOP leaders have expressed the goal of enacting federal tax reform legislation which could have significant impacts on state economies and state revenue collections. Further, other federal budget proposals, from federal hiring freezes and discretionary program cuts on the negative side to potential new infrastructure funding and defense spending increases on the positive side, could have widely disparate impacts across the states that are currently impossible to predict.

Methods

This report provides Medicaid highlights from governors’ proposed budgets for state fiscal year (FY) 2018, which runs from July 1, 2017 through June 30, 2018 in most states.8  The analysis is based on a review of state budget documents, news reports, and other relevant documents. Links to proposed budget documents can be found in Appendix Table 3. In total, 47 states will enact a new budget for FY 2018 while three states (Kentucky, Virginia, and Wyoming) have previously enacted budgets that cover FYs 2017 and 2018. We reviewed 48 state budgets (including proposed supplemental changes to the 2017-2018 biennium budgets for Virginia and Wyoming). Generally, proposed budgets were released late in 2016 and early in 2017. Also, Arkansas and the District of Columbia had not released proposed budgets for FY 2018 at the time of this analysis (DC’s budget year does not begin until October 1, 2017).

This analysis is not comprehensive but is designed to capture major new proposals and changes included in the proposed budgets (also see Appendix Table 1 for Medicaid policy action counts by state). The level of detail presented in governors’ proposed budget documents varies significantly and in most cases does not capture all of the activity in a given state. Governors’ budgets commonly include both funding for state initiatives that are already in place or approved by the state legislature as well as proposals for new policies or initiatives that have not yet been adopted. Often proposed budgets are very different than what is ultimately approved by the state legislature. In addition, some proposed budgets include proposals that would also need to be approved by the Centers for Medicare and Medicaid Services (CMS) before a state could implement the policy. In the summer of 2017, the Kaiser Program on Medicaid and the Uninsured with Health Management Associates will conduct a more comprehensive review of Medicaid changes that were adopted in state budgets for FY 2018. As in previous years, this annual 50-state Medicaid budget survey report should be available in the fall.

Key Findings

Budget Message

While a number of states have improving economies and stable state finances, half are facing budget challenges for FY 2018. Recovery from the Great Recession has been slow and uneven across the states with 32 states spending less in FY 2016 than the pre-recession peak in FY 2008 after adjusting for inflation.9  Individual state results vary widely due, in part, to economic differences and state specific changes in state tax policy. For example, state budgets that rely most heavily on oil and mineral severance taxes (i.e., Alaska, Louisiana, New Mexico, North Dakota, Oklahoma, Texas, West Virginia and Wyoming) have been hard hit by falling gas and coal prices which have led to cuts in production and employment.10  Other states, however, have also experienced declining state revenues in recent quarters including Alabama, Arkansas, Hawaii, Illinois, Kansas, New York, Ohio, and Pennsylvania in the third quarter of 2016 and, in the fourth quarter of 2016, projected declines for California, Connecticut, Delaware, Illinois, Kansas, Maryland, Minnesota, Missouri, Montana, Nebraska, Ohio, and Vermont.11  A few states are also dealing with significant structural imbalances. Examples include the following:

  • Connecticut is facing a $1.5 billion deficit for FY 2018 requiring deep cuts to agency budgets. Pennsylvania is facing a $3 billion deficit leading the governor to call for $2 billion in cuts and savings measures for FY 2018. West Virginia is proposing a combination of cuts and revenue enhancements and a reduction in the size of state government to address the FY 2018 state budget forecast that the governor called the “worst we’ve seen since the Great Depression.”
  • Illinois has $11 billion in unpaid bills, a $130 billion unfunded pension liability, and has not had a full year budget since FY 2015. Kentucky’s governor has called on the Kentucky legislature to address underfunding of the state’s pension system which he called “a crisis.”
  • Kansas is working to achieve a structural balance by FY 2019 after several years of imbalance exacerbated by tax cuts passed in 2012.
  • Maryland’s proposed budget for FY 2018 addresses a $544 million shortfall by spending less in General Funds in FY 2018 than in FY 2017 and by holding Total Fund growth to 1.1 percent—the second-lowest year-over-year percentage increase since at least 1970.

Overall, at least 12 governors are proposing broad-based state budget cuts for FY 2018. For example, of the 55 executive agencies that receive General Fund appropriations in New Mexico, 49 of them took a 5.5 percent reduction for FY 2017 which is proposed to remain in place in FY 2018. In North Dakota, all agencies were asked to identify budget savings of 10 percent of this biennium’s ongoing appropriations.

A few governors reported more positive economic and state budget outlooks. For example, the Idaho governor reported that finances are secure, revenues are exceeding expectations, and economic growth is outpacing the overall growth of government; the Tennessee governor stated that “the state of our state has never been better,” with economic growth outpacing the national economy, a triple-A credit rating, and a Rainy Day Fund that is projected to reach an all-time high in FY 2018; and the Minnesota governor reported on six years of improvement in the state’s budget outlook moving from deficits to surpluses.

Proposed budgets prioritize K-12 and higher education funding and fostering a strong economy. Education accounts for the largest share of state General Fund budgets and continues to be the highest budget priority in most states. Many governors also proposed initiatives to foster a stronger economy including tax modernization efforts, workforce training initiatives, and infrastructure investments including transportation-related infrastructure, but also broadband expansions to rural areas. Other priorities that spanned multiple governors’ budgets included increased investments in public safety and law enforcement, criminal justice and corrections-related initiatives, efforts to improve the child protection and foster care systems, and health care improvement or expansion efforts, including efforts to address mental health and addiction issues. A few governors are also proposing environmental efforts to improve water and air quality.

Governors proposing tax cuts significantly outnumbered those proposing tax increases. Despite significant budget challenges in many states, most governors proposed FY 2018 budgets that include no new taxes. Proposed budgets in at least 17 states included various tax cut proposals (although four of these states – Maine, Oklahoma, Tennessee, and Washington – also proposed tax increases in other areas). A wide variety of tax cuts were proposed including to income taxes, sales taxes (such as eliminating the sales tax on groceries), and business taxes as well as efforts to provide property tax relief at the local level. For example, Florida’s proposed budget cuts business income taxes; provides sales tax holidays for back-to-school sales, disaster preparedness purchases, and veterans’ sales as well as a one-day camping and fishing sales tax holiday; and exempts seniors and veterans from certain fees. South Carolina’s governor is proposing a 1 percent rate reduction over ten years in the personal income tax and a 2.5 percent rate reduction over ten years to all corporate income tax.

At least 10 governors are proposing tax increases including several proposing to expand the sales tax base to professional services or on-line sales (Maine, Oklahoma, West Virginia, Utah, and Washington); two proposing to increase motor fuels taxes (Alaska and Tennessee); four proposing to increase tobacco taxes (Delaware, Kansas, Oklahoma, and Oregon), and three proposing increases to alcoholic beverage taxes (Kansas, Oregon, and West Virginia). Additional proposed tax increases include:

  • Delaware’s governor proposed increases to personal income and corporate franchise taxes.
  • Kansas’ governor proposed increasing taxes on passive income.
  • Washington’s governor proposed a new capital gains tax, increasing the business and occupation tax rate that is applied to a broad range of personal and professional services, and enacting a new tax on carbon pollution associated with the production and consumption of fossil fuels.
  • Oklahoma’s governor proposed a number of revenue changes with the goal of diversifying and strengthening state revenues and generating $1.5 billion in recurring revenue. Changes proposed include sales tax modernization, elimination of corporate income tax, transportation-related taxes and fees, a cigarette tax increase, a wind production tax, and an increase in the excise tax for commercial trucks.

Medicaid Policy Actions

Provider Payment Rates and Taxes

State actions on provider rate changes are generally tied to state fiscal conditions. During economic downturns, states tend to cut rates and when economic conditions improve states are less likely to cut rates and more likely to restore rate cuts or increase rates. Governors proposing provider rate increases for FY 2018 outnumber the governors proposing cuts or freezes. Of the 21 governors proposing increases, three governors proposed across the board increases for most provider types and five governors targeted nursing facilities for increases or restoration of inflationary adjustments (Table 1). Nevada (Adult Day Health, Assisted Living and Swing Beds) and Wisconsin (ICF/DDs) also proposed increases for other long term care providers, Hawaii and Ohio proposed to adjust waiver rates, and North Dakota proposed restoring a 10 percent rate cut for homemaker services. Also, seven governors proposed wage increases or overtime for home care workers, nursing home workers, or mental health direct care workers (Table 1).

Of the 16 governors proposing provider rate cuts, two governors proposed across the board cuts for most providers: 3 percent in Nebraska and 3.3 percent in Wyoming (excluding ID/DD waivers). Wyoming’s governor also proposed reimbursement reductions for Medicare cross-over claims.

Table 1: Governors Proposing Selected Provider Rate Changes
Provider payment increasesProvider payment freezes/cuts
Across the board rate changes for most providersKS, MD, SDNE, WY
Hospital payment changesNJ, NC, TNCT, IN, FL, NH, OH, RI, VT
Nursing facility payment changesHI, NV, ND, VA, WICT, IN, NY, OH, RI
Wage changes or overtime for home care workers, nursing home staff, or mental health direct care workersAZ, MI, RI, TN, VA, WA, WI
Managed care organization rate changesUTFL, LA, OR

Other examples of governors proposing rate increases or freezes/cuts not listed above include:

  • Targeted increases for primary care providers and OB/GYNs in Georgia, transportation providers in Missouri, and pediatric surgeons in Nevada.
  • Proposed reductions in Kansas and Nevada for laboratory services and in Nevada for ambulatory surgery centers.
  • Proposed elimination of facility fees for hospital-based physicians in Maine and Massachusetts and removal of inflationary adjustments for ICFs/DD in Connecticut.
  • Proposed 14 percent dental rate cut in Delaware.
  • Proposed extension of a 3 percent cut (that would otherwise have expired) for home health services in Indiana.
  • New York’s governor would reduce the state’s pharmacy costs by establishing requirements for manufacturers to pay an additional rebate for certain high priced drugs and imposing a surcharge on these drugs when they are sold into the state.
  • Oregon’s governor would reduce inflationary adjustments in the state’s FFS delivery system.

Eight governors are also proposing to impose new or increased provider taxes to help finance Medicaid spending growth including five governors (Georgia, Maine, Kansas, Oregon, and Texas) renewing or increasing a hospital tax, three governors imposing or increasing a managed care tax (Kansas, Ohio, and Oregon), one governor imposing a new nursing facility tax (North Dakota) and one governor reinstating a pharmacy tax (Alabama). Other types of Medicaid financing initiatives proposed include a faculty supplemental payment program in Colorado, increased use of tobacco tax revenues in Georgia and North Dakota, increased Medicaid claiming by schools in Connecticut, and increased federal funding for services provided for Native Americans in Kansas and New Mexico.

Eligibility Changes

Only a few governors are proposing changes to Medicaid eligibility policies. Some of these changes assume the continuation of the ACA status quo including proposed budgets in two states that recommend adoption of the ACA Medicaid expansion (North Carolina and Virginia) and a proposal in Connecticut to reduce income eligibility for parents and relative caregivers to 138 percent FPL (to align with current Marketplace coverage). Two other governors are proposing eligibility expansions: using a Medicaid waiver, Idaho’s governor is proposing to expand Medicaid coverage to children with a serious emotional disturbance with family incomes below 300 percent FPL to meet the terms of a litigation settlement agreement, and North Dakota’s governor is proposing to increase the age limit for its Autism waiver. Five governors are proposing eligibility restrictions:

  • Connecticut’s governor proposes to reduce income eligibility levels for the Medicare Buy-in program to those in effect prior to FY 2010 (but the asset test that was in place at that time would not be re-instituted).
  • Kentucky’s governor would add a requirement for certain “able-bodied” adults to perform at least 20 hours of community engagement or employment activities each week.12 
  • New York’s governor would require legally responsible spouses/relatives to support the cost of caring for an institutionalized family member receiving Medicaid.
  • Wisconsin’s governor would impose a requirement on childless adults that are not employed or who are underemployed to participate in employment and training services.
  • Maine’s governor would end Medicaid eligibility for “able-bodied” parents with incomes above 40 percent FPL.
Benefits, Premiums and Cost-Sharing

Benefit actions are influenced by economic trends. Changes to dental coverage as well as other optional benefits are particularly affected by economic conditions. Nine governors are proposing benefit enhancements while only four governors are proposing benefit reductions. Five governors are proposing changes to adult dental benefits: three would add or restore benefits (Arizona, Hawaii, and Utah) while two governors would impose or reduce a dental benefit cap (Connecticut and Nebraska). Four governors (California, Georgia, Maryland, and Washington) are proposing new or expanded behavioral health services, governors in Oregon and Washington are proposing expanded coverage of Hepatitis C treatment, and Nevada’s governor would expand podiatry coverage. Nevada’s governor is also proposing to reduce the number of case management hours allowed per month for certain enrollees and New York’s governor is proposing to eliminate coverage of some over-the-counter (OTC) pharmacy products.

Given that Medicaid serves low-income populations, copayments and premiums in the program are generally limited. States may charge premiums for enrollees with incomes above 150 percent FPL.13  States also may charge cost sharing, but allowable charges vary by income.14  Four governors are proposing new cost-sharing requirements: Ohio’s governor is proposing to impose a premium requirement on childless adults, Wisconsin’s governor would expand the current premium requirement to all disabled adults in its Medicaid Purchase Plan program, New Mexico’s governor is proposing to impose copayment requirements on higher income enrollees, and New York’s governor is proposing to increase copayments amounts for OTC pharmacy products.

Delivery system/Managed Care reforms

Managed care has become the predominant delivery system for Medicaid in most states, as Medicaid programs have increasingly turned to managed care as a means to help ensure access, improve quality, and achieve budget certainty. A growing number of states are focusing on integration of physical health, behavioral health, and long-term services and supports (LTSS) under the umbrella of managed care. States are also adopting other payment and delivery reforms including patient-centered medical homes, health homes accountable care organizations among others. At least 11 states are proposing new or expanded delivery system or managed care reforms:

  • Managed Care. Mississippi (expanding the number of plans), Missouri (expanding statewide) and Pennsylvania (regional expansion) are expanding capitated managed care programs. Oklahoma is implementing a new capitated managed care program.
  • MLTSS. New Hampshire is proposing to implement Managed Long Term Services and Supports (MLTSS) and also move 50 percent of Medicaid provider payments to alternative payment models by 2020.
  • Behavioral Health. Ohio is proposing to carve-in behavioral health services into managed care. Washington is continuing to invest in behavioral health integration.
  • Other. Alaska is implementing a new primary care case management (PCCM) program. Colorado is expanding enrollment in its Accountable Care Collaborative. California is planning to expand its Drug Medi-Cal Organized Delivery System pilot program to additional counties. Oklahoma is updating its Patient Centered Medical Home payment structure to meet the requirements of CMS’ Comprehensive Primary Care Plus Initiative.

One state is reversing a managed care expansion: North Dakota is planning to transition Medicaid expansion adults from capitated managed care back to a fee for service delivery system. Also, California is delaying the transition of California Children’s Services into managed care until July 1, 2018.

Community-Based Long Term Services and Supports

At least 19 governors are proposing to expand the availability of Medicaid community-based long term services and supports (LTSS), continuing a long term trend over the past more than two decades to rebalance services away from institutional care towards care in home and community-based settings. A majority of these governors were specifically targeting home and community-based services (HCBS) expansions for persons with intellectual and developmental disabilities (IDD) (Table 2), including one governor (Alaska) who is proposing to use the 1915(i) State Plan option to refinance services currently provided through the state’s Community Developmental Disabilities Grant program to 969 consumers. Six governors are proposing to expand the number of seniors and persons with disabilities receiving HCBS (Table 2). South Carolina’s governor is proposing to expand HCBS to persons with traumatic brain injuries, and Wisconsin’s governor is proposing to eliminate an HCBS waiting list of 2,200 children with IDD, physical disabilities, and Severe Emotional Disturbances. Washington is planning to implement its recently approved Section 1115 waiver that includes new services and supports for family caregivers who help people stay at home and avoid the need for more intensive services.

Two governors are proposing additional funding for Money Follows the Person initiatives (that help persons return to the community from an institutional placement) (Table 2). One governor (Oklahoma) is proposing continuing a Money Follows the Person program for tribal partners that is working to design an effective and culturally sensitive package of Medicaid community-based LTSS that responds to the unique needs of tribal communities.

Table 2: Proposed Actions to Expand Community-Based LTSS
Expand home and community-based services (HCBS) for persons with intellectual and developmental disabilities (IDD)AK, CO, CT, FL, GA, MD, MT, NE, NJ, TN, WI
Expand the number of seniors and persons with disabilities receiving HCBSFL, GA, KS, MT, NJ, UT
Additional funding for Money Follows the Person initiativesCO, ND
Medicaid Administration

A number of states are also proposing a wide array of initiatives to improve or enhance the administration of the Medicaid program. At least four governors are proposing funding for or new eligibility-related enhancements:

  • Nebraska and Nevada are implementing new Asset Verification Systems, and Nevada is automating the Medicare Part B Buy-in process (to ensure Medicaid remains the payer of last resort).
  • Oregon is proposing eligibility system enhancements to further automate and streamline the determination process.
  • Tennessee’s governor is proposing to fund a new eligibility system and expand the number of eligibility determination state workers.

Three states (Colorado, Nebraska, and Oklahoma) are proposing changes to their utilization management (UM) functions. In addition, Nevada’s governor is funding Phase III of its Medicaid Management Information System (MMIS) replacement project, Nebraska is planning to merge the Medicaid and CHIP programs and appropriations to achieve efficiencies, and Pennsylvania is planning to merge multiple departments into one Department of Health and Human Services with the goals of saving money, eliminating duplication, and streamlining delivery of services to seniors, people with IDD, and people battling addictions.

Other proposed administrative improvements include: streamlining accreditation of home health and hospice agencies by recognizing accreditation from CMS approved organizations as evidence for state licensure (Wisconsin); providing school-based claiming assistance to schools (Idaho), implementing a broker contract for non-emergency medical transportation (Michigan), program integrity enhancements (Massachusetts and Oregon), and increasing the reimbursement rate for lead investigations (Wisconsin). Also, California is proposing additional funding to implement the new Medicaid managed care regulations, Virginia is proposing funding to enhance its estate recovery efforts and comply with the recent federal regulation requiring periodic access analyses, and South Carolina is proposing to defund and repeal its Certificate of Need program.

Changes to ACA or Medicaid Expansion, Other Reform Proposals

As state policymakers debate state budget priorities and decisions for FY 2018, federal lawmakers are considering major changes to much of the ACA as well as fundamental reforms to the structure and funding of the Medicaid program. With the outcome of the federal debate still uncertain, the proposed state budgets reviewed do not reflect or assume a particular outcome and only a few propose ACA-related changes or reforms:

  • The governors’ proposed budgets in North Carolina and Virginia recommend the ACA Medicaid expansion. In Virginia, the proposed budget provides authority for the governor to implement the expansion if enhanced FMAP is available after October 1, 2017.
  • Conversely, the governor of Wyoming is not proposing the ACA Medicaid expansion for FY 2018 (despite recommending the expansion in the past), indicating that it would be more prudent to wait and see what actions are taken at the federal level.
  • California’s Newly Qualified Immigrant Benefits and Affordability Program would transition coverage of eligible adults without children from state-only Medi‑Cal to a Qualified Health Plan in the Health Benefit Exchange, with Department of Health Care Services providing premium and out‑of‑pocket payment assistance and wraparound benefits not covered by the Exchange plan. California’s governor is proposing that all new qualified adults be included in the wrap program effective January 1, 2018 to ensure that their coverage meets the minimum essential coverage requirements under the ACA.
  • Minnesota’s governor is proposing to offer a public option in the Minnesota Marketplace. Governor Dayton’s plan would allow Minnesotans who earn more than 200 percent FPL the opportunity to purchase MinnesotaCare coverage through MNsure.15 
  • Vermont’s governor is proposing to implement direct enrollment for non-Medicaid clients in Marketplace plans, removing the state as a middle-man between health insurance companies and Vermonters who do not qualify for subsidies.

While not recommending specific actions, governors in Connecticut and Washington referenced potential adverse consequences of ACA repeal and other Medicaid reform proposals. Connecticut Governor Malloy indicated the reductions in federal support would “likely force Connecticut to limit services, to drastically cut coverage to thousands, and as a result, could shift health care provision to inappropriate and more costly venues such as hospital emergency rooms, shelters, and prisons.” Washington Governor Inslee pledged that he would “fight and keep fighting to protect the 750,000 Washingtonians who finally have health insurance, thanks to the Affordable Care Act and Medicaid expansion.” Many Governors have also responded to Congressional requests for input about Medicaid and the ACA.16 

Addressing broader public health issues

Initiatives to Fight the Opioid Epidemic

With overdose deaths from prescription opioid pain medications and other narcotics rapidly increasing across the country, many governors are proposing new and expanded Medicaid and non-Medicaid substance use disorder treatment and prevention efforts along with other prescriber monitoring and criminal justice-related initiatives. Over half of the governors’ budgets reviewed cited at least one new priority in this area (Appendix Table 2). Examples include the following:

Table 3: Examples of Proposed Initiatives to Fight the Opioid Epidemic
AlaskaImprove provider access to the state’s Prescription Drug Monitoring Program (PDMP) by integrating it with the state’s Health Information Exchange.
ArizonaFund five new Medicaid staff positions dedicated to using data analytics to identify needs for member interventions related to opioid misuse or improper opioid prescribing.
IndianaCreate the role of Executive Director of Drug Treatment, Prevention & Enforcement to direct all efforts across state government and address the drug epidemic in a targeted and comprehensive manner.
MassachusettsContinue a multi-pronged approach including increased spending for prevention and treatment, funding to investigate fraudulent prescribing practices, expanding heroin and fentanyl trafficking enforcement, funding a statewide campaign to raise awareness of the Good Samaritan law, and funding for student drug diversion and education programs.
MinnesotaProposed $4 million in FY 2018 for prevention grants to reduce the number of opioid overdoses in Minnesota’s American Indian communities.
NevadaIntroduce the “Controlled Substance Abuse Prevention Act” to provide more training and reporting and heightened protocols for medical professionals.
New JerseyMultiple proposed initiatives include: create a one-stop website and hotline to access treatment, increase treatment funding, develop curriculum for schools on opioids, and fund college housing for students in recovery.
OklahomaEnhance public and internal educational opportunities, develop an opioid/heroin task force to address the growing presence and abuse of these drugs, increase inspections of Narcotics Treatment Programs (NTP’s), register 100 percent of all practitioners for the new Prescription Monitoring Program (PMP) system who administer, prescribe, or dispense controlled substances, upgrade the security requirements within the new PMP to ensure appropriate use and auditing of the accounts for users of the PMP, implement an initiative to help identify “at risk” persons for prescription drug abuse and provide those persons education and/or drug treatment opportunities, and increase the Oklahoma Bureau of Narcotics and Dangerous Drugs Control’s presence in the rural communities of Oklahoma, especially in those areas that are lacking the necessary resources to combat their specific drug issues.

Initiatives to Enhance Behavioral Health Services

The ACA has dramatically expanded coverage for mental health and substance use disorder services in the United States. In addition to the ACA Medicaid and Marketplace coverage expansions, the ACA also requires all new small group and individual Marketplace plans to cover ten Essential Health Benefit categories, including mental health and substance use disorder services, and requires coverage parity with medical and surgical benefits. These requirements build on the Mental Health Parity and Addiction Equity Act of 2008 (MHPAEA, or the federal parity law), which requires group health plans and insurers that offer mental health and substance use disorder benefits to provide coverage that is comparable to coverage for general medical and surgical care.

Proposed state budgets for FY 2018 reflect the growing national focus on behavioral health prevention, treatment, and recovery. In addition to the opioid-related initiatives described above, many states are proposing enhancements to inpatient and outpatient behavioral health delivery systems, including Medicaid-related initiatives as well as enhancements to state and locally-funded programs and facilities (Appendix Table 2). Examples include the following:

Table 4: Examples of Proposed Initiatives to Enhance Behavioral Health Services
ArkansasNew funding for crisis intervention training to help the law enforcement community and others identify mental illness and the help that is needed.
MichiganProposed budget includes new funding to provide wage increases to support direct care workers who provide critical hands-on supports and services (e.g., personal care services, mobility support) to residents served through Michigan’s community mental health system with the goal or reducing turnover and improving quality.
Rhode IslandProposed $9.9 million to provide low cost housing for people with mental illness.
South CarolinaAdditional funding to expand school based mental health services for children.

Other governors proposing initiatives to enhance behavioral health services include:

  • Governors in Georgia, Washington, and Wisconsin are proposing new funding for crisis centers: Georgia’s governor would establish a behavioral health crisis center to address emergency crisis needs for individuals with mental illnesses; Washington’s governor would create two new community crisis walk-in centers that allow individuals in mental health crisis to stay up to 23 hours under observation, and Wisconsin’s governor would create an eight bed Crisis Treatment and Stabilization Facility for children to improve outcomes of children in crisis.
  • Idaho’s governor is proposing to build an adolescent mental health facility in the Treasure Valley.
  • Missouri’s governor is proposing new funding to participate in a federal demonstration program – the Certified Community Behavioral Health Clinic Prospective Payment System Demonstration. The project will develop a system to serve individuals with serious mental illness and substance use disorders while promoting the delivery of efficient and effective care.
  • New Hampshire’s governor proposes to increase funding for behavioral health workers by $3 million to strengthen New Hampshire’s community mental health safety net.
  • Washington’s proposed budget would overhaul the state’s mental health system and continue investments in behavioral health integration. In addition to short-term investments to address challenges at a state hospital, the state would significantly expand resources to serve people in community settings.

The ACA coverage expansions and mental health parity requirements have also led many states to implement new initiatives targeting persons involved with the criminal justice system with the goal of saving money and reducing recidivism through improved health care coverage and treatment. Proposed budgets in a number of states include new or expanded initiatives in this area (Appendix Table 2). Examples include the following:

Table 5: Examples of Proposed Health-Related Corrections and Criminal Justice Initiatives
MissouriCreate specialty courts focused on nonviolent offenders with mental health or addiction issues with the goal of reducing recidivism rates through treatment (also proposed in Michigan and Nevada), create specialty courts for veterans struggling with mental health and substance use issues.
New MexicoIncreased funding in both FY 2017 and FY 2018 to cover a variety of costs including costs associated with the treatment of prisoners with Hepatitis C, transitional living services medical and pharmaceutical contracts, and provision of behavioral health services.
OklahomaCreate bonding authority to build wings on a men’s and a women’s prison for substance abuse offenders and rehabilitation.
Rhode IslandFund new clinical social workers and improve discharge planning for prisoners with behavioral health issues.

Proposed state budgets also included other health-related proposals, a few of which are described below.

Table 6: Examples of Other Proposed Health-Related Initiatives
IowaCreate a state-run family planning program while ending taxpayer funding of abortion providers.
OhioThrough a partnership between the Department of Medicaid and the Department of Health, create a new lead abatement program using CHIP funding.
OregonProvide state-funded health care coverage for children who do not qualify Medicaid solely due to federal citizenship and immigration status requirements.
TexasEnd Medicaid participation of Planned Parenthood affiliates in the state while maintaining state grant funding for women’s health services at an all-time high ($18 million).
WashingtonProposed nearly $120 million to combat homelessness. Budget would increase support services — such as health care and housing assistance — for chronically homeless individuals and families and for youth at risk of becoming homeless. Capital budget would provide funding for more than 1,700 new affordable housing units and to preserve housing.

Outlook

As state policymakers in most states approach the task of adopting a state budget for FY 2018, they do so against the backdrop of great uncertainty at the federal level regarding health care and federal tax policy. While the AHCA failed to pass in the House, discussions on the ACA and efforts to change the structure and financing of Medicaid are likely to continue at the federal level. Changes to Medicaid as well as other proposed budget and tax changes could have significant implications for state budgets. Without changes to the ACA, Medicaid financing, or tax reform at the federal level, half of states are already facing budget challenges for FY 2018.

Reductions to Medicaid financing would mean states may need to consider raising revenues or reducing spending in other program areas to offset federal reductions or turn to Medicaid program cuts to eligibility, benefits, and reimbursement to providers. Restrictions to Medicaid financing could also have implications for state budgets, providers, and beneficiaries. In addition, these restrictions could limit state efforts to address a variety of public health issues including fighting the opioid epidemic, enhancing behavioral health services, and improving health coverage and treatment for persons involved with the criminal justice system, as the Medicaid program (and the Medicaid expansion) play a key role in all of these areas.
Appendix

Appendix Table 1: Medicaid Policy Changes Noted in FY 2018 Governors’ Proposed Budgets
StatesProvider Payments Eligibility BenefitsCost-sharingCommunity-Based LTSSProvider Tax/ Other Financing InitiativeManaged Care/ Delivery System Reform
+ — + — + — Dec. Inc. + —
Alabamax
Alaskaxx
Arizonaxx
Arkansas*
Californiaxxx
Coloradoxxx
Connecticutxxxxx
Delawarex
DC**
Floridaxx
Georgiaxxxx
Hawaiixx
Idahox
Illinois
Indianax
Iowa
Kansasxxxx
Kentucky***x
Louisianax
Mainexxx
Marylandxxx
Massachusettsx
Michiganx
Minnesota
Mississippix
Missourixxx
Montanax
Nebraskaxx
Nevadaxxxx
New Hampshirexxx
New Jerseyxx
New Mexicoxx
New Yorkxxxx
North Carolinaxxx
North Dakotaxxxxx
Ohioxxxxx
Oklahomaxx
Oregonxxx
Pennsylvaniax
Rhode Islandxx
South Carolinax
South Dakotax
Tennesseexxx
Texasx
Utahxxx
Vermontx
Virginia*xx
Washingtonxxxx
West Virginia
Wisconsinxxxx
Wyoming
Totals21164594041901111
NOTES: “+” indicates a positive policy action from the beneficiary’s perspective; “-” indicates a negative policy action from the beneficiary’s perspective. For cost-sharing, “inc.” indicates that the state increased cost-sharing (premiums or copays) and “dec.” indicates that the state decreased cost-sharing. “*” Arkansas had not released a detailed proposed budget for FY 2018 in time to be included in this analysis; “**” DC is on an annual cycle but has not released an FY 2018 proposal and is not incuded in this analysis; “***” Kentucky  is in the middle of a biennial budget cycle and has not proposed mid-year changes but the eligibility change noted in the table is included in the pending “Kentucky Health” Section 1115 Demonstration Waiver request.SOURCE: Kaiser Family Foundation analysis of Governor’s Proposed Budget for FY 2018, March 2017.
Appendix Table 2: Selected Public Health Policy Changes Noted in FY 2018 Governors’ Proposed Budgets
StatesGovernor Proposed Initiatives to Fight the Opioid EpidemicGovernor Proposed Initiatives to Enhance Behavioral Health ServicesGovernor Proposed Health-Related Corrections and Criminal Justice Initiatives
AlabamaX
AlaskaX
ArizonaX
Arkansas*
CaliforniaX
Colorado
Connecticut
DelawareX
DC**
FloridaX
GeorgiaX
Hawaii
IdahoX
IllinoisXX
IndianaX
Iowa
KansasX
Kentucky***
Louisiana
MaineX
MarylandXX
MassachusettsXX
MichiganXX
MinnesotaX
Mississippi
MissouriXXX
MontanaX
Nebraska
NevadaXX
New HampshireXX
New JerseyXX
New MexicoX
New YorkXX
North CarolinaXX
North DakotaX
OhioXXX
OklahomaXX
OregonX
PennsylvaniaXX
Rhode IslandXX
South CarolinaX
South Dakota
TennesseeX
TexasX
Utah
VermontXX
VirginiaXXX
WashingtonXX
West Virginia
WisconsinXX
Wyoming
Totals23287
NOTES: This table counts proposed Medicaid and non-Medicaid initiatives to address broader public health issues that governors referenced specifically in their proposed budgets. This table may not capture all proposed initiatives in each state but is designed to provide a national overview. “*” Arkansas had not released a detailed proposed budget for FY 2018 in time to be included in this analysis; “**” DC is on an annual cycle but has not released an FY 2018 proposal and is not included in this analysis; “***” Kentucky  is in the middle of a biennial budget cycle and had not proposed mid-year changes at the time of this analysis.SOURCE: Kaiser Family Foundation analysis of Governor’s Proposed Budget for FY 2018, March 2017.
Appendix Table 3: Governors’ Proposed Budget Sources
StatesLink to Proposed Budget
AlabamaFY 2018 Budget Proposal 
AlaskaFY 2018 Budget Proposal 
ArizonaFY 2018 Budget Proposal 
Arkansas
CaliforniaFY 2018 Budget Proposal 
ColoradoFY 2018 Budget Proposal 
ConnecticutFY 2018 Budget Proposal 
DelawareFY 2018 Budget Proposal 
DC
FloridaFY 2018 Budget Proposal 
GeorgiaFY 2018 Budget Proposal 
HawaiiFY 2018 Budget Proposal 
IdahoFY 2018 Budget Proposal 
IllinoisFY 2018 Budget Proposal 
IndianaFY 2018 Budget Proposal 
IowaFY 2018 Budget Proposal 
KansasFY 2018 Budget Proposal 
Kentucky
LouisianaFY 2018 Budget Proposal 
MaineFY 2018 Budget Proposal 
MarylandFY 2018 Budget Proposal 
MassachusettsFY 2018 Budget Proposal 
MichiganFY 2018 Budget Proposal 
MinnesotaFY 2018 Budget Proposal 
MississippiFY 2018 Budget Proposal 
MissouriFY 2018 Budget Proposal 
MontanaFY 2018 Budget Proposal 
NebraskaFY 2018 Budget Proposal 
NevadaFY 2018 Budget Proposal 
New HampshireFY 2018 Budget Proposal 
New JerseyFY 2018 Budget Proposal 
New MexicoFY 2018 Budget Proposal 
New YorkFY 2018 Budget Proposal 
North CarolinaFY 2018 Budget Proposal 
North DakotaFY 2018 Budget Proposal 
OhioFY 2018 Budget Proposal 
OklahomaFY 2018 Budget Proposal 
OregonFY 2018 Budget Proposal 
PennsylvaniaFY 2018 Budget Proposal 
Rhode IslandFY 2018 Budget Proposal 
South CarolinaFY 2018 Budget Proposal 
South DakotaFY 2018 Budget Proposal 
TennesseeFY 2018 Budget Proposal 
TexasFY 2018 Budget Proposal 
UtahFY 2018 Budget Proposal 
VermontFY 2018 Budget Proposal 
VirginiaSupplemental Changes to the 2017-2018 Biennium Budget
WashingtonFY 2018 Budget Proposal 
West VirginiaFY 2018 Budget Proposal 
WisconsinFY 2018 Budget Proposal 
WyomingSupplemental Changes to the 2017-2018 Biennium Budget

Endnotes

  1. States that do not operate on the July 1 through June 30 budget cycle include Alabama, DC, and Michigan (October 1 – September 30), New York (April 1 – March 31), and Texas (September 1 – August 31). ↩︎
  2. National Conference of State Legislatures, 2017 State & Legislative Partisan Composition, (National Conference of State Legislatures, March 2017), http://www.ncsl.org/portals/1/documents/elections/Legis_Control_2017_March_27_11am.pdf ↩︎
  3. Of the 18 states with divided control, three have split legislatures. Nebraska’s legislature is unicameral and nonpartisan. ↩︎
  4. Centers Medicare and Medicaid Services. National Health Expenditure Projections 2016 – 2025 (Washington, DC: Centers for Medicare and Medicaid Services, February 15, 2017). https://www.cms.gov/Research-Statistics-Data-and-Systems/Statistics-Trends-and-Reports/NationalHealthExpendData/NationalHealthAccountsProjected.html. ↩︎
  5. Lucy Dadayan and Donald J. Boyd, Widespread Declines in State Tax Revenues in the Second Quarter of 2016 (New York, NY: The Nelson A. Rockefeller Institute of Government, November 2016), http://www.rockinst.org/pdf/government_finance/state_revenue_report/2016-11-30-srr_105.pdf. ↩︎
  6. Lucy Dadayan and Donald J. Boyd, Weak Tax Revenue Growth in the Third and Fourth Quarters of 2016 Amid Uncertainty About Federal Tax Changes (New York, NY: The Nelson A. Rockefeller Institute of Government, March 2017), http://www.rockinst.org/pdf/government_finance/state_revenue_report/2017-03-09-srr_106.pdf. ↩︎
  7. Robin Rudowitz and Allison Valentine, and Vernon Smith, Medicaid Enrollment and Spending Growth: FY 2016 & 2017 (Washington, DC: Kaiser Commission on Medicaid and the Uninsured, October 2016), https://modern.kff.org/medicaid/issue-brief/medicaid-enrollment-spending-growth-fy-2016-2017/. ↩︎
  8. States that do not operate on the July 1 through June 30 budget cycle include Alabama, DC, and Michigan (October 1 – September 30), New York (April 1 – March 31), and Texas (September 1 – August 31). ↩︎
  9. National Association of State Budget Officers, Fall 2016 Fiscal Survey of the States (Washington, DC: National Association of State Budget Officers, December 2016). https://higherlogicdownload.s3.amazonaws.com/NASBO/9d2d2db1-c943-4f1b-b750-0fca152d64c2/UploadedImages/Fiscal%20Survey/Summary%20of%20Fall%202016%20Fiscal%20Survey.pdf. ↩︎
  10. Lucy Dadayan and Donald J. Boyd, Double, Double, Oil and Trouble (New York, NY: The Nelson A. Rockefeller Institute of Government, February 2016), http://www.rockinst.org/pdf/government_finance/2016-02-By_Numbers_Brief_No5.pdf. ↩︎
  11. Lucy Dadayan and Donald J. Boyd, Weak Tax Revenue Growth in the Third and Fourth Quarters of 2016 Amid Uncertainty About Federal Tax Changes (New York, NY: The Nelson A. Rockefeller Institute of Government, March 2017), http://www.rockinst.org/pdf/government_finance/state_revenue_report/2017-03-09-srr_106.pdf. ↩︎
  12. While Kentucky had not released a supplemental budget for FY 2018 at the time this report was prepared, the proposed requirement regarding community engagement and employment activities is included in the proposed “Kentucky Health” Section 1115 Medicaid Demonstration waiver request submitted to CMS on August 24, 2016 which was still pending at the time of this report; accessed at https://www.medicaid.gov/Medicaid-CHIP-Program-Information/By-Topics/Waivers/1115/downloads/ky/ky-health-pa.pdf. ↩︎
  13. Six states (Arizona, Arkansas, Indiana, Iowa, Michigan, and Montana) have received Section 1115 waiver approval to charge premiums or monthly contributions that are not otherwise allowed for their Medicaid expansion adults; these amounts are generally 2% of income, equivalent to what beneficiaries from 100-138% FPL would incur if they enrolled in Marketplace coverage. ↩︎
  14. Some groups and services are exempt from cost sharing, including children enrolled through mandatory eligibility pathways, emergency services, family planning services, pregnancy-related services, and preventive services for children. ↩︎
  15. MinnesotaCare is now the state’s Basic Health Plan under the ACA. MNsure is the state’s Marketplace. ↩︎
  16. Samantha Artiga, Jennifer Tolbert, Petry Ubri, and Robin Rudowitz, Views of Governors and Insurance Commissioners on ACA Repeal and Changes to Medicaid: Responses to a Congressional Request for State Input on Health Reform (Washington, DC: Kaiser Program on Medicaid and the Uninsured, March 2017), https://modern.kff.org/medicaid/issue-brief/views-of-governors-and-insurance-commissioners-on-aca-repeal-and-changes-to-medicaid-responses-to-a-congressional-request-for-state-input-on-health-reform/. ↩︎
News Release

Three Quarters of the Public, Including a Majority of Trump Supporters, Want President Trump to Try to Make the Affordable Care Act Work

Most Say President Trump and Republicans Are Responsible for the ACA Now, Not President Obama and Democrats

Published: Apr 4, 2017

Americans See Many Factors Behind AHCA’s Failure, But Few Republicans Blame President Trump

Despite divided views about the Affordable Care Act, three-fourths of the public (75%) say President Trump and his administration should do what they can to make the law work, while one in five (19%), including 38 percent of Republicans, say the Administration should do what it can to make the law fail so they can replace it later, the latest Kaiser Health Tracking Poll finds.

Fielded after the U.S. House cancelled its March 24 vote on a plan to repeal and replace the Affordable Care Act supported by President Trump and House Speaker Paul Ryan, the poll finds majorities of Democrats (89%) and independents (78%), and half of Republicans (51%) want the Trump Administration to make the law work, as do a majority of President Trump’s supporters (54%).

Chart 1.png

When asked who is responsible for any problems with the Affordable Care Act going forward, six in 10 (61%) say that President Trump and Republicans in Congress would be responsible because they are in control of the federal government. Fewer (31%) say former President Obama and Democrats in Congress are responsible because they passed the law.

Two thirds of the public (64%) say it is a “good thing” that Congress did not pass the Republican repeal and replace legislation called the American Health Care Act (AHCA), more than twice the share (29%) who say it is a “bad thing”.  However, those who say the bill’s failure was a good thing are split nearly equally between those who don’t want to see the Affordable Care Act repealed at all (31% overall) and those who want it repealed but had concerns about the Republican bill (29% overall).

More Americans (52%) say they are “relieved” that the Republican bill did not pass than say they are “happy” (44%), “disappointed” (40%), or angry” (20%). Most Republicans (68%) say they are disappointed that the bill failed, while most Democrats say they are relieved (78%) and happy (70%).

When asked who is most to blame for the failure of the Republican bill, the public is divided with about one-third (33%) saying Republicans in Congress, three in 10 (28%) saying President Trump, and one-fourth (24%) saying Democrats in Congress. Among Republicans, few (14%) blame President Trump, with half (47%) blaming Congressional Democrats and a quarter (27%) blaming Congressional Republicans.

The public also sees a number of major factors contributing to why Congress did not pass the bill, including lack of support from Democrats in Congress (55%) and lack of support from Republicans in the conservative House Freedom Caucus (53%). About half also say lack of support from moderate Republicans in Congress (47%) and lack of leadership from President Trump (47%) were major factors. Fewer say lack of support from doctors, hospitals, and other interest groups (43%), lack of leadership from House Speaker Paul Ryan (41%), and town hall protestors (37%) were major factors.

Chart 2-1.png

Republicans are most likely (75%) to cite Democrats’ lack of support as a major factor in AHCA’s failure, followed by the lack of support from the conservative House Freedom Caucus (45%) and Republican moderates (36%). Less than one-third of Republicans cite the lack of leadership from either House Speaker Paul Ryan (29%) or President Trump (14%) as major factors.

Other findings include:

  • The public remains divided in its view of the Affordable Care Act itself, with equal shares holding unfavorable (46%) and favorable (46%) views. This reflects somewhat less favorable views to the law than Kaiser polls taken earlier this year.
  • There is no general consensus on what President Trump and Republicans in Congress should do next on health care. About half of the public (49%) say they should stop working on health care and move on to other priorities and 45 percent want them to keep working on a plan to repeal and replace the Affordable Care Act. Partisanship colors these views, with most Republicans wanting them to keep working to repeal and replace the ACA, most Democrats wanting them to move on, and independents evenly divided.
  • The AHCA’s failure has dampened the public’s expectations that President Trump could fulfill his campaign promise to provide better care to Americans at a lower cost. The poll finds about a third (37%) of the public expect President Trump to be able to deliver on that promise, down from about half (47%) in December. Most Republicans (80%) remain at least somewhat confident that President Trump can deliver on this promise.

Designed and analyzed by public opinion researchers at the Kaiser Family Foundation, the poll was conducted from March 28- April3 among a nationally representative random digit dial telephone sample of 1,203 adults. Interviews were conducted in English and Spanish by landline (422) and cell phone (781). The margin of sampling error is plus or minus 3 percentage points for the full sample. For results based on subgroups, the margin of sampling error may be higher.

Poll Finding

Kaiser Health Tracking Poll – April 2017: The Fall of the AHCA and Next Steps for the ACA

Authors: Ashley Kirzinger, Bianca DiJulio, Bryan Wu, and Mollyann Brodie
Published: Apr 4, 2017

Findings

KEY FINDINGS:

  • The latest Kaiser Health Tracking Poll, conducted the week after House Republicans pulled the American Health Care Act (AHCA) from a vote, finds about two-thirds of the public (64 percent) says it is a “good thing” that Congress did not pass the bill. Majorities of Democrats (87 percent) and independents (63 percent) say it is a “good thing” the bill didn’t pass, compared to about half of Republicans (54 percent) who view it as a “bad thing.” For those who say Congress not passing the bill is a good thing, similar shares feel this way because they do not want the 2010 health care law repealed (31 percent, overall) as feel this way because while they support repeal efforts they had concerns about the AHCA (29 percent, overall).
  • The public spreads blame for the bill not passing across the board, with one-third saying Republicans in Congress are most to blame, along with about three in ten who say President Trump (28 percent) and about one-fourth who say Democrats in Congress (24 percent) are most to blame. When asked specifically about Republicans in Congress, the public spreads blame about equally across House Speaker Paul Ryan (27 percent) and the conservative Freedom Caucus (27 percent), with slightly fewer blaming moderate Republicans (22 percent). While about half of the public (55 percent) say the AHCA did not pass because it went too far in cutting existing programs, views vary by party, with majorities of Democrats (74 percent) and independents (57 percent) saying it didn’t pass because it went too far in cutting existing programs, compared to six in ten Republicans (58 percent) who say the AHCA did not pass mainly because it didn’t go far enough to end Obamacare.
  • Despite divided views towards the 2010 health law, three-fourths of the public think President Trump and his administration should do what they can to make the current health care law work – including a majority of Democrats and independents and half (51 percent) of Republicans. Large shares of Democrats (80 percent) and independents (65 percent), and one-third of Republicans (34 percent), also say that because President Trump and Republicans in Congress are in control of the government, they are now responsible for any problems with the ACA moving forward.
  • In addition, the public is increasingly wary of President Trump’s ability to deliver on his campaign promise of less expensive and better health care for all Americans – 37 percent say they are confident that President Trump will be able to deliver on this campaign promise, down from 47 percent three months ago.
  • There are divides among Republicans on who they blame for Congress not passing the AHCA as well as the next steps for President Trump and his administration. Compared to moderate and liberal Republicans, conservative Republicans are slightly more likely to place the blame for the AHCA not passing on House Speaker Paul Ryan and to say President Trump’s administration should do what they can to make the current health care law fail so they can replace it later.

The American Health Care Act

On March 6, 2017, House Republicans announced their plan to replace the Affordable Care Act (ACA) with the American Health Care Act (AHCA). Less than three weeks later, on March 24, House Speaker Paul Ryan pulled the bill from the floor before a vote took place because it did not have enough votes to pass. The most recent Kaiser Health Tracking Poll – fielded the week after the bill was pulled – finds most of the public (64 percent) says it is a “good thing” that Congress did not pass the AHCA, while about three in ten (29 percent) say this is a “bad thing.” However, views vary considerably by party with a majority of Democrats (87 percent) and independents (63 percent) saying it is a “good thing” that Congress did not pass the bill compared to about half (54 percent) of Republicans who say it is a “bad thing” that Congress did not pass the bill.

Figure 1: Democrats and Independents Say It Is a “Good Thing” Congress Did Not Pass AHCA, Republicans Say It Is a “Bad Thing”

Those who view Congress not passing the AHCA as a good thing are divided on why they feel that way, with about half saying they feel this way because they do not want the 2010 health care law repealed (31 percent of the public overall) and the other half  (29 percent of the public overall) saying they feel it is a good thing because they had specific concerns about the AHCA even though they generally support repealing and replacing the ACA.

Figure 2: Majority Say AHCA Not Passing Is a Good Thing; But Divided on Their Reasoning

Most Democrats (59 percent) feel it is a good thing that Congress did not pass the AHCA because they do not want the 2010 health care law repealed. And, while most Republicans say it was a bad thing the law did not pass, most of the Republicans who say it was a good thing say they feel that way because they had concerns about the AHCA (33 percent of Republicans overall) as opposed to saying they feel this way because they do not want the ACA repealed (4 percent). Independents are more divided on why they think the law not passing is a good thing, but tilt somewhat more toward having concerns about this particular bill than because they would rather not see the ACA repealed (32 percent versus 26 percent).

Table 1: Partisan Attitudes on Congress Not Passing the AHCA
Percent who say the following:TotalDemocratsIndependentsRepublicans
It is a good thing Congress did not pass the bill…64%87%63%39%
…because they do not want the 2010 health care law repealed3159264
…because while they support efforts to repeal and replace the law, they had concerns about the particular bill they were debating29233233
It is a bad thing that Congress did not pass the bill29103254
Note: Question wording abbreviated. See topline for full question wording. Don’t know/Refused responses not shown.

Half of the Public is Relieved Congress Did Not Pass the AHCA

More Americans say they are “relieved” (52 percent) that Congress did not pass a bill to repeal and replace Obamacare than say they are “happy” (44 percent), “disappointed” (40 percent), or “angry” (20 percent).

Figure 3: More Say They Are “Relieved” About the AHCA Not Passing Than Say “Happy,” “Disappointed,” or “Angry”

Seven in ten Republicans (68 percent) say they feel “disappointed” that Congress did not pass a bill repealing and replacing Obamacare. Democrats, on the other hand, are more likely to say they feel “relieved” (78 percent) and “happy” (70 percent) that Congress did not pass the bill.

Table 2: Republicans Feel Disappointed About Congress Not Passing AHCA; Democrats Feel Relieved

Percent who say they feel the following about Congress not passing a bill to repeal and replace Obamacare:

TotalDemocratsIndependentsRepublicans
Relieved52%78%48%27%
Happy44704118
Disappointed40204168
 Angry20132129

 Why Didn’t The AHCA Pass and Who’s To Blame?

When asked why the bill aimed at repealing and replacing the 2010 health care law (known commonly as Obamacare) did not pass, more say they think it did not pass mainly because it went too far in cutting existing programs (55 percent) than say it was mainly because the replacement bill did not go far enough to end Obamacare (35 percent). Not surprisingly, views vary by party, with three-fourths of Democrats (74 percent) and six in ten independents (57 percent) saying it didn’t pass because it went too far in cutting existing programs, compared to a majority of Republicans (58 percent) who say the AHCA did not pass mainly because it didn’t go far enough to end Obamacare.

Figure 4: Most Democrats and Independents Say AHCA Didn’t Pass Because It Went Too Far in Cutting Programs

Public Points to Several Factors Playing A Role in Congress Not Passing The AHCA

The public sees a number of issues as factors in why Congress was unable to pass the AHCA. About half say lack of support from Democrats in Congress (55 percent) and lack of support from Republicans in the conservative House Freedom Caucus (53 percent) were major factors in the bill not passing, which is just slightly more than the share who say lack of support from moderate Republicans in Congress (47 percent) and lack of leadership from President Trump (47 percent) were major factors. About four in ten say lack of support from doctors, hospitals, and other interest groups (43 percent), lack of leadership from Republican House Speaker Paul Ryan (41 percent), and town hall protestors (37 percent) were major factors in Congress’ inability to pass the bill. Democrats and Republicans have differing views on what the major factors were in the House not passing the bill. For example, three-fourths of Republicans say lack of support from Democrats in Congress was a major factor in the bill not passing, while seven in ten Democrats (71 percent) say lack of leadership from President Trump was a major factor, something only 14 percent of Republicans say.

Table 3: Public Perceives Many Factors Playing a Role in Congress’ Inability to Pass the AHCA
Percent who say each of the following is a major factor in Congress being unable to pass the AHCA:TotalDemocratsIndependentsRepublicans
Lack of support from Democrats in Congress55%45%50%75%
Lack of support from Republicans in the conservative House Freedom Caucus53585545
Lack of support from moderate Republicans in Congress47544736
Lack of leadership from President Trump47714714
Lack of support from doctors, hospitals, and other interest groups43504928
Lack of leadership from Republican House Speaker Paul Ryan41523729
Protestors at town hall meetings who were upset about the bill’s potential effects37493920

Partisans Blame Opposing Party for the AHCA Not Passing

The public is fairly divided on who is most to blame for the fact that the AHCA did not pass. One-third say Republicans in Congress are most to blame for the AHCA not passing along with about three in ten who say President Trump (28 percent) and one-fourth who say Democrats in Congress (24 percent) are most to blame. There are stark partisan differences contributing to this divide, with about half of Republicans (47 percent) and four in ten of President Trump’s supporters (42 percent) placing most of the blame on Democrats in Congress. On the other hand, among Democrats and those who disapprove of President Trump, about four in ten place the blame on President Trump (43 percent each) and on Republicans in Congress (38 percent and 36 percent, respectively). Independents are more likely to place the blame on Republicans in Congress (35 percent) than on Democrats in Congress (21 percent).

Figure 5: Trump Supporters More Likely to Blame Democrats in Congress for AHCA Not Passing

The public is roughly divided about whether the bill did not pass due to in-fighting within the Republican party or due to disagreements between Democrats and Republicans (49 percent versus 45 percent). Republicans are more likely to say it was due to disagreements between Republicans and Democrats than to say it was due to conflict within the Republican party (61 percent versus 35 percent), while Democrats are more likely to say it was because of Republican in-fighting rather than partisan arguments (63 percent versus 32 percent).

Figure 6: Republicans More Likely to Say the AHCA Not Passing Was Because of Disagreements between Republicans and Democrats

How the Public Views Republican Leadership On the AHCA

When asked specifically who is most to blame among Republicans in Congress for the AHCA not passing, the public is also divided. About three in ten say the conservative Freedom Caucus (27 percent) is most to blame, which is the same as the share who say House Speaker Paul Ryan (27 percent) is most to blame. A slightly smaller share (22 percent) say moderate Republican lawmakers are most to blame for Congress not passing the bill. These views do not vary substantially across parties.

Figure 7: Similar Shares Blame the Conservative Freedom Caucus and House Speaker Paul Ryan for the AHCA Not Passing

Conservative Republicans are more likely to place blame on House Speaker Paul Ryan (30 percent) than moderate and liberal Republicans (19 percent). However, among all Republicans, a slightly larger share put the blame for the AHCA not passing on the conservative Freedom Caucus than on House Speaker Paul Ryan or moderate Republicans.

Figure 8: Conservative Republicans More Likely to Place Blame on House Speaker Paul Ryan for the AHCA Not Passing than Moderates

When asked how the failure of the AHCA reflects on Republican lawmakers, more of the public says it is a sign of bigger problems Republicans have governing than say the issue is unique to this bill and doesn’t say much about Republicans’ ability to govern (52 percent versus 39 percent). And, while more Democrats and independents see Congress not passing the AHCA as indicative of bigger problems Republicans have governing, Republicans themselves are less pessimistic. Six in ten (62 percent) Republicans say that Congress’ inability to pass the AHCA is unique to this specific bill and doesn’t say much about Republicans’ ability to act on other issues.

Figure 9: Democrats and Independents More Likely to Say the AHCA Not Passing Is a Sign of Bigger Problems Republicans Have Governing

Next Steps for the ACA

With Congress not passing the most recent attempt to repeal and replace the 2010 health care law, the public is divided in its view of the ACA with equal shares (46 percent) expressing a favorable view as an unfavorable view.

Figure 10: Public Divided in Views of the Affordable Care Act

Despite the divided views towards the law, three-fourths of the public think President Trump and his administration should do what they can to make the current health care law work while one-fifth (19 percent) of Americans say President Trump and his administration should do what they can to make the ACA fail so they can replace it later.

Figure 11: A Majority of Americans Say President Trump and his Administration Should Do What They Can to Make ACA Work

The vast majority of Democrats (89 percent), eight in ten independents (78 percent), and half of Republicans (51 percent) say President Trump and his administration should do what they can to make the law work. There are divides among Republicans, with a majority of moderate and liberal Republicans (60 percent) saying the administration should do what they can to make the law work, compared to 45 percent of conservative Republicans. Among Trump supporters, 54 percent think President Trump’s administration should do what they can to make the current health care law work while a smaller share (37 percent) say they should do what they can to make the law fail.

Figure 12: Across Groups, More Say President Trump Should Try to Make the ACA Work than Make It Fail

With the future of any other replacement plans uncertain, this month’s survey also gauges who the public views as responsible for the 2010 health care law going forward. A majority (61 percent) of the public say that because President Trump and Republicans in Congress are in control of the government, they are now responsible for any problems with the ACA moving forward. About three in ten Americans (31 percent) say that because President Obama and Democrats in Congress passed the law, they are responsible for any problems with it.

Figure 13: Most Say President Trump and Republicans in Congress Are Responsible for any Future Problems with the ACA

The Future of Health Reform

During his campaign, President Trump promised that under his administration, Americans will get better health care at a lower cost than they pay now. The December 2016 Kaiser Family Foundation Tracking Poll1  found that about half of the public thought President Trump would be able to deliver on this campaign promise. Three months later, this month’s survey finds a decrease in the share of the public who are confident that President Trump will be able to deliver on this promise (from 47 percent to 37 percent). The decrease in the share who are confident that President Trump will be able to deliver on this campaign promise is found among Democrats, independents, and Republicans; yet, a large majority of Republicans are still confident that he will be able to deliver.

Figure 14: Republicans Still Confident that President Trump Will Be Able To Deliver on Health Care Promise

But there is no general consensus on what President Trump and Republicans in Congress should do next. About half of the public (49 percent) say President Trump and Republicans should stop working on health care and move on to other priorities while 45 percent of the public want them to keep working on a plan to repeal and replace the 2010 health care law. Partisanship underlies these views, with 75 percent of Republicans wanting President Trump and Republicans in Congress to keep working on a replacement plan, 70 percent of Democrats wanting them to move on to other priorities, and independents divided (48 percent wanting them to move on and 48 percent wanting them to keep working on a replacement plan).

Figure 15: Democrats Say President Trump and Republicans Should Move on from Health Care; Republicans Disagree

Methodology

This Kaiser Health Tracking Poll was designed and analyzed by public opinion researchers at the Kaiser Family Foundation (KFF). The survey was conducted March 28- April 3, 2017, among a nationally representative random digit dial telephone sample of 1,203 adults ages 18 and older, living in the United States, including Alaska and Hawaii (note: persons without a telephone could not be included in the random selection process). Computer-assisted telephone interviews conducted by landline (422) and cell phone (781, including 475 who had no landline telephone) were carried out in English and Spanish by Princeton Data Source under the direction of Princeton Survey Research Associates International (PSRAI). Both the random digit dial landline and cell phone samples were provided by Survey Sampling International, LLC. For the landline sample, respondents were selected by asking for the youngest adult male or female currently at home based on a random rotation. If no one of that gender was available, interviewers asked to speak with the youngest adult of the opposite gender. For the cell phone sample, interviews were conducted with the adult who answered the phone. KFF paid for all costs associated with the survey.

The combined landline and cell phone sample was weighted to balance the sample demographics to match estimates for the national population using data from the Census Bureau’s 2015 American Community Survey (ACS) on sex, age, education, race, Hispanic origin, and region along with data from the 2010 Census on population density. The sample was also weighted to match current patterns of telephone use using data from the January-June 2016 National Health Interview Survey. The weight takes into account the fact that respondents with both a landline and cell phone have a higher probability of selection in the combined sample and also adjusts for the household size for the landline sample. All statistical tests of significance account for the effect of weighting.

The margin of sampling error including the design effect for the full sample is plus or minus 3 percentage points. Numbers of respondents and margins of sampling error for key subgroups are shown in the table below. For results based on other subgroups, the margin of sampling error may be higher. Sample sizes and margins of sampling error for other subgroups are available by request. Note that sampling error is only one of many potential sources of error in this or any other public opinion poll. Kaiser Family Foundation public opinion and survey research is a charter member of the Transparency Initiative of the American Association for Public Opinion Research.

GroupN (unweighted)M.O.S.E.
Total1203±3 percentage points
Party Identification  
   Democrats403±6 percentage points
   Republicans315±6 percentage points
   Independents376±6 percentage points
Trump Approval  
   Approve of President Trump497±5 percentage points
   Disapprove of President Trump662±4 percentage points

Endnotes

  1. A Kirzinger, B Wu, M Brodie, Kaiser Health Tracking Poll: Health Care Priorities for 2017. https://modern.kff.org/health-costs/poll-finding/kaiser-health-tracking-poll-health-care-priorities-for-2017/   ↩︎