KFF designs, conducts and analyzes original public opinion and survey research on Americans’ attitudes, knowledge, and experiences with the health care system to help amplify the public’s voice in major national debates.
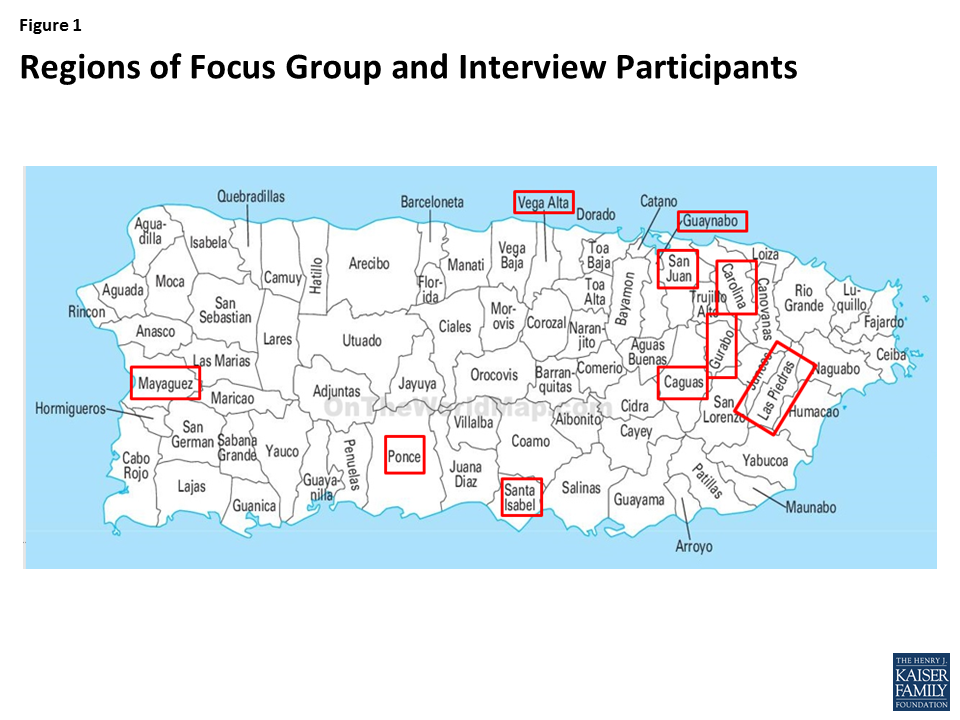
Two months after Hurricane Maria made landfall, the Kaiser Family Foundation traveled to Puerto Rico to conduct focus groups and individual interviews with individuals affected by the storm. We spoke to 40 people from 10 different regions on the island (Appendix 1). See a companion video. Findings show:
Hurricane Maria was a terrifying and traumatic event for participants and their children. A number of participants suffered significant damage to their homes and property with some losing everything.
The storm had significant negative effects on physical and mental health, and many participants continue to experience depression, stress, and anxiety.
Two months after the storm, participants were continuing to face challenges meeting basic needs, and daily life remained extremely challenging due to lack of electricity and limited work options.
Participants felt that recovery efforts have been slow and insufficient.
Despite these challenges, many believe Puerto Rico will recover, although they recognize recovery will likely take many years and believe that the people themselves have an important role to play in recovery.
“I thought there was no end to it. We stood by the window, watching what was happening to my house. The wind and the rain wouldn’t stop…It was endless.”
“I saw the entire process of what happened to my house. It was a total loss. My dad was in tears out of helplessness in the face of that situation.”
“The place where I felt okay was the bathroom. If I had to cry, I cried. And sometimes I tried to muffle my sobs with the bath curtain.”
“I was not working for so long, because I used to work at schools and, if they are not open, I don´t work…that triggered a lot of anxiety….because…I used to be the one who made money.”
“…after two months, there are people who still can’t be reached because there is no road, they cannot leave their homes. They can’t get food.”
“And when he [President Trump] did his crazy things, throwing paper towels, he wasn’t valuing what we were going through, our pain.”
“They are taking so, so long, that I wonder, how is it possible that people who lost their homes aren’t given priority.”
“I would like Puerto Ricans on the outside and Americans to know there are brave people here, strong, and they are not giving up, because we are fighters.”
Issue Brief
Weathering the Storm
Weathering the storm was a terrifying and traumatic experience for participants. Some participants made preparations for the storm, while others anticipated the storm would pass by the island or not be as strong as predicted. Many stayed in their home to weather the storm and brought family and friends to stay with them. Others went to stay with family or friends who had sturdier homes. Participants described the frightening strength of the storm winds and significant rain and flooding. They said that the storm felt endless and they worried about the well-being of family members they were separated from during the storm.
“I didn’t believe it would get here. I mean, I thought it was coming but not with so much strength.”
“We got ready to go. Water, emergency provisions for home, tins, non-perishable goods. Also, I have a plastic container, which we call ‘Hurricane,’ in which we keep torches, candles, anything you may need.”
“I told my wife and my children to go with mom since that house is…made of cement all around.”
“I was holding a door for two hours so it wouldn’t get blown away… ! So, we did that until we came up with putting the sofa as a wedge…And the sofa even moved with the wind….but that was the best thing we could have done…. But that…is something I don´t want to go through again…”
“My mother has several conditions and she takes between 12-14 drugs, and that triggered a bit of anxiety in me…. That was my biggest concern, and so I stocked up on them before the hurricane came.”
“There was a moment when the wind stopped. And then it came on the other side… Later, when night had fallen, I could only see upwards and all the destruction and wondered ‘What could we do now. How can I start?'”
“I thought there was no end to it. We stood by the window, watching what was happening to my house. The wind and the rain wouldn’t stop, there were things flying, the trees falling. It was endless.”
“….we were really worried, wanted to know how they were and there were zero communications. It was quite desperate…during the hurricane it was terrible to think about our grandparents, which is the closest family we have.”
Immediate Aftermath of the Storm
Participants struggled to meet basic needs immediately following the storm. Many participants suffered significant damage to their homes and properties, with some losing everything. They said that in the immediate days and weeks following the storm, it was extremely difficult to meet basic needs and that lines, for water, food, gas, and money were up to 8-10 hours long. In the weeks following the storm, there were no communications on the island and travel around the island was difficult, making it challenging to check on the well-being of family and friends. Few received any aid in the days and weeks immediately following the storm. One silver lining several participants highlighted, was that the storm contributed to increased community and stronger relationships with their neighbors as they worked together following the storm.
“I saw the entire process of what happened to my house. It was a total loss. It exploded. A 100 year old mahogany tree fell on it and everything was gone… My dad was in tears out of helplessness in the face of that situation.”
“…it seemed someone had set a shower in my house, the whole house was leaking water.”
“We divided the tasks at home: my brothers went for fuel, I cooked, grandma helped me with the kids. Mom and my husband tidied up.….We knew that if we all went for fuel, we’d never finish what needed to be done at home. I waited in line 6 or 8 times for $10 worth of fuel. One of them took 6 hours, and in the end, it was only $10!”
“You’d stand in a huge line and when you arrived at the counter they’d tell you that you could only take two gallons per family. And then you’d think, well, at home we are five and we drink three gallons in just one day.”
“There was no way to communicate. You couldn’t drive, there were too many things blocking the roads, and there was no internet, no cell-phones…”
“The municipality came by my house with water and a bag of food about three weeks ago. But that was not long ago. In those first weeks, there was no help.”
“We have come closer together as a family and also with the neighbors.”
Effects on Physical and Mental Health
Participants said that access to health care was limited and chaotic immediately after the storm with limited staff, hospitals without power, injuries and deaths. They noted that pharmacies were unable to process insurance without power, so some had to pay out of pocket for medications. Some pharmacies provided medications on credit and /or without a prescription to help ensure continued access to medications. Participants noted that the ability to access health care has improved over time, but challenges persist, including longer waits, transportation challenges, and limited hospitals, clinics, and pharmacies, with many still running on inconsistent generator power. A number of participants had health coverage through Reforma, Puerto Rico’s Medicaid program, and said the coverage is key for accessing needed care for themselves and their children.
“I was worried about the baby, because of the bilirubin levels, and there was no sun. So I took her to the emergency and they kept her for 24 hours….in the same area where they brought the dead.”
“The pharmacy at the hospital had run out of many things after a month. It’s not that the pharmacy doesn’t want to sell it to us, it’s just not available.”
“You can get an appointment, but not as easily and frequently. What the physician does is give them prescriptions for a whole month. So we go and see him every month or month and a half.”
A number of participants said that the storm disrupted their access to medications and treatment. For example, several participants said they did not have access to insulin because they had no ability to refrigerate it, and one participant was unable to obtain dialysis treatment due to lack of power. Participants said it has been harder to manage chronic conditions like asthma, high blood pressure, and diabetes due to stress and anxiety, limited access to medication, and increased consumption of processed and canned foods and soda due to difficulties accessing fresh food.
“I ran out of insulin. I was told to put in tepid water in a glass. But I saw that the insulin wasn’t translucent, it had sort of crystallized, like sugar.”
“For my grandmother’s diabetes, the diet change has been terrible. It’s completely out of control. As there is no electricity, we cannot eat the same food.”
Participants also described profound effects on their mental and emotional health. They noted that while they try to be strong for their children and others, they feel desperation in moments alone. Many said they feel stressed and anxious and are having trouble sleeping at night. They also said that many of their children are fearful and frightened ever time it rains. Several were also affected by deaths they witnessed or knew of as a result of the storm.
“What I’ve seen around me is death. People who have committed suicide. After the hurricane, they have been in very sad situations, really.”
“The place where I felt okay was the bathroom. If I had to cry, I cried. And sometimes I tried to muffle my sobs with the bath curtain.”
“My husband goes hysterical. When he comes home from work he starts digging, with the flashlight, and tries to rebuild the porch. He hates the night, doesn’t sleep.”
“One of my grandchildren, whenever there’s heavy rain, she asks me to close the windows and get into the bathroom with her. I tell her to be calm, but she cannot.”
Life Two Months After the Storm
Daily life remains very difficult and disrupted two months after the storm. Participants said some basic needs still have not been addressed. Most are still without power, and where power has returned, it remains unpredictable. They also pointed to continued challenges accessing water and gas and noted that cell service and communication remains limited across the island. Participants described the struggles of daily life without power, noting that they are unable to keep fresh food, unable to cook inside their home, and or to use their washing machine. They emphasized that there is no relief from the heat and mosquitos and constant noise and air pollution from generators. They also said that there remain significant traffic jams and delays on the roads due to the lack of traffic lights.
“…we miss the comfort of things we used to take for granted. Like, we used to get up and we’d be able to take a shower, it was as simple as putting the clothes in the washing machine, and leaving…To have the comfort of cooking inside the house…”
“Even now I don’t have a signal at home. I have to go out on the highway. You can’t communicate. And things are very difficult.”
“To date, I am still in survival mode.”
“But now with my dad, I have to wake up much earlier. I had to bring them home with me, as they have no power or water since Irma. He’s diabetic and has conditions so I have to wake up a lot earlier and I have to medicate and take him home, then take the girls to school and get to work.”
Participants’ daily routines remain disrupted. Some participants are still displaced from their homes or have displaced family or friends living with them. Some children returned to school, but many schools are operating under shortened schedules. Some participants have returned to work, but a number went many days without work or lost their jobs. They noted that many jobs are not available right now because of the lack of power. Moreover, it is more difficult for parents to work given the more limited school hours.
“It has changed completely. We live in one space….Seeing those elderly people get up…and they were used to sitting on the balcony. Today, you find them crying because they cannot do it. It affects me. I adapt, but it affects me.”
“I’ve already relocated. I looked for a place to rent because my house must be reconstructed completely.”
“I found work last week. Prior to that I didn’t have a job, ever since Irma. I was a bartender but lost my job. Because my workplace was left without power and couldn’t operate.”
“…I was not working for so long, because I used to work at schools and, if they are not open, I don’t work. And that triggered a lot of anxiety…. Because…I used to be the one who made money. So although I tried to channel all those energies, I did get a bit hopeless.”
Views on Recovery Efforts
Participants feel that recovery efforts have been slow and that major gaps in basic needs remain two months after the storm. They did not feel that President Trump has provided much help or respect for the people of Puerto Rico. They said that assistance from FEMA has been slow and not well targeted. Some felt that FEMA is acting slow because FEMA funds were misused by some individuals after previous storm. In addition, many thought that local government is complicating and slowing down recovery efforts.
“…after two months, there are people who still can’t be reached because there is no road, they cannot leave their homes. They can’t get food. And you think, my God…but there is so much arriving!”
“And when he [President Trump] did his crazy things, throwing paper towels, he wasn’t valuing what we were going through, our pain.”
“They are taking so, so long, that I wonder, how is it possible that people who lost their homes aren´t given priority.”
“But they also have to think of the emergency we are in, they [FEMA] can’t take 60 days to assess a house, when it is obvious the assistance is needed.”
“The thing is, FEMA can’t do anything until the municipality and the state agree on something and they start moving.”
“I think FEMA is acting in a responsible way, being very cautious and studying properly every case. Because…in the other incidents, people would take the money and wouldn’t fix their homes. “
“I’d have to call [FEMA] three times on the same day and they’d give me different versions of the information. So, I’d have to take note of their names and the version they had given me. And this situation is like walking uphill, because these new employees don’t know what to tell you about the assistance…”
Thoughts on the Future
Participants believe the island will recover, but that it will take a long time, likely many years. They feel there remains great needs across the island, but that there is not enough recognition of the continued need and suffering. Many noted that they remain committed to staying on the island and recovery, even though staying is hard. Others are leaving because they are no longer able to find employment to support them. Many have family and friends that have already left the island. Participants want more transparency and information about recovery efforts, in particular, about where funding and supplies are going. They also believe that the people of Puerto Rico have a role to play in recovery themselves, and that they can’t just sit back and wait for assistance.
“I’d like to stay where I am, but it depends on the power and work. For the moment, I’m staying.”
“I have friends who have little children and left because the children couldn’t get used to not having electricity or water.”
“I’m looking for a job, and I’m analyzing other options I have, like starting my own business… but I have to do something.”
“It will be good. It will be slow, but it will be good.”
“I have faith in that it will get better. That the storm took some things, but it didn’t take our warrior hearts.”
“I would like Puerto Ricans on the outside and Americans to know there are brave people here, strong, and they are not giving up, because we are fighters.”
“I also think that it is not like we are just sitting here waiting for help to move. Because we are moving. But there comes a limit where you get stuck because you don’t have more resources.”
“We ourselves. Puerto Rico helping out Puerto Rico.”
Conclusion
These findings show that Hurricane Maria was a terrifying and traumatic event for many Puerto Ricans. Many suffered significant damage to their homes and property, with some losing everything, and many are struggling with mental and emotional effects of the storm and their losses. Two months after the storm, individuals were continuing to face challenges meeting basic needs, and daily life remained extremely challenging, due to lack of electricity and limited work options. Individuals feel that recovery efforts have been slow and insufficient and emphasized that the island still needs substantial help and resources to recover. Despite these challenges, many believe Puerto Rico will recover, although they recognize recovery will likely take many years and believe that the people themselves have an important role to play in recovery.
The authors extend their deep appreciation to the individuals who shared their time and stories as well as the individuals who helped make this project possible including, Perry Undem Research/Communication and Marisol Lugo Juan with Lighthouse Market Intelligence.
Appendix
Methods
The focus groups and interviews were conducted in Spanish and English in San Juan and Ponce, Puerto Rico, on November 18 and 19, 2017. The Kaiser Family Foundation worked with PerryUndem Research/Communication to conduct the focus groups and interviews. This brief highlights participants’ experiences during and immediately after the storm as well as how they were faring two months after the storm. It also provides an overview their thoughts on recovery efforts and their reflections on the future for themselves and the island.
Figure 1: Regions of Focus Group and Interview Participants
Federal funding for the Children’s Health Insurance Program (CHIP) expired on September 30, 2017. CHIP covers 8.9 million children in working families who earn too much to qualify for Medicaid but cannot afford or access private coverage. (See here for state Medicaid and CHIP eligibility limits for children.) This fact sheet provides an overview of state plans for CHIP as they grow closer to exhausting federal funds amid continued delay of Congressional action to extend funding. It is based on data collected from state Medicaid and CHIP officials by the Kaiser Family Foundation (KFF) and Health Management Associates (HMA) during November 2017, which updates data earlier reported in Summer 2017. The findings show that about three-quarters of states anticipate exhausting funding by the end of March 2018 and that several states have begun or will begin notifying families about coverage reductions before the end of 2017. As such, further delay in Congressional action is likely to result in confusion among families that could lead to coverage losses and administrative costs even if funding is extended in the next few weeks. See Appendix Table 1 for state data.
When Will States Run out of Funding?
Remaining funds available to states, including redistribution funds, are limited and anticipated to run out soon. Federal stopgap funds available to states include remaining federal funds from each state’s federal fiscal year (FY) 2017 CHIP allotment and redistribution funding from prior years provided by the Centers for Medicare and Medicaid Services (CMS) from a limited amount of unspent funds across all states. However, once states exhaust those funds, no additional funds will be available unless Congress enacts legislation. As of December 6, 2017, nine states have exhausted their FY 2017 allotments and have received redistribution funds from CMS to continue coverage. CMS is expected to release the final redistribution payments in the near-term, but these amounts will be insufficient to cover states’ FY 2018 CHIP shortfalls.1
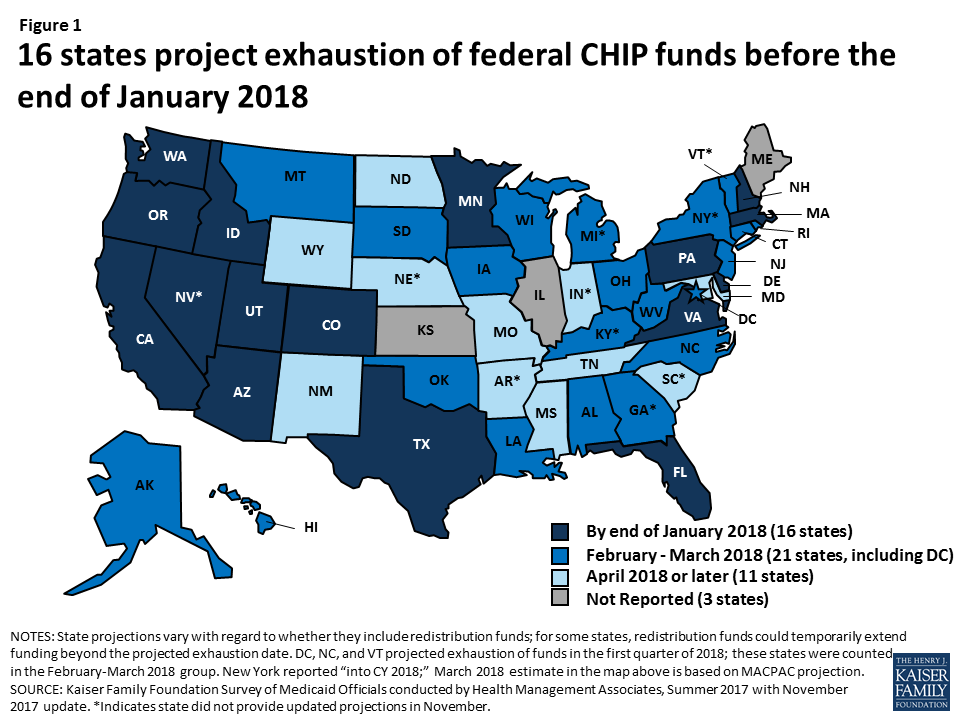
A third of states anticipate exhausting funding by the end of January 2018 (Figure 1). Among the 48 states2 that provided an estimate of when they will exhaust federal funds, including the 38 states that provided an update in November 2017, 16 states projected they will exhaust federal funds by the end of January 2018, and an additional 21 states projected they will exhaust federal funds by the end of March 2018. State projections are fluid and change as enrollment and costs fluctuate and states receive redistribution funds.
Figure 1: 16 states project exhaustion of federal CHIP funds before the end of January 2018
The majority of states will face a budget shortfall without an extension of federal funds because nearly all states assumed continued federal CHIP funding in their state fiscal year (SFY) 2018 state budgets. Because state budgets for SFY2018 have already been adopted, special legislative sessions and/or Governor action will likely be needed to address these shortfalls.
What are State Options to Respond to the Loss of Federal Funds?
State options to respond to the loss of federal CHIP funds vary based on how they have implemented their CHIP program. States have implemented their CHIP programs by creating a separate CHIP program, through a CHIP-funded Medicaid expansion, or using a combination of both approaches. Regardless of how states implement their program, they receive the enhanced (relative to Medicaid) matching rate for CHIP coverage, which was further increased by 23 percentage points under the Affordable Care Act (ACA). As of FY2016, about four in ten children covered through CHIP were in separate CHIP programs, and six in ten were in CHIP-funded Medicaid expansions.3
States are not required to maintain separate CHIP coverage. States with separate CHIP programs can transition enrollees to Medicaid at the lower federal Medicaid match rate or discontinue coverage. Some states have state laws that require them to close the program and/or discontinue coverage if federal funds decrease. For example, Arizona must freeze enrollment if the federal match rate decreases, West Virginia must close the program if federal funding levels fall below the levels allotted in 1997, and Colorado cannot access provider taxes it uses to support coverage for some CHIP children without federal match.
States are required to maintain CHIP-funded Medicaid expansion coverage under the ACA maintenance of effort (MOE) requirement. They will face increased costs since they will receive the lower federal Medicaid match rate for this coverage.
What are Current State Plans for Addressing the Loss of Federal Funds?
Many states with separate CHIP programs are planning to reduce coverage in response to the loss of federal funding, and several plan to begin notifying families before the end of the year. Overall, 14 of the 24 states that reported November 2017 data and have a separate CHIP program indicated plans to reduce or limit separate CHIP coverage for children or pregnant women, while most of the remaining 10 states reported they had not yet determined specific plans for reducing coverage.
A total of 14 states reported plans to terminate or phase out coverage for children, including 5 states that plan to end coverage by the end of January 2018 (Figure 2).4 In addition, three states plan to take action in February (AL, OK, and WV), one state plans to take action in March (SD). The additional five states (MS, NC, ND, PA, and WY) plan to take action later or did not indicate a date for planned action. States will begin notifying families of the upcoming changes one month or more in advance of the planned action date. As of December 6, 2017, at least three states had begun informing families about potential changes. Colorado sent a warning to families about potential coverage losses5 and Utah6 and Oklahoma7 had posted notices on their websites warning of potential coverage reductions.
Figure 2: Five States Plan to End Coverage by January 31, 2018
Seven states reported plans to close new enrollment for children or establish a cap on the total number of children that can be enrolled in their separate CHIP program. Connecticut reported it will close enrollment or establish an enrollment cap on December 20th, 2017, and Alabama, North Carolina, and Virginia reported plans to close enrollment or establish an enrollment cap in January. Mississippi, Pennsylvania, and Utah also reported plans to take this action but did not specify planned dates of action.
In addition, several states reported plans to reduce CHIP coverage for pregnant women. Colorado and Virginia both plan to terminate or phase out coverage for enrolled pregnant women on January 31, 2018. Virginia also plans to close new enrollment for pregnant women or establish an enrollment cap on January 1, 2018. Oklahoma has also indicated plans to terminate coverage for pregnant women covered through its unborn child option as of February 28, 2018.8
Several states indicated plans to transition children from separate CHIP programs to Medicaid. For example, Oregon, which anticipates exhausting its federal CHIP funds in December 2017, plans to transition children to Medicaid on January 1, 2018. In addition, Idaho and Louisiana indicated plans to transition children in February. States will face increased state costs for children transitioned from CHIP to Medicaid because they will receive the lower federal Medicaid match rate for this coverage.
States with CHIP-funded Medicaid expansion coverage must determine how they will fund the increased cost of covering these children at the lower federal Medicaid match rate. States can address these shortfalls by reducing costs in Medicaid, making reductions in other areas of the budget, or increasing revenues (Box 1). States will face challenges replacing federal dollars since many were already facing shortfalls heading into SFY 2018.9
Box 1: Examples State Plans to Cover Increased Costs for CHIP-funded Medicaid Expansion Coverage
Alaska reported that it will request supplemental funding from the state general fund to address its estimated $7 million shortfall for SFY 2018.
Utah reported that it will end its separate CHIP coverage and that it requested approximately $11.3 million in additional funding from the state legislature to cover increased costs of its CHIP-funded Medicaid expansion coverage.
Hawaii reported that it would make reductions in other areas of the budget (outside of Medicaid/CHIP) and request an emergency appropriation for SFY 2018 to address its estimated $9.3 million shortfall.
How Will Coverage Reductions and Changes Affect Families and States?
Reductions in CHIP coverage will result in coverage losses for children and negative effects on children’s health and family finances. If states close enrollment and/or discontinue coverage for children in separate CHIP programs, some children could shift to their parents’ employer-sponsored plans or Marketplace plans, but others would become uninsured. Previously, some states closed enrollment in CHIP for limited periods in response to state budget pressures, and studies show that this led to coverage losses, left eligible individuals without access to coverage, and had negative effects on health and family finances (Appendix 2).
Implementing program changes to CHIP will also require administrative time and costs for states. States reported having to take an array of actions to implement program changes (Box 2). States need to build in time to conduct these actions as they plan to make program changes. In addition, states face administrative costs associated with these actions. For example, Connecticut estimates that implementing program changes will cost $250,000, Oklahoma estimates costs of $1.1 million, Pennsylvania estimates costs of $3.4 million, and South Dakota estimates costs of $200,000.10 Colorado previously estimated that eligibility system changes alone would cost $300,000.11 CMS indicated that states must factor such costs associated with the close out of the program into calculations of use of remaining federal funds.12
Box 2: Administrative Actions to Implement Program Changes
Notifying families
Translating notices
Submitting state plan amendments to CMS
Conducting tribal consultation
Making changes to eligibility systems and other systems
Training eligibility staff
Redetermining eligibility for other programs
Notifying providers, managed care organizations (MCOs), and other stakeholders
Updating contracts with MCOs, vendors, and other third parties.
What Actions Remain for Congress to Extend Funding?
Multiple steps still remain for Congress to extend federal CHIP funding. As of early December 2017, the House had passed a bill to extend CHIP funding. In early October 2017, the Senate Finance Committee reported a bill out of committee to extend funding. However, the full Senate has not yet taken up action to extend funding. Final legislation still requires passage by the full Senate, resolution of any differences between the House and Senate bills, and signature by the President.
Further delay in Congressional action is likely to result in confusion among families that could lead to coverage losses and administrative costs even if Congress later extends funding. As states begin to notify families of changes in CHIP coverage, there is the potential for confusion among families that could lead to coverage losses, even if Congress later extends funding. Moreover, states are already beginning to take action to implement program changes, resulting in administrative time and costs. States will face additional administrative burdens and costs associated with reversing these changes and restarting coverage, if funding is extended.
Appendix Table 1: State CHIP Budget Assumptions and Projected Dates of Exhaustion of Federal Funds
State
Has separate CHIP coverage?
SFY 2018 budget assumes continued federal funding?
SFY 2018 budget assumes ACA enhanced match continues?
State estimate of when it will exhaust federal funding1
State reported update to funding exhaustion date in November 2017?
Alabama
Yes
Yes
Yes
February 2018
Yes
Alaska
Yes
No
March 2018
Yes
Arizona
Yes
Yes
Yes
December 2017
Yes
Arkansas
Yes
Yes
Yes
June 2018
California
2
Yes
No
January 2018
Yes
Colorado
Yes
Yes
Yes
January 2018
Yes
Connecticut
Yes
Yes
Yes
February 2018
Yes
Delaware
Yes
Yes
Yes
January 2018
Yes
DC
Yes
NR
1st Q 2018
Yes
Florida
Yes
Yes
Yes
January 2018
Yes
Georgia
Yes
Yes
NR
January to March 20183
Hawaii
Yes
Yes
February 2018
Yes
Idaho
Yes
Yes
Yes
January 2018
Yes
Illinois
Yes
Yes
No
NR
Indiana
Yes
Yes
NR
Summer 2018
Iowa
Yes
Yes
Yes
March 2018
Yes
Kansas
Yes
NR
NR
NR
Kentucky
Yes
Yes
Yes
February 2018
Louisiana
Yes
Yes
Yes
February 2018
Yes
Maine
Yes
Yes
NR
NR
Maryland
Yes
Yes
April 2018
Yes
Massachusetts
Yes
Yes
Yes
January 2018
Yes
Michigan
Yes
Yes
February/March 2018
Minnesota
Yes
NR
November 2017
Yes
Mississippi
Yes
Yes
Yes
April 2018
Yes
Missouri
Yes
Yes
No
Spring/Summer 2018
Yes
Montana
Yes
Yes
Yes
February 2018
Yes
Nebraska
Yes
No
2nd Q 2018
Nevada
Yes
Yes
NR
October/November 2017
New Hampshire
No
N/A
December 2017
Yes
New Jersey
Yes
Yes
Yes
March 2018
Yes
New Mexico
Yes
NR
July 2018
Yes
New York
Yes
Yes
Yes
March 20184
North Carolina
Yes
Yes
Yes
1st Q 2018
Yes
North Dakota
Yes
Yes
Yes
May 2018
Yes
Ohio
Yes
NR
February 2018
Yes
Oklahoma
Yes5
No
N/A
March 2018
Yes
Oregon
Yes
Yes
Yes
December 2017
Yes
Pennsylvania
Yes
Yes
Yes
January 2018
Yes
Rhode Island
Yes
Yes
March 2018
Yes
South Carolina
Yes
Yes
SFY 2019
South Dakota
Yes
Yes
Yes
March 2018
Yes
Tennessee
Yes
Yes
Yes
Late spring
Yes
Texas
Yes
Yes
Yes
January 2018
Yes
Utah
Yes
Yes
Yes
January 2018
Yes
Vermont
Yes
No
1st Q 2018
Virginia
Yes
Yes
Yes
January 2018
Yes
Washington
Yes
Yes
Yes
September 2017
Yes
West Virginia
Yes
Yes
Yes
February 2018
Yes
Wisconsin
Yes
Yes
Yes
March 2018
Yes
Wyoming
Yes
Yes
Yes
April 2018
Yes
NOTES: NR: Not reported. N/A: Not applicable; state budget does not assume continuation of CHIP funding. 1State projections vary with regard to whether they include redistribution funds; for some states, redistribution funds could temporarily extend funding beyond the projected exhaustion date. 2 Some counties in California provide separate CHIP coverage. 3Georgia reported Feb/March 2018 if they suspend eligibility, Jan 2018 if eligibility not suspended. 4New York reported “into CY 2018” in Summer 2017 and did not provide an updated estimate; March 2018 estimate is based on MACPAC projection. 5 Oklahoma has a separate CHIP program that provides premium assistance to some children and coverage for pregnant women through the unborn child option.SOURCES: Kaiser Family Foundation Survey of Medicaid Officials in 50 States and DC conducted by Health Management Associates, Summer 2017 with November 2017 updates. List of states with separate CHIP coverage is from a national survey conducted by the Kaiser Family Foundation with Georgetown University Center for Children and Families, January 2017, http://www.kff.org/medicaid/report/medicaid-and-chip-eligibility-enrollment-renewal-and-cost-sharing-policies-as-of-january-2017-findings-from-a-50-state-survey/.
Appendix 2: Effects of Previous State Enrollment Caps and Freezes
After Arizona froze CHIP enrollment in December 2009, enrollment fell by more than 60% from about 46,900 to 17,600 as of July 2011 (Figure 2).13 Just over four in ten disenrolled children moved to Medicaid due to declines in family income, but many others likely became uninsured.14 The children’s uninsured rate in Arizona grew following the enrollment freeze.15 Over the same period, the waiting list for CHIP grew to over 100,000 children and was continuing to grow at a rate of about 10,000 children per month.16
In North Carolina, enrollment fell by nearly 30% from about 72,000 to 51,300 when it froze enrollment between January and October 2001. The number of children determined eligible for CHIP but placed on a waiting list grew to over 34,000.17 Most (60%) children added to the waiting list were previously enrolled in Medicaid and were unable to transition to CHIP.
Enrollment freezes negatively affected children’s health and family finances. In North Carolina, parents with children affected by the enrollment freeze said their children experienced periods of being uninsured and that almost all needed care during the time that they lacked coverage.18 Parents often had to delay care while their children were uninsured and reported difficulties obtaining prescription medications for their children.19 Parents also reported that obtaining care while their children were uninsured resulted in significant financial hardships, requiring them to cut back on necessities, borrow money from family or friends, and accrue debt for missed payments on bills.20
Cost estimate for Oklahoma is combined federal and state costs. Other states did not specify whether the estimates they provided are for state costs alone or federal and state costs combined. ↩︎
Colorado’s projected cost for eligibility system changes is from the state’s response to the Summer 2017 Medicaid budget survey. ↩︎
Centers for Medicare and Medicaid Services, “Contingency Planning for a Title XXI Shortfall,” Children’s Coverage TAG, July 25, 2017. ↩︎
Ian Hill, Brigette Courtot, and Jennifer Sullivan, “Coping With SCHIP Enrollment Caps: Lessons From Seven States’ Experiences” Health Affairs 26 no.1 (January/February 2007): 258-268, http://content.healthaffairs.org/content/26/1/258.full.pdf↩︎
In this video, residents of Puerto Rico discuss their daily lives and views of recovery efforts two months after Hurricane Maria. They describe a climate of frustration, job loss and continuing economic disruption, a lack of basic services such as electricity and a rising toll on the population’s mental and physical health. A related report is also available.
Donor government funding for family planning decreased in 2016 compared to the prior year, with bilateral support falling from $1.34 billion in 2015 to $1.19 billion (-12%).
This marked the second year of declines in a row, following an initial increase after the London Summit on Family Planning held in 2012. These declines were largely due to currency fluctuations and the timing of donor disbursements, although even after accounting for these factors, funding in 2016 declined, returning to 2013 levels; funding from several donors decreased in real terms.
Among the 10 donor governments profiled, four governments decreased bilateral funding (France, Norway, the U.K., and the U.S.), five increased (Australia, Denmark, Germany, the Netherlands, and Sweden), and one remained flat (Canada).
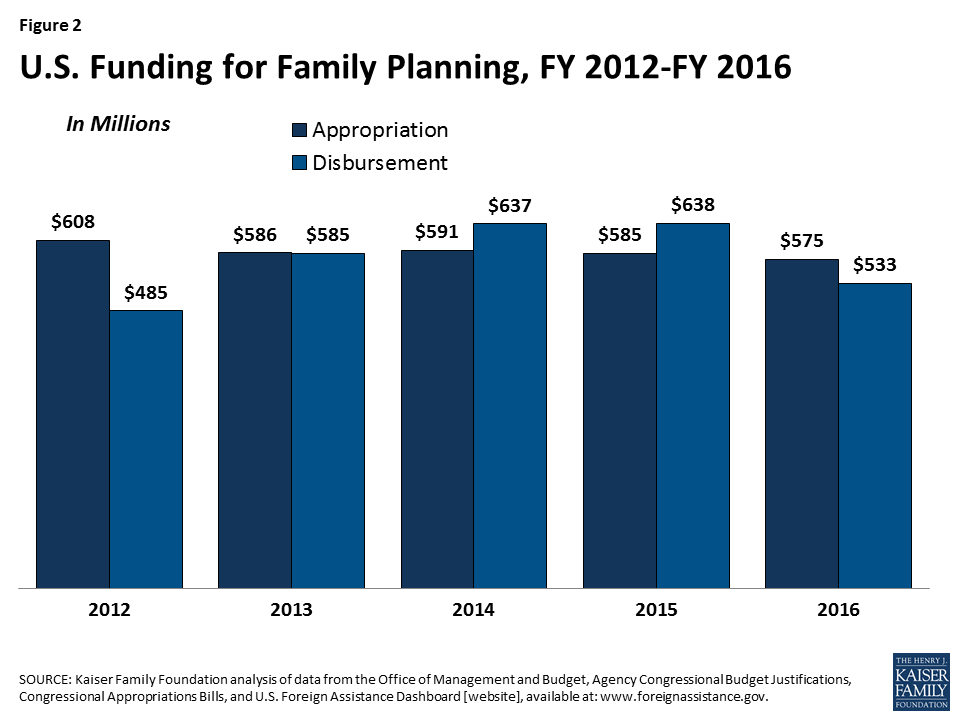
The decline by the U.S. in 2016 (from US$638.0 million in 2015 to US$532.7 million in 2016) appears to reflect the timing of disbursements, as overall funding commitments by the U.S. have remained flat for several years.
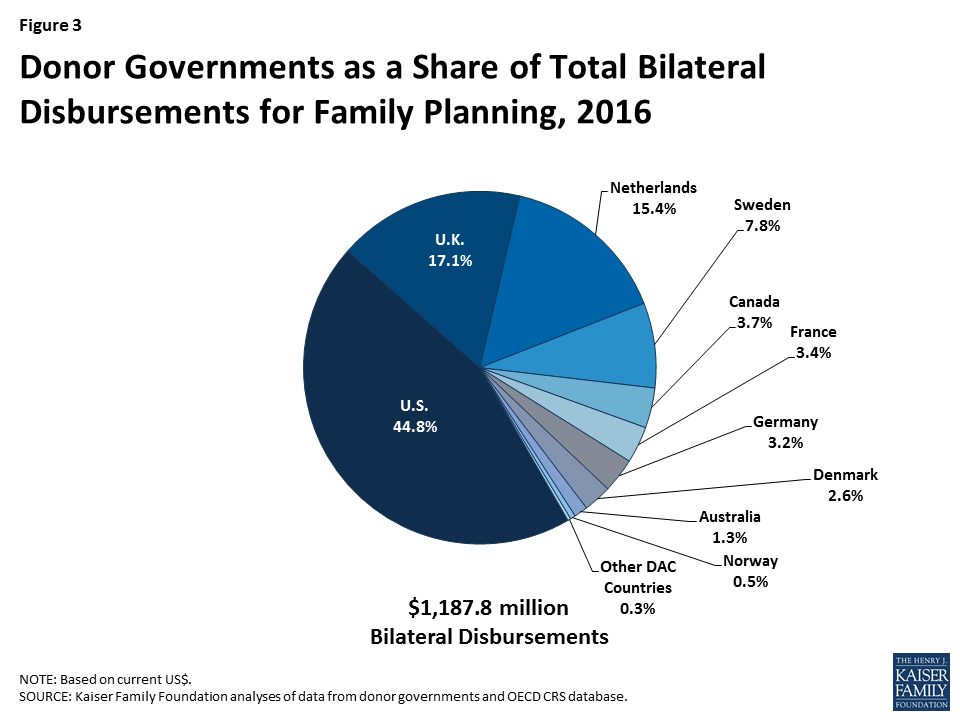
Despite the decline, the U.S. was still the largest bilateral donor to family planning in 2016, providing 45% of total bilateral funding. The U.K. (US$203.4 million, 17%) was the second largest donor, followed by the Netherlands (US$183.1 million, 15%), Sweden (US$92.5 million, 8%), and Canada (US$43.8 million, 4%).
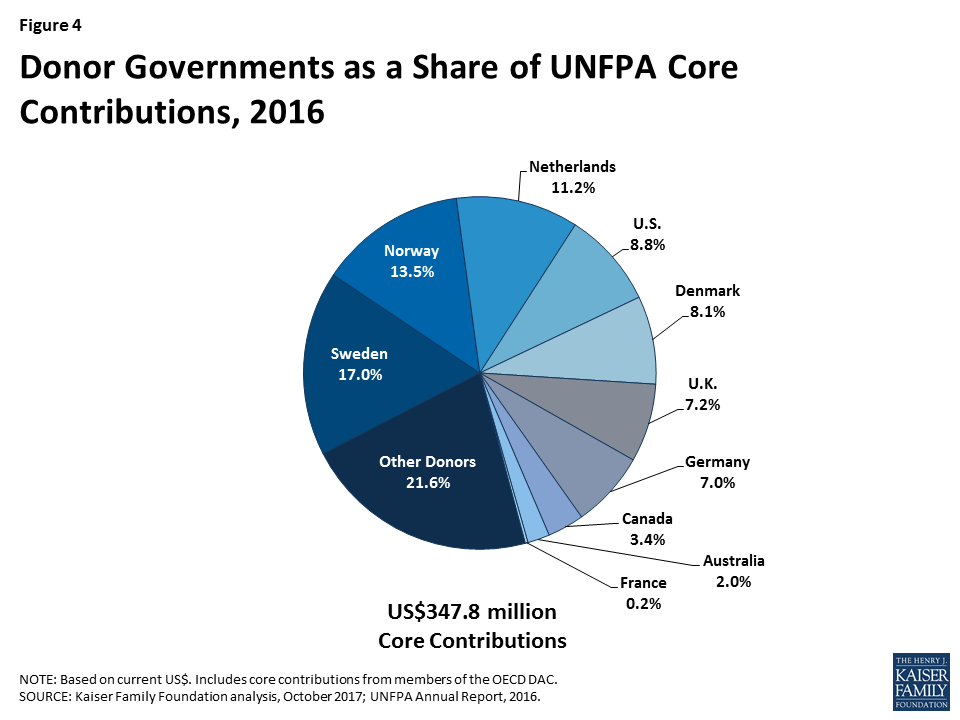
In addition to bilateral disbursements for family planning, donor governments also provided US$347.8 million in core contributions to UNFPA; this also represented a decline over the prior year period of US$44.8 million (-13%) compared to 2015 (US$392.6 million).1 Sweden provided the largest core contribution to UNFPA in 2016 (US$59.0 million), followed by Norway (US$46.8 million), the Netherlands (US$39.1 million), and the U.S. (US$30.7).
Report
Introduction
This report provides the latest data on donor government resources available for family planning activities in low- and middle-income countries. It is part of an effort by the Kaiser Family Foundation that began after the London Summit on Family Planning in 2012 where donors committed US$2.6 billion in additional funding to increase access to family planning by 2020 (see Appendix 1).2 This current report provides data on donor government disbursements in 2016, the most recent year available. It includes data from all members of the Organisation for Economic Co-operation and Development (OECD)’s Development Assistance Committee (DAC), as well as non-DAC members where data are available.3 Data are collected directly from donors and supplemented with data from the DAC. Ten donor governments that account for 98% of total disbursements are profiled in this analysis. Both bilateral assistance and core contributions to UNFPA are included. See methodology for more detail. For information on family planning funding from other sources (e.g. multilateral organizations, foundations, etc.) see Appendix 2.
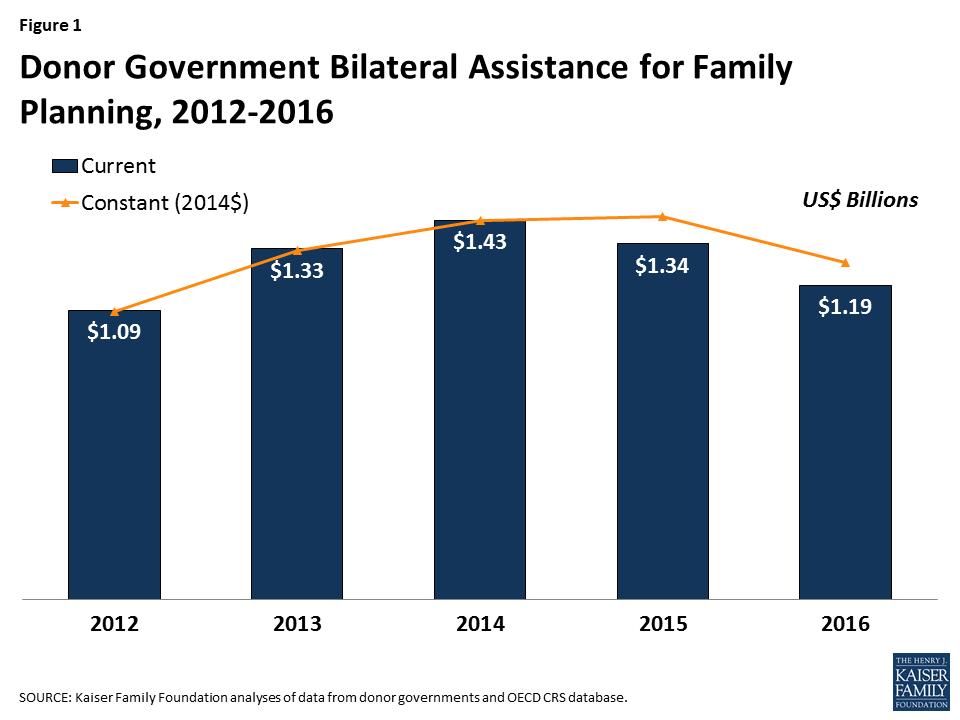
Figure 1: Donor Government Bilateral Assistance for Family Planning, 2012-2016
Findings
Bilateral Assistance
In 2016, donor governments disbursed US$1,187.8 million in bilateral funding for family planning activities (see Table 1, Figure 1 & Appendix 3), a decline of more than US$150 million (-12%) compared to the 2015 level (US$1,344.0 million). This marks the second year of declines after initial increases following the London Summit in 2012. Much of the decline over the past two years can be attributed to two factors: 1) the rise in the value of the U.S. dollar compared to other currencies in 2015, which accounted for 36% of the decline; and 2) an apparent delay in the timing of disbursements by the U.S., which accounted for 42% of the decline (while U.S. funding declined by more than US$100 million in 2016, annual funding commitments appropriated by Congress have remained flat for the past several years; in addition, there have been other years where disbursements have varied from commitments; see Figure 2).4 However, even after accounting for currency fluctuations and the timing of disbursements, funding declined by 22% over the two-year period and returned to 2013 levels.
Among the donors profiled, five (Australia, Denmark, Germany, the Netherlands, and Sweden) increased FP funding in 2016, four decreased funding (France, Norway, the U.K., and the U.S.) and one remained flat (Canada). This was the case in current U.S. dollars as well as after adjusting for currency fluctuations.
Table 1: Donor Government Bilateral Disbursements for Family Planning, 2012-2016 (in current US$, millions)
Country
2012
2013
2014
2015
2016
Difference
2015 – 2016
2012 – 2016
Australia
$43.2
$39.5
$26.6
$12.4
$14.9
$2.5(20.2%)
$-28.3(-65.5%)
Canada
$41.5
$45.6
$48.3
$43.0
$43.8
$0.8(1.9%)
$2.3(5.5%)
Denmark
$13.0
$20.3
$28.8
$28.1
$30.7
$2.6(9.3%)
$17.7(136.2%)
France
$49.6
$37.2
$69.8
$68.6
$39.9
$-28.7(-41.8%)
$-9.7(-19.6%)
Germany
$47.6
$38.2
$31.3
$34.0
$37.8
$3.8(11.2%)
$-9.8(-20.6%)
Netherlands
$105.4
$153.7
$163.6
$165.8
$183.1
$17.3(10.4%)
$77.7(73.7%)
Norway
$3.3
$20.4
$20.8
$8.1
$5.7
$-2.4(-29.6%)
$2.4(72.7%)
Sweden
$41.2
$50.4
$70.2
$66.0
$92.5
$26.5(40.2%)
$51.3(124.5%)
U.K.
$252.8
$305.2
$327.6
$269.9
$203.4
$-66.5(-24.6%)
$-49.4(-19.5%)
U.S.
$485.0
$585.0
$636.6
$638.0
$532.7
$-105.3(-16.5%)
$47.7(9.8%)
Other DAC Countries*
$11.0
$29.5
$9.0
$10.1
$3.3
$-6.9(-67.8%)
$-7.7(-70.3%)
Total
$1,093.6
$1,325.0
$1,432.7
$1,344.0
$1,187.8
$-156.3 (-11.6%)
$94.2 (8.6%)
*Austria, Belgium, Czech Republic, European Union, Finland, Greece, Hungary, Iceland, Ireland, Italy, Japan, Korea, Luxembourg, New Zealand, Poland, Portugal, the Slovak Republic, Slovenia, Spain, and Switzerland.
Figure 2: U.S. Funding for Family Planning, FY 2012-FY 2016
The United States was the largest bilateral donor in 2016 accounting for US$532.7 million or 45% of total bilateral assistance (see Figure 3). The U.K. (US$203.4 million, 17%) was the second largest bilateral donor, followed by the Netherlands (US$183.1 million, 15%), Sweden (US$92.5 million, 8%), and Canada (US$43.8 million, 4%).
Figure 3: Donor Governments as a Share of Total Bilateral Disbursements for Family Planning, 2016
Donor Contributions to UNFPA
While the majority of donor government assistance for family planning is provided bilaterally, donors also provide support for family planning activities through contributions to the United Nations Population Fund (UNFPA) (see Appendix 4). Most of UNFPA’s funding is from donor governments, which provide funding in two ways: 1) donor directed or earmarked contributions for specific activities (e.g. donor contributions to the UNFPA Supplies), which are included as part of bilateral funding above; and 2) general contributions to “core” activities that are untied and meant to be used for both programmatic activities (family planning, population and development, HIV-AIDS, gender, and sexual and reproductive health and rights) and operational support as determined by UNFPA.
In 2016, donor governments provided US$347.8 million in core contributions to UNFPA, a decrease of US$44.8 million (-13%) below 2015 levels (US$392.6 million) and US$123.7 million (-26%) below 2014 levels. Despite the overall declines, the majority of donors either increased funding (Germany and Sweden) or remained flat (Canada, France, Netherlands, and U.S.); four donors declined (Australia, Denmark, Norway and the U.K.); however U.K. contributions remained flat when measured in currency of origin. Sweden provided the largest core contribution to UNFPA in 2016 (US$59.0 million), followed by Norway (US$46.8 million), the Netherlands (US$39.1 million), and Denmark (US$28.1) (see Figure 4 and Table 2). Among the ten donors profiled, one donor – Norway – provided a larger contribution to UNFPA’s core resources than their total bilateral disbursement for family planning.
Figure 4: Donor Governments as a Share of UNFPA Core Contributions, 2016
Table 2: Donor Government Contributions to UNFPA (Core Resources), 2012-2016 (in current US$, millions)
Country
2012
2013
2014
2015
2016
Difference
2015 – 2016
2012 – 2016
Australia
$14.9
$15.6
$13.9
$11.7
$7.0
$-4.7(-39.9%)
$-7.9(-52.8%)
Canada
$17.4
$16.0
$14.0
$12.4
$11.7
$-0.7(-5.8%)
$-5.7(-32.8%)
Denmark
$44.0
$40.4
$41.9
$35.7
$28.1
$-7.6(-21.3%)
$-15.9(-36.1%)
France
$0.5
$0.0
$0.0
$0.6
$0.8
$0.2(39.3%)
$0.3(67.2%)
Germany
$20.7
$24.0
$24.7
$21.3
$24.4
$3.1(14.4%)
$3.7(17.7%)
Netherlands
$49.0
$52.4
$48.4
$39.7
$39.1
$-0.6(-1.5%)
$-9.9(-20.2%)
Norway
$59.4
$70.6
$69.1
$55.6
$46.8
$-8.8(-15.7%)
$-12.6(-21.1%)
Sweden
$66.3
$65.8
$70.3
$57.4
$59.0
$1.6(2.9%)
$-7.3(-10.9%)
U.K.
$31.8
$31.5
$33.1
$30.8
$25.0
$-5.8(-18.8%)
$-6.8(-21.4%)
U.S.
$30.2
$28.9
$31.1
$30.8
$30.7
$-0.1(-0.3%)
$0.5(1.7%)
Other Donors
$98.0
$108.8
$125.0
$96.6
$75.1
$-21.5(-22.2%)
$-22.9(-23.4%)
Total
$432.2
$454.0
$471.5
$392.6
$347.8
$-44.8 (-12.9%)
$-84.4 (-19.5%)
Looking Ahead
As this report finds, family planning funding initially increased after the 2012 London Summit on Family Planning but more recently has begun to decline and future funding is uncertain. While this recent decline is due to several factors, including currency fluctuations and the timing of disbursements, even after accounting for these factors, funding in 2016 had fallen to 2013 levels. Moreover, future funding from the largest donor to family planning – the United States – is uncertain. In 2017, the Trump Administration ended funding to UNFPA and has proposed eliminating all bilateral funding in 2018. While the U.S. Congress has not yet finalized funding for the 2018 fiscal year, but is expected to continue bilateral funding at some level, this downward pressure on the family planning budget is likely to continue.
Against this uncertain backdrop, donors met in London earlier this year to renew their commitments to FP2020. In addition, following President Trump’s reinstatement and expansion of the Mexico City Policy, which requires foreign NGOs to certify that they will not “perform or actively promote abortion as a method of family planning” with non-U.S. funds as a condition for receiving U.S. global health assistance, the governments of Belgium, Denmark, the Netherlands, and Sweden co-organized the “SheDecides” conference in early 2017 to address potential funding losses to broader reproductive health. Whether these new and renewed commitments can increase overall FP funding levels or replace potential declines from the U.S. remains to be seen and ongoing tracking of donor government efforts will continue to be critical.
Methods
Bilateral and multilateral data on donor government assistance for family planning (FP) in low- and middle-income countries were collected from multiple sources. The research team collected the latest bilateral assistance data directly for 10 governments: Australia, Canada, Denmark, Germany, France, the Netherlands, Norway, Sweden, the United Kingdom, and the United States during the first half of 2017. Data represent the fiscal year 2016 period for all governments. Direct data collection from these donors was desirable because they represent the preponderance of donor government assistance for family planning and the latest official statistics – from the Organisation for Economic Co-operation and Development (OECD) Creditor Reporting System (CRS) (see: http://www.oecd.org/dac/stats/data) – which are from 2015 and do not include all forms of international assistance (e.g., funding to countries such as Russia and the Baltic States that are no longer included in the CRS database). In addition, the CRS data may not include certain funding streams provided by donors, such as FP components of mixed-purpose grants to non-governmental organizations. Data for all other OECD DAC member governments – Austria, Belgium, Czech Republic, the European Union, Finland, Greece, Hungary, Iceland, Ireland, Italy, Japan, Korea, Luxembourg, New Zealand, Poland, Portugal, the Slovak Republic, Spain, and Switzerland – who collectively accounted for less than 2 percent of bilateral family planning disbursements, were obtained from the OECD CRS and are from calendar year 2015.
For purposes of this analysis, funding was counted as family planning if it met the OECD CRS purpose code definition: “Family planning services including counselling; information, education and communication (IEC) activities; delivery of contraceptives; capacity building and training.”5 Where it was possible to identify funding amounts, family-planning-related activities funded in the context of other official development assistance sectors (e.g. education, civil society) are included in this analysis. Project-level data were reviewed for Canada, Denmark, France, Germany, the Netherlands, Norway, and Sweden to determine whether all or a portion of the funding could be counted as family planning. Family-planning-specific funding totals for the United States were obtained through direct data downloads and communications with government representatives. Funding attributed to Australia and the United Kingdom is based on a revised Muskoka methodology as agreed upon by donors at the London Summit on Family Planning in 2012. Funding totals presented in this analysis should be considered preliminary estimates based on data provided by representatives of the donor governments who were contacted directly.
It was difficult in some cases to disaggregate bilateral family planning funding from broader reproductive and maternal health totals, as the two are sometimes represented as integrated totals. In addition, family-planning-related activities funded in the context of other official development assistance sectors (e.g. education, civil society) have in the past remained largely unidentified. For purposes of this analysis, we worked closely with the largest donors to family planning to identify such family-planning-specific funding where possible. In some cases (e.g. Canada), specific FP percentages were recorded for mixed-purpose projects. In other cases, it was possible to identify FP-specific activities by project titles in languages of origin, notwithstanding less-specific financial coding. In still other cases, detailed project descriptions were analyzed. (see Appendix 3 for detailed data table).
Bilateral funding is defined as any earmarked (FP-designated) amount and includes family planning-specific contributions to multilateral organizations (e.g. non-core contributions to the Global Programme to Enhance Reproductive Health Commodity Security at UNFPA). U.S. bilateral data correspond to amounts disbursed for the 2016 fiscal year. UNFPA contributions from all governments correspond to amounts received during the 2016 calendar year, regardless of which contributor’s fiscal year such disbursements pertain to.
With some exceptions, bilateral assistance data were collected for disbursements. A disbursement is the actual release of funds to, or the purchase of goods or services for, a recipient. Disbursements in any given year may include disbursements of funds committed in prior years and in some cases, not all funds committed during a government fiscal year are disbursed in that year. In addition, a disbursement by a government does not necessarily mean that the funds were provided to a country or other intended end-user. Enacted amounts represent budgetary decisions that funding will be provided, regardless of the time at which actual outlays, or disbursements, occur. In recent years, most governments have converted to cash accounting frameworks, and present budgets for legislative approval accordingly; in such cases, disbursements were used as a proxy for enacted amounts.
UNFPA core contributions were obtained from United Nations Executive Board documents. UNFPA estimates of total family planning funding provided from both core and non-core resources were obtained through direct communications with UNFPA representatives. Other than core contributions provided by governments to UNFPA, un-earmarked core contributions to United Nations entities, most of which are membership contributions set by treaty or other formal agreement (e.g., United Nations country membership assessments), are not identified as part of a donor government’s FP assistance even if the multilateral organization in turn directs some of these funds to FP. Rather, these would be considered as FP funding provided by the multilateral organization, and are not considered for purposes of this report.
The fiscal year period varies by country. The U.S. fiscal year runs from October 1-September 30. The Australian fiscal year runs from July 1-June 30. The fiscal years for Canada and the U.K. are April 1-March 31. Denmark, France, Germany, the Netherlands, Norway, and Sweden use the calendar year. The OECD uses the calendar year, so data collected from the CRS for other donor governments reflect January 1-December 31. Most UN agencies use the calendar year and their budgets are biennial.
All data are expressed in US dollars (USD). Where data were provided by governments in their currencies, they were adjusted by average daily exchange rates to obtain a USD equivalent, based on foreign exchange rate historical data available from the U.S. Federal Reserve (see: http://www.federalreserve.gov/) or in some cases from the OECD. Data obtained from UNFPA were already adjusted by UNFPA to represent a USD equivalent based on date of receipts.
Appendices
Appendix 1: London Summit on Family Planning (2012)
In July 2012, the U.K. Government and the Bill & Melinda Gates Foundation, in partnership with UNFPA, civil society organizations, developing countries, donor governments, the private sector, and multilateral organizations met at the London Summit on Family Planning (FP2020) and made commitments aimed at improving access to voluntary family planning services.
London Summit on Family Planning Goals & Outcomes: “By 2020, the goal is to deliver contraceptives, information, and services to a total of 380 million women and girls in developing countries so they can plan their families.”
Sustain coverage for the estimated 260 million women in the world’s poorest countries who are currently using contraceptives (as of June 2012); and
Provide family planning for an additional 120 million women in these countries.
The Summit resulted in stated commitments totaling US$2.6 billion in additional funding for family planning activities from all sources (donor governments, non-governmental organizations, philanthropies, multilateral organizations, and domestic resources).
Appendix 2: Other Sources of Funding for FP in Low- & Middle-Income Countries
In addition to donor governments, there are three other major funding sources for family planning assistance: multilateral organizations, the private sector, and domestic resources.
Multilateral Organizations: Multilateral organizations are international organizations made up of member governments (and in some cases private sector and civil society representatives), who provide both core contributions as well as donor-directed funding for specific projects. Core support from donors is pooled by the multilateral organization, which in turn directs its use, such as for family planning. Donor-directed or earmarked funding, even when provided through a multilateral organization, is considered part of a donor’s bilateral assistance.
The primary multilateral organization focused on family planning is the United Nations Population Fund (UNFPA), which estimates that it spent US$319 million (US$76 million from core resources and US$243 million from non-core resources), or 40% of its total resources, on family planning activities in 2016.6 Another important source of multilateral assistance for family planning is the World Bank which provides such funding under broader population and reproductive health activities and hosts the Secretariat for the Global Financing Facility (GFF).
Private Sector: Foundations (charitable and corporate philanthropic organizations), corporations, faith-based organizations, and international non-governmental organizations (NGOs) provide support for FP activities in low- and middle-income countries not only in terms of funding, but through in-kind support; commodity donations; and co-investment strategies with government and other sectors. For instance, the Bill & Melinda Gates Foundation has become a major funder of global health efforts, including family planning activities, and is a core partner of FP2020. In 2016, the Gates Foundation provided US$181 million for family planning.7
Domestic Resources: Domestic resources includespending by country governments that also receive international assistance for FP and spending by households/individuals within these countries for FP services. Such resources represent a significant and critical part of the response. Since the London Summit, a total of 41 low- and middle-income countries have made specific commitments to increase their family planning spending.
Appendix 3: Donor Government Bilateral Disbursements for Family Planning, 2012-2016* (in current US$, millions)
Country
2012
2013
2014
2015
2016
Notes
Australia
$43.2
$39.5
$26.6
$12.4
$14.9
Australia identified A$18.4 million in bilateral FP funding for the 2016-17 fiscal year using the FP2020-agreed methodology, which includes funding from non-FP-specific activities (e.g. HIV, RH, maternal health and other sectors) and a percentage of the donor’s core contributions to several multilateral organizations (e.g. UNFPA). For this analysis, Australian bilateral FP funding did not include core contributions to multilateral institutions. However, it was not possible to identify and adjust for funding to other non-FP-specific activities in most cases. Data for 2016 are preliminary.
Canada
$41.5
$45.6
$48.3
$43.0
$43.8
Bilateral funding is for family planning and reproductive health components of combined projects/activities in FY16-17; family planning-specific activities cannot be further disaggregated. Reproductive health activities without family planning components are not reflected. This is a preliminary estimate.
Denmark
$13.0
$20.3
$28.8
$28.1
$30.7
Bilateral funding is for family planning-specific activities in 2016.
France
$49.6
$37.2
$69.8
$68.6
$39.9
Bilateral funding is new commitment data for a mix of family planning, reproductive health and maternal & child health activities in 2012-2016; family planning-specific activities cannot be further disaggregated.
Germany
$47.6
$38.2
$31.3
$34.0
$37.8
Bilateral funding is for family planning-specific activities.
Netherlands
$105.4
$153.7
$163.6
$165.8
$183.1
The Netherlands budget provided a total of US$469.5 million in 2016 for “Sexual and Reproductive Health & Rights, including HIV/AIDS” of which an estimated US$183.1 million was disbursed for family planning and reproductive health activities (not including HIV); family planning-specific activities cannot be further disaggregated.
Norway
$3.3
$20.4
$20.8
$8.1
$5.7
Bilateral funding is for family planning-specific activities, narrowly-defined under the corresponding DAC subsector 13030. Overall bilateral and multilateral Norwegian support to Sexual and Reproductive Health and Rights (SRHR) including family planning was NOK1.186 billion ($142 million) in 2016.
Sweden
$41.2
$50.4
$70.2
$66.0
$92.5
Bilateral funding is for combined family planning and reproductive health activities; family planning-specific activities cannot be further disaggregated. None of Sweden’s top-magnitude health activities appears to reflect an exclusive family-planning-specific subsector focus, indicative of the integration of FP activities into broader health initiatives in ways similar to those employed by some other governments. It thus may not be possible to identify exact amounts of Swedish bilateral or multi-bi FP financing.
U.K.
$252.8
$305.2
$327.6
$269.9
$203.4
In the financial year 2016/17, the UK spending on family planning was £171.23 million. This is a provisional estimate, using the FP2020-greed methodology, which includes funding from non-FP-specific activities (e.g., HIV, RH, maternal health and other sectors) and a percentage of the donor’s core contributions to several multilateral organizations. For this analysis, UK bilateral FP funding of £155.4 million was calculated by removing unrestricted core contributions to multilateral organizations. However, it was not possible to identify and adjust for funding for other non-FP-specific activities in most cases. The nominal 2014-16 US$ decrease is significantly exchange-rate-related. Bilateral funding is for combined family planning and reproductive health, consistent with the agreed-on methodology. A final estimate will be available after DFID publishes its annual report for 2016/17 in 2018.
U.S.
$485.0
$585.0
$636.6
$638.0
$532.7
Bilateral funding is for combined family planning and reproductive health activities; while USAID estimates that most funding is for family planning-specific activities only, these cannot be further disaggregated.
Other DAC Countries**
$11.0
$29.5
$9.0
$10.1
$3.3
Bilateral funding was obtained from the Organisation for Economic Co-operation and Development (OECD) Credit Reporting System (CRS) database and represents funding provided in the prior year (e.g. data presented for 2016 are the 2015 totals, the most recent year available; 2015 presents 2014 totals; etc.).
Total
$1,093.6
$1,325.0
$1,432.7
$1,344.0
$1,187.8
*For purposes of this analysis, family planning bilateral expenditures represent funding specifically designated by donor governments for family planning as defined by the OECD DAC (see methodology), and include: stand-alone family planning projects; family planning-specific contributions to multilateral organizations (e.g. contributions to UNFPA Supplies); and, in some cases, projects that include family planning within broader reproductive health activities. During the FP2020 Summit, donors agreed to a revised Muskoka methodology to determine their FP disbursements totals. This methodology includes some funding designated for other health sectors including, HIV, reproductive health (RH), maternal health, and other areas, as well as a percentage of a donor’s core contributions to several multilateral organizations including UNFPA, the World Bank, WHO, and the Global Fund to Fight AIDS, Tuberculosis and Malaria. Among the donors profiled, Australia and the U.K. reported FP funding using this revised methodology.
**Austria, Belgium, Czech Republic, European Union, Finland, Greece, Hungary, Iceland, Ireland, Italy, Japan, Korea, Luxembourg, New Zealand, Poland, Portugal, the Slovak Republic, Slovenia, Spain, and Switzerland.
Appendix 4: United Nations Population Fund (UNFPA) Mission, Goals, & London Summit on Family Planning Commitment (2012)
Created in 1969, UNFPA supports sexual and reproductive health activities in many low- and middle-income countries and was a key partner in the London Summit on Family Planning.
UNFPA Goal: “The goal of UNFPA is to deliver a world a world where every pregnancy is wanted, every childbirth is safe and every young person’s potential is fulfilled. To accomplish this, UNFPA works to ensure that all people, especially women and young people, are able to access high quality sexual and reproductive health services, including family planning, so that they can make informed and voluntary choices about their sexual and reproductive lives.”8
UNFPA Mandate:
“Build the knowledge and the capacity to respond to needs in population and family planning;
Promote awareness in both developed and developing countries of population problems and possible strategies to deal with these problems;
Assist their population problems in the forms and means best suited to the individual countries’ needs; and
Assume a leading role in the United Nations system in promoting population programmes, and to coordinate projects supported by the Fund.”9
UNFPA London Summit on Family Planning Commitment (2012): “UNFPA will double the proportion of its resources focused on family planning from 25% to 40 % based on current funding levels, bringing new funding of at least US$174 million per year from core and noncore funds. This will include a minimum of US $54 million per year, from 2013-2019, in increased funding for family planning from UNFPA’s core resources.”
Endnotes
Includes core-contributions from members of the OECD DAC only; core contributions from non-DAC donors are not included in this total. ↩︎
The Kaiser Family Foundation initiated a family planning resource tracking project in 2013, adapting the methodology it has long used to track donor government spending on HIV. Since 2002, the Joint United Nations Programme on HIV/AIDS (UNAIDS) and the Kaiser Family Foundation have been tracking donor government assistance for HIV in low- and middle-income countries by the donor government members of the Organization for Economic Co-operation and Development’s (OECD) Development Assistance Committee (DAC). For the methodological approach used to monitor donor government spending on HIV see: https://modern.kff.org/global-health-policy/report/financing-the-response-to-aids-in-low/. ↩︎
Includes funding from 29 DAC member countries and the European Union(EU). ↩︎
U.S. appropriations for family planning (FP) activities in a given fiscal year may be disbursed over a multi-year period. Therefore, while U.S. appropriations for FP have been relatively flat over the past several years, the actual disbursements have fluctuated over the same period. ↩︎
OECD, The List of CRS Purpose Codes and Voluntary Budget Identifier Codes, July 2017. ↩︎
A new Kaiser Family Foundation report finds that donor government funding for family planning declined in 2016 for the second year in a row, decreasing to US$1.19 billion compared to US$1.34 billion in 2015.
While the declines over this two-year period were largely due to exchange rate fluctuations and the timing of donor disbursements which accounted for 78 percent of the overall decrease, there were actual cuts in funding from some donor countries which accounted for 22 percent. Among the 10 donors profiled in the report, four donors decreased funding, including the two largest donors (the U.S. and the U.K.); five increased funding; and one remained flat.
The U.S. remained the largest donor, providing US$532.7 million, or 45 percent of total bilateral funding for family planning programs in 2016. The U.K. (US$203.4 million) was the second largest bilateral donor, followed by the Netherlands (US$183.1 million), Sweden (US$92.5 million), and Canada (US$43.8 million).
This analysis is being released at the same time as Family Planning 2020’s (FP2020) annual report.
An Early Assessment of Hurricane Harvey’s Impact on Vulnerable Texans in the Gulf Coast Region: Their Voices and Priorities to Inform Rebuilding Efforts
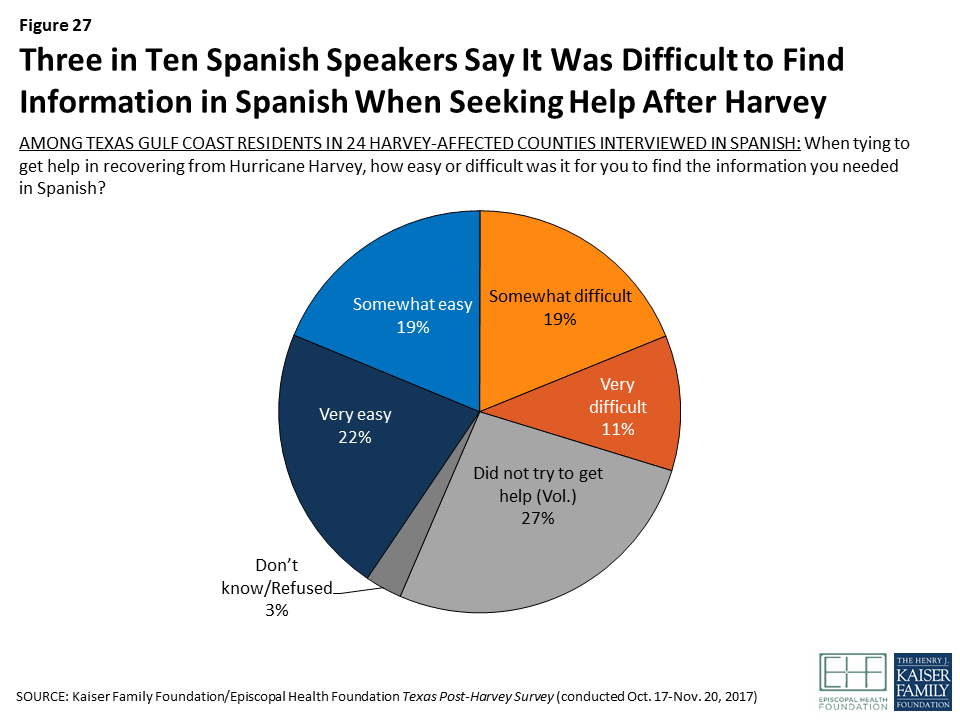
In late August 2017, Hurricane Harvey pummeled the Texas Gulf Coast, dropping record amounts of rainfall and causing damage with estimates ranging as high as $190 million.1 In an effort to understand the needs and circumstances of vulnerable Texans affected by the hurricane, the Kaiser Family Foundation and the Episcopal Health Foundation partnered to conduct a representative survey of adults living in 24 counties along the Texas coast that were particularly hard-hit. The survey – which was conducted between two to three months after Harvey made landfall – allows for examination of the views and experiences of residents in these counties overall, as well as in four distinct geographic regions: Harris County (the county where Houston is located and the largest in terms of population); the counties surrounding Harris that are part of the same Regional Council of Governments (“Outside Harris”); the three counties (Orange, Jefferson, and Hardin) that make up the “Golden Triangle” area east of Houston where the cities of Beaumont, Orange, and Port Arthur are located; and several counties to the southwest of Houston that make up the coastal area including Corpus Christi and Rockport (“Coastal”). In addition to the survey, the partners conducted three focus groups in Houston and two in Beaumont with low- and middle-income residents who were affected by the storm.
Key findings from the survey include:
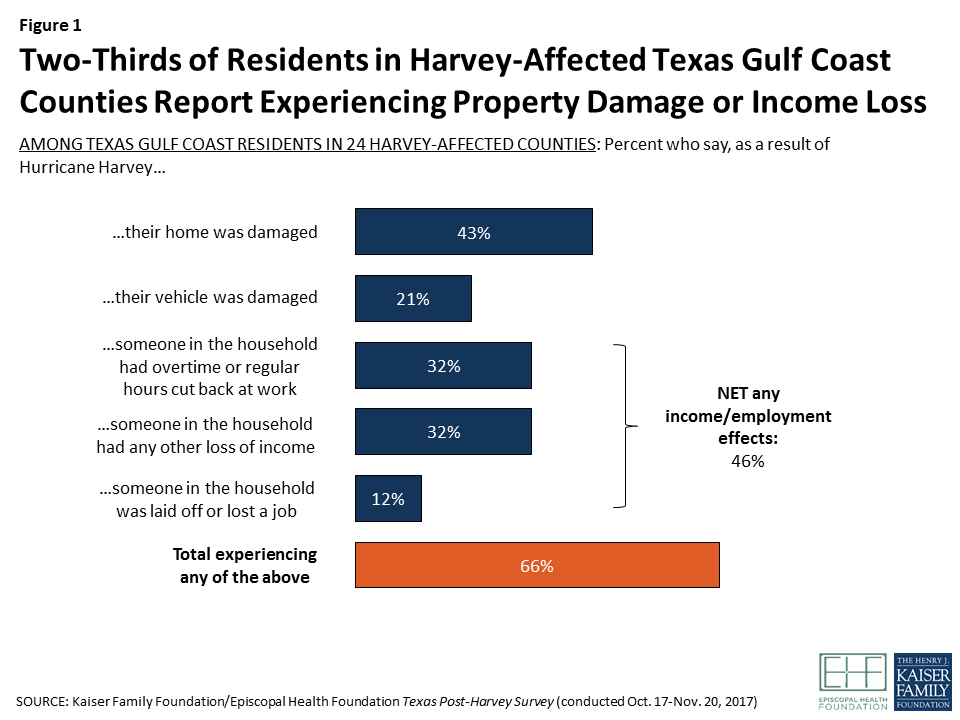
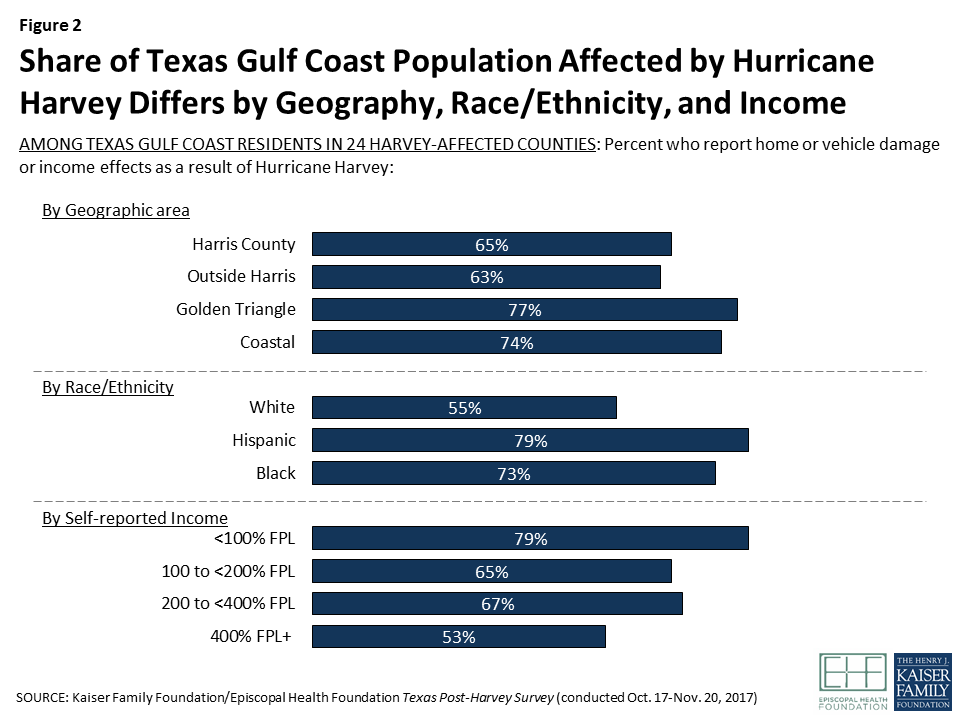
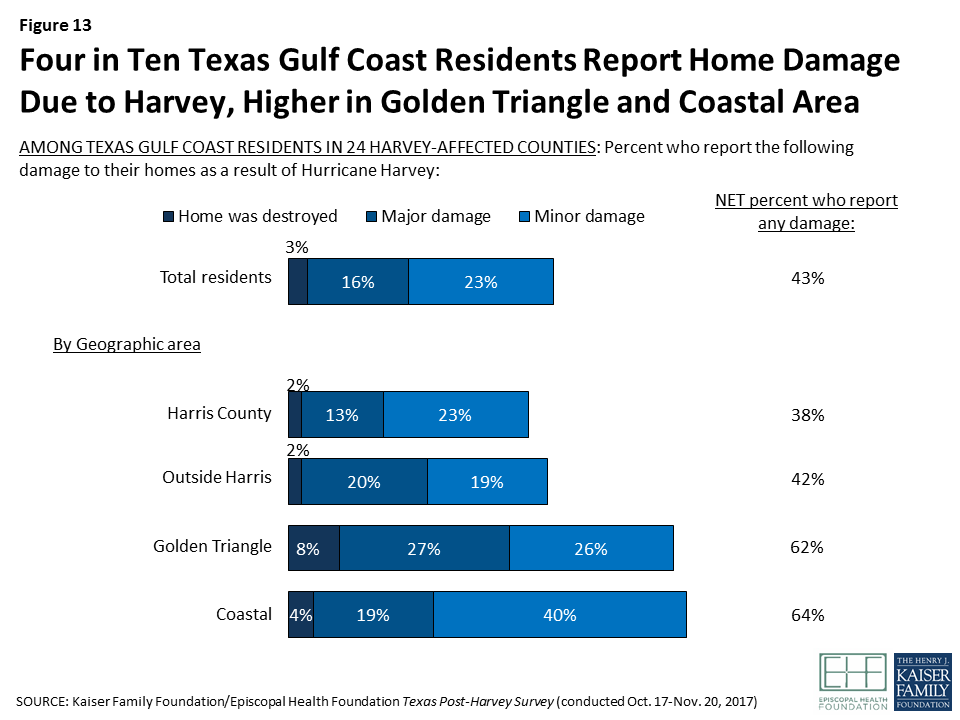
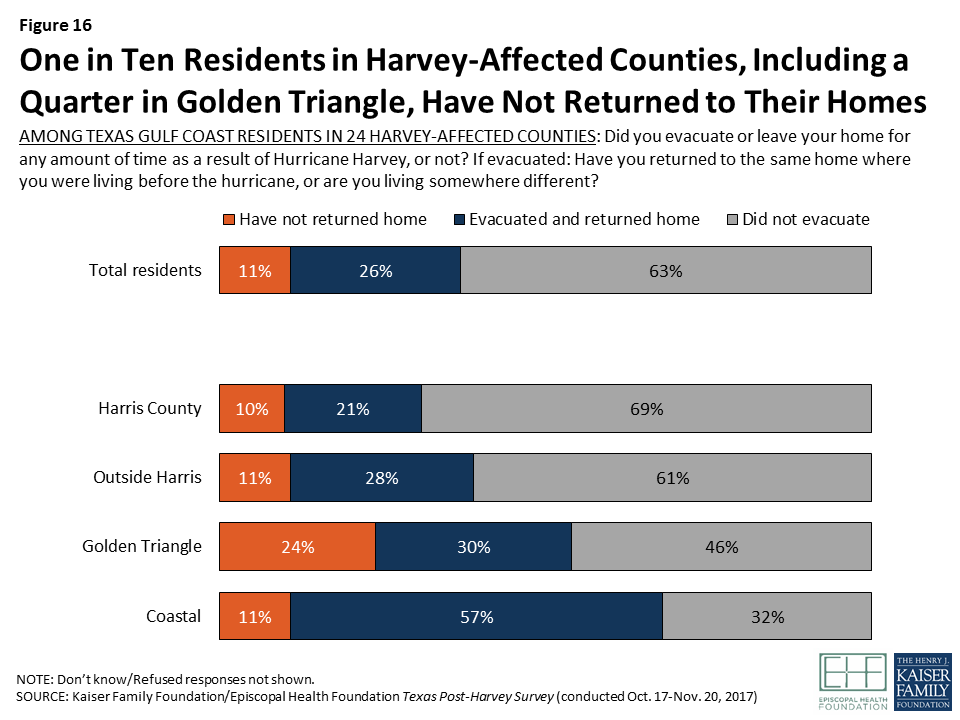
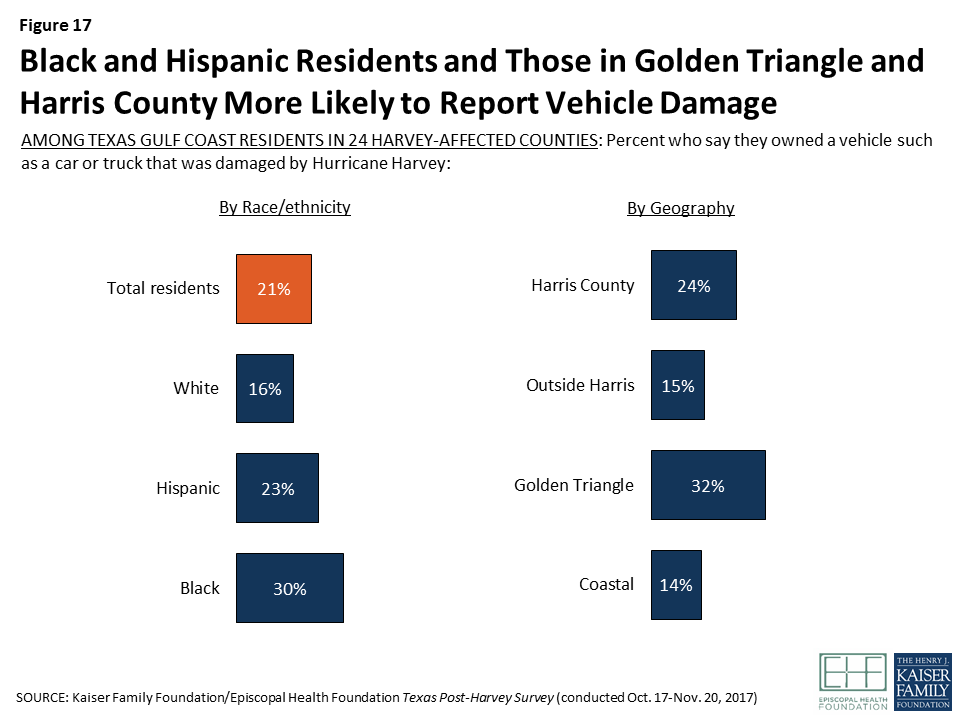
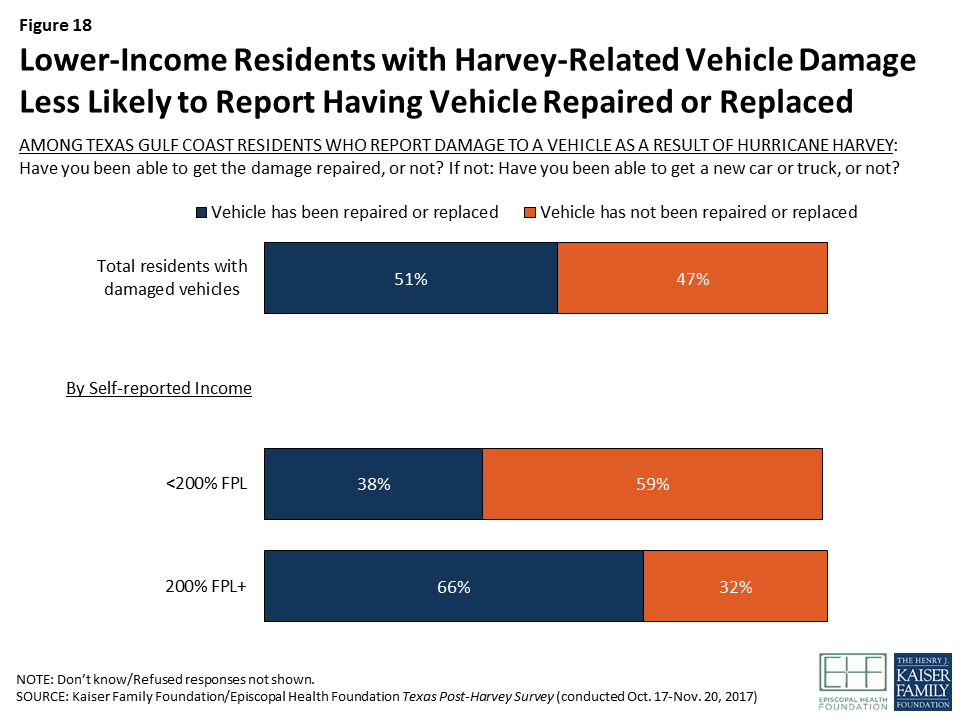
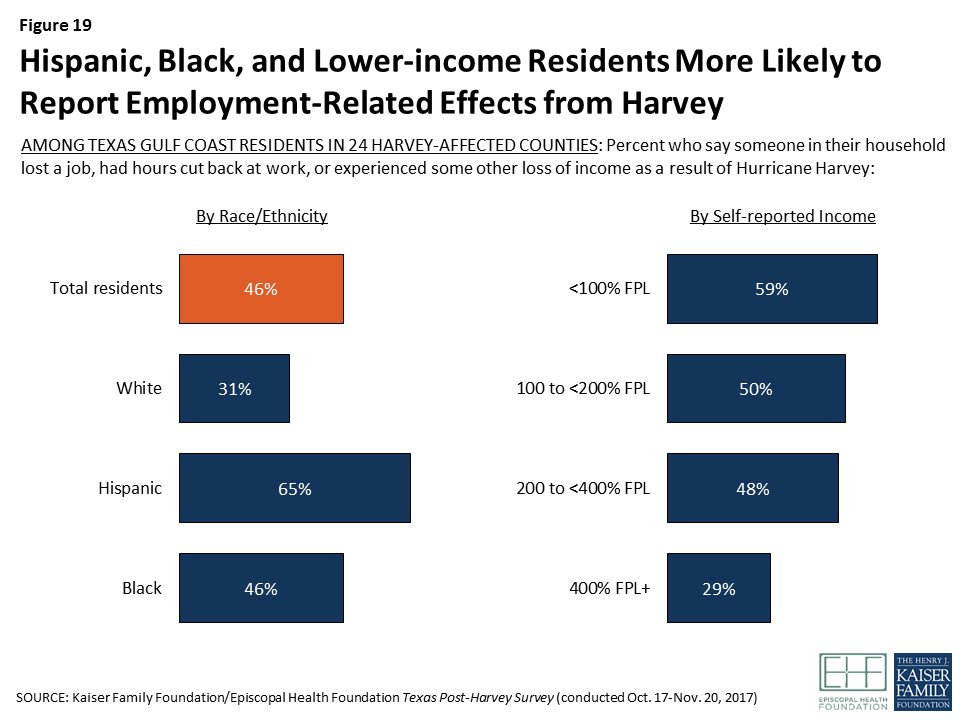
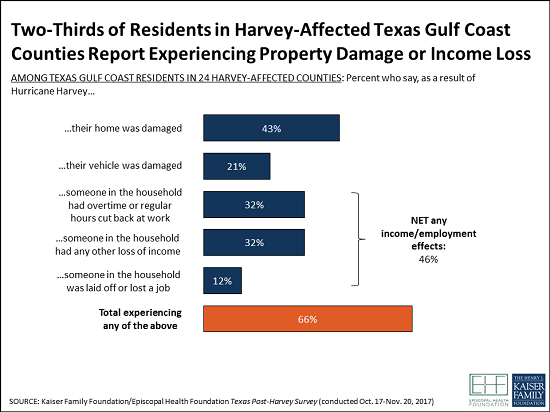
Two-thirds of residents of the 24 hard-hit Texas counties surveyed report being affected by Hurricane Harvey in terms of damage to their homes or vehicles, employment disruption, or income loss. Four in ten sustained damage to their home, nearly half experienced an interruption or loss of employment or some other loss of income, and one in five had a vehicle that was damaged. One in nine remain displaced from their homes at the time of the survey.
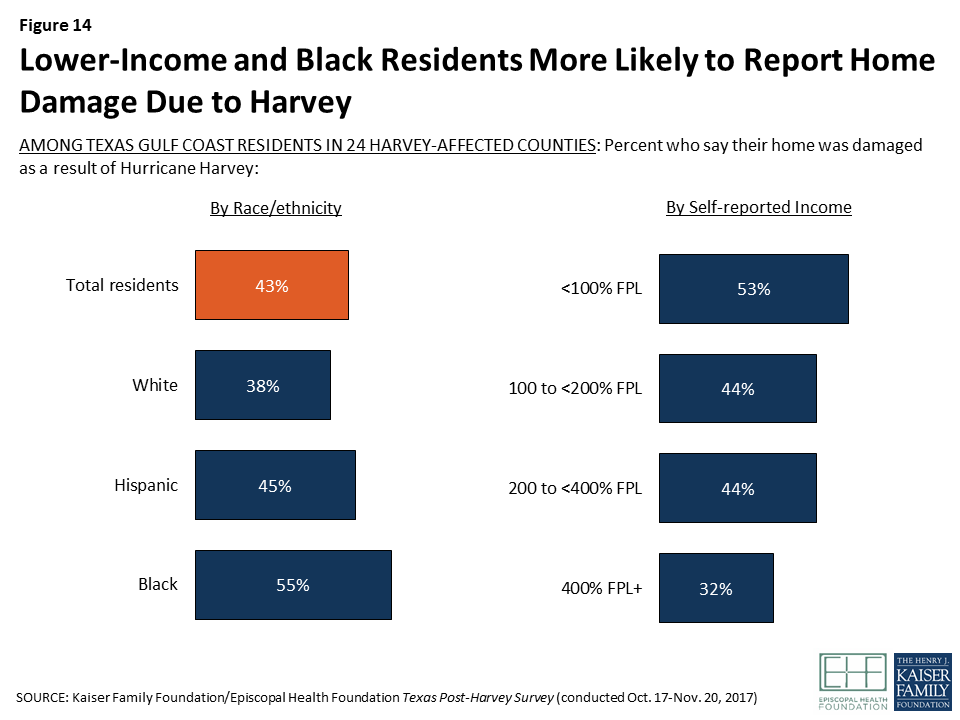
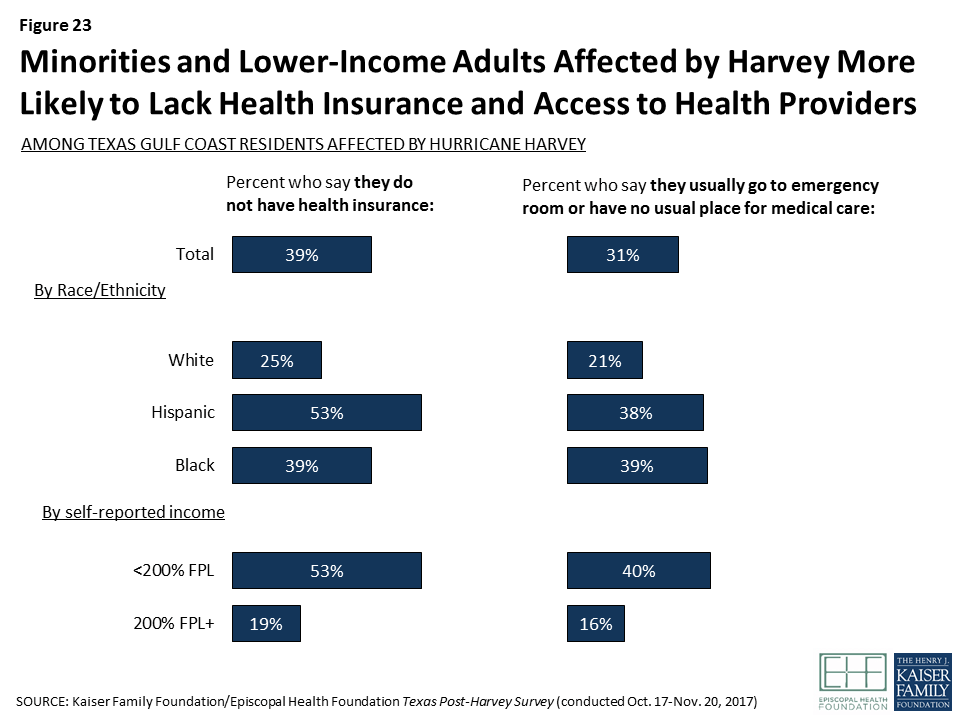
Effects of the hurricane were unevenly distributed by geography and demographics. Black and Hispanic residents, those with lower incomes, and those living in the Golden Triangle and Coastal areas were more likely to be affected by property damage or income loss than other residents.
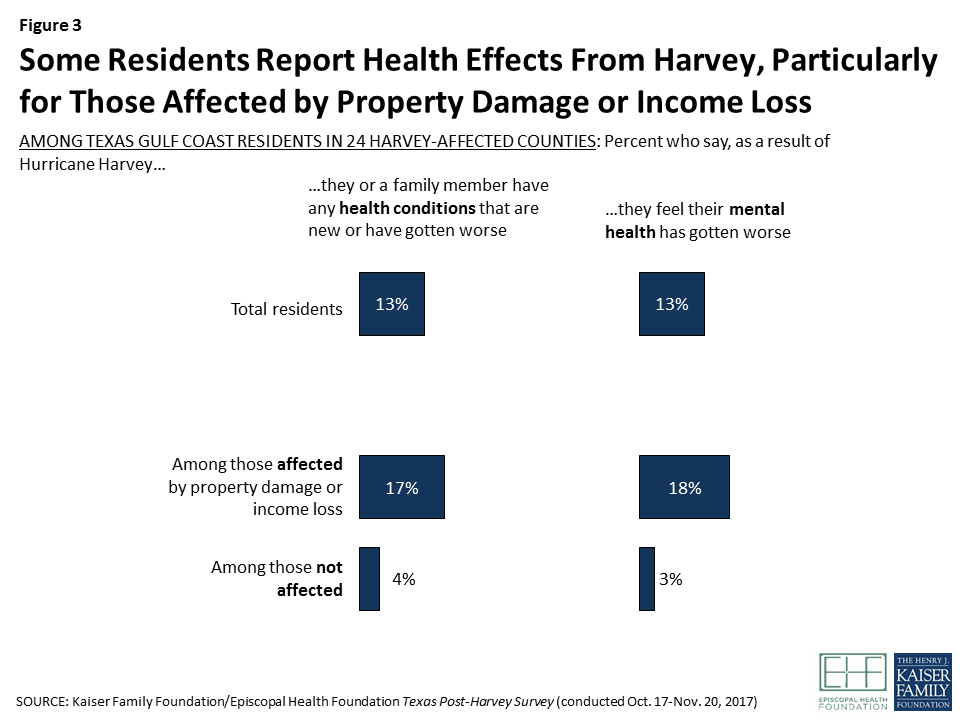
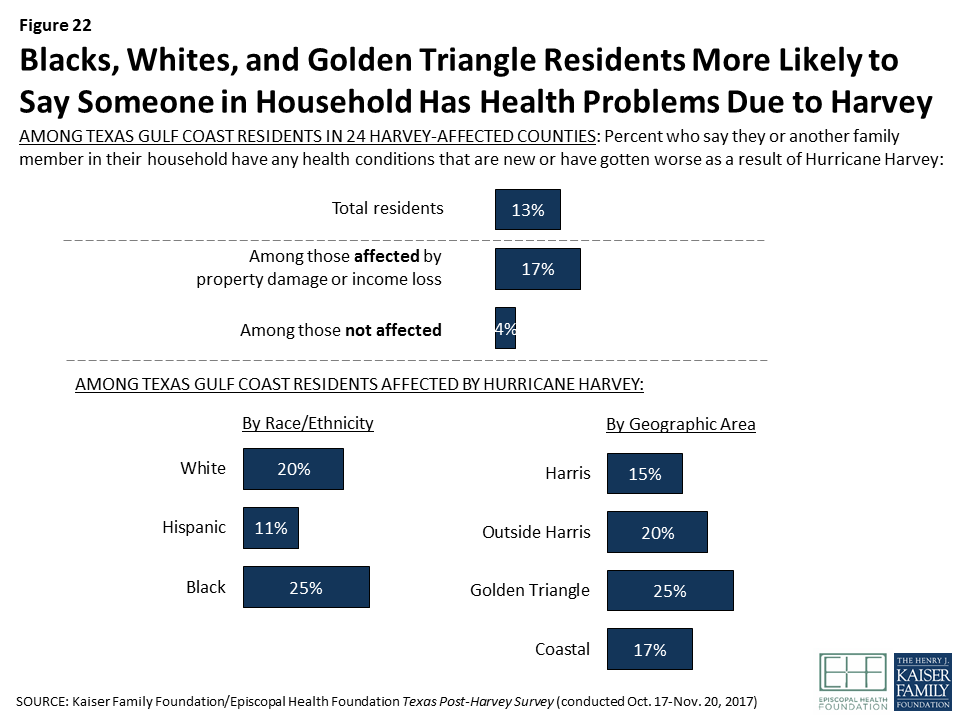
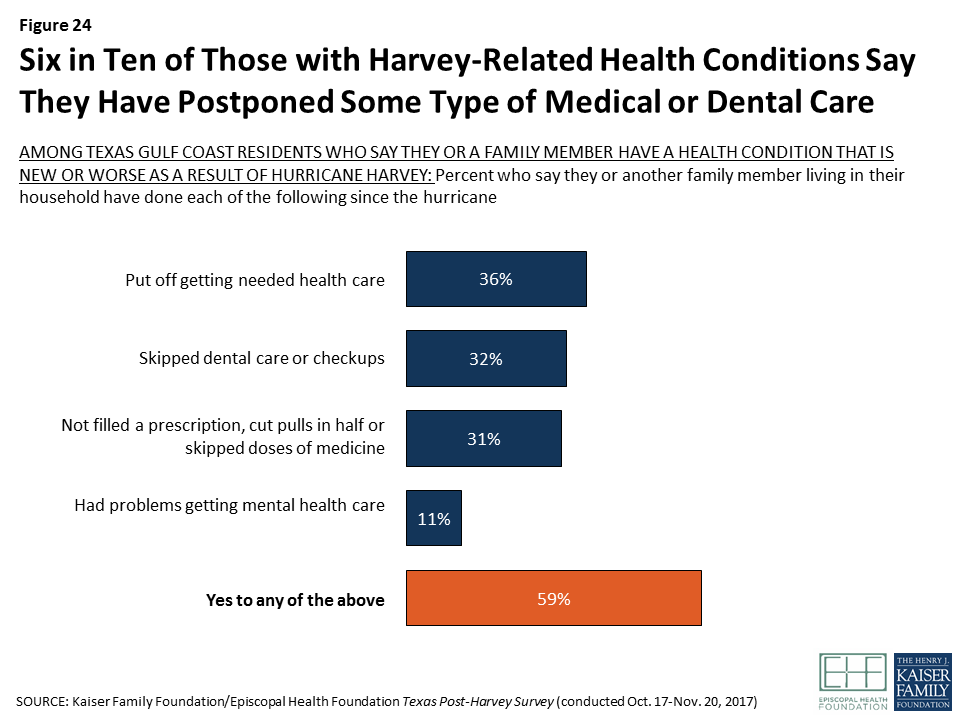
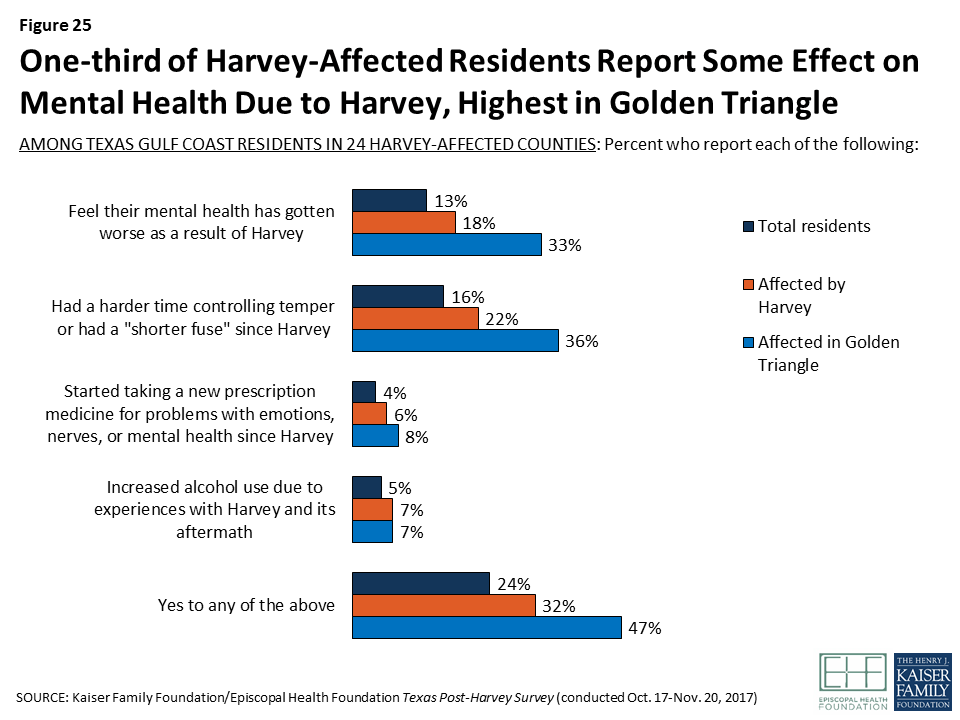
Health and mental health issues affected a smaller share of the population, but some residents report struggling to get needed health care, and focus groups suggest some may have unmet mental health needs. One in six affected residents say someone in their household has a health condition that is new or worse as a result of Harvey, and nearly two in ten feel that their own mental health is worse because of the storm. Among those with a new or worsened health condition, six in ten say they have skipped or postponed needed medical or dental care, cut back on prescriptions, or had problems getting mental health care since the storm.
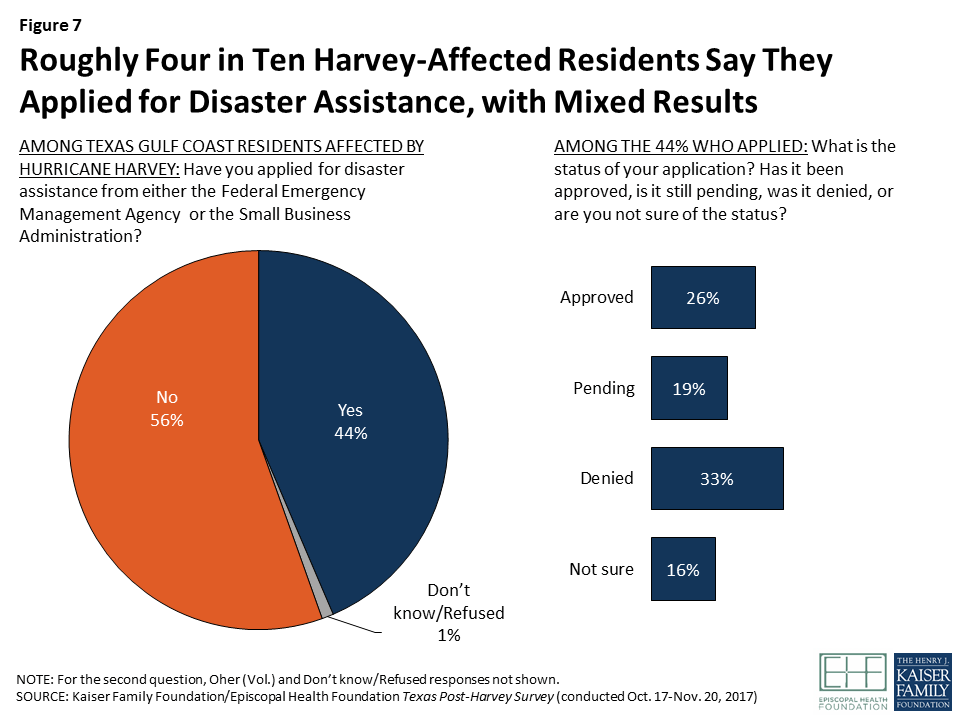
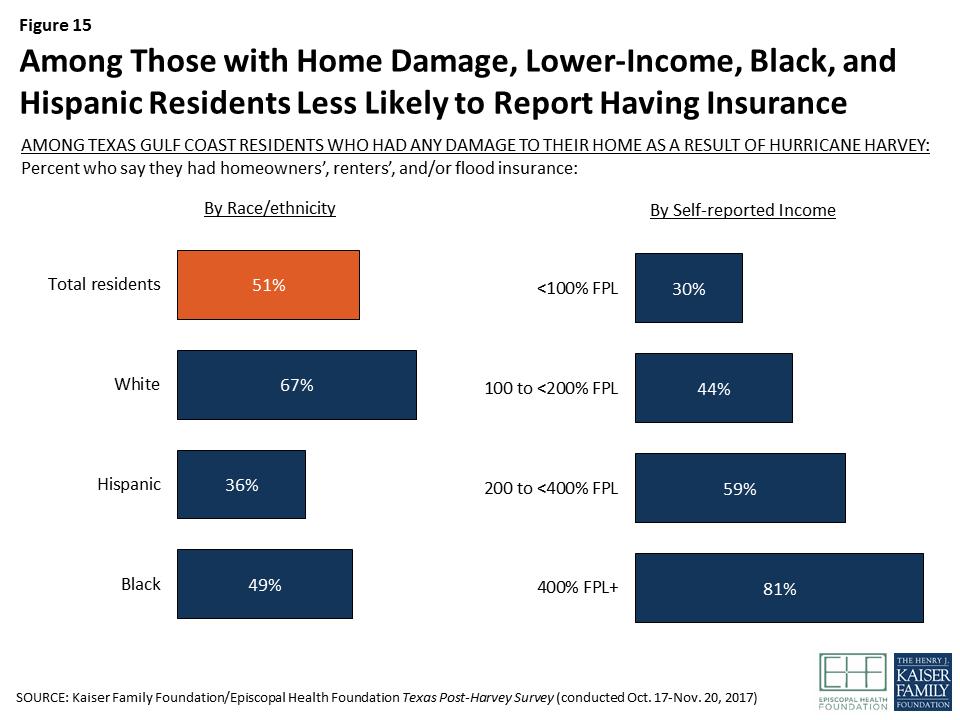
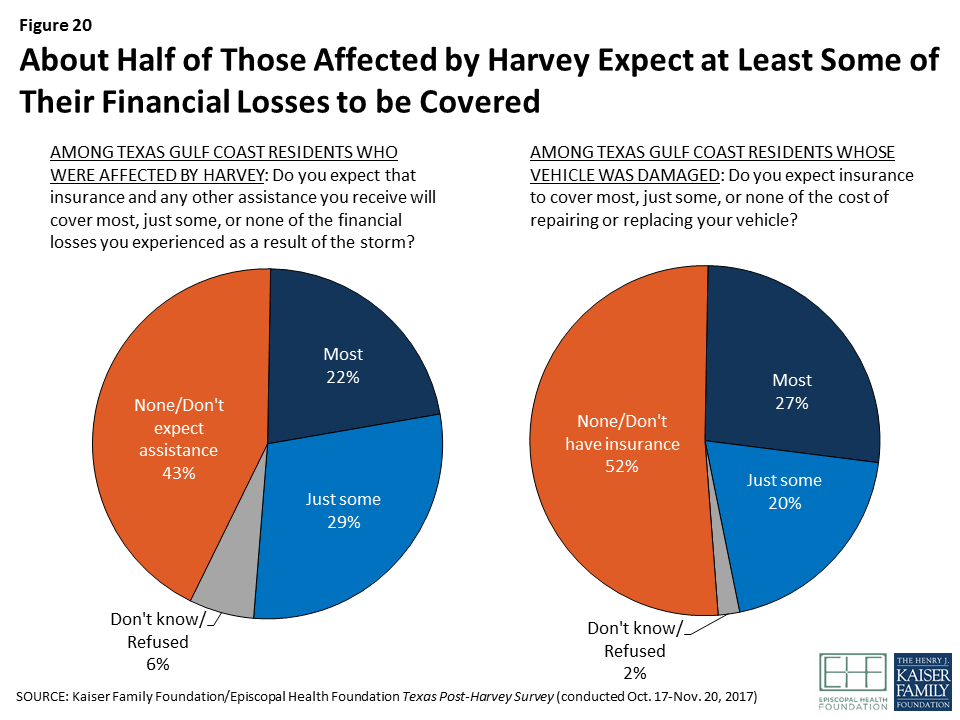
About half of those who have applied for disaster assistance from FEMA or the SBA say their application is still pending or has been denied, and many of those who were denied say they were not told the reason for the denial and were not given information on how to resubmit their application. About a quarter of those whose homes were damaged say they had any flood insurance. Four in ten of those who were affected say they expect none of their financial losses to be covered by insurance or other assistance.
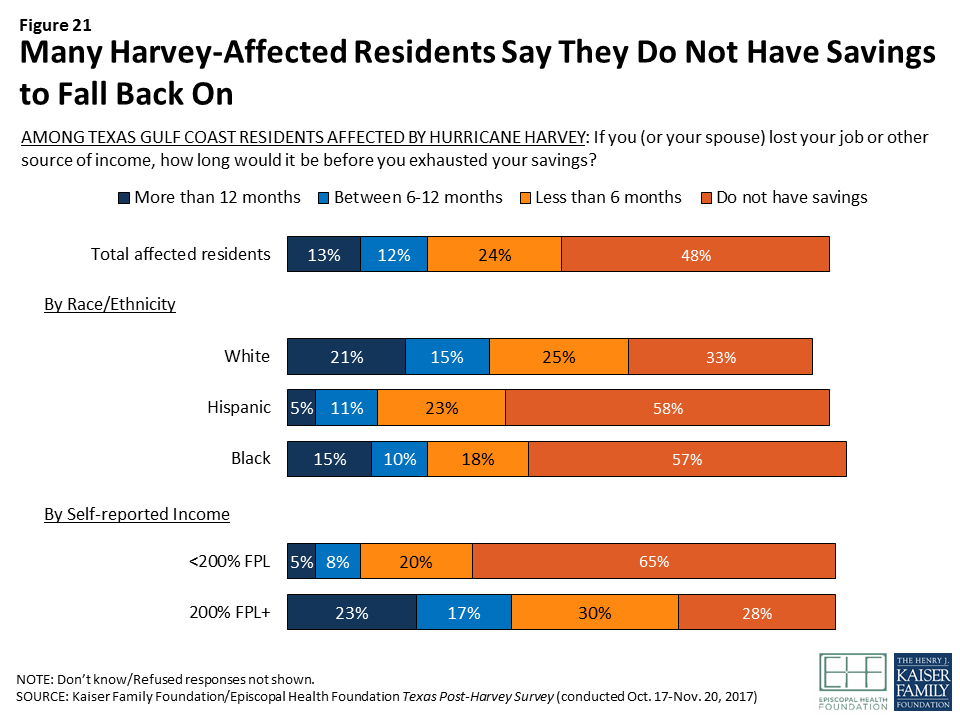
The financial situations of most people affected by Harvey are tenuous. About half of affected residents say they have no savings whatsoever, and another quarter say that if they lost their job or other source of income, their savings would be exhausted in less than 6 months.
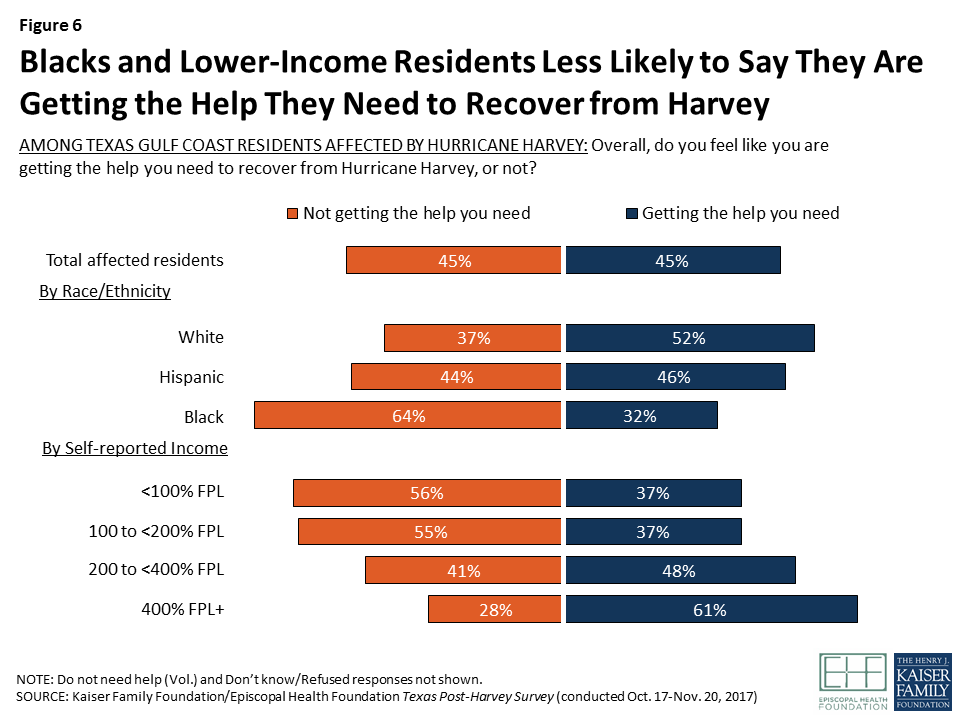
Survey: Three months after Hurricane Harvey, nearly half of affected Texas residents say they are not getting the help they need to recover
Nearly half of affected residents say they are not getting the help they need to recover from the hurricane. Particular areas that stand out where residents say they need more help include applying for disaster assistance and repairing damage to their homes.
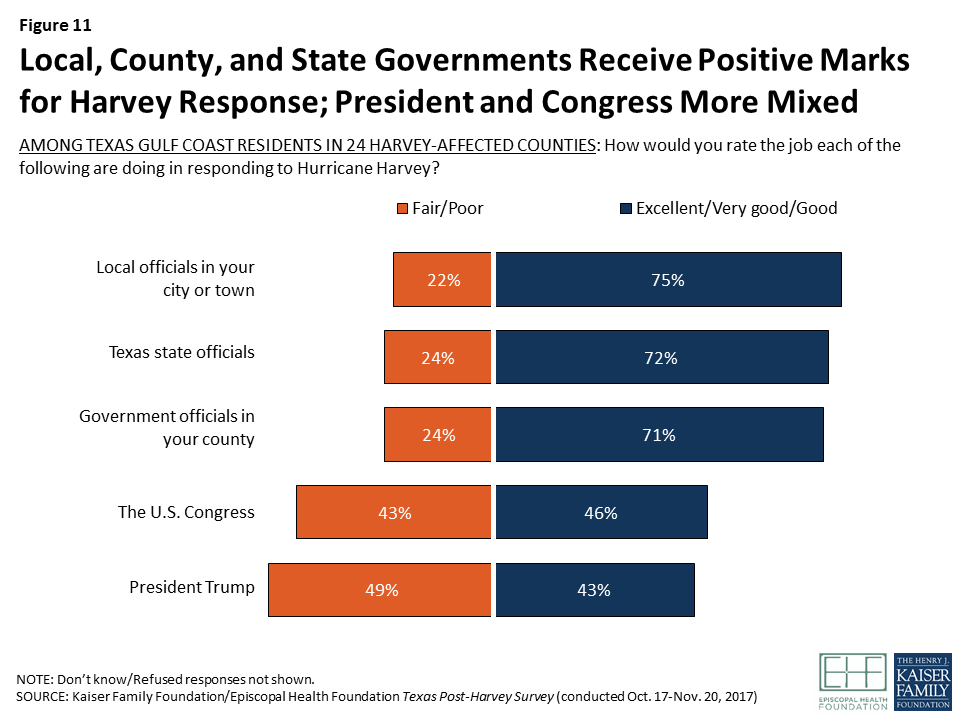
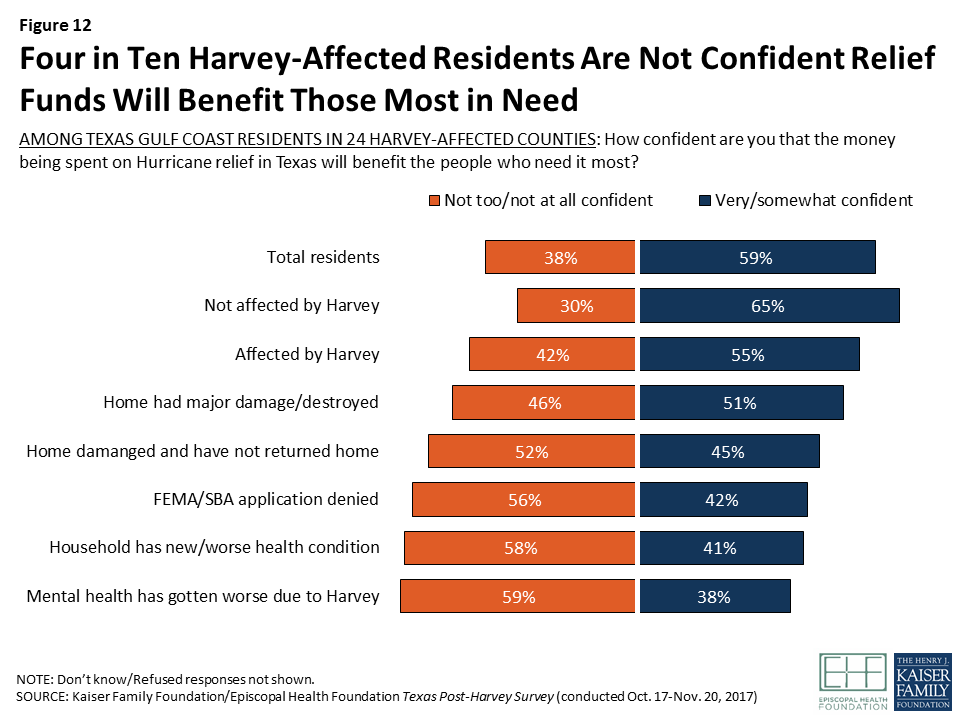
Local, county, and state governments receive high marks from residents for their response to Hurricane Harvey so far. Residents are more mixed in their views of how the U.S. Congress has responded, and responses tilt negative when it comes to President Trump’s response. Four in ten affected residents are not confident relief funds will benefit those most in need.
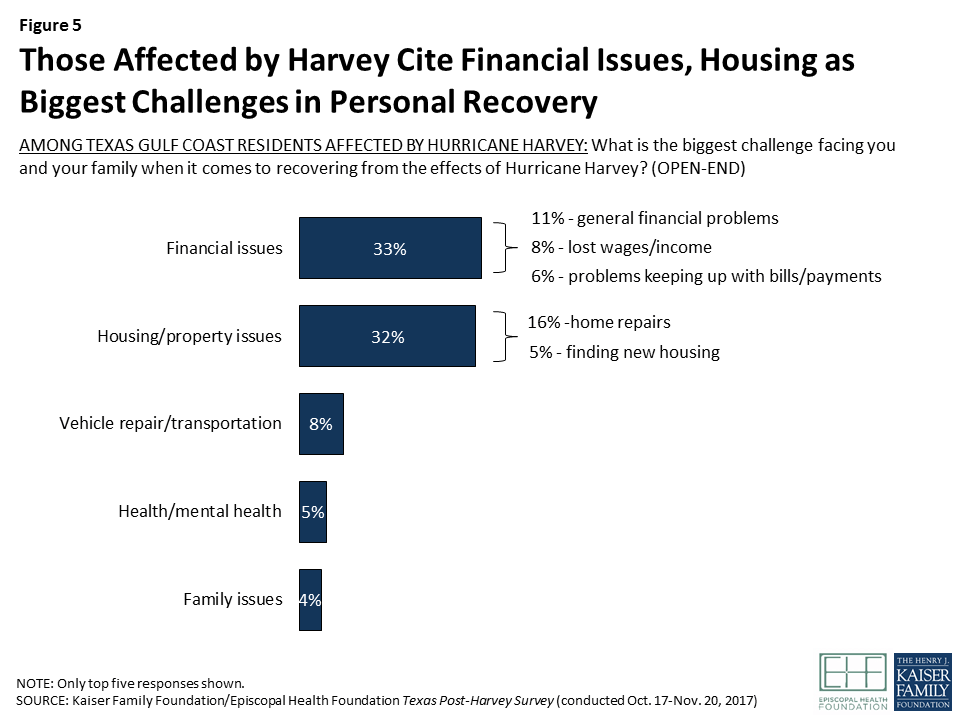
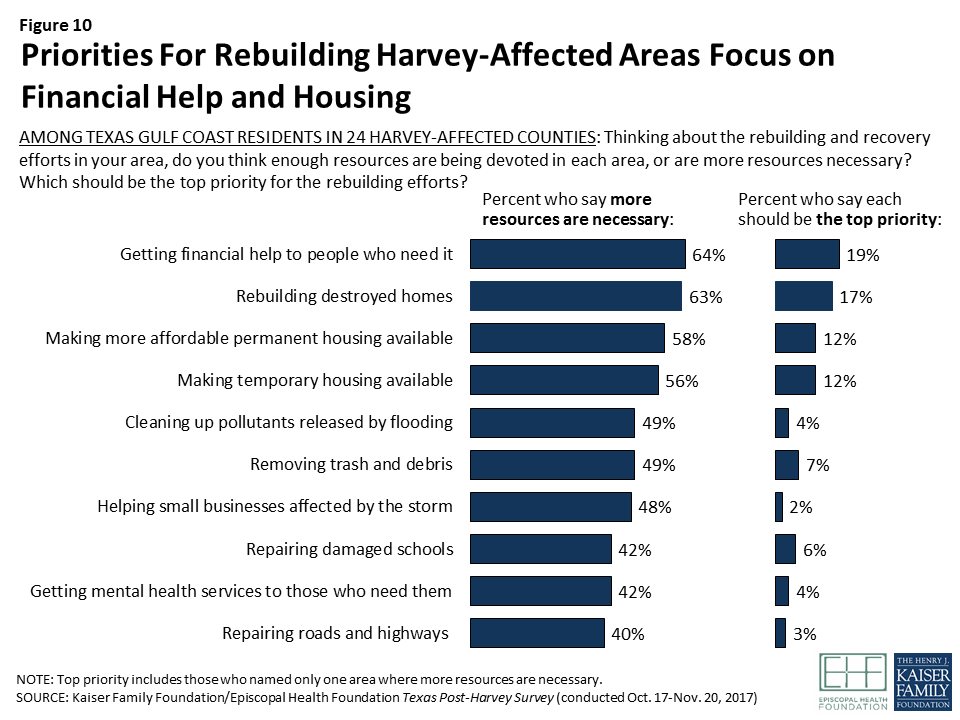
For the community overall, including for affected residents, the top priorities seen for the recovery focus on basic needs, including financial assistance and housing. Top priorities are getting financial assistance to those who need it, rebuilding destroyed homes, and making more affordable permanent and temporary housing available.
Key Findings: Introduction
Hurricane Harvey made landfall as a Category 4 hurricane near Rockport, Texas on August 25, 2017. Three months later, many Texans in the affected areas continue to recover and rebuild their lives and their communities from this unprecedented natural disaster.
With a record 52 inches of rainfall and massive winds in parts of the region, the flooding caused by the storm had widespread and devastating effects. A total of 41 counties in Southeast Texas were designated as federal disaster areas. As of mid-November, 888,866 individual assistance applications had been received by the Federal Emergency Management Agency (FEMA) and $8.73 billion in federal funds had been provided to affected Texans.2 In some of the hardest hit communities, many residents remain displaced from their homes, and finding continued shelter for these individuals is a major public policy concern. The storm also affected more than 1 million students and 220 school districts across the region.
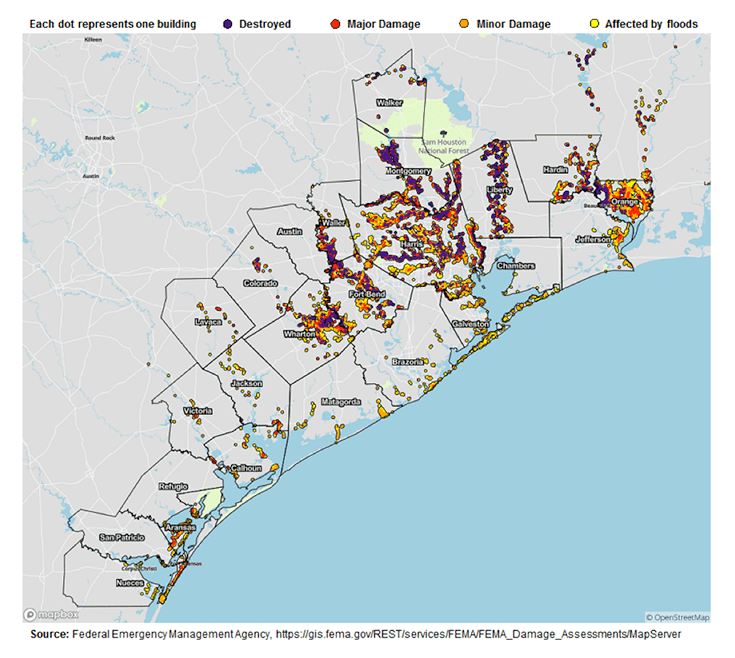
In order to provide policymakers, funders, and others working on the recovery effort with reliable information about how Texas residents were affected by Hurricane Harvey and what their needs and priorities are when it comes to recovery, the Kaiser Family Foundation and the Episcopal Health Foundation partnered to conduct a representative survey of residents in 24 counties along the Texas Gulf Coast that were heavily impacted by property damage from the storm. Both partners worked together to design the survey and analyze the results. The 24 counties were chosen based on a mapping analysis of Harvey property damage developed by FEMA (see Appendix A Figure One), in an effort to examine a contiguous area of counties that suffered the largest share of property damage. The region surveyed divides into four groupings of counties: Harris County (the county where Houston is located and the largest in terms of population); the counties surrounding Harris that are part of the same Regional Council of Governments (“Outside Harris”); the three counties that make up the “Golden Triangle” area east of Houston where the cities of Beaumont, Orange, and Port Arthur are located; and several counties to the southwest of Houston that make up the coastal area including Corpus Christi and Rockport (“Coastal”).3
These 24 counties are home to approximately 7.95 million people, which represents 94 percent of the total population in the 41 counties that were declared as federal disaster areas. This region is incredibly diverse in terms of race and ethnicity (40 percent White, 36 percent Hispanic, 16 percent Black, six percent Asian, and two percent others). On average about 15 percent of the people in the affected region are officially designated as living in poverty, with wide variations in poverty across the counties.4 These counties are also diverse in their population density; eight of the counties we surveyed were designated as rural counties and 16 as urban counties.
The survey was designed to represent the views of residents living in the region overall, and also be able to describe the views and experiences of those living in each of the four regions. In order to represent some of the most vulnerable groups affected by the storm, the survey also included oversamples of lower-income residents, Black and Hispanic residents, and those living in the areas that had the largest amount of property damage as reported by FEMA. Results for the region overall have been weighted to reflect the demographics of the overall population. The survey was fielded from late October through late November, roughly two to three months after Harvey made landfall.
In addition to the survey, the partners conducted five focus groups (three in Houston and two in Beaumont) on October 8 and 9 with lower- and middle-income residents who experienced damage to their homes and/or a loss of income as a result of Hurricane Harvey. The focus group findings highlighted in this report help provide context and add the human story behind some of the quantitative findings from the survey.
Key Findings: Section 1: The Big Picture: Who Was Affected By Harvey And How?
Housing, Property Damage, Employment, and Income Effects
Hurricane Harvey left a trail of physical destruction along the Texas Gulf Coast, and the survey finds that a large share of area residents felt the effects in their own lives. Overall, two-thirds of adults in the 24 Texas Gulf Coast counties surveyed say they were adversely affected by the hurricane, either because their home or vehicle was damaged or because they or a family member in their household experienced the loss of a job, decreased wages, or other lost income.
More specifically, more than four in ten residents (43 percent) report that their home was damaged, including one in five who say their home had major damage (16 percent) or was completely destroyed (3 percent). About one in five (21 percent) also say they owned a vehicle that was damaged or destroyed by Harvey. Nearly half (46 percent) say they or someone in their household experienced employment-related effects of the hurricane, including losing a job or being laid off (12 percent), having hours cut back at work (32 percent), or some other loss of income such as from a small business or unpaid missed days of work (32 percent).
Figure 1: Two-Thirds of Residents in Harvey-Affected Texas Gulf Coast Counties Report Experiencing Property Damage or Income Loss
For more detail on residents’ housing and transportation situation, see Section 4For more detail on residents’ employment and financial situation, see Section 5
The effects of Hurricane Harvey were felt more heavily in some communities than others. Geographically, those in the Golden Triangle (77 percent) and Coastal counties (74 percent) were more likely to report being affected than those in Harris County and the counties that surround it (65 percent and 63 percent, respectively), with differences largely driven by higher rates of property damage. Effects were also distributed unevenly across demographic groups, with Black and Hispanic residents and those with lower incomes more likely to report being affected. For Hispanics, this disparity is largely driven by higher rates of employment- related effects, while for Blacks it is driven both by employment effects and by higher rates of damage to their homes and vehicles. Not surprisingly, those with lower incomes – who are less likely to hold salaried jobs and more likely to work on an hourly or contract basis – are more likely to report adverse effects on employment and income as a result of the storm. However, the income disparity is not limited to employment effects; lower- and middle-income individuals are also more likely to report damage to their homes compared to those with higher incomes.
Figure 2: Share of Texas Gulf Coast Population Affected by Hurricane Harvey Differs by Geography, Race/Ethnicity, and Income
Table 1: Detailed Effects of Hurricane Harvey by Geographic Region, Race/Ethnicity, and Income
Percent who report the following as a result of Hurricane Harvey:
Geographic Region
Race/Ethnicity
Self-reported Income(% of FPL)
Harris County
Outside Harris
Golden Triangle
Coastal
White
Black
Hisp.
<100
100 to <200
200 to <400
400+
Home was damaged (NET)
38%
42%
62%
64%
38%
55%
45%
53%
44%
44%
32%
Major damage/ destroyed
15
22
35
23
21
23
16
22
20
19
17
Minor damage
23
19
26
40
16
32
29
31
24
24
14
Vehicle was damaged
24
15
32
14
16
30
23
25
23
20
18
Someone in household experienced income/job loss
49
40
46
44
31
46
65
59
50
48
29
NET Affected in any of above ways
65
63
77
74
55
73
79
79
65
67
53
Since race and income are correlated, it can be difficult to determine whether the disparities in storm-related effects are driven more by one factor or the other. Our analysis indicates that both race/ethnicity and income play a role, but that some racial and ethnic differences persist regardless of income. For example, Hispanic residents at both higher and lower income levels are more likely than their white counterparts to say someone in their household experienced employment-related disruptions as a result of the storm – specifically having hours cut back at work. Nearly six in ten (58 percent) Hispanics who report incomes below 200 percent of the federal poverty level (FPL) say this happened, compared with three in ten lower-income Blacks (31 percent) and two in ten lower-income whites (19 percent). And for those with self-reported incomes above 200 percent of poverty, Hispanics are almost twice as likely as whites to say a family member had their hours cut back (37 percent versus 20 percent).5
Table 2: Percent Reporting Different Effects from Hurricane Harvey by Race and Income
Percent who report the following as a result of Hurricane Harvey:
Self-reported Income <200% FPL
Self-reported Income 200% FPL or higher
White
Hispanic
Black
White
Hispanic
Home was damaged
46%
48%
59%
35%
42%
Vehicle was damaged
16
25
32*
17
20
Someone in household was laid off or lost a job
14
17
22
5
6
Someone in household had hours cut back at work
19
58*
31*
20
37*
Someone in household had other loss of income
31
45*
37
19
36*
NET Affected in any of above ways
61
82*
74*
53
71*
Note: * indicates statistically significant difference from white residents in the same income category.
Effects on Physical and Mental Health
In addition to the reported effects on people’s finances and living situations, some residents also report problems with their physical and mental health as a result of Hurricane Harvey. Overall, 13 percent of residents in the 24-county area (including 17 percent of those who suffered property damage or income losses and 4 percent of those who did not) say someone in their household has a health condition that is new or has gotten worse as a result of Harvey. Similarly, 13 percent of all residents (including 18 percent of those who suffered property or income losses and 3 percent of those who did not) feel that their own mental health has gotten worse as a result of the hurricane.
Figure 3: Some Residents Report Health Effects From Harvey, Particularly for Those Affected by Property Damage or Income Loss
For more detail on residents’ health care challenges, see Section 6
Key Findings: Section 2: Are Affected Residents Getting The Help They Need?
Residents’ General Level of Recovery
Three months after the storm, residents’ self-reported level of recovery from Hurricane Harvey is somewhat mixed. Among those who were affected by property damage or income loss from the storm, just over half say their lives are largely (25 percent) or almost back to normal (31 percent), while about four in ten say their lives are still somewhat (28 percent) or very disrupted (16 percent). Once again, those living in the Golden Triangle area appear to be the hardest hit, with roughly six in ten affected residents saying their lives are still somewhat (29 percent) or very disrupted (33 percent).
Figure 4: Affected Residents in the Golden Triangle Are More Likely to Say Their Personal Situation Is Still Disrupted After Harvey
When asked to name in their own words the biggest challenge facing their family in recovering from Hurricane Harvey, affected residents focus on basic needs like housing and financial stability. One-third (33 percent) say their biggest challenges are financial, including general financial problems (11 percent), making up lost wages (8 percent), and problems keeping up with bills (6 percent). Another third (32 percent) mention housing-related challenges, including 16 percent who mention home repairs and 5 percent who mention trying to find a new living situation. Eight percent mention transportation issues including the need to repair or replace a vehicle, five percent mention health challenges, including mental health or stress, and four percent name family-related issues.
Figure 5: Those Affected by Harvey Cite Financial Issues, Housing as Biggest Challenges in Personal Recovery
The survey shows there is room for progress in getting needed help to affected residents. Nearly half (45 percent) of those who were affected in terms of property damage or income loss say they are getting the help they need to recover from Hurricane Harvey, while an equal share (45 percent) say they are not. Here, too, progress is uneven, with Black residents and those with lower incomes more likely to say they’re not getting the help they need.
Figure 6: Blacks and Lower-Income Residents Less Likely to Say They Are Getting the Help They Need to Recover from Harvey
Experiences with Disaster Assistance
One major source of help for people affected by natural disasters in the U.S. is disaster assistance provided by the Federal Emergency Management Agency (FEMA) and low-interest loans provided by the U.S. Small Business Administration (SBA). Overall, about four in ten (44 percent) residents who were affected by Hurricane Harvey, including 59 percent of those whose homes were damaged, say they have applied for assistance from FEMA or the SBA. Among those who applied, one quarter (26 percent) say their application has been approved and one-third (33 percent) say it was denied. Another 19 percent say their application is still pending, and 16 percent are not sure of the status.
Among those who applied for assistance from FEMA or the SBA, those who report incomes at least four times FPL (45 percent) and those whose home had major damage or was destroyed (36 percent) are more likely to say their application was approved. In addition, white and Hispanic residents who applied for assistance are more likely than Black residents who applied to say their application was approved (34 percent, 28 percent, and 13 percent, respectively).
Figure 7: Roughly Four in Ten Harvey-Affected Residents Say They Applied for Disaster Assistance, with Mixed Results
Among the 30 percent of those who applied for FEMA or SBA assistance who say their application was denied, four in ten (38 percent) say they were not told why their application was denied, and six in ten (59 percent) say they were not given information on how to revise and resubmit their application.
Figure 8: Many Who Were Denied FEMA Aid Say They Weren’t Told Why, and Most Did Not Receive Information on How to Resubmit
When those who did not apply for FEMA assistance were asked why they did not apply, most (63 percent) said they had only minor damage or did not feel they needed the help. However, some said they lacked information about how to apply (12 percent), they didn’t think they would qualify (8 percent), or they thought it would be too much hassle or too difficult to go through the process (5 percent).
Focus group highlight: Disaster assistance
The focus group discussions indicated that there is a lot of confusion and misinformation among affected residents about the different ways to get assistance. Participants were frustrated by the bureaucracy of applying for help, which they don’t feel they have time for while taking care of their families, trying to find work, and rebuilding their homes (a few participants said it took at least 3 hours of waiting to speak with a live operator on a FEMA call). There was also the perception that FEMA adjusters were temporary hires, not well-trained or familiar with the affected communities, and that your likelihood of getting approved for assistance depended on the particular adjuster who visited your home.
In the Hispanic groups in particular, there was a resistance to taking out loans that they’d be repaying for many years. Many thought that SBA loans would come with high interest rates. Others were frustrated that in order to get an SBA loan you need to have money in the bank and a minimum credit score, which many of them did not have, and some undocumented immigrants mentioned the need to have a social security number to apply. These discussions suggest that people could benefit from navigators to understand the different sources of help (FEMA, SBA, Red Cross and other charities) and to navigate the application and appeals process.
“And then the FEMA lines are, you can’t even get through. Then you have to go through the whole process with FEMA. They may still come out and, just like [indicates another focus group participant], I was denied just like him. Right now, even if I want to try and go through a whole process to even fight with FEMA, I have to go through a whole entire appeal. My roof is still…there’s still big bubbles in the roof.” – 40-year-old Black female, Houston
“They came to my house and they walked [around] my house and saw the damage. And they gave me $364.29. I know people who didn’t have as much damage as I had that got thousands…I think it just all depends on the person that came to your house. The man that came to my house, he was like giving us real serious. He wasn’t caring, he wasn’t compassionate. He was in and out. But I have a friend that had a lady and she was very nice. She came and walked through the house. She was compassionate. She didn’t even have as much damage as I did and she got like $2500.” – 59-year-old Black female, Beaumont
“There’s a certain way you have to answer it [the application for assistance]. If you answer one question [ wrong ], even if you misunderstood or didn’t understand it or comprehend the question, they deny you.” – 29-year-old Hispanic male, Beaumont
“If FEMA was referring us to the Small Business Loan, why do have to have all this credit score and amount of money saved up? We could go through a regular bank.” – 40-year-old Black female, Houston
Areas where Additional Help is Needed
Related to this confusion around accessing FEMA benefits, the most common area in which residents say they need more help is applying for disaster assistance, with 34 percent of affected residents saying they need help in this area. A close second is repairing damaged homes, an area in which 29 percent of affected residents say they need assistance. Some also say they need help finding affordable permanent or temporary housing, finding a job, getting transportation, and accessing medical care and mental health care. For most of these areas, Black residents, those with lower incomes, and those in the Golden Triangle area are more likely than others to say they need more help.
Table 3: Many Affected Residents Say They Need Help in Different Areas
Percent of thoseAFFECTED by Harvey who say they need more help in each area:
Total affected residents
Golden Triangle
Self-reported Income <200% FPL
Black residents
Applying for disaster assistance
34%
47%
43%
55%
Repairing damage to home
29
52
35
38
Finding affordable permanent housing
17
25
23
27
Getting medical care
17
22
26
27
Finding temporary housing
13
24
20
24
Finding a job
13
17
20
19
Getting transportation
10
12
15
23
Getting mental health care
10
13
14
21
When asked about the different types of help they may have received from government agencies, local charities, or other organizations, about a third of affected residents (35 percent) say they’ve gotten help paying for food, including half (51 percent) of those living in the Coastal region and 41 percent living in the Golden Triangle area. Much smaller shares of affected residents say they’ve gotten help paying for housing or utilities (9 percent), paying for health care (7 percent), finding employment (5 percent), or accessing mental health services (5 percent).
Figure 9: A Third of Harvey-Affected Residents Say They’ve Gotten Help Paying for Food, Far Fewer Report Getting Help in Other Are
Key Findings: Section 3: What Do Residents See As The Biggest Priorities For Recovery, And How Do They Rate The Local, State, And Federal Response?
When asked about priorities for rebuilding and recovery in their area, Texas Gulf Coast residents – including those who were affected by the hurricane and those who weren’t – identify many areas where more resources are needed, with the largest focus being on financial help and housing for those in need. The highest-ranking priority overall is getting financial help to people who need it; 64 percent say more resources are necessary in this area and when forced to choose, 19 percent pick it as the top priority. A close second is rebuilding destroyed homes (63 percent say more resources are necessary and 17 percent choose it as the top priority). Ranking third and fourth are making more affordable permanent and temporary housing available, with nearly six in ten saying more resources are necessary and 12 percent choosing each as the top priority. About half also say more resources are needed in cleaning up pollutants released by the flooding (49 percent), removing trash and debris (49 percent), and helping small businesses affected by the storm (48 percent), while about four in ten say the same about repairing damaged schools (42 percent), getting mental health services to those who need them (42 percent), and repairing roads and highways (40 percent). Ranking of priorities is similar when looking at responses only among those who were directly affected by the storm.
Figure 10: Priorities For Rebuilding Harvey-Affected Areas Focus on Financial Help and Housing
Looking at residents overall – including those who were affected by the storm and those who weren’t – most give their local, county, and state governments positive marks for the job they’re doing responding to Hurricane Harvey, with about seven in ten saying each is doing an excellent, very good, or good job. Ratings are more divided when it comes to the U.S. Congress, with 46 percent saying they’re doing at least a good job and 43 percent saying they’re doing a fair or poor job. Ratings are more negative for President Trump, with half (49 percent) saying the president is doing a fair or poor job responding to the hurricane and about four in ten (43 percent) giving him positive ratings.
Figure 11: Local, County, and State Governments Receive Positive Marks for Harvey Response; President and Congress More Mixed
Among those who were directly affected by the storm, views of the government’s response are similar, but tend to lean more negative than among the public overall. In particular, affected residents living in the Golden Triangle area, the counties surrounding Harris County, are more likely than those living in Harris and the Coastal counties to say each level of government is doing a fair or poor job responding to the hurricane. For example, about four in ten residents of the Golden Triangle and the counties surrounding Harris say that government officials in their county are doing a fair or poor job responding to Harvey, compared with about a quarter in Harris County and the Coastal counties. The exception to this pattern is in ratings of President Trump, whom Harris County residents rate more negatively than others.
Table 4: Ratings of Government Response to Harvey Among Those Directly Affected
Percent of thoseAFFECTED by Harvey who say each is doing a “fair” or “poor” job responding to Hurricane Harvey:
Total affected residents
Harris County
Outside Harris
Golden Triangle
Coastal
Local officials in your city or town
25%
22%
31%
35%*
23%
Government officials in your county
28
24
36*
38*
25
Texas state officials
25
24
28
33*
22
The U.S. Congress
44
41
50
49
43
President Trump
53
58*
46
48
46
Note: * indicates statistically significant difference from at least one other region.
Overall, about six in ten residents – including majorities in each of the four geographic areas – say they are very or somewhat confident that the money being spent on hurricane relief in Texas will benefit the people who need it most, while 38 percent say they are not too or not at all confident. However, those who were directly affected by the storm are more likely than those who were not affected to say they are not confident that money spent on relief will reach those who need it most (42 percent versus 30 percent, rising to nearly half – 46 percent – among those whose homes had major damage or were destroyed). Those who remain displaced from their homes (52 percent), those who say their FEMA application was denied (56 percent), those who say they or a family member have a health condition that is new or worse as a result of the storm (58 percent), and those who feel their own mental health is worse (59 percent) are particularly likely to lack confidence that funds will reach the people who need them most.
Figure 12: Four in Ten Harvey-Affected Residents Are Not Confident Relief Funds Will Benefit Those Most in Need
Focus group highlight: Equity in distribution of aid
In each of the five focus groups, when asked about the channels for receiving help after the hurricane, participants raised concerns about some people abusing the system and getting help they don’t need, while others who really need help are going without it. There was some tension in the groups between the need to verify information from people applying for aid to make sure abuse doesn’t happen, and wanting the process to be simpler so people who need help can get it faster.
“I’ve dealt with this in Wisconsin. I’ve dealt with FEMA like on three different occasions. It was nothing near as dramatic as I dealt with here. And I had less problems there than I had here. I just don’t get it. They can pick and choose. Is it cherry-picking? How do they do it? Do they cherry-pick, just like with Red Cross?” – 40-year-old Black female, Houston
“So many millions of dollars – they said that on TV. They don’t know where the money is, where the help is. The economic help. It’s not gonna reach us. It’s gonna reach those who have the money, who have insurance.” – 45-year-old undocumented Hispanic male, Houston
“I know people that came from Louisiana in 2005 after Katrina. They were living large. They were exchanging FEMA checks…and getting stuff they didn’t need.” – 42-year-old Hispanic male, Houston
Key Findings: Section 4: More Details On Housing And Transportation Issues
HOUSING DAMAGE AND DISPLACEMENT
The most visible and catastrophic harm wrought by Hurricane Harvey was the damage – sometimes irreparable – to residents’ homes and living spaces. As noted in Section 1, more than four in ten residents (43 percent) of the 24 counties surveyed say their home was damaged as a result of the hurricane, including 3 percent who say it was completely destroyed, 16 percent who say it suffered major damage requiring more than a month to repair, and 23 percent who say there was minor damage that could be repaired within a month. The numbers are starkest in the Golden Triangle, where 62 percent reported damage, including 35 percent who say their home either had major damage or was destroyed. Reported home damage was also common, but less severe, in the Coastal counties; 64 percent in that area say their home was damaged, with the major portion (40 percent) saying the damage was minor and could be repaired within a month.
Figure 13: Four in Ten Texas Gulf Coast Residents Report Home Damage Due to Harvey, Higher in Golden Triangle and Coastal Area
In addition to these geographic disparities, Black residents and those with lower incomes were also somewhat more likely than their white and higher-income counterparts to report damage to their homes.
Figure 14: Lower-Income and Black Residents More Likely to Report Home Damage Due to Harvey
More than half (55 percent) of those whose homes were damaged by Harvey are homeowners, but 42 percent (including 60 percent of those with self-reported incomes below the federal poverty level) are renters. Renters are more likely than owners to report that the damage to their home was minor (62 percent versus 48 percent), while owners whose homes were damaged are more likely to say the damage was major or that their home was destroyed (50 percent versus 37 percent).
Among those whose homes were damaged, half (48 percent) say they had homeowners’ or renters’ insurance and 23 percent had flood insurance; combined, 51 percent report having at least one type of insurance. Lower-income residents are much less likely to report having insurance; three in ten (30 percent) of those with self-reported incomes below 100 percent FPL whose homes were damaged say they had any. Similarly, Black and Hispanic residents are less likely than whites to report having insurance; among those whose homes were damaged, two-thirds of whites, half of Blacks, and one-third of Hispanics say they had any insurance.
Figure 15: Among Those with Home Damage, Lower-Income, Black, and Hispanic Residents Less Likely to Report Having Insurance
Focus group highlight: Homeowners and flood insurance
Among focus group participants, many homeowners did not have flood insurance and either say they were told they didn’t need it or that they just didn’t think it was worth the cost. Even among those who have purchased flood insurance, many seemed to lack the knowledge and skills (literacy) to navigate the insurance system.
“In my area they tell me, you don’t need flood insurance because you don’t live next to a lake, or you don’t have any water near you. So you don’t need flood insurance, just the hazard insurance in case you have a fire or something. How can you imagine that everything was going to flood like this?” – 58-year-old Hispanic male, Houston
“I’ve been paying for this insurance all this time and I think I got one thing, but I just never went to just actually get a full low-down on what it was. I come to find out…I got this insurance, but the water would have to come through the window.” – 64-year-old Black male, Beaumont
Overall, 37 percent of those living in the 24 Texas counties surveyed, rising to 54 percent in the Golden Triangle area and 68 percent in the Coastal counties, say they evacuated or left their home for some amount of time as a result of Hurricane Harvey. About one in nine residents overall (11 percent), including 24 percent in the Golden Triangle area, were still displaced from their homes at the time of the survey. Among those who have not returned to their pre-Harvey home, half say their housing costs have increased, including 28 percent who say they’ve increased a lot.
Figure 16: One in Ten Residents in Harvey-Affected Counties, Including a Quarter in Golden Triangle, Have Not Returned to Their Homes
Most residents who evacuated temporarily say they feel safe after returning to their homes, however some report that they are living in unsafe conditions. Among those who evacuated and have returned to their homes, 32 percent say they moved back in before they felt it was safe, including 13 percent (rising to 24 percent in the Golden Triangle area) who still felt their home was unsafe at the time of the survey.
Focus group highlight: Living conditions
Most focus group participants who have returned to their homes said they felt safe because they’re more comfortable at home than anywhere else (those who were staying with relatives pointed out how stressful that can be). Still, many reported living in unsafe conditions: one woman with a hole in her roof has to take out buckets each time it rains, another sleeping on the couch in her living room can’t cook in her kitchen because of debris falling from the ceiling. While most renters said their landlords were treating them well overall, a few had complaints about landlords not fixing things and sometimes leaving them living in dangerous situations. Many were also afraid to push back on their landlords for fear that they would have to move out and would have nowhere else to go.
“We’ve got this, like a lot of people, just this open roof, where water…I have two buckets where the water is draining in. And I’ve had quotes come in to fix the roof, and it’s too much. We don’t have thousands of dollars sitting in the bank. I’m living there, but every time it rains I’m like, ‘Okay, get the buckets out.’ I’ve got plastic draped over it. And I’m going through a lot of health issues…I’m not working too well right now. I’m home watching this water drain in, and I’m like, ‘What else is gonna come in through the roof?’ I mean I had a rat come in the house once. I’m scared to death. It’s just an awful way of living.” – 55-year-old white female, Houston
“My landlords, they know I have 3 babies – 8 months, 2 years, and 4 years. I have a sewer problem. I have sewer water that’s underneath about half of my house. When the hurricane hit, I had water raise up, probably about the full 3 feet under the house. And my floors are like bowing now. They’ve been taking my rent money, promising me to come fix stuff. And they just haven’t come… I’m a single mom of three, and I just don’t have – it’s what about $150 to go to court? I know the options I can take…going, taking them to small claims court. In the end, we’d have to move. My closest family is in Austin. I don’t have anybody down here. I don’t wanna be like the other people at the homeless shelter with my babies. Housing’s limited right now.” – 29-year-old white female, Beaumont
“I’m still scrubbing and it’s moldy and it stinks. I tell [my landlords] and they say, ‘You know we have other people, I’ll get to you.’ They do the best they can here and there. – 53-year-old Black female, Houston
“It’s hard staying with relatives though. It’s fine to visit relatives, but when you actually have to stay, it’s not the same.” – 47-year-old Black female, Houston
Vehicle Damage and Transportation Issues
Beyond damage to their homes, many residents report having damage to a vehicle as a result of the hurricane. Overall, 21 percent of residents say they had a vehicle such as a car or truck that was damaged by Harvey, including somewhat larger shares of those living in the Golden Triangle and Harris County compared with other areas, and a larger share of Black residents compared with whites.
Figure 17: Black and Hispanic Residents and Those in Golden Triangle and Harris County More Likely to Report Vehicle Damage
Among those whose vehicle was damaged, about half (51 percent) say they have been able to repair or replace their vehicle, while the other half (47 percent) say they have not. Lower-income adults who experienced vehicle damage are less likely than those with higher incomes to say they’ve been able to repair or replace their vehicle. Among those who have not been able to repair or replace their vehicle, about half (51 percent) say there is convenient public transportation in their area that allows them to get to work or other places they need to go, while the other half (48 percent) say there is not.
Figure 18: Lower-Income Residents with Harvey-Related Vehicle Damage Less Likely to Report Having Vehicle Repaired or Replaced
Key Findings: Section 5: More Details On Employment And Financial Issues
Employment Disruption and Loss of Income
While damage to homes and other property was surely the most visible impact of Hurricane Harvey, interruptions in employment were a common occurrence and caused financial disruptions for many residents, particularly when combined with the cost of repairing damage to their home or repairing or replacing a damaged vehicle. Overall, nearly half (46 percent) of residents say they experienced some type of job or income loss as a result of Harvey, including 12 percent who say they or a family member was laid off or lost a job, 32 percent who say someone in their household had their hours cut back at work, and 32 percent who say they experienced another loss of income, such as from a small business or unpaid missed days of work.
Job and income effects were evenly distributed geographically for the most part, but were much more commonly reported among Hispanic (65 percent) and Black residents (46 percent) compared with whites (31 percent), and among those with lower incomes compared to those with higher incomes.
Figure 19: Hispanic, Black, and Lower-income Residents More Likely to Report Employment-Related Effects from Harvey
On the other hand, some residents report taking on extra work since the hurricane; three in ten residents affected by the storm say that since Harvey, they or another family member in their household has taken on an extra job or worked more hours to make ends meet.
Focus group highlight: Employment disruptions
Focus group participants reported a range of employment disruptions in the wake of Hurricane Harvey. For many, the effects were temporary, while others were still struggling to find work three months after the storm. Many participants were self-employed or contract or hourly workers who lost several weeks of work due to the storm, but had since returned to work. Some reported that they still had less work than they did before Harvey, while others said their work level returned to normal after several weeks. A few who work in construction or home repairs said that after a lull, they now have more work than they did before the storm. On the other hand, a few participants – particularly in the Beaumont groups – reported that they had lost their jobs entirely and were still without work several months after the hurricane.
“I work installing alarm systems. It was touch and go, like everyone said, for about almost a month because I didn’t have places to go to, then the traffic was so bad. We were doing 10% of what we normally do on a day because we couldn’t get around. It was slow because in this industry you start getting clients slowly. You start putting clients on the line, and by the time they’re ready to go, then that’s when you start doing installations…I would say 5-6 weeks before I was really back into it.” – 38-year-old Hispanic male, Houston
“I’m still without a job. My whole job was destroyed. I worked at a library, and they don’t know when it will be open. I’m still looking for a job. I filed for unemployment but it will stop next week. I need to find work before next week.” – 24-year-old Black female, Beaumont
“There is more work now. Absolutely more work. Everybody that works construction, cleaning – a lot of work.” – 58-year-old Hispanic male, Houston
Financial Circumstances of Affected Individuals
While insurance payments and FEMA assistance may be a financial help for some, many residents either don’t have access to these benefits or don’t expect them to cover a major portion of their financial losses. Among all those who were affected by the storm, just one in five (22 percent) expect that insurance and other financial assistance they receive will cover most of the financial losses they experienced. Three in ten (29 percent) say they expect it to cover just some of their losses, and 42 percent say they expect none of their losses to be covered.
Similarly, among those who had a vehicle damaged, half say they expect insurance to cover none of the cost of repairing or replacing their vehicle, while 27 percent expect insurance to cover most of the cost and one in five say it will cover just some. Lower-income adults are much less likely than those with higher incomes to say insurance will cover most of the cost of repairing or replacing a vehicle (19 percent of those who report incomes below 200 percent FPL versus 4o percent of those with higher incomes).
Figure 20: About Half of Those Affected by Harvey Expect at Least Some of Their Financial Losses to be Covered
The financial impacts of Hurricane Harvey have led to serious consequences for some residents who were affected by the storm, particularly among Black and Hispanic residents and those with lower incomes. For example, three in ten (29 percent) affected residents – rising to 36 percent of Hispanics and 40 percent of those who report incomes below the poverty level – say that since Harvey, they have fallen behind in paying their rent or mortgage. One quarter of affected residents, including 37 percent of Black residents, say they have had problems paying for food since the storm. In addition, about four in ten affected residents say that since the hurricane, they have borrowed money from friends or relatives (39 percent), and one in eight (13 percent) say they have borrowed from a payday lender to make ends meet.
Table 5: Financial Problems Reported by Those Affected by Hurricane Harvey
Total residents
Race/Ethnicity
Self-reported Income (% of FPL)
White
Black
Hispanic
<100
100 to <200
200 to <400
400+
Percent of AFFECTED residents who say each has happened since Harvey:
Fallen behind in paying rent or mortgage
29%
18%
31%
36%
40%
29%
32%
8%
Had problems paying for food
25
17
37
25
33
29
24
10
Had utilities turned off because you didn’t pay the bill
10
5
12
14
17
12
7
3
Percent of AFFECTED residents who say they have done the following since Harvey to make ends meet:
Borrowed money from friends or relatives
39
28
55
41
50
47
36
18
Taken on an extra job or worked extra hours
30
28
28
33
30
33
43
19
Borrowed money from a payday lender
13
2
14
20
17
16
13
3
It’s worth noting that the financial circumstances of many of those who were affected by Harvey were tenuous even before the hurricane, and few report having many financial resources to fall back on. About half (48 percent) of affected residents say they have no savings whatsoever, and another quarter (24 percent) say that if they lost their job or other source of income, their savings would be exhausted in less than 6 months. This level of financial instability is much more common among Black and Hispanic residents compared with whites, and among those with lower incomes compared with higher-income individuals.
Figure 21: Many Harvey-Affected Residents Say They Do Not Have Savings to Fall Back On
Focus group highlight: Financial stress
Most focus group participants we spoke with were feeling financially stressed. Many were living paycheck-to-paycheck before Hurricane Harvey hit, and did not have the means to absorb the financial hit of missing several weeks of work because of the storm. They feel behind on their bills and prioritize financial help to allow them to catch up. Some are still struggling to pay for food and basic items like clothing for their children. For many (particularly among Hispanics), there was pride associated with working one’s own way back from a bad situation and not taking “handouts.” Many thought of themselves as entrepreneurs and didn’t want something for free, but would like a boost to help get their business going or to find more work.
“Yes, we’re still catching up. We’re still catching up with our bills. We’re not at where we were at before. And now you’re having to limit a lot… My son wanted a pizza. They’re charging me like $5 for a pizza I pay $1 for at the store…I was trying to save a few bucks that I do have, but for my son of course I’m going to do it for him. I spent that $5 even though we were not going to have enough to eat again for the next couple days.” – 42-year-old Hispanic female, Houston
“The stress we get is because we don’t have the money to fix things, so the help to cope with stress will be economic help actually.” – 37-year-old undocumented Hispanic female, Houston
“[Asked what type of help you need] Financing to help you get through until the insurance money comes. For a lot of people, by the time the insurance money comes you had to take money from so many other places, borrow so much money from family and friends. Some of that money you have to use just to get even on what you got behind on.” – 64-year-old Black male, Beaumont
Key Findings: Section 6: More Details On Health And Mental Health Issues
Health Conditions and Access to Care
Below the surface, and often related to the housing and financial problems they are facing, some residents report problems with their physical and/or mental health as a result of their experiences with Hurricane Harvey. Overall, one in eight residents (13 percent) say they or another family member in their household has a health condition that is new or has gotten worse as a result of the storm. Those who were affected by home damage or income loss are more likely to report a new or worsened health condition (17 percent), but still a small share of those who were not affected (4 percent) report such a condition. Among those who were affected, Black and residents and those living in the Golden Triangle are somewhat more likely to report a decline in the health of someone in their household (25 percent each).
Among those who report that someone in their household has a new or worsened health condition, 38 percent mention a respiratory condition such as asthma, allergies, or cough, and 20 percent mention mental health issues including anxiety, depression, and general stress.
Figure 22: Blacks, Whites, and Golden Triangle Residents More Likely to Say Someone in Household Has Health Problems Due to Harvey
While Hurricane Harvey may have led to new or worsened health problems for some residents, it’s worth noting that many affected residents lacked consistent access to health insurance and health care providers even before the storm. Four in ten (39 percent) of those who were affected by Harvey say that they do not have health insurance. Reported lack of coverage is highest among Hispanic (53 percent) and Black residents (39 percent) affected by the storm, as well as those who report incomes below 200 percent of the poverty level (53 percent).
In addition, three in ten Harvey-affected residents (31 percent) say they have no usual place they go for care when they are sick or need advice about their health, or that their usual source of care is a hospital emergency room. This is highest among affected Black (39 percent) Hispanic residents (38 percent) and those with self-reported incomes below 200 percent of poverty (40 percent).
Figure 23: Minorities and Lower-Income Adults Affected by Harvey More Likely to Lack Health Insurance and Access to Health Providers
Since Hurricane Harvey, some residents report skipping or postponing medical care or having problems paying medical bills, with much higher rates among those who have someone in their household with a new or worse health condition resulting from the storm. For example, 36 percent of those who say someone in their household has a new or worse health condition due to Harvey say that they or another family member has put off or postponed getting needed health care since the storm, 32 percent say a family member has skipped dental care or check-ups, and 31 percent say they have not filled a prescription, cut pills in half, or skipped doses of a medicine. In addition, 10 percent of residents overall, including 26 percent of those with a health problem due to Harvey, say they’ve had problems paying medical bills since the storm.
Figure 24: Six in Ten of Those with Harvey-Related Health Conditions Say They Have Postponed Some Type of Medical or Dental Care
Focus group highlight: Accessing health care
Many participants in the focus groups did not have health insurance, though some who were working have insurance through their jobs and some others in Houston have access to a county health program. Most of the uninsured said insurance was just too expensive and they prefer to deal with health issues as they happen. Many reported relying on home remedies or visiting clinics or urgent care centers when they get sick.
“My insurance just went out, and I know it’s gonna cost me going to the clinic. I’m just kind of calling around trying to figure out what’s going to be the cheapest one. Because even with unemployment, I’m not getting what I was getting when I was working.” – 29-year-old white female, Beaumont
“Whatever your gramma told you to do, that’s the remedy. Ibuprofen for pain and tea for your throat. That’s it. And you save $250 on doctor’s visits.” – 33-year-old undocumented Hispanic female, Houston
Stress and Mental Health Issues
The trauma associated with living through a disaster like Harvey and its aftermath can lead to increased stress and declines in mental health for some people. While most residents of the Texas counties surveyed (64 percent) say their mental health is excellent or very good, those who were affected by Harvey are less likely than those who were not affected to rate their mental health as excellent (35 percent versus 48 percent) and more likely to rate it as fair or poor (17 percent versus 7 percent).
Overall, 13 percent of residents – including 18 percent of those who were affected by property damage or income loss and 3 percent of those who were not affected – feel that their mental health has gotten worse as a result of the storm. Among those who were affected, some also say they have had a harder time controlling their temper or felt they had a shorter fuse since Harvey (22 percent), that they’ve increased their alcohol use (7 percent), or that they’ve started a new medication for mental health problems since Harvey (6 percent).
Mental health needs may be most acute in the Golden Triangle area. Among affected residents, those living in the Golden Triangle are more likely to say their mental health has gotten worse (33 percent) and that they’ve had a harder time controlling their temper since the storm (36 percent).
Figure 25: One-third of Harvey-Affected Residents Report Some Effect on Mental Health Due to Harvey, Highest in Golden Triangle
Access to care is also a problem for some with mental health needs. Fifteen percent of those who say their mental health is worse as a result of the hurricane say they or a family member have had problems getting mental health care since the storm.
In addition to formal mental health services, informal support networks can be a key source of help for individuals coping with the stress of living through a disaster like Hurricane Harvey. The survey finds that few affected residents report having a robust support network of relatives and friends living nearby. Just one in five affected residents (19 percent) say they have “a lot” of people nearby who they can rely on for help or support, with another 17 percent saying they have “a fair amount.” Six in ten say they have “just a few” (47 percent) or no people living nearby who they can rely on (17 percent). Black and Hispanic residents and those with lower incomes are also more likely than others to say they lack a robust support network.
Table 6: Many Affected Residents Say They Lack Nearby Support Networks
Thinking about your personal support network – how many people do you have living nearby who you can rely on for help and support?
Total affected residents
Race/Ethnicity
Self-reported Income(% of FPL)
White
Black
Hispanic
<100
100 to <200
200 to <400
400+
A lot/A fair amount (NET)
36%
48%
26%
31%
25%
25%
42%
57%
A lot
19
29
12
16
13
14
21
34
Fair amount
17
19
14
15
12
12
21
23
Just a few/No people living nearby (NET)
64
52
74
68
75
75
58
42
Just a few
47
39
51
53
55
57
43
32
No people living nearby
17
14
24
15
20
18
14
10
Focus group highlight: Mental health issues
Most focus group participants reported some level of increased stress or mental strain due to the storm. Several said that whenever it starts raining, they have flashbacks or start worrying. Others said the stress comes from the financial problems they face and multiple worries about how they are going to find enough work to get back on their feet financially, while finding time to fix up their house and take care of their families. Some mentioned their children’s stress levels, or the strain of trying to keep things “normal” for their kids while they were personally stressed. To deal with stress, some people said they focus on work, others said they spend time with family, have a few drinks, and fire up the barbecue. Many (particularly in Beaumont) said they turned to prayer.
While acknowledging mental health problems, most participants tended to downplay the importance of seeking professional help and see their ability to address other stressors, especially economic and housing, as key to resolve their mental stress. When asked about whether they sought mental health counseling, most hadn’t considered it, with the exception of one young woman in Beaumont. But many seem to have unmet mental health needs. One young man who was unemployed said, “I really don’t have a way of coping with it, I just live with it,” and another young man sitting next to him said, “You took the words right out of my mouth.”
“Whenever it rains I get very scared that it’s gonna start over.” – 52-year-old Hispanic female, Houston
“I feel stressed out still. Even though it’s over, I still have that stress. You know, thinking that we have to fix that room, that we need another car, my husband has been working only for a week and a half. He needs to switch jobs now because the person he was working with, his home was flooded.” – 37-year-old undocumented Hispanic female, Houston
“My mother is 83 and she is a cancer survivor for over 17 years. Now, she’s going to her sister’s house during the week and then she’ll come stay with me on the weekends… My mom is such a ticker for worrying about being a burden on someone else… Thanksgiving is a major holiday for her. We may have a hundred people at our house… We’ll cook dinner, and we’ll cook for everybody there. And like, ‘Okay, what are we going to do this year?’ She’s always saying, ‘This may be my last year’… Sometimes the weight can be really, really heavy – not just for you but for everybody. Our family’s close. So when something affects one, it’s like a domino effect because it’s gonna affect everybody. But we pull together.” – 53-year-old Black female, Beaumont
“We survived today, and we’re gonna get through tomorrow. I’m not gonna go pay $65 an hour to go talk to somebody about what’s going on.” – 42-year-old Hispanic female, Houston
“I pray, but it’s getting to the point to where it’s starting to affect where like my stress on being able to take care of my kids is overwhelming. They have like MMHR I think, and they have like just the counseling. I’ve been thinking of calling…just because I feel like it’s just overwhelming.” – 29-year-old white female, Beaumont
Key Findings: Section 7: Language And Immigration Issues
Immigrants, particularly those who do not speak English well or do not have legal resident status in the U.S., can be particularly vulnerable to the effects of natural disasters and their aftermath for many reasons, including that they may lack the literacy necessary to navigate the systems in place to help people affected, they may be ineligible for benefits, or they may be hesitant to seek help for fear of exposing their own or a family member’s legal status.
Figure 26: Majority of Likely Undocumented Immigrants Worry About Drawing Attention to Legal Status if They Seek Help
The survey used questions to determine the likely immigration status of respondents by asking those who were born outside the U.S. whether they were a permanent resident (i.e. had a green card) when they came to the U.S. or if their status had been changed to permanent resident since arriving. Overall, 12 percent of residents in the 24-county area, including 27 percent of Hispanics, say they have not been granted permanent resident status, indicating that they are likely to be undocumented immigrants. Of this group, seven in ten (73 percent) were directly affected by Harvey, including two-thirds (68 percent) who experienced a disruption in their employment and three in ten who say their home was damaged.
Among those who are likely to be undocumented immigrants, a majority says they are very worried (39 percent) or somewhat worried (17 percent) that if they try to get help in recovering from the hurricane, they will draw attention to their own immigration status or that of a family member. Even among immigrants who are legal residents, about one in five (21 percent) worry about drawing attention to someone else’s status.
Language issues also presented a barrier for some individuals, regardless of immigration status. Among Hispanics who completed the survey in Spanish (42 percent of all Hispanics), three in ten say it was very or somewhat difficult to find the information they needed in Spanish when trying to get recovery help, while four in ten say it was easy and another quarter say they did not seek help.
Figure 27: Three in Ten Spanish Speakers Say It Was Difficult to Find Information in Spanish When Seeking Help After Harvey
Focus group highlight: Language and immigration issues
Two of the focus groups in Houston were conducted in Spanish, including one with individuals who identified as undocumented immigrants. Most Spanish speakers said that when seeking information or help since the hurricane, they were able to find people to help them in Spanish. However, most also felt that it took longer to get help in Spanish than in English, and that Hispanics were getting less help than others. For those who are undocumented, some said they did not want to seek assistance because they expected to be asked for a social security number, or they feared being reported to immigration. Most turned to informal networks (friends, families, and neighbors) for help rather than official sources.
“They check it [identification] for everything. Even for giving you help, they want your social security. They want to look at your taxes.” – 45-year-old undocumented Hispanic male, Houston
“My sister-in-law, they were gonna cut off her power and the company said to call an organization. First thing they told her is, ‘If you don’t have a Texas ID, we cannot help you.’” –42-year-old undocumented Hispanic female, Houston
“What happens is, as Hispanics in the Hispanic community, we don’t really have a federal program or a government program to help the small businesses like ours. We don’t really have an agency that we can go to.” – 58-year-old Hispanic male, Houston
Key Findings: Conclusion
Overall, the survey and focus group results provide an early snapshot of the biggest challenges facing vulnerable Texas Gulf Coast residents three months after Hurricane Harvey cut its wide swath across the region. With about half of affected individuals saying they are not getting the help they need to recover from the storm, residents prioritize basic needs like repairing damaged homes, help finding temporary and permanent shelter, and financial assistance to help affected individuals get back on their feet. The results also suggest that there is ongoing confusion about the different ways to get financial assistance, and that many affected residents could benefit from navigators or other resources to help with the application process. Finally, these results demonstrate that lower-income individuals, Black and Hispanic residents, and those living in the Golden Triangle area were particularly hard-hit by the effects of Harvey and continue to lag in the recovery, suggesting that organizations focused on recovery should keep a focus on these communities as they move forward from short-term to long-term recovery efforts.
Appendices
Appendix A: Survey and Focus Group Methodology
Survey Methodology
The Kaiser Family Foundation/Episcopal Health Foundation Post-Harvey Survey was conducted by telephone October 17 – November 20, 2017 among a random representative sample of 1,635 adults age 18 and older living in 24 counties along the Texas Gulf Coast. The counties were chosen based on a mapping analysis of Harvey property damage developed by FEMA, in an effort to examine a contiguous area of counties that suffered the largest share of property damage (see Figure 1). The region was further divided into four groupings of counties: 1) Harris County; 2) Counties surrounding Harris (Liberty, Chambers, Galveston, Brazoria, Matagorda, Wharton, Colorado, Austin, Waller, Fort Bend, Montgomery, and Walker counties); 3) Golden Triangle (Jefferson, Hardin, and Orange counties); and 4) Coastal counties (Nueces, San Patricio, Refugio, Aransas, Calhoun, Victoria, Jackson, and Lavaca counties).
Appendix A – Figure 1: Counties included in survey sample based on FEMA damage assessments
Interviews were administered in English and Spanish, combining random samples of both cellular and landline telephones (note: persons without a telephone could not be included in the random selection process). Sampling, data collection, weighting and tabulation were managed by SSRS in close collaboration with Kaiser Family Foundation and Episcopal Health Foundation researchers. Episcopal Health Foundation paid for the costs of the survey fieldwork, and Kaiser Family Foundation contributed the time of its research staff. Both partners worked together to design the survey and analyze the results.
The sampling procedures were designed to reach set numbers of respondents in each of the four county-groups and to oversample particular vulnerable subpopulations who were likely to require assistance in the aftermath of the hurricane, namely: people who experienced property damage as a result of the hurricane, those with household incomes near or under poverty level, Hispanic residents (in particular, non-native Hispanics), and Black residents. Some respondents were reached by oversampling cellular and landline numbers matching directory-listings in areas where data from the Federal Emergency Management Agency (FEMA) indicated large amounts of property damage due to Harvey. The sampling and screening procedures included an oversample component designed to increase the number of low-income respondents, specifically low-income Hispanic and Black respondents. This included 104 respondents who were reached by calling back respondents in the affected areas who had previously completed an interview on the SSRS Omnibus poll and indicated they fit one of the oversample criteria (based on income and race).
The dual frame cellular and landline phone sample was generated by Survey Sampling International (SSI) using random digit dial (RDD) procedures. All respondents were screened to verify that they resided in one of the 24 counties covered by this study at the time Harvey hit Texas. For the landline sample, respondents were selected by asking for the youngest adult male or female currently at home based on a random rotation. If no one of that gender was available, interviewers asked to speak with the youngest adult of the opposite gender. For the cell phone sample, interviews were conducted with the adult who answered the phone.
A multi-stage weighting design was applied to ensure an accurate representation of the population of each county-group. The first stage of weighting involved corrections for sample design, including accounting for oversampling of the most-affected areas, as well as non-response for the callback sample. In the second weighting stage, demographic adjustments were applied to account for systematic non-response along known population parameters, within each county-group. Population parameters included gender, age, race, Hispanic origin (broken down by nativity), educational attainment, and phone status (cell phone only or reachable by landline). This stage excluded the low-income oversample component. Based on this second stage of weighting, estimates were derived for the share of low-income respondents (Black, Hispanic and other) in the population. The third stage of weighting included all respondents in each county-group and included income-status (low or high) by race/ethnicity based on the previous stage’s outcomes. In the last stage each county-group was weighted to accurately represent its adult-population share within the 24-county region. Weighting parameters were provided by SSI based on estimates from the U.S. Census Bureau’s 2016 American Community Survey (ACS) for Harris County and 5-year (2011-2015) cumulative data from the ACS for other county groups.
The margin of sampling error, including the design effect for the full sample, is plus or minus 3 percentage points. Numbers of respondents and margins of sampling error for key subgroups are shown in the table below. For results based on other subgroups, the margin of sampling error may be higher. Sample sizes and margins of sampling error for other subgroups are available by request. Note that sampling error is only one of many potential sources of error in this or any other public opinion poll. Kaiser Family Foundation public opinion and survey research is a charter member of the Transparency Initiative of the American Association for Public Opinion Research.
Group
N (unweighted)
Margin of sampling error
Total residents
1,635
+/-3 percentage points
Harris
714
+/-5 percentage points
Outside Harris
310
+/-7 percentage points
Golden Triangle
305
+/-7 percentage points
Coastal
306
+/-6 percentage points
Affected by Harvey
1,113
+/-4 percentage points
Harris
461
+/-6 percentage points
Outside Harris
186
+/-9 percentage points
Golden Triangle
239
+/-8 percentage points
Coastal
227
+/-8 percentage points
Focus Group Methodology
As part of this project, the Kaiser Family Foundation and the Episcopal Health Foundation conducted focus groups to gather qualitative data from vulnerable populations affected by Hurricane Harvey. Topics covered in the focus groups were similar to those covered in the survey. The groups were held in Houston on November 8-9, 2017 and Beaumont on November 9, 2017. In total, five two-hour groups were conducted with eight participants each.
To qualify for each group, individuals must have said: 1) that their total family income from all sources in 2016, before taxes, was less than $60,000; and 2) that they experienced damage to their home or vehicle or lost job-related income as a result of Hurricane Harvey, and that the loss was at least a minor problem for them and their family. In addition, participants in each session were recruited with several additional aims: That at least half said their loss of income or property was a major problem for them and their family, and at least half said they their home had major damage or was destroyed. Recruitment also aimed to target a mix of owners and renters.
In Houston, two groups were conducted with Hispanics in Spanish – one of which consisted of participants who self-identified as undocumented immigrants. A third Houston group, consisting of mixed races/ethnicities, was conducted in English. In Beaumont, two groups were conducted in English, one with Black residents and the other with participants of mixed races/ethnicities. Participants in four of the groups were given an incentive of $100, and participants in one Houston group were given $125 since the group was conducted in the morning, a more difficult time to recruit for.
ConneXion Research recruited and provided moderator services for each group. The Houston groups were held at ConneXion’s research facility, and the Beaumont groups were held at a health service organization. The screener questionnaire and discussion guide was developed by researchers at the Kaiser Family Foundation and the Episcopal Health Foundation. Groups were audio and video recorded with participants’ permission. Focus group costs were paid for by the Episcopal Health Foundation.
Appendix B: Additional Resources
In Episcopal Health Foundation’s (EHF) initial effort to study the scope of property damage caused by Harvey, staff created a user-friendly, interactive map by using a geographic information system (GIS) mapping file from the FEMA website. The analysis was conducted using parcel data on buildings and homes, as well as flood inundation data showing the depth of water levels in different areas. EHF staff also overlaid the CDC-developed social vulnerability index data on these maps, identifying communities in need of additional support to prepare or recover from a disaster. Staff further identified and analyzed FEMA application data at the zip code level across the 41 counties, showing tremendous diversity of needs in the region.
The counties included in each cluster are: Cluster One: Harris County; Cluster Two (Surrounding Harris): Liberty, Chambers, Galveston, Brazoria, Matagorda, Wharton, Colorado, Austin, Waller, Fort Bend, Montgomery, and Walker counties; Cluster Three (Golden Triangle): Orange, Jefferson and Hardin; and Cluster Four (Coastal): Nueces, San Patricio, Refugio, Aransas, Calhoun, Victoria, Jackson, and Lavaca counties. ↩︎
Analysis of U.S. Census Bureau American Community Survey data. ↩︎
There were not enough higher-income Black residents in the sample to analyze. ↩︎
Survey: Three Months after Hurricane Harvey, Nearly Half of Affected Texas Residents Say They are Not Getting the Help They Need to Recover
Residents’ Top Priorities for Rebuilding Focus on Financial Help and Housing; Most Give Local and State Governments Good Marks for Response, But Lower for Federal Officials
KFF/EHF Survey Examines Residents’ Experiences and Views in 24 Hard-Hit Counties across Texas
Two-thirds (66%) of residents across 24 Texas counties report that they suffered property damage, employment disruptions and/or lost income due to Hurricane Harvey, finds a new Kaiser Family Foundation/Episcopal Health Foundation survey. One in nine residents in these hardest-hit counties remain displaced from their homes three months after the storm.
The survey also finds nearly half (45%) of those who suffered losses across the region say they are not getting the help they need to recover, and four in 10 (42%) say they are not confident that relief funds will reach those most in need.
While Harris County and the entire region suffered major damage, the survey results show that the storm disproportionately affected Black and Hispanic residents, low-income residents and people living in both the “Golden Triangle” area, which includes Beaumont, Orange, and Port Arthur, and in the “Coastal” area including Rockport and Corpus Christi.
The new KFF/EHF partnership survey probes deeply into the experiences and views of residents in Houston, Harris County and the many other Texas communities hit hardest by the storm and its aftermath. The partners also conducted five focus groups in Houston and Beaumont as part of the project, which aims to provide leaders working on relief efforts with reliable information about Texas residents’ needs and priorities for ongoing recovery.
“The conventional wisdom that Texans hit by Hurricane Harvey have recovered is wrong,” said Drew Altman, president and CEO of the Kaiser Family Foundation. “The people in the hardest-hit areas are telling us that they still face major hurdles before their lives return to normal.”
“We want government and other recovery funds to use this information to make good decisions about how to reach those most in need,” said Elena Marks, president and CEO of the Episcopal Health Foundation. “This survey gives an important voice to hard-hit communities that may have been forgotten, especially those with the greatest needs and fewest resources following the storm.”
Across the Region, Most Residents Report Suffering Property Damage or Lost Income
The survey provides an extensive look at the breadth of the storm damage to residents’ property and incomes. For example:
More than four in ten (43%) report that their home was damaged, including about one in five who say their home either suffered major damage (16%) or was completed destroyed (3%). In the Golden Triangle and Coastal areas, about six in ten report damage to their home.
Among those whose homes were damaged, about half (48%) say they had homeowners’ or renters’ insurance, and roughly a quarter (23%) had flood insurance. Lower-income residents, Blacks and Hispanics were all less likely to report having any type of insurance.
Nearly half (46%) say they or someone else in their household lost job-related income as a result of the storm, such as getting fewer hours at work (32%), losing a job entirely (12%) or losing income from a small business or unpaid missed days (32%). These income disruptions affected a greater share of Hispanic (65%) and Black (46%) residents compared to White residents (31%).
One in five (21%) say they had a car or other vehicle that was damaged or destroyed.
Four in 10 (43%) affected residents say they do not expect any of their financial losses to be covered by insurance or other assistance.
Residents’ Top Priorities for Relief: Financial Help and Housing
When asked about priorities for rebuilding and recovery in their area, getting financial help to people who need it tops residents’ lists: nearly two-thirds (64%) say more resources are necessary in this area. A close second is rebuilding destroyed homes (63%), followed by making more affordable permanent housing (58%) and temporary (56%) housing available. These priorities also top the list among those residents who lost property or income due to the storm.
The large share who want more efforts to get financial help to people in need may reflect the community’s mixed success in navigating federal aid programs. Overall about four in 10 (42%) of affected residents say they applied for financial assistance from the Federal Emergency Management Agency (FEMA) or the Small Business Administration (SBA).
Among those who applied, one quarter (26%) say their application was approved and one-third (33%) say it was denied. The remainder say it is still pending (19%) or they are not sure (16%). Among those who were denied, four in 10 (38%) say they were not given a reason, and six in 10 (60%) say they were not given information on how to revise and resubmit their application.
Perhaps not surprisingly, affected residents say that help applying for disaster assistance topped their personal needs – with a third (34%) saying they needed more help in this area. A close second is repairing damaged homes, named by 29 percent of affected residents.
Hurricane Harvey’s financial effects have led to serious hardships for many affected residents. For example, three in ten (29%) of all affected residents report that they or a household member have fallen behind in their rent or mortgage payments since the storm. The shares are largest among Hispanic (36%) and Black residents (31%) and those with self-reported incomes below the federal poverty level (40%).
These financial difficulties reflect that many affected residents have limited financial resources – with nearly half (48%) saying they have no savings at all, and another quarter (24%) saying they would use up their savings within six months if they lost their job or other sources of income.
Some Face New Mental and Physical Health Challenges and Difficulties Affording Care
The storm and its aftermath also are taking a toll on people’s mental and physical health. Overall, 13 percent of residents say someone in their household has a new or worsening health condition due to the hurricane, rising to 17 percent among those who suffered property or income losses.
Many confronting these emerging health problems are struggling to afford and obtain care. About six in 10 (59%) say they have skipped or postponed needed medical or dental care, cut back on prescriptions or had difficulty getting mental health care since the storm.
In addition, 13 percent of residents overall, including 18 percent of those affected by property or income loss, say their mental health has gotten worse as a result of Harvey.
Some affected residents also say they have had a harder time controlling their temper or felt they had a shorter fuse since Harvey (22%), that they have increased their alcohol use (7%), or that they’ve started a new medication for mental health problems since Harvey (6%).
Mental health needs appear most acute in the Golden Triangle area. Among affected residents, those living in the Golden Triangle are more likely to say their mental health has gotten worse (33%) and that they’ve had a harder time controlling their temper since the storm (36%).
Residents Rate Local and State Response Positively, But are Mixed on Federal Officials
Most residents give their local, county, and state governments positive marks for the job they are doing responding to Hurricane Harvey. About seven in 10 say each is doing an excellent, very good, or good job.
Ratings are less positive for federal authorities. Similar shares say that Congress is doing at least a good job (46%) as say it is doing a fair or poor job (43%). Ratings for President Trump are lower still, with about half (49%) saying he is doing a fair or poor job and about four in 10 (43%) saying he is doing at least a good job.
METHODOLOGY
Designed and analyzed by researchers at the Kaiser Family Foundation and the Episcopal Health Foundation, the Texas Post-Harvey Survey was conducted by landline and cellular telephone October 17 – November 20, 2017 among a random sample of 1,635 adults ages 18 and older living in 24 Texas counties that suffered large amounts of property damage from Hurricane Harvey according to FEMA reports. The region was further divided into four groupings of counties: Harris County (N=714), Counties surrounding Harris (N=310), Golden Triangle (N=305), and Coastal counties (N=306). See report for a full list of counties. The margin of sampling error including the design effect for the full sample is plus or minus 3 percentage points. For results based on other subgroups, the margin of sampling error may be higher.
Filling the need for trusted information on national health issues, the Kaiser Family Foundation is a nonprofit organization based in Menlo Park, California.
The Episcopal Health Foundation (EHF) believes all Texans deserve to be healthy. EHF is committed to transforming the health of our communities by going beyond just the doctor’s office. By providing millions of dollars in grants, working with congregations and community partners, and providing important research, we’re supporting solutions that address the underlying causes of poor health. EHF was established in 2013 and is based in Houston. With more than $1.2 billion in estimated assets, the Foundation operates as a supporting organization of the Episcopal Diocese of Texas and works across 57 Texas counties. #HealthNotJustHealthcare
The Affordable Care Act (ACA) requires healthcare marketplaces to establish “Navigator” programs to assist individuals with outreach, education, and enrollment in insurance coverage. For states using the federal marketplace (currently 34) the Centers for Medicare and Medicaid Services (CMS) provides navigator funding and manages the program. However, recent funding cuts to the program have meant that grantees have had to assess and, in some cases curb, the services they provide.1 We examined the potential impact of these funding cuts on people with HIV, a population that has experienced significant gains in insurance coverage under the ACA, with, in many cases, the help of navigators. Several of the federal navigator grantees were AIDS Service Organizations (ASOs) and/or organizations that identified people with HIV as a population they would specifically work with. This issue brief analyzes funding data and findings from stakeholder interviews with these navigator grantees to assess their role in serving people with HIV as well as the potential impact of cuts going forward.
Background
Federally funded navigator organizations are currently operating under a three-year grant, 2015-2017. While earlier this year, CMS announced that $60 million would be available for the third and final year of navigator funding, an amount comparable to each of the first two years under the grant, it later released awards amounting to a $26 million or 41% cut, with several organizations losing funding altogether. CMS explained that year three funding would be “based on [grantee] ability to meet their enrollment goals during the previous year” but did not detail the specific metrics to be used to calculate the award.2 A recent Kaiser Family Foundation report found that in many cases services offered by navigator programs will be disrupted, including by cutting services to certain populations and geographic regions and curtailing the types of assistance they provide. They also found that as confusion around the continuation of the ACA “coupled with a shortened open enrollment period, increases demand for the consumer education and in-person enrollment assistance Navigators provide. At a time when more help may be needed, the funding reductions are likely to reduce the level of in-person help available to consumers during this fall’s open enrollment and throughout the 2018 coverage year.”
We sought to examine the impact of proposed cuts on people with HIV and the organizations that serve them. People with HIV face unique medical needs and vulnerabilities, and were more likely to be uninsured prior to the ACA compared to the population overall.3 As such, the availability of enrollment assistance was particularly important for this population. Aware of this, some navigator groups specifically identified people with HIV as a target population for assistance under their grant (11 out of 103, or 11%). To assess the impact of navigator funding cuts on these entities, we analyzed changes in funding levels and conducted interviews with key stakeholders.
Methods
We examined the CMS notification of 2016 navigator grant awards, which included grant application summaries, to identify organizations that specifically targeted their enrollment assistance to people with HIV either directly or indirectly through sub-grantees.4 We included grantees in the following three categories:
Grantees that are AIDS Service Organizations (ASO);
Grantees that identified an AIDS Service Organization as a sub-grantee; and/or
Grantees that specifically identified serving people with HIV as a target population
Using this 3 pronged test, we identified 11 “HIV navigator entities” out of 103 grantees overall (11%). Based on funding data released by a third party, we examined changes in their 2017 awards, compared to 2016.5 In addition, we conducted interviews with representatives at 11 navigator organizations, including both named grantees and sub-grantees. Most of the 11 were primary grantees (9); the remaining 2 were sub-grantees. Organizations represented all regions of the U.S., except for the Northeast but were most likely to be located in the South . All participants were asked to discuss: why they decided to include people with HIV as a target population (and for ASOs, why they sought a navigator grant); the role that navigators played for people with HIV; their reaction to the cuts; the impact the cut would likely have on their organization; and the impact the cut would likely have on people with HIV. Interviews were conducted in September and October 2017.
Findings
HIV Navigator Profiles and Funding
In 2016, the 11 HIV navigator entities received $15,889,012 overall, ranging from $489,170 to $5,813,294 (a similar amount as 2015). In 2017, their funding was cut by 42% overall to $9,244,768, a comparable percentage cut to that experienced by other navigators.6 Cuts ranged from just over $1,000 to more than $1 million and the percentage of the cut ranged from less than 1% to over 90% compared to the previous year. None lost all of their funding.
Several of the grantee organizations interviewed for this report were AIDS Service Organizations (ASOs) (4 of 11), organizations specifically dedicated to serving people with HIV and each existed prior to the ACA. Many were well situated to begin enrollment work as they were already working as case managers or collaborating with HIV clinics to provide similar services. In addition to the ASOs, 7 other organizations elected to include people with HIV as one of the target population for their grant or identified an ASO as a sub-grantee.
Decision to Focus Navigator Work on People with HIV
Navigator organizations had a range of reasons for seeking out the grant. Participants discussed the importance of having navigators familiar with the needs of HIV positive people. They discussed the value in having special expertise when it came to health plans, their ability to develop lasting relationships with consumers, and foster connections with Ryan White HIV/AIDS Program entities and other community organizations serving people with HIV.
ASOs were motivated to apply for navigator grants to engage their existing and vulnerable client population of people with HIV. They spoke of taking advantage of the opportunities presented by the ACA for their clients.
Once the ACA took away the ban on getting insurance if you have preexisting conditions it was an amazing route forward for our clients living with HIV who previously…[be]cause they had a preexisting condition we would have a really hard time getting them into a comprehensive health insurance plan. Once that ban was lifted, we had new opportunities to get our clients with HIV health insurance.
They were particularly interested in helping those who had limited experience with insurance in the past and saw themselves as being able to provide both insurance education and enrollment assistance to their clients. One ASO navigator indicated, for example, that they applied for the grant because leading up to the ACA they had already had “a statewide network of trusted partners” and knew that that these “trusted entities within communities” would be where consumers would turn to become educated on the ACA. They believed that they were well situated to provide the leadership needed to bring these groups together under a statewide navigator grant. Finally, ASO navigators also mentioned the value that an additional funding stream would bring to their organization, in supporting their ability to serve people with HIV.
Non-ASO navigators identifying people with HIV as a target population did so because of their perceived need to assist this population. One navigator entity is a health association with a health center partner working near an area hard hit by the opioid epidemic. Due to the relationship with that health center and a desire to reach individuals affected by the opioid epidemic at higher risk for HIV, they included people with HIV as a target group. Other organizations sought to include the most vulnerable members of their community as target populations and believed people with HIV to be such a group. One organization, for example, stated that they included people with HIV in their grant because the Obama Administration had emphasized reaching underserved populations and they believed this group met that criteria. Some participants talked about wanting to leverage existing relationships with AIDS Service Organizations under the grant. One group traditionally focused on another health condition predominately serving the African American community, said while it has not been the focus of their work, they made efforts to address the needs of HIV positive people in the past. They included people with HIV in the grant, and in their past work, because they believe addressing healthcare access needs of this population fits in with their overall mission to address health disparities within the black community.
Stakeholders cited the value in enrolling consumers at a place where they were already receiving services and feared that reducing HIV specific navigator assistance would add to confusion around enrollment. HIV navigators saw themselves as providing a consistent place to go for trusted information year after year. Those that lost or shrunk their capacity to offer this service were worried that even if they referred clients to other enrollment sites, they might not go. Navigators found that consumers were more comfortable engaging in settings that were familiar and believed that this facilitated a smoother enrollment process.
[Navigators with HIV expertise] know the questions to ask, they know the plans that will cover the services that they need, they have personal relationships with the case managers that are assisting these consumers. It is a huge value. Personalized service. You aren’t just someone who walks in from the street. You have a name and you are connected to someone that knows a little bit about you.
One navigator also believed the convenience factor associated with enrolling in coverage at an ASO where consumers were already receiving services lead to their enrollment success.
I think it is just a natural thing that they can be more honest and we were trusted and it was easy, if you are already there for a case management appointment, why not go ahead and try to get health insurance.
Another organization had their navigators attend sensitivity training to help ensure that when staff met with people with HIV, or any other condition, they created a welcoming environment. They did various role-playing with their staff including addressing concerns of enrollees with different health conditions. They made an effort to explore the “various issues individuals may come in with so [staff could] work to address their own prejudices” in advance. This navigator was concerned that others navigator entities would not approach working with diverse community members with the same degree of sensitivity.
On the other hand, ASOs also mentioned that they did have to work around the stigma that HIV-negative enrollees unfamiliar with HIV clinical or support settings might feel in seeking enrollment services. Some worried that individuals might not want to seek enrollment assistance within a known HIV services location. To address this ASO grantees and sub-grantees often offered enrollments outside of their own settings and rebranded parts of their facilities.
Actually, for us I think being an ASO doing the work has been a bit more challenging … because of the stigma so we have really tried hard to distinguish …[our enrollment work as separate from the HIV services we provided] so people can feel comfortable coming to us and comfortable with our help.
Participants also discussed the importance of having expertise related to which health plans work best for people with HIV in terms of access to medications, providers, and interoperability with Ryan White. Navigators discussed that while making sure providers are in-network and medications are on formulary is import for anyone enrolling, this is especially the case for someone with HIV. Participants cited the high costs of HIV treatment, which could run thousands of dollars a month, and the need to ensure that plans not only cover prescribed drugs but also do so with affordable cost-sharing. They also discussed the importance of staying engaged with HIV treatment as a way to promote individual health and to provide the preventative benefits associated with achieving viral supression. They see affordable accessible coverage as a facilitator for staying engaged in care.
The main problem is that people living with HIV/AIDS they have very specific medications that they need to take and doctors that they need to see… they need to stay on their medications and see their doctors frequently in order to stop it from advancing into AIDS so those drugs alone cost thousands of dollars a month so having a navigator help them work through those questions that they have, understand what’s available to them, which plans make sense for their needs, I mean it is essential for that population.
In some cases, HIV navigator entities conducted reviews of all the regionally available marketplace plans so they could understand which ones represented the best options for people with HIV. In one instance, an HIV sub-grantee who lost their funding employed the single individual who did a plan analysis for the entire state network of ASOs. The main grantee hoped that the ASO would be able to continue this service without navigator funding but was unsure.
Since Ryan White Programs and especially AIDS Drug Assistance Programs (ADAPs) can assist clients with the costs associated with insurance coverage (e.g. premiums and cost-sharing) in certain circumstances, navigators with HIV care expertise also played an important role in relaying information about these services to enrollees. Navigators with HIV expertise often had a specialized understanding of how to enroll consumers in Ryan White assistance and knowledge of which plans could be used with Ryan Whites premium assistance.7 Many worried about what would happened if consumers enrolled without this specialist knowledge in the future.
Navigators serving people with HIV at ASOs and other community based organizations felt they had the opportunity to provide more in-depth assistance than they would if their clients were seeing navigators at sites exclusively devoted to processing enrollments. Several explained that it often took many visits to get a client enrolled. Others talked about how their role extended beyond just enrollment clients in coverage to conducting insurance education.
[Clients] may need to interact with staff several times until they get the help they need, people come back to us for anything in the world from dealing with old medical bills that should have been covered to an argument that they are having with their doctor, or if they get dropped or things like that.
One organization described their navigators giving out their personal cell phone numbers so clients could reach them. They doubted that other entities would be similarly committed to ensuring a vulnerable population had this level of support and did not know if they could continue without funding.
[Navigators] provided their cell phone numbers. They were on call day and evening if [clients] had questions, even for emotional support. We may not be able to provide that same type of assistance. We just don’t have the funds to be able to do it.
Navigators believed that providing additional attention and ongoing education was especially important for people with HIV, many of whom were unfamiliar with how to use and enroll in insurance. Several organizations talked about offering “insurance 101” to their clients and providing ongoing education throughout the year. One group would print out and walk through the Summary of Benefits and Coverage for each person enrolled in the marketplace. This group also conducted three way calls with pharmacies so clients would learn how to make those call on their own in the future. These navigators emphasized the ongoing need to remind clients about how to maximize the benefits of coverage.
We saw a need for that 101 assistance…We also saw a population that wasn’t used to insurance, had a lot of questions on how to use it, best practices. We saw a lot of people who were going to emergency rooms for things like colds. We did a lot of 101 counseling individually, like going through the summary of benefits with clients but then also doing larger kind of like health insurance 101, what is a deductible, what is coinsurance, what is the difference, what are costs you are responsible to pay, what are costs the health insurance will pay.
Navigator entities serving people with HIV often forged close relationships with community partners, including Ryan White clinics and health departments, as well as sheriff’s offices, and providers. In several instances, participants or their sub-grantees co-located within clinics or health departments to provide those seeking HIV care or support services with enrollment assistance. These relationships appeared to be especially meaningful in Ryan White clinics and ADAP offices. One grantee said their navigators worked very closely with ADAP when the issuer serving most ADAP clients left the market. Together they assessed the remaining available marketplace options and transitioned clients from the plan that was terminating to new coverage. Ryan White Programs in several settings relied on co-located navigator services to ensure that their clients received enrollment help with individuals familiar with these programs and the general needs of people with HIV. Another grantee began offering co-located services at just a couple ADAP offices (upon ADAPs request) but both parties found the relationship so fruitful that the navigator expanded to offering services at all ADAP enrollment sites in later enrollment periods.
These navigators sometimes offered enrollment services within HIV clinics as a way of meeting HIV positive individuals where they were comfortable and already seeking services. In some cases, these navigators said patients would not necessarily have known they were an outside entity.
We wanted to make it really accessible, we would also have standing appointments at the …clinic and other places too. That was really key for us, making sure we regularly went to the places people living with HIV might be, if it wasn’t our office.
Navigators also made sure community partners such as health departments and hospital infectious disease clinics were aware of their services so they could refer HIV positive clients to them for enrollment assistance. They attended pride events, community celebrations, and ran workshops with other local groups. After the funding announcement, however, a number of navigators said they had to cut back on how much work they could do with these outside partners and, in some cases pulled back on offering co-located services.
Reaction to Funding Cut
Participants described seeking out navigator work for altruistic reasons and working hard to ensure vulnerable populations had access to health coverage and health care. They said that the funding cuts threatened to negatively impact both the capacity they had worked so hard to build up and the communities they served.
The majority of the participants we spoke with were very “surprised,” calling the cuts they received “a shock on every level,” “devastating,” and “a big blow.” Most said they had no indication from CMS or project officers that cuts were coming. Several reported only positive feedback from their project officers leading up to the late August announcement, which made significant cuts particularly confounding. Several reported they were explicitly told they were “doing a great job.” One navigator group who faced a cut nearing 60% had received only positive feedback from their project officer and had even been asked to mentor other struggling navigator grantees and to sit on national enrollment panels.
[The cuts were] a huge surprise, devastating because our contract officer kept reassuring us with how pleased she was with the great work we were doing. As a matter of fact, [we were]… asked to mentor two other organizations who were not doing well. We were asked to be panelists on national conferences on navigation and coverage to care educational workshops so you know we were very taken by surprise.
One organization, also taken aback when the learned of the cut, said they heard news of the cuts from a reporter before hearing from CMS.
Oh yeah [the cut was a surprise]. We had absolutely no clue. [The] poor [reporter] was actually the one who told me about the cut because we hadn’t heard anything…[he] called to find out what I thought about the cuts to the navigator grants and I was like ‘what cuts to the navigator grants?’ …We had no prior knowledge before they held the press conference so the press actually knew about the cuts before the grantees did. The only information we received about the cuts was the press release, that’s it.
Among those interviewed, only one stakeholder who experienced a very small cut explained that they were not surprised as they thought they were being rewarded for the productive enrollment work they had been engaged with and believed that they had met all their targets.
Many participants were confused by the justification (ability to meet enrollment targets) CMS had used to defend the cuts. Some navigators explained that they worked with vulnerable populations with complicated lives. They felt punished for making the choice to reach out to those with the greatest need who sometimes took a longer time to enroll and sometimes did not complete enrollment. One HIV navigator was frustrated that they had been encouraged to be aspirational in their goal setting as they now felt they penalized for that optimism. Others said that they were meeting or exceeding targets and were confused that CMS had justified cuts based on failure to achieve these very goals. Navigators were left second guessing their work and wondering whether only certain enrollments counted towards their goals (i.e. Medicaid enrollments vs. marketplace enrollments). Based on their own experience and in talking to others, one stakeholder wondered how the awards had been calculated saying “we still don’t know where [CMS] got the numbers.” A separate group echoed this stating “we really don’t have a clear understanding of how these decisions were made or what metrics were used to make the determination.” Another wondered whether they were using the same metric as CMS to assess goal achievement and questioned whether there were calculated motivations behind the agency’s funding approach.
It doesn’t look at all like the federal government actually calculated the cut that way which tell us that it was all political and it wasn’t a decision made by anyone who does this for a living.
Several organizations discussed the timing of the award notifications. They noted learning of award cuts as they were in the thick of preparing for the fifth open enrollment period and that short notice meant rethinking their activities, their staffing, and their ability to fund sub-grantees just 8 weeks before enrollment began. Another participant explained they were upset that these cuts came in the final year of a three-year funding period. After two years of grant-funded enrollment work, they felt they had found their feet, building up expertise and fostering partnerships with organizations that serve people with HIV. They felt they had become a trusted source of enrollment assistance for people with HIV and that the cut effectively undid their hard work in the final year of funding.
[The cut] was obviously a really devastating blow. I think the timing of it is especially hard because we have spent so much work now going into the third year of this grant…building up partnerships, building… the client base – expects these services of us now. I was really committed to doing whatever we could to maintain our commitment to our partner agencies and our clients that were expecting to have us be available to them.
While the loss of funding weighed heavily on the minds of navigators, they noted other confounding factors that left them worried about their ability to enroll and engage consumers. They pointed out that the cuts, the short notice of the grant award, and the condensed open enrollment period formed a triad of enrollment barriers they would have to overcome.
I think [people with HIV] will be impacted greatly, we have only half the crew in half the locations from which to serve the same population and more. We also have a shortened open enrollment. It is almost like everything is working against us to assist the same number of people that we would have been able to assist had we not gotten these cuts. We may not be able to reach everyone we need to reach. We are going to try to do it but taking into account that we got reduced by 50%, locations reduced by 50%, a shortened enrollment period. It’s going to be hard. It is nothing that we can promise that we are going to be able to get to all of them.
When trying to reach hard to reach populations… The shortened enrollment period is a big risk factor that may reduce the number that reenroll or may reduce the number of uninsured enrolling. And then the incredible confusion of ‘is the ACA still the law?’…it is just such an uphill battle for – and the 90% cut in advertising- and for all consumers so that when you look at special populations it is even harder.
Impact of cut on HIV Navigator Organizations
Participants discussed how funding cuts would impact their organizations including in terms of staffing, ability to fund sub-grantees, reach into the community, and the activities they would engage in.
Many of the HIV navigator entities we spoke with said that they had to let staff go almost immediatelyafter learning about the funding cut. Several had to cut more than 50% of their navigators. Depending on how the grant was set up this was sometimes internal staff but more often external staff located in other organizations receiving navigator funds as a sub-grantee. Several navigators reported letting go of their ASO sub-grantees. When a sub-grantee lost funding, in some cases their organization seemed able to take on the staff with other internal resources. In other cases, it was unclear to the named grantee what would happen to those staff members. We spoke to one sub-grantee whose funding was retracted because of the cut to the primary grant holder. While the navigator will be able to stay on with her organization, her work will shift at least temporarily to focusing on Ryan White and she may need to move out of case management altogether. At the time of the interview, she was trying to get approved as a Certified Application Counselor (CAC), a separate federal enrollment training program without funding, which would allow her to enroll the organizations existing clients. She was frustrated that the funds were cut before she could file for the navigator certification and as a result has to complete another and duplicative training process that might not come through for open enrollment.
I had done all my [navigator] recertification, I was ready to file for my recertification through the state but I had done all the training, everything. Then just to find out there was no more funding, that was it…[laughs]…I am just having to work backwards here, against the clock for the start of open enrollment.
Other organizations have cut staff hours. Several organizations funded some of their navigator sub-grantees or staff with short-term contracts for only the three months around open enrollment and others, typically a smaller group, for a full year (through the end of the grant period).
HIV Navigator entities took different approaches in selecting which sub-grantees to let go or offer a retracted contract. While some entities focused on funding only those who enrolled the greatest number of people in the past, others tried to cut only entities that they knew had other sources of funding, such as federally funded health centers. Some grantees tried to ensure their cuts did not disproportionally impact specific geographic regions while others focused their efforts on the most densely populated urban areas. Some navigator organizations prioritized generalist navigator entities, cutting groups specifically serving special populations, including people with HIV, while others tried to fund all groups, even if that meant funding at lower levels.
Several participants streamlined their activities supported by navigator funding in light of grant cuts. A few organizations focused most of their efforts on the open-enrollment period, culling activities outside of open enrollment such as working with clients on special enrollment periods or assisting during tax time. Two organizations that faced particularly large cuts said that they were choosing to focus on renewals this year rather than doing community outreach to encourage new enrollments. The organizations taking this approach felt their duty was to first serve their existing client base and were daunted even when limiting their focus to this group. One of the organizations additionally said they had gotten the message from CMS that reenrollments should be prioritized. Many of the groups were overwhelmed at the prospect of trying to assist the same number of people with less support than in the past.
Now we have half the crew trying to reenroll the same number of and enroll new ones…Since we do have a staff reduction we have had to reduce the number of locations we can have a physical presence in…so basically everything is cut in half but we are going to try and attempt to reenroll all those consumers [with HIV] that we helped last year plus reach out to the others. It’s a daunting task.
Several organizations said they would have to reduce the level of community outreach, education, and event participation. Another strategy HIV navigators took was to reduce the number of sites where they had staff co-located at clinics and non-profits. Others who had bought paid media in the past said they would roll some of that back. One group said they would make a bigger push to get more earned media as a result.
Groups that received relatively high grant awards discussed their privilege. Some groups lost a significant share of their funding but because they had comparatively large grants to begin with, even after the cut, they were left with substantial funding to work with. One navigator lost little funding. These groups were the least likely to completely cut out specific aspects of their programing and worked to spread the cuts around so as not to focus the hit on any one organization, region, or population. One such navigator group said that they would “not stand there and makes a decision that one population is more in need or more deserving than another” in deciding how to realign their resources after the cut. However, they acknowledged that they were able to take this stand because they still had a large grant and noted, if they had less funding to work with, they would have had to approached dealing with their cut differently.
Impact on People with HIV
Participants discussed how they believed the cuts would affect the consumers they serve with HIV. Navigators had an overwhelmingly pessimistic view of their ability to continue enrollment work and specifically serve people with HIV in the future. They were unsure about funding to continue work beyond the enrollment period and concerned about what the drop off in specialized navigator resources would ultimately mean for people with HIV. Navigators worried that the ultimate impact on people with HIV losing access to coverage assistance could be losing insurance and falling out of care, or in some cases, returning to Ryan White.
Some thought the loss of navigators with HIV expertise, including those located in familiar settings, might cause instability and that this could take emotional toll on clients and could potentially lead to loss of coverage.
I think there is going to be a lot of confusion. There is so much confusion and misinformation… Without [the HIV specific navigator]…resource to go to I don’t know where people will be able to go…The impact and toll on somebody emotionally with all this instability that’s happening…is a matter of life and death…All the people in our office are really concerned and it can be very emotional. I don’t think we are really quantifying what this stress and concern is potentially doing as well.
Navigators worried about losing a “safe space” where HIV positive consumers could comfortably disclose their serostatus during enrollment. Recognizing that people with HIV sometimes face stigma in social institutions, including in health care settings, many of the navigators believed their enrollment services reduced barriers HIV positive individuals might face in a less welcoming or discriminatory environment.
I mean maybe the larger problem is that people who have HIV/AIDS face a lot of societal stigmas, they might be afraid to share with anyone that they are living with HIV/AIDS and so not having a navigator permanently housed at [an HIV sub-grantee location]… kind of changes the landscape in that they might not…feel comfortable seeking out the [assistance]…that they need … It discourages them from enrolling….
One participant noted that if a navigator asks enrollees to disclose their medications and doctors in order to select an appropriate plan (which is important), it would effectively require someone with HIV to “come out” as positive. This navigator felt that going to an ASO might relieve some of the stress around that situation. Navigators who let ASO sub-grantees go due to the cuts worried about how that would affect safe access to coverage assistance for people with HIV and worried that these consumers may not want to get enrollment help elsewhere. Another navigator said that if someone was forced to go to an enrollment site not obviously friendly to people with HIV, it might be a barrier, especially if they had already been receiving this service at an ASO in the past.
In my experience once someone discloses their status, they really want to continue working with you. That’s just one less person you have to go sharing your personal health business with…I think people do like minimizing that… I do think there would be an added level of either discomfort or maybe another potential emotional barrier to get you through the door.
Many navigators were concerned that those enrolling without assistance, either as a result of the cuts or in future enrollment periods, might pick unaffordable plans and could ultimately fall out of care. One navigator worried consumers would chose plans based on premiums alone and not look at provider or drug access. Others expressed concerned that those who enroll without help would enroll in unaffordable plans, eventually drop coverage, and become disengaged with care.
A person that is HIV positive really needs to adhere to taking their drugs on a daily basis and a lot of medications are thousands of dollars a month and if they don’t have the right plan they are not going to be able to afford those medications and potentially could lead down the road to HIV progressing to AIDS…
One Navigator voiced concern about the burden Ryan White might face if people with HIV who had gained coverage dropped it and needed to turn back to the safety net program for care and treatment.
Well I guess there is always Ryan White as a payer of last resort. Where it’s gonna impact us is, how many people [is Ryan White] going to be able to help if too many [people go back to the program for assistance].
One participant with a former sub-grantee working in an area hard hit by the opioid epidemic worried about how the loss of that navigator would affect the local burgeoning HIV epidemic. The individual funded to work in this region will stay on with the Community Health Center where they were located but traveling to the affected county will “no longer be in her scope of practice” so it is unclear if her enrollment outreach in that affected community will be able to continue.
Many of the HIV navigator entities did not see themselves offering navigator assistance in the future without additional funding and worried people with HIV would not have access to knowledgeable enrollment assistance moving forward. Given the reduction in funding this year and the messages they were receiving from an administration prioritizing dismantling the Affordable Care Act, many simply assumed this year’s grant would be their last.
I fear that if nothing changes we are looking at discontinuing some of the really good partnerships that we spent time and effort building up. I don’t know what open enrollment would look like next year but at this point we wouldn’t have navigators or certified application counselors in house at this point.
Navigators believed that some of their sub-grantees who had engaged in case management and Medicaid enrollment work prior to the ACA with other revenue streams, such as Community Health Centers and hospitals, would continue these activities in the future. However, they were less certain about the ability of smaller non-profits, which had relied on the navigator grants, to continue this work, especially those serving vulnerable populations. They worried about where people with HIV would turn for knowledgeable enrollment assistance.
My main concern [was]… having known a lot of the clients that have been coming to us year after year for assistance trying to find plans that would serve them the best to suddenly not have someone there to help them. It is going to leave a lot of people in the dark. A lot of people find the healthcare.gov website confusing to work with or they just aren’t sure what to look at with formularies and whatnot to make to make their antiretroviral medication affordable.
Navigators expressed concern that people with and at risk for HIV many not enroll in the future. They feared these groups would lose a contact point with health and social services as they lost enrollment access points. They feared that losing contact with these community members would mean individuals would not only lose access to enrollment assistance but they also may lose access to other services their organizations offer. For example, one navigator organization tied enrollment events in with other community health events such as HIV testing, sometimes collaborating with the health departments. With the cuts, they were not sure they would be able to continue to operate these events moving forward and they feared that as a result there would be fewer people who would learn their HIV status as well as fewer people with coverage.
Conclusion
This study presents findings from interviews with navigators serving people with HIV to assess how recent funding cuts could affect their ability to enroll and retain this population in coverage. Most of those we spoke with were stunned by the cuts and very concerned about their ability to serve this population moving forward. Those that were more confident in their ability to continue to assist people with HIV had alternative funding streams, experienced small cuts, or retained a large grant despite a substantial proportional cut. The participants in this study placed a great deal of value on the HIV specific enrollment experience they offered. In part, this stemmed from their knowledge about HIV treatment, ability to assess plan design for factors important to someone with the condition, and understanding of the Ryan White Program. However, beyond having a particular knowledge base, HIV navigator entities cited their ability to provide a safe and familiar setting where consumers knew they could discuss their coverage needs related to HIV free of stigma and discrimination as a unique asset. Most navigators were uncertain about what type of enrollment help and mid-year plan assistance people with HIV will receive moving forward, and some feared this could lead to loss of coverage. Navigators were concerned that people with HIV who enroll in plans without navigators with experience working with this population could enroll in unaffordable plans and ultimately fall out of coverage. Looking to the future, it will be important to continue to monitor how people with HIV enroll in coverage, whether they stay retained in care, and what happens if they do not.
Premium assistance is the mechanism by which Ryan White Program grantees are provide financial assistance to help with the cost of insurance (usually premiums and other cost-sharing). ↩︎
On January 23, 2017, President Trump reinstated the Mexico City Policy (see KFF explainer). In the past, the policy required foreign non-governmental organizations (NGOs) to certify that they would not “perform or actively promote abortion as a method of family planning,” using funds from any source, as a condition for receiving U.S. government global family planning assistance; it applied to foreign NGOs receiving funding directly, as prime recipients, and indirectly, as sub-recipients. It also required U.S. NGOs to ensure that their foreign NGO sub-recipients were in compliance.
Under the Trump Administration, the policy’s scope has been significantly expanded to include most other U.S. bilateral global health assistance, beyond just family planning funding, and additional funding agreements.
At this time, many questions remain about the potential impact of the expanded policy. One key unknown is the size of the universe of affected NGOs. To begin to answer this question, we analyzed data on U.S. global health assistance obligated over a recent three-year period (FY 2013-FY 20151 ) to identify the number of foreign NGOs that received funding. Our findings should be considered a minimum estimate, since we were only able to include a sample of NGO sub-recipients. Our analysis finds that:
If the policy had been in effect during this time, at least 1,275foreign NGOs – half as prime recipients of U.S. global health assistance and half as sub-recipients – and approximately $2.2 billion in funding directed to these NGOs would have been subject to the policy.
In addition, at least 469U.S. NGOs receiving U.S. global health assistance would have been required to ensure that their foreign NGO sub-recipients were in compliance.
The expansion of the policy greatly increased its reach. Among prime recipients alone, most affected foreign NGOs (92%) and funding (88%) would not have been subject to the policy under its pre-expansion terms.
Ultimately, while it is too soon to know the actual impacts of the expanded policy on the people served by U.S. global health programs, our analysis suggests that, at a minimum, a significant number of NGOs will be subject to the policy.
Issue Brief
Introduction
On January 23, 2017, President Trump reinstated the Mexico City Policy (MCP), renamed “Protecting Life in Global Health Assistance” (see the KFF explainer). In the past, when in effect, the policy required foreign non-governmental organizations (NGOs)2 to certify that they would not “perform or actively promote abortion as a method of family planning” using funds from any source (including non-U.S. funds) as a condition for receiving U.S. government global family planning assistance. This included both foreign NGOs receiving U.S. funding directly, as “prime recipients,”3 or indirectly, as “sub-recipients.”4 Furthermore, it required U.S. NGOs to ensure that any foreign NGO sub-recipients were in compliance. Under the Trump Administration, the policy’s scope has been significantly expanded beyond these conditions. It now includes most other U.S. bilateral global health assistance and, pending the outcome of a rule-making process, additional funding agreements (in the past, it applied to cooperative agreements and grants;5 the Administration intends to also apply it to contracts).6 As such, the policy applies to more than $7 billion, to the extent that such funding is ultimately provided to foreign NGOs, directly or indirectly.
At this time, many questions remain about the potential impact of the expanded policy. One key unknown is the size of the universe of affected NGOs. We undertook this analysis to begin to answer that question. Using ForeignAssistance.gov data obtained from USAID,7 we identified NGO prime recipients of U.S. global health assistance in the most recent three-year period for which such data were available (FY 2013- FY 2015).8 We categorized them into U.S. and foreign NGOs. We included bilateral global health funding obligated by USAID (including funding that had been transferred to USAID from the Department of State) through grants, cooperative agreements, and contracts (contracts were included even though the rule-making process has not yet been initiated9 ) that would have been subject to the MCP. We then analyzed data from USAspending.gov to identify NGO sub-recipients of the top NGO prime recipients of U.S. global health assistance over the same period.10 This allowed us to create a database of foreign NGOs that would have been subject to the expanded MCP if the policy had been in effect during that three-year period, as well as U.S. NGOs that would have been required to ensure that their foreign NGO sub-recipients were in compliance. We also quantified the effect of expanding the policy beyond its prior conditions on the number of affected NGOs.
Our findings should be considered a minimum estimate since we only looked at sub-recipients of the top prime recipients of funding (and not all prime recipients report sub-recipient data). Indeed, based on a prior analysis we conducted, most U.S. global health assistance flows first to U.S.-based organizations before reaching foreign NGOs.11 In addition, we did not include NGOs that received global health funding transferred from State or other agencies to the Department of Health and Human Services in this analysis (although such funding is subject to the policy12 ). At the same time, it is important to note that while all foreign NGOs will be required to certify compliance with the MCP as a condition of receiving U.S. global health assistance, only some carry out activities that are prohibited by the policy; however, available data did not allow us to assess this issue. See full methodology in Appendix A.
Findings
Overview
We found that had the expanded Mexico City Policy been in effect during the FY 2013 – FY 2015 period:
At least 1,275 foreign NGOs – 639 as prime recipients of U.S. global health assistance and 658 as sub-recipients – would have been subject to the policy.13 See Figure 1.
Figure 1: Foreign NGOs Subject to Mexico City Policy: Recipients of U.S. Global Health Assistance, FY 2013-FY 2015
Together, they accounted for approximately $2.2 billion14 in funding subject to the policy, including $1.36 billion to prime recipients and $831 million15 to sub-recipients.
This funding supported foreign NGO efforts in at least 91 countries, including many countries that allow for legal abortion in at least one case not permitted by the MCP (see KFF analysis), and across all major global health program areas: family planning/reproductive health (FP/RH), maternal and child health (MCH), nutrition, HIV, TB, malaria, global health security, and other threats, including NTDs. HIV had the greatest number of foreign NGO prime recipients (470), followed by MCH (105) and FP/RH (82). See Table 1.
Table 1: Foreign NGO Prime Recipients: Number and Amount of Program Area Funding Subject to Mexico City Policy, FY 2013-FY 2015
Program Area
Number of Prime Recipients Subject to MCP*
Prime Recipient Funding Subject to MCP*
FP/RH
82
$175 million
MCH
105
$75 million
Nutrition
15
$6 million
HIV
470
$873 million
Tuberculosis
30
$194 million
Malaria
55
$31 million
Global Health Security
43
$1 million
Other Threats, inc. NTDs
5
$6 million
TOTAL
639
$1.36 billion
NOTES: * Does not include funding not subject to the MCP, including support for the Food for Peace (FFP) and American Schools and Hospitals Abroad (ASHA) programs and certain WASH efforts as well as support via agreements other than cooperative agreements, grants, and contracts. Sub-recipients not included.
HIV also accounted for the greatest amount of affected funding ($873 million), though this represented just 8% of HIV program area funding obligated over the period. The TB program had the greatest share of its program funding affected (35%), though this represented a much smaller amount of funding ($194 million). For FP/RH funding, 11% (or $175 million) was subject to the policy.16 See Table 2. These variations largely reflect the extent to which different program areas rely on foreign NGOs as prime recipients of aid, which was most common in the case of the TB program.
Table 2: Foreign NGO Prime Recipients: Amount & Share of Program Area Funding Subject to Mexico City Policy, FY 2013-FY 2015
Program Area
Total Program Area Funding
Prime Recipient Funding Subject to MCP* (% of Total)
FP/RH
$1.54 billion
$175 million (11%)
MCH
$2.27 billion
$75 million (3%)
Nutrition
$490 million
$6 million (1%)
HIV
$11.24 billion
$873 million (8%)
Tuberculosis
$554 million
$194 million (35%)
Malaria
$1.62 billion
$31 million (2%)
Global Health Security
$388 million
$1 million (<1%)
Other Threats, inc. NTDs
$413 million
$6 million (2%)
NOTES: * Does not include funding not subject to the MCP, including support for the Food for Peace (FFP) and American Schools and Hospitals Abroad (ASHA) programs and certain WASH efforts as well as support via agreements other than cooperative agreements, grants, and contracts. Sub-recipients not included.
In addition to foreign NGOs, at least 469 U.S. NGOs that received U.S. global health assistance during this period (including 391 who were prime recipients) would have been required to ensure that their foreign NGO sub-recipients were in compliance. See Figure 2.
Figure 2: U.S. NGOs and the Mexico City Policy: Recipients of U.S. Global Health Assistance, FY 2013-FY 2015
Newly Subject NGOs and Funding
Looking at prime recipients only, we also quantified the effect of expanding the policy beyond its prior conditions on the number of affected NGOs (available data on sub-recipients did not permit this level of analysis). We found that the expansion of the policy beyond family planning assistance and to contracts greatly increased its reach:
Among prime recipients alone, most affected foreign NGOs (587 of 639, or 92%) and most funding ($1.2 billion of $1.36 billion, or 88%) would not have been subject to the policy under its pre-expansion terms. See Figure 3.
Figure 3: Foreign NGOs Newly Subject to Mexico City Policy: Impact of Expansion on Prime Recipients, FY 2013-FY 2015
Of the 587 newly subject to the policy, 557 received non-family planning global health assistance only (i.e., MCH, nutrition, HIV, TB, malaria, global health security, and other threats, including NTDs) and 401 received funding through contracts only.17,18 See Figure 4.
Figure 4: Foreign NGOs Newly Subject to Mexico City Policy: Impact of Expansion on Prime Recipients, FY 2013-FY 2015, by Reason
Of the 391 U.S. NGOs prime recipients that would have had to ensure certification by and monitor compliance of their foreign NGO sub-recipients, most (321, or 82%) would have had to do this for the first time due to the expansion.19
Conclusion
Our analysis finds that the expansion of the Mexico City Policy by the Trump Administration greatly increased its reach, affecting a much greater number of foreign NGOs and funding than prior iterations. This is particularly the case given the Administration’s intent to expand the policy to include contracts, pending the outcome of a rule-making process. Importantly, while our analysis provides an initial estimate of the number of foreign NGOs that would be subject to the policy, it does not represent the entire universe, due to data limitations in identifying sub-recipients of U.S. support. Such an accounting would be important for more fully understanding the scope and impact. Furthermore, this analysis does not assess the extent to which affected NGOs carry out activities prohibited by the policy, some of whom may choose to end such activities or forgo U.S. funding. Ultimately, this next layer of analysis will be critical to assessing the impact of the expanded policy on the people served by U.S. global health programs, as the policy continues to be rolled-out.
Appendix
Methodology
Using ForeignAssistance.gov data obtained from USAID,20 we identified NGO prime recipients of U.S. global health assistance in the most recent three-year period for which such data were available (FY 2013 – FY 2015).21 We categorized them into U.S. and foreign22 NGOs. We included bilateral global health funding obligated by USAID (including funding that had been transferred to USAID from the Department of State) through grants, cooperative agreements, and contracts. We then analyzed data from USAspending.gov to identify NGO sub-recipients of the top NGO prime recipients of U.S. global health assistance over the same period. This allowed us to create a database of foreign NGOs that would have been subject to the expanded MCP if the policy had been in effect during that three-year period, as well as U.S. NGOs that would have been required to ensure that their foreign NGO sub-recipients were in compliance. We also quantified the effect of expanding the policy beyond its prior conditions on the number of affected NGOs.
Our findings should be considered a minimum estimate since we only looked at sub-recipients of the top prime recipients of funding (and not all prime recipients report sub-recipient data).23 In addition, we did not include NGOs that received global health funding transferred from State or other agencies to the Department of Health and Human Services in this analysis (although such funding is subject to the policy).
Funding totals shown in this report represent net obligations. We only included funding subject to the policy and for health activities in program areas subject to the policy.24 Funding that is exempted from the policy (e.g., funding provided to international organizations, such as the Global Fund to Fight AIDS, Tuberculosis and Malaria, certain water and sanitation activities, the American Schools and Hospitals Abroad (ASHA) program, the Food for Peace (FFP) program, and humanitarian assistance) was not included. The exceptions were funding provided to entities that are government-run hospitals25 and entities that qualify for a “commercial exemption”26 under the current policy.
For prime recipients, we used information in the ForeignAssistance.gov data on health program area, responsible office, and activity descriptions to identify funding amounts subject to the policy, which was available for most but not all recipients. For sub-recipients, we used information in the USAspending.gov data on the funded agreement and activity, as well as related additional research, to identify funding amounts subject to the policy. The funded agreement must have been included in and identified as “health,” at least in part, in the ForeignAssistance.gov prime recipient data for the funding to have been considered subject to the policy at the sub-recipient level.
NGOs are defined by USAID as “any non-governmental organization or entity, whether non-profit or profit-making, receiving or providing USAID-funded assistance under an assistance instrument or contract.”27 This includes institutions of higher education,28 hospitals, non-profit non-governmental organizations, and commercial organizations.29,30 For prime recipients, we used information in the ForeignAssistance.gov data on organization type and country of origin to assign organizations into these categories; where information was not available, we did additional research. For sub-recipients, we conducted additional research to categorize organizations as NGOs and used information in the USAspending.gov data on country of origin to assign them to the U.S. or foreign category.
Endnotes
At the time this project began, this was the most recent complete data available at the awardee level. Complete data from FY 2016 may now be available. ↩︎
Defined by USAID as “a for-profit or not-for-profit non-governmental organization that is not organized under the laws of the United States, any State of the United States, the District of Columbia, or the Commonwealth of Puerto Rico, or any other territory or possession of the United States.” USAID: “Standard Provisions for U.S. Nongovernmental Organizations: A Mandatory Reference for ADS Chapter 303,” ADS Reference 303maa, partial revision May 22, 2017, https://www.usaid.gov/ads/policy/300/303maa; “Standard Provisions for Non-U.S. Nongovernmental Organizations: A Mandatory Reference for ADS Chapter 303,” ADS Reference 303mab, partial revision May 22, 2017, https://www.usaid.gov/ads/policy/300/303mab. ↩︎
A prime recipient receives money directly from the U.S. government after signing a cooperative agreement, grant, contract, or other funding agreement with the U.S. government. ↩︎
A sub-recipient receives money from a prime recipient (see above) to carry out the original agreement. ↩︎
With some exceptions – see endnote #9 for exception about “grants under contracts.” ↩︎
USAID, “Implementation of Protecting Life in Global Health Assistance (formerly known as the Mexico City Policy),” Executive Message to USAID/General Notice Distribution List, May 15, 2017. As of May 15, the policy applies to all new USAID grants and cooperative agreements that provide global health assistance, as well as to all existing grants and cooperative agreements that provide global health assistance when such agreements are amended to add new funding. As of March 2, the same holds true for USAID grants and cooperative agreements that provide family planning assistance. USAID: “Standard Provisions for U.S. Nongovernmental Organizations: A Mandatory Reference for ADS Chapter 303,” ADS Reference 303maa, partial revision May 22, 2017, https://www.usaid.gov/ads/policy/300/303maa; “Standard Provisions for Non-U.S. Nongovernmental Organizations: A Mandatory Reference for ADS Chapter 303,” ADS Reference 303mab, partial revision May 22, 2017, https://www.usaid.gov/ads/policy/300/303mab. ↩︎
KFF analysis of USAID FY 2013 – FY 2015 transaction data provided via personal communication with USAID staff of the U.S. Foreign Assistance Dashboard (ForeignAssistance.gov), Feb. 10, 2017. ↩︎
At the time this project began, this was the most recent complete data available at the awardee level. ↩︎
USAID, “Implementation of Protecting Life in Global Health Assistance (formerly known as the Mexico City Policy),” Executive Message to USAID/General Notice Distribution List, May 15, 2017. As of the date this brief was published, the policy is not in effect with regard to contracts. A rulemaking process is required to apply the policy to contracts, which may take some time. The exception to this is “grants under contracts,” which were previously subject to the policy when last in effect and are covered by the reinstated policy at this time; they are essentially grants made to sub-recipients by prime recipients of contracts. ↩︎
Among the top 20 NGO prime recipients, as measured by funding that could have been subject to the MCP had it ultimately been directed to foreign NGOs, 14 reported providing global health funding to sub-recipients, but only 13 were included in this analysis (there was an apparent error in the funding amount reported by the one that was excluded); their sub-recipients that were NGOs were included in this analysis. KFF analysis of data downloaded from USAspending.gov, March 10, 2017. ↩︎
Some prime recipients are also sub-recipients, so the total is less than the sum of prime and sub-recipients. ↩︎
This $2.2 billion represented 17% of global health assistance that the policy might have applied to during this period if it had ultimately been provided entirely to foreign NGOs during this period (approximately $12.54 billion). ↩︎
Of this, approximately $12 million was provided to other foreign NGOs (sub-recipients) by a foreign NGO prime recipient; this funding may or may not overlap to some degree with that prime recipient’s funding that was included in the foreign NGO prime recipient funding total. ↩︎
This does not represent the entire amount of program funding that would have been subject to the policy. Most FP/RH funding was provided to U.S. NGO prime recipients, which may have provided funding to foreign NGO sub-recipients in turn; as with other global health funding provided to U.S. NGO prime recipients, funding provided indirectly to foreign NGOs would have been subject to the Mexico City policy. ↩︎
NGOs that received funding through both cooperative agreements/grants and contracts were not considered to be newly impacted since they would already be subject to the policy; only 15 NGOs received both during this time period. ↩︎
See State Department, “Subject: Protecting Life in Global Health Assistance,” Federal Assistance Management Advisory Number 2017-01; USAID, “USAID Notice: Implementation of Protecting Life in Global Health Assistance (formerly known as the Mexico City Policy),” Executive Message, May 15, 2017. ↩︎
Additionally, some of the 70 U.S. NGOs that would have been required to ensure prior certification of their foreign NGO subawardees for FP/RH funding under prior policy would have also had their responsibilities expanded under the reinstated policy to include subawardees of their non-FP/RH funding via cooperative agreements and grants and/or any global health funding via contracts. ↩︎
KFF analysis of USAID FY 2013 – FY 2015 transaction data provided via personal communication with USAID staff of the U.S. Foreign Assistance Dashboard (ForeignAssistance.gov), Feb. 10, 2017. ↩︎
At the time this project began, this was the most recent complete data available at the awardee level. ↩︎
A foreign NGO is defined by USAID as an NGO “that is not organized under the laws of the United States, any State of the United States, the District of Columbia, or the Commonwealth of Puerto Rico, or any other territory or possession of the United States.” USAID: “Standard Provisions for U.S. Nongovernmental Organizations: A Mandatory Reference for ADS Chapter 303,” ADS Reference 303maa, partial revision May 22, 2017, https://www.usaid.gov/ads/policy/300/303maa; “Standard Provisions for Non-U.S. Nongovernmental Organizations: A Mandatory Reference for ADS Chapter 303,” ADS Reference 303mab, partial revision May 22, 2017, https://www.usaid.gov/ads/policy/300/303mab. ↩︎
Among the top 20 NGO prime recipients, as measured by funding that could have been subject to the MCP had it ultimately been directed to foreign NGOs, 14 reported providing global health funding to sub-recipients, but only 13 were included in this analysis (there was an apparent error in the funding amount reported by the one that was excluded); their sub-recipients that were NGOs were included in this analysis. KFF analysis of data downloaded from USAspending.gov, March 10, 2017. ↩︎
See USAID, “Implementation of Protecting Life in Global Health Assistance (formerly known as the Mexico City Policy),” Executive Message to USAID/General Notice Distribution List, May 15, 2017; USAID, “Standard Provisions for U.S. Nongovernmental Organizations: A Mandatory Reference for ADS Chapter 303,” ADS Reference 303maa, partial revision May 22, 2017, https://www.usaid.gov/ads/policy/300/303maa; USAID, “Standard Provisions for Non-U.S. Nongovernmental Organizations: A Mandatory Reference for ADS Chapter 303,” ADS Reference 303mab, partial revision May 22, 2017, https://www.usaid.gov/ads/policy/300/303mab. ↩︎
PAI, What You Need to Know About the Protecting Life in Global Health Assistance Restrictions on U.S. Global Health Assistance, Oct. 5, 2017. ↩︎
Foreign public educational institutions were excluded from our analysis, since they are exempt from the Mexico City Policy as government-operated institutions. ↩︎
USAID, Grants and Cooperative Agreements to Non-Governmental Organizations, ADS Chapter 303, partial revision, April 3, 2017, https://www.usaid.gov/ads/policy/300/303. ↩︎
Not subject to the Mexico City Policy are, among others: agreements with national and sub‐national governments, including foreign public universities; public international organizations; and other multilateral entities in which sovereign nations participate (such as the Global Fund to Fight AIDS, Malaria, and Tuberculosis, and Gavi, the Vaccine Alliance). USAID, “Implementation of Protecting Life in Global Health Assistance (formerly known as the Mexico City Policy),” Executive Message to USAID/General Notice Distribution List, May 15, 2017. A Department of State memo included a similar statement; see the Department of State, “Subject: Protecting Life in Global Health Assistance,” Federal Assistance Management Advisory Number 2017-01, May 15, 2017. ↩︎