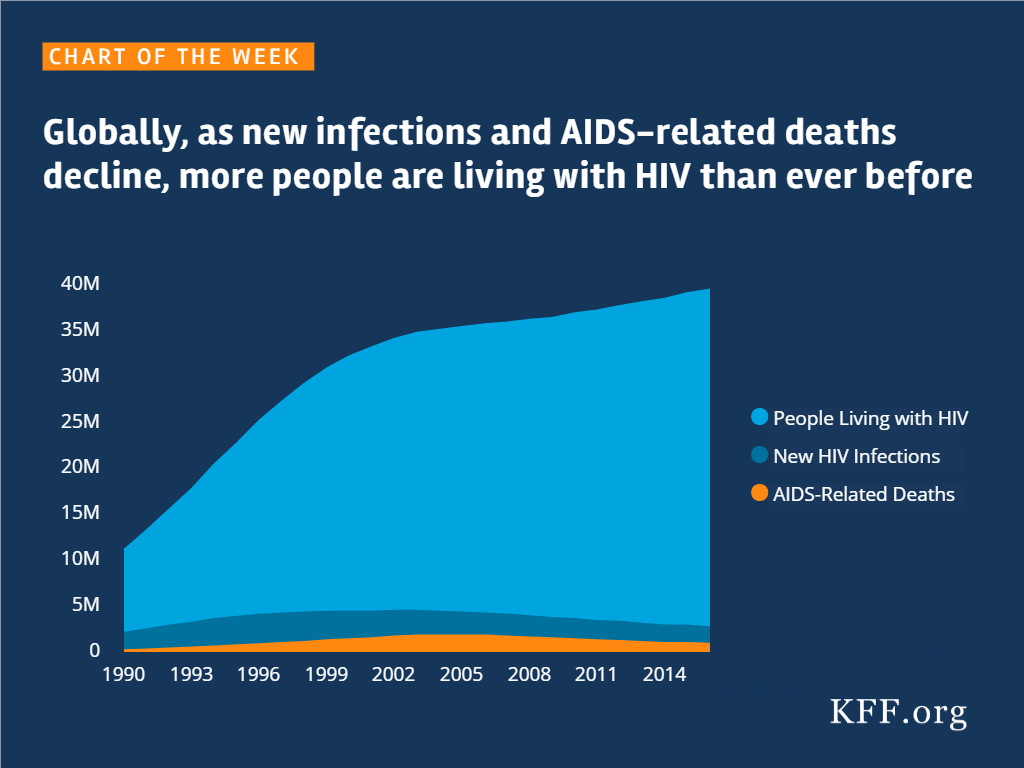
Globally, As New Infections and AIDS-related Deaths Decline, More People Are Living With HIV Than Ever Before
Source
SOURCE: Analysis of data obtained via online query of the UNAIDS Aidsinfo website; accessed November 2017.
The independent source for health policy research, polling, and news.

SOURCE: Analysis of data obtained via online query of the UNAIDS Aidsinfo website; accessed November 2017.
More than three and a half decades have passed since the first case of AIDS. An entire generation has been born and grown up without ever knowing a time when HIV did not exist, and they may be the first to see it end.
While there is no cure for HIV, experts say we have the knowledge and tools today that could lead to the eradication of the disease. Antiretrovirals (or ARVs), the medications used to treat HIV, work to reduce the viral load to levels undetectable by standard lab tests. Studies show that when the viral load is less than 200 copies of virus per milliliter of blood, long-term health is greatly improved and sexual transmission of the virus is extremely unlikely, if not impossible.[i]
For those who do not have HIV, PrEP (short for pre-exposure prophylaxis), an FDA approved once daily pill, offers another means of protection. When taken as prescribed, PrEP is highly effective in protecting against HIV.[ii] PrEP is also a significant advance in that it provides women with the first HIV prevention tool that they can control themselves.
To provide more insight into the knowledge, attitudes and experiences of young adults in the U.S. at this critical time in the epidemic, the Kaiser Family Foundation conducted a comprehensive nationally representative survey of 1,794 18-30 year olds between January 25-February 16, 2017. Given the disproportionate impact of HIV on Black and Latino populations, oversamples of these groups were included to provide a more in-depth look by race.
[i] Journal of the American Medical Association, July 12, 2016; New England Journal of Medicine, Sept. 1, 2016
[ii] New England Journal of Medicine, Dec. 30, 2010; Science Translational Medicine, Sept. 12, 2012; New England Journal of Medicine, Aug. 2, 2012
MENLO PARK, CA – A comprehensive new national survey of young adults, ages 18-30, from the Kaiser Family Foundation finds more than three and half decades into the epidemic, HIV remains an issue of deep concern for young people of color, both for themselves as well as for those they know. Few of those surveyed know about advances in prevention and treatment that experts say could end HIV if more widely adopted.
A majority (53%) of young Black adults say they are personally concerned about HIV, including 44 percent who are “very concerned.” Many Latinos also express worry (35% “very concerned,” 12% “somewhat concerned”). By contrast, 61 percent of their white peers say HIV is “not a concern” for them personally today, and another 20 percent say they are “not too concerned.”
About three times as many Blacks (46%) and Latinos (41%), as whites (15%), say HIV today is a “very serious” concern for people they know. Almost twice as many Black young adults (30%) say they know someone who is living with, or has died of, HIV/AIDS, as compared to whites and Latinos (16% each). One in five (20%) Black young people have a family member or close friend affected by HIV.
A third of Black (34%) and Latino (35%) young people say they worry about getting HIV; 16 percent of whites say they worry about their risk.
“An entire generation has been born and grown up without ever knowing a time when HIV did not exist, and they may be the first to see it end. Whether this future is realized rests with those most affected being educated about – and having access to – the latest advances in prevention and treatment,” said Tina Hoff, Senior Vice President, Health Communications and Media Partnerships, Kaiser Family Foundation.
Many Don’t Know about Advances in Prevention and Treatment
PrEP, the pill to protect against HIV, has been called a potential “game changer” in the fight against HIV; yet, in the five years since it was approved by the Food & Drug Administration (FDA), only 13 percent of young adults know about the prevention option.
Among the relatively few young people who have heard anything about PrEP (27%), only 18 percent believe it to be “very effective.” Many also doubt that all who might want PrEP could get it: 64 percent say “no.” When taken as prescribed, `this once daily pill reduces the risk of getting HIV up to 99 percent.
There are also gaps in understanding of how antiretrovirals (ARVs), the medications used to treat HIV, work. While most are generally aware of the health benefits, many understate the effectiveness of modern day treatments. Half of young people do not know being on consistent treatment also prevents the spread of HIV to sexual partners (29 percent say “not too effective,” and 23 percent say “not at all effective”). Just one in ten (11%) say ARVs are “very effective” at preventing the spread of HIV. Studies show that when the viral load is less than 200 copies of virus per milliliter of blood, long-term health is greatly improved and sexual transmission of the virus is extremely unlikely, if not impossible.
Stigma and Misperceptions Persist
Even this many years later, unfounded fears about the risks presented by those with HIV persist. Most young people today say they would be comfortable having people with HIV as friends (65%) or work colleagues (66%) but when it comes to other situations, stigma – and misperceptions – are evident.
Majorities say they would be uncomfortable having a roommate with HIV (51%), or having their food prepared by someone with HIV (58%). Three quarters (73%) respond that are “very uncomfortable” having a sexual partner with HIV, another 18 percent say they would be “somewhat uncomfortable.”
Providing insight into what may be behind the stigma, the survey also revealed a lack of understanding among a significant share about how HIV is transmitted. More than a third incorrectly believe there is a chance HIV could be spread through everyday items, such as plates and glasses (38%) or toilets (38%). Majorities are misinformed in thinking HIV can be transmitted by spitting (54%), or kissing (58%).
HIV Testing
The Centers for Disease Control and Prevention (CDC) recommends HIV testing as part of routine health care, yet more than half (54%) of young adults say they have never been tested. Most who have not say it is because they don’t believe [they are] at risk (67% of those never tested), followed by a doctor never suggested it (41%, multiple responses were possible).
Black young adults are more likely – and more recently – to report having gotten an HIV test. One in three (34%) Black young adults replied they had been tested for HIV within the last 12 months; comparatively, 16 percent of whites and 25 percent of Latinos report having been tested as recently. Overall, 61 percent of Black young adults report ever having been tested for HIV, as compared with 42 percent of whites and 49 percent of Latinos.
Black young adults are also more likely to say a health care provider has suggested HIV testing. One in four (25%) Black respondents report having a health care provider suggest HIV testing within the previous12 months; only about one in ten whites and Latinos say the topic came up (8% and 14%, respectively). Analysis shows that those who have discussed HIV with a health care provider – and/or have had a health care provider suggest testing – are more likely to report having been tested for HIV.
| THE U.S. EPIDEMIC. More than three and a half decades have passed since the first case was diagnosed of what is now known as AIDS. An estimated 1.1 million people in the United States are living with HIV, more than at any time in the history of the epidemic. Due to a combination of social inequities, and where the disease took hold, a disproportionate share of those affected are Black and Latino and/or gay men. In 2015, Black Americans accounted for almost half (45%) of new HIV diagnoses in the U.S., while comprising just 12 percent of the population. Latinos are also heavily affected, accounting for 24 percent persons newly diagnosed with HIV in 2015 and representing 17 percent of the population. |
The survey was designed and analyzed by researchers at the Kaiser Family Foundation. It was conducted between January 25 – February 16, 2017 among a nationally-representative sample of 1,794 people ages 18-30 years of age. Interviews were administered online and by telephone in English using an instrument developed by staff at the Kaiser Family Foundation. NORC at the University of Chicago conducted sampling, interviewing, and tabulation for the survey using the GenForward panel, a representative panel of adults ages 18-30 living in the United States. Panel members who do not have internet access complete surveys via telephone, and internet users complete surveys via the web (for the current survey, 1,647 participated via the web and 147 via telephone). The margin of sampling error including the design effect for the full sample is plus or minus 3 percentage points; for Black and Latino young adults it is plus or minus 7 percentage points and for whites it is plus or minus 5 percentage points. For sub-groups the sampling error may be higher.Methodology
Filling the need for trusted information on national health issues, the Kaiser Family Foundation is a nonprofit organization based in Menlo Park, California.
NOTE: A more recent version of this analysis, for 2019, is available here.
The premiums for 2018 Marketplace plans were recently released to give consumers a chance to look at their plan options before open enrollment begins on November 1. Premiums are rising significantly in many counties across the country, in part due to the decision of the Trump Administration to cease payments to insurers for cost-sharing reductions. Insurer participation also declined in many areas, leaving more counties with only one insurer, which likely contributed to the high rate of premium growth.
The map below illustrates how premiums changed for 2018 by looking at the change in the lowest-cost bronze, silver and gold plans by county. Results are shown for a 40-year-old paying the full premium and for a 40-year old with an income of $20,000 (166% of poverty), $25,000 (207% of poverty), $30,000 (249% of poverty), $35,000 (290% of poverty), and $40,000 (332% of poverty), who would be eligible for a premium tax credit.
Nationally, the unsubsidized premium for the lowest-cost bronze plan is increasing an average of 17% between 2017 and 2018, the lowest-cost silver plan is increasing an average of 32%, and the lowest-cost gold plan is increasing an average of 18% (Table 1). These average increases are weighted by the number of plan selections by county in 2017 (see Methods). Premiums for silver plans are rising much more than those for bronze or gold plans because in many states insurers loaded the cost from the termination of the cost-sharing reduction payments entirely on the silver tier.
For consumers who receive premium tax credits, the amounts that they will have to pay will often be lower in 2018 (Table 2). The particularly large increase in premiums for silver plans means that tax-credit-eligible Marketplace enrollees will see much higher premium tax credits (which are calculated based on the second-lowest-cost silver plan in each area). These large credits make gold plans more easily attainable and make bronze plans much cheaper (or even available at no additional premium). In fact, after these increases, the lowest-cost gold premium is lower than the lowest-cost silver premium in 478 counties.
For example, a 40-year-old individual making $35,000 (249% of poverty) and eligible for a tax credit will on average pay 36% less in 2018 for their share of the premium for the lowest-cost bronze plan, 6% less for the lowest-cost silver plan, and 12% less for the lowest-cost gold plan. The savings are greater for subsidized enrollees with lower incomes and less for those with higher incomes (Table 2). The premiums for bronze plans may be particularly attractive to many people eligible for premium tax credits. For example, the tax credit for a 40-year-old individual making $25,000 covers the full cost of the premium for the lowest-cost bronze plan in 1,679 counties (Table 3).
| Table 1: Average Change in the Lowest-Cost Premium by Metal Level Before Tax Credit, 2017-2018 for a 40-year-old | ||
| % Change in Lowest Cost Bronze Premium | +17% | |
| % Change in Lowest Cost Silver Premium | +32% | |
| % Change in Lowest Cost Gold Premium | +18% | |
| SOURCE: Kaiser Family Foundation analysis of premium data from Healthcare.gov and review of state rate filings. | ||
| Table 2: Average Change in the Lowest-Cost Premium by Metal Level After Tax Credit, 2017-2018 | |
| 40-year-old with $20,000 income (166% of poverty) | |
| % Change in Lowest Cost Bronze Premium | -85% |
| % Change in Lowest Cost Silver Premium | -14% |
| % Change in Lowest Cost Gold Premium | -26% |
| 40-year-old with $25,000 income (207% of poverty) | |
| % Change in Lowest Cost Bronze Premium | -69% |
| % Change in Lowest Cost Silver Premium | -10% |
| % Change in Lowest Cost Gold Premium | -20% |
| 40-year-old with $30,000 income (249% of poverty) | |
| % Change in Lowest Cost Bronze Premium | -50% |
| % Change in Lowest Cost Silver Premium | -8% |
| % Change in Lowest Cost Gold Premium | -16% |
| 40-year-old with $35,000 income (290% of poverty) | |
| % Change in Lowest Cost Bronze Premium | -36% |
| % Change in Lowest Cost Silver Premium | -6% |
| % Change in Lowest Cost Gold Premium | -12% |
| 40-year-old with $40,000 income (332% of poverty) | |
| % Change in Lowest Cost Bronze Premium | -24% |
| % Change in Lowest Cost Silver Premium | 1% |
| % Change in Lowest Cost Gold Premium | -6% |
| SOURCE: Kaiser Family Foundation analysis of premium data from Healthcare.gov and review of state rate filings. | |
| Table 3: Number of Counties Where an Individual’s Tax Credit Covers the Full Premium of the Lowest-Cost Bronze Plan in 2018, for a 40-year-old | |
| Example Age and Income | Number of counties where the tax credit covers the full premium for the lowest-cost bronze plan |
| 40-year-old with $20,000 income (166% of poverty | 2434 |
| 40-year-old with $25,000 income (207% of poverty) | 1679 |
| 40-year-old with $30,000 income (248% of poverty) | 488 |
| 40-year-old with $35,000 income (290% of poverty) | 169 |
| 40-year old with $40,000 income (332% of poverty) | 104 |
| SOURCE: Kaiser Family Foundation analysis of premium data from Healthcare.gov and review of state rate filings. | |
The map below shows where an individual’s tax credit covers the full premium of the lowest-cost bronze plan for a 40-year-old with an income of $20,000 (166% of poverty), $25,000 (207% of poverty), $30,000 (249% of poverty), $35,000 (290% of poverty), and $40,000 (332% of poverty).
The map below shows counties where the unsubsidized premium for the lowest-cost gold plan has a lower or comparable premium to the lowest-cost silver plan in 2018.
The differences in premium changes across plan types and the peculiar effect these differences have on plan costs for both unsubsidized and subsidized enrollees makes it important that consumers shop around and carefully consider their options. Although CMS will no longer be paying insurers for reducing the cost sharing for lower-income enrollees, insurers remain obliged to provide the reduced cost sharing policies to eligible Marketplace enrollees. These policies generally have higher actuarial values than gold plans for enrollees with incomes below 200% of poverty so consumers will need to carefully consider whether it makes sense to switch even though gold-plan premiums may be comparable or less than silver plans. Consumers eligible for cost sharing reductions also will need to weigh the much lower premiums they would pay for a bronze plan with the much higher cost sharing they could encounter if they need care.
We analyzed data from the 2017 and 2018 Individual Market Medical files to determine premiums and the benchmark amounts to calculate premium tax credits for the scenarios presented. These files are available at data.healthcare.gov. The 2017 data were from the 2017 QHP Individual Market Medical file dated 8-11-2017. Premiums from the 12 state based marketplace are from a review of state rate filings and plan finders. California premium data were from 2018 and 2017 Product Prices for all Health Insurance Companies and Products by Zip Code files made available by Covered California. Massachusetts premium by zip code data in 2017 and 2018 were from Massachusetts Health Connector. Where premiums and benchmark amounts varied by zip code within a county, the benchmark for the majority of enrollees within the county was used.
The average changes in plan costs were weighted by county using 2017 plan selections obtained from the 2017 Marketplace Open Enrollment Period County-Level Public Use file provided by CMS and available here. In states running their own exchanges, we gathered county-level plan selection data where possible, and if unavailable estimated county plan selections based on the county population in the 2010 census and total state plan selections in the 2017 OEP State-Level Public Use File provided by CMS and available here. Massachusetts enrollment by zip code data in 2017 were from Massachusetts Health Connector, with adjustments made to match total state plan selections in 2017.
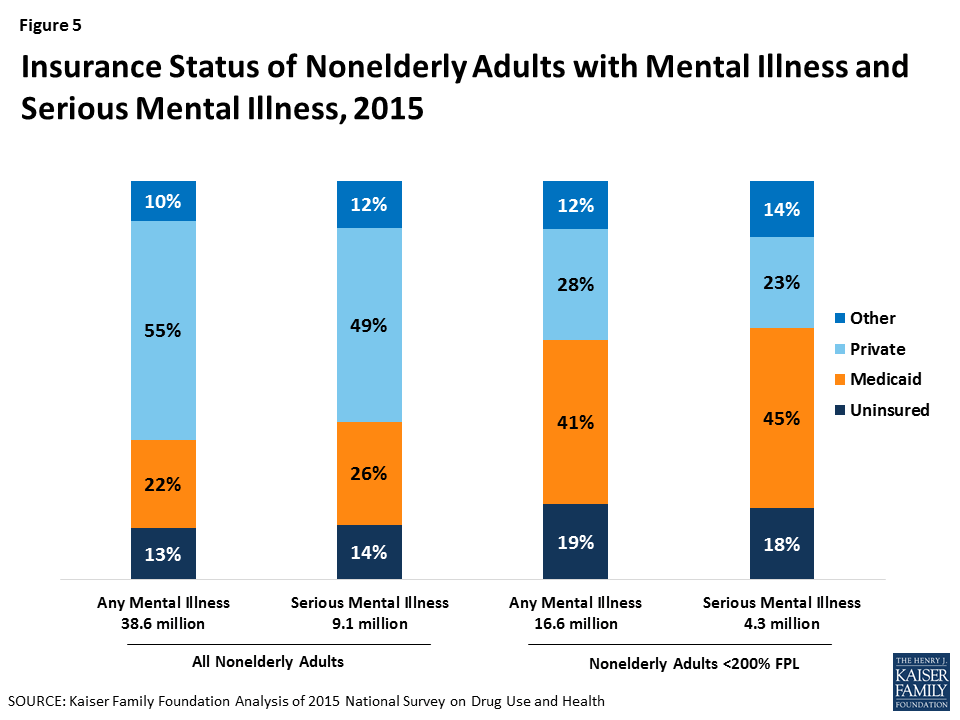
In 2015, over 43 million adults had a mental illness and nearly 10 million had a serious mental illness, such as depression, bipolar disorder, or schizophrenia. People with mental health conditions often have chronic medical conditions, significant health care services utilization, and barriers to employment, and are frequently involved with the criminal justice system.1 ,2 ,3 ,4 Medicaid plays an important role for individuals with mental health conditions, particularly among those with low incomes. In 2015, Medicaid covered 22% of nonelderly adults with mental illness and 26% of nonelderly adults with serious mental illness. The Medicaid program covers many inpatient and outpatient mental health services, such as psychiatric treatment, counseling, and prescription medications. Medicaid coverage of mental health services is often more comprehensive than private insurance coverage.
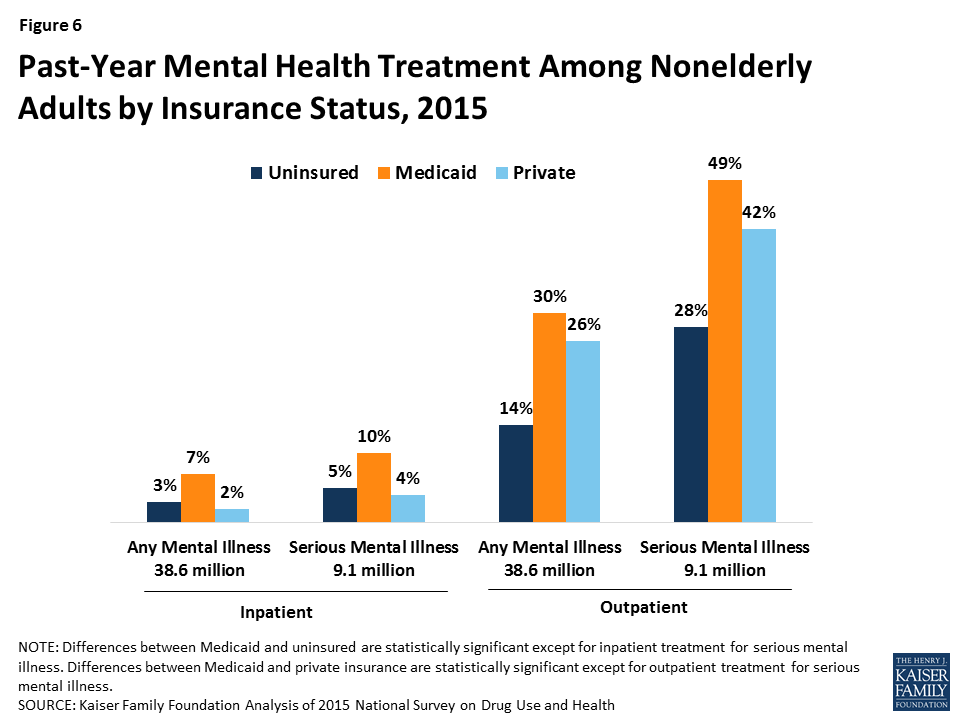
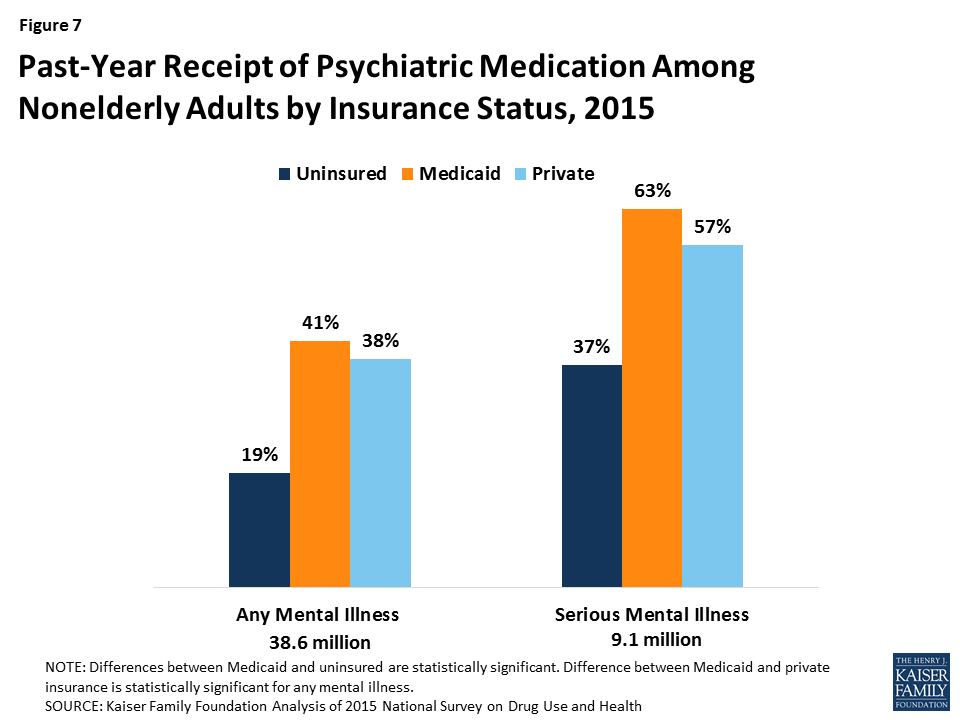
As of June 2017, 32 states have expanded Medicaid, with enhanced federal funding, to cover adults up to 138% of the federal poverty level ($16,643/year for an individual in 2017). The Medicaid expansion has enabled many low-income individuals with mental health conditions to obtain coverage and access treatment. The following series of graphics describes individuals with mental health conditions and compares mental health needs and receipt of services among individuals without insurance, with Medicaid, and with private insurance. The data show that utilization of mental health services among people with Medicaid is comparable to and sometimes greater than utilization among people with private insurance, while people who lack insurance often face difficulty obtaining services.
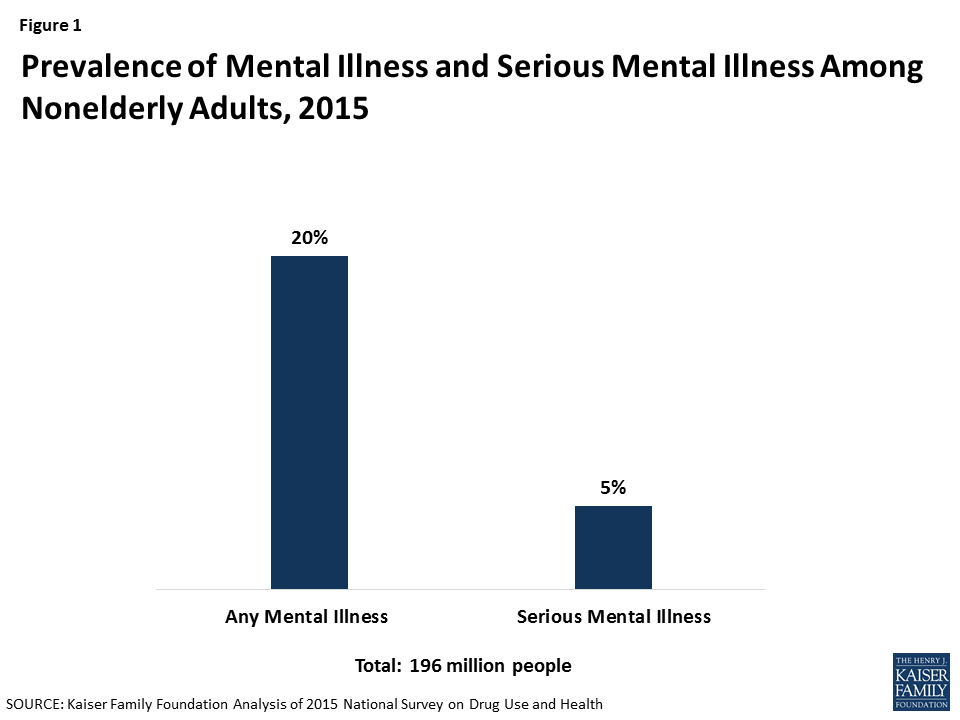
1. 20% of nonelderly adults have a mental illness and 5% have a serious mental illness.
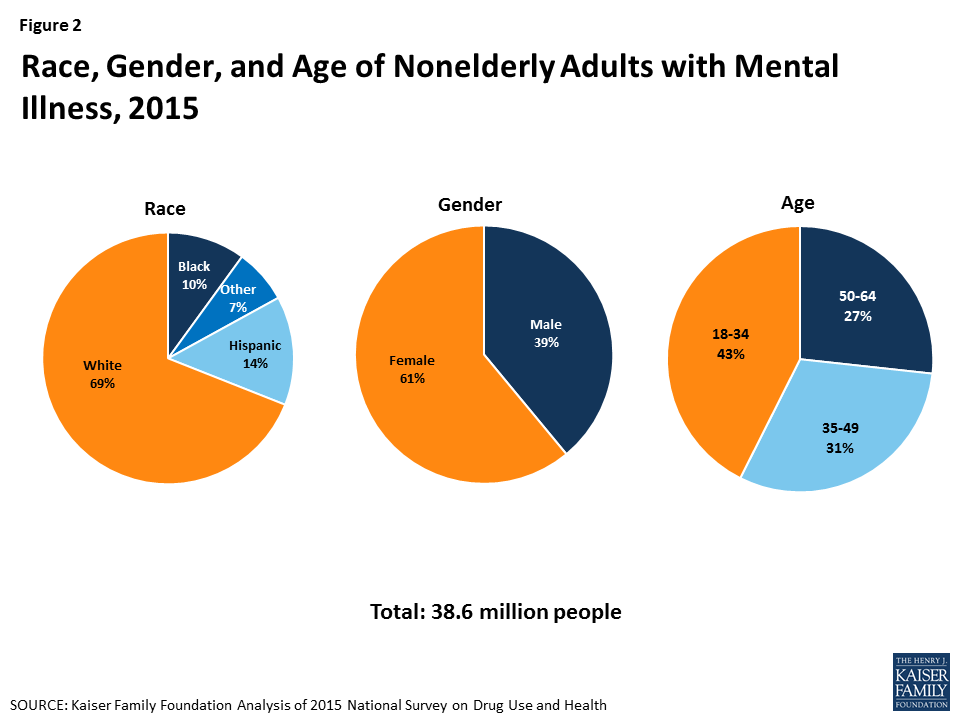
2. Nonelderly adults with mental illness are predominantly white, female, and under 50.
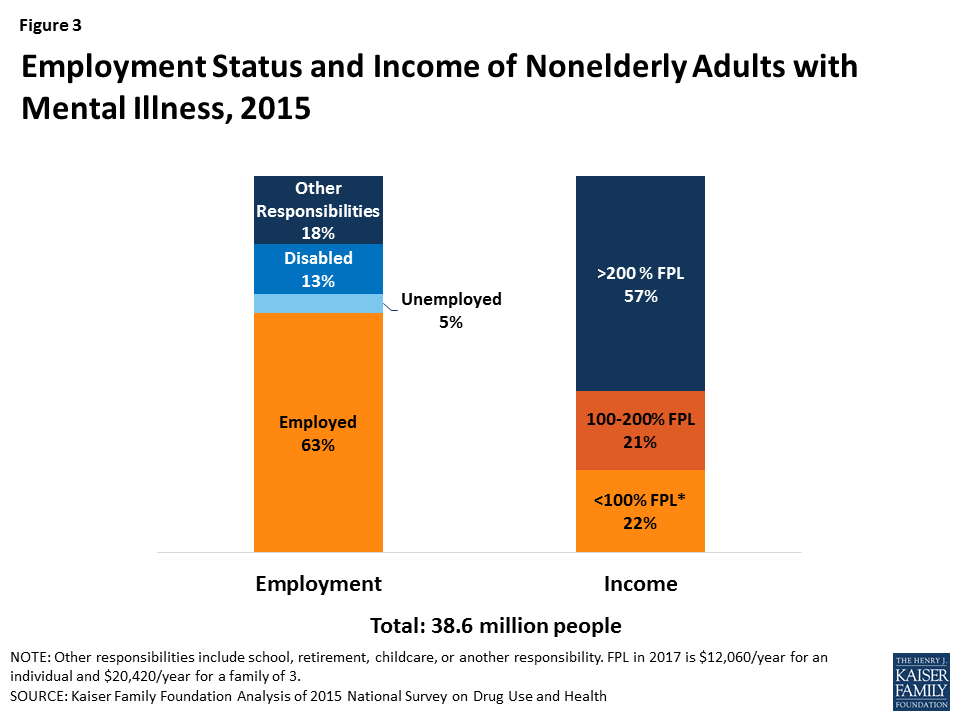
3. Most nonelderly adults with mental illness are employed (63%), but over 4 in 10 have low incomes, including 22% below poverty.
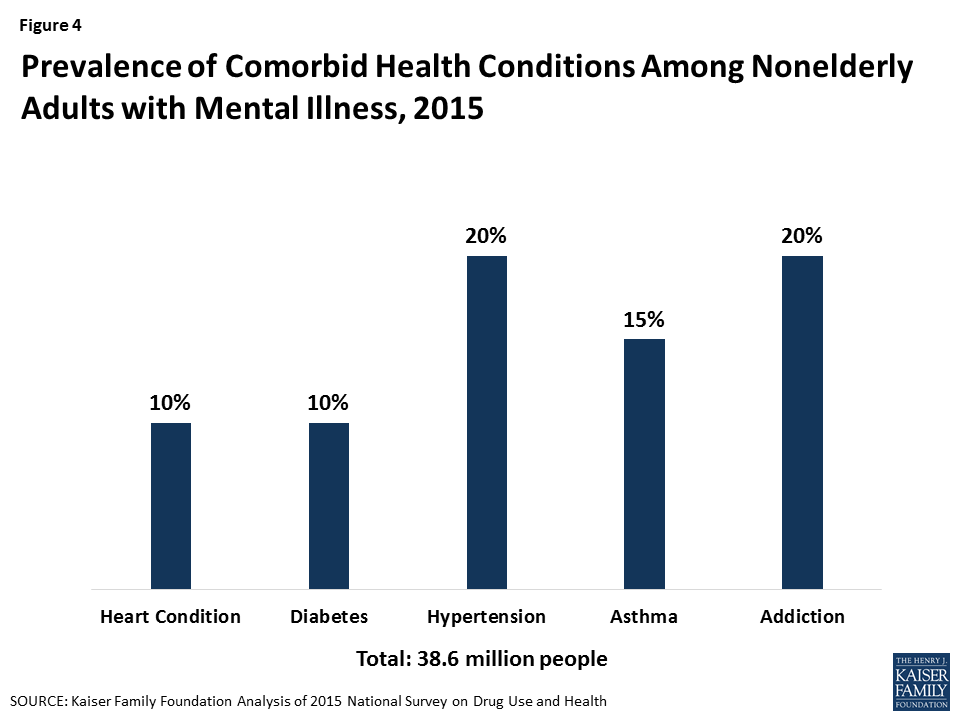
4. Nonelderly adults with mental illness often have co-morbid health conditions.
5. Most nonelderly adults with mental illness and serious mental illness have either Medicaid or private insurance, and Medicaid plays a particularly important role for those with low incomes.
6. Among nonelderly adults with mental illness and serious mental illness, those with Medicaid are more likely than those without insurance or with private insurance to receive treatment.
7. Receipt of psychiatric medication is also more common among nonelderly adults with Medicaid compared to those without insurance or with private insurance.
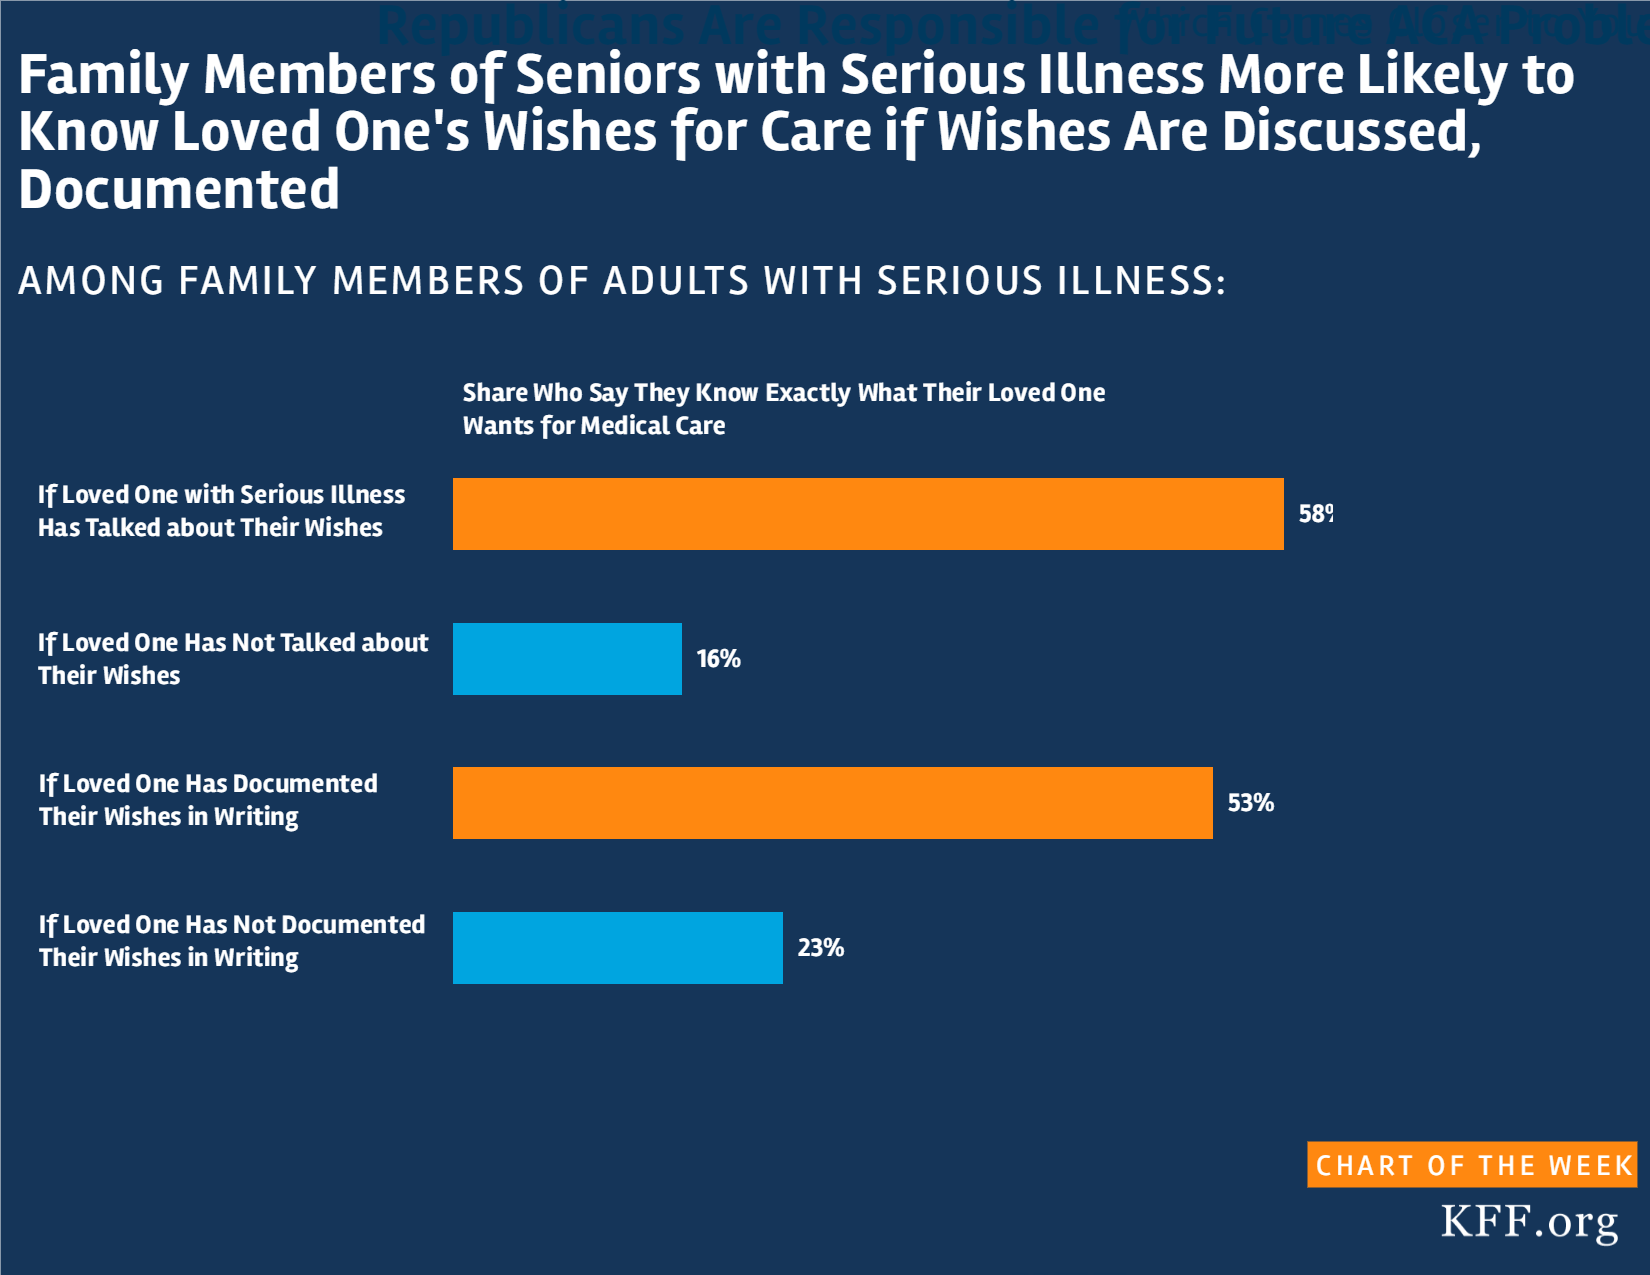
Kaiser Family Foundation Serious Illness in Late Life Survey (conducted May 4-July 12, 2017)
Social determinants, such as individual and community behaviors, economic circumstances, and environmental factors, can influence health costs and outcomes, despite being outside the control of the health system in some respects. This chart collection explores social determinants and health outcomes in the United States and similar countries. The collection looks at income inequality, obesity, and rates of insurance, as well as behaviors such as cigarette and alcohol consumption. Health outcomes, such as disease burden from drug abuse disorders and motor vehicle road injuries, also are examined, along with measures such as years of life lost due to firearms assaults and death rates from accidental poisonings.
The chart collection is part of the Peterson-KFF Health System Tracker, an online information hub dedicated to monitoring and assessing the performance of the U.S. health system.
In this November 2017 post for The JAMA Forum, Larry Levitt reviews the status of the Affordable Care Act following actions by the Trump administration widely perceived as designed to undermine the marketplaces. Despite assertions to the contrary, Levitt finds, “at least for now, the ACA seems very much alive.”
Other contributions to The JAMA Forum are also available.
Two months after Maria, a growing majority of Americans say that Puerto Ricans are not getting the help they need
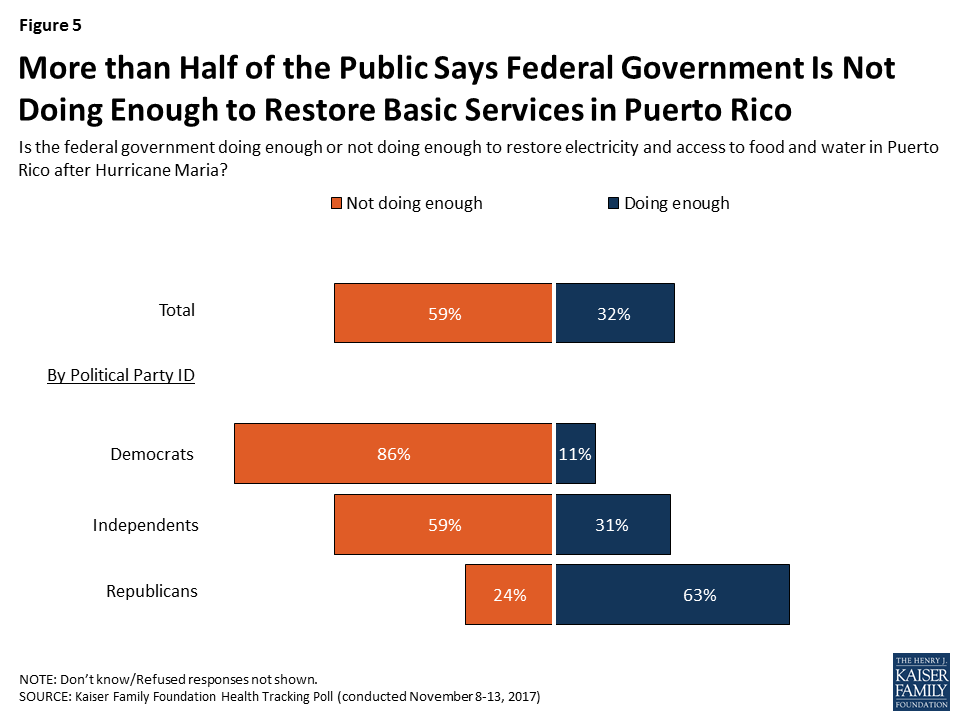
In an ongoing effort to track the public’s awareness and perceptions of the impact of Hurricane Maria on people in Puerto Rico, the November Kaiser Health Tracking poll finds that most of the public (63 percent) says they are closely following news about the recovery effort. Compared to last month, and now two months after the hurricane made landfall on the island, more of the public now says people in Puerto Rico are not yet getting needed help, rising from 62 percent in October to 70 percent this month. These views vary considerably by party, but this month half of Republicans (52 percent) also say people are not yet getting the help they need, up from 38 percent in October. Similarly, most of the public (59 percent) says the federal government is not doing enough to restore electricity and access to food and water in Puerto Rico; again, slightly higher than the share last month (52 percent). On this point, most Republicans (63 percent) feel the federal government is doing enough, while majorities of independents (59 percent) and Democrats (86 percent) feel it is not.
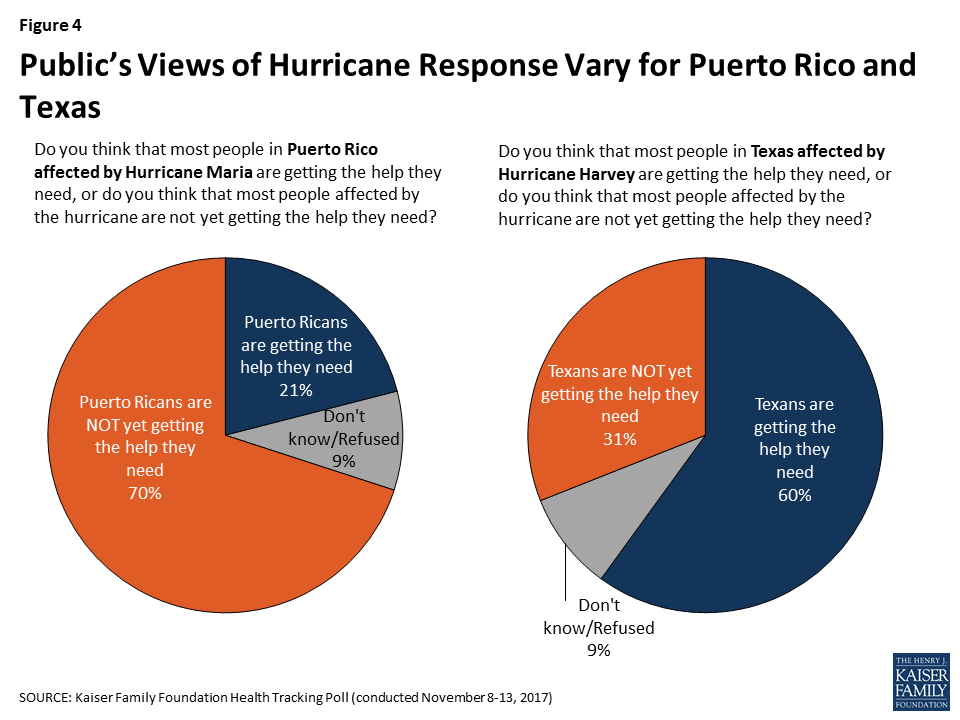
In addition to Puerto Rico, the Texas gulf coast and Houston areas are undergoing significant rebuilding and recovery efforts after Hurricane Harvey struck in late-August. As with Puerto Rico’s recovery effort, most of the public also reports closely following news about the recovery in the Houston area after Hurricane Harvey. However, unlike views on Puerto Rico, a majority, including majorities across parties, feel that Texans affected by Hurricane Harvey are getting the help they need (60 percent).
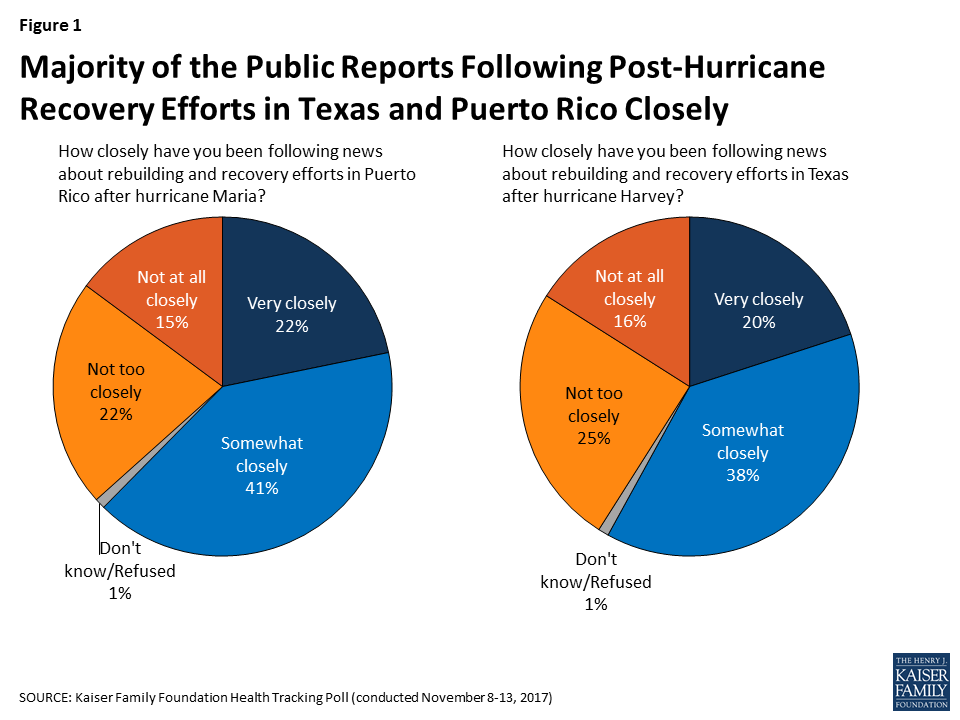
About two months after Hurricane Maria struck Puerto Rico causing massive damage to much of the island’s basic infrastructure, most Americans (63 percent) say they’re following news about the rebuilding and recovery efforts in Puerto Rico at least somewhat closely. In comparison, a similar share of the public says they are following recovery efforts in Texas after Hurricane Harvey struck the Houston area in late-August at least somewhat closely (58 percent).
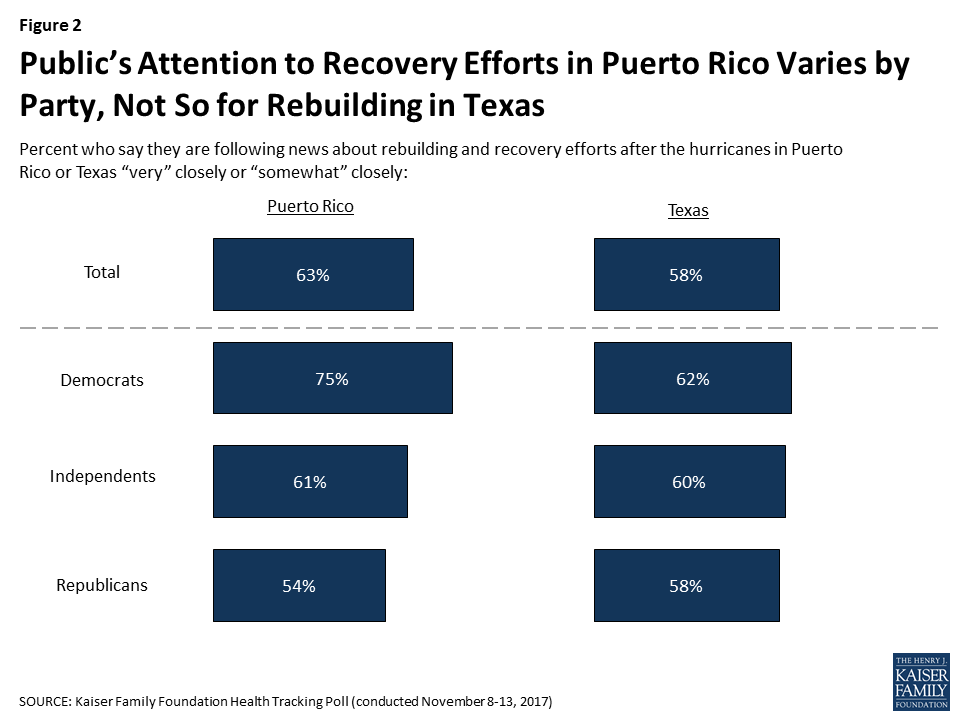
However, the share of the public that reports following news about Puerto Rico varies by party, with more Democrats (75 percent) saying they are closely following recovery efforts in Puerto Rico than independents (61 percent) and Republicans (54 percent). In contrast, there are no partisan differences for those following news about Texas; similar shares of Democrats (62 percent), independents (60 percent) and Republicans (58 percent) say they are closely following news about recovery from Hurricane Harvey.
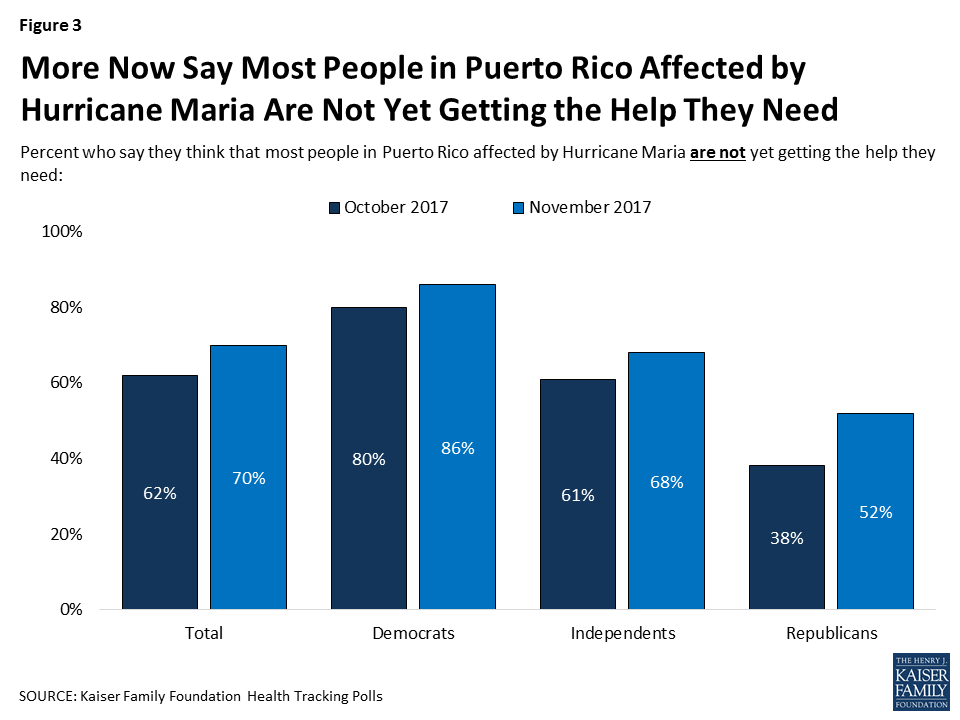
Seven in ten of the public feel that people in Puerto Rico are not yet getting the help they need, up from 62 percent in October 2017. These perceptions vary considerably by party, however half of Republicans (52 percent) now say Puerto Ricans aren’t yet getting needed help, up from 38 percent in October.
A Tale of Two Hurricanes: Most Americans say Texans are getting the help they need, but Puerto Ricans are not
On the other hand, the majority of public (60 percent) thinks people affected by Hurricane Harvey are getting the help they need. There is some variation by party, but it is not as stark as the partisan differences when asking about Puerto Rico. Overall, majorities of Democrats (54 percent), independents (61 percent), and Republicans (69 percent) say Texans affected by Hurricane Harvey are getting the help they need.
When asked whether the federal government is doing enough to restore electricity and access to food and water in Puerto Rico or not, a majority of the public (59 percent) says the federal government is not doing enough, including a majority of Democrats (86 percent) and independents (59 percent). On the other hand, most Republicans (63 percent) say the federal government is doing enough in Puerto Rico. Pessimism towards the federal government’s response has grown from 52 percent in October to 59 percent this month.
This Kaiser Health Tracking Poll was designed and analyzed by public opinion researchers at the Kaiser Family Foundation (KFF). The survey was conducted November 8th-13th 2017, among a nationally representative random digit dial telephone sample of 1,201 adults ages 18 and older, living in the United States, including Alaska and Hawaii (note: persons without a telephone could not be included in the random selection process). Computer-assisted telephone interviews conducted by landline (415) and cell phone (786, including 482 who had no landline telephone) were carried out in English and Spanish by SSRS of Media, PA. Both the random digit dial landline and cell phone samples were provided by Marketing Systems Group (MSG). For the landline sample, respondents were selected by asking for the youngest adult male or female currently at home based on a random rotation. If no one of that gender was available, interviewers asked to speak with the youngest adult of the opposite gender. For the cell phone sample, interviews were conducted with the adult who answered the phone. KFF paid for all costs associated with the survey.
The combined landline and cell phone sample was weighted to balance the sample demographics to match estimates for the national population using data from the Census Bureau’s 2016 American Community Survey (ACS) on sex, age, education, race, Hispanic origin, and region along with data from the 2010 Census on population density. The sample was also weighted to match current patterns of telephone use using data from the July-December 2016 National Health Interview Survey. The weight takes into account the fact that respondents with both a landline and cell phone have a higher probability of selection in the combined sample and also adjusts for the household size for the landline sample. All statistical tests of significance account for the effect of weighting.
The margin of sampling error including the design effect for the full sample is plus or minus 3 percentage points. Numbers of respondents and margins of sampling error for key subgroups are shown in the table below. For results based on other subgroups, the margin of sampling error may be higher. Sample sizes and margins of sampling error for other subgroups are available by request. Note that sampling error is only one of many potential sources of error in this or any other public opinion poll. Kaiser Family Foundation public opinion and survey research is a charter member of the Transparency Initiative of the American Association for Public Opinion Research.
| Group | N (unweighted) | M.O.S.E. |
| Total | 1,201 | ±3 percentage points |
| Party Identification | ||
| Democrats | 398 | ±6 percentage points |
| Republicans | 298 | ±7 percentage points |
| Independents | 392 | ±6 percentage points |