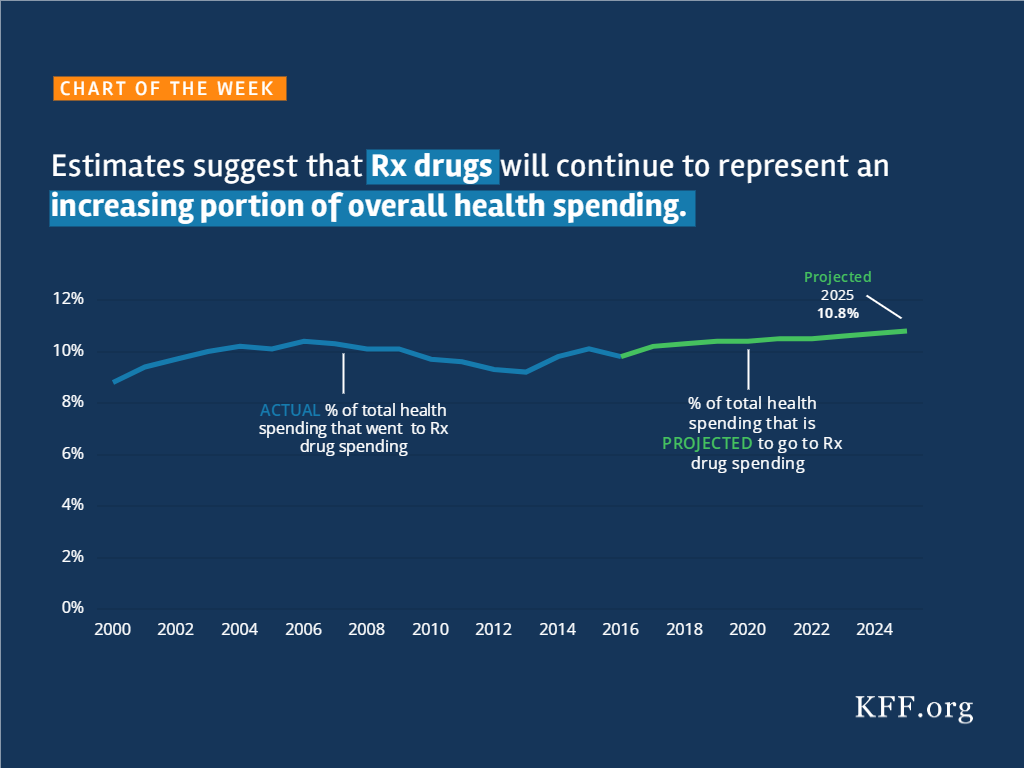
Estimates Suggest That Rx Drugs Will Continue to Represent an Increasing Portion of Overall Health Spending
Source
The independent source for health policy research, polling, and news.
Note: the DC federal district court issued a decision in Stewart v. Azar on June 29, 2018. See our explainer.
On January 11, 2018, the Centers for Medicare and Medicaid Services (CMS) issued a State Medicaid Director letter announcing a new policy that, for the 1st time, allows states to condition Medicaid on participation in a work or “community engagement” program. The next day, CMS approved a new Medicaid waiver in Kentucky. The waiver includes a program called Kentucky HEALTH, which encompasses a work requirement as well as coverage lockouts of up to 6 months for failure to pay monthly premiums (up to 4% of income), timely renew eligibility, or timely report a change in circumstances, among other provisions. Kentucky HEALTH applies to most nonelderly adults, including low-income parents and expansion adults. The state plans to implement Kentucky HEALTH by July, 2018. On January 24, 2018, 15 Kentucky Medicaid enrollees filed a lawsuit in the U.S. District Court for the District of Columbia challenging CMS’s authority to issue the work requirement policy and approve the Kentucky waiver. This issue brief answers 5 key questions about the case.1
A guide to the lawsuit challenging CMS’s approval of the #Kentucky HEALTH #Medicaid #waiver and its #workrequirements.
The complaint describes the 15 plaintiffs as “housekeepers and custodians, ministers and morticians, car repairmen, retired workers, students, church administrators, bank tellers, caregivers, and musicians.” They range in age from 20 to 62, and rely on Medicaid for services such as check-ups, treatment for chronic conditions such as diabetes and high blood pressure, mental health and substance use disorder counseling, prescription drugs, and vision and dental care. For example,
The defendants are the U.S. Department of Health and Human Services (HHS), CMS, and their principal officials, including the HHS Acting Secretary, the CMS Administrator and Principal Deputy Administrator, and the Director of the CMS Center for Medicaid and CHIP Services.
The plaintiffs are asking the court to declare that the work requirement policy and Kentucky’s waiver are illegal and cannot be implemented because they violate the Administrative Procedures Act (APA), the Medicaid provisions of the Social Security Act, and the President’s Constitutional duty to take care that laws are faithfully executed. The plaintiffs argue that HHS “bypass[ed] the legislative process and act[ed] unilaterally to ‘comprehensively transform’ Medicaid” using a “narrow statutory waiver authority” that has “effectively rewritten the statute.” The plaintiffs argue that the Kentucky waiver puts them at risk of losing Medicaid by creating new eligibility criteria that they contend are beyond HHS’s authority, such as the work requirement and the highest premiums ever permitted in Medicaid. In support, they cite Kentucky’s waiver application, which projects 95,000 fewer enrollees and $2.5 billion less in spending over five years.
The lawsuit challenges the Kentucky HEALTH program as a whole and several individual provisions, including the work requirement; premiums and associated coverage delays, penalties and lockout; increased cost-sharing for non-emergency use of the emergency room; coverage lockouts for failure to timely renew eligibility or report a change in circumstances; and elimination of retroactive coverage and non-emergency medical transportation. It also points out that the work requirement policy, on which the Kentucky waiver is based, was issued after the public comment period for the waiver closed.
CMS’s new policy explains that it is allowing waivers to test whether “requiring work or community engagement. . . will result in more beneficiaries being employed or engaging in other productive community engagement, thus producing improved health and well-being.” CMS has determined that programs “designed to promote better mental, physical, and emotional health” or, separately, “to help individuals and families rise out of poverty and attain independence” will further program objectives. CMS explains that there are other determinants of health in addition to high-quality health care and cites “a growing body of evidence suggest[ing] that targeting certain health determinants, including productive work and community engagement, may improve health outcomes.” The guidance acknowledges that “[t]his is a shift from prior agency policy” but maintains that “it is anchored in historic CMS principles that emphasize work to promote health and well-being.” For example, CMS cites the Medicaid buy-in option, which expands financial eligibility to enable working people with disabilities to maintain coverage, and the option to provide supported employment services to people with disabilities, although “receipt of these supports is not a condition of eligibility or coverage.”
In a letter accompanying the Kentucky waiver, CMS explains that the waiver is “likely to assist in improving health outcomes;. . . address behavioral and social factors that influence health outcomes;. . . incentivize beneficiaries to engage in their own health care and achieve better health outcomes; and. . . familiarize beneficiaries with a benefit design that is typical of what they may encounter in the commercial market and thereby facilitate smoother beneficiary transition to commercial coverage.”
HHS relied on its authority under Section 1115 of the Social Security Act to issue the work requirement policy and the Kentucky waiver. Section 1115 permits the HHS Secretary to waive certain provisions of federal Medicaid law to allow states to undertake experimental, pilot or demonstration projects that the Secretary determines will further program objectives. Under the APA, the court will review the administrative record to determine if HHS acted lawfully. The court can set aside agency action that is “arbitrary, capricious, an abuse of discretion, or otherwise not in accordance with law,” contrary to the Constitution, outside the scope of the agency’s statutory authority, issued without required procedures, unsupported by substantial evidence, or unwarranted by the facts.2 The court might consider whether the work policy and the Kentucky waiver qualify as an experiment; whether the Secretary exceeded his authority when determining that the new policies further Medicaid objectives; whether the new policies are supported by evidence in the administrative record; and whether the work policy should have been issued using formal notice and comment rule-making.
The defendants have 60 days to respond to the complaint. They also need to file with the court the administrative record that forms the basis of the agency’s decisions. The plaintiffs are seeking to have the case certified as a class action on behalf of all Kentucky residents enrolled in Medicaid on or after January 12, 2018, a group that they anticipate numbers in the hundreds of thousands. The plaintiffs also are asking the court for a preliminary injunction, which would prevent implementation of the work policy and the Kentucky waiver until a final decision in the case.
While the Kentucky lawsuit proceeds, there are currently 9 other states (AR, AZ, IN, KS, ME, MS, NH, UT, & WI) with pending waiver applications seeking work requirements for expansion adults and/or low-income parents. Policymakers and other stakeholders in these states will be watching the Kentucky case to see how CMS responds to the complaint and what the court decides and waiting to see whether CMS approves more waivers with work requirements, on what terms, and whether litigation follows in other states.
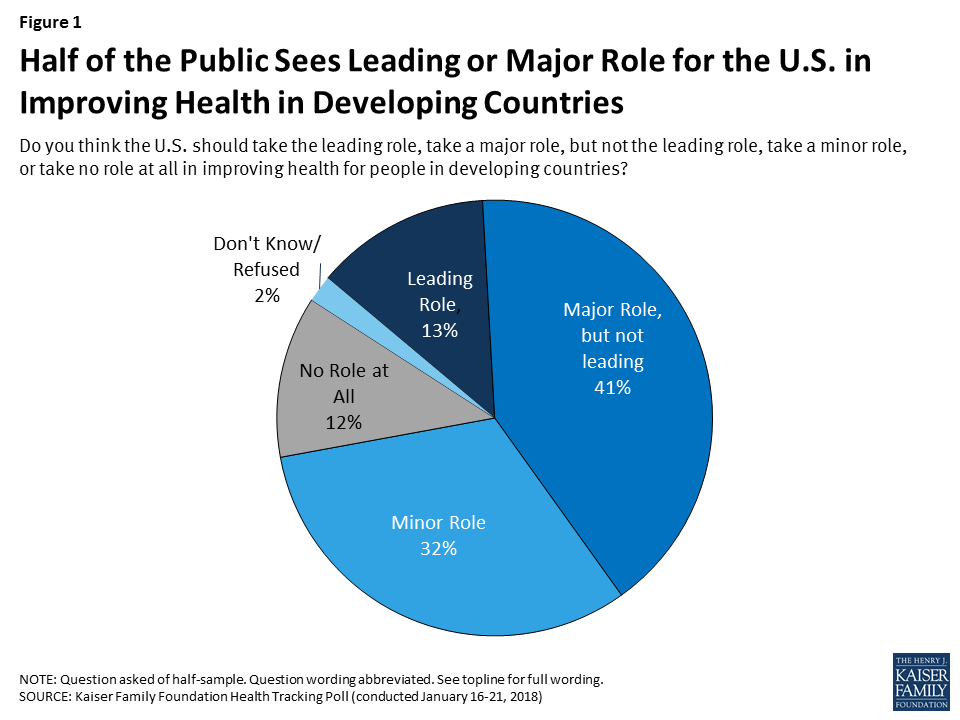
A new Kaiser Family Foundation issue brief assessing global health policy one year after President Trump took office finds half of Americans (54%) say they want the U.S. to play a major or leading role in improving health for people in developing countries, though support for such engagement is strongest among Democrats (73%) and lower among independents (47%) and Republicans (49%). The brief identifies a mix of challenges to U.S. global health policy, some of which pre-dated President Trump and some of which are the result of decisions and actions of the Administration.
Overall public support fell slightly from the last time the Foundation polled on this issue in 2016, when 61 percent said they think the U.S. should take a leading or major role.
Most of the public (59%) believes the U.S. is spending the right amount or too little on global health programs, but one-third (33%) believe the U.S. is spending too much – a significant increase from the 18 percent saying the U.S. was spending too much in 2016. Fifty-three percent say the Trump Administration has made global health a lower priority than previous administrations.
Against this backdrop of broad public support, the Trump Administration has instituted a number of notable changes in broader U.S. foreign policy that emphasize U.S. interests and affect global health, and in the area of global health specifically, proposed steep budget cuts and implemented policy changes, including the reinstatement and expansion of the Mexico City Policy. However, U.S. global health funding has so far been buoyed by strong bipartisan support from Congress and key stakeholders.
Looking ahead, the U.S. global health policy issues to watch for in 2018 and beyond include the soon-to-be released White House budget request for FY 2019, amidst ongoing budget pressures and concerns about the U.S. deficit; continuing implementation of the Mexico City Policy; decisions around the next phase of the President’s Emergency Plan for AIDS Relief; and the future of the Global Health Security Agenda, among others.
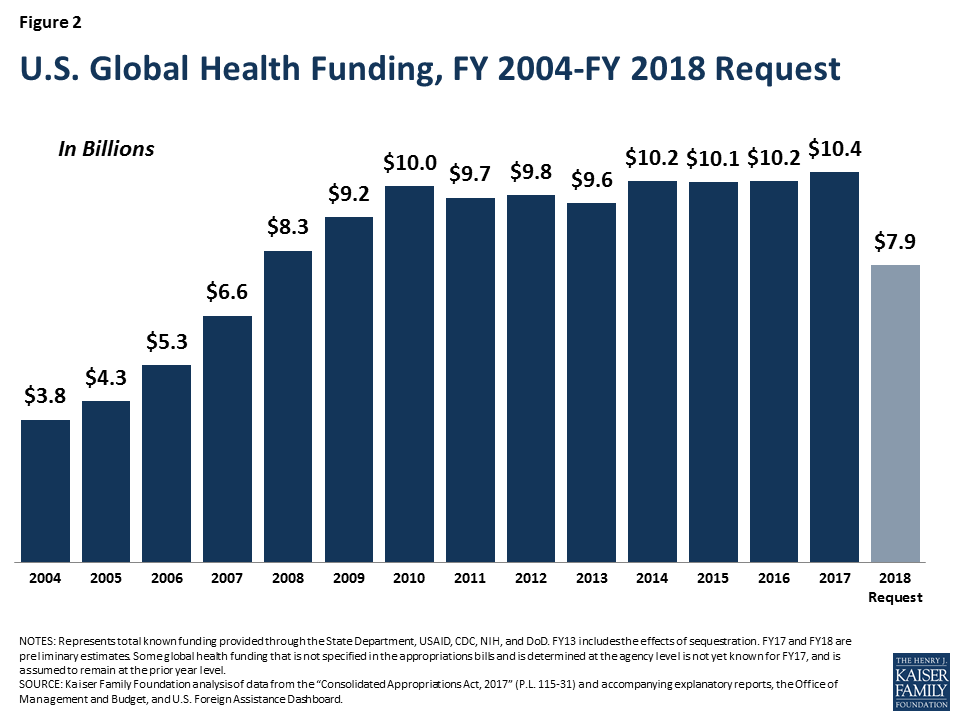
This month marks one year since Donald Trump became the 45th President of the United States after winning the election on a populist, “America-First”, platform. Since then, there have been many questions raised about what a Trump Presidency would mean for U.S. global health policy in light of statements on scaling back foreign aid and a skepticism of the value of multilateral institutions and key international agreements. Historically, global health has enjoyed bipartisan support and been highlighted as a major area of success for the United States. Funding for global health rose significantly in the last decade and, although it has leveled off, it still represents the largest component of U.S. foreign assistance (an estimated 24% in FY 2017).
In this brief, we take stock of the U.S. global health response on the occasion of one year of the Trump Presidency and look ahead to the global health policy issues that are likely to be front and center in the coming months and years. Overall, there are a mix of challenges facing the U.S. global health response, some of which pre-dated Trump and others that are the result of decisions and actions of the administration, including proposals to significantly scale back funding. At the same time, global health programs still enjoy strong bipartisan support in Congress and, according to our just-released poll, about half of the public still wants the U.S. to play a major or leading role in improving health in developing countries (see Figure 1 and Appendix).
In keeping with the “America First” campaign and promises to re-examine the U.S. role in world affairs, the Trump Administration has made a number of notable changes in broader U.S. foreign policy that affect global health. These include the administration’s decision to withdraw from the Paris Climate Accord, its criticism of and new demands for U.S. engagement in the context of international trade agreements such as the Trans-Pacific Partnership (TPP) and North American Free Trade Agreement (NAFTA), and skepticism of, and intent to reduce U.S. support for the United Nations and potentially other multilateral organizations. More recently, the administration has proposed to cut foreign aid to countries that voted counter to U.S. government wishes at the UN. While this threat is not without precedent, it is a departure from U.S. policy over the prior two decades, and underscores the administration’s theme of emphasizing U.S. interests over other considerations.
The Trump Administration has also sought to make its mark on the agencies that carry out U.S. foreign policy, including the State Department and the U.S. Agency for International Development (USAID). Following a March 2017 White House Executive Order on reorganizing the executive branch, Secretary of State Rex Tillerson has attempted to re-organize and reform these agencies. One potential move that was feared by many was the idea of “merging” USAID and the State Department – the two currently exist as quasi-independent – but to date there is no evidence of such a change being actively pursued. At the same time, budget requests from the White House have demonstrated the administration’s desire to make significant cuts to these agencies’ budgets, and their day-to-day management has been criticized by current and former employees. In addition, there has been decidedly slow progress in nominating and appointing staff for key foreign policy leadership posts, along with a notable exodus of experienced staff over the last year. For example, as of this writing, President Trump had nominated far fewer candidates at the State Department (89) compared to Presidents Obama (137) and George W Bush (153) at the same point in their first terms.
And, whereas human rights has been a component of U.S. foreign policy that the Obama Administration sought to elevate in its foreign policy (even including it prominently in its national security strategy), Trump Administration officials have downplayed the importance of human rights, leading to worries in the foreign policy and development community, and letters of concern from members of Congress.
A lack of ambassadors in some countries, needed staff appointments in some positions, a shifting stance on human rights, and a shrinking foreign policy workforce have concerning implications for planning and carrying out U.S. global health programs. Such difficulties for global health have been compounded by certain policy decisions, including proposals to significantly cut U.S. global health funding (see Figure 2).
The most concrete global health policy change of the administration to date came on the first Monday of President Trump’s term, in the form of a re-instatement and expansion of the Mexico City Policy. The Policy, which was in effect and applied to family planning assistance in previous Republican administrations, was not only re-instated but also expanded to encompass almost all global health assistance, increasing the number of organizations and the amount of funding affected by the policy. We found the expanded policy applies to more than $7 billion in funding and likely affects more than one thousand foreign NGOs. In addition, on March 30 the administration invoked the “Kemp-Kasten amendment” to withhold funding for the United Nations Population Fund (UNFPA), the lead U.N. agency focused on global population and reproductive health, as has been done in previous Republican administrations.
The administration’s request to significantly cut global health funding is unprecedented. For FY2018 the White House proposed cuts of over $2B to global health, representing a 23% overall reduction compared to FY2017; these included a proposed reduction to PEPFAR of more than $1 billion and a zeroing out of the family planning budget, among others. Multiple analyses of the potential impacts of such cuts conclude that serious negative health consequences would result, including many more infections and deaths from HIV and TB, and an increase in the number of abortions along with greater maternal mortality. None of these requested cuts have been enacted but this is the first time cuts of this magnitude have been proposed, and they mark a significant shift from the direction and emphasis of prior administrations.
Even as they have implemented more restrictive policies and proposed cuts, Trump Administration officials have publicly stated support for select U.S. global health priorities. In his first major speech to the United Nations in September, for example, President Trump highlighted three major U.S. global health areas of success: PEPFAR, the President’s Malaria Initiative, and the Global Health Security Agenda (GHSA). Secretary of State Tillerson has also spoken about the importance of PEPFAR and the GHSA; the U.S. has signaled its intention to remain engaged in the larger GHSA effort, and has even highlighted the importance of global health security in the newly revised U.S. National Security Strategy, and is expected to do the same in a forthcoming national biodefense strategy. Despite the foreign policy vacancies noted above, some global health and development leaders have remained in their roles since the Obama Administration, including the U.S. Global AIDS Coordinator and the Director of the National Institutes of Health, while other key positions have been filled by President Trump, including the new USAID Administrator who has a strong record in global health, the Director of the Centers for Disease Control and Prevention, and leadership on global health within the White House National Security Council.
Congress has also continued to play a significant role in global health, including bipartisan and bicameral push back against proposed funding cuts. Funding for global health was kept at FY 2017 levels and, while not yet final, will likely be level in FY2018 as well. Moreover, Congress has asserted its role in directing global health efforts by including, for the first time, language in the FY 2017 budget legislation that prevents the administration from changing global health program funding levels. Congress also included language requiring a report before any reorganization of State and USAID could occur. Many stakeholders, including current and former U.S officials, the faith community, and members of the military, have also pushed back on the administration’s proposed cuts to global health and development.
Our latest (January 2018) tracking poll assessed public support for U.S. engagement in global health in the Trump era. The public perceives the Trump Administration as less supportive of global health, with half (53%) saying the Trump Administration has made global health a lower priority than previous administrations.
As mentioned above, about half of the public (54%) say they want the U.S. to play a leading or major role in improving health for people in developing countries. Support for such engagement is strongest among Democrats (73%), who also are more likely to support the U.S. playing “a leading role” (20%), and lower among independents (47%) and Republicans (49%), see Figure 3; Trump supporters are not interested in the U.S. playing a leading role (just 4% say they believe this). However, overall support fell slightly from 2016, when 61% said they think the U.S. should take a leading or major role.

Most of the public (59%) believe the U.S. is spending the right amount or not enough on global health programs, but one-third (33%) believe the U.S. is spending too much – a significant jump from the 18% saying we were spending too much in 2016.
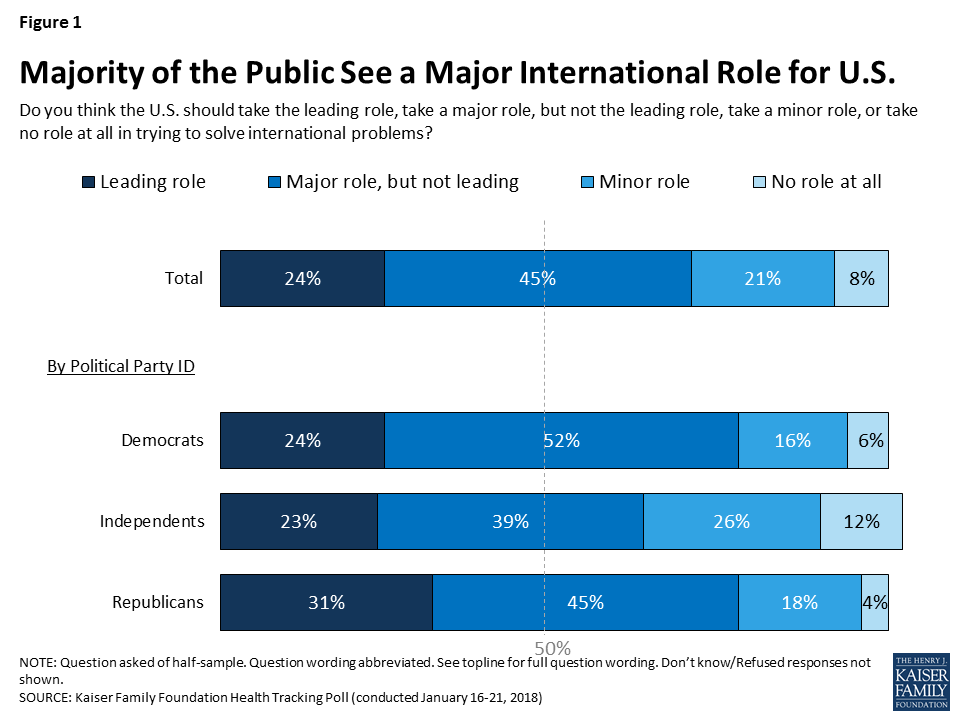
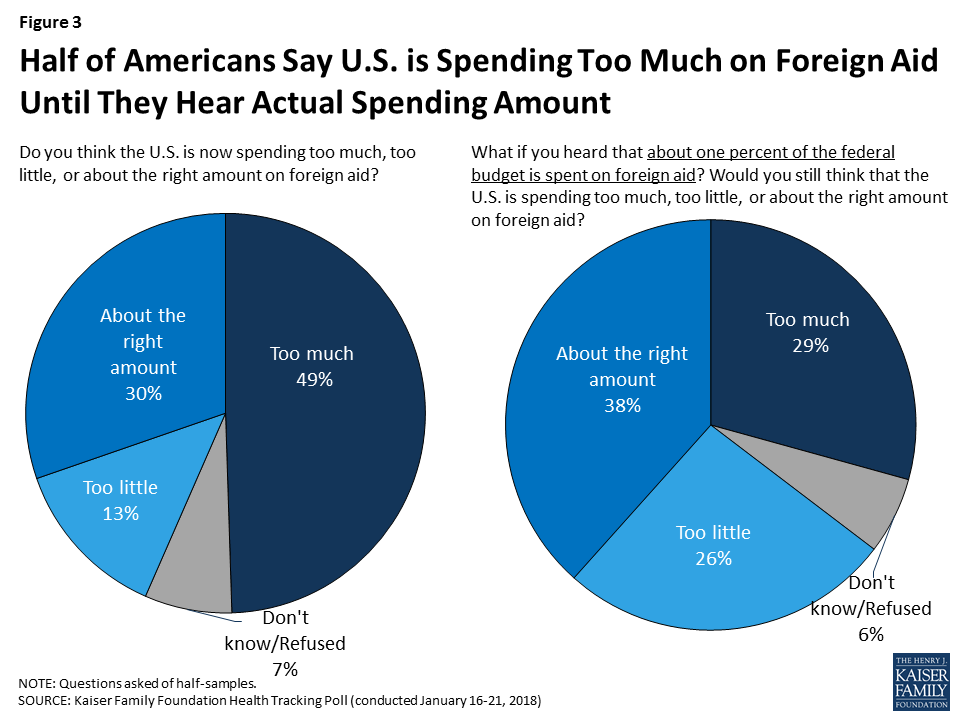
For overall global engagement, the poll numbers indicate a greater proportion of the U.S. public (69%) now believes the U.S. should take at least a major role in solving the world’s problems than in 2016 (57%). The share of Republicans agreeing with this statement grew from 20% in 2016 to 31% in 2018. However, confusion about the amount spent on U.S. foreign aid persists, with half (49%) saying too much is spent in this area but when presented with the actual amount – about 1% of the federal budget goes to foreign aid – people are much less likely (29%) to view that as too much spending (as found in previous polls). See Appendix and poll results for more detailed information.
The push and pull in global health policy will likely continue in 2018 and potentially intensify. On the one hand, actions taken by the administration signal a reduced U.S. engagement in the world and intention to step back further in global health. On the other, U.S. global health programs have so far demonstrated resilience, buoyed by strong support from Congress and key stakeholders.
The tension will likely be tested again in the near term with the soon-to-be released FY 19 White House budget request, which many expect to propose at least the same level of deep cuts to global health. Negotiations will take place within the broader context of greater budget pressures and concerns about the deficit, particularly in wake of recently enacted tax legislation that could tighten discretionary spending, including for foreign assistance, even more.
Beyond that, there will be a number of other issues to watch, including:
The key question going forward, then, may very well be which vision of global health will end up holding sway in the political back-and-forth in Washington – that of the White House or Congress? Ultimately, the winners, or losers, of this “battle” will be the people that benefit from U.S. investments around the world.
The January 2018 Kaiser Health Tracking Poll examines the public’s perceptions and attitudes about the role of the United States in efforts to improve health for people in developing countries.
The survey finds that a majority of the public (69 percent), including most Democrats (76 percent), Republicans (76 percent), and independents (62 percent), think the U.S. should take a major or leading role in solving international problems.
About half the public (54 percent), including 73 percent of Democrats and around half of independents (47 percent) and Republicans (49 percent), say the U.S. should take a leading or major role in improving health for people in developing countries. About four in ten (41 percent) Trump supporters say the U.S. should take a leading or major role in improving health in developing countries, compared to two-thirds of those who do not approve of President Trump’s job performance.

The poll finds half of the public (49 percent) say that the U.S. is now spending “too much” on foreign aid, while 13 percent say the U.S. is spending “too little” and three in ten say the U.S. is spending “about the right amount.” Yet, after hearing that foreign aid spending is actually about one percent of the federal budget, the share of the public who say spending is “too much” decreases from 49 percent to 29 percent.
Most of the public (59 percent) believes the U.S. is spending “about the right amount” or “too little” on global health programs, but one-third (33%) believe the U.S. is spending “too much” – a significant increase from the 18 percent saying the U.S. was spending “too much” in 2016, the last year the Foundation polled on this issue, but more similar to previous years’ polling.

About half of the public (53 percent) believe President Trump and his administration have made improving health for people in developing countries a “lower priority” compared to previous administrations, and about one-third (36 percent) say the priority level has been “about the same.” Few (5 percent) say the Trump administration has made it a “higher priority.” When asked how they would like to see President Trump and his administration prioritize improving health for people in developing countries, four in ten Americans (43 percent) say President Trump’s current priority level is “about right.”

Health care costs are a substantial and growing burden for many people on Medicare and are projected to consume a larger share of total income over time, according to a new analysis from the Kaiser Family Foundation.
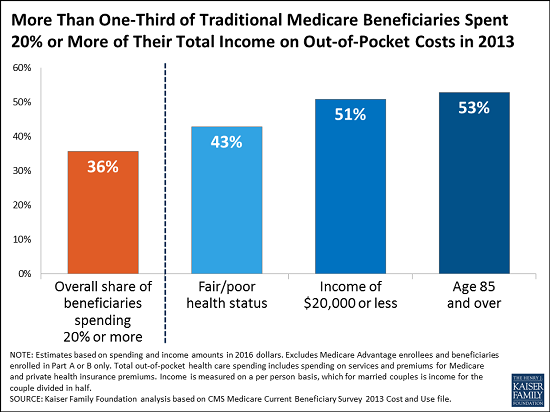
The study, Medicare Beneficiaries’ Out-of-Pocket Health Care Spending as a Share of Income Now and Projections for the Future, finds that more one-third of people with traditional Medicare spent at least 20 percent of their total income on out-of-pocket health care costs in 2013. That included premiums, deductibles and cost sharing for Medicare-covered services, as well as spending on services not covered by Medicare, such as dental and long-term care. The analysis of spending as a share of total income does not include enrollees in Medicare Advantage plans, who account for 19 million of the 59 million people with Medicare. Income is measured on a per person basis, which for married couples is income for the couple divided in half.
While some people with Medicare face relatively low out-of-pocket costs, the financial burden can be especially large for beneficiaries with modest incomes and significant medical needs. For instance, among beneficiaries in traditional Medicare, just over half with incomes below $20,000 and those ages 85 and over spent at least 20 percent of their total income on health expenditures in 2013, along with more than 4 in 10 beneficiaries in fair or poor health status.
Among all Medicare beneficiaries, out-of-pocket costs consumed 41 percent of beneficiaries’ per person Social Security income in 2013, on average. Older women and beneficiaries ages 85 and older tended to have higher average out-of-pocket spending as a share of average Social Security income than others, according to the analysis.
The analysis projects that the health care spending burden among Medicare beneficiaries will rise over time. By 2030, the study projects that under current policies 42 percent of people with traditional Medicare will spend 20 percent of their total income or more on health care costs. Among all people with Medicare, out-of-pocket costs are projected to consume half of the average per person Social Security benefit by 2030.
With rising health care costs representing a growing challenge to the financial security of older adults, these findings have implications for policies that could shift costs on to beneficiaries as part of a broader effort to reduce federal spending on Medicare, Medicaid or Social Security.
Medicaid provides health insurance for over 80 million Americans, including pregnant women, low-income parents, children, seniors, and people with disabilities, while Supplemental Security Income (SSI) is a monthly cash payment to help low-income people with disabilities pay for housing, food, and other basic needs. SSI does not include health insurance, but people who receive SSI generally automatically qualify for Medicaid. SSI enrollees are a subset of all Medicaid enrollees with disabilities. People who receive SSI cash assistance must meet stringent income, asset, and medical eligibility criteria. Many people with disabilities do not receive cash assistance from SSI but still qualify for health insurance from Medicaid through other eligibility pathways.
Proponents of Medicaid work requirements often describe these policies as applying to “able-bodied” adults. Recent guidance from the Centers for Medicare and Medicaid Services (CMS), allowing states for the first time to condition Medicaid eligibility on meeting a work requirement, permits states to target only people who are “eligible on a basis other than disability.” Kentucky’s waiver, the first to include a work requirement (referred to as community engagement),1 applies to Medicaid expansion adults and traditional adults, including low-income parents. As of mid-January, 2018, nine other states have submitted waiver proposals to CMS seeking work requirements (AR, AZ, IN, KS, ME, MS, NH, UT, and WI).
Although the CMS work guidance excludes people who are eligible for Medicaid based on a disability, many adults with disabilities will face Medicaid work requirements because they are eligible for Medicaid on another basis. While Medicaid work requirements could apply to all expansion adults and/or low-income parents, this issue brief focuses on the subset of those with disabilities because they may have difficulty meeting the work requirement or obtaining an exemption due to their health needs. We examine the implications of work requirements for nonelderly Medicaid adults with disabilities who do not receive SSI (referred to as non-SSI adults with disabilities) and compare their work status and functional limitations to those who do receive SSI. The Appendix contains 50-state data.
Three in 10 nonelderly adults with Medicaid report having a disability, according to data from the American Community Survey (ACS) (Figure 1). The ACS classifies a person as having a disability if the person reports serious difficulty with hearing, vision, cognitive functioning (concentrating, remembering, or making decisions), mobility (walking or climbing stairs), self-care (dressing or bathing), or independent living (doing errands, such as visiting a doctor’s office or shopping, alone).2 The ACS definition of disability is intended to capture whether a person has a functional limitation that results in a participation limitation and is similar to measures used in other federal surveys, such as the National Health Interview Survey.
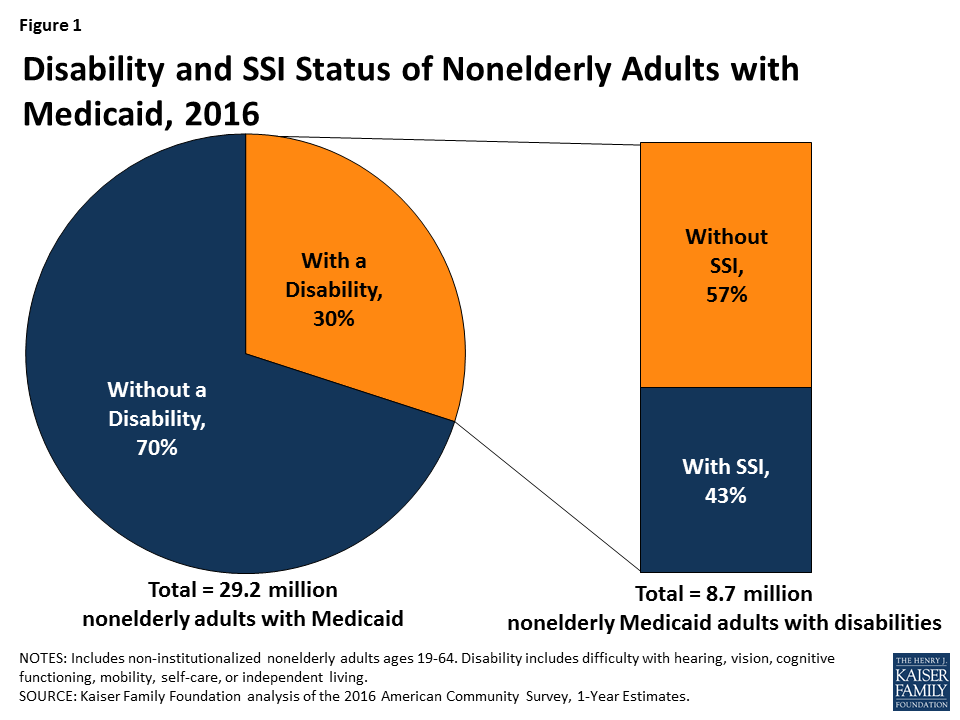
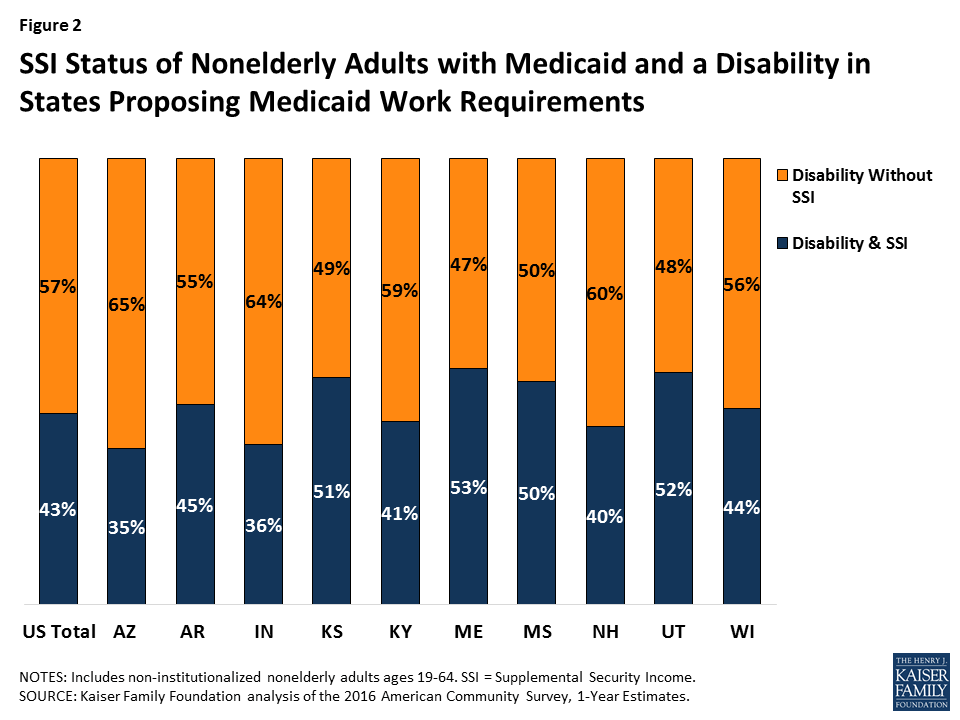
Despite reporting serious difficulty in at least one ACS functional area, nearly six in 10 (57%) nonelderly Medicaid adults have a disability but do not receive SSI cash assistance (Figure 1). Box 1 below provides an overview of SSI eligibility criteria and the various Medicaid eligibility pathways available to people with disabilities. Many of the nonelderly Medicaid adults with disabilities in Kentucky and the nine states with work requirement proposals do not receive SSI (Figure 2 and Appendix Table 1). The share of nonelderly Medicaid adults with a disability who do not receive SSI in these states ranges from 47 percent in Maine to 65 percent in Arkansas.
Box 1: SSI vs. Medicaid Eligibility Criteria for People with Disabilities
In order to qualify for SSI, individuals must have low incomes, limited assets, and an impaired ability to work at a substantial gainful level as a result of old age or significant disability. The SSI disability standard is more stringent than the ACS definition of disability, which requires serious difficulty in at least one of the six functional areas described above. In addition, SSI income and asset limits are more restrictive than those required for Medicaid expansion adults and many optional disability-related Medicaid coverage pathways.3 People who meet the ACS definition of disability but do not receive SSI can be eligible for Medicaid as expansion adults or Section 1931 parents (based solely on their low income). They also may be eligible for Medicaid through an optional disability-related pathway (such as the state option to cover people with disabilities up to the federal poverty level or a home and community-based services waiver).4
Despite reporting functional limitations, non-SSI adults with disabilities are more than three times as likely to be in the workforce than adults with disabilities who receive SSI (Figure 3). Less than one-quarter (23%) of non-SSI adults with disabilities work, compared to about seven percent of adults with disabilities who receive SSI (Figure 3). About one in five (19%) non-SSI adults with disabilities usually work 20 or more hours per week in the weeks they work, and another four percent usually work less than 20 hours per week (Figure 3). For comparison, Kentucky’s waiver requires non-exempt enrollees to work 80 hours per month (equivalent to 20 hours per week). Appendix Table 2 contains state-level data on the work status and usual hours worked for non-SSI adults with disabilities.
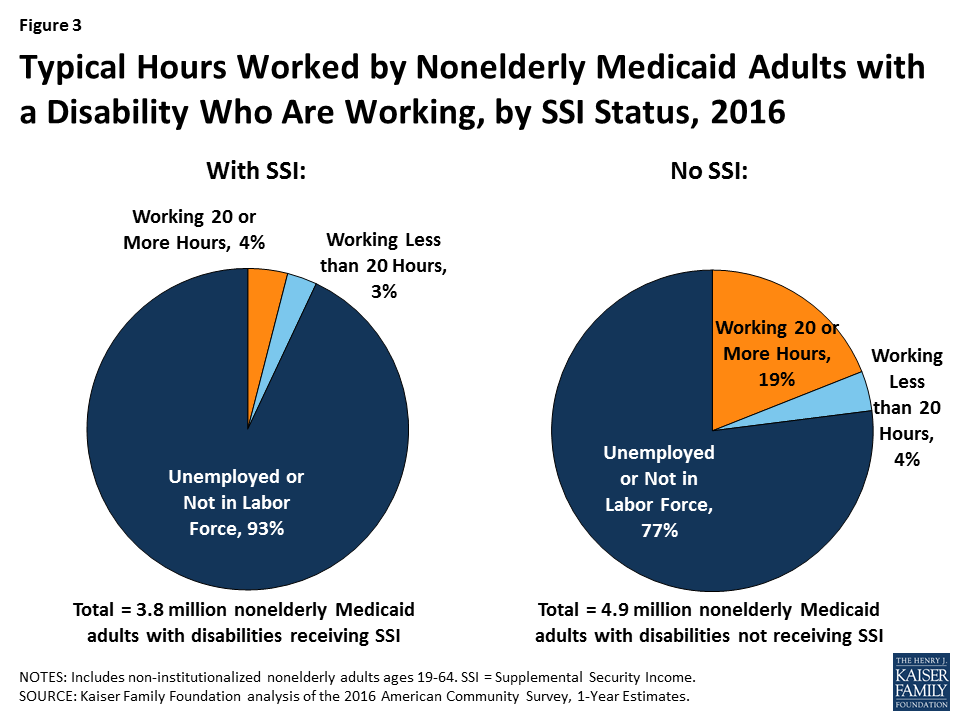
Over three-quarters (77%) of non-SSI adults with disabilities are not in the workforce (77%) (not working or unemployed but looking for work) (Figure 3). Their absence from the workforce is likely at least in part due to the serious functional difficulties they report in areas such as cognitive functioning, mobility, self-care, and independent living, as described above.
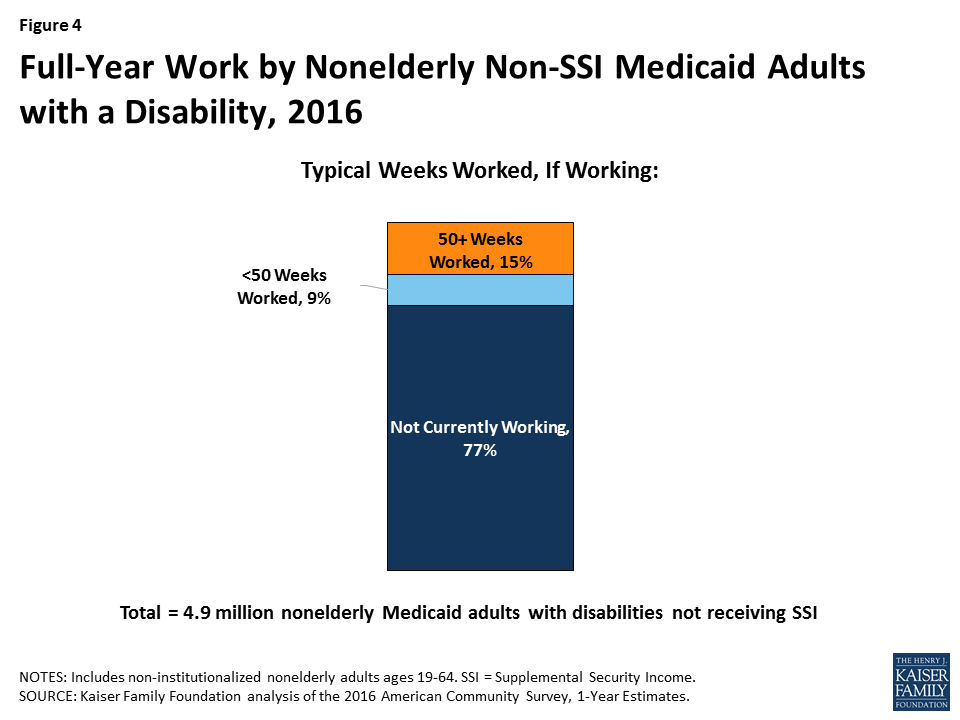
Among those who are working, 15 percent of non-SSI adults with disabilities typically are working for the full year (50 or more weeks) (Figure 4). Another nine percent are working, but typically for less than the entire year. People with disabilities may experience health issues related to their disability that prevent them from working consistently over time or from working every week.
Nonelderly Medicaid adults with a disability may have health problems that limit their ability to work, or to work full-time, even though their needs do not rise to the stringent SSI level. Over half of non-SSI adults with disabilities report serious difficulty with mobility (52%), and a majority (51%) report serious difficulty with cognitive functioning (Figure 5). Over two in five (42%) non-SSI adults with disabilities report serious difficulty with independent living tasks, such as visiting a doctor’s office or shopping alone. Over one in five (21%) non-SSI adults with disabilities report serious difficulty with self-care tasks, such as dressing or bathing. Smaller shares report serious difficulty with vision (18%) and hearing (14%), compared to the other limitations that make up the ACS disability definition.
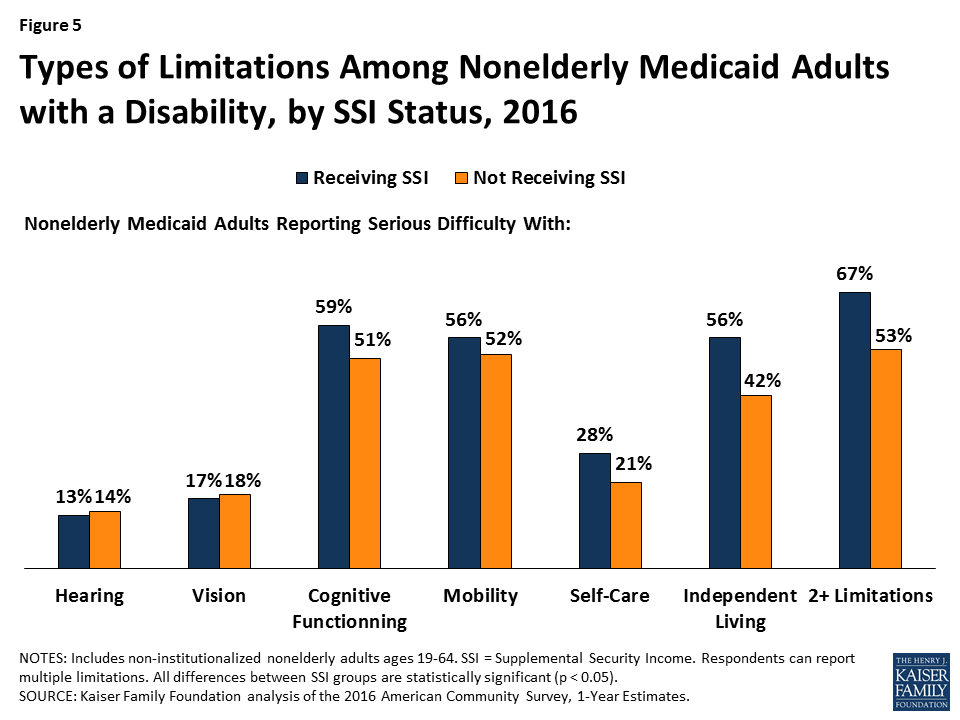
Most nonelderly Medicaid adults with a disability have multiple functional limitations. Over half (53%) of those without SSI have two or more of the six ACS functional limitations, compared to two-thirds (67%) of those with SSI (Figure 5).
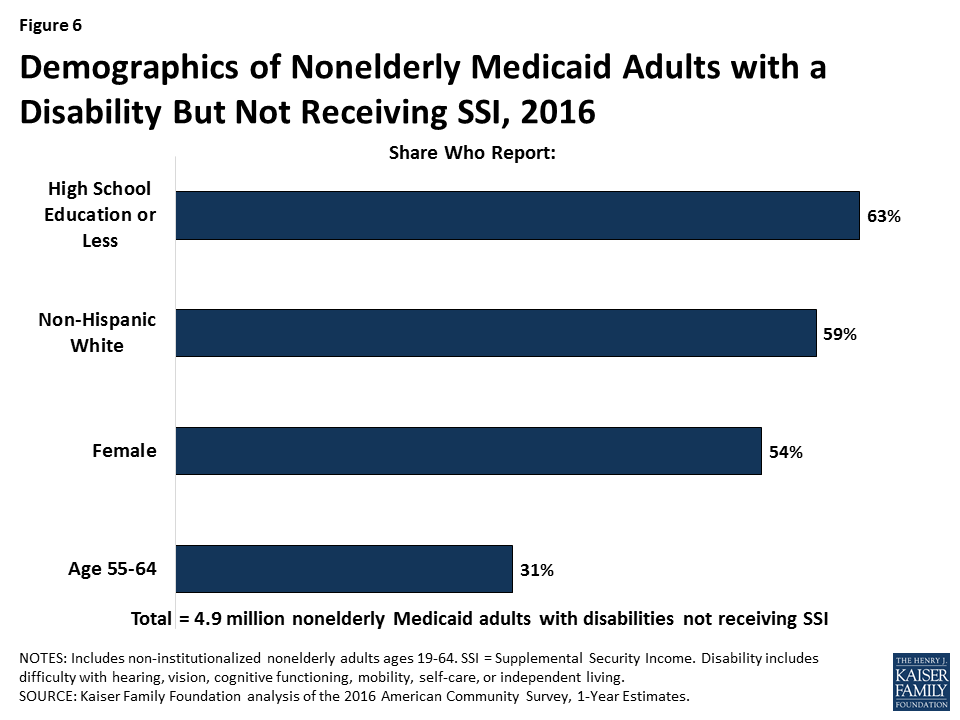
Over six in 10 (63%) non-SSI adults with disabilities have a high school education or less, a factor that could create additional barriers to meeting a work requirement (Figure 6). About six in 10 (59%) non-SSI adults are non-Hispanic white, 54 percent are female, and more than three in 10 (31%) are ages 55 to 64 (Figure 6).
If they are not exempted, waivers that condition Medicaid eligibility on meeting a work requirement could adversely impact people with disabilities who have limitations that interfere with their ability to work but do not rise to the stringent SSI level of disability. While Kentucky’s waiver does not apply to people who receive SSI or other people who are eligible for Medicaid “based on a disability,” 59 percent of nonelderly Medicaid adults with disabilities in Kentucky do not receive SSI; this share is 57 percent nationally and ranges from 47 percent to 65 percent in the nine states with pending work requirement waivers.
Kentucky’s waiver requires people who are determined to be “medically frail” to be exempt from the work requirement, but there is no detail about how that process will be administered or whether all people with serious functional difficulties that impede their ability to work will qualify for an exemption. People who are classified as “medically frail” also will be exempt from other waiver provisions that can result in the loss of coverage, including the six-month coverage lockouts for failure to pay premiums (for those above 100% FPL), failure to timely renew eligibility, and failure to timely report a change in circumstances that affects eligibility.5 Kentucky’s waiver also requires the state to provide exemptions or reasonable modifications to the work requirement and other program rules under the Americans with Disabilities Act (ADA), Section 504 of the Rehabilitation Act, and Section 1557 of the ACA to assist people with disabilities and prevent eligible people from losing coverage.
Experience in TANF shows that work requirements can result in people with disabilities losing benefits for which they are eligible. Key issues to watch to determine the impact of Medicaid work requirement waivers on people with disabilities include whether states will have adequate staff, money, and administrative capacity to implement complex program rules; whether the medical frailty process will correctly identify and exempt all people who cannot comply with a work requirement because of a disability; what types of reasonable modifications and support services the state will provide under the ADA to enable people with disabilities to comply; how many people with disabilities will lose coverage for which they remain eligible; and whether they are able to successfully use the appeals process to regain or prevent lapses in coverage.
| Appendix Table 1: Nonelderly Medicaid Adults by Disability and SSI Status, 2016 | |||||
| Total Nonelderly Medicaid Adults | Nonelderly Medicaid Adults with a Disability | Nonelderly Medicaid Adults with a Disability but Not SSI | |||
| Number | Share of Total Nonelderly Medicaid Adults | Number | Share of Nonelderly Medicaid Adults with a Disability | ||
| United States Total | 29,177,700 | 8,661,500 | 30% | 4,900,400 | 57% |
| Alabama | 326,800 | 143,900 | 44% | 64,300 | 45% |
| Alaska | 57,900 | 18,600 | 32% | 10,500 | 56% |
| Arizona | 765,900 | 200,300 | 26% | 130,100 | 65% |
| Arkansas | 324,300 | 117,000 | 36% | 63,900 | 55% |
| California | 5,187,300 | 1,018,900 | 20% | 612,500 | 60% |
| Colorado | 511,300 | 124,500 | 24% | 81,800 | 66% |
| Connecticut | 363,800 | 83,100 | 23% | 56,500 | 68% |
| Delaware | 88,500 | 24,700 | 28% | 14,000 | 57% |
| DC | 105,300 | 28,500 | 27% | 19,100 | 67% |
| Florida | 1,410,100 | 480,400 | 34% | 234,600 | 49% |
| Georgia | 563,900 | 227,900 | 40% | 99,200 | 44% |
| Hawaii | 112,200 | 22,700 | 20% | 13,300 | 58% |
| Idaho | 85,200 | 38,500 | 45% | 15,200 | 39% |
| Illinois | 1,186,200 | 299,800 | 25% | 191,400 | 64% |
| Indiana | 499,200 | 184,500 | 37% | 118,400 | 64% |
| Iowa | 272,300 | 82,200 | 30% | 49,500 | 60% |
| Kansas | 123,800 | 56,400 | 46% | 27,500 | 49% |
| Kentucky | 615,200 | 217,800 | 35% | 129,300 | 59% |
| Louisiana | 461,400 | 176,300 | 38% | 90,300 | 51% |
| Maine | 120,400 | 55,500 | 46% | 26,300 | 47% |
| Maryland | 493,900 | 140,500 | 28% | 82,100 | 58% |
| Massachusetts | 902,000 | 218,600 | 24% | 128,100 | 59% |
| Michigan | 1,144,800 | 381,800 | 33% | 220,700 | 58% |
| Minnesota | 491,200 | 127,200 | 26% | 82,200 | 65% |
| Mississippi | 246,200 | 108,200 | 44% | 53,800 | 50% |
| Missouri | 311,400 | 146,800 | 47% | 88,100 | 60% |
| Montana | 90,100 | 35,700 | 40% | 21,600 | 60% |
| Nebraska | 71,100 | 32,000 | 45% | 15,000 | 47% |
| Nevada | 256,300 | 73,500 | 29% | 46,200 | 63% |
| New Hampshire | 80,300 | 26,100 | 33% | 15,800 | 60% |
| New Jersey | 694,600 | 171,900 | 25% | 90,100 | 52% |
| New Mexico | 325,300 | 84,800 | 26% | 49,900 | 59% |
| New York | 2,721,500 | 592,900 | 22% | 342,900 | 58% |
| North Carolina | 642,300 | 245,300 | 38% | 126,700 | 52% |
| North Dakota | 35,600 | 14,900 | 42% | 9,900 | 66% |
| Ohio | 1,224,600 | 373,800 | 31% | 241,400 | 65% |
| Oklahoma | 201,600 | 92,300 | 46% | 52,300 | 57% |
| Oregon | 498,000 | 144,100 | 29% | 92,900 | 64% |
| Pennsylvania | 1,185,100 | 439,700 | 37% | 259,500 | 59% |
| Rhode Island | 120,600 | 42,200 | 35% | 18,800 | 45% |
| South Carolina | 354,000 | 137,700 | 39% | 69,000 | 50% |
| South Dakota | 37,300 | 15,300 | 41% | 7,800 | 51% |
| Tennessee | 592,400 | 228,200 | 39% | 117,700 | 52% |
| Texas | 1,247,200 | 513,700 | 41% | 231,200 | 45% |
| Utah | 128,600 | 46,800 | 36% | 22,300 | 48% |
| Vermont | 85,600 | 24,300 | 28% | 12,900 | 53% |
| Virginia | 330,000 | 130,300 | 39% | 72,400 | 56% |
| Washington | 727,400 | 219,000 | 30% | 136,600 | 62% |
| West Virginia | 277,000 | 98,100 | 35% | 60,800 | 62% |
| Wisconsin | 452,600 | 142,500 | 31% | 79,500 | 56% |
| Wyoming | 28,200 | 11,600 | 41% | 4,800 | 41% |
| NOTES: Includes non-institutionalized nonelderly adults ages 19-64. SSI = Supplemental Security Income. Disability includes serious difficulty with hearing, vision, cognitive functioning, mobility, self-care, or independent living.SOURCE: Kaiser Family Foundation analysis based on the 2016 American Community Survey, 1-Year Estimates. | |||||
| Appendix Table 2: Work Status of Nonelderly Medicaid Adults with a Disability but Not SSI, 2016 | ||||||
| Total Non-SSI Medicaid Adults with Disabilities | Total Working | Share Working | Share Working 20+ Hours/Week | Share Working <20 Hours/Week | Share Unemployed or Not in Labor Force | |
| United States Total | 4,900,400 | 1,150,800 | 23% | 19% | 4% | 77% |
| Alabama | 64,300 | 6,700 | 10% | 9% | 2% | 90% |
| Alaska | 10,500 | 2,700 | 26% | 21% | * | 74% |
| Arizona | 130,100 | 30,500 | 23% | 19% | 4% | 77% |
| Arkansas | 63,900 | 14,000 | 22% | 19% | 3% | 78% |
| California | 612,500 | 156,200 | 26% | 22% | 4% | 74% |
| Colorado | 81,800 | 22,600 | 28% | 22% | 5% | 72% |
| Connecticut | 56,500 | 12,600 | 22% | 19% | 3% | 78% |
| Delaware | 14,000 | 3,800 | 27% | 19% | * | 73% |
| DC | 19,100 | 4,100 | 21% | 20% | * | 79% |
| Florida | 234,600 | 42,400 | 18% | 16% | 2% | 82% |
| Georgia | 99,200 | 17,100 | 17% | 15% | 3% | 83% |
| Hawaii | 13,300 | 2,600 | 20% | 16% | * | 80% |
| Idaho | 15,200 | 3,600 | 24% | 17% | * | 76% |
| Illinois | 191,400 | 41,700 | 22% | 18% | 4% | 78% |
| Indiana | 118,400 | 26,700 | 23% | 19% | 4% | 77% |
| Iowa | 49,500 | 17,100 | 34% | 25% | 9% | 66% |
| Kansas | 27,500 | 7,600 | 28% | 22% | * | 72% |
| Kentucky | 129,300 | 31,100 | 24% | 22% | 2% | 76% |
| Louisiana | 90,300 | 17,200 | 19% | 16% | 3% | 81% |
| Maine | 26,300 | 4,200 | 16% | 12% | * | 84% |
| Maryland | 82,100 | 23,500 | 29% | 25% | 4% | 71% |
| Massachusetts | 128,100 | 37,700 | 29% | 24% | 5% | 71% |
| Michigan | 220,700 | 55,400 | 25% | 20% | 5% | 75% |
| Minnesota | 82,200 | 30,900 | 38% | 28% | 9% | 62% |
| Mississippi | 53,800 | 7,000 | 13% | 11% | * | 87% |
| Missouri | 88,100 | 12,800 | 15% | 12% | 3% | 85% |
| Montana | 21,600 | 6,400 | 30% | 22% | * | 70% |
| Nebraska | 15,000 | 4,400 | 29% | 25% | * | 71% |
| Nevada | 46,200 | 9,500 | 20% | 17% | 4% | 80% |
| New Hampshire | 15,800 | 3,500 | 23% | 20% | * | 77% |
| New Jersey | 90,100 | 21,200 | 24% | 19% | 5% | 76% |
| New Mexico | 49,900 | 12,000 | 24% | 21% | * | 76% |
| New York | 342,900 | 90,800 | 26% | 22% | 4% | 74% |
| North Carolina | 126,700 | 22,500 | 18% | 14% | 4% | 82% |
| North Dakota | 9,900 | * | 38% | * | * | 62% |
| Ohio | 241,400 | 62,500 | 26% | 21% | 5% | 74% |
| Oklahoma | 52,300 | 8,800 | 17% | 15% | * | 83% |
| Oregon | 92,900 | 29,200 | 31% | 26% | 6% | 69% |
| Pennsylvania | 259,500 | 62,200 | 24% | 19% | 5% | 76% |
| Rhode Island | 18,800 | 5,900 | 31% | 27% | * | 69% |
| South Carolina | 69,000 | 12,100 | 17% | 15% | * | 83% |
| South Dakota | 7,800 | 3,400 | 44% | 30% | * | 56% |
| Tennessee | 117,700 | 23,500 | 20% | 18% | 2% | 80% |
| Texas | 231,200 | 49,100 | 21% | 17% | 4% | 79% |
| Utah | 22,300 | 6,500 | 29% | 25% | * | 71% |
| Vermont | 12,900 | 4,100 | 32% | 28% | * | 68% |
| Virginia | 72,400 | 13,600 | 19% | 16% | * | 81% |
| Washington | 136,600 | 31,800 | 23% | 18% | 6% | 77% |
| West Virginia | 60,800 | 11,900 | 20% | 16% | 3% | 80% |
| Wisconsin | 79,500 | 19,400 | 24% | 20% | 5% | 76% |
| Wyoming | 4,800 | 1,200 | 24% | 19% | * | 76% |
| NOTES: Includes non-institutionalized nonelderly adults ages 19-64. SSI = Supplemental Security Income. Disability = serious difficulty with hearing, vision, cognitive functioning, mobility, self-care, or independent living.* indicates data do not meet standards of statistical reliability to report.SOURCE: Kaiser Family Foundation analysis based on the 2016 American Community Survey, 1-Year Estimates. | ||||||
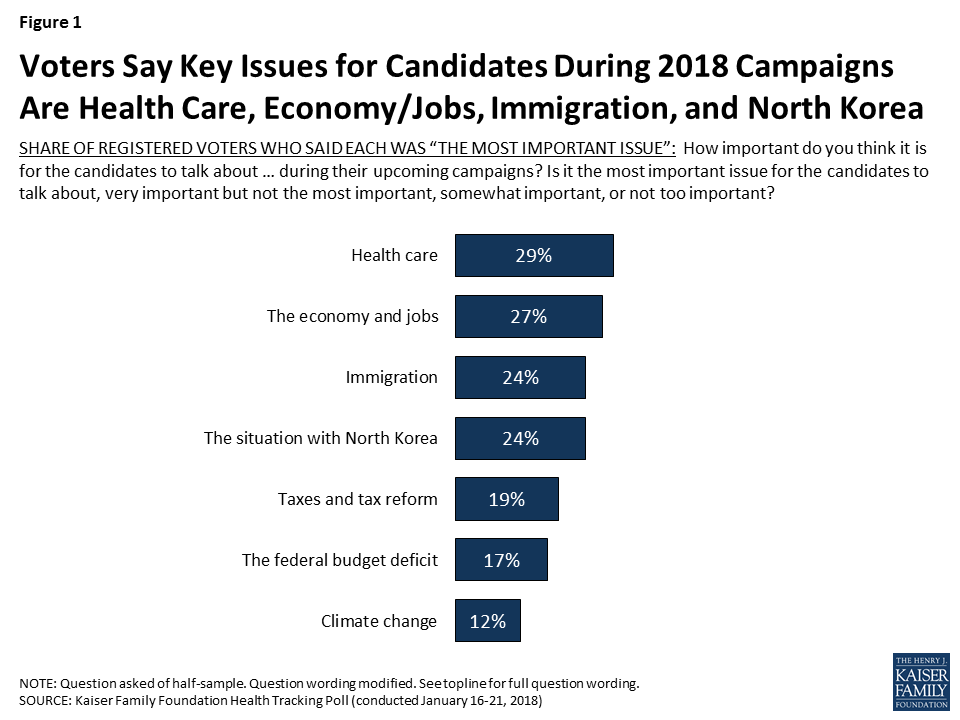
With the 2018 midterm elections still about ten months away, the January Kaiser Health Tracking Poll finds health care among the top issues American voters want 2018 candidates to talk about during their upcoming campaigns. When asked how important a series of major national issues are for 2018 congressional candidates to talk about, similar shares of registered voters say health care (29 percent) and the economy and jobs (27 percent) are “the most important issue.” This is closely followed by immigration (24 percent) and the situation in North Korea (24 percent). Fewer registered voters say “the most important issue” for congressional candidates to discuss are taxes and tax reform (19 percent), the federal budget deficit (17 percent), and climate change (12 percent).
Democratic voters are more focused on health care (39 percent) than Republican voters (13 percent), while one-third of independent voters (32 percent) say health care is the “most important issue” for congressional candidates to talk about during their campaigns. For Republican voters, the top issue they want to hear congressional candidates talk about is the situation with North Korea (31 percent), followed by immigration (27 percent) and the economy and jobs (25 percent).
| Table 1: Views of Top Issues for 2018 Candidates by Party Identification | ||||||
| Percent who say each of the following is the most important issue for congressional candidates to talk about in their upcoming campaigns: | All Voters | Party ID | ||||
| Democratic Voters | Independent Voters | Republican Voters | ||||
| Health care | 29% | 39% | 32% | 13% | ||
| The economy and jobs | 27 | 30 | 26 | 25 | ||
| The situation with North Korea | 24 | 23 | 20 | 31 | ||
| Immigration | 24 | 22 | 24 | 27 | ||
| Taxes and tax reform | 19 | 22 | 14 | 16 | ||
| The federal budget deficit | 17 | 17 | 16 | 14 | ||
| Climate change | 12 | 19 | 11 | 1 | ||
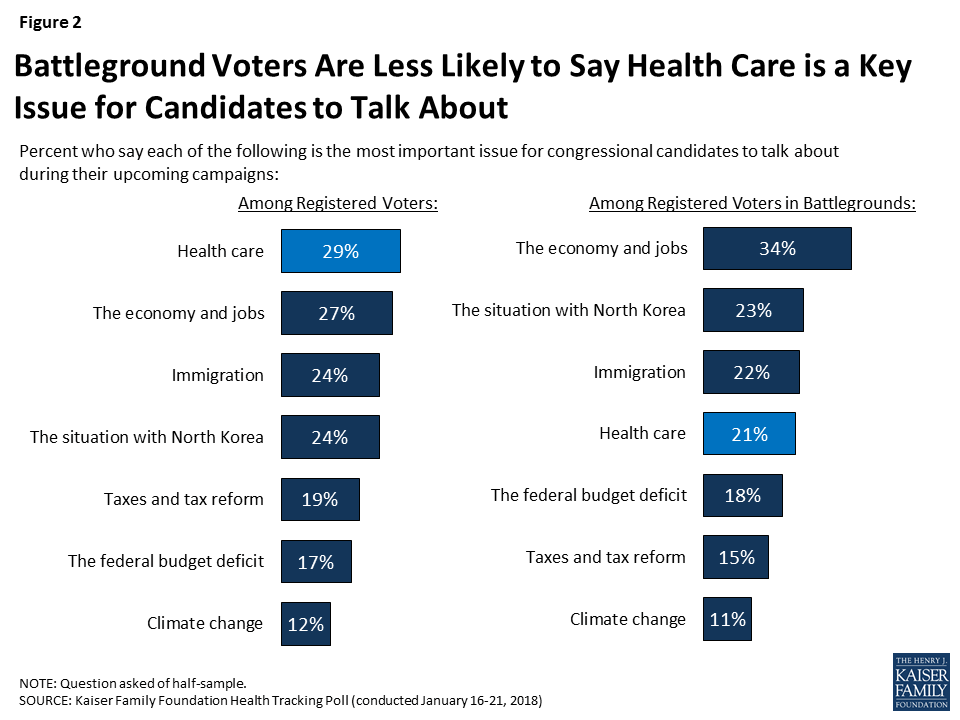
While health care is among the top issues for voters nationwide, it ranks lower among voters living in areas where there are competitive House, Senate, or Governor races. Voters in areas with competitive elections are more likely to prioritize candidates talking about the economy and jobs (34 percent) than other issues. One in five say the situation with North Korea (23 percent), immigration (22 percent), and health care (21 percent) are the most important issues for candidates to discuss.
2018 Midterm Election Analysis
As part of Kaiser Family Foundation’s effort to examine the role of health care in the 2018 midterm elections, throughout the year we will be tracking the views of voters – paying special attention to those living in states or congressional districts in which both parties have a viable path to win the election. This group, referred to in our analysis as “voters in battlegrounds” is defined by the 2018 Senate, House, and Governor ratings provided by The Cook Political Report. Congressional and Governor races categorized as “toss-up” were included in this group. A complete list of the states and congressional districts included in the comparison group is available in Appendix A.
This month’s Kaiser Health Tracking Poll examines awareness of the recent repeal of the Affordable Care Act’s (ACA) individual mandate and the most recent open enrollment period, as well as views of who is most responsible for the 2010 health care law moving forward.
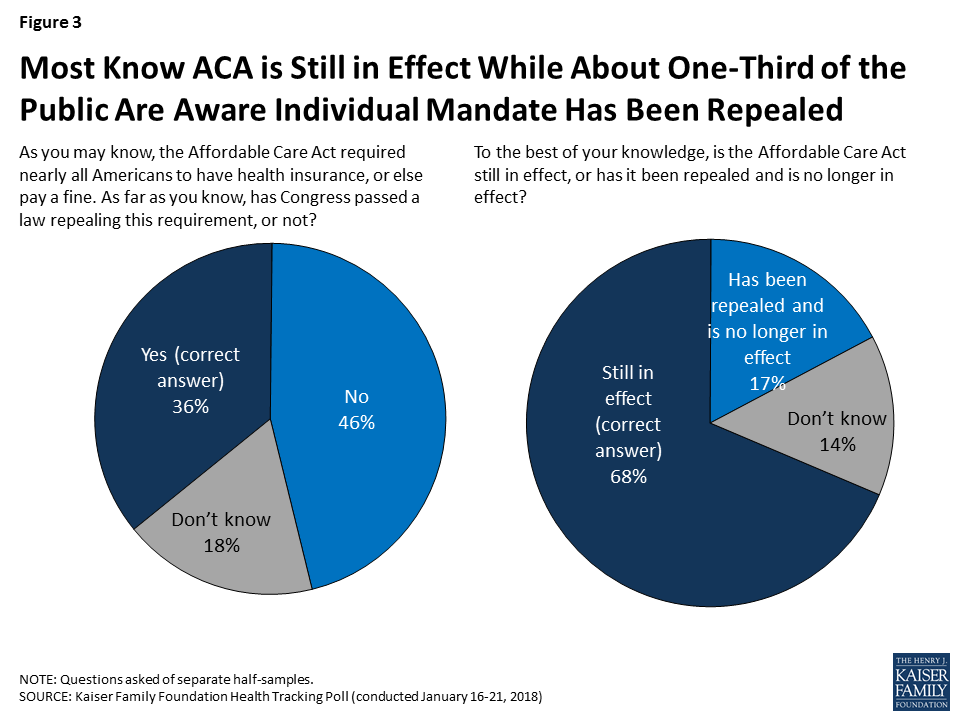
As part of the Republican tax reform plan signed into law at the the end of 2017, lawmakers eliminated the ACA’s requirement that nearly all individuals have health insurance or else pay a fine, known commonly as the individual mandate. The tax plan reduced the individual penalty for not having health insurance to zero beginning in 2019, effectively repealing the least favorable provision of the ACA (according to polling conducted by Kaiser Family Foundation). This month’s Kaiser Health Tracking Poll finds that one-third of the public (36 percent) are aware that Congress has a passed a law repealing this requirement while about half (46 percent) incorrectly say that the requirement has not been repealed. Another one in five (18 percent) are unsure of whether the individual mandate has been repealed or not. The results are similar when we look at those who are more likely to be impacted by this legislative change – the uninsured and those who buy their insurance through the individual market under the age of 65. Among this group, about four in ten (37 percent) are aware the individual mandate has been repealed, while 44 percent say it has not been repealed and 19 percent are unsure.
On the other hand, a majority of the public (68 percent) are aware that the ACA is still in effect, while one in five (17 percent) say it has been repealed and is no longer in effect and 14 percent are unsure.
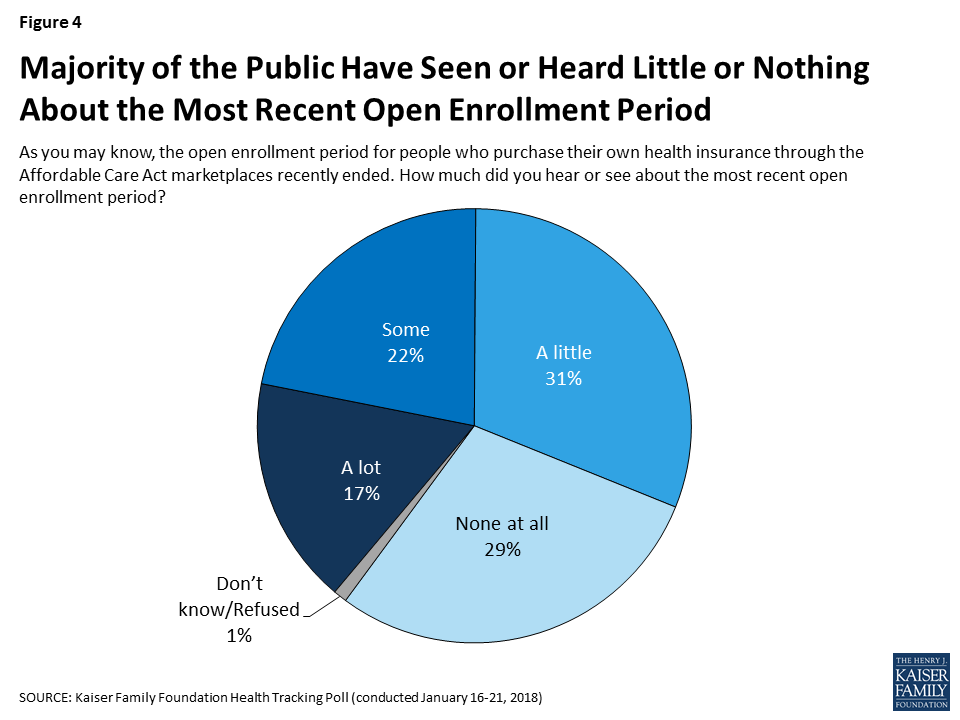
The ACA’s fifth open enrollment period, the time period that individuals who purchase health plans on their own can shop for insurance, ended for most people on December 15, 2017. About four in ten (39 percent) say they heard or read at least some about the open enrollment period, while six in ten say they heard or read either “a little” (31 percent) or “none at all” (29 percent).
According to the Centers for Medicare and Medicaid Services, nearly nine million people have signed up for insurance through the federal marketplace,1 which is 400,000 fewer than the number of people that signed up during the previous enrollment period.2 The public is divided in its perception of whether more or fewer people signed up for health insurance during the most recent open enrollmend period. About one-third (36 percent) say more people signed up (including about one in five who said “a lot more”) during open enrollment, while a similar share (31 percent) say fewer signed up (including 13 percent who said “a lot fewer”).

Perceptions of how the most recent open enrollment period went are largely driven by party identification. Democrats and independents are more likely to say more (either “a lot” or “a little”) people signed up this year than in previous years (43 percent and 37 percent, respectively) compared to Republicans (24 percent).
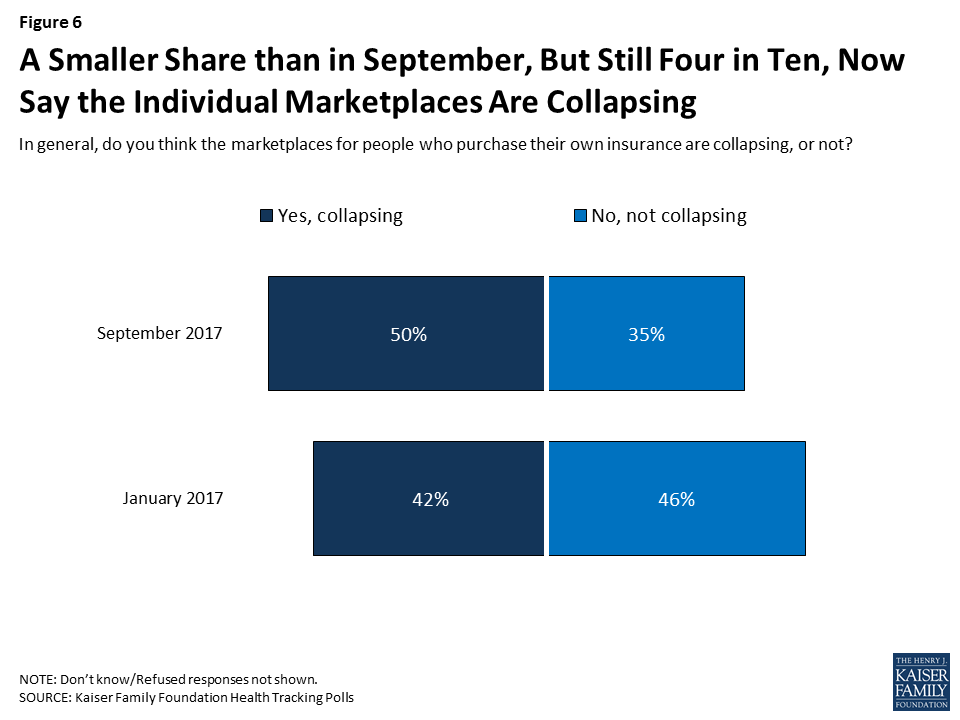
Overall, the share of the public who think the individual marketplaces are collapsing has decreased from September 2017 (down to 42 percent from 50 percent).
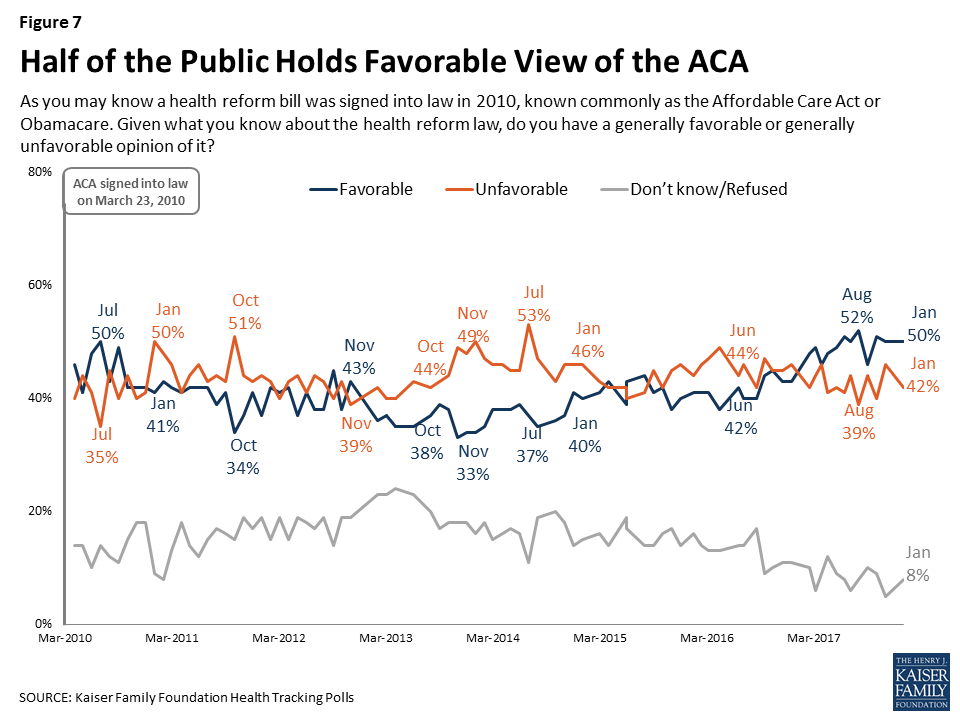
At the start of 2018, the public is more favorable in their views of the ACA, with 50 percent saying they have a favorable view and 42 percent saying they have an unfavorable view. This continues the trend of a larger share of the public holding favorable views rather than unfavorable ones first measured during the Republican efforts to repeal the ACA during 2017.
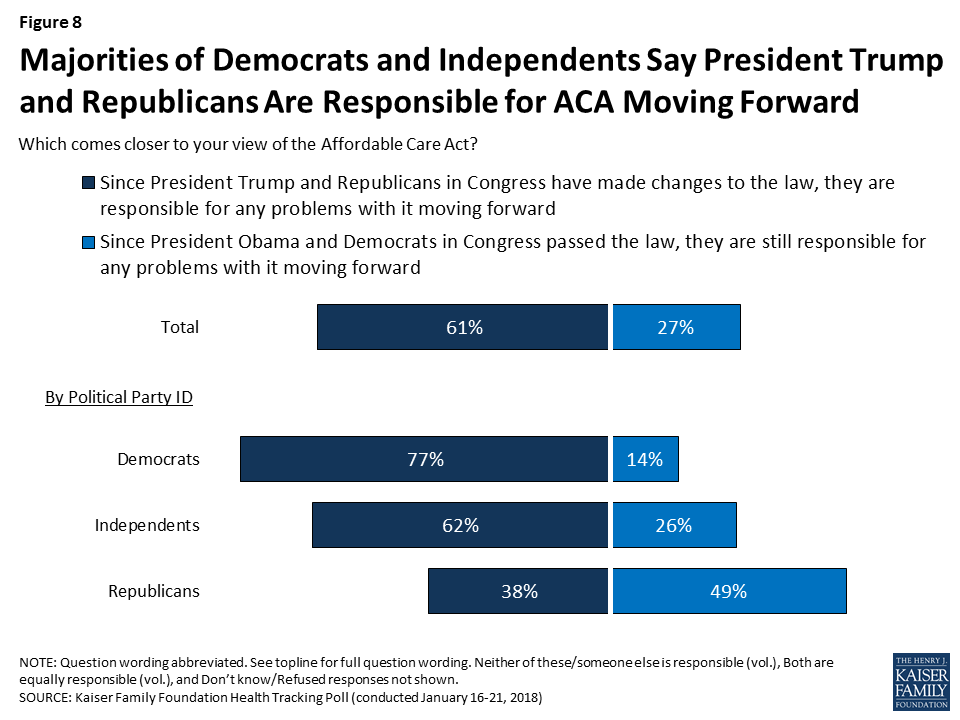
The majority of the public (61 percent) say since President Trump and Republicans in Congress have made changes to the ACA, they are responsible for any problems with it moving forward, compared to about three in ten (27 percent) who say that because President Obama and Democrats in Congress passed the law, they are responsible for any problems with it. Partisan differences continue, with majorities of Democrats and independents saying President Trump and Republicans are responsible for any problems with it moving forward while a larger share of Republicans say President Obama and Democrats are responsible for the law moving forward.
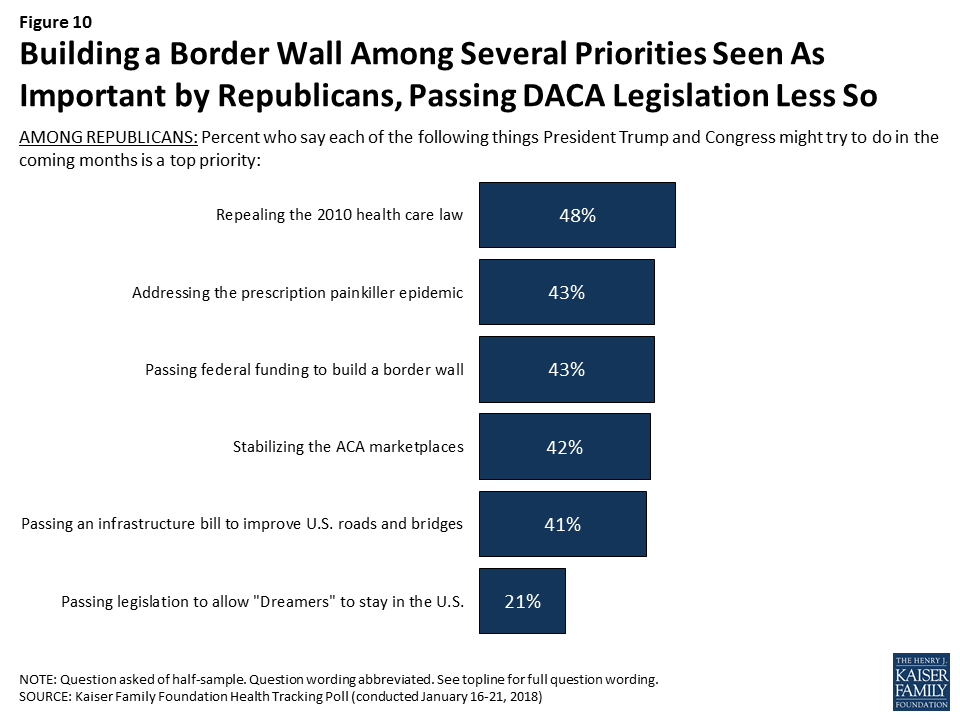
In terms of how the public views the legislative priorities for President Trump and Republicans in Congress, passing federal funding for President Trump’s plan to build a border wall between the U.S. and Mexico ranks the lowest among the public (21 percent) – considerably lower than passing a federal budget to prevent a government shutdown (57 percent), stabilizing the ACA marketplaces where people who don’t get health insurance through their employer can buy coverage (51 percent), addressing the prescription painkiller addiction epidemic (48 percent), and passing legislation to allow Dreamers to stay in the U.S. (45 percent). Despite the recent attention given to Republican efforts to repeal the 2010 Affordable Care Act (ACA), about three in ten (28 percent) say this should be a top priority for President Trump and Congress in the coming months.
Across all Kaiser Family Foundation polling during the fall 2017 renewing funding for the Children’s Health Insurance Program (CHIP) consistently ranked at the top of the public’s priorities, including in this month’s Kaiser Health Tracking Poll (68 percent say it should be a “top priority”). Congress agreed to a six-year extension of the CHIP program as part of the continuing resolution passed on January 22, 2018.

Besides all partisans prioritizing passing legislation to prevent a government shutdown, views of what should be the top priorities for the President and Congress vary sharply across partisans. A majority of Democrats want President Trump and Congress to focus on passing legislation to allow Dreamers to legally stay in the U.S. (66 percent), stabilizing the ACA marketplaces (61 percent), and addressing the prescription painkiller addiction epidemic (54 percent).
| Table 2: Views of Top Priorities by Party Identification | ||||||
| Percent who say each of the following should be a top priority for President Trump and Congress: | Total | Party ID | ||||
| Democrats | Independents | Republicans | ||||
| Renewing funding for the Children’s Health Insurance Program (CHIP) | 68% | 84% | 69% | 48% | ||
| Passing a federal budget to prevent a government shutdown | 57 | 55 | 57 | 61 | ||
| Stabilizing the ACA marketplaces | 51 | 61 | 48 | 42 | ||
| Addressing the prescription painkiller addiction epidemic | 48 | 54 | 50 | 43 | ||
| Passing legislation to allow “Dreamers” to legally stay in the U.S. | 45 | 66 | 40 | 21 | ||
| Passing an infrastructure bill to improve U.S. roads and bridges | 40 | 39 | 40 | 41 | ||
| Repealing the 2010 health care law | 28 | 17 | 25 | 48 | ||
| Passing federal funding to build a border wall | 21 | 5 | 19 | 43 | ||
On the other hand, Republicans are more likely to prioritize repealing the ACA (48 percent), addressing the prescripton painkiller epidemic (43 percent), passing federal funding to build a border wall (43 percent), stabilizing the ACA marketplaces (42 percent), and passing an infrastructure bill (41 percent) than they are to prioritize legislation to allow Dreamers to stay in the U.S. (21 percent).
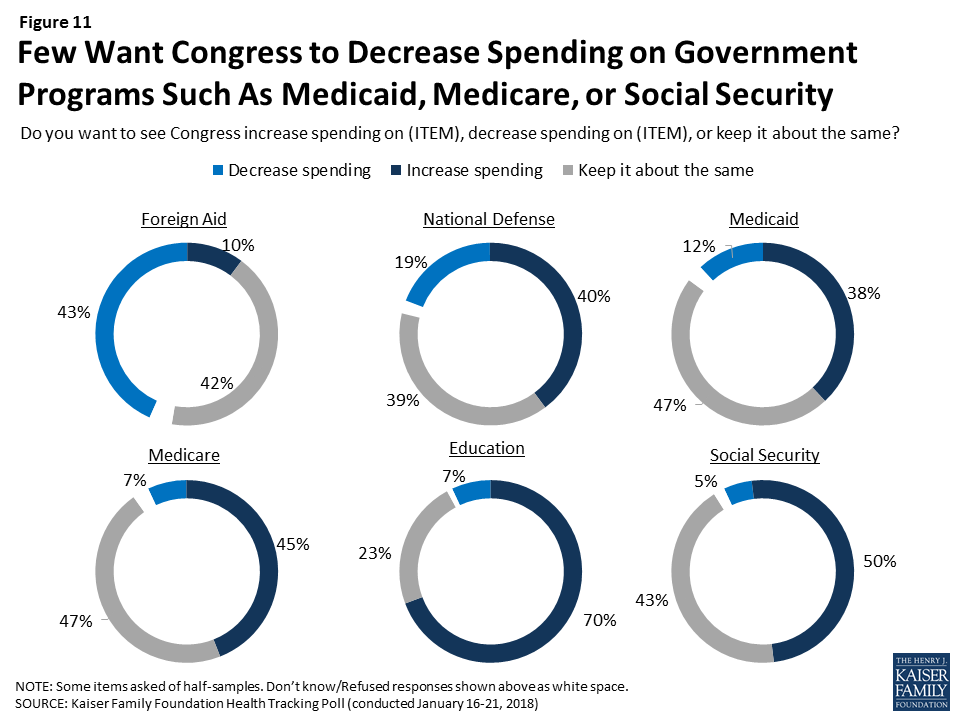
As Congress continues to work on a federal budget, some lawmakers have suggested making cuts to government programs such as Medicare and Medicaid. Few Americans – regardless of party identification – want to see Congress decrease spending on Social Security (5 percent), Medicare (7 percent), or Medicaid (12 percent). This is similar to the share who want to see Congress decrease spending on education (7 percent) and smaller than the share who want to see Congress decrease spending on national defense (19 percent) or foreign aid (43 percent). Large shares want to see spending on all of these government programs say about the same.
This month’s Kaiser Health Tracking Poll finds that language can matter in framing questions about government spending on programs like Medicare and Medicaid. As noted above, four in ten say they want to see Congress increase spending on Medicare (45 percent) and Medicaid (38 percent), while about one in ten want to see Congress decrease spending on these programs (7 percent and 12 percent, respectively). When the public is asked about government spending using broader terminology like “welfare programs” or “entitlement programs” rather than a specific name, larger shares of the public say they want to see spending decrease (32 percent and 27 percent, respectively).
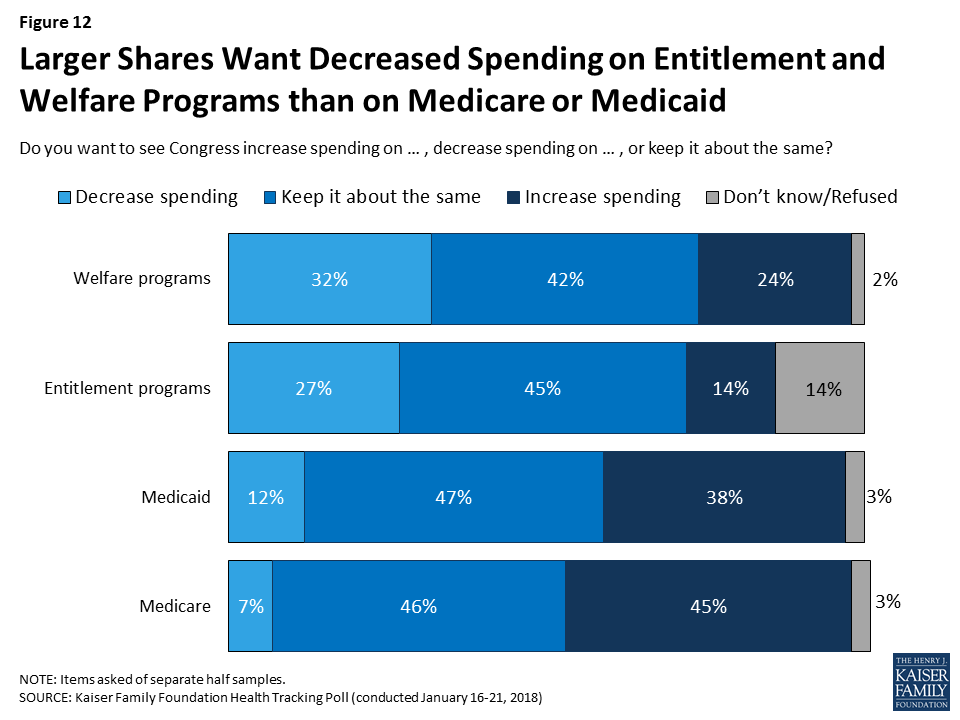
A larger share of Republicans say they would like Congress to decrease spending on welfare programs (58 percent) and entitlement programs (51 percent) than either independents (30 percent and 25 percent, respecitvely) or Democrats (11 percent for both).
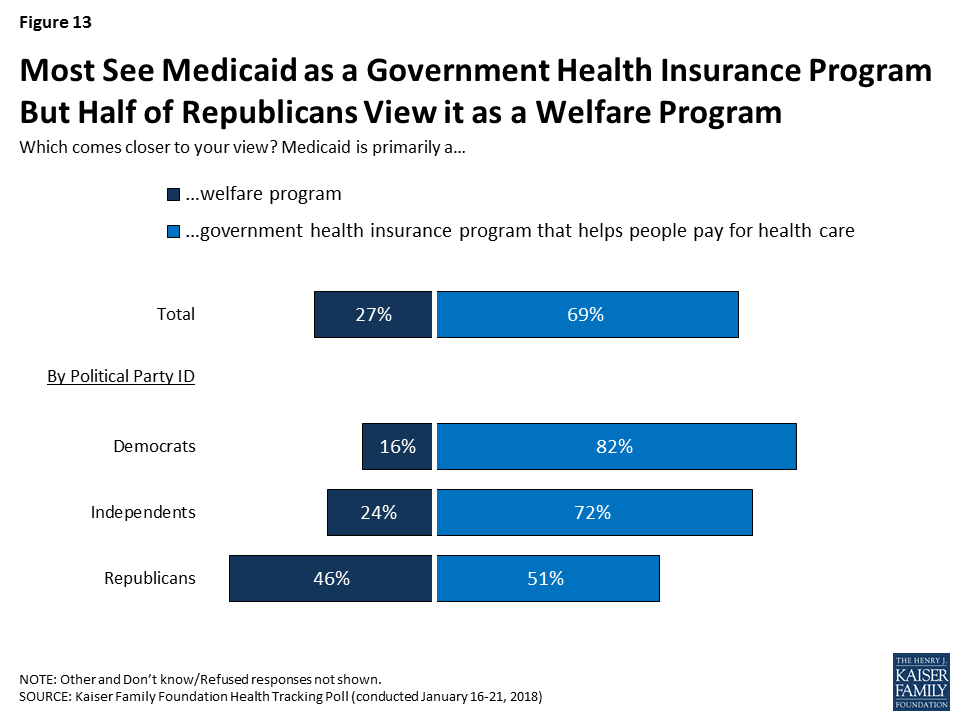
Overall, the majority of the public (69 percent) believe Medicaid is primarily a government health insurance program that helps people pay for health care while one-fourth (27 percent) believe it is primarily a welfare program. There are partisan differences with overwhelming majorities of Democrats (82 percent) and independents (72 percent) saying it is a government health insurance program, while Republicans are divided with half (51 percent) saying it is a government health insurance program and about half (46 percent) saying Medicaid is primarily a welfare program.
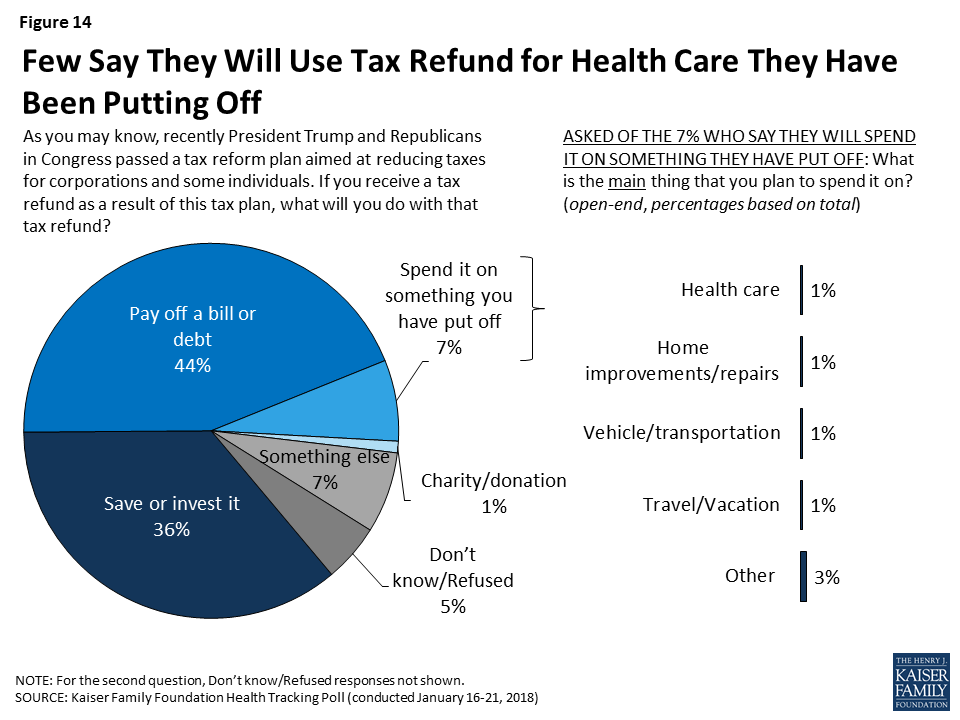
In light of the recent tax reform legislation passed by President Trump and Congress, the January Kaiser Health Tracking Poll asks the public what they would do with a tax refund. Four in ten (44 percent) say they would use their tax refund to pay off a bill or debt and about one-third (36 percent) say they would save or invest it. Fewer – 7 percent – say they would spend it on something they have put off, including 1 percent who say they would use it on health care they have been putting off.
This Kaiser Health Tracking Poll was designed and analyzed by public opinion researchers at the Kaiser Family Foundation (KFF). The survey was conducted January 16-21 2018, among a nationally representative random digit dial telephone sample of 1,215 adults ages 18 and older, living in the United States, including Alaska and Hawaii (note: persons without a telephone could not be included in the random selection process). Computer-assisted telephone interviews conducted by landline (433) and cell phone (782, including 497 who had no landline telephone) were carried out in English and Spanish by SSRS of Glen Mills, PA. Both the random digit dial landline and cell phone samples were provided by Marketing Systems Group (MSG). For the landline sample, respondents were selected by asking for the youngest adult male or female currently at home based on a random rotation. If no one of that gender was available, interviewers asked to speak with the youngest adult of the opposite gender. For the cell phone sample, interviews were conducted with the adult who answered the phone. KFF paid for all costs associated with the survey.
The combined landline and cell phone sample was weighted to balance the sample demographics to match estimates for the national population using data from the Census Bureau’s 2016 American Community Survey (ACS) on sex, age, education, race, Hispanic origin, and region along with data from the 2010 Census on population density. The sample was also weighted to match current patterns of telephone use using data from the January-June 2017 National Health Interview Survey. The weight takes into account the fact that respondents with both a landline and cell phone have a higher probability of selection in the combined sample and also adjusts for the household size for the landline sample. All statistical tests of significance account for the effect of weighting.
The margin of sampling error including the design effect for the full sample is plus or minus 3 percentage points. Numbers of respondents and margins of sampling error for key subgroups are shown in the table below. For results based on other subgroups, the margin of sampling error may be higher. Sample sizes and margins of sampling error for other subgroups are available by request. Note that sampling error is only one of many potential sources of error in this or any other public opinion poll. Kaiser Family Foundation public opinion and survey research is a charter member of the Transparency Initiative of the American Association for Public Opinion Research.
| Group | N (unweighted) | M.O.S.E. |
| Total | 1215 | ±3 percentage points |
| Half Sample A | 610 | ±5 percentage points |
| Half Sample B | 605 | ±5 percentage points |
| Party Identification | ||
| Democrats | 388 | ±6 percentage points |
| Republicans | 317 | ±6 percentage points |
| Independents | 406 | ±6 percentage points |
| 2018 Election | ||
| Registered voters | 1028 | ±4 percentage points |
| Voters in competitive elections | 298 | ±7 percentage points |
Health care and the economy and jobs top voters’ list as “the most important issue” for Congressional candidates to talk about ahead of November’s midterm elections, but the lineup shifts among voters in states and districts with competitive elections, the January Kaiser Health Tracking Poll finds.
When asked how important a series of major national issues are, similar shares say health care (29%) and the economy and jobs (27%) is “the most important issue.” These are closely followed by immigration (24%) and the situation in North Korea (24%).
But a third (34%) of voters who live in states or Congressional districts expected to have highly competitive 2018 midterm races (based on The Cook Political Report’s ratings) cite the economy as “the most important issue.” Fewer voters in these battleground areas cite North Korea (23%), immigration (22%), or health care (21%) as the top issue.
Border Wall Ranks at Bottom of Public’s Priorities for Washington, But Higher for Republicans
The poll also weighs the public’s priorities for Washington as Congress continues to work on a budget deal to keep the federal government running past Feb. 8 and address immigration and border security, including the status of the “Dreamers,” who are immigrants brought to the U.S. illegally as children but allowed to stay under the Obama Administration’s Deferred Action for Childhood Arrivals (DACA) program.
Providing federal funding for a wall along the U.S.-Mexico border ranks the lowest among eight priorities for President Trump and Congress, with one in five (21%) people naming it as a “top priority.” Several health care priorities rank higher, including renewing the Children’s Health Insurance Program (68%), which Congress did Monday as part of a short-term budget deal to reopen government; stabilizing the Affordable Care Act’s marketplaces (51%); and addressing the prescription painkiller epidemic (48%). Nearly half (45%) of the public say passing legislation to allow the Dreamers to stay in the U.S. should be a top priority.
There are wide partisan differences in these priorities. Two thirds of Democrats cite the Dreamers as a top priority, ahead of health care issues including ACA stabilization (61%) and the opioids epidemic (54%). Republicans are about as likely to consider the border wall as a top priority (43%) as they are to consider repealing the ACA (48%), the opioids epidemic (43%), stabilizing the ACA marketplaces (42%), and passing an infrastructure bill (41%). Passing a federal budget to prevent a government shutdown ranks higher (61%).
Few Support Cuts to Medicare and Medicaid Spending, but Framing Language Matters
As Congress continues to work on a federal budget, few Americans – regardless of party identification – want to see reduced spending on Medicare (7%) or Medicaid (12%). However, the poll also finds that the way spending on such programs is framed can affect the public’s views. When asked about government spending using more loaded terms like “entitlement programs” or “welfare programs,” larger shares say they want to see spending decrease (32% for welfare programs, 27% for entitlement programs).
A clear majority of the public (69%) view Medicaid primarily as a government health insurance program that helps people pay for health care, compared to one-fourth (27%) view it primarily as a welfare program. There are partisan differences, with overwhelming majorities of Democrats (82%) and independents (72%) viewing it as insurance, and Republicans divided with a narrow majority (51%) saying it is insurance and nearly half (46%) saying it is welfare.
Relatively Few Know the Tax Reform Law Repeals the ACA’s Unpopular Individual Mandate
The poll also assesses the public’s awareness about the repeal of the law’s individual mandate provision effective in 2019 through the tax reform law enacted in December. The mandate, which requires most Americans to have health coverage or pay a tax penalty, has consistently polled as the ACA’s least popular provisions.
About one third (36%) of the public are aware that Congress repealed this requirement, while nearly half (46%) incorrectly say that the requirement has not been repealed. The rest (18%) are unsure if it was repealed or not. The results are similar among those who are most likely to be affected by the change – those who are either uninsured or buy their insurance through the individual market.
The poll also finds that most Americans do not plan to spend their tax refund on health care they have been putting off. When asked what they would do with a tax refund, four in ten (44%) say they would use a tax refund to pay off a bill or debt, while a third (36%) say they would save or invest it. Few (7%) say they would spend it on something they have put off, including just 1 percent who say they would use it for health care that they put off.
Designed and analyzed by public opinion researchers at the Kaiser Family Foundation, the poll was conducted from January 16 – 21, 2018 among a nationally representative random digit dial telephone sample of 1,215 adults. Interviews were conducted in English and Spanish by landline (433) and cell phone (782). The margin of sampling error is plus or minus 3 percentage points for the full sample. For results based on subgroups, the margin of sampling error may be higher.
SOURCE: Kaiser Family Foundation analysis of March 2017 Current Population Survey, Annual Social and Economic Supplement
On January 22, 2018, Congress passed a six-year extension of CHIP funding as part of a broader continuing resolution to fund the federal government. Federal funding for CHIP had expired on September 30, 2017. Without additional funding available, states operated their CHIP programs using remaining funds from previous years. However, some states came close to exhausting funding, leading them to make contingency plans to reduce coverage and notify families of potential coverage reductions. In late December 2017, Congress provided some short-term funding for early 2018, but some states still expected to exhaust funds by March 2018. The six-year funding extension provides stable funding for states to continue their CHIP coverage. This fact sheetprovides a summary of key provisions of the CHIP funding extension (Table 1). In sum, it:
What’s in the #CHIP funding extension passed by #Congress?
| Table 1: Key Provisions of the HEALTHY KIDS Act (H.R. 195, Division C) | |
| CHIP Funding | Extends federal CHIP funding for 6 years, from FY2018 through FY2023. Makes some adjustments to avoid duplicate payments given the short-term federal funding provided for the first quarter of FY2018. Extends Child Enrollment Contingency Fund payments for states with a funding shortfall and CHIP enrollment exceeding a state-specific target level. Extends the qualifying states option that allows states that expanded Medicaid before CHIP was created in 1997 to receive CHIP matching funds for some children enrolled in Medicaid. |
| Federal Match Rate | Continues the 23 percentage point CHIP enhanced federal match rate established by the Affordable Care Act for FY2018 and FY2019, decreases it to 11.5 percentage points in FY2020, and returns to the regular CHIP match rate for FY2021through FY2023. |
| Express Lane Eligibility | Extends authority for states to rely on findings from agencies such as those that administer TANF or SNAP for initial Medicaid/CHIP eligibility determinations and renewals through FY2023. |
| Maintenance of Effort | Extends states’ maintenance of effort requirements to maintain coverage for children from FY2019 through FY2023. After October 1, 2019, the maintenance of effort requirement would only apply to children in families with incomes at or below 300% FPL. |
| Demonstration Project Funding | Extends federal funding for the childhood obesity demonstration project and pediatric quality measures program for FY2018 through FY2023. |
| Outreach and Enrollment Funding | Extends federal funding for CHIP outreach and enrollment grants from FY2018 through FY2023. Specifies that organizations that utilize parent mentors are able to receive grant funding and that any income or stipend a parent receives through this grant funding should not be considered in Medicaid eligibility determinations. |
| CHIP Risk Pools | Allows states to include CHIP children and those in look-alike programs in the same risk pool and specifies that CHIP look-alike programs qualify as minimum essential coverage. Look-alike programs are for children under 18 who are ineligible for Medicaid and CHIP and purchase coverage through the state that provides benefits at least identical to CHIP funded through non-Federal funds including premiums. |
| Medicaid Improvement Fund | Adds $980 million to the fund to reduce state costs associated with claims systems beginning in FY2023. |